professor nancy devlin - king's fund nancy devlin... · professor nancy devlin the king’s...
TRANSCRIPT
Professor Nancy Devlin
The King’s FundLondon • 18th November 2014
What is the role of the EQ-VAS?

Source: Feng, Parkin and Devlin (2014) Quality of Life Research 23(3) 977-89
This research was funded by the grant from the EuroQol Group. Views expressed are those of the authors, and not the funders.

Contents
1. The EQ-VAS in 3L and 5L2. The provenance of VAS3. Concerns about EQ-VAS in PROMs4. Why is the EQ-VAS in the EQ-5D?5. Characteristics of EQ-VAS data6. What does the EQ-VAS tell us?7. Concluding remarks

The EQ-VAS (3L version)

The EQ-VAS (5L version)
Note:
• Differences in format
• How comparable are EQ-VAS data from the 3L and 5L?
• No formal test of this to date.

• Rating scales have their origins in psychophysics: how people perceive and judge phenomena that can be measured objectively eg. sound; light.
• Subsequently developed for measurement of subjective assessments where there is no objective measure e.g. mood, pain and quality of life
• ‘feeling thermometer’
• Advantages: simplicity, ease of administration and scoring; suitability for frequent and repeated use; generally report high levels of validity and reliability
2. The provenance of VAS

• Irregularities in completion/difficulties in coding
• The EQ-VAS data show different results (e.gwith respect to improvement in health) than EQ Index or condition-specific measures
• Fewer patients reporting improvements in health
• And more patients reporting a worsening in health
3. Concerns about EQ-VAS

Examples of each completion type

Change in number and percentage of scores by procedure (1 April 2009 to 31 March 2010)


• Introduced as a warm-up task for VAS valuation of EQ-5D health states
• The vertical orientation, scale demarcation, numbering, end points and response instructions (draw line to the scale) were all determined by the requirements of the VAS valuation task.
• The EQ-VAS labels may mean different things to different people completing it, which may ‘‘attenuate the comparison of scores’’
• No formal study of how endpoints interpreted by respondents
4. Why is the EQ-VAS in the EQ-5D?


5. Characteristics of EQ-VAS data The distribution of EQ-VAS and Index weighted profiles in Q1 and Q2 , all
procedures combined
For an analysis of the causes of the ‘bi-modal’ distribution of the EQ Index, see
Parkin, Devlin and Feng (2014) What determines the shape of an EQ-5D Index? OHE Research Paper.
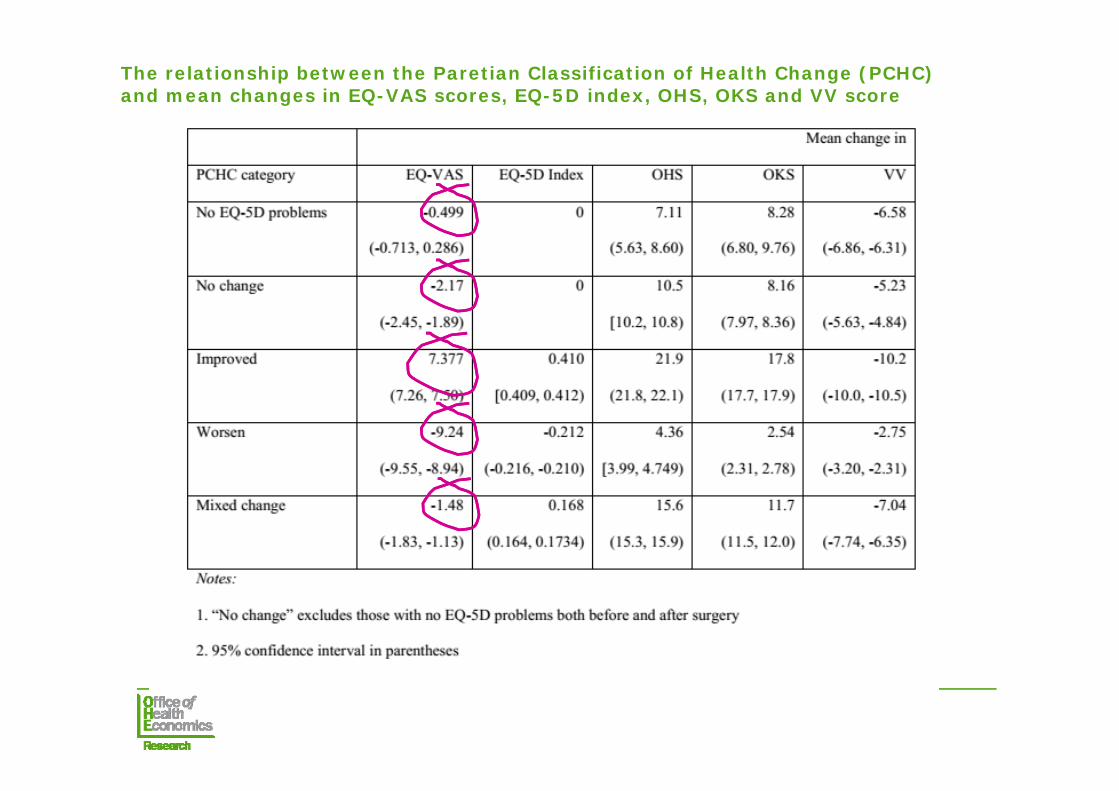
The relationship between the Paretian Classification of Health Change (PCHC) and mean changes in EQ-VAS scores, EQ-5D index, OHS, OKS and VV score

Correlations between EQ-VAS score and EQ-5D index, OHS score, OKS score and VV score

The relationship between the EQ-VAS and the dimensions/levels of the EQ-5D

• Patients’ own overall assessment of their health
• Distinct from EQ-5D profile: restricted to the five dimensions
• Distinct from EQ Index:
• profiles summarised by preferences of the general public
• anchored at 0 = dead
• introduces an exogenous source of variance
• More generally: there is no ‘neutral’ way of summarising multiple question items in anyHRQoL questionnaire
Parkin D, Rice N, Devlin N. Statistical analysis of EQ-5D profiles: Does the use of value sets bias inference? Medical Decision Making 2010; 30: 556-565
6. What does EQ-VAS tell us?

• Pooled data from the EuroQol Group (with thanks to Mark Oppe)

• EQ-VAS measures something which is conceptually different than EQ-5D profile.
• Potentially valuable, complementary information about the patients’ view of their own health
• But improvements in formatting arguably required (and consistency between 3L and 5L EQ-VAS)
• Research required to explore how different sorts of respondents interpret endpoints, and whether this compromises comparability of data (between people, or in repeated measures e.g. response shift).
7. Concluding remarks