professor boguslavas gruŽevskis labour market research institute of lithuanian social research...
TRANSCRIPT

Professor Boguslavas GRUŽEVSKISLabour Market Research Institute of
Lithuanian Social Research Centre
2015, Vilnius
Protection of young people and older workers against unemployment in Lithuania
SEMINAREffective employment insurance strategies andeffective protection against unemployment

TABLE OF CONTENTS1. The situation of young people and older population in the
labour market (employment and unemployment trends)
2. Specifics of working old-age pensioners in Lithuania and other EU countries
3. Employment security for young people in Lithuania
4. Employment security for older population in Lithuania
5. Summary
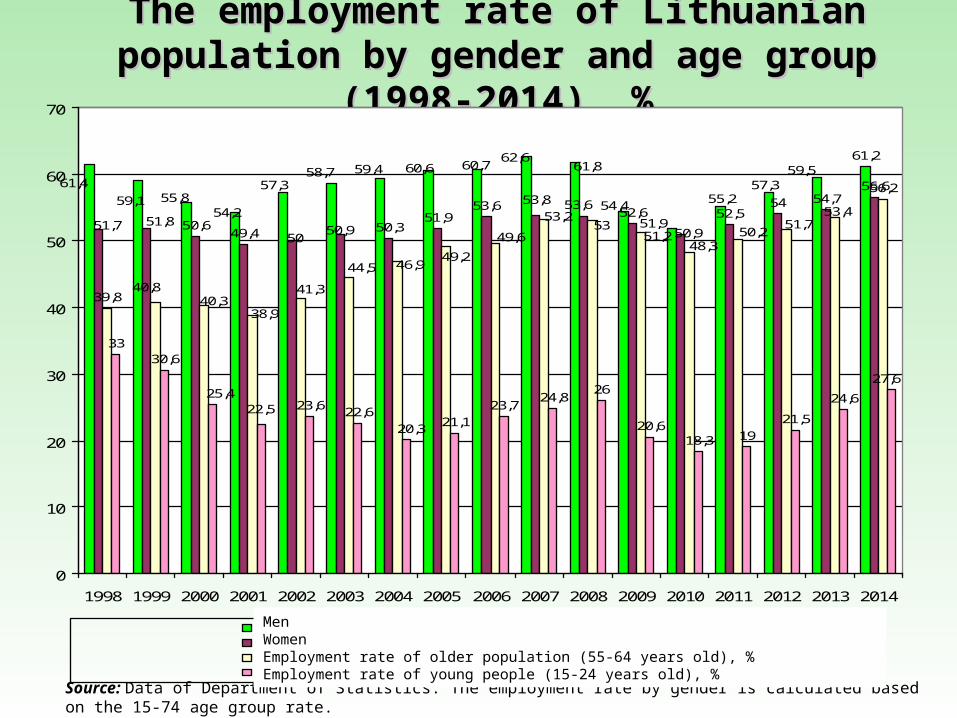
The employment rate of Lithuanian population by The employment rate of Lithuanian population by gender and age group (1998-2014), %gender and age group (1998-2014), %
Source: Data of Department of Statistics. The employment rate by gender is calculated based on the 15-74 age group rate.
61,2
50,649,4 50,3
51,953,6 52,6 52,5
54 54,756,6
39,8
56,2
3330,6
23,6 22,621,1
23,724,8
26
20,618,3 19
21,5
24,6
27,6
57,361,459,1 55,8
54,2
58,7 59,4 60,6 60,762,6
61,8
54,451,9
55,257,3
59,5
51,851,7
53,8 53,6
50,950 50,9
46,9
41,340,840,3
38,9
44,549,2
49,6
53,253
51,248,3
50,251,7
53,4
25,422,5
20,3
0
10
20
30
40
50
60
70
1998 1999 2000 2001 2002 2003 2004 2005 2006 2007 2008 2009 2010 2011 2012 2013 2014
vyrai moterysVyresnio amžiaus (55-64 m.) gyventojų užimtumo lygis (proc.)Jaunimo (15-24 m.) užimtumo lygis (proc.)
MenWomenEmployment rate of older population (55-64 years old), %Employment rate of young people (15-24 years old), %

The employment rate by age in the EU-28 Member States and Lithuania (2004-2013), %
2004 2005 2006 2007 2008 2009 2010 2011 2012 2013
Employment rate (15-64)
EU 62.7 63.4 64.3 65.3 65.7 64.5 64.0 64.1 64.1 64.1
Lithuania 61.4 62.6 63.6 65.0 64.4 59.9 57.6 60.2 62.0 63.7
Employment rate (65-74)
EU 6.5 6.8 7.0 7.4 7.6 7.6 7.7 8.0 8.3 8.5
Lithuania 6.3 6.3 7.1 8.5 9.1 8.4 7.3 8.7 10.0 8.8
Source: Eurostat, 2014

5
Unemployment rate (2004-2014)Unemployment rate (2004-2014) (According to data of the Department of Statistics)
Unemployed, thousands
Young unemployed (15-24 years ), thousands
Unemployment rate, % Youth unemployment rate, %

The unemployment rate of the Lithuanian population by gender and age-The unemployment rate of the Lithuanian population by gender and age-groups (1998-2014), %groups (1998-2014), %
Source: Data of Department of Statistics
*The unemployment rate by gender is calculated based on15 years of age and older population age group rate
Men Women
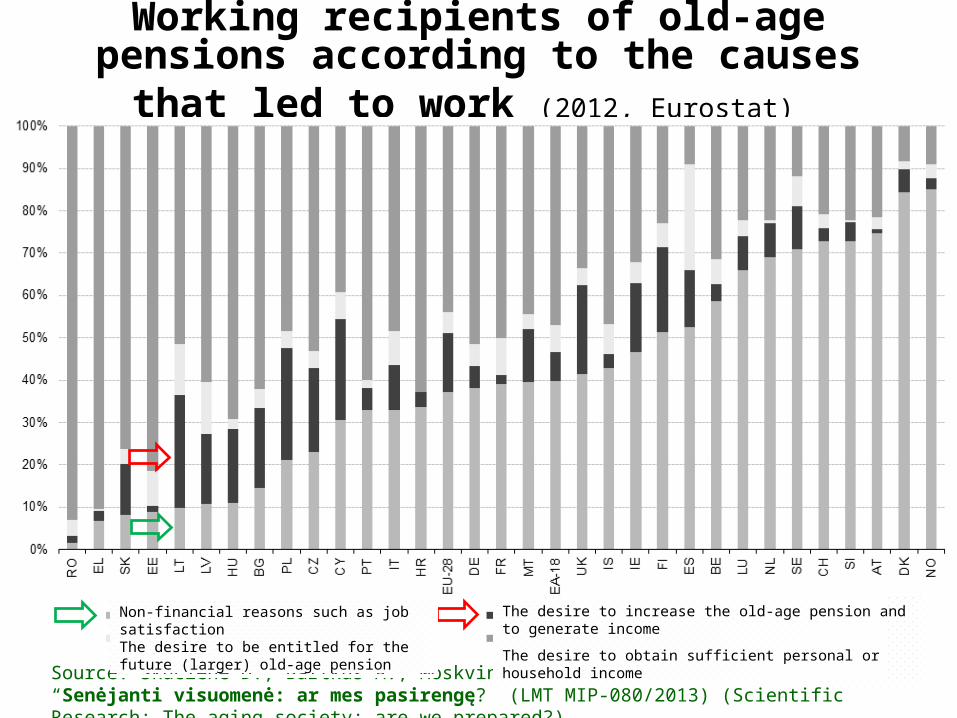
Working recipients of old-age pensions according to the causes that led to work
(2012, Eurostat)
Source: Skučienė D., Bartkus A., Moskvina J., Uleckienė A. Mokslinis tyrimas “Senėjanti visuomenė: ar mes pasirengę?” (LMT MIP-080/2013) (Scientific Research: The aging society: are we prepared?)
Non-financial reasons such as job satisfactionThe desire to be entitled for the future (larger) old-age pension
The desire to increase the old-age pension and to generate income
The desire to obtain sufficient personal or household income

Factors of planned participation in the labour market by education (%, N=1003, 18+)
Source: Skučienė D., Bartkus A., Moskvina J., Uleckienė A. Mokslinis tyrimas “Senėjanti visuomenė: ar mes pasirengę?” (LMT MIP-080/2013) (Scientific Research: The aging society: are we prepared?)

The average monthly income in different age-groups (2010-2015), EUR
Source: Data of State Social Insurance Fund Board (SODRA)

Employment Security
EMPLOYMENT SECURITY - the system of external measures or the content of internal motivation (the
entirety of skills, competencies and regulations)?

Employment security for young people in Lithuania
1. Formation of work motivation and career management competence (the area of responsibility of educational sphere, the problem of young people who are not in employment, education or training (NEET), the development of culture of poverty).
2. Transition from school to the labour market.
3. Support to safeguard jobs.

Employment security for young people in Lithuania
Transition from school to the labour market
1) Specialist training according to the needs of the labour market and international standards;2) Restriction of early school leavers without completing the training programmes;3) Promoting non-formal education (early school-leavers to acquire the necessary competencies)

Employment security for young people in Lithuania
4) National volunteering programme (for socially awkward young people or seeking self-realisation); 5) Apprenticeship training forms;6)Promotion of entrepreneurship (providing loans, training and counselling, assistance in drawing up business plans);
7) The project ‘Trust yourself’ (promotion of employment motivation, social rehabilitation, preparation for the labour market).

Employment security for young people in Lithuania
8) Support for the first job (part of the salary is reimbursed to the employer);
9) Measures of the Lithuanian Labour Exchange (Labour market training programs; motivational seminars, services of youth employment centres; Talent Bank; work for pupils and students; voluntary practice (up to 2 months, wages are not paid,
but are insured against health and accident)).

Employment security for young people in Lithuania
Support to safeguard the jobs and employment (LLE measures)1) Subsidies for employers;2) Supporting the job acquisition skills (practical work after training);3) Support for job creation;4) Territorial mobility support;5) Project (ESF) ‘Remain in the labour market’ (Integrated subsidy and skill support services).

Employmet security for older population in Lithuania
1. Guarantees in the workplace
2. Contribution to employment
3. Earlier retirement

Employmet security for older population in Lithuania
Guarantees in the workplace1) A longer period of notice on dismissal (up to four months);2) More difficult conditions for termination of employment;3) Priority right to remain at work;4) Extended period for paying unemployment benefits.

Employmet security for older population in Lithuania
Contribution to employment (implementation measures of the Lithuanian Labour Exchange):1) Contribution to employment;2) Vocational training by vouchers;3) Job rotation;4) Public works;5) Local employment initiatives;6) Seniors Bank.

SUMMARY (1)
1. Due to demographic changes, a very difficult situation is being formed in Lithuanian labour market, so effective youth and older population employment support measures are very necessary.
2. Though various youth employment support measures are developed and implemented in Lithuania, their efficiency is low enough due to the low average wage.
3. Although since 2011, Lithuanian employers constantly feel the lack of skilled labour force, the intensity of emigration from Lithuania for 10 years is one of the highest in the EU.
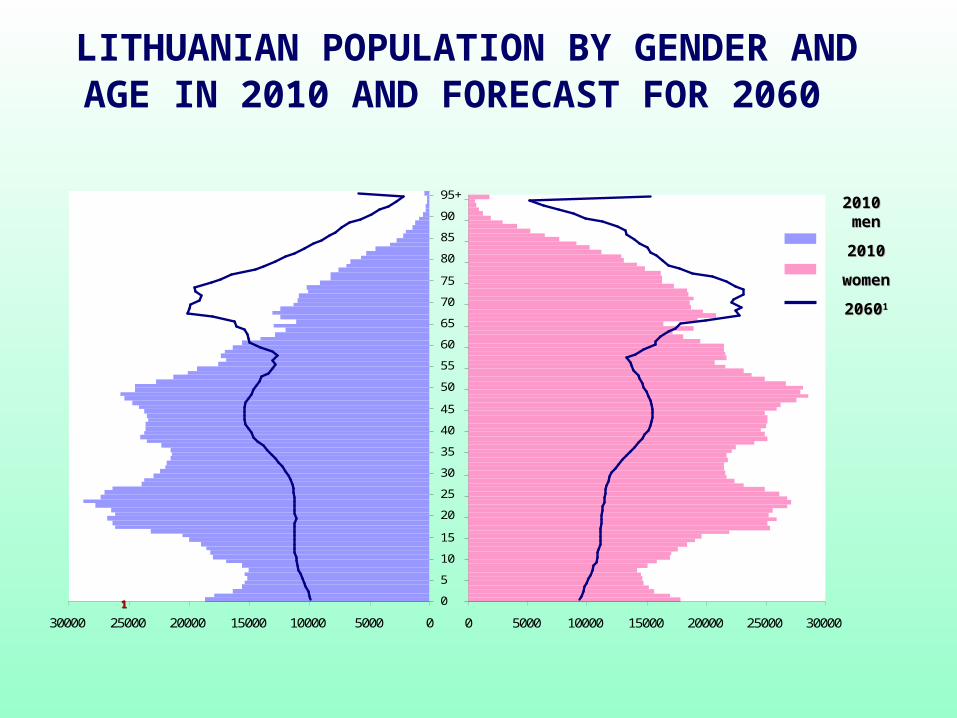
LITHUANIAN POPULATION BY GENDER AND AGE IN 2010 AND FORECAST FOR 2060
050001000015000200002500030000
0
5
10
15
20
25
30
35
40
45
50
55
60
65
70
75
80
85
90
95+
0 5000 10000 15000 20000 25000 30000
2010 2010 menmen
20102010
womenwomen
2060206011
11

Forecast of changes in the total population of the EU Member States, (%) (estimated according to the Eurostat forecast for 2011 (EUROPOP) and current statistics of National Statistical Offices)
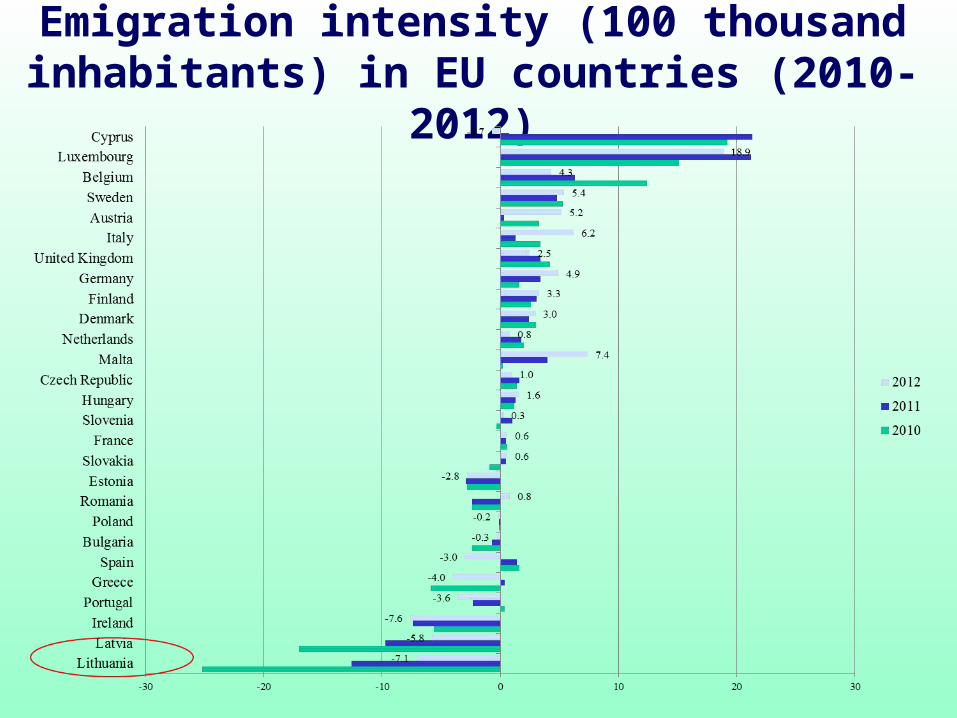
Emigration intensity (100 thousand inhabitants) in EU countries (2010-2012)

Age of emigrants from Lithuania (%)
Age groups
2011 2012 2013
Residents Emigrants Residents Emigrants Residents Emigrants
0-14 14,9% 10,5% 14,8% 12,6% 14,7% 13,0%
15-24 14,2% 28,9% 13,9% 27,6% 13,6% 26,3%
25-34 12,5% 33,7% 12,4% 32,4% 12,5% 31,6%
35-44 13,9% 15,1% 13,7% 15,2% 13,5% 15,5%
45-54 15,2% 8,7% 15,3% 8,6% 15,3% 9,0%
55-64 11,4% 2,3% 11,8% 2,4% 12,2% 2,8%
65+ 17,9% 0,8% 18,1% 1,2% 18,2% 1,8%

SUMMARY (2)
4. Due to the low wages and widespread illegal employment, the employment support measures are often insufficient to encourage the employment of social assistance recipients (‘poverty trap’).
5. Working in old age (retirement) is often seen as coercion, so it is necessary to increase the attractiveness of employment in old age.
6. In order to increase the employment of young people and old population in Lithuania, it is necessary to pay more attention to salaries, investment policy and the creation of new and well-paid jobs. Without these priority actions, social security and employment support measures will have little effect.

Net income in the EU-27 Member States and Lithuania, euro per month
LITHUANIA IS MOVING AWAY FROM THE EU AVERAGE (according to income growth)
* Income of a single person without children, 50 percent of the median income** Income of a married couple with two children, income of one person - 100 percent, income of the other person - 67 per cent of median income. Increase in EU-27 by EUR 605 in 2005-2012, in Lithuania - 402.Source: Eurostat, 2014.
2005 2006 2007 2008 2009 2010 2011 2012
EU-27* 1.191 1.223 1.254 1.255 1.240 1.288 1.317 1.373
Lithuania*
183 214 263 308 287 282 290 303
EU-27** 3.978 4.085 4.189 4.192 4.140 4.302 4.398 4.583
Lithuania**
610 716 880 1.030 959 942 967 1.012

Thank you for your attention!