professor abdul muttaleb jaber professor abdul muttaleb jaber faculty of pharmacy faculty of...
TRANSCRIPT

Professor Abdul Muttaleb JaberProfessor Abdul Muttaleb Jaber
Faculty of PharmacyFaculty of Pharmacy
Office: Room # 512 (Faculty of Office: Room # 512 (Faculty of Pharmacy)Pharmacy)
Tel: Tel: E-mail: [email protected]: [email protected]
Office hours: Office hours: M & W 10-12 amM & W 10-12 am

Chapter 1Chapter 1Control of the quality of analytical methodsControl of the quality of analytical methods Uncertainty in measurementsUncertainty in measurements Significant figures and calculationsSignificant figures and calculations Control of errors in analysisControl of errors in analysis Fundamental statistical termsFundamental statistical terms Validation of analytical proceduresValidation of analytical procedures Standard operating procedure (SOP)Standard operating procedure (SOP) Reporting of resultsReporting of results Some terms used in the control of Some terms used in the control of analytical proceduresanalytical proceduresBasic calculations in pharmaceutical Basic calculations in pharmaceutical analysisanalysis

Electronic Electronic AnalyticalAnalyticalBalanceBalance

Copyright McGraw-Hill 2009Copyright McGraw-Hill 2009 44
Uncertainty in MeasurementUncertainty in Measurement
Exact: numbers with defined valuesExact: numbers with defined values– Examples: counting numbers, conversion Examples: counting numbers, conversion
factors based on definitionsfactors based on definitions
Inexact: numbers obtained by any Inexact: numbers obtained by any method other than countingmethod other than counting– Examples: measured values in the Examples: measured values in the
laboratorylaboratory

A A measurementmeasurement always has always has some degree of uncertainty.some degree of uncertainty.
Uncertainty has to be indicated in any Uncertainty has to be indicated in any measurement.measurement. Any measurement has Any measurement has certain digits and certain digits and one uncertain digit. one uncertain digit. A digit that must be A digit that must be estimatedestimated is is
called called uncertain.uncertain.

Uncertainty in Measurements

Significant FiguresSignificant Figures– Used to express the uncertainty of Used to express the uncertainty of
inexact numbers obtained by inexact numbers obtained by measurement measurement
– The last digit in a measured value is an The last digit in a measured value is an uncertain digit - estimated uncertain digit - estimated
The number of certain digits + the The number of certain digits + the uncertain digit is called number of uncertain digit is called number of significant figures.significant figures.

Rules for Counting Significant Figures
1. Nonzero integers
2. Zeros
leading zeros
captive zeros
trailing zeros
3. Exact numbers

Rules for Counting Significant Figures
Nonzero integers always count as significant figures.
3456 has
4 sig figs.

ZerosLeading zeros do not count as significant figures. (Zeros before the nonzero digit)
0.0486 has3 sig figs.0.0003 hasone significant figure
Captive (sandwiched) zeros always count as always count as significant figures.significant figures.
16.07 has16.07 has
4 sig figs.4 sig figs.

ZerosTrailing zeros are significant only
if the number contains a decimal point.
9.300 has
4 sig figs.

Exact numbers have an infinite number of significant figures.
1 inch = 2.54 cm, exactly
• Zeros at the end of a number before a
decimal place are ambiguous
10,300 g has: 3 or 4 or 5??

PracticePractice
Determine the number of significant figures in Determine the number of significant figures in each of the following.each of the following.
345.5 cm 345.5 cm 4 significant figures4 significant figures
0.0058 g0.0058 g2 significant figures2 significant figures
1205 m1205 m4 significant figures 4 significant figures
250 mL250 mL2 significant figures 2 significant figures
250.00 mL250.00 mL5 significant figures 5 significant figures

Significant Figures in Calculations
A calculated answer cannot be more precise than the measuring tool.
A calculated answer must match the least precise measurement.
Significant figures are needed for final answers from
1) adding or subtracting
2) multiplying or dividing

Rules for Significant Figures in Mathematical Operation
Multiplication and Division: # sig figs in the result equals the number in the least precise measurement used in the calculation.
6.38 2.0 =
12.76 13 (2 sig figs)

Rules for Significant Figures in Mathematical Operation
Addition and Subtraction: # sig figs in the result equals the number of decimal places in the least precise measurement.
Answer cannot have more digits to the right of the decimal than any of original numbers
6.8 + 11.934=
22.4896 22.5) 3 sig figs(
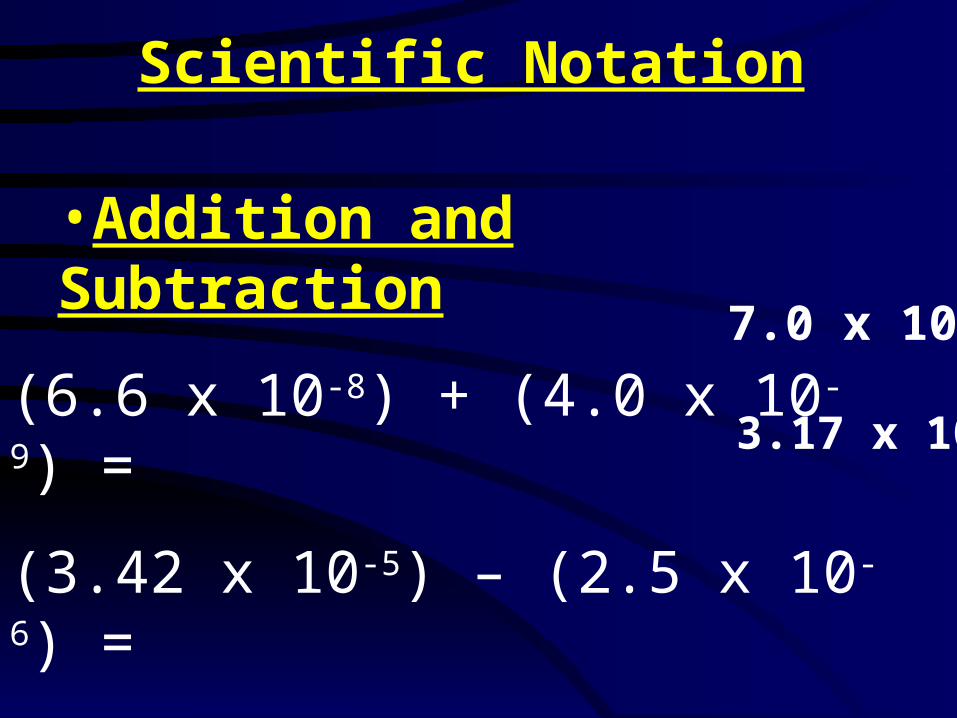
Scientific Notation
•Addition and Subtraction
(6.6 x 10⁻⁸) + (4.0 x 10⁻⁹) =
(3.42 x 10⁻⁵) – (2.5 x 10⁻⁶) =
7.0 x 10⁻⁸
3.17 x 10⁻⁵

Multiple computationsMultiple computations
2.54 X 0.00282.54 X 0.0028 = = 0.0105 X 0.060 0.0105 X 0.060
1) 11.31) 11.3 2) 112) 11 3) 0.0413) 0.041
Continuous calculator operation = Continuous calculator operation =
2.54 x 0.0028 2.54 x 0.0028 0.0105 0.0105 0.060 = 11 0.060 = 11

Here, the mathematical operation requires Here, the mathematical operation requires that we apply the addition/ subtraction rule that we apply the addition/ subtraction rule first, then apply the multiplication/division first, then apply the multiplication/division rule.rule.
= 12
Exact numbersExact numbers– Do not Do not limit answer limit answer because exact because exact
numbers have an infinite number of numbers have an infinite number of significant figuressignificant figures
– Example: Example: A tablet of a drug has a mass of 2.5 g. If A tablet of a drug has a mass of 2.5 g. If
we have three such tablets, the total we have three such tablets, the total mass is mass is
3 x 2.5 g = 7.5 g3 x 2.5 g = 7.5 g– In this case, 3 is an exact number and In this case, 3 is an exact number and
does not limit the number of significant does not limit the number of significant figures in the result.figures in the result.

To get the correct number of To get the correct number of significant digits you need to round significant digits you need to round numbersnumbers
Rounding rulesRounding rules
– If the number is less than 5 round If the number is less than 5 round “down”.“down”.
– If the number is 5 or greater round If the number is 5 or greater round “up”.“up”.

Fundamental statistical termsFundamental statistical terms
• Central value = Arithmetic mean = average• Arithmetic Mean = Mean or average;
• Median: Modern numerical value• 20.6 20.1 20.7 20.0 20.4
• Accuracy: Nearness of the experimental value to the true value– Absolute Error = Xi - or -
• (+ve or –ve)– Relative mean error = Absolute error/– Percent relative error = Relative error X 100
•
N
XX
i
X

Accuracy and precisionAccuracy and precision
– Two ways to judge the quality of a Two ways to judge the quality of a set of measured numbers set of measured numbers
– AccuracyAccuracy: how close a : how close a measurement is to the true or measurement is to the true or accepted valueaccepted value
– PrecisionPrecision:: how closely how closely measurements of the same thing measurements of the same thing are to one another are to one another

Precision and AccuracyPrecision and Accuracy

25
Inaccurate &imprecise
Inaccurate butprecise
Accurate butimprecise
Relationship between accuracy and precision
Accurate and Precise

• Central value = Arithmetic mean = average
• Arithmetic Mean = Mean or average;
• Median: Modern numerical value• 20.6 20.1 20.7 20.0 20.4
• Ways to express the accuracy of data– Absolute Error = Xi - or -
• (+ve or –ve)– Relative mean error = Absolute error/– Percent relative error = Relative error X 100
N
XX
i

Ways to express the precision of data
• Average Deviation:
• Standard deviation: s =
• Relative average deviation =
• Relative standard deviation = • RSD may be called: Coefficient of variation
n
X Xi Σ d
1-n
2)X-(Xi
X
d
X
s

Percent relative standard deviation = %RSD
=
Range = Absolute difference between the
largest and the smallest values
Range = w = Xhighest - Xlowest
100XX
s

Significance of standard deviationSignificance of standard deviation
• The standard deviation, s, measures how closely the data are clustered about the mean.
• The significance of s is that the smaller the standard deviation, the more closely the data are clustered about the mean.
• A set of light bulbs having a small standard deviation in lifetime must be more uniformly manufactured than a set with a large standard deviation

ExampleCalculate the average and the standard deviation for the following four measurements: 821, 783, 834, and 855 hours. The average is
To avoid round‑off errors, we generally retain one more significant figure for the average and the standard deviation than was present in the original data. The standard deviation is
The average and the standard deviation should both end at the same decimal place. For = 823.2, the value s = 30.3 is reasonable, but s = 30.34 is not.
X
X

Types of ErrorsTypes of Errors
Determinate Errors or Systematic Errors:– They can be determined and eliminated– Those originate from a fixed cause.– They may be either high or low every time the
analysis is run
• Sources: Methods, Equipment and materials, Personal judgment, Mistakes
• Random (indeterminate errors) – They originate from indeterminate processes.– They produce a value that sometimes is high and
sometimes is low. – Ex: Flipping a coin!!

They cannot be controlled They can be evaluated statistically to
supply information about the reliability of the data
They vary in a nonreproducible way and never the same except by chance
Characteristics of indeterminate errors


• In mathematical description of Gaussian distribution, the scatter or precision is represented by a standard deviation if indefinitely large data set, ( the term s is used for a small data set, for a finite number of measurements)
varies according to data but 68.3% of the curve area always lies within 1 of the mean
• 95.4% of the curve area always lies within 2 of the mean
• 99.7% of the curve area always lies within 3 of the mean
• A large means a broad error curve, a small value means a small narrow curve.
• Number of degrees of freedom always equals to the number of measurements –1; (n-1).

Linearity (Fitting the Least Square Line) Linearity (Fitting the Least Square Line)
• Statistics provides a mathematical relationship that enables calculating the slope and intercept of the best straight line
• The equation for a straight line is
y = a + bx
a = intercept; b = slope• It is assumed that the values of x are almost free
of error• The failure of the data points to fall exactly on the
liens assumed to be caused entirely by the intermediate errors in the instrument readings, y

• The sum of the squares of the deviations, Q, of the actual instrument readings from the correct values are minimized (made minimum) by adjusting the values of the slope, b and the intercept, a
• If a linear relationship between x and y does exist, this puts the line through the best estimates of the true mean values.
• a = ; are the means of x’s and y’s• b =
• Once the best slope and intercept have been determined, a line with those values can be put on the graph along with the original data points to complete the plot
Xby y and X
2)(
))([(
XX
yyXX
i
ii

Example
• Many instrumental methods of analysis utilize calibration plots of measured signal versus concentration. Below are shown the data collected for such a plot. Assume that a linear relationship exists and that the concentration is the independent variable, known with a high degree of certainty.
Concentration Signal (ppm)
1.00 0.1162.00 0.2815.00 0.5677.00 0.88010.00 1.074
Calculate, using the least‑squares method, the slope and interceptof the "best‑fit" line. along with the confidence interval of each atthe 95 % level.

• Let the independent variable of concentration equal x and the dependent variable of signal equal y. Then
Data necessary for equations are:

• From the equations given above for a and b
• a =
• b =
• Slope = b = = 0.092
• Intercept = a = 0.584 – (0.1092)(5.20) = 0.016
Xby
2)(
))([(
XX
yyXX
i
ii
1092.026.53
817.5

Terms used in the control of analytical Terms used in the control of analytical proceduresprocedures
ICH: ICH: The International Conference on Harmonisation The International Conference on Harmonisation of Technical Requirements for Registration of of Technical Requirements for Registration of Pharmaceuticals for Human Use Pharmaceuticals for Human Use
ICH brings together the regulatory authorities and ICH brings together the regulatory authorities and pharmaceutical industry of Europe, Japan and the US to pharmaceutical industry of Europe, Japan and the US to discuss scientific and technical aspects of drug discuss scientific and technical aspects of drug registration.registration.

41
Method validation: What is it?Method validation is the evaluation of a method toensure that its performance is suitable for the analysisbeing carried out. ISO Definition• Confirmation by examination and provision of
objective evidence that the particular requirements for a specified intended use are fulfilled”
• [ISO 8402:1994]
Definition of method validation
Validation of analytical methods

42
Validation of analytical methods
Introduction: Why analytical monitoring? Definition of method validation Why method development and method validation? How method validation is done?
Requirements for a Validation of analytical procedures Validation protocol for analytical method Analytical Procedure Tests Required for Validation of the Analytical Procedure Specificity and selectivity Accuracy Precision Repeatability Reproducibility

43
Sensitivity Linearity and range Limit of detection Limit of quantitation System Stability Ruggedness Robustness System Suitability Extent of validation Protocols Classification of analytical tests Chemical laboratory validation requirements Revalidation Standard Reference Materials (SRMs) (or Primary
Standards) Accreditation of laboratory methods

44
Why method development and method validation?
• Validation of an analytical method will ensure that the results of an analysis are reliable, consistent and perhaps more importantly that there is a degree of
confidence in the results. • As either a customer of an analytical laboratory or as
a performing laboratory, it must be demonstrated that the parameter you determine is the right one and that the results have demonstrated “fitness for purpose”.– Method validation provides the necessary proof
that a method is “fit for purpose”.
45
• Official analytical methods described in and recognized publications for a particular active constituent or formulation are regarded as validated and do not require revalidation. (Regulatory methods)
• However, the suitability of these methods must be verified under actual conditions of use i.e., the specificity and precision of the method should be demonstrated for the published method when applied to the relevant sample matrix and laboratory
conditions.
Comments on method development and method validation?

46
Tests Required for Validation of the Analytical Procedure
Data submitted should, as appropriate, address the following parameters:
• Specificity of the procedure• Accuracy and precision of the procedure• Linearity of response for the analyte (and internal
standard, if appropriate)• Limit of detection• Limit of quantitation• Sensitivity• Ruggedness/Robustness

47
The USP Eight Steps of Method Validation

48
• It is the ability to assess clearly the analyte in the presence of components which may be expected to be present.
• Typically, these might include impurities, degradants, matrix, etc.
• The specificity of the analytical method must be demonstrated by providing data to show that:– Known degradation products and synthetic impurities do
not interfere with the determination of the active constituent in bulk actives
– Known degradation products, synthetic impurities and sample matrix present in the commercial product do not interfere with the determination of the active constituent
•
1. Specificity and selectivity

49
• Accuracy
• Precision
(could be expressed by : standard deviation, variance, or coefficient of variation)
– Repeatability (intra-assay precision): same operating conditions under short interval of time) same person using single instrument)
– Intermediate precision
– Reproducibility
2 .Accuracy and Precision

50
• The closeness of agreement between the value which is accepted either as a conventional true value or an accepted reference value, and the value found.
• When measuring accuracy, it is important to spike the sample matrix with varying amounts of active ingredient(s).
• If a matrix cannot be obtained, then a sample should be spiked at varying levels.
• In both cases, acceptable recovery must be demonstrated.
Accuracy

51
• Accuracy is often described as “trueness”– Trueness: The closeness of agreement between
the arithmetic mean of a large number of test results and the true or accepted reference value. [BS ISO 5725-1:1994]
52
• For some methods the true value cannot be determined exactly and it may be possible to use an accepted reference value to determine this value.
• For example if suitable reference materials are available or if the reference value can be determined by comparison with another method.

53
• Accuracy may be measured in different ways and the method should be appropriate to the matrix.
• The accuracy of an analytical method may be determined by any of the following ways:
Measurements of Accuracy

54
a. Analyzing a sample of known concentration and comparing the measured value to the ‘true’ value . However, a well characterized sample (e.g., reference standard, a Certified Reference Material (CRM) must be used.

55

56
b. Spiked –Product matrix recovery method (Most widely used)
• A known amount of pure active constituent is added to the blank [sample that contains all other
ingredients except the active(s)] matrix.
• Spiked samples are generally prepared at 3 levels in the range 50 - 150 % of the target concentration.
• The matrix is constructed to mimic representative samples in all respects where possible. For impurities, spiked samples are prepared over a range that covers the impurity content, for example 0.1 - 2.5 % w/w.
• The resulting mixture is assayed, and the results obtained are compared with the expected result.

57
c. Standard addition method • This method is used if a blank sample
cannot be prepared without the analyte being present.
• A sample is assayed, a known amount of pure active constituent is added, and the sample is again assayed.
• The difference between the results of the two assays is compared with the expected answer.

58

59
• The accuracy of a method may vary across the range of possible assay values and therefore must be determined at several different levels.
• The accuracy should cover at least 3 concentrations (80, 100 and 120% or others) in the expected range.
• Accuracy may also be determined by comparing test results with those obtained using another validated test method.

60
Acceptance criteria:
• The expected recovery depends on the sample matrix, the sample processing procedure and on the analyte concentration.
• The mean % recovery should be within the following ranges:

61
%Active/impurity content
Acceptable mean recover
(%)
> 10 98 - 102
> 1 90 - 110
0.1 - 1 80 - 120
< 0.1 75 - 125

62
• It is the closeness of agreement (degree of scatter) between a series of measurements obtained from multiple sampling of the homogeneous sample under the prescribed conditions.
• Precision may be considered at three
levels: repeatability, intermediate precision and reproducibility.
Precision

63
• It expresses the precision under the same operating conditions over a short interval of time. Repeatability is also termed intra-assay precision
• Factors such as the operator, equipment, calibration and environmental considerations, remain constant and have little or no contribution to the final results
• Repeatability consists intra-laboratory assay: repeated analysis (a minimum of 5 replicate determinations
must be made and the mean, % Relative Standard Deviation ,RSD, and number of determinations reported) of an independently prepared sample on the same day by the same operator in the same laboratory.
a. Repeatability

64
• It expresses variations within-laboratories : different days, different analysts, different equipment, etc.
• Repeated analysis (a minimum of 5 replicate determinations must be made and the mean, % RSD and number of determinations reported) of an independently prepared sample by different operators on different days in the same laboratory.
b. Intermediate Precision
65
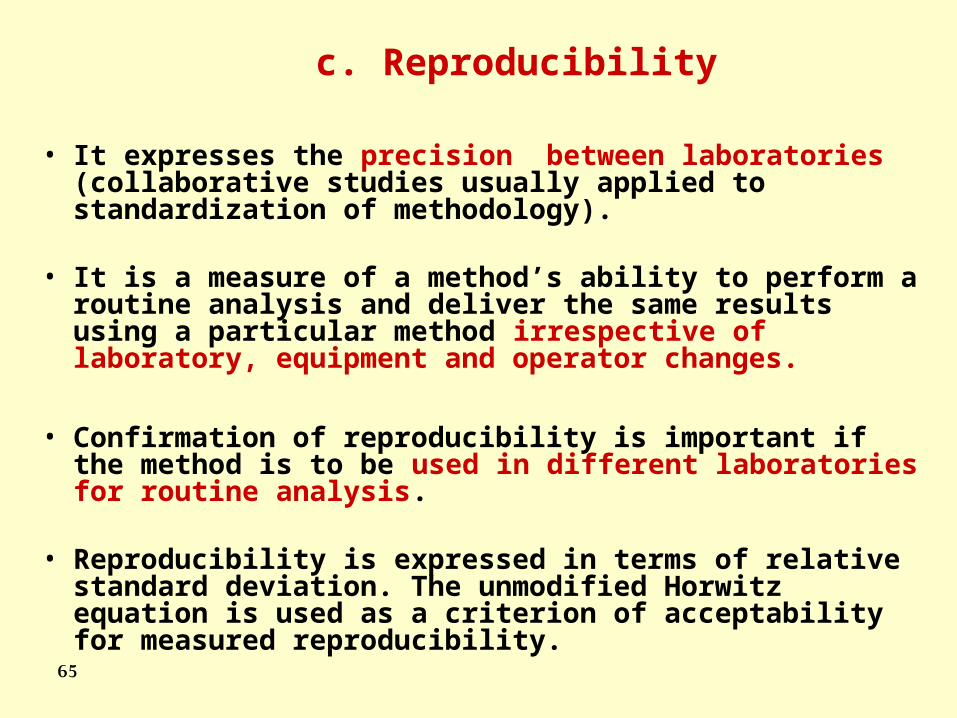
• It expresses the precision between laboratories (collaborative studies usually applied to standardization of methodology).
• It is a measure of a method’s ability to perform a routine analysis and deliver the same results using a particular method irrespective of laboratory, equipment and operator changes.
• Confirmation of reproducibility is important if the method is to be used in different laboratories for routine analysis.
• Reproducibility is expressed in terms of relative standard deviation. The unmodified Horwitz equation is used as a criterion of acceptability for measured reproducibility.
c. Reproducibility

66
• The modified Horwitz equation which suggests
RSD < 2 (1 - 0.5 log C) x 0.67 Where C is the concentration of the analyte expressed as a decimal fraction (i.e. 0.1, 1x10⁻⁶ etc.)• Collaborative methods do not require
validation of reproducibility since by their nature they are validated in this way (providing that the analysis falls within the validated range of that method).
67
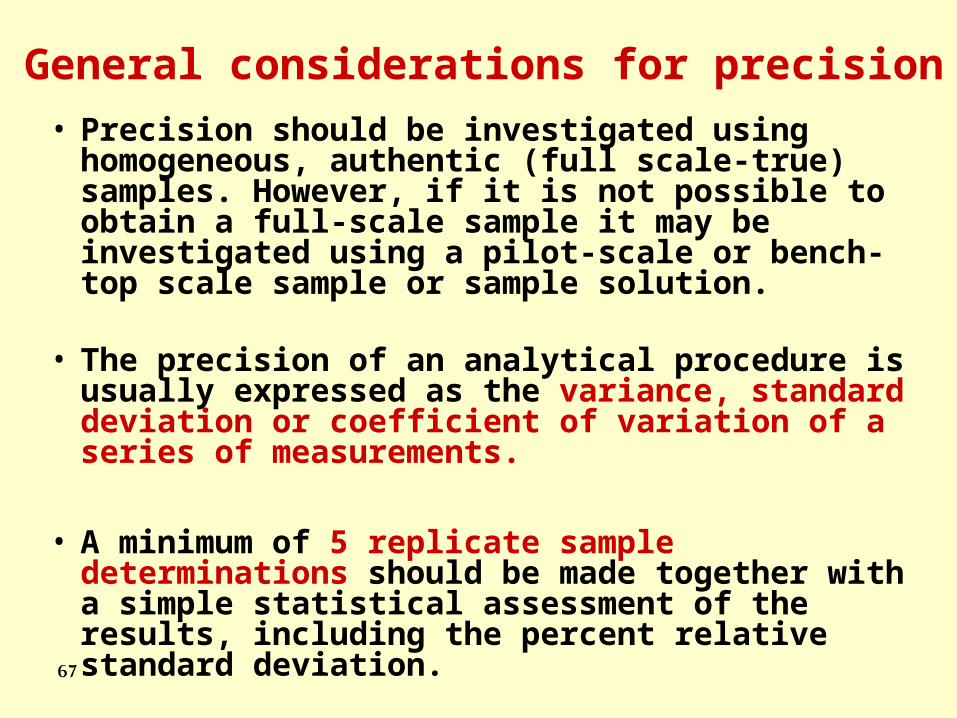
• Precision should be investigated using homogeneous, authentic (full scale-true) samples. However, if it is not possible to obtain a full-scale sample it may be investigated using a pilot-scale or bench-top scale sample or sample solution.
• The precision of an analytical procedure is usually
expressed as the variance, standard deviation or coefficient of variation of a series of measurements.
• A minimum of 5 replicate sample determinations should be made together with a simple statistical assessment of the results, including the percent relative standard deviation.
General considerations for precision

68 Mebendazole is used as anthelmintic

69

70
%Component measured in sample
Precision RSD
%
10.0 2
1.0 to 10.0 5
0.1 up to 1.0 10
< 0.1 20

71
72
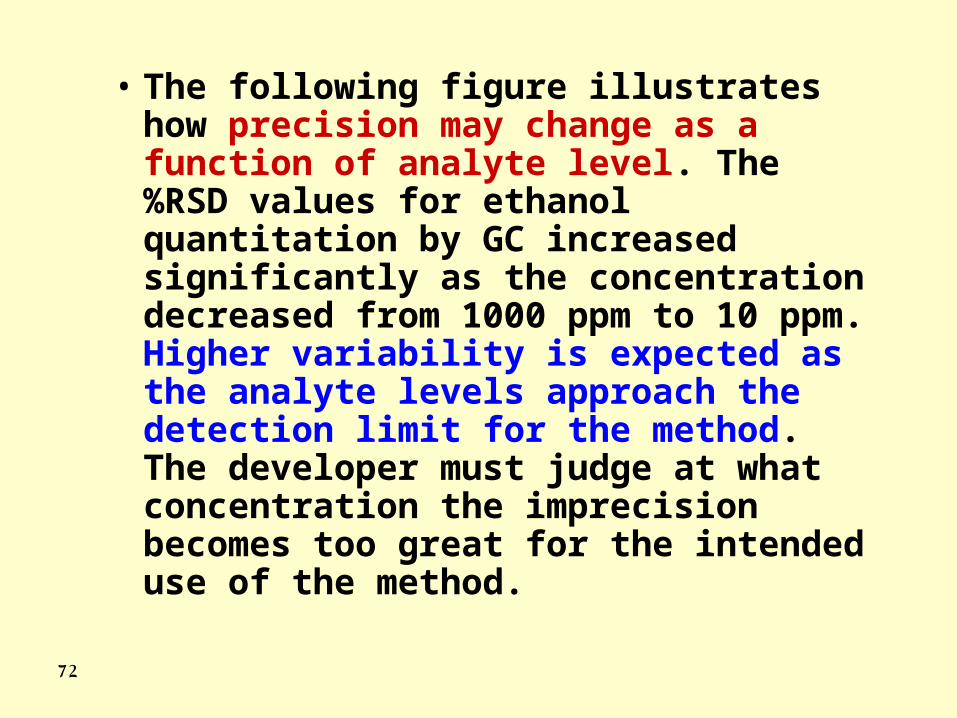
• The following figure illustrates how precision may change as a function of analyte level. The %RSD values for ethanol quantitation by GC increased significantly as the concentration decreased from 1000 ppm to 10 ppm. Higher variability is expected as the analyte levels approach the detection limit for the method. The developer must judge at what concentration the imprecision becomes too great for the intended use of the method.

73
Figure 2. %RSD versus concentration for a GC headspace analysis of ethanol.

74
•Sensitivity
•Linearity and range
•Limit of detection
•Limit of quantitation
3. Sensitivity, linearity, limit of detection,limit of quantification

75
It is the gradient of the response curve, i.e. the change in instrument response that corresponds to a change in analyte concentration within the linear range
Sensitivity

76
• A linearity study verifies that the sample solutions are in a concentration range where analyte response is linearly proportional to concentration.
• For assay methods, this study is generally performed by preparing standard solutions at five concentration levels, from 50 to 150% of the target analyte concentration.
• Five levels are required to allow detection of curvature in the plotted data.
Linearity

77
•Standards should be prepared and analyzed a minimum of three times. •For impurity (low concentrations) methods, linearity is determined by preparing standard solutions at five concentration levels over a range such as 0.05-2.5 wt%.•When linear regression analyses are performed, it is important not to force the origin as (0,0) in the calculation. This practice may significantly skew the actual best-fit slope through the physical range of use.

78
• The linearity of the method over an appropriate range must be determined and reported. The range selected must cover the nominal concentration of the analyte in the product ± 25%.
• Duplicate determinations must be made at 3 (nominal concentration ± 25%) or more concentrations.
• Reports submitted must include, the slope of the line, intercept and correlation coefficient data.

79
Linearity of an analyte in a material
0.010
0.015
0.020
0.025
0.030
0.035
0.040
0.01 0.015 0.02 0.025 0.03 0.035 0.04
Reference material mg/mlCal
cula
ted a
nal
yte
in m
g/m
L Table of values (x,y)
x y # Reference
material mg/mlCalculated
mg/ml
1 0.0100 0.0101
2 0.0150 0.0145
3 0.0200 0.0210
4 0.0250 0.0260
5 0.0300 0.0294
6 0.0400 0.0410
Linearity

80
Linearity Statistics
•Intercept -0.0002
•Limit of Linearity and Range 0.005 – 0.040 mg/mL
•Slope 1.0237
•Correlation coefficient 0.9978
•Relative standard deviation 3.4%

81
• Acceptability of linearity data is often judged by examining the correlation coefficient and y-intercept of the linear regression line for the response versus concentration plot.
• A correlation coefficient of > 0.999 is generally considered as evidence of acceptable fit of the data to the regression line.
• The y-intercept should be less than a few percent of the response obtained for the analyte at the target level.

82

83
Calibration and Standards• In almost all chemical analysis, chemical
concentrations are found by indirect measurements, which are based on direct measurements together with calibration
• Calibration is to ascertain the relationship between the content of the sample and the response of the assay method and is essential for quantitative analysis.
• Chemical standards are pure substances, mixtures, solutions, gases, or materials such as alloys or biological substances that are used to calibrate and validate all or part of the methodology of a chemical analysis.
• Experimental optimization of an assay normally requires the use of chemical standards

84
• It is the interval between the upper and lower concentration of analyte in the sample (including these concentrations) for which it has been demonstrated that the analytical procedure has a suitable level of precision, accuracy and linearity.
Range

85
• In practice, the range is determined using data from the linearity and accuracy studies.
• Assuming that acceptable linearity and accuracy (recovery) results were obtained
Determination of the range

86
• An example of range criteria for an assay method is that the acceptable range will be defined as the concentration interval over which linearity and accuracy are obtained per previously discussed criteria and that yields a precision of 3% RSD.
• For an impurity method, the acceptable range will be defined as the concentration interval over which linearity and accuracy are obtained per the above criteria, and that, in addition, yields a precision of 10% RSD.
Acceptance criteria for the Range

87
• It is the lowest amount of analyte in a sample which can be detected but not necessarily quantitated as an exact value.
• Limit of detection is the point at which a measured value is larger than the uncertainty associated with it.
• In chromatography,e.g., limit of detection is an amount that produces a peak with a height at least 3 times that of the baseline noise level.
• For validation it is usually sufficient to indicate the level at which detection becomes problematic.
Limit of Detection

88
LOQ, LOD and S/N-R
• Limit of Quantitation
• Limit of Detection
• Signal to Noise Ratio
noise
Peak ALOD
Peak BLOQ
Baseline
• Noise level plays an important role in the LOD and LOQ!

89
• The LOD may be determined by injecting the lowest calibration standard 10 (could be 20) times and calculating the standard deviation. Three times the standard deviation will be the LOD.

90
• The limit of quantitation is a parameter of quantitative assays for low levels of compounds in sample matrices and is used particularly for the determination of impurities and/or degradation products or low levels of active constituent in a
product.• The limit of quantitation is the lowest amount of
the analyte in the sample that can be quantitatively determined with defined precision under the stated experimental conditions.
Limit of quantitation (LOQ)

91
• The LOQ may be determined by preparing standard solutions at estimated LOQ concentration (based on preliminary studies).
• The solution should be injected and analyzed n (normally 6-10) times.
• The average response and the relative standard deviation (RSD) of the n results should be calculated and the RSD should be less than 20%.
• If the RSD exceeds 20%, a new standard solution of higher concentration should be prepared and the above procedure repeated.
92
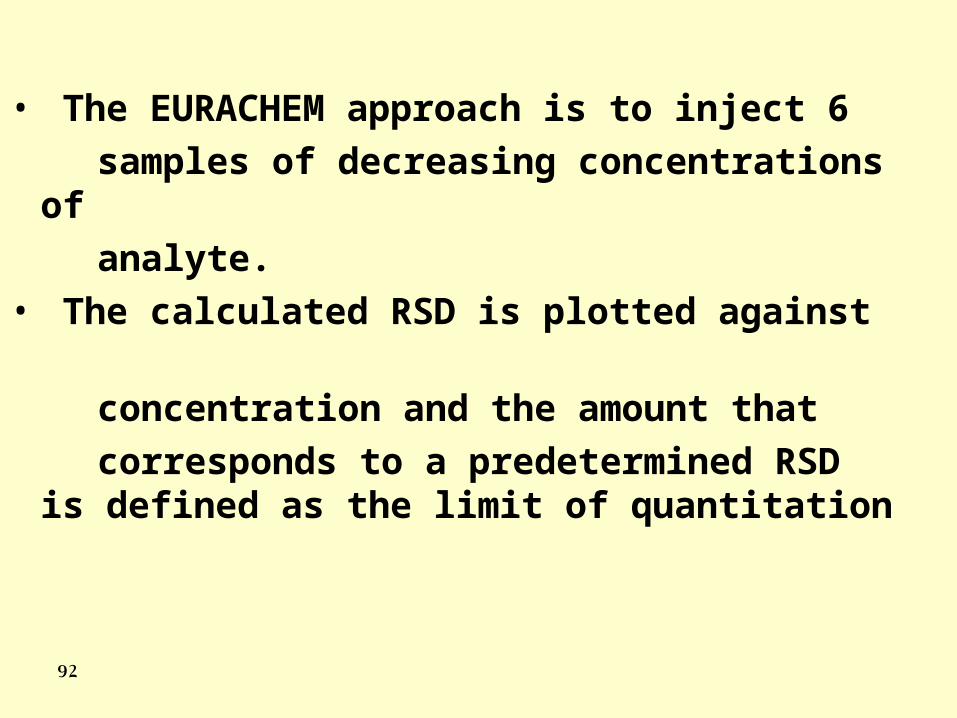
• The EURACHEM approach is to inject 6
samples of decreasing concentrations of
analyte.
• The calculated RSD is plotted against
concentration and the amount that
corresponds to a predetermined RSD is defined as the limit of quantitation

93

94
• Many solutes readily decompose prior to analytical investigations, for example during the preparation of the sample solutions, during extraction, clean-up, phase transfer, and during storage of prepared vials (in refrigerators or in an automatic sampler).
• Under these circumstances, method development should investigate the stability of the analytes.
4. System Stability

95
• It is a measure of the bias in assay results generated during a pre-selected time interval, for example every hour up to 46 h, using a single solution.
• System stability should be determined by replicate analysis of the sample solution.
• System stability is considered to be appropriate if the relative standard deviation calculated on the assay results obtained in different time intervals does not exceed more than 20 % of the corresponding value of the system precision.
• If the value is higher on plotting the assay results as a function of time, the maximum duration of the usability of the sample solution can be calculated.
Determination of the stability of the samples being analyzed in a sample solution

96
97
Example of system stability
• The effect of long-term storage and freeze-thaw cycles can be investigated by analyzing a spiked sample immediately upon preparation and on subsequent days of the anticipated storage period.
• A minimum of two cycles at two concentrations should be studied in duplicate.
• If the integrity of the drug is affected by freezing and thawing, spiked samples should be stored in individual containers and appropriate caution should be employed for study samples.
98
• Ruggedness • Robustness• Variability caused by:
– Day-to-day variations– Analyst-to-analyst– Laboratory-to-laboratory– Instrument-to-instrument– Chromatographic column-to-column– Reagent kit-to-kit– Instability of analytical reagents
5 .Ruggedness and robustness of the method

99
• The robustness of an analytical procedure is a measure of its capacity to remain unaffected by small, but deliberate, variations in method parameters and provides an indication of its reliability during normal usage.
• Ideally, robustness should be explored during the development of the assay method.
• For the most efficient way to do this is through the use of a designed experiment.
• Such experimental designs might include a Plackett-Burman matrix approach to investigate first order effects, or a 2k factorial design that will provide information regarding the first (main) and higher order (interaction) effects.
Robustness

100
• In carrying out such a design, one must first identify variables in the method that may be expected to influence the result. • For instance, consider an HPLC assay which uses an ion-pairing reagent. One might investigate: sample sonication or mixing time; mobile phase organic solvent constituency; mobile phase pH; column temperature; injection volume; flow rate; modifier concentration; concentration of ion-pairing reagent; etc. • It is through this sort of a development study that variables with the greatest effects on results may be determined in a minimal number of experiments. •The actual method validation will ensure that the final, chosen ranges are robust