profarma healthcare15 vf_2
TRANSCRIPT
January 13, 2015
J.P. Morgan Healthcare Conference

POSITIVE SECTOR DYNAMICS
Positive Sector Dynamics | Global Market
3
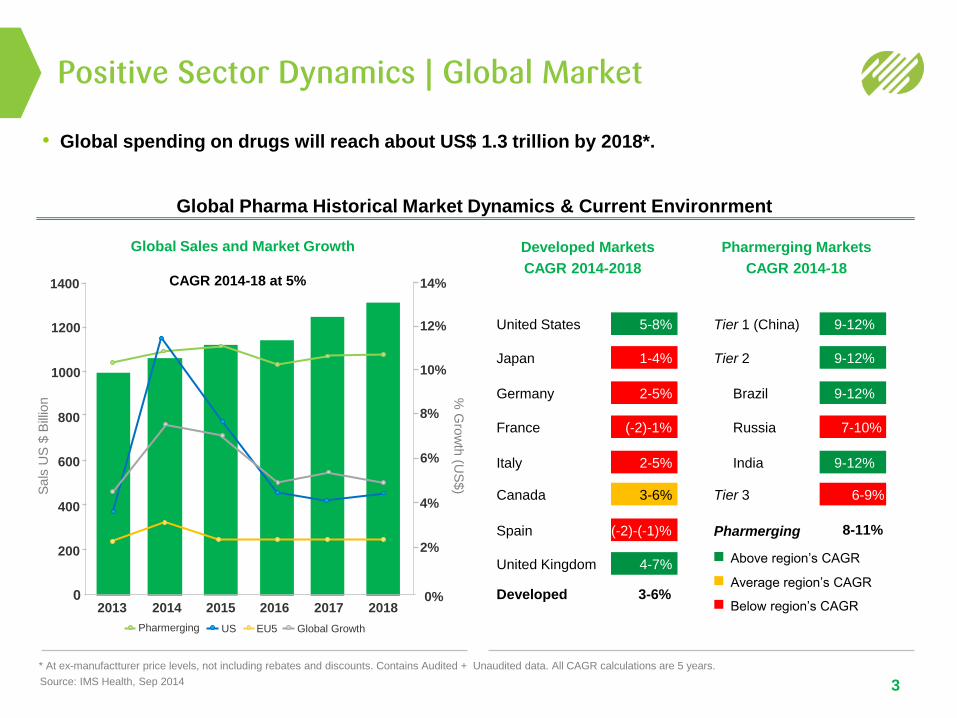
* At ex-manufactturer price levels, not including rebates and discounts. Contains Audited + Unaudited data. All CAGR calculations are 5 years.
Global Sales and Market Growth
2013 2014 2015 2016 2017 2018
800
600
400
200
0
6%
4%
2%
0%
Sals
US
$ B
illio
n %
Gro
wth
(US
$)
Source: IMS Health, Sep 2014
1200
1000
United States 5-8% Tier 1 (China) 9-12%
Japan 1-4% Tier 2 9-12%
Germany 2-5% Brazil 9-12%
France (-2)-1% Russia 7-10%
Italy 2-5% India 9-12%
Canada 3-6% Tier 3 6-9%
Spain (-2)-(-1)% Pharmerging 8-11%
United Kingdom 4-7%
Developed 3-6%
Developed Markets
CAGR 2014-2018
Pharmerging Markets
CAGR 2014-18
Above region’s CAGR
Average region’s CAGR
Below region’s CAGR
Global Pharma Historical Market Dynamics & Current Environrment
CAGR 2014-18 at 5%
8%
• Global spending on drugs will reach about US$ 1.3 trillion by 2018*.
1400
10%
12%
14%
Pharmerging US EU5 Global Growth
Positive Sector Dynamics | Elements of Market Growth
4
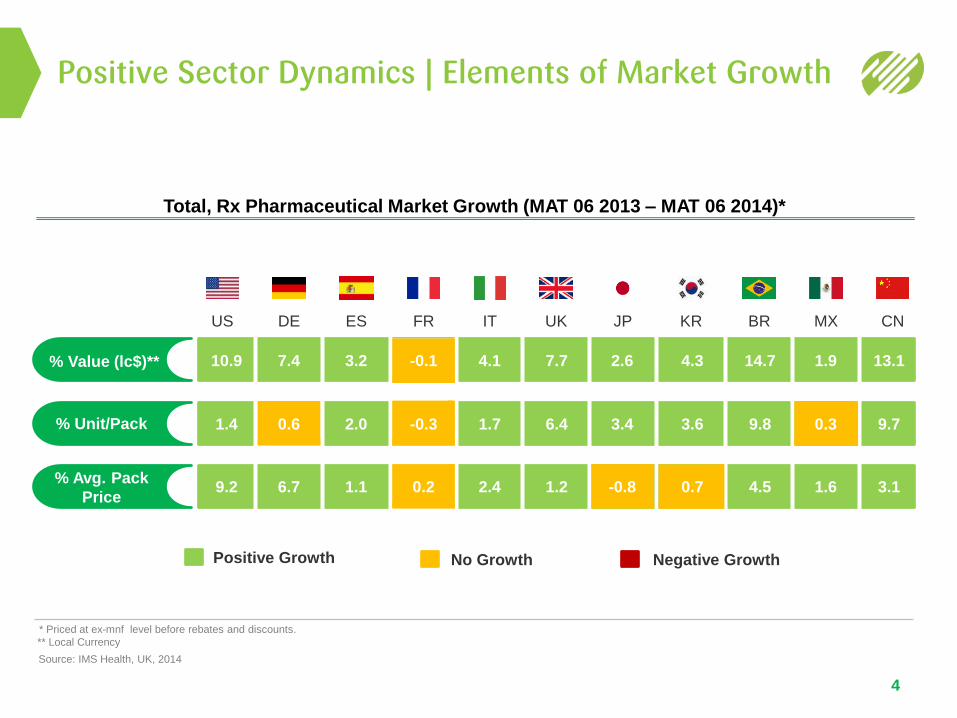
Source: IMS Health, UK, 2014
Total, Rx Pharmaceutical Market Growth (MAT 06 2013 – MAT 06 2014)*
US DE ES FR IT UK JP KR BR MX CN
% Value (lc$)**
% Unit/Pack
% Avg. Pack
Price 9.2 6.7 2.4 1.2 4.5 1.6 3.1 1.1 -0.8 -0.8 -0.8 0.7 -0.8 0.2
10.9 -0.8 -0.1 7.4 3.2 4.1 7.7 2.6 4.3 14.7 13.1 1.9
1.4 -0.8 -0.3 -0.8 0.6 2.0 1.7 6.4 3.4 3.6 9.8 9.7 -0.8 0.3
Positive Growth Negative Growth No Growth
* Priced at ex-mnf level before rebates and discounts.
** Local Currency
Positive Sector Dynamics | Elements of Market Growth
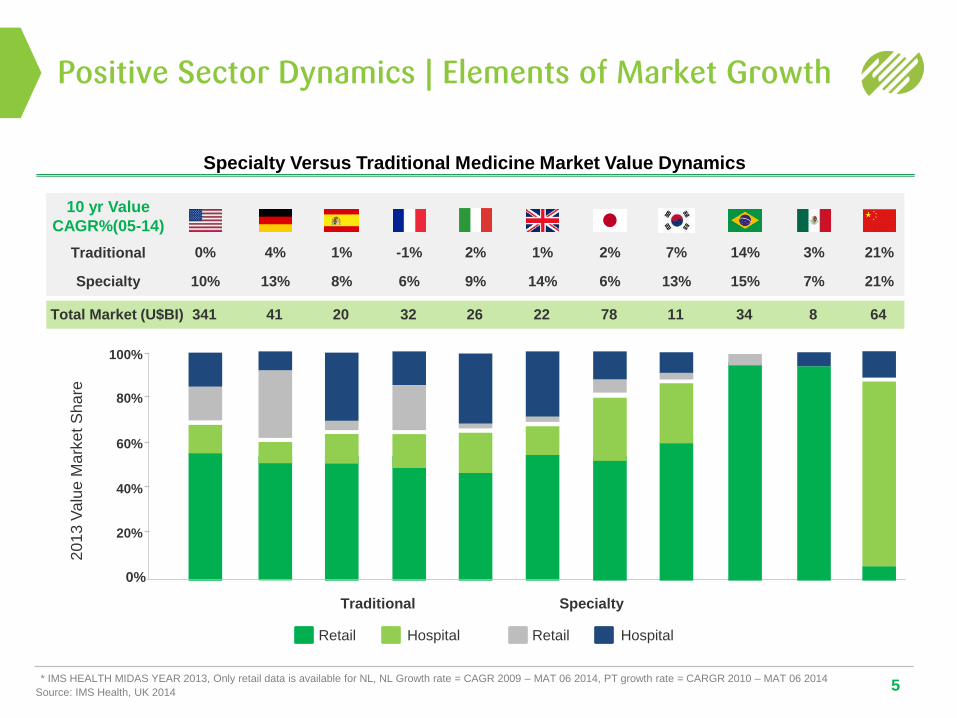
5 Source: IMS Health, UK 2014
Specialty Versus Traditional Medicine Market Value Dynamics
* IMS HEALTH MIDAS YEAR 2013, Only retail data is available for NL, NL Growth rate = CAGR 2009 – MAT 06 2014, PT growth rate = CARGR 2010 – MAT 06 2014
Retail Hospital
Traditional
Retail Hospital
Specialty
20
13
Va
lue
Ma
rket S
ha
re
80%
60%
40%
20%
0%
100%
0%
10%
Traditional
Specialty
10 yr Value
CAGR%(05-14)
4%
13%
1%
8%
-1%
6%
2%
9%
1%
14%
2%
6%
7%
13%
14%
15%
3%
7%
21%
21%
341 Total Market (U$BI) 41 20 32 26 22 78 11 34 8 64
Positive Sector Dynamics | The Brazilian Market
6 Source: IBGE. Farmácia Popular, Health, OMS, IMS, Brazil Central Bank
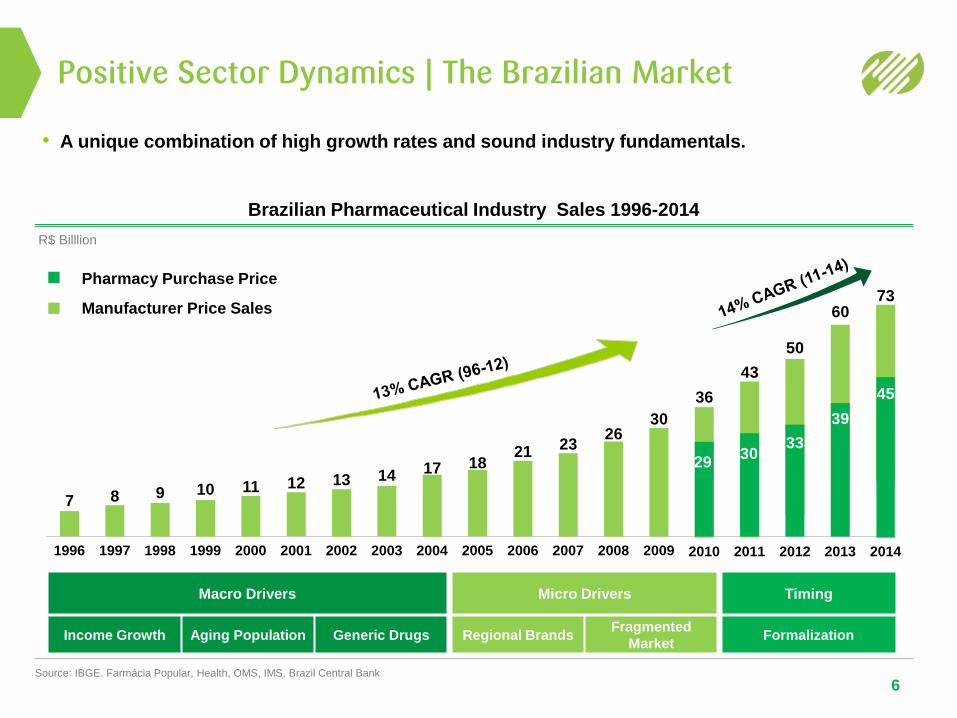
Macro Drivers Micro Drivers Timing
Income Growth Aging Population Generic Drugs Regional Brands Fragmented
Market Formalization
Pharmacy Purchase Price
Manufacturer Price Sales
Brazilian Pharmaceutical Industry Sales 1996-2014
• A unique combination of high growth rates and sound industry fundamentals.
R$ Billlion
7
1996
8
1997
9
1998
10
1999
11
2000
12
2001
13
2002
14
2003
17
2004
18
2005
21
2006
23
2007
26
2008
30
2009
50
33
2012
39
60
2013
45
73
2014
43
2011
30
36
2010
29
7
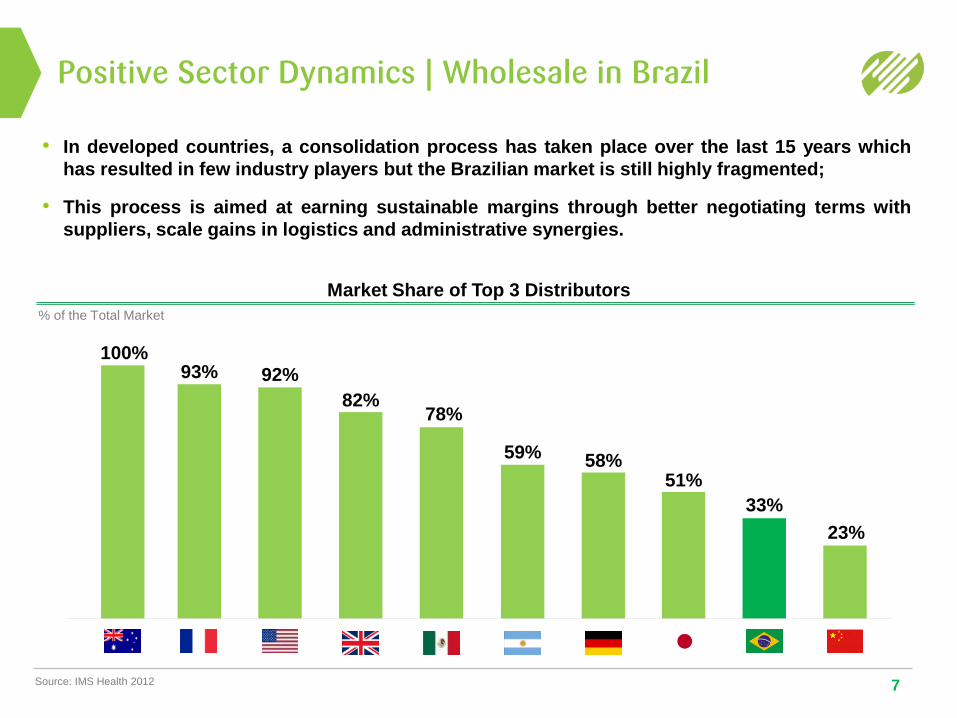
Market Share of Top 3 Distributors
% of the Total Market
Source: IMS Health 2012
100% 93% 92%
82% 78%
59% 58% 51%
33%
23%
• In developed countries, a consolidation process has taken place over the last 15 years which
has resulted in few industry players but the Brazilian market is still highly fragmented;
• This process is aimed at earning sustainable margins through better negotiating terms with
suppliers, scale gains in logistics and administrative synergies.
Positive Sector Dynamics | Wholesale in Brazil
Positive Sector Dynamics | The Retail Industry in Brazil
8
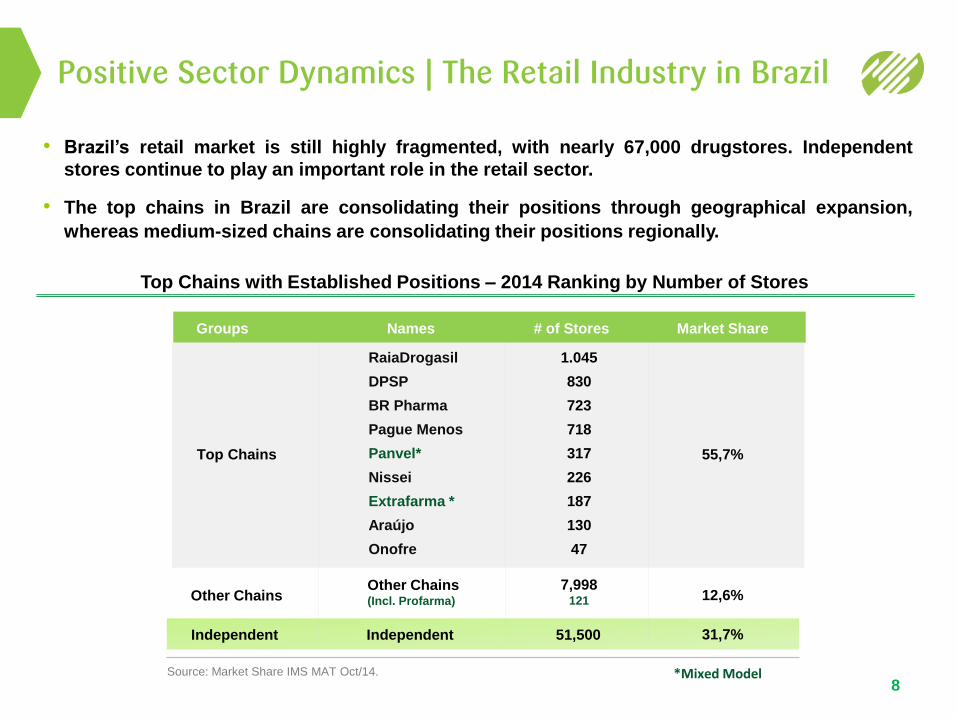
• Brazil’s retail market is still highly fragmented, with nearly 67,000 drugstores. Independent
stores continue to play an important role in the retail sector.
• The top chains in Brazil are consolidating their positions through geographical expansion,
whereas medium-sized chains are consolidating their positions regionally.
Groups # of Stores Names
Source: Market Share IMS MAT Oct/14.
Market Share
12,6%
31,7%
55,7% Top Chains
RaiaDrogasil
DPSP
BR Pharma
Pague Menos
Panvel*
Nissei
Extrafarma *
Araújo
Onofre
1.045
830
723
718
317
226
187
130
47
Other Chains Other Chains (Incl. Profarma)
7,998 121
Independent Independent 51,500
*Mixed Model
Top Chains with Established Positions – 2014 Ranking by Number of Stores
9
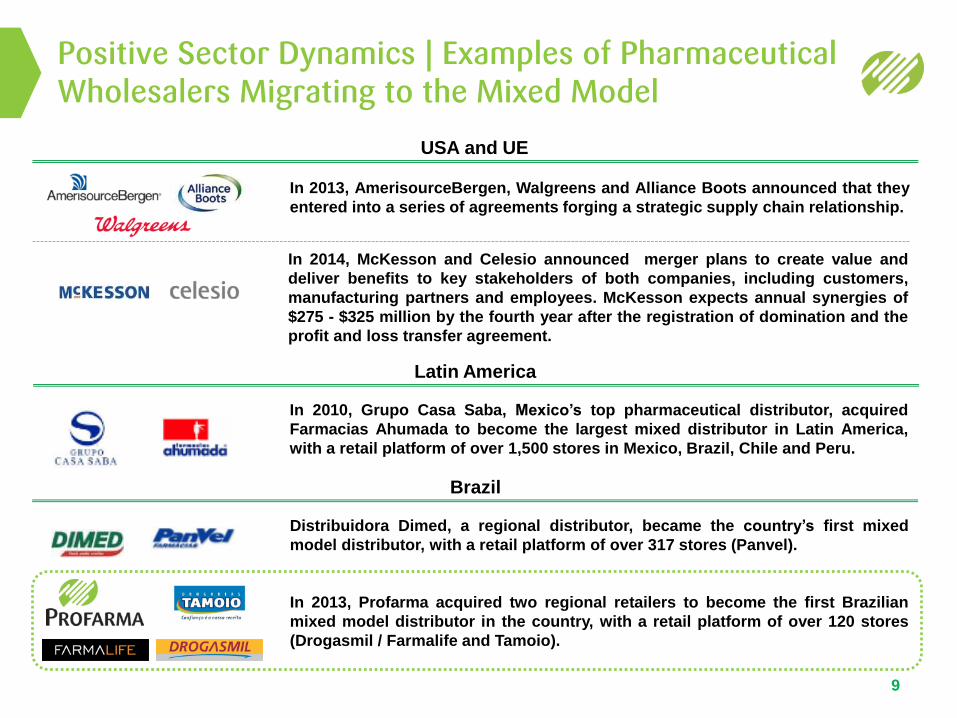
Positive Sector Dynamics | Examples of Pharmaceutical Wholesalers Migrating to the Mixed Model
In 2013, AmerisourceBergen, Walgreens and Alliance Boots announced that they
entered into a series of agreements forging a strategic supply chain relationship.
USA and UE
Latin America
In 2010, Grupo Casa Saba, Mexico’s top pharmaceutical distributor, acquired
Farmacias Ahumada to become the largest mixed distributor in Latin America,
with a retail platform of over 1,500 stores in Mexico, Brazil, Chile and Peru.
Distribuidora Dimed, a regional distributor, became the country’s first mixed
model distributor, with a retail platform of over 317 stores (Panvel).
Brazil
In 2013, Profarma acquired two regional retailers to become the first Brazilian
mixed model distributor in the country, with a retail platform of over 120 stores
(Drogasmil / Farmalife and Tamoio).
In 2014, McKesson and Celesio announced merger plans to create value and
deliver benefits to key stakeholders of both companies, including customers,
manufacturing partners and employees. McKesson expects annual synergies of
$275 - $325 million by the fourth year after the registration of domination and the
profit and loss transfer agreement.
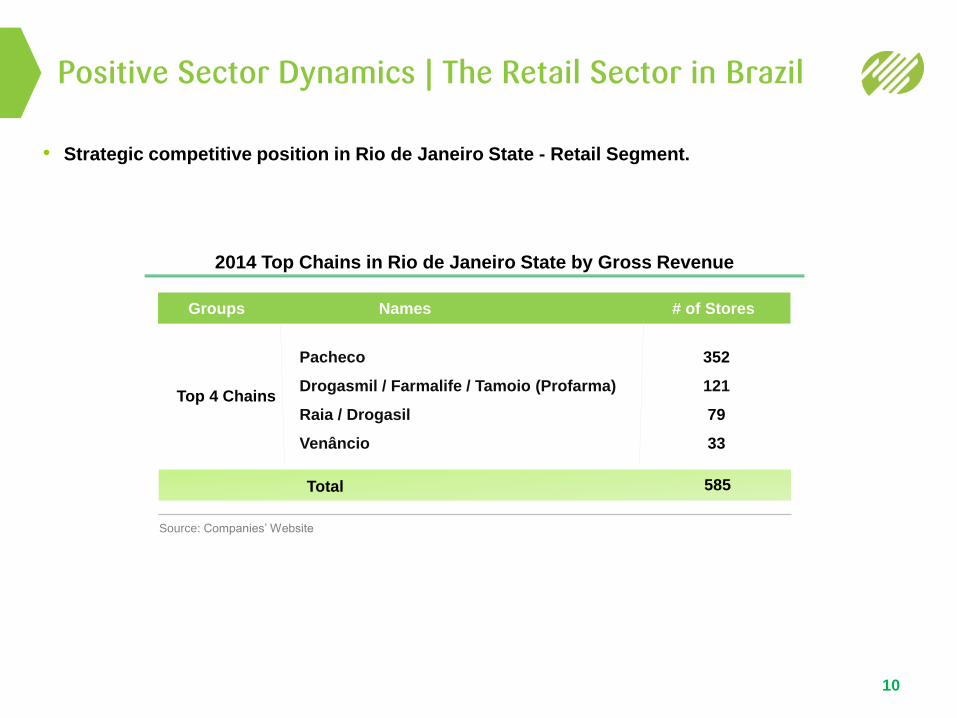
Positive Sector Dynamics | The Retail Sector in Brazil
10
• Strategic competitive position in Rio de Janeiro State - Retail Segment.
Groups # of Stores Names
Top 4 Chains
Pacheco
Drogasmil / Farmalife / Tamoio (Profarma)
Raia / Drogasil
Venâncio
352
121
79
33
585 Total
2014 Top Chains in Rio de Janeiro State by Gross Revenue
Source: Companies’ Website
COMPANY’S OVERVIEW
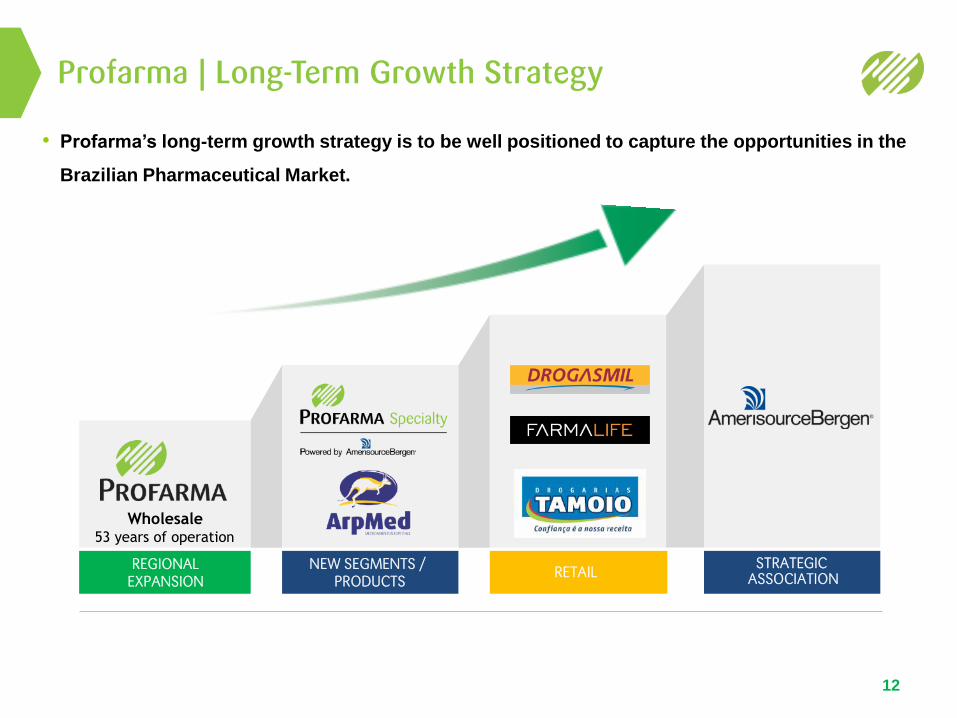
• Profarma’s long-term growth strategy is to be well positioned to capture the opportunities in the
Brazilian Pharmaceutical Market.
Profarma | Long-Term Growth Strategy
12
Wholesale 53 years of operation
REGIONAL EXPANSION
NEW SEGMENTS / PRODUCTS
STRATEGIC ASSOCIATION RETAIL
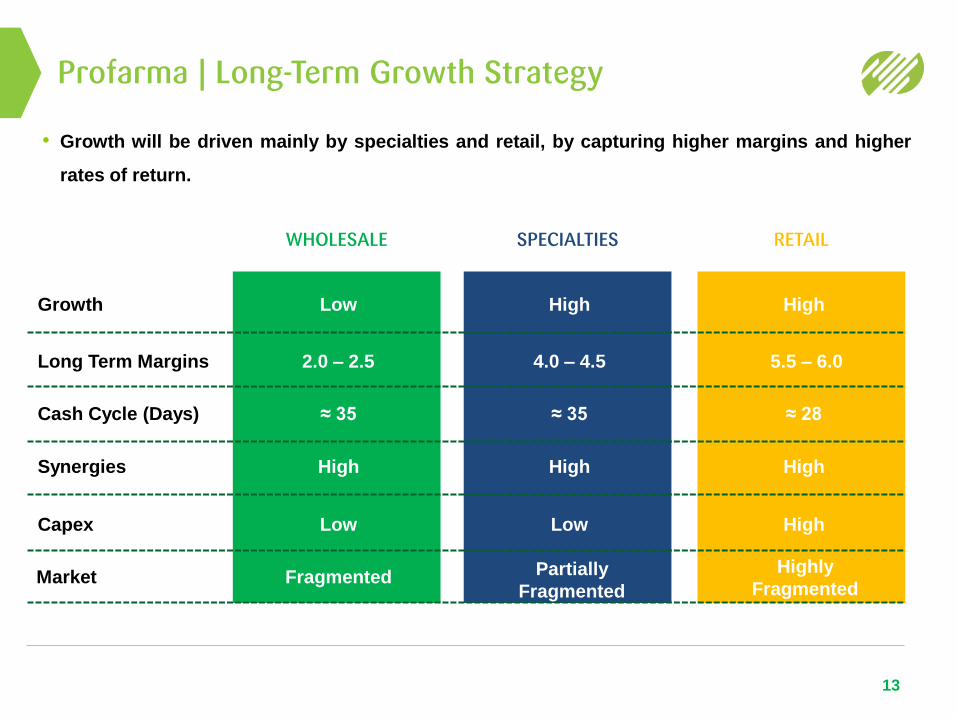
• Growth will be driven mainly by specialties and retail, by capturing higher margins and higher
rates of return.
Profarma | Long-Term Growth Strategy
13
WHOLESALE SPECIALTIES RETAIL
Growth
Long Term Margins
Cash Cycle (Days)
Synergies
Capex
Low High High
2.0 – 2.5 4.0 – 4.5 5.5 – 6.0
Low Low High
≈ 35 ≈ 35 ≈ 28
High High High
Market Fragmented Partially
Fragmented
Highly
Fragmented
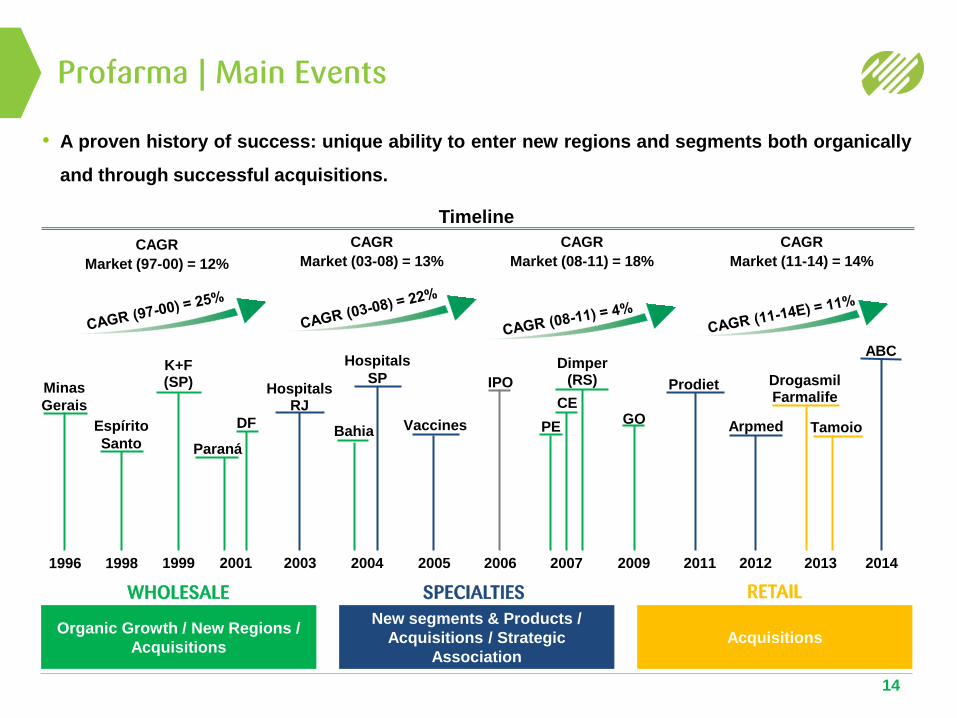
Profarma | Main Events
14
Timeline
Organic Growth / New Regions /
Acquisitions
New segments & Products /
Acquisitions / Strategic
Association
Acquisitions
Espírito
Santo
1998
K+F (SP)
1999
Minas
Gerais
1996
DF
Paraná
2001
Hospitals RJ
2003
Vaccines
2005
IPO
2006
PE
Dimper (RS)
CE
2007 2009
Prodiet
2011
Arpmed
2012
Bahia
2004
Hospitals
SP
2013
Tamoio
Drogasmil Farmalife
ABC
2014
GO
• A proven history of success: unique ability to enter new regions and segments both organically
and through successful acquisitions.
SPECIALTIES WHOLESALE RETAIL
CAGR
Market (11-14) = 14%
CAGR
Market (08-11) = 18%
CAGR
Market (03-08) = 13% CAGR
Market (97-00) = 12%
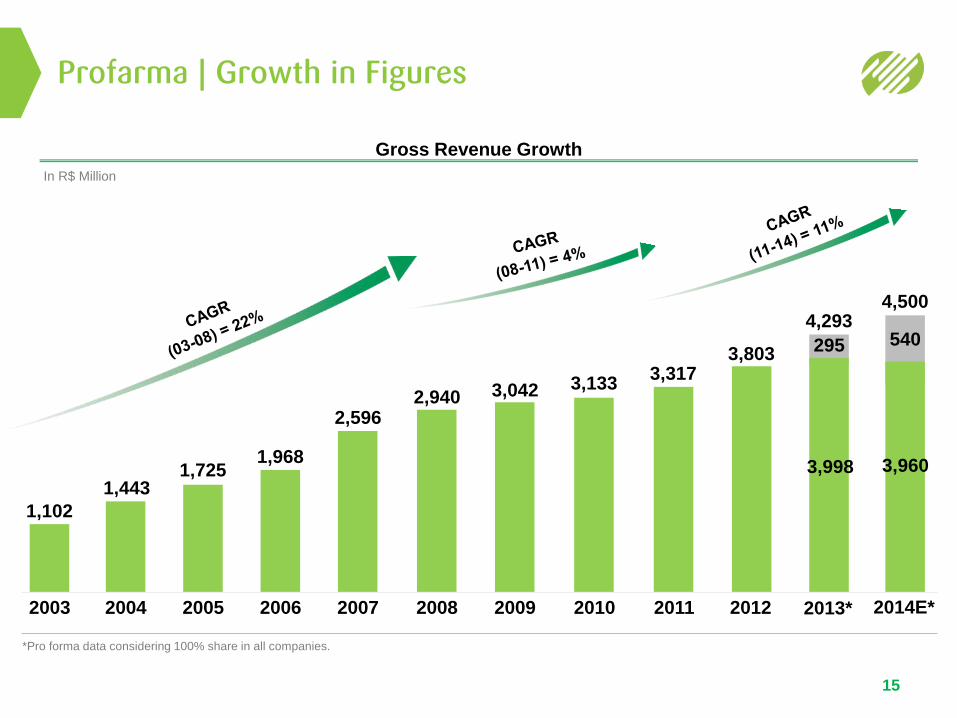
Profarma | Growth in Figures
15
In R$ Million
1,102
2003
1,443
2004
1,725
2005
1,968
2006
2,596
2007
2,940
2008
3,042
2009
3,133
2010
Gross Revenue Growth
2011
3,317
2012
3,803
4,293
2013*
3,998
295
4,500
2014E*
3,960
540
*Pro forma data considering 100% share in all companies.
68.1
80.1 78.7
110.7
74.6 73.0
92.2
125.1** 126.1**
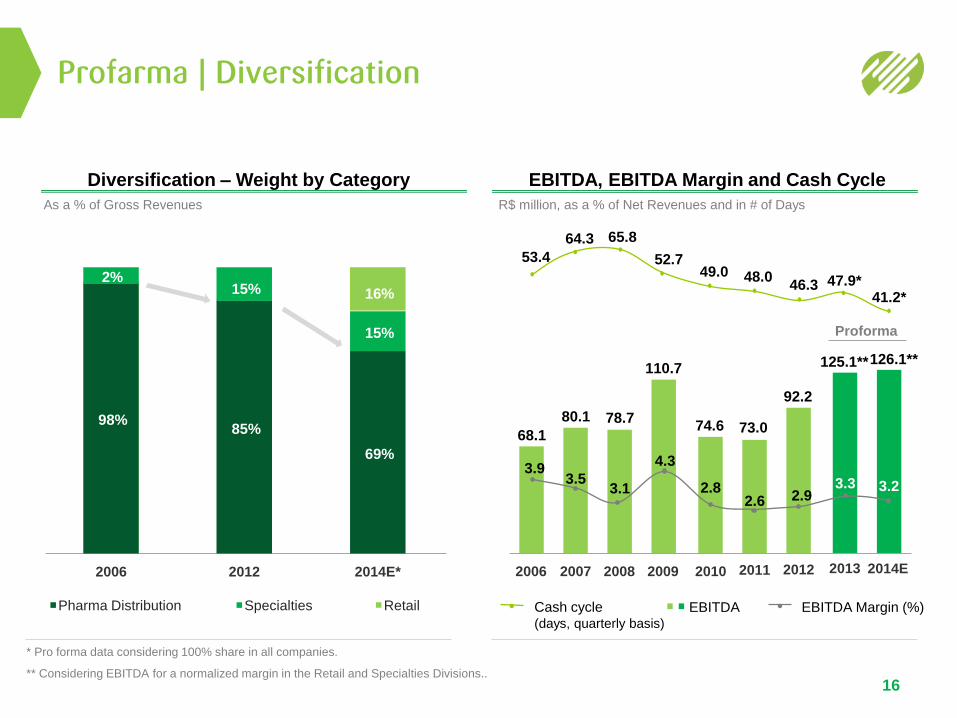
Profarma | Diversification
Diversification – Weight by Category EBITDA, EBITDA Margin and Cash Cycle
As a % of Gross Revenues R$ million, as a % of Net Revenues and in # of Days
EBITDA EBITDA Margin (%) Cash cycle (days, quarterly basis)
Pharma Distribution Specialties Retail
2006 2012
98%
2%
85%
15%
69%
15%
16%
2014E* 2006 2007 2008 2009 2010 2011 2012 2013
52.7
64.3
53.4
65.8
49.0 48.0 47.9*
4.3
3.5 3.9
3.1 2.8 2.6 2.9
3.3
46.3
2014E
41.2*
3.2
Proforma
* Pro forma data considering 100% share in all companies.
** Considering EBITDA for a normalized margin in the Retail and Specialties Divisions.. 16

PHARMACEUTICAL DISTRIBUTION
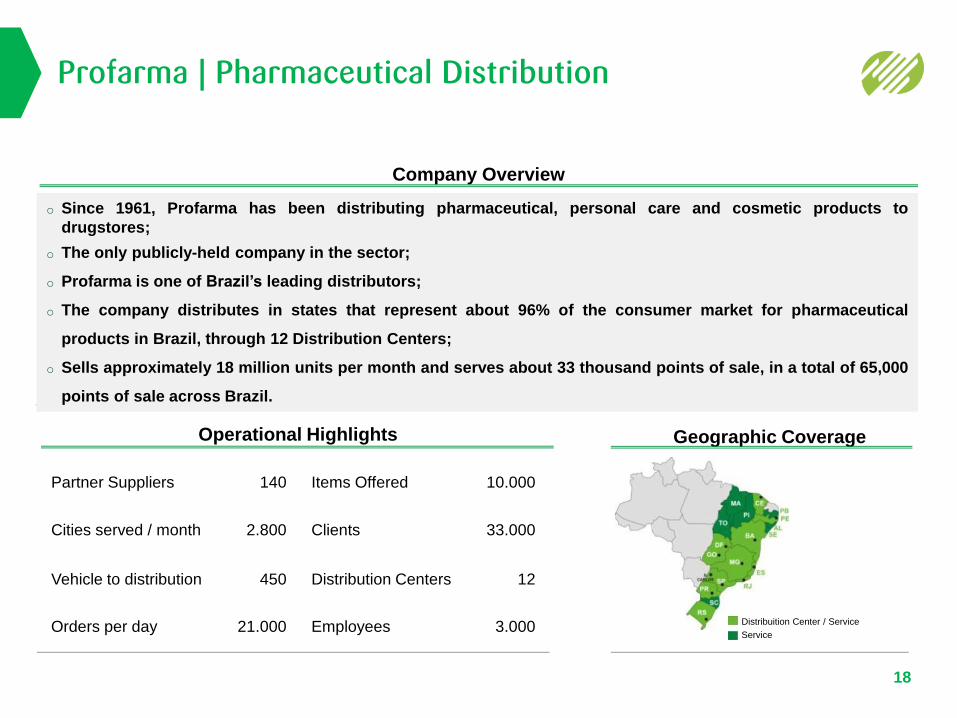
Profarma | Pharmaceutical Distribution
18
Orders per day 21.000
Items Offered 10.000
Clients 33.000
Employees 3.000
Distribution Centers 12
Partner Suppliers 140
Cities served / month 2.800
Vehicle to distribution 450
Company Overview
Operational Highlights Geographic Coverage
Distribuition Center / Service
Service
o Since 1961, Profarma has been distributing pharmaceutical, personal care and cosmetic products to
drugstores;
o The only publicly-held company in the sector;
o Profarma is one of Brazil’s leading distributors;
o The company distributes in states that represent about 96% of the consumer market for pharmaceutical
products in Brazil, through 12 Distribution Centers;
o Sells approximately 18 million units per month and serves about 33 thousand points of sale, in a total of 65,000
points of sale across Brazil.

SPECIALTIES
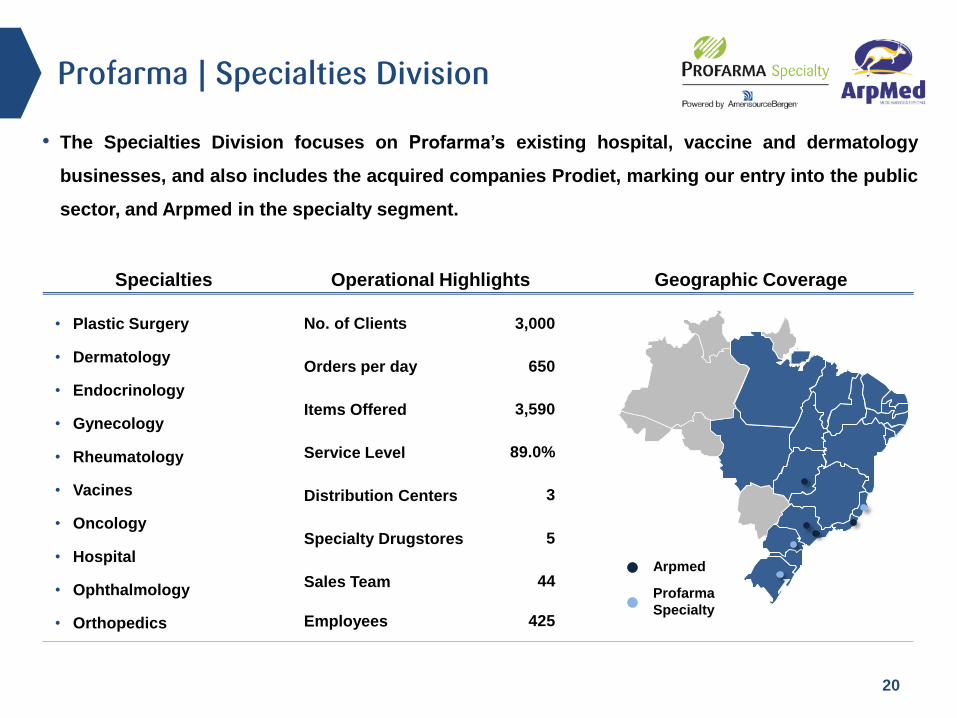
• The Specialties Division focuses on Profarma’s existing hospital, vaccine and dermatology
businesses, and also includes the acquired companies Prodiet, marking our entry into the public
sector, and Arpmed in the specialty segment.
20
Profarma | Specialties Division
Cobertura Geográfica
• Plastic Surgery
• Dermatology
• Endocrinology
• Gynecology
• Rheumatology
• Vacines
• Oncology
• Hospital
• Ophthalmology
• Orthopedics
Specialties Geographic Coverage Operational Highlights
Arpmed
Profarma
Specialty
Orders per day 650
Specialty Drugstores 5
Distribution Centers 3
No. of Clients 3,000
Items Offered 3,590
Sales Team 44
Employees 425
Service Level 89.0%
21
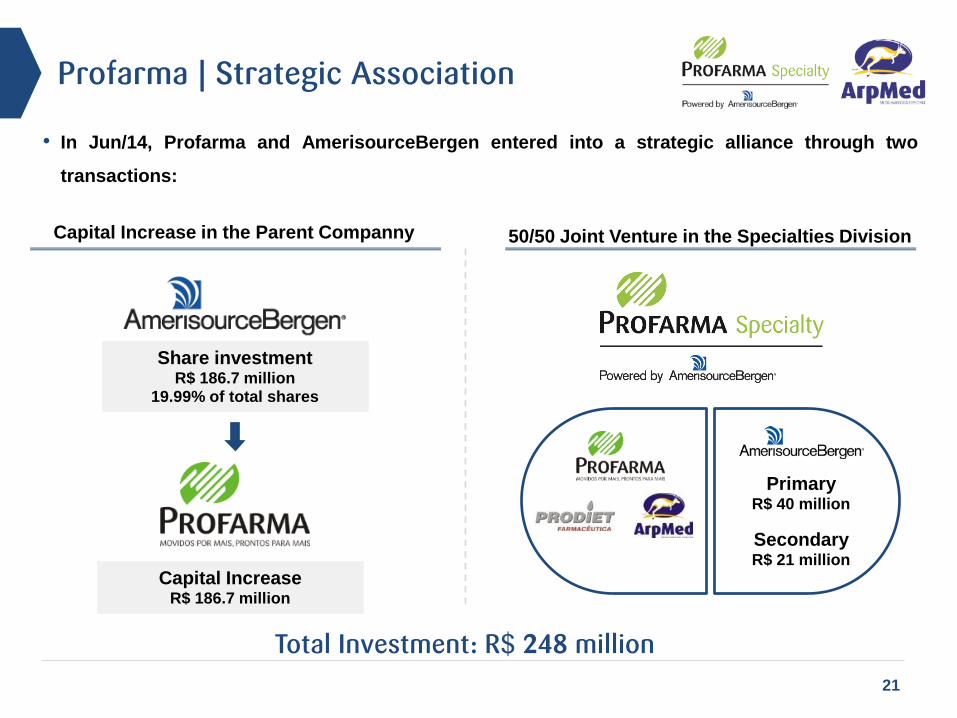
Profarma | Strategic Association
50/50 Joint Venture in the Specialties Division Capital Increase in the Parent Companny
Total Investment: R$ 248 million
Share investment R$ 186.7 million
19.99% of total shares
Primary R$ 40 million
Secondary R$ 21 million
Capital Increase R$ 186.7 million
• In Jun/14, Profarma and AmerisourceBergen entered into a strategic alliance through two
transactions:
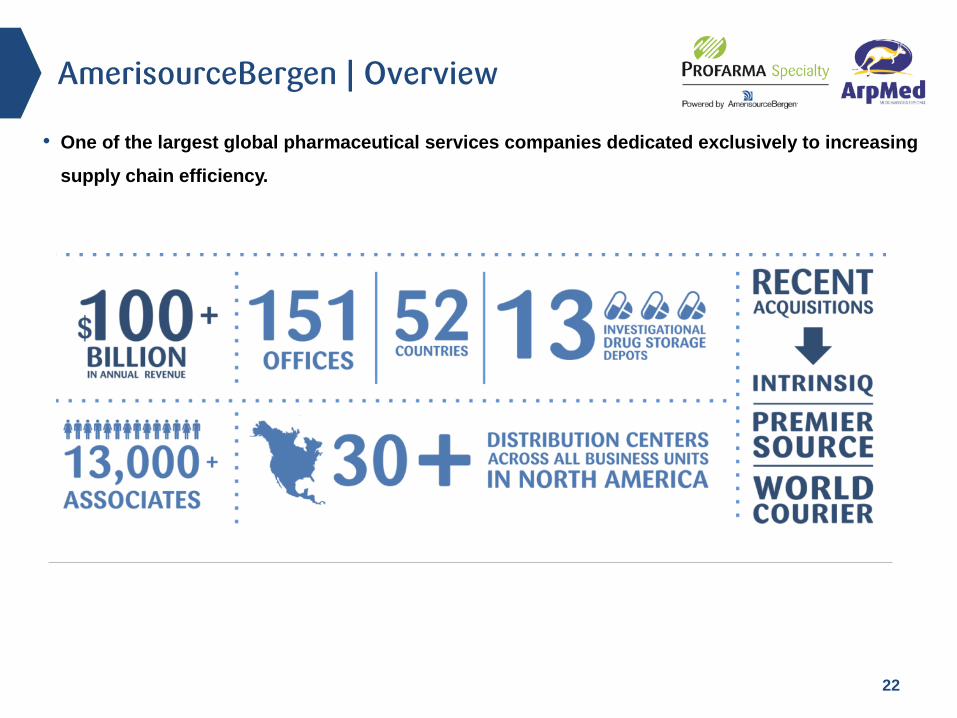
• One of the largest global pharmaceutical services companies dedicated exclusively to increasing
supply chain efficiency.
22
AmerisourceBergen | Overview
23
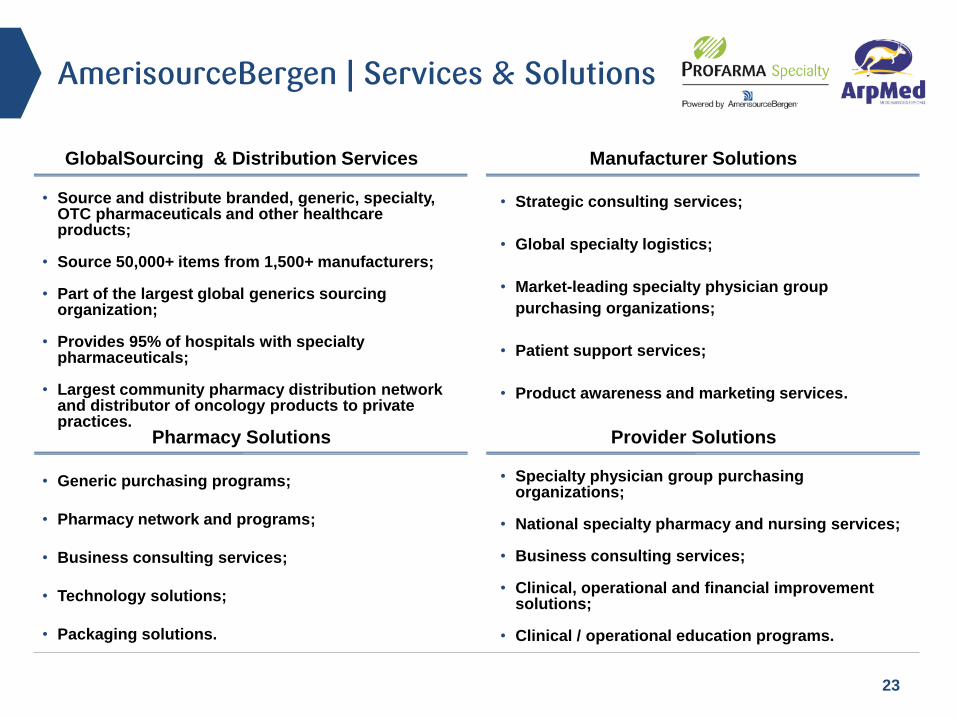
GlobalSourcing & Distribution Services Manufacturer Solutions
Provider Solutions Pharmacy Solutions
• Generic purchasing programs;
• Pharmacy network and programs;
• Business consulting services;
• Technology solutions;
• Packaging solutions.
• Source and distribute branded, generic, specialty, OTC pharmaceuticals and other healthcare products;
• Source 50,000+ items from 1,500+ manufacturers;
• Part of the largest global generics sourcing organization;
• Provides 95% of hospitals with specialty pharmaceuticals;
• Largest community pharmacy distribution network and distributor of oncology products to private practices.
• Specialty physician group purchasing organizations;
• National specialty pharmacy and nursing services;
• Business consulting services;
• Clinical, operational and financial improvement solutions;
• Clinical / operational education programs.
• Strategic consulting services;
• Global specialty logistics;
• Market-leading specialty physician group
purchasing organizations;
• Patient support services;
• Product awareness and marketing services.
AmerisourceBergen | Services & Solutions
RETAIL
25
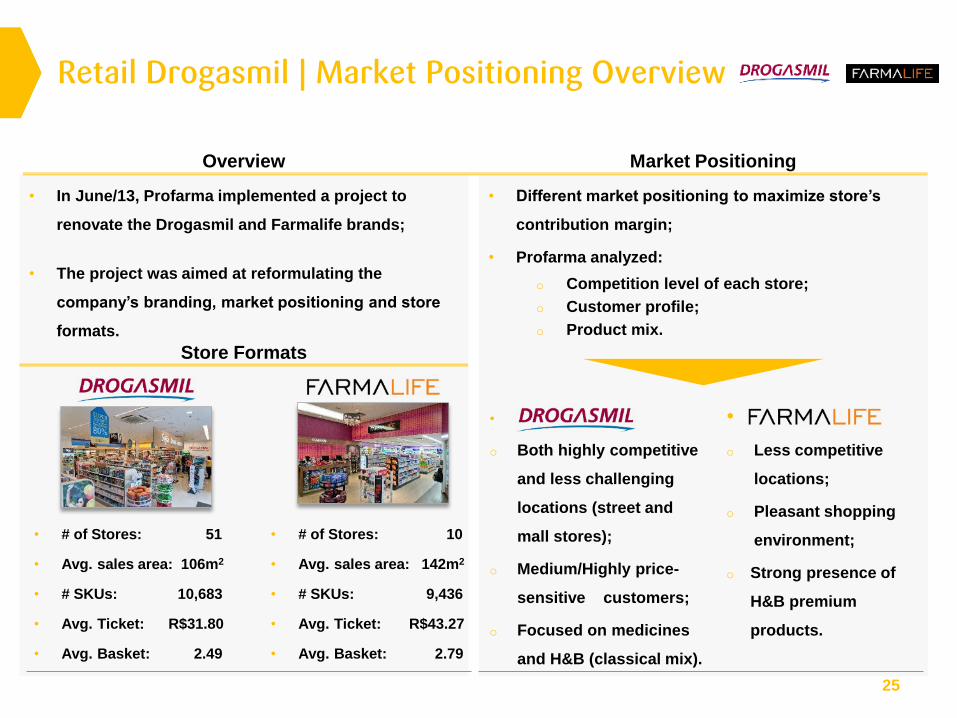
Overview Market Positioning
• Different market positioning to maximize store’s
contribution margin;
• Profarma analyzed:
o Competition level of each store;
o Customer profile;
o Product mix.
•
o Both highly competitive
and less challenging
locations (street and
mall stores);
o Medium/Highly price-
sensitive customers;
o Focused on medicines
and H&B (classical mix).
•
o Less competitive
locations;
o Pleasant shopping
environment;
o Strong presence of
H&B premium
products.
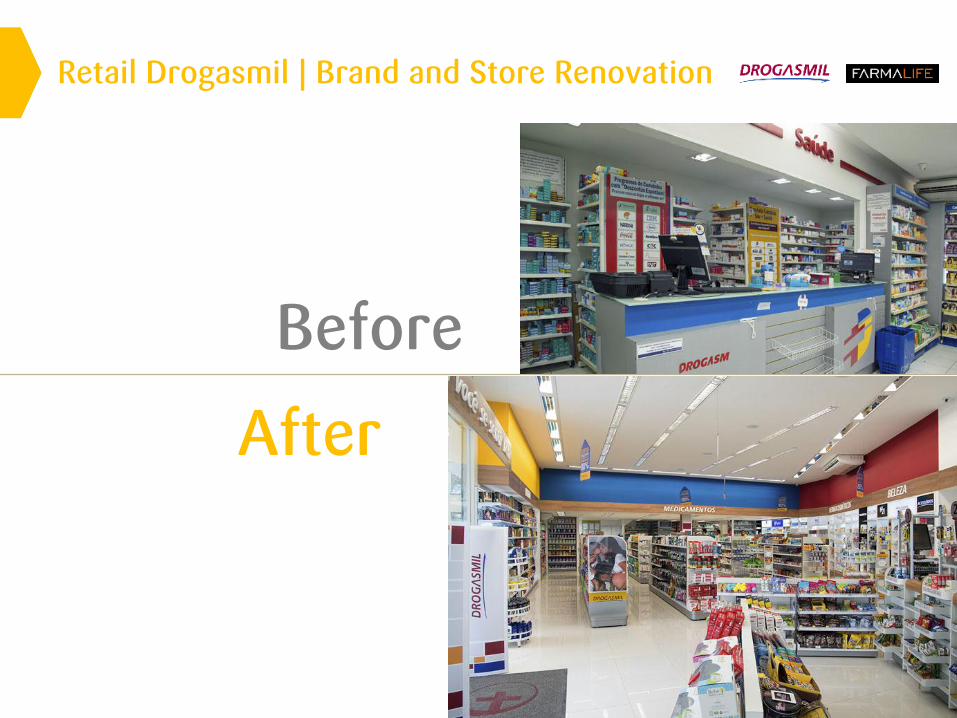
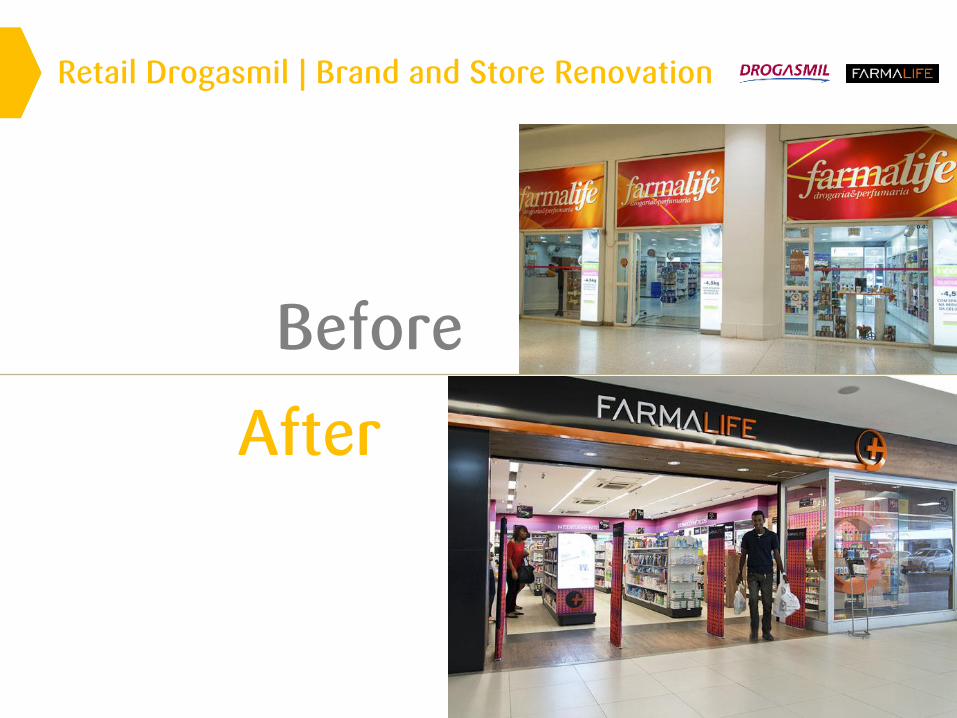
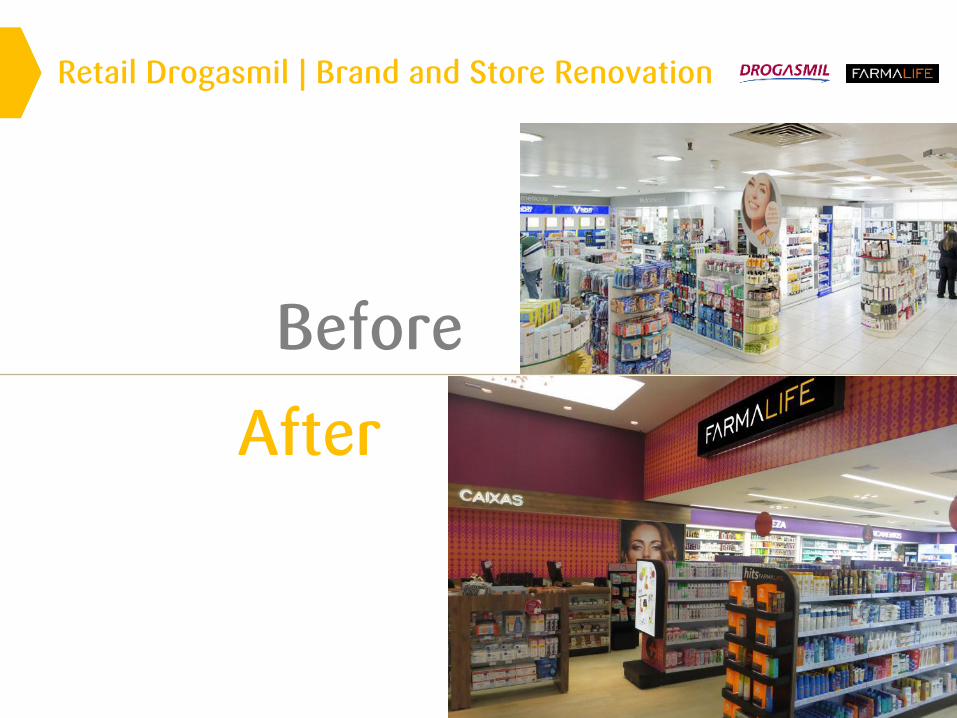
• In June/13, Profarma implemented a project to
renovate the Drogasmil and Farmalife brands;
• The project was aimed at reformulating the
company’s branding, market positioning and store
formats.
Store Formats
• # of Stores: 51
• Avg. sales area: 106m2
• # SKUs: 10,683
• Avg. Ticket: R$31.80
• Avg. Basket: 2.49
• # of Stores: 10
• Avg. sales area: 142m2
• # SKUs: 9,436
• Avg. Ticket: R$43.27
• Avg. Basket: 2.79
Retail Drogasmil | Market Positioning Overview
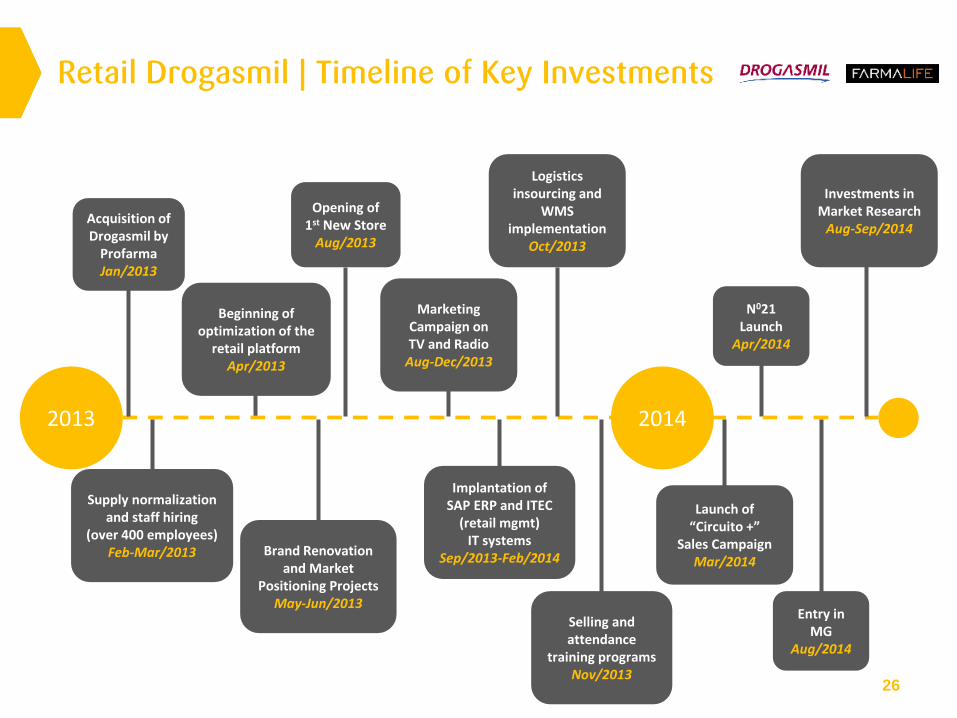
26
2013 2014
Acquisition of Drogasmil by
Profarma Jan/2013
Supply normalization and staff hiring
(over 400 employees) Feb-Mar/2013
Beginning of optimization of the
retail platform Apr/2013
Brand Renovation and Market
Positioning Projects May-Jun/2013
Marketing Campaign on TV and Radio
Aug-Dec/2013
Implantation of SAP ERP and ITEC
(retail mgmt) IT systems
Sep/2013-Feb/2014
Logistics insourcing and
WMS implementation
Oct/2013
Selling and attendance
training programs Nov/2013
Launch of “Circuito +”
Sales Campaign Mar/2014
N021 Launch
Apr/2014
Entry in MG
Aug/2014
Investments in Market Research
Aug-Sep/2014
Opening of 1st New Store
Aug/2013
Retail Drogasmil | Timeline of Key Investments
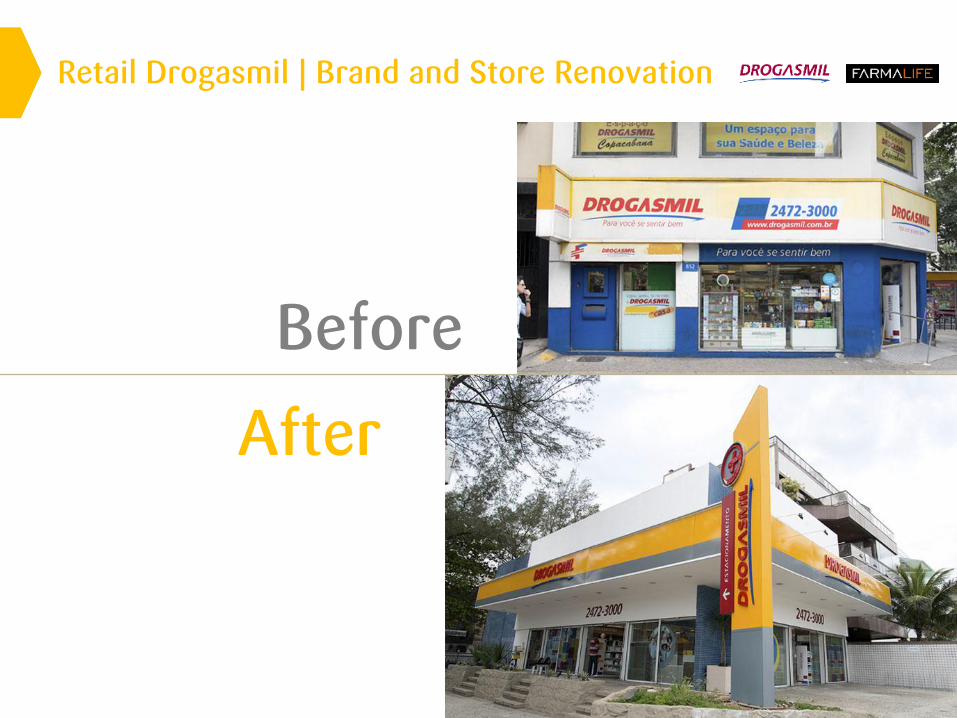
Retail Drogasmil | Brand and Store Renovation
Before
After
Retail Drogasmil | Brand and Store Renovation
Before
After
Retail Drogasmil | Brand and Store Renovation
Before
After
Retail Drogasmil | Brand and Store Renovation
Before
After
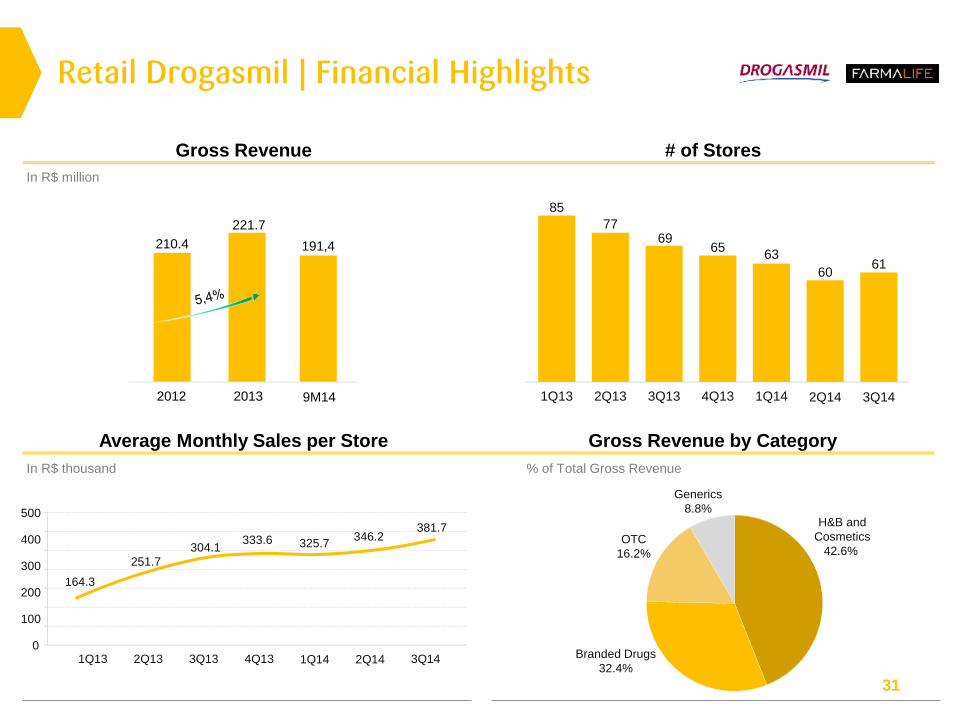
31
In R$ million
% of Total Gross Revenue In R$ thousand
63 61
1Q13 2Q13 3Q13 4Q13 1Q14
164.3
381.7
1Q13 2Q13 3Q13 4Q13 3Q14 0
100
200
300
400
500 H&B and
Cosmetics
42.6%
Branded Drugs
32.4%
OTC
16.2%
Generics
8.8%
Retail Drogasmil | Financial Highlights
# of Stores Gross Revenue
Gross Revenue by Category Average Monthly Sales per Store
60
69 77
65
85
2Q14 3Q14
1Q14 2Q14
251.7
304.1 333.6 325.7
346.2
210.4
221.7
2012 2013
191,4
9M14
32
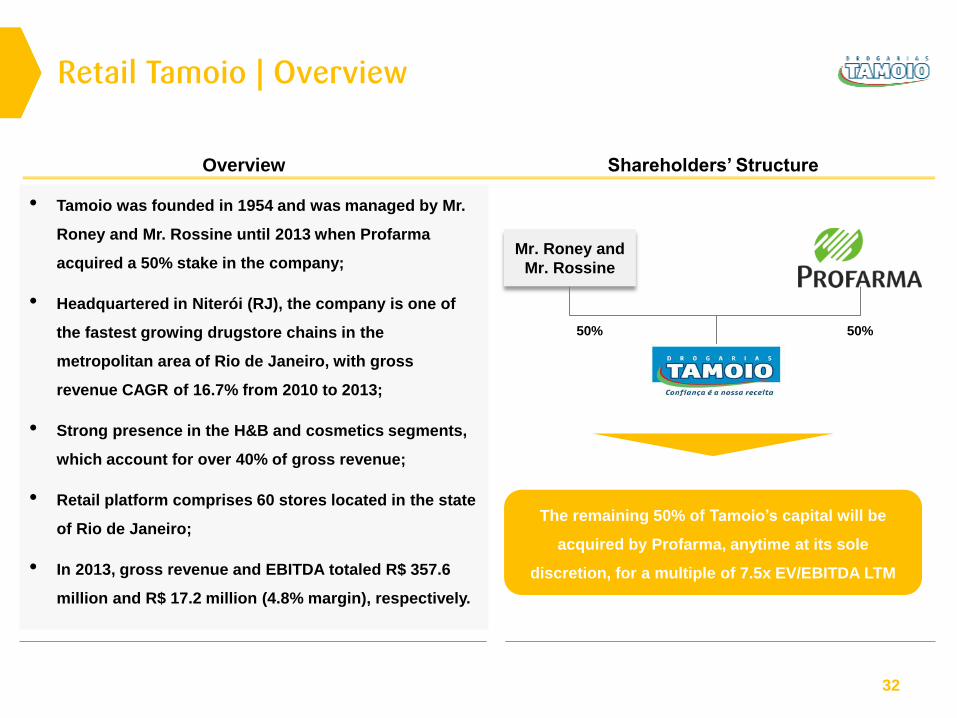
• Tamoio was founded in 1954 and was managed by Mr.
Roney and Mr. Rossine until 2013 when Profarma
acquired a 50% stake in the company;
• Headquartered in Niterói (RJ), the company is one of
the fastest growing drugstore chains in the
metropolitan area of Rio de Janeiro, with gross
revenue CAGR of 16.7% from 2010 to 2013;
• Strong presence in the H&B and cosmetics segments,
which account for over 40% of gross revenue;
• Retail platform comprises 60 stores located in the state
of Rio de Janeiro;
• In 2013, gross revenue and EBITDA totaled R$ 357.6
million and R$ 17.2 million (4.8% margin), respectively.
Mr. Roney and
Mr. Rossine
50% 50%
The remaining 50% of Tamoio’s capital will be
acquired by Profarma, anytime at its sole
discretion, for a multiple of 7.5x EV/EBITDA LTM
Retail Tamoio | Overview
Overview Shareholders’ Structure
33
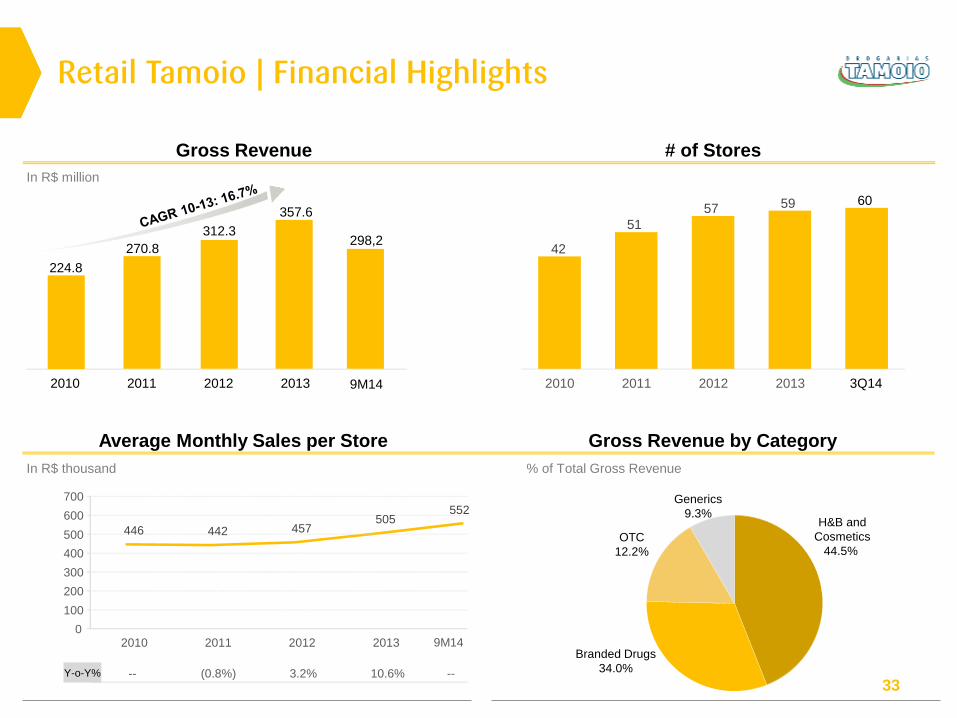
In R$ million
% of Total Gross Revenue In R$ thousand
42
51
57 59 60
2010 2011 2012 2013 3Q14
H&B and
Cosmetics
44.5%
Branded Drugs
34.0%
OTC
12.2%
Generics
9.3%
Retail Tamoio | Financial Highlights
# of Stores Gross Revenue
Gross Revenue by Category Average Monthly Sales per Store
Y-o-Y% -- (0.8%) 3.2% 10.6%
446 442 457 505
2010 2011 2012 2013 0
100
200
300
400
500
600
700
9M14
552
224.8
270.8
312.3
357.6
2010 2011 2012 2013
298,2
9M14
--
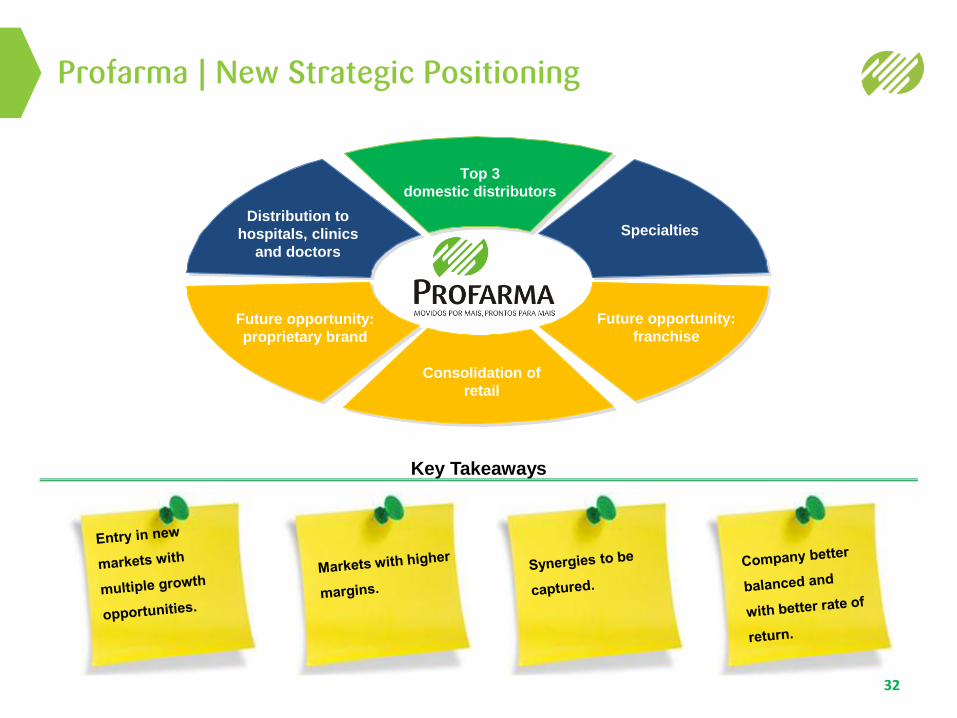
Distribution to
hospitals, clinics
and doctors
Future opportunity:
franchise Future opportunity:
proprietary brand
Top 3
domestic distributors
Specialties
Consolidation of
retail
Profarma | New Strategic Positioning
32
Key Takeaways

CONSOLIDATED PERFORMANCE
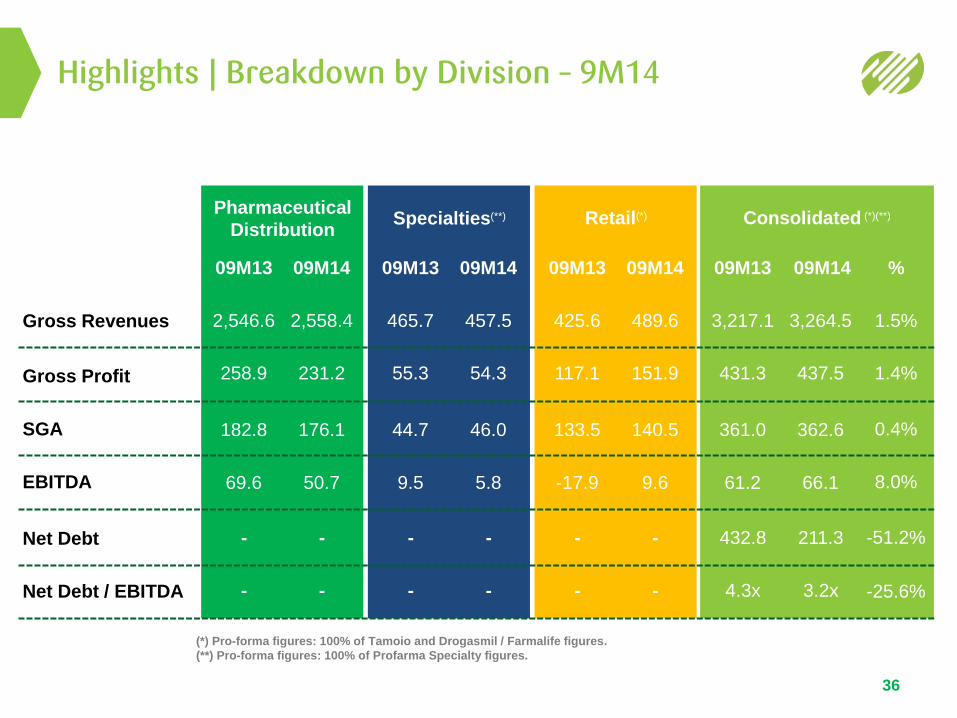
Specialties(**)
09M13 09M14
465.7
55.3
44.7
9.5
457.5
54.3
46.0
5.8
-
-
-
-
Retail(*)
09M13 09M14
425.6
117.1
133.5
-17.9
489.6
151.9
140.5
9.6
-
-
-
-
Consolidated (*)(**)
09M13 09M14
3,217.1
431.3
361.0
61.2
3,264.5
437.5
362.6
66.1
432.8
4.3x
211.3
3.2x
%
1.5%
1.4%
0.4%
8.0%
-51.2%
-25.6%
Pharmaceutical
Distribution
09M13 09M14
2,546.6
258.9
182.8
69.6
2,558.4
231.2
176.1
50.7
-
-
-
-
Highlights | Breakdown by Division – 9M14
36
Gross Revenues
Gross Profit
SGA
EBITDA
(*) Pro-forma figures: 100% of Tamoio and Drogasmil / Farmalife figures.
(**) Pro-forma figures: 100% of Profarma Specialty figures.
Net Debt
Net Debt / EBITDA
ANALYST COVERAGE
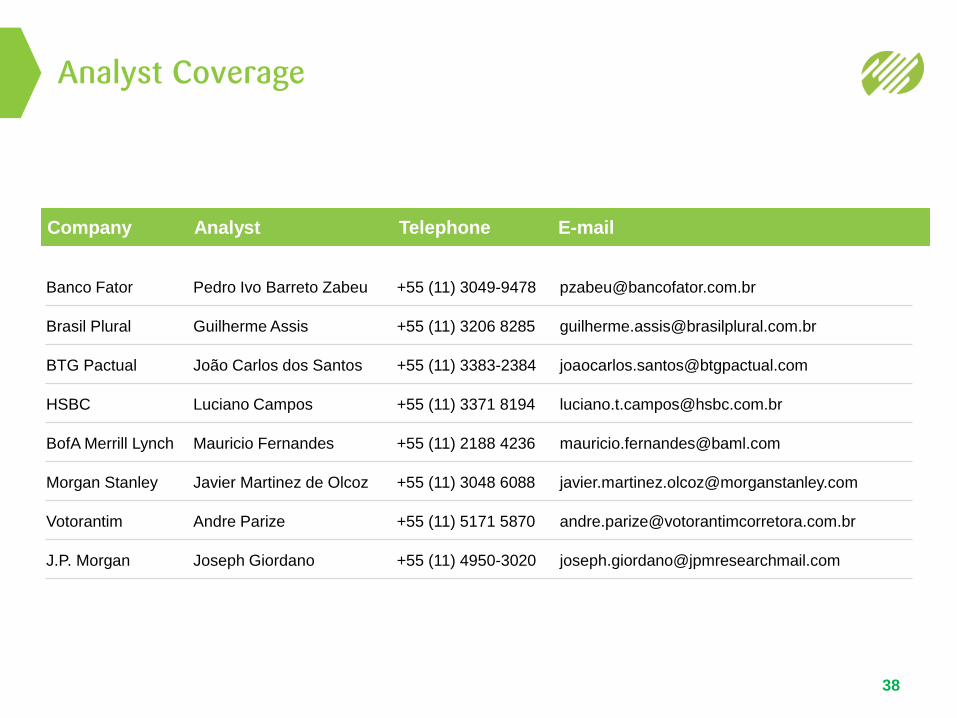
Analyst Coverage
38
Company Analyst Telephone E-mail
Banco Fator Pedro Ivo Barreto Zabeu +55 (11) 3049-9478 [email protected]
Brasil Plural Guilherme Assis +55 (11) 3206 8285 [email protected]
BTG Pactual João Carlos dos Santos +55 (11) 3383-2384 [email protected]
HSBC Luciano Campos +55 (11) 3371 8194 [email protected]
BofA Merrill Lynch Mauricio Fernandes +55 (11) 2188 4236 [email protected]
Morgan Stanley Javier Martinez de Olcoz +55 (11) 3048 6088 [email protected]
Votorantim Andre Parize +55 (11) 5171 5870 [email protected]
J.P. Morgan Joseph Giordano +55 (11) 4950-3020 [email protected]
Max Fischer - CFO & IRO | Beatriz Diez – IR Manager
www.profarma.com.br/ir | Tel.: 55 (21) 4009-0276 | E-mail: [email protected]