prof. tamás lajos budapest university of technology · pdf filebasics of vehicle...
TRANSCRIPT

Basics of vehicle aerodynamics
Prof. Tamás LajosBudapest University of Technology and Economics
Department of Fluid Mechanics
University of Rome „La Sapienza” 2002

Influence of flow characteristics on the operation of vehicles
Objectives of improvement of flow past vehicle bodies: • reduction of fuel consumption• more favourable comfort characteristics (mud
deposition on body, noise, ventilating and cooling of passenger compartment)
• improvement of driving characteristics (stability, handling, traffic safety)
Vehicle aerodynamics includes three interacting flow fields: • flow past vehicle body • flow past vehicle components (wheels, heat exchanger,
brakes, windshield), • flow in passenger compartment

Approaches in vehicle aerodynamics 1
1900-1920 Adaptation of shapes from other fields
Airship
Torpedo
Boot

Approaches in vehicle aerodynamics 21920-1970 Adaptation of results of airplane and
airship development: streamlining
Járay experimental cars

Approaches in vehicle aerodynamics 3
1970-1990 Detail optimisation

Approaches in vehicle aerodynamics 4
1990 - Basic form optimisation

Change of drag coefficient of cars
Av2
Fc2
DD ρ=
D3
ae Acv2
P ρ=
Drag coefficient

Characteristics of flow past vehicle bodies
• Front: stagnation point, overpressure, accelerating flow• Side walls, roof: boundary layer separation depending
on the rounding up of leading edges around the front. • Rear wall: in separation bubble nearly constant pressure
below the ambient, strong turbulent mixing• Underbody gap: surrounded by „rough” and moving
surfaces, decreasing velocities downstream, sideward outflow
Complex 3D turbulent flow in relative co-ordinate system. Classification of flow field: Flow past • front, • side walls and roof, • in underbody gap,• behind the rear wall (wake).

Relation between curvature of streamlines and pressure distribution
Rv
np 2
ρ=∂∂ where
n co-ordinate normal to streamlineR radius of streamline curvature
If the streamlines are curved pressure increasesperpendicular to them, outwards from the centre of curvature

Aerodynamic forces and viscosityIn case of inviscid flow τ=0 (no shearstresses exist) and the resultantof pressure forces is 0. (In case of cylinder symmetrical flow field.)So Faer = 0
∫ =−A
0Adp
In case of viscous flow τ ≠ 0 (shear stresses exist) and (the resultant of pressure forces is different from 0). In case of cylinder non-symmetrical flow field.So Faer ≠ 0
∫ ≠−A
0Adp

Cause of drag forces at streamlined and bluff bodies
Streamlined bodies are characterized by attached flow. The share of pressure forces in drag force (component of aerodynamic force parallel to undisturbed flow) is small. Drag is caused mainly by shear stresses. Since shear forces are small cD is relatively small.
Bluff bodies are characterized by boundary layer separation and separation bubbles. Drag is caused mainly by pressure forces, sincep-p0>> τ cD is relatively big.

Boundary layer (BL) separation
On solid surface BLdevelops
Adverse pressure gradientcauses BL separation
Adverse pressure gradient over the plate
BL at accelerating and decelerating flow
Separation bubble is confined by shear layer
BL separation causes asymmetry in flow field

Where to expect BL separation
Between points a) 7-16 behind the leading edge, b) over the bonnet, in front of the
windscreenc) 21-25 after the upper horizontal
leading edge over the windscreend) 1-35 behind the upper horizontal
trailing edge, over the rear window
Ad a)
Ad b), d)
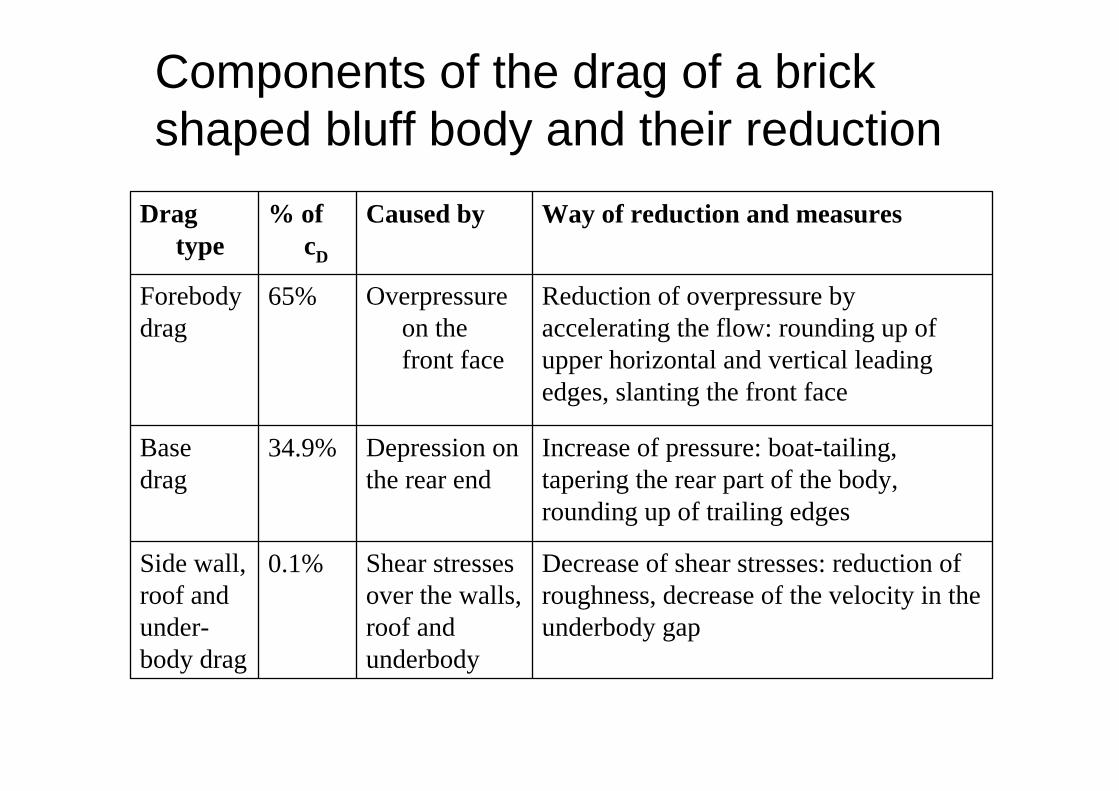
Components of the drag of a brick shaped bluff body and their reduction
Decrease of shear stresses: reduction of roughness, decrease of the velocity in the underbody gap
Shear stresses over the walls, roof andunderbody
0.1%Side wall, roof andunder-body drag
Increase of pressure: boat-tailing, tapering the rear part of the body, rounding up of trailing edges
Depression onthe rear end
34.9%Base drag
Reduction of overpressure by accelerating the flow: rounding up of upper horizontal and vertical leading edges, slanting the front face
Overpressure on the front face
65%Forebodydrag
Way of reduction and measuresCaused by% of cD
Drag type

Reduction of forebody drag (decrease of overpressure on the front) 1
Boundary layer separation is a good indicator of high drag
Rounding up of upper horizontal leading edge
Rounding up of vertical leading edges

Reduction of forebody drag (decrease of overpressure on the front) 2
Conclusions:a) The most significant drag reduction can be achieved by
rounding up the vertical and upper horizontal leading edges on the front face.
b) Relatively small amendments can result considerable drag reduction.
c) The drag reduction of front spoiler is large if its use is combined with rounded leading edges.
Use of front spoilerChanging the shape of the front end

Reduction of base drag (increase of pressure on the rear end) 1
Curvature of streamlines indicates depression Tapering the rear end (boat tailing) results in
considerable drag reduction
Practical realizations of tapering
Rear spoiler increasesthe pressure on the rear end decreasing drag and lift

Reduction of base drag (increase of pressure on the rear end) 2
Longitudinal vortices can develop over slanted trailing edges, causing increase of drag and lift
Conclusions:a) Tapering of rear part results is reduction of the size of rear separation bubble and increase of pressureb) Rear spoiler and increase of boot height reduces dragand lift simultaneouslyc) Slanted trailing edges can cause longitudinal vortices increasing the drag and lift

Reduction of side wall, roof and underbody drag (decrease of shear stresses)
Conclusionsa) Roof and side wall drag can be reduced by reduction of roughness of the wall (no protruding parts, frames)b) Underbody drag can be reduced by reducing the roughness (covering) and reducing the velocity in underbody gap (tight underbody gap, front spoiler )

Effect of add-on devices and limits of aerodynamic drag reduction

Example: wind tunnel investigations aiming at reduction of aerodynamic drag of buses
Wind tunnel: recirculating, 2.6 m x 5 m open test section, vmax= 50 m/s wind velocity, 6 component overhead balance, when necessary, ground simulation with moving belt, flow visualisation with oil smoke. Bus model: 1:5 scale bus models with rotating wheels, detailed underbody and interchangeable parts.

Result of the systematic wind tunnel tests
Decrease of drag coefficient cD=0.57⇒ 0.39 (-32%) resultingin about 20% reduction of fuel consumption at 100km/h speed (+ less noise and mud deposition).
-(5-8)%The front spoiler decreases the height of underbody gap by 38%
-4%Covering of underbody before the front wheels
±0Rounding up of lower horizontal leading edge and trailing edges
-8%Increase of front face slant from 80 to 110
-38%Rounding up of upper horizontal and vertical leading edges (around the front end) (r/h = 0.04 ⇒ 0.11)
∆ce/cex100%Change of bus body geometry

Increase of driving stability 1 reducing aerodynamic lift
Airfoils, side box provided with wing increase the negative lift: acp= v2/R = 2-3
Effect of the gap size on the lift

Increase of driving stability 2reducing aerodynamic lift
Conclusionsa) Aerodynamic lift is particularly important at high
performance and racing cars where the negative lift increases the speed in curves
b) Lift can be reduced by spoilers under the front bumper and at the upper horizontal trailing edge
c) At racing cars airfoils and underbody devices increase the negative lift

Increase of driving stability 3 influencing yawing moment
Conclusionsa) Yawing moment is caused mainly
by the depression on the leeward rounded leading edge
b) Yawing moment can be reduced by generating BL separation or
c) By using fin at the rear part of the car
cN
cD

Numerical simulation of the flow past vehicle bodies 1
Nyomaseloszlas a buszhomlokfal a szimmetriasíkjában
-5
-4
-3
-2
-1
0
1
2
-0.15 0.05 0.25 0.45 0.65
Ívkoordináták
Cp
Mért értékek
Buszhomlokfal1
Nyomáseloszlás a hátfal szimmetriasíkjában
-1.2
-1
-0.8
-0.6
-0.4
-0.2
0
0.2
0 0.1 0.2 0.3 0.4 0.5 0.6
ív koordináták
Cp buszhatfal1
Mért értékek
FLUENT is an universal, finite volume simulation code for calculation of 3D steady and unsteady, laminar or turbulent, one or two phase flow with or without heat transfer and chemical reactions. Bus surface (half) and cells in
simulation domain
Measured and calculatedpressure distributions on the front a) and rear b) wall.
a) b)

Experimental investigations of muddeposition on bus body
Reduction of mud deposition an side walls and rear wall by using wind tunnel experiments
• simulation of moving ground with moving belt• rotating wheels, detailed underbody • Measurement of mud deposition
- with water of increased conductivity, introduced over the moving belt: measurement of conductivity
- measurement of concentration of tracer gas- flow visualisation using oil smoke
ConclusionsSmall changes in rear wallgeometry reduces mud deposition on rear wall by 73%. The area of side walls covered by mud can be reduced considerablyby reducing the deceleration ofunderbody flow.

Numerical simulation of mud deposition on rear wall of buses
Unfavourable flow conditions ⇒ extensive mud deposition on rear wall

Numerical simulation of mud deposition on rear wall of buses
Favourable flow conditions ⇒ limited mud deposition on rear wall
Flow visualisation Numerical simulation

Numerical simulation of flow past isolatedwheel
-1.5
-1
-0.5
0
0.5
1
1.5
0 30 60 90 120 150 180 210 240 270 300 330 360
ϕ [°]
Cp [-
]
FackrellCFD k-omegaCFD k-epsilon
stationary
rotating
Comparison of measurement and numerical simulation
ConclusionBeside wind tunnel investigations numerical simulation is cost-effective and more and more reliable tool for analysing and optimising the flow past vehicle bodies.
ConclusionOptimisation of vehicle bodies results in• considerable reduction of fuel consumption• improvement of comfort characteristics and • more favourable driving characteristics of
ground vehicles. In optimisation besides wind tunnel
investigations numerical simulation of flow field has become more and more important.