productivitynet business plan overview 2002
TRANSCRIPT

Controlling the engines of business…
Business Plan OverviewJune 13th, 2002
™
Page 2
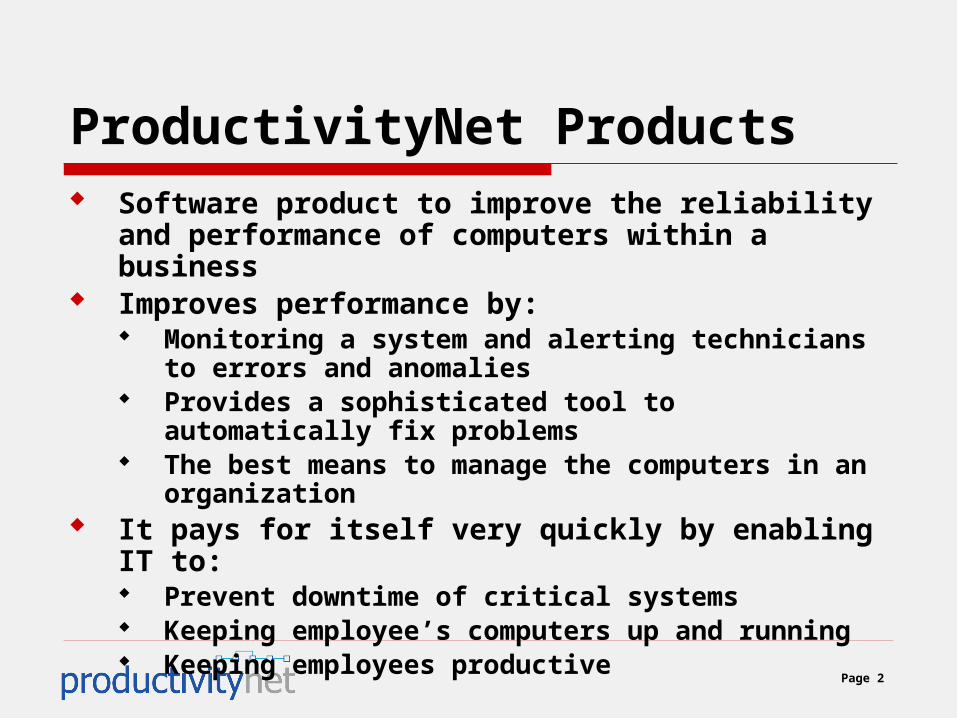
ProductivityNet Products Software product to improve the reliability
and performance of computers within a business
Improves performance by: Monitoring a system and alerting technicians to
errors and anomalies Provides a sophisticated tool to automatically
fix problems The best means to manage the computers in an
organization It pays for itself very quickly by enabling IT
to: Prevent downtime of critical systems Keeping employee’s computers up and running Keeping employees productive

Page 3
Downtime costs 500 Person firm in North Greenbush Mail Server goes down
200 employees stop work and call the help desk 200 x $50 per hr. x 10 mins. X 12 time a year = $20,000 Cost of ProductivityNet Software for Mail Server =
$2750 Payback 1.65 months= $20,000/ $2,750
Other Situations: Web server goes down Voice Mail system Sales force system Other systems issues through out the organization
We have become highly dependent on systems to run the business
Need to provide IT with critical tools to maintain systems

Page 4
Management Team John C. Cavalier – Chairman
Chairman MapInfo, 40 Yrs Senior Management in IT
Vincent J. Pasceri – Founder & CEO Founder, won numerous business awards, First
company to be funded while a student at RPI Steven I. Talbot – Chief Marketing Officer
20 years experience in software and marketing, Corp Strategy & Development MapInfo.
P. Michael McCutcheon – Chief Technology Officer Founder, Chief Architect, Product Developer,
Graduate of RPI

Page 5
ProductivityNet Business
SystemControl-Web &
Wireless
ProcessControl
ProcessControl
ApplicationSystems
ApplicationSystems
NetworkSystems
NetworkSystems
NetworkAdmin.
SystemAdmin.
SystemAdmin.
ProcessMgr.
RemoteSys. Mgmt.
RemoteSys. Mgmt.
MSP,xSP, etc.
Oper. Sys.Expertise
NOSExpertise
Applic. SpecificExpertise
Process ControlExpertise
Underlying Assumptions:Downtime is costly
Downtime slows/ stops revenueQoS needs to be maximized
OperatingSystems
OperatingSystems
Page 6
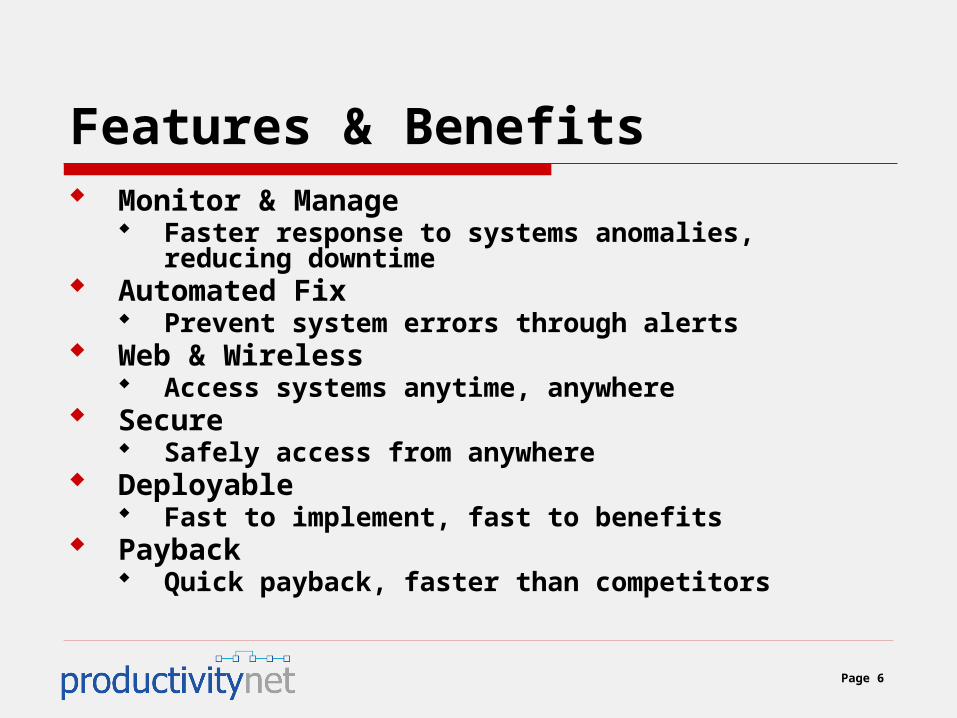
Features & Benefits Monitor & Manage
Faster response to systems anomalies, reducing downtime
Automated Fix Prevent system errors through alerts
Web & Wireless Access systems anytime, anywhere
Secure Safely access from anywhere
Deployable Fast to implement, fast to benefits
Payback Quick payback, faster than competitors
Page 7
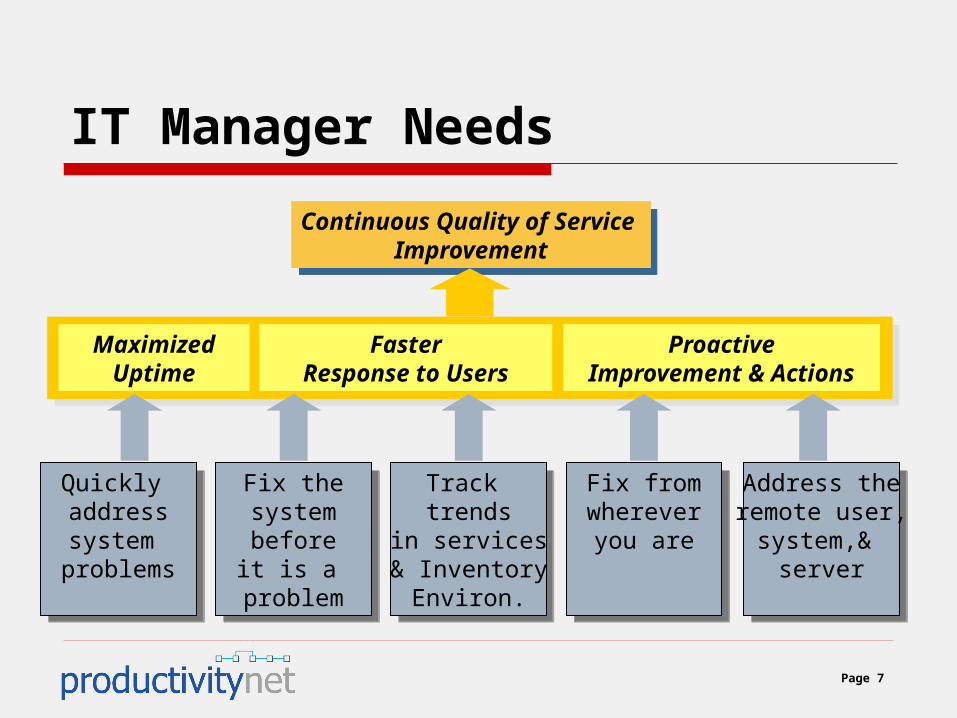
IT Manager Needs
Quickly addresssystem
problems
Fix thesystembeforeit is a
problem
Fix fromwhereveryou are
Address theremote user,
system,& server
Track trends
in services& Inventory
Environ.
Continuous Quality of Service Improvement
Continuous Quality of Service Improvement
MaximizedUptime
FasterResponse to Users
ProactiveImprovement &
Actions

Page 8
Product Family
Clients ActiveManageHost
Agents
Web, Palm& Pocket PC
Windows,Linux, Solaris,
& SNMP
Windows 2000
Futures:• Routers & NOS• Web Server• Mail Server• DB Server• Applications

Page 9
Key Features Alert engine
Rule Based Responses Role-based Administration Reporting & Inventory
Track Trends Inventory software
Web & Wireless Console
Heterogeneous & Distributed System Control
Remote KVM (Keyboard Video Mouse) Secure and Encrypted Fast & Flexible
Deployment & Configuration

Page 10
Competitive Matrix
Factors of Competition Act
iveM
anag
e v2
.0R
emot
e K
VM
Sol
utio
ns
(Sof
twar
e)
Ent
erpr
ise
Man
agem
ent
Sol
utio
ns
Mon
itorin
g A
pplic
atio
nsW
irele
ss A
pplic
atio
nsS
yste
ms
Man
agem
ent
App
licat
ions
Monitor + + Manage + +
Secure Fix +
Access + + + Deploy + +
Value + Overall Score 29 23 21 21 21 19
Key Scale
+ Excellent 5
Meets Needs 3
Minimal 1

Page 11
Competitive Landscape
Upstart/ PointProducts
FocusedProducts
LegacyComplete
Expert Players(Delivering Key Value)
Functionality
Valu
e
CAHP
BMC
Opalis
Sonic Mobility
MOM
LanDesk
ProductivityNet
PCAnywhere

Page 12
Market Validation Jeb Bolding, Product Analyst, EMA
“ActiveManage has the fastest deployment time out of any
systems management product I have tested.” Sue Cooper, Editor, Windows & .Net Magazine
“I almost can't believe how many features you've covered here. Sounds like something that could give the bigger guys, the HP’s, a run for their money.”
Mike Gunderloy, Product Editor, Microsoft Certified Professional Magazine “ActiveManage works well, and has an impressive feature
set ... The result is a management tool that moves smoothly from browser to handheld to automated response system without a hitch.”
Page 13
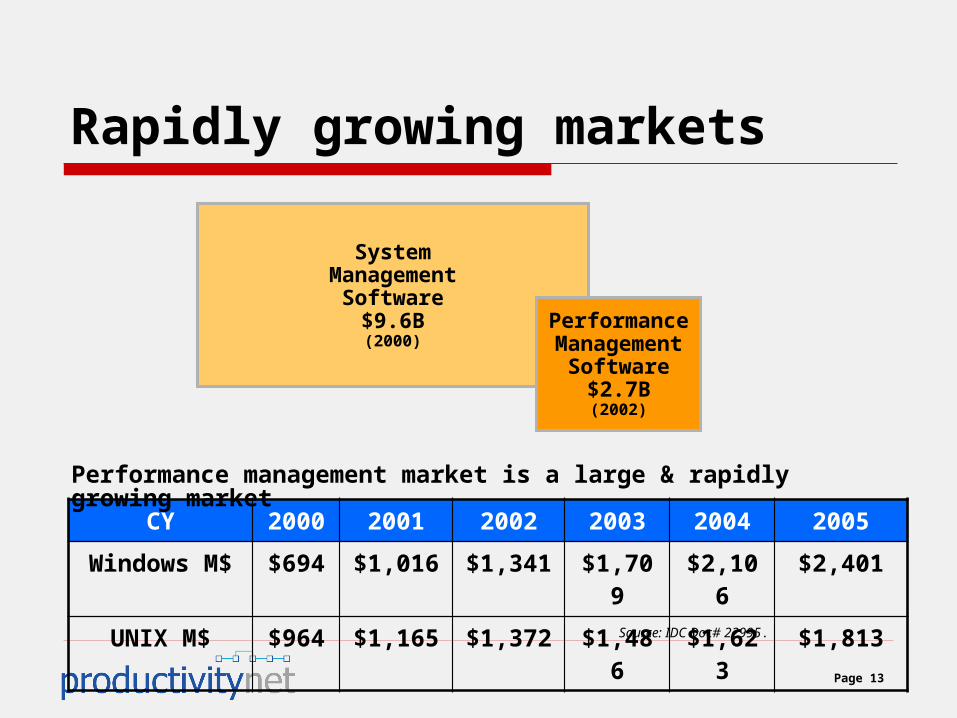
Rapidly growing markets
CY 2000 2001 2002 2003 2004 2005
Windows M$
$694 $1,016 $1,341 $1,709
$2,106
$2,401
UNIX M$ $964 $1,165 $1,372 $1,486
$1,623
$1,813Source: IDC Doc# 22995.
Performance management market is a large & rapidly growing market
SystemManagement
Software$9.6B(2000)
PerformanceManagement
Software$2.7B(2002)

Page 14
Industry Trends Systems have become cheap & powerful
Capabilities are accelerating Prices are under $1,000
System environments have diversified Deployment strategies to max. performance &
availability Proliferation of services – mail, DB, Application
services, etc. System environments are more specialized &
sophisticated Routers have become specialized systems DB Servers, Shared services, ASP
Businesses have become distributed Remote offices to be supported Coop Business Nets
The heterogeneous system environment has reached critical mass Service issues are critical to company revenues and
productivity

Page 15
Barrier to Entry Technology
Component bases agents – for rapid deployment
Wireless and web platform – anytime, anywhere system control
Rules based host engine – Monitor and fix key system issues
Business Model Value – high functionality, relative low cost to
deploy relative to competition Lock-in effect of users – creation of customized
knowledge bases and rules by customers Natural upgrade path – as systems are added
to the network

Page 16
Business Model Strategy Low cost adoption at department level
Avg. Selling Price $5,000 Proof of benefits
Viral Spread to other departments Low cost adoption and ease of deployment Avg. Selling Price $4,000 per Dept.
Natural Upgrade Path As servers and PCs are added to network
Web based sales and upgrades Download of product on web site, license key
controlled Add-ons and upgrades through web based sales
VARs Multi-tiered program based on volume Low barrier to start, incentives to achieve volume
sales
Page 17
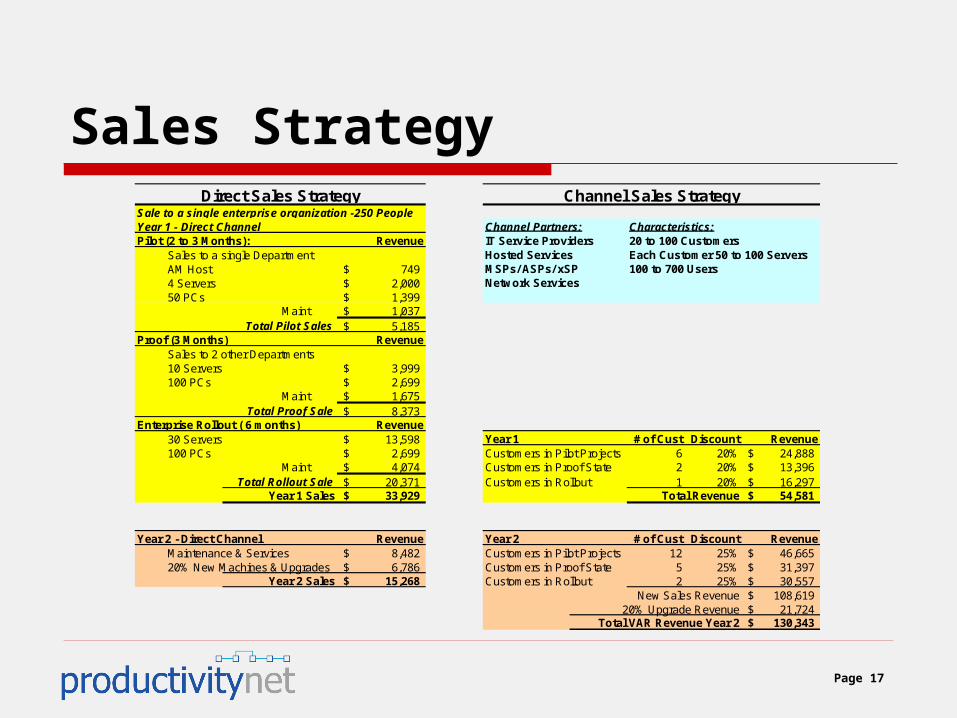
Sales StrategySale to a single enterprise organization -250 PeopleYear 1 - Direct Channel Channel Partners: Characteristics:Pilot (2 to 3 Months): Revenue IT Service Providers 20 to 100 Customers
Sales to a single Department Hosted Services Each Customer 50 to 100 ServersAM Host 749$ MSPs/ ASPs/ xSP 100 to 700 Users4 Servers 2,000$ Network Services50 PCs 1,399$
Maint 1,037$ Total Pilot Sales 5,185$
Proof (3 Months) RevenueSales to 2 other Departments10 Servers 3,999$ 100 PCs 2,699$
Maint 1,675$ Total Proof Sale 8,373$
Enterprise Rollout ( 6 months) Revenue30 Servers 13,598$ Year 1 # of Cust Discount Revenue100 PCs 2,699$ Customers in Pilot Projects 6 20% 24,888$
Maint 4,074$ Customers in Proof State 2 20% 13,396$ Total Rollout Sale 20,371$ Customers in Rollout 1 20% 16,297$
Year 1 Sales 33,929$ Total Revenue 54,581$
Year 2 - Direct Channel Revenue Year 2 # of Cust Discount RevenueMaintenance & Services 8,482$ Customers in Pilot Projects 12 25% 46,665$ 20% New Machines & Upgrades 6,786$ Customers in Proof State 5 25% 31,397$
Year 2 Sales 15,268$ Customers in Rollout 2 25% 30,557$ New Sales Revenue 108,619$
20% Upgrade Revenue 21,724$ Total VAR Revenue Year 2 130,343$
Direct Sales Strategy Channel Sales Strategy
Page 18
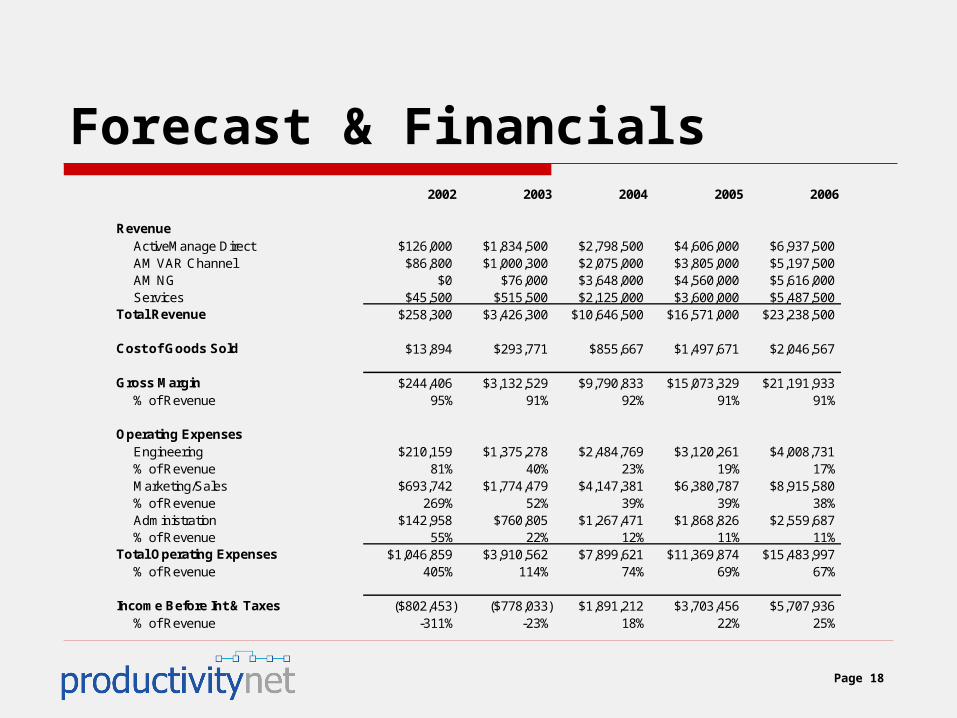
Forecast & Financials2002 2003 2004 2005 2006
RevenueActiveManage Direct $126,000 $1,834,500 $2,798,500 $4,606,000 $6,937,500AM VAR Channel $86,800 $1,000,300 $2,075,000 $3,805,000 $5,197,500AM NG $0 $76,000 $3,648,000 $4,560,000 $5,616,000Services $45,500 $515,500 $2,125,000 $3,600,000 $5,487,500
Total Revenue $258,300 $3,426,300 $10,646,500 $16,571,000 $23,238,500
Cost of Goods Sold $13,894 $293,771 $855,667 $1,497,671 $2,046,567
Gross Margin $244,406 $3,132,529 $9,790,833 $15,073,329 $21,191,933% of Revenue 95% 91% 92% 91% 91%
Operating ExpensesEngineering $210,159 $1,375,278 $2,484,769 $3,120,261 $4,008,731% of Revenue 81% 40% 23% 19% 17%Marketing/Sales $693,742 $1,774,479 $4,147,381 $6,380,787 $8,915,580% of Revenue 269% 52% 39% 39% 38%Administration $142,958 $760,805 $1,267,471 $1,868,826 $2,559,687% of Revenue 55% 22% 12% 11% 11%
Total Operating Expenses $1,046,859 $3,910,562 $7,899,621 $11,369,874 $15,483,997% of Revenue 405% 114% 74% 69% 67%
Income Before Int & Taxes ($802,453) ($778,033) $1,891,212 $3,703,456 $5,707,936% of Revenue -311% -23% 18% 22% 25%

Page 19
Summary / Investment Thesis The Product: System Control using
Web and Wireless Quick payback for the customer Experienced management and
operating team Highly differentiated product Strong and fast growing market Expansive business model Positioned well in competitive
landscape – externally validated