productivity technical progress and scale efficiency …
TRANSCRIPT
Journal of Economic and Financial Sciences | JEF | July 2013 6(2), pp. 479-494 479
PRODUCTIVITY, TECHNICAL PROGRESS AND SCALE
EFFICIENCY IN INDIAN MANUFACTURING: POST-REFORM PERFORMANCE
Ewert Kleynhans# North-West University
Valarmathi Pradeep+ Ministry of Environment and Forests, New Delhi
Received: October 2012 Accepted: May 2013
Abstract
This article studies the effects of the economic reforms on the Indian manufacturing industries. Data Envelopment Analysis was used to estimate technical and scale efficiency changes after the 1991 reform initiatives. The estimates suggest, however, that the efficiency of manufacturing industries declined during the post-reform era. The variations are different across industries, and the findings demonstrate the importance of technological progress for improving manufacturing efficiency and productivity in India.
Keywords India, reforms, Malmquist approach, industry, manufacturing, efficiency, productivity
_______________________________
#Prof Ewert PJ Kleynhans is professor at the School of Economics, North-West University Potchefstroom, South Africa.
+Dr Valarmathi Pradeep is a post-doctoral fellow at the School of Economics, North West University, Potchefstroom, South Africa and fulltime Economist at the Society for Integrated Coastal Management (SICOM), Ministry of Environment and Forests (MoEF), New Delhi, India.
Kleynhans & Pradeep
480 Journal of Economic and Financial Sciences | JEF | July 2013 6(2), pp. 479-494
1. INTRODUCTION
The Indian manufacturing sector has followed diverse pathways to industrial development since independence in 1947. Over the last three decades, the sector has undergone significant changes through extensive reforms. India, along with China, is fast emerging as a global manufacturing hub. It was ranked second by the Global Manufacturing Competitiveness Index, an index developed by Deloitte Touche Tohmatsu (2010:15) in collaboration with the US Council on Competitiveness.
The first tentative moves towards economic liberalisation were made by the then prime minister Indira Gandhi during the early 1980s, but the pace of liberalisation did not accelerate until the unveiling of the “new” economic policies by her son and successor Rajiv Gandhi in 1985. The pro-incumbent nature of the policy regime of the 1980s was evident in a number of policy initiatives. The industrial policy resolution of 1980 emphasised the need to improve productivity in existing units and in order to make them globally competitive. Scale economies in the private sector, both in terms of new technologies and cost-effective organisational structures, had a role in this era. The post-1991 reforms laid strong emphasis on enabling markets and globalisation coupled with lower degrees of direct government involvement in economic activities. The focus was mainly on five areas: foreign investment, entry procedures, technology, monopolies and restrictive trade practices and the public sector.
The first policy announcement of the reform process was the abolition of licences. For the first time in post-independence India, licensing requirements for all projects were abolished; only those related to defence or potentially environment-damaging industries needed prior permission. The 1990s reform also encouraged technology adoption and greater participation of foreign companies in the Indian industrial sector. The reforms of the 1990s were much more favourable for entrepreneurship and product market entry by new firms, and hence were more competition-inducing than the reforms of the 1980s.
The ‘outward-oriented’ New Industrial Policy (NIP) introduced by India in the early 1990s abolished the licensing of capital goods, reduced the number of industries in the public sector, increased foreign ownership in domestic industries, began deregulating small-scale industrial units, reduced trade barriers and encouraged private investment in infrastructure. These elements of the reform programme were introduced to enhance productivity and efficiency in Indian industries (Pattnayak & Thangavelu, 2005:602).
The high growth rates in total factor productivity (TFP) were obtained, driven by economic liberalisation and an attitudinal change favouring the reforms (as discussed in Panagariya, 2002 & 2008 and De Long, 2003). Young (1995), for example, finds that capital-deepening, increasing educational attainment and increasing labour-force participation rates explain most of the high growth rates. By measuring efficiency and productivity, one can separate their effects and be able to identify the role of industries in the reform process.
While there is a growing volume of literature undertaking an explicit comparison of reform processes, the effect of economic reforms on the productivity of Indian manufacturing industries remains a matter of considerable debate (see for instance Balakrishnan, Pushpangadan, & Babu, 2000; Goldar & Kumari, 2003). The majority of studies have found that productivity growth in the post-reform period of the 1990s decelerated from growth rates seen in the 1980s. This has interested economists and policy analysts, as the reform process was expected to accelerate productivity growth. The traditional industry argument maintains that
PRODUCTIVITY, TECHNICAL PROGRESS AND SCALE EFFICIENCY IN INDIAN MANUFACTURING
Journal of Economic and Financial Sciences | JEF | July 2013 6(2), pp. 479-494 481
the removal of protection may result in a large number of industries becoming liquidated. Alternatively, advocates of liberalisation claimed that the effect would be marginal, as most industries were inefficient, and this would only provide opportunities to the remaining industries to improve their performance.
The concept of technical efficiency indicates the degree of success in the utilisation of productive resources. Technical efficiency is considered to be an important determinant of productivity growth and international competitiveness in any economy (Taymaz & Saatci, 1997:461). Technical efficiency consists of maximising the level of production that can be obtained from a given combination of factors. In the Indian context, a number of studies have examined the technical efficiency of manufacturing industry – for example, Page (1984), Little, Mazumdar and Page (1987), Patibandla (1998), Mitra, Varoudakis and Veganzones-Varoudakis (2002) and others. Driffield and Kambhampati (2003:419) estimated frontier production functions for six manufacturing industries. Their findings suggested an increase in overall efficiency in five of the six following the reform period. Mukherjee and Ray (2005) examined the efficiency dynamics of a ‘typical’ firm in individual states during the pre- and post-reform periods. Their findings established no major changes in the efficiency rankings for different states after the reform. Using a panel dataset of 121 Indian manufacturing industries from 1981 to 1998, Pattnayak and Thangavelu (2005:601) found evidence of total factor productivity improvements for most of the industries after the reform period.
In an effort to determine how the economic reform programme shifted Indian manufacturing onto the global stage and influenced technical and scale economies of major industries, the current study now employs a non-parametric approach to explain productivity changes, technical progress and scale efficiencies of industries. India is used as an ideal example to test the measuring of these various measures of productivity changes, given the significant reform programme that took place in recent times. The literature cited above gives a picture of either a particular industry or two or more firms. In this article we have taken into consideration the whole industrial sector (on a two-digit level) classification for the analysis. These are the gaps that this study intends to fill. The purpose of the article is to provide evidence concerning patterns of total factor productivity growth (including TFP catching up) using an alternative measure of TFP – the Malmquist index of total factor productivity growth – which allows for the isolation of catching up to the frontier from shifts in the frontier of the production possibility curve. The Malmquist index is therefore an excellent measure of productivity. To examine the estimates of efficiency and productivity changes, this article uses an industry-level panel dataset from 1991 to 2003.
The rest of the paper is organised as follows: the next section provides a contextualisation for the empirical analysis through a review of the Indian manufacturing sector and related studies after the reform period. The methodology of the Data Envelopment Analysis (DEA) technique along with the Malmquist Index is described in Section 3. Section 4 describes the dataset and variables, while Section 5 reports the empirical findings. The final section adds some concluding remarks.
2. MANUFACTURING: THE SIGNIFICANCE OF INDIA’S REFORM
India’s non-agricultural sectors produced 75% of the overall output of the country’s economy between 1991 and 2003. Manufacturing accounted for 23% of total GDP among the non-agricultural sectors; the electricity, water-supply and gas, mining, and construction sub-sectors
Kleynhans & Pradeep
482 Journal of Economic and Financial Sciences | JEF | July 2013 6(2), pp. 479-494
accounted for 9% and the service sector, comprising all other sub-sectors, accounted for the remaining 4% (Kalirajan, 2004:1). This implies that manufacturing is a major sector in the Indian economy, when considered a single group of activities.
Rodrik and Subramanian (2004:222) reported the significance of spillover benefits from Indian manufacturing to other non-agricultural sectors. Dasgupta and Singh (2005:1053) point out that an export-orientated manufacturing sector is essential to ease the balance of payments situation for India, as it seeks imports to advance in its skills and technology. Kumar and Aggarwal (2005:441) established differences in the nature of research and development (R&D) activities of multi-national enterprise affiliates and local firms following the reforms. Local firms engage their R&D activities in absorbing imported knowledge and providing a backup to their outward expansion. The trade liberalisation of the early 1990s has changed the manufacturing environment significantly.
A major criticism of reform programmes in India is the different pace of reform in the product market, as opposed to the labour market. There have been extensive reforms in the product market. Labour market reforms were not adequate in the case of the Indian economy (as discussed in Kochhar et al., 2006; Panagariya, 2008). Studies on manufacturing productivity have led, however, to contradictory findings. While Unel (2003:2) points out acceleration in TFP growth in Indian manufacturing after the reform period, estimates reported by Goldar and Kumari (2003:455) indicate a fall in TFP growth in the post-reform period.
Basically, in an era of continuing inflation, fluctuating energy costs, high taxes, government regulations, capital shortage, worker dissatisfaction, intense foreign competition and inadequate productivity, it is indeed a challenge to manage the manufacturing industries. Without productivity the role of manufacturing industries in an economy is called into question; hence this current research deals with the study of productivity of the manufacturing industries after the reforms were introduced in India.
3. METHODOLOGY OF DEA AND THE MALMQUIST INDEX
Analyses of the technical efficiency of manufacturing industries in developing countries have received considerable attention in the economic literature in recent years. These include Onder, Deliktas and Lenger (2003) on Turkey; Pham, Dao and Reilly (2009) on Vietnam; and Margono et al. (2011) on Indonesia. Technical efficiency is related to how closely the production function operates to the frontier for the production possibility set. The basic hypothesis of the present study was similar to the Indian government’s assumption that the reforms would stimulate the manufacturing industry. Accordingly, it set out to estimate the effect and test this assumption.
The historical roots of a rigorous approach to efficiency measurement can be traced to the pioneering research by Debreu (1951) and Farrell (1957). Over the past three decades, a variety of approaches, parametric and non-parametric, have been developed to investigate the production frontier and productive efficiency. For a detailed survey on such methodologies, see Lovell (1992), and Kalirajan and Shand (1999). In parametric models, an explicit functional form is specified for the frontier and econometrically estimates the parameters using sample data for inputs and output. Accuracy of the derived technical efficiency estimates is therefore sensitive to the nature of the functional form specified.
The method of Data Envelopment Analysis (DEA), introduced by Charnes, Cooper and Rhodes (1978), and further generalised by Banker, Charnes and Cooper (1984), offers a non-parametric
PRODUCTIVITY, TECHNICAL PROGRESS AND SCALE EFFICIENCY IN INDIAN MANUFACTURING
Journal of Economic and Financial Sciences | JEF | July 2013 6(2), pp. 479-494 483
alternative in contrast to the parametric frontier production function analysis. A production frontier is empirically constructed using linear programming methods from observed input-output data of sample decision-making units (DMUs). In this study, the output-oriented (OO) DEA that seeks the maximum proportional increase in output production, with input levels held fixed, was adopted.
The non-parametric approach entails constructing an envelope of the most productive groups to serve as the frontier for the productive performance of all manufacturing industry groups. There will therefore be one production frontier for each year of the sample, with differences between the frontiers of any two years representing the technical change between those years. By exploiting the computational strength of DEA, the Malmquist productivity-change index may be decomposed into multiplicative factors that can be attributed to pure technical progress, technical change (TC), technical efficiency change (TEC) and scale efficiency change (SEC). Lovell (1996) provides a description of how the DEA-based Malmquist approach implements such decomposition.
The conventional setup of Färe et al. (1992) is adopted in modelling the problem as transformation of a vector of inputs 𝑥𝑡 ∈ 𝑅+𝑁 into a vector of output 𝑦𝑡 ∈ 𝑅+𝑀. The production technology at each time period 𝑡, denoted 𝑆𝑡, is identified as the set of all technologically feasible input-output combinations at time 𝑡 (Lovell, 1996). This is constructed from the data as:
𝑠𝑡 = ��𝑥𝑡,𝑦𝑡�: 𝑦𝑡𝑚 ≤�λ𝑡𝑘
𝐾
𝑘=𝑙
𝑦𝑡𝑚𝑘;� 𝐾
𝑘=𝑙
λ𝑡𝑘 𝑥𝑡𝑛𝑘 ≤ 𝑥𝑡𝑛,𝑚 = 1, … . ,𝑀;𝑛 = 1, … . ,𝑁; λ𝑡
𝑘 ≥ 0,𝑘 = 1, …𝐾� (1)
where each firm produces 𝑀 number of outputs using 𝑁 number of inputs and 𝐾 is the sample size.
This paper assumes constant return to scale (CRS) technology, which specifies that there is no further restriction on the so-called intensity variables 𝜆𝑡𝑘 other than those implied by Equation (1). This includes strong disposability of inputs and outputs (Färe et al., 1994). The output distance function (and the corresponding Malmquist index) can be computed relative to any type of technology, including variable returns to scale (VRS). Relaxation of CRS to VRS entails the additional restriction of:
� 𝐾
𝑘=𝑙
λ𝑙𝑘 = 1
to Equation (1). The output distance function arises when a feasible combination is measured against prevailing technology by
𝐷 𝑡
𝑜�𝑥𝑡 ,𝑦𝑡� = inf{𝜃:�𝑥𝑡,𝑦𝑡/𝜃� 𝜖 𝑆𝑡 }
Such output distance functions are simply Debreu-Farrell output-oriented technical efficiency measures. In the non-parametric approach, these technical efficiency measures can be readily computed from the output-oriented DEA models of Charnes et al. (1978) (hereafter CCR), and Banker et al. (1984) (hereafter BCC).
To measure the productivity change of industry group 𝑝 from year 𝑡 to year (𝑡 + 1) and decompose it into some economically meaningful components, a few distance functions need to be calculated. Two of these are shown below and the others can be formed in the same way. To solve the linear programming problem
Kleynhans & Pradeep
484 Journal of Economic and Financial Sciences | JEF | July 2013 6(2), pp. 479-494
�𝐷𝑡 𝑜�𝑥𝑝 𝑦𝑡𝑝
𝑡 �� = max 𝜙
−1
𝜙, λ (2)
subject to:
𝜙 𝑦𝑚𝑝 𝑡 − � λ𝑡𝑝𝑘
𝐾
𝑘=1
𝑦𝑡𝑘 ≤ 0,𝑚 = 1, … ,𝑀
� λ𝑡𝑝𝑘
𝐾
𝑘=1
𝑥𝑡𝑛𝑘 ≤ 𝑥𝑡𝑛𝑝,𝑛 = 1, … ,𝑁
λ𝑡𝑝𝑘 ≥ 0,𝑘 = 1, … ,𝐾
The distance function can also be defined when measurement is carried out against a technology of a different period, at time (𝑡 + 1) say, by:
𝐷𝑡+1 �𝑥𝑡,𝑦𝑡�0 = 𝑖𝑛𝑓�𝜃: �𝑥𝑡,𝑦𝑡/𝜃� 𝜖𝑆𝑡+1�
This is obtained as the solution of the linear programming problem:
�𝐷𝑡+1 (𝑥𝑝𝑜 𝑦𝑝 𝑡 )𝑡,
� −1 = max 𝜙
𝜙, λ (3)
𝜙 𝑦𝑚𝑝 𝑡 −� λ𝑡+1𝑝𝑘
𝐾
𝑘=1
𝑦𝑡+1𝑘 ≤ 0,𝑚 = 1, … ,𝑀
� λ𝑡+1𝑝𝑘
𝐾
𝑘=1
𝑋𝑡+1 𝑛𝑘 ≤ 𝑋𝑡
𝑛𝑝,𝑛 = 1, … ,𝑁
λ𝑡+1𝑝𝑘 ≥ 0, 𝑘 = 1, … ,𝐾
From such distance functions, the (output-oriented) Malmquist index for productivity change (MALM) is defined as:
𝑀𝑜 �𝑋𝑡+1,𝑌𝑡+1,𝑋𝑡,𝑌𝑡� = �𝐷0 𝑡 (𝑥𝑡+1 , 𝑦𝑡+1)𝐷0𝑡(𝑥𝑡 , 𝑦𝑡)
𝐷0𝑡+1(𝑥𝑡+1, 𝑦𝑡+1)𝐷0𝑡+1(𝑥𝑡 , 𝑦𝑡) �
𝑡+1 ½
(4)
Following Färe et al. (1994), this paper also decomposes the Malmquist index into components representing the effects of pure efficiency change, changes in scale economies and technical change. Technical progress (TP) and technical efficiency change (TEC) are defined respectively as:
𝑇𝑃 = ��𝐷0𝑡(𝑥𝑡+1 , 𝑦𝑡+1)𝐷0𝑡+1(𝑥𝑡+1, 𝑦𝑡+1)� �
𝐷0𝑡(𝑥𝑡 , 𝑦𝑡)𝐷0𝑡+1(𝑥𝑡 , 𝑦𝑡)��
½
(5)
and
𝑇𝐸𝐶 = 𝐷0𝑡+1(𝑥𝑡+1, 𝑦𝑡+1)
𝐷0𝑡(𝑥𝑡 , 𝑦𝑡) (6)

PRODUCTIVITY, TECHNICAL PROGRESS AND SCALE EFFICIENCY IN INDIAN MANUFACTURING
Journal of Economic and Financial Sciences | JEF | July 2013 6(2), pp. 479-494 485
The aim is to distinguish the effects in TEC that can be separately attributed to pure efficiency changes and scale efficiency changes. By relaxing the CRS constraint employed under TEC, first, a component is defined for pure efficiency, which is labelled pure technical efficiency change (PTEC), as:
𝑃𝑇𝐸𝐶 = 𝐷𝑜,𝑉𝑅𝑆𝑡+1 (𝑥𝑡+1,𝑦𝑡+1)𝐷𝑜,𝑉𝑅𝑆𝑡 (𝑥𝑡 ,𝑦𝑡)
(7)
and the scale efficiency change (SEC):
𝑆𝐸𝐶 = 𝐷0𝑡+1(𝑥𝑡+1, 𝑦𝑡+1 )/ 𝐷𝑜,𝑉𝑅𝑆
𝑡+1 (𝑥𝑡+1, 𝑦𝑡+1)𝐷0𝑡(𝑥𝑡 ,𝑦𝑡)/ 𝐷𝑜,𝑉𝑅𝑆
𝑡 (𝑥𝑡 , 𝑦𝑡) (8)
and, therefore, the technical efficiency change (TEC) can be decomposed as:
TEC = PTEC × SEC
Therefore, four separate linear programming problems have to be solved for each sample observation in order to calculate the Malmquist index (Equation 4) for it. From Equations (7) and (8), it follows that an additional two, based on the VRS technology, are to be solved in order to obtain the decomposed components, namely technical change progress (TC), the technical efficiency change (TEC), pure technical efficiency change (PTEC) and scale efficiency change (SEC), which form the various components of the Malmquist index for productivity change (MALM) for the observation sample.
4. DATA AND VARIABLES
The main data source utilised was the Annual Survey of Industries (ASI), published by the Central Statistical Organisation of India. The ASI includes only registered manufacturing sectors. Data from 1991 to 2003 at the two-digit level of manufacturing industries classified according to International Standard Industrial Classification (ISIC, Rev 3.1) is taken for the analysis. The dataset is widely used in analysing the Indian industrial sector (see Lall & Chakravorty, 2005; Pandey & Dong, 2009). This article analyses the behaviour of total factor productivity and its components during the post-reform period 1992 to 2003.
This study focused on the post-reform period of about 1991 to 2003 because the data is available only up till 2003. This also enables one to isolate the effects of the policy reforms best. Moreover, it was decided to stick to 1991 to 2003 because this period witnessed distinct macro-economic events that played the largest role in shaping the global economy. The 1991 to ’95 period was an initial transition phase following the dissolution of the former Soviet Union. Data from 1995 to 1999 also captured the East Asian and Mexican financial crises and would confuse the issues. So would the bursting of the global equities market bubbles between 1999 and 2003, which would capture the sharp contraction in economic growth throughout much of the developed world, including the financial crises in Argentina and the Russian Federation and the economic recovery in South-East Asia. Due to these factors it was decided to focus specifically on the effect on the Indian industrial sector’s productivity and efficiency during the period 1991 to 2003.
The output variable is gross value added. Using gross value added at constant prices is a common practice in the Indian empirical literature (Goldar, 1986; Rajesh & Duraisamy,

Kleynhans & Pradeep
486 Journal of Economic and Financial Sciences | JEF | July 2013 6(2), pp. 479-494
2008:378). The data on value added is deflated by appropriate price deflators with 1993 to 1994 as the base. The input variables include labour and capital. The ASI provides three measures of labour input. The first is number of workers, which can be approximated as paid manual workers. The second is number of paid employees in the organisation, which includes both paid manual as well as non-manual workers. Third is total persons engaged, which relates to all persons engaged by the industry, whether for wages or not, in work connected directly or indirectly with the manufacturing process. The ASI also provides data on the number of days worked by workers and employees in a particular year. In this article, ‘total persons engaged’ was used as it is the most suitable measure of labour input in the production function framework. Gross fixed capital is used to represent capital. In many studies, capital stock is measured by the book value of fixed assets, while in others its flow is measured by summing rent, repairs and depreciation expenses or perpetual inventory created from annual investment data. This measure has its own shortcomings. The book value and perpetual inventory methods do not address the question of capacity utilisation, whereas the flow measure may be questioned on the grounds that the depreciation charges in the financial accounts may be unrelated to actual depreciation of hardware. Following Kumar (2006), gross fixed capital is deflated using the Wholesale Price Index (WPI) of machinery and machine products (base 1993-94 = 100) to include the real gross fixed capital for the empirical model.
5. EMPIRICAL FINDINGS
This section presents the empirical results pertaining to technical efficiency in Indian manufacturing industries during its post-reform period. Considering each industry group in terms of its characteristic type of industrial activity, this article assesses the capacity of each group to use its presence in generating output in the most efficient manner. Such an evaluation carries with it the suggestion that industry groups are judged against each other on a common basis of output-oriented efficiency. It is therefore assumed that all industry groups are operating with respect to a common production frontier for manufacturing in India. This seems like a rather restricted assumption for the production technology; however, the results will not be affected much since the analysis is on two-digit (macro-level) data.
The key findings from computing the output-based MALM of productivity changes are summarised in TABLES 1 and 2.
TABLE 1: DEA Results: (Geometric) Average annual measures of TFP change and its components in the Indian manufacturing industries
Efficiency component Post-reform
MALM
TP
PTEC
SEC
0.996
1.020
0.981
0.996
Source: Authors’ estimates
TABLE 1 summarises the performance of all manufacturing industries during the post-reform period in India. The MALM for Indian manufacturing during post-reform recorded an average
PRODUCTIVITY, TECHNICAL PROGRESS AND SCALE EFFICIENCY IN INDIAN MANUFACTURING
Journal of Economic and Financial Sciences | JEF | July 2013 6(2), pp. 479-494 487
annual decrease of 0.4%, despite some evidence of technical progress achieved by the industries. Pure technical efficiency changed by minus 1.9% and change in scale efficiency is minus 0.4%; however, technical progress grew by 2% during the period of the analysis. Deteriorating efficiency might be attributable to a failure to achieve technological mastery, or might be due to short-run cost-minimising behaviour in the face of quasi-fixed vintage capital. The decline in the level of efficiency happened within the context of higher technical progress, identified as the upward shift of the best practice technology in all industries. The growth in technical progress failed to contribute to the productivity growth in Indian manufacturing industries, owing principally to the failure to improve efficiency in the post-reform period. This indicates that the majority of the industries failed to catch up with the shifting frontier technology, resulting in a decrease in their relative efficiency.
Distinguishing between pure efficiency change and technical efficiency change permits one to observe the importance of the role that non-constant returns to scale have played over time. The fairly rapid rate of structural transformation has taken place with government performing the job of giving guidelines for development. Such guidelines may take the form of new lines of manufactured output, or new methods for the same manufactured output – both of which have the effect of replacing plant and capacity. With new capacity being installed for new directions and an accelerated pace of technological obsolescence for old lines of manufactured output, it would therefore be expected that technology would be characterised by increasing returns to scale. At the same time, large variations in scale economies could also be seen as a result of the sustained pace of change.
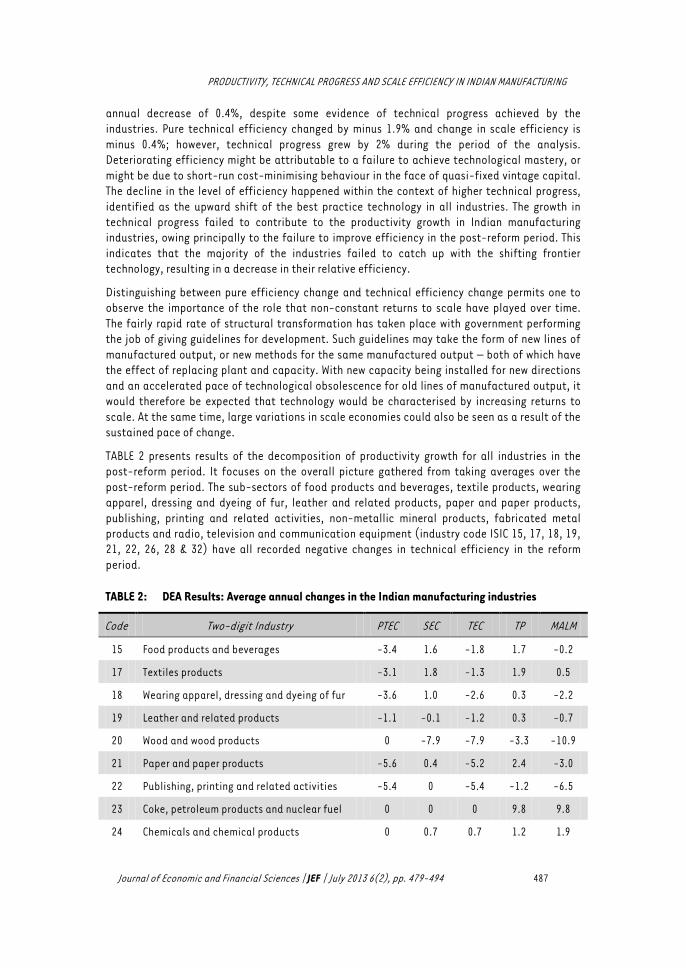
TABLE 2 presents results of the decomposition of productivity growth for all industries in the post-reform period. It focuses on the overall picture gathered from taking averages over the post-reform period. The sub-sectors of food products and beverages, textile products, wearing apparel, dressing and dyeing of fur, leather and related products, paper and paper products, publishing, printing and related activities, non-metallic mineral products, fabricated metal products and radio, television and communication equipment (industry code ISIC 15, 17, 18, 19, 21, 22, 26, 28 & 32) have all recorded negative changes in technical efficiency in the reform period.
TABLE 2: DEA Results: Average annual changes in the Indian manufacturing industries
Code Two-digit Industry PTEC SEC TEC TP MALM
15 Food products and beverages -3.4 1.6 -1.8 1.7 -0.2
17 Textiles products -3.1 1.8 -1.3 1.9 0.5
18 Wearing apparel, dressing and dyeing of fur -3.6 1.0 -2.6 0.3 -2.2
19 Leather and related products -1.1 -0.1 -1.2 0.3 -0.7
20 Wood and wood products 0 -7.9 -7.9 -3.3 -10.9
21 Paper and paper products -5.6 0.4 -5.2 2.4 -3.0
22 Publishing, printing and related activities -5.4 0 -5.4 -1.2 -6.5
23 Coke, petroleum products and nuclear fuel 0 0 0 9.8 9.8
24 Chemicals and chemical products 0 0.7 0.7 1.2 1.9
Kleynhans & Pradeep
488 Journal of Economic and Financial Sciences | JEF | July 2013 6(2), pp. 479-494
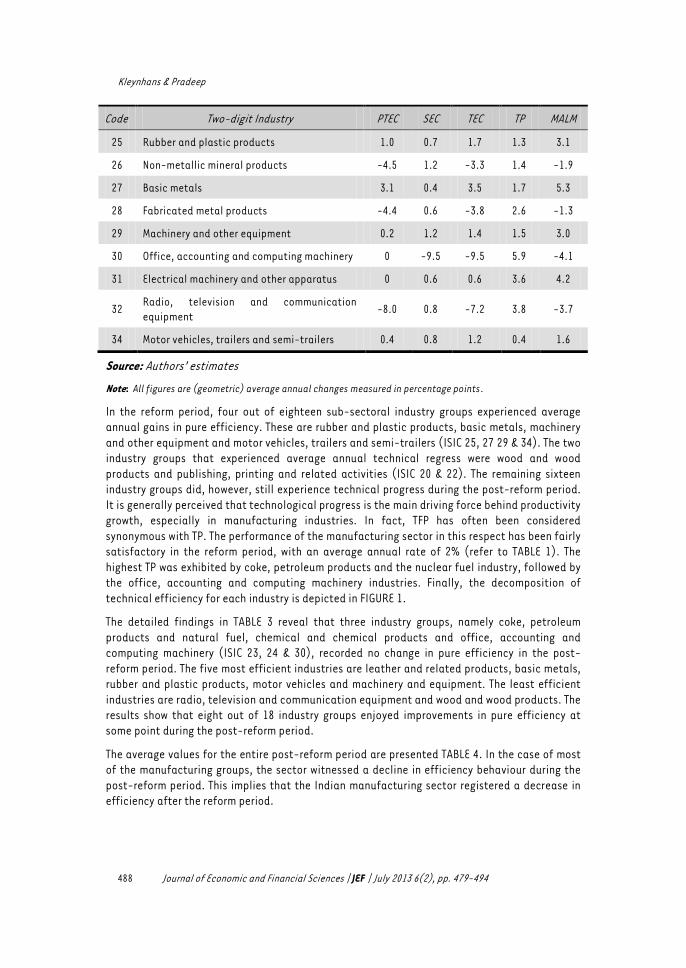
Code Two-digit Industry PTEC SEC TEC TP MALM
25 Rubber and plastic products 1.0 0.7 1.7 1.3 3.1
26 Non-metallic mineral products -4.5 1.2 -3.3 1.4 -1.9
27 Basic metals 3.1 0.4 3.5 1.7 5.3
28 Fabricated metal products -4.4 0.6 -3.8 2.6 -1.3
29 Machinery and other equipment 0.2 1.2 1.4 1.5 3.0
30 Office, accounting and computing machinery 0 -9.5 -9.5 5.9 -4.1
31 Electrical machinery and other apparatus 0 0.6 0.6 3.6 4.2
32 Radio, television and communication equipment
-8.0 0.8 -7.2 3.8 -3.7
34 Motor vehicles, trailers and semi-trailers 0.4 0.8 1.2 0.4 1.6
Source: Authors’ estimates
Note: All figures are (geometric) average annual changes measured in percentage points.
In the reform period, four out of eighteen sub-sectoral industry groups experienced average annual gains in pure efficiency. These are rubber and plastic products, basic metals, machinery and other equipment and motor vehicles, trailers and semi-trailers (ISIC 25, 27 29 & 34). The two industry groups that experienced average annual technical regress were wood and wood products and publishing, printing and related activities (ISIC 20 & 22). The remaining sixteen industry groups did, however, still experience technical progress during the post-reform period. It is generally perceived that technological progress is the main driving force behind productivity growth, especially in manufacturing industries. In fact, TFP has often been considered synonymous with TP. The performance of the manufacturing sector in this respect has been fairly satisfactory in the reform period, with an average annual rate of 2% (refer to TABLE 1). The highest TP was exhibited by coke, petroleum products and the nuclear fuel industry, followed by the office, accounting and computing machinery industries. Finally, the decomposition of technical efficiency for each industry is depicted in FIGURE 1.
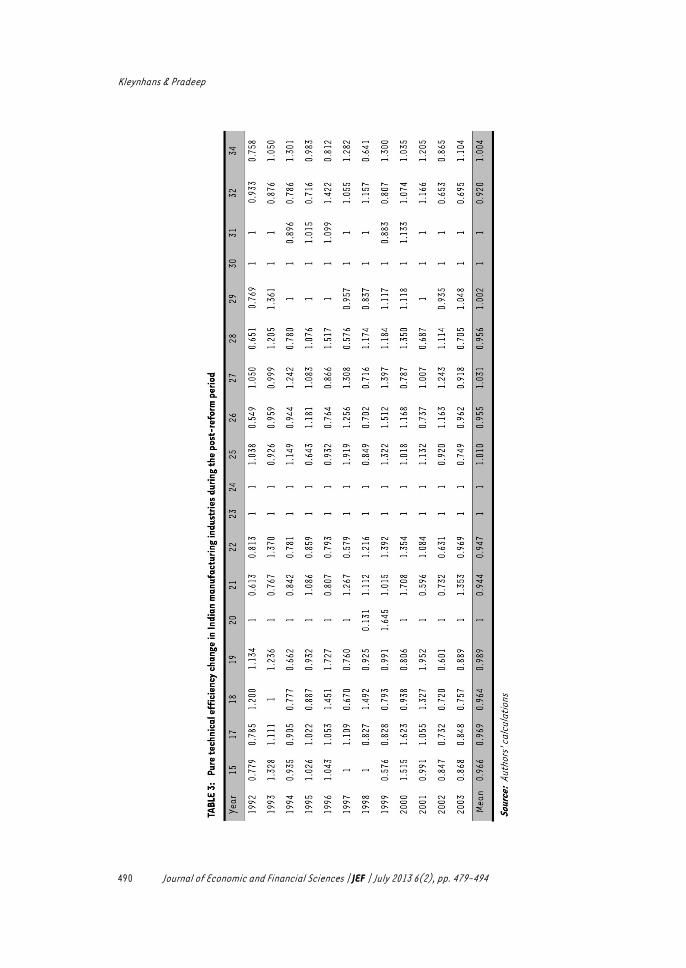
The detailed findings in TABLE 3 reveal that three industry groups, namely coke, petroleum products and natural fuel, chemical and chemical products and office, accounting and computing machinery (ISIC 23, 24 & 30), recorded no change in pure efficiency in the post-reform period. The five most efficient industries are leather and related products, basic metals, rubber and plastic products, motor vehicles and machinery and equipment. The least efficient industries are radio, television and communication equipment and wood and wood products. The results show that eight out of 18 industry groups enjoyed improvements in pure efficiency at some point during the post-reform period.
The average values for the entire post-reform period are presented TABLE 4. In the case of most of the manufacturing groups, the sector witnessed a decline in efficiency behaviour during the post-reform period. This implies that the Indian manufacturing sector registered a decrease in efficiency after the reform period.

PRODUCTIVITY, TECHNICAL PROGRESS AND SCALE EFFICIENCY IN INDIAN MANUFACTURING
Journal of Economic and Financial Sciences | JEF | July 2013 6(2), pp. 479-494 489
FIGURE 1: The post-reform period: TEC and its components
Source: Authors’ analyses
Radio, television and communication equipment (ISIC 32) recorded the lowest efficiency during the post-reform period. In the competitive environment of the post-reform period, the sub-sector group of basic metals (ISIC 27) was found to be the most efficient one.
TABLE 4: Efficiency behaviour during post-reform period
Code Industries Post Reform
15
17
18
19
20
21
22
23
24
25
26
27
28
29
30
31
32
34
Food products and beverages
Textiles products
Wearing apparel, dressing and dyeing of fur
Leather and related products
Wood and wood products
Paper and paper products
Publishing, printing and related activities
Coke, petroleum products and nuclear fuel
Chemicals and chemical products
Rubber and plastic products
Non-metallic mineral products
Basic metals
Fabricated metal products
Machinery and other equipment
Office, accounting and computing machinery
Electrical machinery and other apparatus
Radio, television and communication equipment
Motor vehicles, trailers and semi-trailers
0.966
0.969
0.964
0.989
1
0.944
0.947
1
1
1.010
0.955
1.031
0.956
1.002
1
1
0.920
1.004
Source: Authors’ estimates
-12-10
-8-6-4-20246
15 17 18 19 20 21 22 23 24 25 26 27 28 29 30 31 32 34
Gro
wth
rate
Industry Code
PTEC SEC TEC
Kleynhans & Pradeep
490 Journal of Economic and Financial Sciences | JEF | July 2013 6(2), pp. 479-494
PRODUCTIVITY, TECHNICAL PROGRESS AND SCALE EFFICIENCY IN INDIAN MANUFACTURING
Journal of Economic and Financial Sciences | JEF | July 2013 6(2), pp. 479-494 491
6. CONCLUDING REMARKS
India has experienced significant policy changes since 1984. These changes, in turn, have resulted in considerable reforms in the economy. The nature of these reforms and their likely impact on the economy are well documented in the literature. Since the 1991 economic reform(s), it appears, however, that the growth engine has slowed down in the case of Indian manufacturing.
This article evaluated the total factor productivity growth and its components of the Indian manufacturing industry, specifically during the post-reform period. This was done through the development of a non-parametric approach, known as Data Envelopment Analysis (DEA). This method decomposes the Malmquist productivity-change index (MALM) into its various components of technical change progress (TC), the technical efficiency change (TEC), pure technical efficiency change (PTEC) and scale efficiency change (SEC) in a unique way and provides much more information.
The empirical estimates suggest that most of the industrial efficiency declined in the post-reform period, contradicting the belief that economic reform can stimulate industries through the promotion of efficiency. Labour and capital play a significant role in the reform process by improving efficiency. Fikkert and Hasan (1998) also report the importance of scale economies in improving the efficiency of the Indian manufacturing industry, particularly after the reform period. Bhattacharya et al. (2011:300) emphasise the role of the labour market in influencing productivity changes following the reform period. The cost of capital could also make important differences in productivity and efficiency across industries.
The results were contrary to what was expected. A few studies, instead of directly blaming the reforms for the slowdown, have held deteriorating capacity utilisation responsible for the phenomenon. They argued that owing to a surge in investment activities and imports in the post-reform period, unaccompanied by commensurate expansion of demand, capacity utilisation went on worsening in the manufacturing sector, thereby adversely affecting productivity growth (Uchikawa, 2001; Goldar & Kumari, 2003).
The reforms undertaken so far have enhanced the openness of the Indian economy and have facilitated India’s integration into the world market. The challenge for policymakers, therefore, lies in addressing the question as to what reduces efficiency and why the degree of efficiency has eroded, despite the introduction of market-oriented reforms. It must also be acknowledged that technical progress does have a role to play and that technological upgrading may be used to improve performance. Progress in the post-reform period has mainly been driven by technical progress. This diversity must be borne in mind within the policy context. As the economy becomes more open, greater inflows of capital combined with a strong labour market reform programme will enhance productivity, efficiency and scale economies.
The estimates highlight the role of capital and labour in the reform process in the case of Indian manufacturing. In a recent comparative study of Chinese and Indian manufacturing industries, over the period 1998 to 2003, Pandey and Dong (2009:754) found higher average productivity in Chinese manufacturing compared to its Indian counterpart. Institutional reforms within China (e.g. private property right and labour market reform) are emphasised as driving factors for higher productivity growth.
It would be of value to utilise this method and determine the long-term effects, and also compare it to South African manufacturing industries and the other BRICS (Brazil, Russia, India, China and South Africa) countries in further research. Recent studies on the competitiveness of South African manufacturers (like Kleynhans & Swart, 2012, and Kleynhans & Zwedala, 2012) is of value, but the significance of this article lies in the fact that
Kleynhans & Pradeep
492 Journal of Economic and Financial Sciences | JEF | July 2013 6(2), pp. 479-494
it investigates and quantifies technical efficiency in relation to the closeness that the production function operates to the frontier for the production possibility set.
This article conceptualised an overall industrial sector as a decision-making unit (DMU) in the analysis. This is a restrictive assumption. In doing so, it was also unable to capture any firm-specific heterogeneity that may exist within industries. The overall findings do, nevertheless, reflect significant heterogeneity among various manufacturing industries using performance indicators. In this respect, technology will play an important role in the future.
LIST OF REFERENCES
Balakrishnan, P., Pushpangadan, K. & Babu, M.S. (2000). Trade liberalisation and productivity growth in manufacturing: Evidence from firm-level panel data. Economic and Political Weekly, 35(41), pp. 3679-3682.
Banker, R.D., Charnes, A. & Cooper, W.W. (1984). Some models for estimating technical and scale inefficiencies in data development analysis. Management Science, 30(9), pp. 1078-1092.
Bhattacharya, M., Narayan, P.K., Popp, S. & Rath, B.N. (2011). The productivity-wage and productivity-employment nexus: A panel data analysis of Indian manufacturing. Empirical Economics, 40(2), pp. 285-303.
Charnes, A., Cooper, W.W. & Rhodes, E. (1978). Measuring the efficiency of decision making units. European Journal of Operational Research, 2(6), pp. 429-444.
Dasgupta, S. & Singh, A. (2005). Will services be the new engine of Indian economic growth? Development and Change, 36(6), pp. 1035-1057.
De Long, B. (2003). India since independence: an analytic growth narrative. In D. Rodrik (ed.)Search of Prosperity: Analytic Narratives on Economic Growth, New Jersey, Princeton: Princeton University Press.
Debreu, G. (1951). The coefficient of resource utilisation, Econometrica, 19(3), pp. 273-92.
Deloitte Touche Tohmatsu (2010). Global Manufacturing Competitiveness Index. [Online] Available: http://www.compete.org/images/uploads/File/PDF%20Files/2010_Global_Manufacturing_Competitiveness_Index_FINAL.pdf. (Accessed 13 October 2011).
Driffield, N.L. & Kambhampati, U.S. (2003). Trade liberalisation and the efficiency of firms in Indian manufacturing. Review of Development Economics, 7(3), pp. 419-430.
Färe, R., Grosskopf, S. Lindgren, B. & Roos, P. (1992). Productivity changes in Swedish pharmacies 1980-1989: a non-parametric Malmquist approach. Journal of Productivity Analysis, 3(1-2), pp. 85-101.
Färe, R., Grosskopf, S., Norris, M. & Zhang Z. (1994). Productivity growth, technical progress and efficiency change in industrialized countries, American Economic Review, 84(1), pp. 66-83.
Farrell, M.J. (1957). The measurement of productive efficiency. Journal of the Royal Statistical Society, 120(3), pp. 253-290.
Fikkert, B. & Hasan, R. (1998). Returns to scale in a highly regulated economy: evidence from Indian firms. Journal of Development Economics, 56, pp. 51-79.
PRODUCTIVITY, TECHNICAL PROGRESS AND SCALE EFFICIENCY IN INDIAN MANUFACTURING
Journal of Economic and Financial Sciences | JEF | July 2013 6(2), pp. 479-494 493
Goldar, B. & Kumari, A. (2003). Import liberalisation and productivity growth in Indian manufacturing industries in the 1990s. Developing Economies, 41(4), pp. 436-460.
Goldar, B. (1986). Productivity growth in Indian industry. New Delhi: Allied Publishers.
Kalirajan, K.P. & Shand, R.T. (1999). Frontier production functions and technical efficiency measures. Journal of Economic Surveys, 13(2), pp. 149-172.
Kalirajan, K. (2004). Is the manufacturing sector in India an engine of growth? Working Paper No.151, Institute for Social and Economic Change, Nagarabhavi, Bangalore, India.
Kleynhans, E.P.J. & Swart, A. (2012). Spillover Effects Enhancing Sales, Production and Competitiveness of South African Manufacturers. African Journal of Business Management. 6(10), pp. 3699-3705.
Kleynhans, E.P.J. & Zwedala, S. (2012). The Contribution of FDI, Technology and R&D to Spillovers in Industrial Development: A South African Firm-Level Investigation. Managing Global Transitions. International Research Journal, 10(4), pp. 341-359.
Kochhar, K., Kumar, U., Rajan, R., Subramanian, A. & Tokatlidis, I. (2006). India’s pattern of development: what happened, what follows? Journal of Monetary Economics, 53, pp. 981-1019.
Kumar, N. & Aggarwal, A. (2005). Liberalisation, outward orientation and in-house R&D activity of multinational and local firms: A quantitative exploration for Indian manufacturing. Research Policy, 34(4), pp. 441-460.
Kumar, T.S. (2006). Productivity in Indian chemical sector: An intra sectoral analysis. Economic and Policy Weekly, pp. 4148-4152. (30 Sept.)
Lall, S.V. & Chakravorty, S. (2005). Industrial location and spatial inequality: theory and evidence from India. Review of Development Economics, 9(1), pp. 47-68.
Little, I.M.D., Mazumdar, D. & Page, J.M. (1987). Small manufacturing enterprises: a comparative study of India and other economies. New York: Oxford University Press.
Lovell, K.C.A. (1992). Production frontier and productive efficiency. In H. Fried, K Lovell & S. Schmidt (eds.), The measurement of productive efficiency techniques and applications, Oxford University Press.
Lovell, K.C.A. (1996). Applying efficiency measurement techniques to the measurement of productivity change. Journal of Productivity Analysis, 7(2-3), pp. 329-340.
Margono, H., Sharma, S.C. Sylwester, K. & Al-Qalawi, U. (2011). Technical efficiency and productivity analysis in Indonesian provincial economies. Applied Economics, 43(6), pp. 663-672.
Mitra, A., Varoudakis, A. & Veganzones-Varoudakis, M. (2002). Productivity and technical efficiency in Indian states manufacturing: the role of infrastructure. Economic Development and Cultural Change, 50(2), pp. 395-426.
Mukherjee, K. & Ray, S.C. (2005). Technical efficiency and its dynamics in Indian manufacturing: an inter-state analysis. Indian Economic Review, 40(2), pp. 101-125.
Onder, O.A., Deliktas, E. & Lenger, A. (2003). Efficiency in the manufacturing industry of selected provinces in Turkey: a stochastic frontier analysis. Emerging Markets Finance and Trade, 39(2), pp. 98-113.
Page, J.M. (1984). Firm size and technical efficiency: applications of production frontiers to Indian survey data. Journal of Development Economics, 16(1), pp. 129-152.
Kleynhans & Pradeep
494 Journal of Economic and Financial Sciences | JEF | July 2013 6(2), pp. 479-494
Panagariya, A. (2002). India's economic reforms: what has been accomplished? What remains to be done? Manila: Asian Development Bank. [Online] Available: http://beta.adb.org/publications/indias-economic-reforms-what-has-been-accomplished-what-remains-be-done. (Accessed 11 October 2011).
Panagariya, A. (2008). India: The Emerging Giant. New York: Oxford University Press.
Pandey, M. & Dong, X.Y. (2009). Manufacturing productivity in China and India: the role of institutional changes. China Economic Review, 20(4), pp. 754-766.
Patibandla, M. (1998). Structure, organizational behavior, and technical efficiency: the case of an Indian industry. Journal of Economic Behavior & Organization, 34(3), pp. 419-434.
Pattnayak, S.S. & Thangavelu S.M. (2005). Economic reform and productivity growth in Indian manufacturing industries: an interaction of technical change and scale economies. Economic Modelling, 22(4), pp. 601-615.
Pham, H.T., Dao, T.L. & Reilly, B. (2009). Technical efficiency in the Vietnamese manufacturing sector. Journal of International Development, 22(4), pp. 503-520.
Rajesh, R.S.N., & Duraisamy M. (2008). Efficiency and productivity in the Indian unorganized manufacturing sector: did reforms matter? International Review of Economics, 55(4), pp. 373-399.
Rodrik, D. & Subramanian, A. (2004). From “Hindu growth” to productivity surge: The mystery of the Indian growth transition. IMF Staff Papers, 52(2), pp. 193-228.
Taymaz, E. & Saatci, G. (1997). Technical change and efficiency in Turkish manufacturing industries. Journal of Productivity Analysis, 8(4), pp. 461-475.
Uchikawa, S. (2001), Investment boom and underutilisation of capacity in the 1990s. Economic and Political Weekly, 36(34), pp. 3247-3254.
Unel, B. (2003). Productivity trends in India’s manufacturing sectors in the last two decades. Working Paper No.03/22, International Monetary Fund (IMF).
Young, A. (1995). The tyranny of numbers: confronting the statistical realities of the East Asian growth experience. Quarterly Journal of Economics, 110(3), pp. 641-680.