productivity performance of the services sector
TRANSCRIPT
MALAYSIA
MALAYSIA


STATUTORY REQUIREMENTS
In accordance with Section 7 of the Malaysia Productivity Council (Incorporation) (Amendment) Act 1991, Malaysia Productivity Corporation hereby publishes and submits to the Minister of International Trade and
Industry the status of productivity in Malaysia.
vi
“All things being equal, we need a bolder business community to achieve a high income
nation within the coming eight year timeframe. Considering the current pace can we
make it on time? More importantly, with the current rate of globalisation and growing
emerging economies, would the goalpost shift again?”
Malaysia’s economy continued to grow in 2011 with a GDP growth of 5.1% and employment growth of 0.6%. In tandem with this, the economy recorded a productivity growth of 4.6% to a productivity level of RM54,023. It is gratifying to note that Malaysia’s productivity had surpassed growth recorded by most OECD countries. Malaysia’s 4.6% productivity growth was ahead of Republic of Korea (2.1%), Finland (1.9%), USA (1.2%), UK (0.5%) and Japan (-0.2%).
According to the World Competitiveness Yearbook (WCY) 2011, Malaysia ranked among the top 20 countries with countries such as Canada, Denmark, Finland, Norway and Australia and ahead of China, New Zealand, South Korea and Japan.
There is a crucial need to continuously strive for higher productivity and raise the competitiveness of our economy. Our productivity level of USD14,217 was relatively lower than some OECD and Asian countries such as Korea (USD39,490), Singapore (USD55,702), Australia (USD58,683) and Hong Kong (USD65,174).
Intensified efforts to boost productivity growth by both the Government and industries based on technology and innovative transformation strategies are crucial to generate a quantum leap in productivity growth. The application of ICT-based technology at
MESSAGE FROM THE MINISTER OF INTERNATIONAL TRADE AND INDUSTRY MALAYSIA

vii
organisation level will further strengthen innovative efforts in production, services, marketing and ultimately, to the Nation. The Government will continue to assume a proactive role in creating an environment that serves the Nation’s drive for productivity. Some of the measures include the reduction in regulatory burden by modernising business regulation. The growth in productivity is critical to the success of the Economic Transformation Programme.
This Productivity Report 2011/2012 will be useful to decision makers in the public and private sectors; including investors, academicians and the business community at large. I would strongly encourage the public and private sector to use this Report as a reference for strategic planning and policy formulation to ensure that productivity is continuously enhanced at company, industry and national levels.
DATO’ SRI MUSTAPA MOHAMED
Minister of International Trade and Industry
Malaysia
viii
STATEMENT BY THE CHAIRMAN
“The future of productivity growth in Malaysia will depend on the capability to make more
productive use of skilled labour, improved innovative capacity of firms, facilitate the shift of
capital and other resources to the most productive sectors of the economy and reduced
regulatory barriers and simplify doing business through modernisation of business
regulatory review.”
This Productivity Report is the 19th edition published by MPC and provides a comprehensive analysis on productivity performance of key economic sectors. Three new chapters have been incorporated into this Report covering productivity initiatives to enhance national competitiveness ranking, modernising business regulation, enterprise innovation and business excellence.
Productivity growth is the impetus towards raising the living standards of an economy over the long-term. It is also a key indicator of the overall competitiveness and innovation of an economy. Productivity reflects the efficiency of a Nation’s economic system and the effectiveness of its economic policies. The strong economic fundamentals resulting from improved Government efficiency through its regulatory review and modernising business initiatives and improvement in the firm’s efficiency have enabled the economy to continue growing despite the challenging global economy that affected Eurozone, USA and Japan.
Malaysia recorded a productivity growth of 4.6% in 2011. The growth was broad-based across all major economic sectors except mining, which recorded a negative growth.
The agriculture sector recorded the highest productivity growth followed by the services sector. It is gratifying to note that the Malaysian productivity growth was higher than many OECD countries and the Asian developed economies such as Singapore, Taiwan, Hong Kong and Korea.

ix
Besides analysis on productivity performance at industry, sectoral, national and international levels, this Report also includes the achievements of some of the Entry Point Projects (EPPs) under the National Key Economic Areas (NKEAs), best practices observed and the proposed strategic directions for the various economic sectors.
This Report also provides key insight on Malaysia’s competitiveness ranking in comparison with major world players. Government initiatives in reducing the regulatory barriers and facilitating doing business through modernising business regulation as well as initiatives taken by the industries towards applying new technologies, adopting new business processes and upgrading workforce skills will also be discussed in this Report.
MPC continues to receive support, advice and contributions from various organisations and individuals in the preparation of this Report. On behalf of the MPC, I would like to thank all the various ministries and agencies, the experts for their contribution and the staff of MPC for their dedication and many others, who have contributed in one way or another to produce this Report.
TAN SRI AZMAN HASHIMChairman Malaysia Productivity Corporation
x
MALAYSIA PRODUCTIVITY CORPORATION
Malaysia Productivity Corporation (MPC) was established to assume an important role in the enhancement of productivity and quality of the country towards achieving a higher national economic growth.
To realise the above, MPC has formulated a strategic operation based on the following vision, mission and objectives.
VISION
The leading organisation in productivity enhancement for global competitiveness and innovation
MISSION
To deliver high impact services towards achieving performance excellence through innovation for the
betterment of life
OBJECTIVES
Our corporate objectives are:
Providing value-added information on productivity, quality, competitiveness and best practices through research
activities and databases;
Developing human capital and organisational excellence for building a knowledge-based society through training,
systems development and best practices; andNurturing innovative and creative culture for productivity and competitiveness through partnership programmes.
xi
CONTENTS
MESSAGE FROM MINISTER vi
STATEMENT BY THE CHAIRMAN viii
MALAYSIA PRODUCTIVITY CORPORATION Vision, Mission and Objectives x
REPORT HIGHLIGHTS xvii
PART 1: ENHANCING A PRODUCTIVE AND COMPETITIVE ECONOMY
Chapter 1: Productivity Performance of Malaysia Overall Productivity Performance 2Sectoral Productivity Performance 3
Services Sector 3Manufacturing Sector 9Agriculture Sector 9Construction Sector 10Mining Sector 10Way Forward 12Outlook for 2012 13
Chapter 2: Sources of Malaysia’s Economic GrowthOverview 18Sources of Economic Growth 18TFP of Selected Economic Growth 20International Total Factor Productivity Comparison 22Sources of Output Growth in Selected Countries 22Total Factor Productivity Growth for Future Direction 23Box 2.1: Productivity Measurement Using the KLEMS Approach 26Box 2.2: Wage Management Framework 28
Chapter 3: Malaysia and International Competitiveness Overview 32The Importance of Competitiveness 32Competitiveness Definitions 32Competitiveness Model 32Malaysia’s Overall Competitiveness Performance 33

xii
CONTENTS
Malaysia’s Performance with Selected Countries 35Economic Performance 36Government Efficiency 38Business Efficiency 38Infrastructure 40
Malaysia Towards Global Competitiveness 43Box 3.1: Characteristics of Innovation-Driven Economies 45
PART 2: TRANSFORMATION TOWARDS BUSINESS EXCELLENCE
Chapter 4: Modernising Business Regulation Overview 50The Rationale of Regulatory Review 50International Comparison on Regulatory Performance 51Best Practices in Regulation Development Process 51Best Practice Regulation in Malaysia 54Conclusion 56Box 4.1: Enhancing Malaysia’s Competitiveness Through Modernising Business Regulation 57Box 4.2: Improving Efficiency in Dealing with Construction Permits in Kuala Lumpur 58Box 4.3: Modernising Trade Facilitation Through Business Process Improvement 62
Chapter 5: Escalating Enterprise Innovation and Business Excellence Overview 66 Enterprise Innovation (EI) Improvement Roadmap 66
Intervention Programmes 70Developing a Global Perspective 72
Business Excellent Framework 72Comparative Analysis of Excellence Frameworks 73New Malaysia Business Excellence Framework (MBEF) 76Benefits of Malaysia Business Excellence Framework (MBEF) for Organisations 77Business Excellence (BE) Community 78
Box 5.1: Knowledge Content Study in Enterprises (MyKE) 80Box 5.2: History and Development of ICQCC 83Box 5.3: Moving Quality Environment (QE)/5S to Lean Management 87Box 5.4: Green Productivity (GP) for Sustainable Development 90Box 5.5: Enhancing Productivity through Material Flow Cost Accounting (MFCA) 92Box 5.6: Achieving Excellence through Quality Management Excellence Award (QMEA) 94

xiii
CONTENTS
PART 3: SYNERGY THROUGH PUBLIC-PRIVATE COLLABORATION
Chapter 6: Productivity Performance of the Services Sector Overview 98Productivity Performance 99Total Factor Productivity 100 Strategies and Outlook 103Logistic Services 103
Overview 103Productivity Performance 104Innovation and Best Practices 105Progress of Entry Point Projects (EPPs) 106Strategies and Outlook 107
Information and Communication Technology (ICT) Services 109Overview 109Productivity Performance 109Innovation and Best Practices 110Progress of Entry Point Projects (EPPs) 111Strategies and Outlook 114
Wholesale and Retail Trade Services 115Overview 115Productivity Performance 116Innovation and Best Practices 117Progress of Entry Point Projects (EPPs) 118Strategies and Outlook 119
Business and Professional Services 119Overview 119Productivity Performance 120Innovation and Best Practices 121Progress of Entry Point Projects (EPPs) 121Strategies and Outlook 122
Tourism Services 122Overview 122
xiv
CONTENTS
Productivity Performance 123Innovation and Best Practices 124Progress of Entry Point Projects (EPPs) 125Strategies and Outlook 125
Private Education Services 126Overview 126Productivity Performance 126Innovation and Best Practices 127Progress of Entry Point Projects (EPPs) 128Strategies and Outlook 129
Healthcare Services 130Overview 130Productivity Performance 130Innovation and Best Practices 132Progress of Entry Point Projects (EPPs) 133Strategies and Outlook 134
Construction Services 135 Overview 135Productivity Performance 137Progress of Entry Point Projects (EPPs) 137Strategies and Outlook 143
Box 6.1: Benchmarking for Education Excellence 146Box 6.2: Measuring Performance of Private Hospitals 148Box 6.3: Building Information Modelling for Greater Productivity of the
Construction Sector 150
Chapter 7: Productivity Performance of the Manufacturing Sector Overview 154Productivity Performance of Sub-Sectors and Industries 156NKEAs Sub-Sector’s Performance Analysis 159Total Factor Productivity (TFP) of Selected Manufacturing Sub-Sectors 2007-2011 168Innovation and Best Practices 169Strategies and Outlook 170Box 7.1: Transforming the Traditional Job into Modern Job 172

xv
CONTENTS
Chapter 8: Productivity Performance of the Agriculture Sector Overview 176Productivity Performance 176
Land Productivity 177Labour Productivity 177Capital Productivity
International Agricultural Productivity Comparison 179Human Resource Capacity Development 180Innovation and Best Practices 181Progress of Entry Point Projects (EPPs) 183
Capitalising on Malaysia’s Competitive Advantages 184Tapping Premium Markets 187Ensuring Food Security Objectives are Consistent with Increasing GNI 189Expanding Malaysia’s Participation in the Regional Value Chain 192
Strategies and Outlook 192Box 8.1: Innovative Farming Practices: “From Ideas to Reality” 194
PART 4: SUSTAINING THE QUALITY OF LIFE
Chapter 9: Nation’s Quality of Life AspirationOverview 198Malaysia’s Quality of Life Index 198The Quality of Work Life (Malaysia) 2012 204
Theme 1: Perceptions of Organisation and Workplace 204Theme 2: Management and Leadership Styles 206Theme 3: Working Hours and the Effects of Working Hours
Have on Managers 210Theme 4: Strategic Performance of Organisations 210
Way Forward of Quality of Life 211MPC Way Forward 211
Enhancing Malaysia’s Competitiveness 212Modernising Business Regulations 213Expediting Enterprise Innovation 214Fast-Tracking Towards Business Excellence 214Institutionalising Knowledge Management Culture 215
Box 9.1: Best Practices in Work Life Balance 218Box 9.2: National Customer Satisfaction Index 219
xvi
CONTENTS
APPENDICES Appendix A: Productivity 226Appendix B: Innovation 232Appendix C: Competitiveness 233Appendix D: Regulatory Review 235Appendix E: Technical Notes 239Appendix F: The Contribution by Sub-Sectors 2011 245
MPC BOARD OF DIRECTORS 246
MPC CONSULTATIVE PANELS 247
PARTNERSHIP 251
MPC MANAGEMENT TEAM 252
MPC OFFICE ADDRESSES 253
REFERENCES 255
ACRONYMS AND ABBREVIATIONS 257
INDEX 260

xvii
REPORT HIGHLIGHTS
PRODUCTIVITY PERFORMANCE OF MALAYSIA
Malaysia’s Productivity Performance
Productivity measurement using the ratio of output to the number of employees has reached 68% of the
target level of productivity in 2020. The target level of national productivity for a high income economy
by 2020 is RM78,800. If the projected growth is sustained at a rate of more than 4% per annum, the
target level of productivity can be achieved by 2020. Malaysia’s productivity performance grew by 4.6%
in 2011. Productivity level had increased from RM51,674 in 2010 to RM54,023 in 2011.
International Productivity Performance
Malaysia recorded a higher productivity growth as compared to most OECD countries such as Korea
(2.1%), Finland (1.9%) and Canada (0.6%). However, the growth was lower compared with emerging
countries such as the People’s Republic of China (8.7%), Indonesia (5.0%) and India (4.9%).
Among OECD countries, Malaysia’s productivity level of USD14,217 was lower than Ireland (USD96,559),
United States (USD92,369), Japan (USD74,258) and South Korea (USD34,490). Among selected Asian
countries, Malaysia registered a productivity level higher than Thailand (USD4,801), China (USD4,443), the
Philippines (USD3,341), Indonesia (USD3,040) and India (USD3,034). However, Malaysia’s productivity
level was lower than Hong Kong (USD65,174), Singapore (USD55,702) and Taiwan (USD43,827).
Sources of Growth
The main contributor to economic growth is capital (40.0%), followed by Total Factor Productivity (TFP)
growth (32.7%) and labour (27.3%). Malaysia has been using the KLEMS (Capital, Labour, Energy,
Materials & Services) approach to measure the growth of Total Factor Productivity (TFP) as practiced
by European Union (EU), Japan, Korea and the United States. KLEMS analyses each factor input such
as capital labour, energy, intermediate input, materials and services in terms of quality and efficiency.
Malaysia recorded a TFP growth rate of 1.7% in 2011, lower than Singapore (2.4%), South Korea (2.4%)
and India (2.3%).
xviii
Modernising Business Regulation
The burden of regulation on business was estimated at RM15 billion in 2011 (2.5% of GDP). Most
countries have set a 25% reduction in regulation cost as their targets. Malaysia plans to reduce by
RM 1 billion cost of unnecessary regulation a year until 2015. Programs involving Government and
private agencies have been implemented under the supervision of the Task Force to Facilitate Business
(PEMUDAH) to achieve the target reduction in regulatory burden.
A framework for quality management regulation and Best Practice Regulation Handbook was published to
encourage competitiveness, innovation, investment and skills that will contribute towards improvement.
Quality of Life
Quality of Life Index measures the qualitative aspects of productivity which complements the quantitative
measurement of the economy such as labor productivity. Malaysia Quality of Life Index, reached a score
of 111.9 points (based on year 2000 = 100). Happiness World Report compiled by the United Nations
also placed Malaysia in the second position among Southeast Asia countries behind Singapore and was
ranked 51 among 156 countries in the world.
Quality of Working Life includes having a more conducive working environment, job satisfaction and
individual well-being. The preliminary study found that more than 70% of employees love their work,
had high moral and showed loyalty and high job aspirations. Positive factors which support the welfare
and quality of work include guaranteed work, creativity and employee recognition and strong leadership,
vision, respect and setting a good example.
Outlook for 2012
The economy is anticipated to sustain its growth momentum in 2012 where productivity is expected to
grow by more than 4.0%. The growth in productivity is expected to benefit from the implementation of
some of the EPPs introduced under the NKEAs where the private sector will provide the impetus in driving
economic expansion while the Government will provide the supportive role in improving productivity.
xix
The productivity of the services sector is expected to grow by 4.9% in 2012 lead by communication and
other services sub-sectors. Growth in the communication sub-sector will be supported by advancement in
wireless technology, expansion in High-Speed Broadband infrastructure as well as Government initiatives
to promote broadband usage through-out the country.
The manufacturing sector’s productivity is targeted to grow moderately by 2.3% in 2012 caused by
the spillover effect of the Euro debt crisis and the unresolved structural adjustments experienced in
the US economy. However, the sector will also be supported by continuous growth in the domestic-
oriented industries attributed by the recovery of transport equipment sub-sector and expansion in the
construction-related cluster.

ENHANCING A PRODUCTIVE
AND COMPETITIVE
ECONOMYPART
1
CHAPTER 1
PRODUCTIVITY PERFORMANCE OF MALAYSIA
PRODUCTIVITY PERFORMANCE OF MALAYSIA
2
PRODUCTIVITY PERFORMANCE OF MALAYSIA
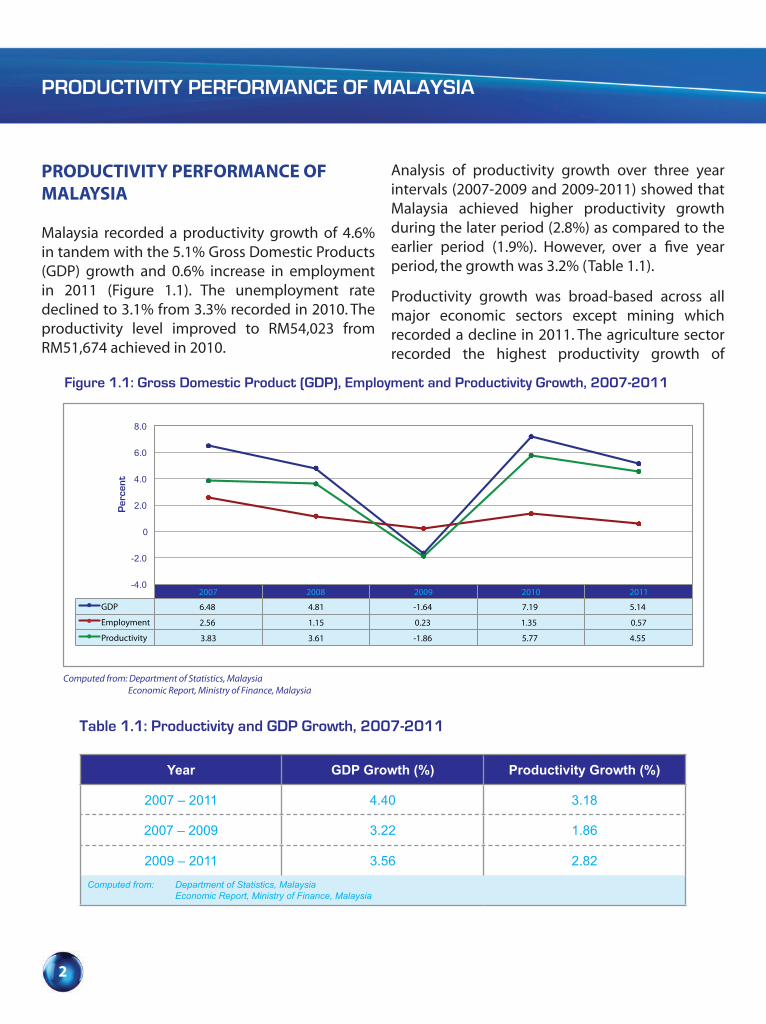
Malaysia recorded a productivity growth of 4.6% in tandem with the 5.1% Gross Domestic Products (GDP) growth and 0.6% increase in employment in 2011 (Figure 1.1). The unemployment rate declined to 3.1% from 3.3% recorded in 2010. The productivity level improved to RM54,023 from RM51,674 achieved in 2010.
Analysis of productivity growth over three year intervals (2007-2009 and 2009-2011) showed that Malaysia achieved higher productivity growth during the later period (2.8%) as compared to the earlier period (1.9%). However, over a five year period, the growth was 3.2% (Table 1.1).
Productivity growth was broad-based across all major economic sectors except mining which recorded a decline in 2011. The agriculture sector recorded the highest productivity growth of
Figure 1.1: Gross Domestic Product (GDP), Employment and Productivity Growth, 2007-2011
Computed from: Department of Statistics, Malaysia Economic Report, Ministry of Finance, Malaysia
Per
cent
2007 2008 2009 2010 2011
GDP 6.48 4.81 -1.64 7.19 5.14
Employment 2.56 1.15 0.23 1.35 0.57
Productivity 3.83 3.61 -1.86 5.77 4.55
-4.0
-2.0
0
2.0
4.0
6.0
8.0
Table 1.1: Productivity and GDP Growth, 2007-2011
Year GDP Growth (%) Productivity Growth (%)
2007 – 2011 4.40 3.18
2007 – 2009 3.22 1.86
2009 – 2011 3.56 2.82
Computed from: Department of Statistics, Malaysia Economic Report, Ministry of Finance, Malaysia
Table 1.2: Productivity Level and Growth, 2011
Economic Activities Level (RM) Growth (%)
Agriculture 29,466 6.23
Mining 866,246 -6.14
Manufacturing 54,509 1.97
Construction 24,635 3.09
Services 53,938 4.92
Malaysia 54,023 4.55
Computed from: Department of Statistics, Malaysia Economic Report, Ministry of Finance, Malaysia
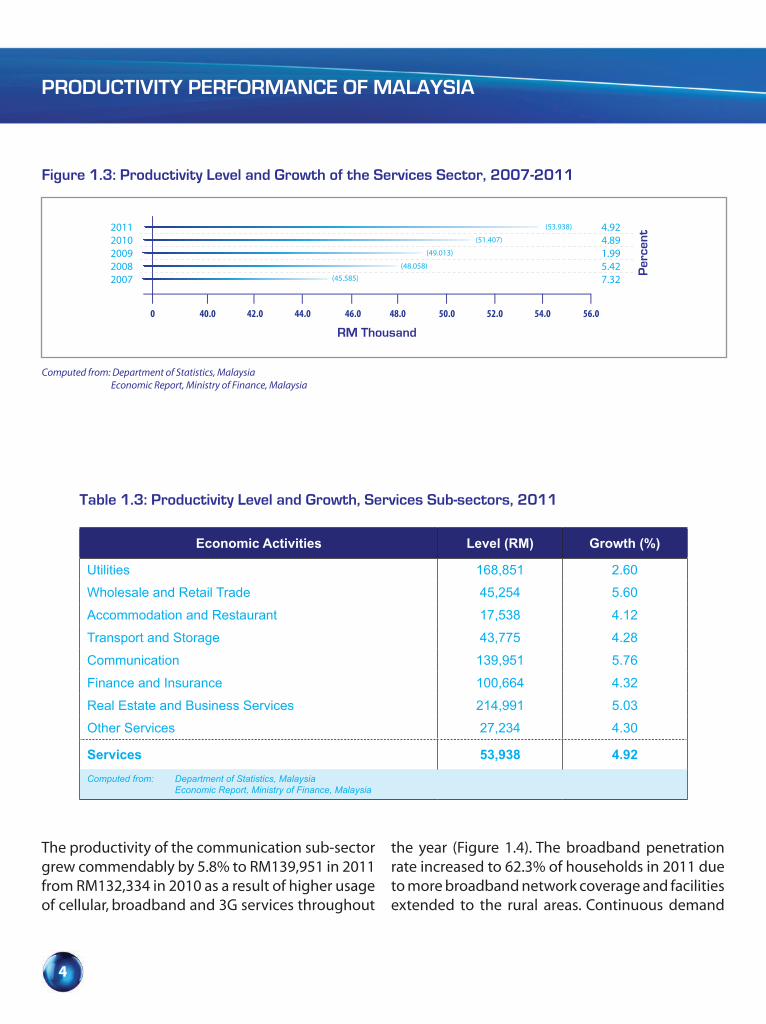
Table 1.3: Productivity Level and Growth, Services Sub-sectors, 2011
Economic Activities Level (RM) Growth (%)
Utilities 168,851 2.60
Wholesale and Retail Trade 45,254 5.60
Accommodation and Restaurant 17,538 4.12
Transport and Storage 43,775 4.28
Communication 139,951 5.76
Finance and Insurance 100,664 4.32
Real Estate and Business Services 214,991 5.03
Other Services 27,234 4.30
Services 53,938 4.92
Computed from: Department of Statistics, Malaysia Economic Report, Ministry of Finance, Malaysia

CHAPTER 1
3
6.2% while the services sector which is the main economic contributor, also showed significant productivity gain of 4.9% (Figure 1.2 & Table 1.2).
Sectoral Productivity PerformanceServices sector
The productivity of the services sector expanded by 4.9% to RM53,938 in 2011 from RM51,407 in
2010. Communication sub-sector contributed the highest productivity growth of 5.8% followed by wholesale and retail trade (5.6%) and real estate and business services (5.0%) (Figure 1.3 & Table 1.3). The improvement in productivity performance was partly due to the results of the Economic Transformation Programme (ETP) initiatives focusing mainly on the services sub-sectors.
2007 2008 2009 2010 2011
Agriculture -2.29 9.26 1.78 1.80 6.23
Mining 1.08 -1.99 -5.61 0.04 -6.14
Manufacturing 2.29 1.93 -11.90 7.56 1.97
Construction 7.00 4.19 5.74 4.59 3.09
Services 7.32 5.42 1.99 4.89 4.92
-15.0
-10.0
-5.0
0
5.0
10.0
15.0
Figure 1.2: Productivity Growth by Economic Sectors, 2007-2011
Computed from: Department of Statistics, Malaysia Economic Report, Ministry of Finance, Malaysia
Per
cent
Table 1.1: Productivity and GDP Growth, 2007-2011
Year GDP Growth (%) Productivity Growth (%)
2007 – 2011 4.40 3.18
2007 – 2009 3.22 1.86
2009 – 2011 3.56 2.82
Computed from: Department of Statistics, Malaysia Economic Report, Ministry of Finance, Malaysia
Table 1.2: Productivity Level and Growth, 2011
Economic Activities Level (RM) Growth (%)
Agriculture 29,466 6.23
Mining 866,246 -6.14
Manufacturing 54,509 1.97
Construction 24,635 3.09
Services 53,938 4.92
Malaysia 54,023 4.55
Computed from: Department of Statistics, Malaysia Economic Report, Ministry of Finance, Malaysia
Table 1.3: Productivity Level and Growth, Services Sub-sectors, 2011
Economic Activities Level (RM) Growth (%)
Utilities 168,851 2.60
Wholesale and Retail Trade 45,254 5.60
Accommodation and Restaurant 17,538 4.12
Transport and Storage 43,775 4.28
Communication 139,951 5.76
Finance and Insurance 100,664 4.32
Real Estate and Business Services 214,991 5.03
Other Services 27,234 4.30
Services 53,938 4.92
Computed from: Department of Statistics, Malaysia Economic Report, Ministry of Finance, Malaysia
PRODUCTIVITY PERFORMANCE OF MALAYSIA
4
The productivity of the communication sub-sector grew commendably by 5.8% to RM139,951 in 2011 from RM132,334 in 2010 as a result of higher usage of cellular, broadband and 3G services throughout
the year (Figure 1.4). The broadband penetration rate increased to 62.3% of households in 2011 due to more broadband network coverage and facilities extended to the rural areas. Continuous demand
Figure 1.3: Productivity Level and Growth of the Services Sector, 2007-2011
Computed from: Department of Statistics, Malaysia Economic Report, Ministry of Finance, Malaysia
RM Thousand
20112010200920082007
0 40.0 42.0 44.0 46.0 48.0 50.0 52.0 54.0 56.0
4.924.891.995.427.32
Per
cent
(45.585)
(48.058)
(49.013)
(51.407)
(53.938)
Table 1.1: Productivity and GDP Growth, 2007-2011
Year GDP Growth (%) Productivity Growth (%)
2007 – 2011 4.40 3.18
2007 – 2009 3.22 1.86
2009 – 2011 3.56 2.82
Computed from: Department of Statistics, Malaysia Economic Report, Ministry of Finance, Malaysia
Table 1.2: Productivity Level and Growth, 2011
Economic Activities Level (RM) Growth (%)
Agriculture 29,466 6.23
Mining 866,246 -6.14
Manufacturing 54,509 1.97
Construction 24,635 3.09
Services 53,938 4.92
Malaysia 54,023 4.55
Computed from: Department of Statistics, Malaysia Economic Report, Ministry of Finance, Malaysia
Table 1.3: Productivity Level and Growth, Services Sub-sectors, 2011
Economic Activities Level (RM) Growth (%)
Utilities 168,851 2.60
Wholesale and Retail Trade 45,254 5.60
Accommodation and Restaurant 17,538 4.12
Transport and Storage 43,775 4.28
Communication 139,951 5.76
Finance and Insurance 100,664 4.32
Real Estate and Business Services 214,991 5.03
Other Services 27,234 4.30
Services 53,938 4.92
Computed from: Department of Statistics, Malaysia Economic Report, Ministry of Finance, Malaysia

CHAPTER 1
5
for broadband services was also supported by aggressive marketing strategies carried out by telecommunication providers which had also contributed towards its productivity.
The wholesale and retail trade sub-sector recorded a productivity growth of 5.6% to RM45,254 in 2011
from RM42,856 in 2010 (Figure 1.5). The growth was mainly supported by strong expansion in domestic consumption as well as higher number of tourist arrivals that generated more retail spending especially during festive seasons and the year-end holiday.
Figure 1.4: Productivity Level and Growth of the Communication Sub-sector, 2007-2011
Computed from: Department of Statistics, Malaysia Economic Report, Ministry of Finance, Malaysia
RM Thousand
20112010200920082007
0 20.0 40.0 60.0 80.0 100.0 120.0 140.0 160.0
5.76 6.71 6.4410.5710.14
Per
cent
(105.374)
(116.510)
(124.018)
(132.334)
(139.951)
Figure 1.5: Productivity Level and Growth of the Wholesale and Retail Trade Sub-sector, 2007-2011
Computed from: Department of Statistics, Malaysia Economic Report, Ministry of Finance, Malaysia
RM Thousand
20112010200920082007
0 5.0 10.0 15.0 20.0 25.0 30.0 35.0 40.0
5.60 5.28 1.42 9.8010.09
Per
cent
(36.552)
(40.135)
(40.705)
(42.856)
(45.254)
45.0 50.0

PRODUCTIVITY PERFORMANCE OF MALAYSIA
6
The productivity of the real estate and business services sub-sector grew by 5.0% in 2011 to a level of RM214,991 from RM204,686 recorded in 2010 (Figure 1.6). The growth was bolstered by strong real estate and equity market during the year. The increase in shared services and outsourcing (SSO) activities had stimulated the productivity in the business services segment.
The strong demand for loans especially from the industries as well as higher fee-based income and insurance premiums had led to the growth in productivity of the finance and insurance sub-sector by 4.3% to RM100,664 in 2011 from RM96,497 in 2010 (Figure 1.7).
Figure 1.6: Productivity Level and Growth of the Real Estate and Business Services Sub-sector, 2007-2011
Computed from: Department of Statistics, Malaysia Economic Report, Ministry of Finance, Malaysia
RM Thousand
20112010200920082007
0 170.0 175.0 180.0 185.0 190.0 195.0 200.0 205.0
5.035.994.090.223.10
Per
cent
(185.137)
(185.535)
(193.125)
(204.686)
(214.991)
210.0 215.0 220.0
Figure 1.7: Productivity Level and Growth of the Finance and Insurance Sub-sector, 2007-2011
Computed from: Department of Statistics, Malaysia Economic Report, Ministry of Finance, Malaysia
RM Thousand
20112010200920082007
0 20.0 30.0 40.0 50.0 60.0 70.0 80.0 90.0 100.0
4.324.784.406.509.35
Per
cent
(82.837)
(88.218)
(92.099)
(96.497)
(100.664)
110.0 120.0

CHAPTER 1
7
The other services sub-sector recorded a productivity growth of 4.3% to RM27,234 in 2011 from RM26,112 in 2010 (Figure 1.8). The private healthcare and education were the main contributors to this sub-sector. The increase in productivity for healthcare was partly contributed by the improvement in specialised healthcare services to cater to the growing demand for health
tourism. The increase in productivity for education was due to the Government’s continuous efforts in promoting Malaysia as a hub in the global education network.
The productivity performance of transport and storage sub-sector expanded by 4.3% to RM43,775 in 2011 from RM41,980 in 2010 (Figure 1.9). Frequent
Figure 1.8: Productivity Level and Growth of the Other Services Sub-sector, 2007-2011
Computed from: Department of Statistics, Malaysia Economic Report, Ministry of Finance, Malaysia
RM Thousand
20112010200920082007
0 22.5 23.0 23.5 24.0 24.5 25.0 25.5 26.0 26.5
4.301.672.393.142.69
Per
cent
(24.321)
(25.085)
(25.684)
(26.112)
(27.234)
27.0 27.5
Figure 1.9: Productivity Level and Growth of the Transport and Storage Sub-sector, 2007-2011
Computed from: Department of Statistics, Malaysia Economic Report, Ministry of Finance, Malaysia
RM Thousand
20112010200920082007
0 37.0 38.0 39.0 40.0 41.0 42.0 43.0 44.0 45.0
4.285.76
-3.292.416.05
Per
cent
(40.082)
(41.046)
(39.693)
(41.980)
(43.775)
PRODUCTIVITY PERFORMANCE OF MALAYSIA
8
travel and trade-related activities especially in the air and sea transport segments contributed to the growth of this sub-sector. Besides, efficient and systematic land transport also contributed to the performance of the sub-sector.
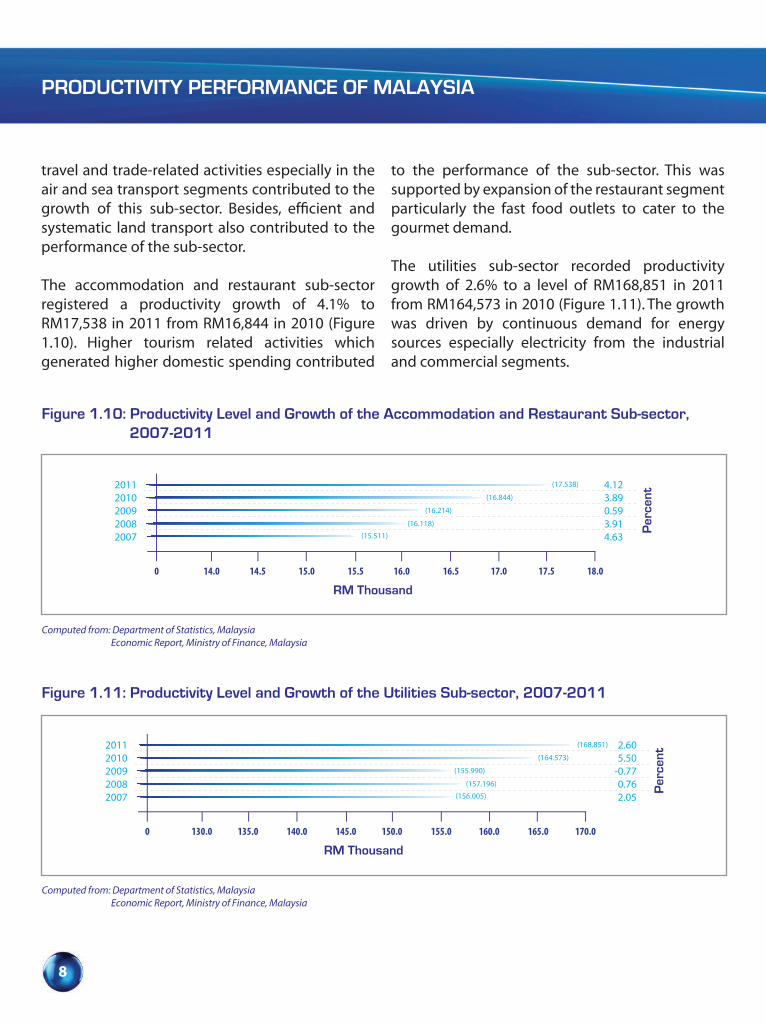
The accommodation and restaurant sub-sector registered a productivity growth of 4.1% to RM17,538 in 2011 from RM16,844 in 2010 (Figure 1.10). Higher tourism related activities which generated higher domestic spending contributed
to the performance of the sub-sector. This was supported by expansion of the restaurant segment particularly the fast food outlets to cater to the gourmet demand.
The utilities sub-sector recorded productivity growth of 2.6% to a level of RM168,851 in 2011 from RM164,573 in 2010 (Figure 1.11). The growth was driven by continuous demand for energy sources especially electricity from the industrial and commercial segments.
Figure 1.10: Productivity Level and Growth of the Accommodation and Restaurant Sub-sector, 2007-2011
Computed from: Department of Statistics, Malaysia Economic Report, Ministry of Finance, Malaysia
RM Thousand
20112010200920082007
0 14.0 14.5 15.0 15.5 16.0 16.5 17.0 17.5 18.0
4.123.890.593.914.63
Per
cent
(15.511)
(16.118)
(16.214)
(16.844)
(17.538)
Figure 1.11: Productivity Level and Growth of the Utilities Sub-sector, 2007-2011
Computed from: Department of Statistics, Malaysia Economic Report, Ministry of Finance, Malaysia
RM Thousand
20112010200920082007
0 130.0 135.0 140.0 145.0 150.0 155.0 160.0 165.0 170.0
2.60 5.50-0.77 0.76 2.05
Per
cent
(156.005)
(157.196)
(155.990)
(164.573)
(168.851)

CHAPTER 1
9
Manufacturing sector
The productivity of the manufacturing sector grew by 2.0% amounting to RM54,509 in 2011 from RM53,459 in 2010 (Figure 1.12). Refined petroleum products sub-sector recorded the highest productivity growth of 10.7%, followed by wearing apparel sub-sector which registered strong productivity growth of 7.3%, attributed to greater demand particularly Turkey, Middle East and emerging economies such as China. The high value added contribution sub-sectors which
demonstrated strong growth in productivity were chemicals and chemical products (4.9%) as well as rubber and plastics products (4.0%). The productivity growth of these sub-sectors surpassed the manufacturing average.
Agriculture sector
The agriculture sector recorded commendable productivity growth of 6.2% to RM29,466 in 2011 from RM27,738 in 2010 (Figure 1.13). The growth was attributed mainly by higher production of
Figure 1.12: Productivity Level and Growth of the Manufacturing Sector, 2007-2011
Computed from: Department of Statistics, Malaysia Economic Report, Ministry of Finance, Malaysia
RM Thousand
20112010200920082007
0 44.0 46.0 48.0 50.0 52.0 54.0 56.0 58.0 60.0
1.97 7.56-11.90 1.93 2.29
Per
cent
(55.349)
(56.414)
(49.700)
(53.459)
(54.509)
Figure 1.13: Productivity Level and Growth of the Agriculture Sector, 2007-2011
Computed from: Department of Statistics, Malaysia Economic Report, Ministry of Finance, Malaysia
RM Thousand
20112010200920082007
0 5.0 10.0 15.0 20.0 25.0 30.0 35.0 40.0
6.231.801.789.26-2.29
Per
cent
(24.501)
(26.770)
(27.247)
(27.738)
(29.466)
PRODUCTIVITY PERFORMANCE OF MALAYSIA
10
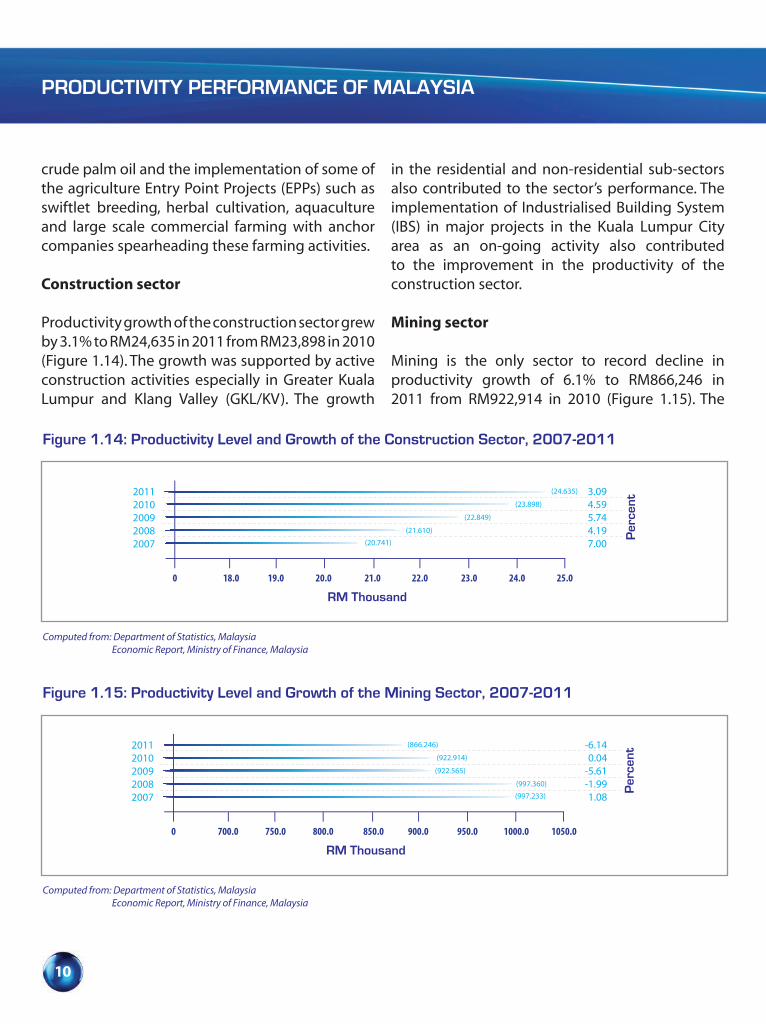
crude palm oil and the implementation of some of the agriculture Entry Point Projects (EPPs) such as swiftlet breeding, herbal cultivation, aquaculture and large scale commercial farming with anchor companies spearheading these farming activities.
Construction sector
Productivity growth of the construction sector grew by 3.1% to RM24,635 in 2011 from RM23,898 in 2010 (Figure 1.14). The growth was supported by active construction activities especially in Greater Kuala Lumpur and Klang Valley (GKL/KV). The growth
in the residential and non-residential sub-sectors also contributed to the sector’s performance. The implementation of Industrialised Building System (IBS) in major projects in the Kuala Lumpur City area as an on-going activity also contributed to the improvement in the productivity of the construction sector.
Mining sector
Mining is the only sector to record decline in productivity growth of 6.1% to RM866,246 in 2011 from RM922,914 in 2010 (Figure 1.15). The
Figure 1.14: Productivity Level and Growth of the Construction Sector, 2007-2011
Computed from: Department of Statistics, Malaysia Economic Report, Ministry of Finance, Malaysia
RM Thousand
20112010200920082007
0 18.0 19.0 20.0 21.0 22.0 23.0 24.0 25.0
3.094.595.744.197.00
Per
cent
(20.741)
(21.610)
(22.849)
(23.898)
(24.635)
Figure 1.15: Productivity Level and Growth of the Mining Sector, 2007-2011
Computed from: Department of Statistics, Malaysia Economic Report, Ministry of Finance, Malaysia
RM Thousand
20112010200920082007
0 700.0 750.0 800.0 850.0 900.0 950.0 1000.0 1050.0
-6.140.04
-5.61-1.991.08
Per
cent
(997.233)
(997.360)
(922.565)
(922.914)
(866.246)

CHAPTER 1
11
productivity of the sector was impacted by the decline in the production of crude oil due to shutdowns of several facilities for maintenance as well as upgrading activities to expand oil and gas production capacity.
Regional Overview of Comparative Productivity Performance
Although affected by the global economic slowdown in terms of export performance, Malaysia’s productivity had surpassed growth recorded by most Organisation of Economic Cooperation Development (OECD) countries. Malaysia recorded a 4.6% productivity growth,
ahead of Republic of Korea (2.1%), Finland (1.9%), USA (1.2%), UK (0.5%) and Japan (-2.0%) (Figure.1.16). In terms of level, Malaysia’s productivity level at USD14,217 was lower than Republic of Korea (USD39,490), Finland (USD64,345), USA (USD92,369) UK (USD66,906) and Japan (USD74,258) (Figure 1.16). Strong economic fundamentals coupled with pragmatic macro economic policies and the implementation of ETP are among the initiatives taken by the Government to further enhance Malaysia’s productivity level.
Among the selected Asian countries, China recorded the highest productivity growth of
Figure 1.16: Productivity Levels and Growth of Malaysia and Selected OECD Countries, 2011
Computed from: OECD Economic Outlook, Vol. 90 Database : OECD Statistics : Country Data, The Economist Intelligent Unit
IRELANDUNITED STATES
JAPANUNITED KINGDOM
FINLANDAUSTRALIA
CANADAKOREA
NEW ZEALANDMALAYSIA
0 10 20 30 40 50 60 70 80 90 100
2.851.19
-0.200.501.880.300.592.07
-0.294.55
USD Thousand
Per
cent
(96.559)
(92.369)
(74.258)
(66.906)
(64.345)
(58.863)
(56.988)
(39.490)
(34.786)
(14.217)

PRODUCTIVITY PERFORMANCE OF MALAYSIA
12
8.7%, followed by Indonesia (5.0%) and India (4.8%). Malaysia’s productivity growth at 4.6% was ahead of Hong Kong (2.7%), Singapore (2.1%) and Taiwan (1.9%), while Thailand posted a decline in productivity by 1.1% (Figure 1.17).
Malaysia productivity level was at least three times higher as compared to its regional peers namely, Thailand (USD4,801), China (USD4,443), Philippines (USD3,341), Indonesia (USD3,040) and India (USD2,867), but lagging behind Hong Kong, Singapore and Taiwan.
Way Forward
In the context of an ailing global economy especially in the US and Eurozone, many exporting
countries including Malaysia were affected. As a small open economy which is dependent on export and vulnerable to major changes worldwide, concentration on domestic consumption is the best option to overcome this sluggish economy.
The current Budget 2012 is expected to spur domestic consumption. These include the one-off financial assistance to households in the low and middle-income groups, schooling assistance to all primary and secondary students and book vouchers to all local students in tertiary education institutions as well as increment in public sector wage.
Besides relying on domestic consumption, Malaysia must also diversify its efforts and initiatives to be on
Figure 1.17: Productivity Levels and Growth of Malaysia and Selected Asian Countries, 2011
HONG KONGSINGAPORE
TAIWANMALAYSIATHAILAND
CHINAPHILIPINESINDONESIA
INDIA
0 10 20 30 40 50 60 70
2.702.101.904.55-1.108.700.505.004.80
USD Thousand
Computed from: Country Data, The Economist Intelligent Unit
Per
cent
(65.174)
(55.702)
(43.827)
(14.217)
(4.801)
(4.443)
(3.341)
(3.040)
(2.867)

CHAPTER 1
13
target to become a high-income economy by 2020. Productivity-driven growth is what the country requires in order to achieve the high-income status. Achieving productivity improvements can be attained through five interlinked catalysing factors which would enable individuals and organisations to thrive. The five factors are organisational development, human capital management, the capability to innovate, the ability to acquire and use of technology and efficient management systems.
Enhancing business environment to be more conducive is among the factors that can improve productivity. Realising the need to enhance ease in the public delivery system and facilitate business investment, the Modern Business Licensing (MBL) is one of the initiatives implemented and facilitated by Special Taskforce to Facilitate Business (PEMUDAH). The ultimate aim of the MBL initiative is to abolish unnecessary licences and simplify business-related procedures in the country.
Outlook for 2012
The economy is anticipated to sustain its growth momentum in 2012 where productivity is expected to grow by more than 4.0%. The growth in productivity is expected to benefit from the implementation of some of the EPPs introduced
under the ETP where the private sector will provide the impetus in driving economic expansion while the Government will provide the supportive role in improving productivity.
The productivity of the services sector is expected to grow by 4.9% in 2012 lead by communication and other services sub-sectors. Growth in the communication sub-sector will be supported by advancement in wireless technology, expansion in High-Speed Broadband infrastructure as well as Government initiatives to promote broadband usage through out the country.
The manufacturing sector’s productivity is targeted to grow moderately by 2.3% in 2012 caused by the after effect of the Euro debt crisis and the subprime lending experienced in the US economy. However, the sector will also be supported by continuous growth in the domestic-oriented industries attributed by the recovery of transport equipment sub-sector and expansion in the construction-related cluster.
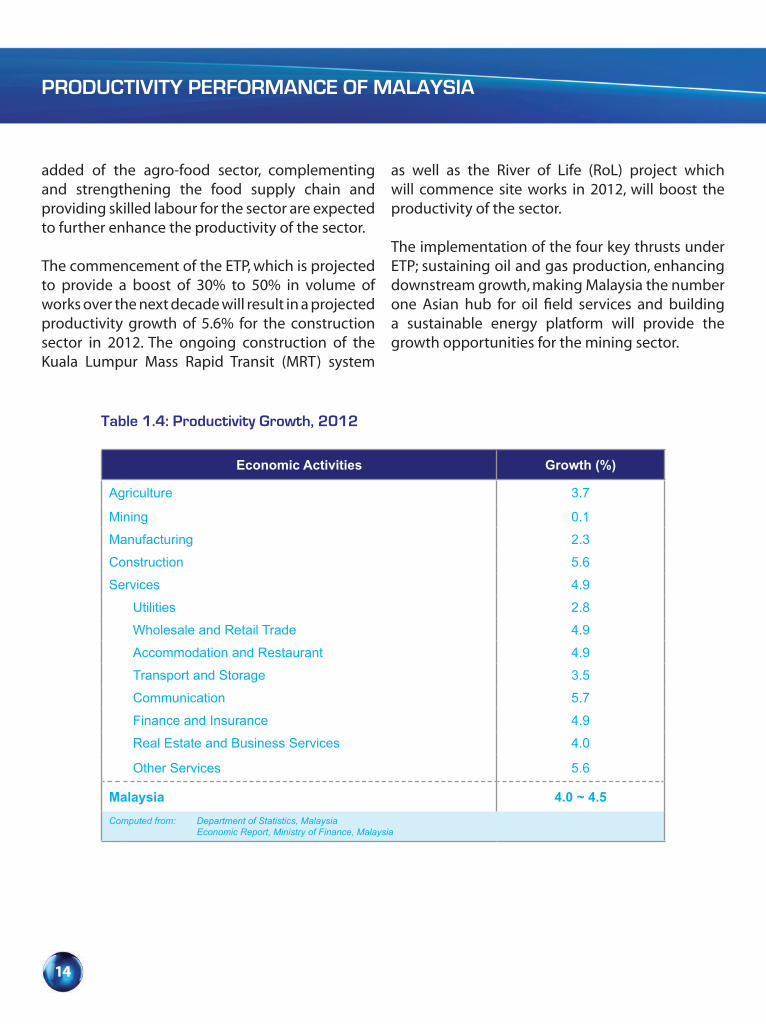
The agriculture sector is expected to register a productivity growth of 3.7% in 2012 supported by the food production segment. With the launching of the National Agro-Food Policy 2011-2020 where the objectives among others, are to increase value-
PRODUCTIVITY PERFORMANCE OF MALAYSIA
14
added of the agro-food sector, complementing and strengthening the food supply chain and providing skilled labour for the sector are expected to further enhance the productivity of the sector.
The commencement of the ETP, which is projected to provide a boost of 30% to 50% in volume of works over the next decade will result in a projected productivity growth of 5.6% for the construction sector in 2012. The ongoing construction of the Kuala Lumpur Mass Rapid Transit (MRT) system
as well as the River of Life (RoL) project which will commence site works in 2012, will boost the productivity of the sector.
The implementation of the four key thrusts under ETP; sustaining oil and gas production, enhancing downstream growth, making Malaysia the number one Asian hub for oil field services and building a sustainable energy platform will provide the growth opportunities for the mining sector.
Table 1.4: Productivity Growth, 2012
Economic Activities Growth (%)
Agriculture 3.7
Mining 0.1
Manufacturing 2.3
Construction 5.6
Services 4.9
Utilities 2.8
Wholesale and Retail Trade 4.9
Accommodation and Restaurant 4.9
Transport and Storage 3.5
Communication 5.7
Finance and Insurance 4.9
Real Estate and Business Services 4.0
Other Services 5.6
Malaysia 4.0 ~ 4.5
Computed from: Department of Statistics, Malaysia Economic Report, Ministry of Finance, Malaysia
CHAPTER 1
15
Towards A High Income Economy

CHAPTER 2
SOURCES OF MALAYSIA’S ECONOMIC GROWTH
SOURCES OF MALAYSIA’S ECONOMIC GROWTH
18
Overview
Sources of economic growth is derived from two components namely, the increase in employment and productivity. The underlying factors that contribute to productivity growth are increase in capital intensity and TFP growth. TFP is defined as the change in output after taking into account, the growth in physical capital and changes in the quantity and quality of labour input.
Sources of Economic Growth
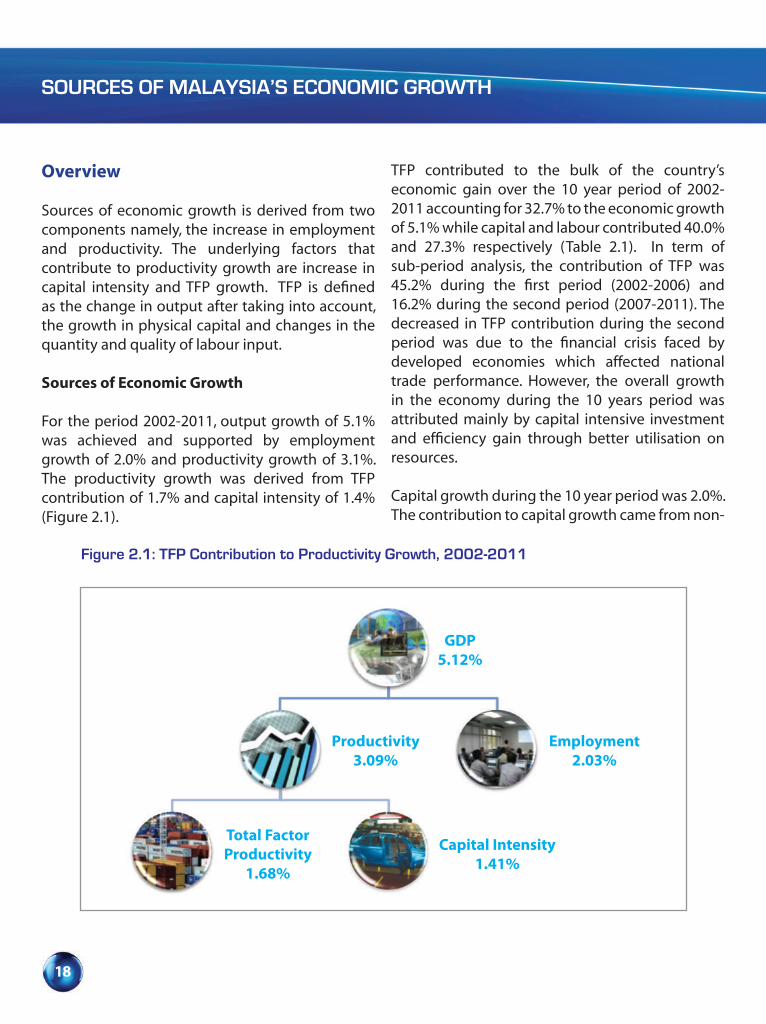
For the period 2002-2011, output growth of 5.1% was achieved and supported by employment growth of 2.0% and productivity growth of 3.1%. The productivity growth was derived from TFP contribution of 1.7% and capital intensity of 1.4% (Figure 2.1).
TFP contributed to the bulk of the country’s economic gain over the 10 year period of 2002-2011 accounting for 32.7% to the economic growth of 5.1% while capital and labour contributed 40.0% and 27.3% respectively (Table 2.1). In term of sub-period analysis, the contribution of TFP was 45.2% during the first period (2002-2006) and 16.2% during the second period (2007-2011). The decreased in TFP contribution during the second period was due to the financial crisis faced by developed economies which affected national trade performance. However, the overall growth in the economy during the 10 years period was attributed mainly by capital intensive investment and efficiency gain through better utilisation on resources.
Capital growth during the 10 year period was 2.0%. The contribution to capital growth came from non-
GDP5.12%
Employment2.03%
Productivity3.09%
Total FactorProductivity
1.68%
Capital Intensity1.41%
Figure 2.1: TFP Contribution to Productivity Growth, 2002-2011

CHAPTER 2
19
ICT capital (1.2%) and ICT capital (0.8%). During the first period 2002-2006, capital growth was 1.9% of which non-ICT capital contributed 1.0% and ICT capital (0.9%). Likewise during the second period 2007-2011, capital growth had increased to 2.2% of which 1.4% by non-ICT capital and 0.8% by ICT capital (Table 2.1).
The high contribution of non-ICT capital to GDP growth was reflected by higher investment in structural as well as machinery and equipment. Over the last two decades, share of investment in non-ICT capital had decreased from 88.8% in 1990 to 81.1% in 2010, while share of ICT capital workforce had shown increasing trend from 11.2% in 1990 to 18.9% in 2010 (Figure 2.2).
Table 2.1: Contribution of TFP, Capital and Labour to GDP (%)
2002-2006 2007-2011 2002-2011
GDP
Labour
Labour Quality
Labour Quantity
Capital
Non ICT Capital
ICT Capital
TFP
5.83
1.27 (21.80)
0.24
1.03
1.92(32.96)
1.04
0.88
2.64(45.24)
4.41
1.53(34.60)
0.17
1.36
2.17(49.19)
1.36
0.81
0.71(16.21)
5.12
1.40(27.31)
0.20
1.19
2.04(39.95)
1.20
0.84
1.68(32.74)
Computed from: Department of Statistics, Malaysia
10.0 20.0 30.0 40.0 50.0 60.0 70.0 80.0 90.0 100.0
Figure 2.2: Share of Non ICT Capital and ICT Capital
Computed from: Department of Statistics, Malaysia
Non ICT Captal ICT Capital
2010
2002
1990
0
Percent
81.318.7
84.915.1
88.812.2

SOURCES OF MALAYSIA’S ECONOMIC GROWTH
20
In contrast, the contribution of labour had shown a marginal increased from 1.3% (labour quality 0.2% and labour quantity 1.0%) during the first period to 1.5% (labour quality 0.2% and labour quantity 1.4%) during the second period (Table 2.1). This shows that the quantity of workforce was the major contributor to output growth. Share of higher skill workforce had marginally increased from 24.4% in 2001 to 27.9% in 2011 while share of low skill workforce had declined from 26.4% in 2001 to 23.2% in 2011 (Figure 2.3).
TFP of Selected Economic Sectors
Malaysia’s aspiration to advance towards a high-income economy requires higher TFP growth to be recorded in all economic sectors. This involves adopting an innovation-based economy to be globally competitive. By examining the TFP of the different economic sectors, it is possible to understand how the respective sectors have performed and to identify those sectors which require greater attention.
For the period 2002-2011, the services sector recorded the highest TFP growth of 3.3% attributed to high output growth due to higher demand from both external and domestic users. TFP growth contributed 55.1% to output growth as a result of the implementation of some of EPPs as seven of 12 NKEAs are from the services sector. Likewise, capital and labour contributed 14.1% and 30.8% respectively (Table 2.2). Some of outstanding contributors within the services sub sector include trade and finance services. Higher TFP growth can be achieved by shifting towards more ICT based operation such as e-business, besides of the personalised services offered to the customers.
The agriculture sector recorded a TFP growth of 2.5%, which is in line with the move to modernise and transform the sector and operate like a business venture. The higher TFP contribution was influenced by higher commodity prices in recent years as well as a successful implementation of some of EPPs focusing on high-value added crops, swiftlet breeding and aquaculture. This was
Figure 2.3: Share of Employment by Skill (%)
Computed from: Department of Statistics, Malaysia
High Skill Medium Skill Low Skill
2011
2006
2001
0 10.0 20.0 30.0 40.0 50.0 60.0
Percent
27.8948.9623.15
26.3149.2124.49
24.3549.2426.41
CHAPTER 2
21
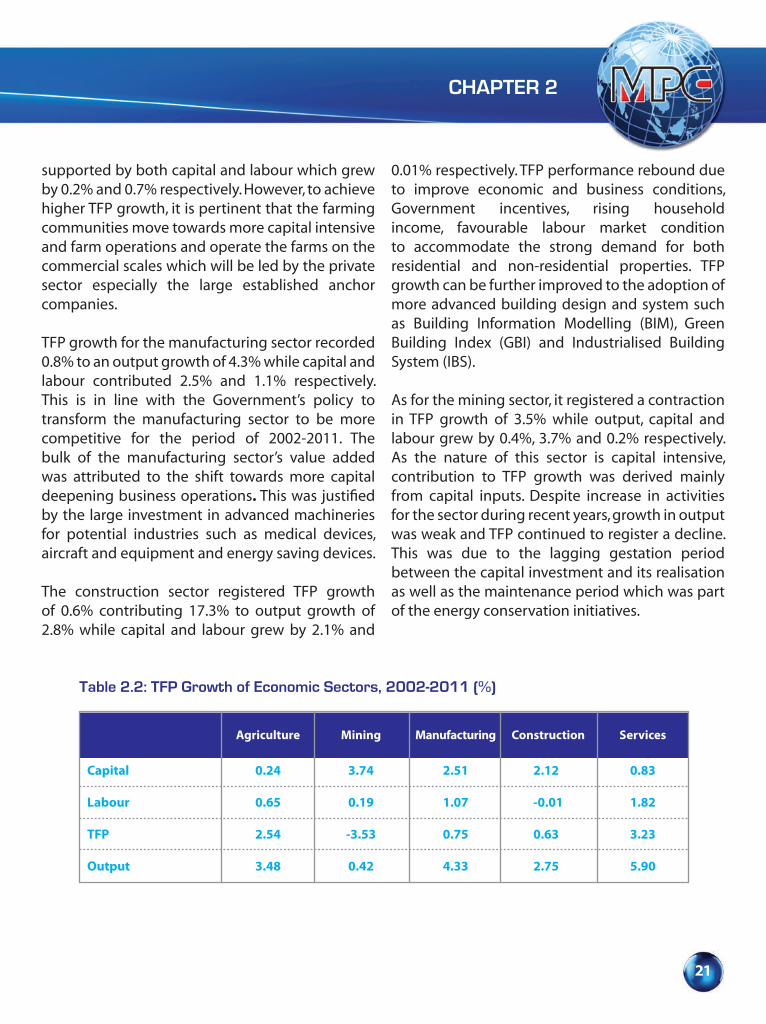
supported by both capital and labour which grew by 0.2% and 0.7% respectively. However, to achieve higher TFP growth, it is pertinent that the farming communities move towards more capital intensive and farm operations and operate the farms on the commercial scales which will be led by the private sector especially the large established anchor companies.
TFP growth for the manufacturing sector recorded 0.8% to an output growth of 4.3% while capital and labour contributed 2.5% and 1.1% respectively. This is in line with the Government’s policy to transform the manufacturing sector to be more competitive for the period of 2002-2011. The bulk of the manufacturing sector’s value added was attributed to the shift towards more capital deepening business operations. This was justified by the large investment in advanced machineries for potential industries such as medical devices, aircraft and equipment and energy saving devices.
The construction sector registered TFP growth of 0.6% contributing 17.3% to output growth of 2.8% while capital and labour grew by 2.1% and
0.01% respectively. TFP performance rebound due to improve economic and business conditions, Government incentives, rising household income, favourable labour market condition to accommodate the strong demand for both residential and non-residential properties. TFP growth can be further improved to the adoption of more advanced building design and system such as Building Information Modelling (BIM), Green Building Index (GBI) and Industrialised Building System (IBS).
As for the mining sector, it registered a contraction in TFP growth of 3.5% while output, capital and labour grew by 0.4%, 3.7% and 0.2% respectively. As the nature of this sector is capital intensive, contribution to TFP growth was derived mainly from capital inputs. Despite increase in activities for the sector during recent years, growth in output was weak and TFP continued to register a decline. This was due to the lagging gestation period between the capital investment and its realisation as well as the maintenance period which was part of the energy conservation initiatives.
Table 2.2: TFP Growth of Economic Sectors, 2002-2011 (%)
Agriculture Mining Manufacturing Services
Capital
Labour
TFP
Output
0.24
0.65
2.54
3.48
2.51
1.07
0.75
4.33
2.12
-0.01
0.63
2.75
0.83
1.82
3.23
5.90
3.74
0.19
-3.53
0.42
Construction
SOURCES OF MALAYSIA’S ECONOMIC GROWTH
22
International Total Factor Productivity Comparison
Cross country comparison among the Asian economies for the period 2002-2011 shows Malaysia registered a TFP growth of 1.7%, which was higher than Thailand (0.9%), Indonesia (1.2%), Japan (0.6%) and Vietnam (-0.6%). However countries such as China (3.9%), South Korea (2.4%), Singapore (2.4%) and India (2.3%) registered higher TFP growth in relation to Malaysia.
Sources of Output Growth in Selected Countries
TFP is driven by the catching up phenomenon associated with the gradual adoption of new vintage technologies. Quality of workforce assumes a prominent role in facilitating innovation and is effects are indicated by improvement in labour productivity. Industries adopting ICT intensive technologies and high quality workforce appear to exhibit higher TFP growth.
Emerging economies, such as China, Vietnam, India, Indonesia, Thailand and Malaysia recorded a high contribution of labour quantity as the main source of input to output growth. During the period 2002-2011, Singapore labour quantity contributed significantly at 2.3% within the output growth of 6.3% (Figure 2.4). During the same period, emerging countries which record high contribution of labour quantity to output growth, were Vietnam (1.4%), India (1.4%), Thailand (1.3%), Indonesia (1.2%), Malaysia (1.2%) and China (0.8%). Selected developed Asian countries such as Japan and South Korea recorded a decline in labour quantity by 0.4% and 0.1% and increased in labour quality by 0.3% and 0.5% respectively.
Labour quality is measured by a weighted summation of the percentage of employment in low, medium and high skilled levels using relative wages as weights for the three skill levels respectively. During the period of 2002-2011, Malaysia recorded labour quality growth of 0.2%, lower than Singapore (0.6%), Thailand (0.5%), Japan (0.3%) and South Korea (0.3%) but higher than Vietnam (0.1%). In term of contribution to output growth, Japan recorded higher contribution of 45.3%, while Malaysia, Singapore, Thailand and South Korea contributed 4.0%, 9.7%, 11.2% and 11.7% respectively.
Non-ICT capital remains a major source of output growth for emerging economies. During the period 2002-2011, the higher output growth of 10.7% and 7.2% in China and Vietnam were largely due higher contribution of non-ICT capital at 5.6% and 5.0% respectively. For Malaysia, the output growth of 5.1% was due to rise in non-ICT contribution at 1.2%. For selected Asian developed countries such as Singapore, South Korea and Japan, the contribution from non-ICT capital was 0.6%, 1.1% and 0.1% respectively (Figure 2.4).
The growth in ICT capital of selected countries during the period 2002-2011, showed that Vietnam, China and Malaysia recorded higher ICT capital growth at 1.2%, 1.1% and 0.9% respectively. However the percentage contribution of ICT capital to the output growth was low with Vietnam (17.2%), China (10.8%) and Malaysia (17.2%), relatively to Japan, which grew at 0.2% and accounted for 32.4% to the output growth of 0.6%. Japan started investing heavily in ICT capital much earlier than any Asian economy. For example, in 2002, the contribution of ICT capital in Japan was 52.5% to total capital

CHAPTER 2
23
investment. Investment in ICT capital is vital in order to benefit from advancement in ICT. Unlike technological advancement in the past, which were largely confined to manufacturing, ICT capital is a technology that can permeate the economy and bring about significant production gains in trade, finance, transport and communication.
Total Factor Productivity Growth for Future Direction
The transformation to a high-income nation will be supported with TFP growth. As the economy moves towards an innovation-based economy, it is imperative that competitiveness and higher economic growth be sustained. TFP growth in turn, requires several factor inputs to be fulfilled such as:
• Human Capital Development
In order to obtain a high level of TFP growth, it is necessary to have competitive and highly skilled human capital. In the era of rapid changes, human capital development programmes emphasising on training skilled workers with a mix of critical and applied skills required by the industries and ‘lifelong learning’ in the economy is pertinent. Other factors to consider in driving toward a strong TFP growth include examining the business hiring and training practices, the structure of its operations and its systems for rewarding their employees for their contributions and efforts. Hence a flexibility labour market and promoting greater understanding between employers and employees are crucial to improve long-term TFP performance.
Figure 2.4: Contribution of TFP, Labour, Non-ICT Capital and ICT Capital to the Economic Growth (%)
Source: The Conference Board Total Economy Data based
China India Indonesia Japan Malaysia Singapore South Korea Thailand Vietnam
Labour Quantity 0.75 1.39 1.08 -0.55 1.19 2.34 -0.15 1.26 1.41
Non-ICT Capital 5.36 3.22 2.35 0.12 1.20 0.64 1.05 1.29 5.03
ICT Capital 1.14 0.84 0.67 0.21 0.84 0.36 0.33 0.53 1.20
Labour Quality 0.18 0.18 0.20 0.31 0.20 0.61 0.48 0.50 0.13
TFP 3.90 2.26 1.20 0.60 1.68 2.39 2.42 0.92 -0.62
VIETNAMTHAILAND
SOUTH KOREASINGAPORE
MALAYSIAJAPAN
INDONESIAINDIA
CHINA
-2.0 0 2.0 4.0 6.0 10.08.0 12.0Percent
SOURCES OF MALAYSIA’S ECONOMIC GROWTH
24
• Enhancing Technological Capabilities
ICT technology can permeate the economy and bring significant productivity gains in all economic sectors. Malaysia’s continued economic growth depends upon improvement in technological progress and capital deepening. This means that more investment of new technologies such as ICT capital have to be allocated to each unit of labour as well as to broaden the knowledge-based of the workers.
• Intensifying Demand
Malaysia’s future prosperity is inextricably linked to its long-term productivity and its trade performance in the global market. The increasingly competitive nature of the global market demands that our businesses must operate at a optimum level in order to be efficient and effectively. To compete at the global arena, industries must adopt effective marketing strategies, develop new innovative products and services and branding to develop consumer loyalty. This can be achieved only through a knowledge-based workforce who are able to conduct research, innovate and introduce new production methods and organisational systems that will lead to higher TFP.
• Efficient Allocation of Resources Among the Sector
Better allocation of resources implies more output from a given amount of input leading to higher TFP. The financial and global economic crisis of 2008 had shown the need for Malaysia to adopt a rebalancing strategy. This means that the Malaysian economy has to be oriented towards domestic demand and a
more efficient allocation of resources among the various sectors have to be undertaken. While the export-oriented industries cannot be ignored, it is imperative that the small and medium sized industries (SMIs) be encouraged to continue serving the domestic market and if possible, the export market.
• Reducing Business Rule and Regulation
Rules and regulations help to correct market failures in striving towards achieving broader social objectives. However excessive regulation can distort and impede sound business decisions to the detriment of economic performance. The effect of excessive regulation is reflected through consumers having to pay higher prices and being offered with lesser choice of products; for employees, it means fewer jobs and lower real wages and for shareholders, it results in lower return on investment and fewer funds for retirement. As such, it is essential that Government establishes a regulatory framework which promotes competition, innovation, investment, supports the formation of skills in the labour market and contributes to TFP growth.
• Innovation and Creativity
Innovation is another key driver of TFP growth. Developed countries such as Finland, Sweden, Japan and United State have achieved higher levels of R&D intensity and are leaders in innovation leading to higher TFP achievement. Innovation includes the development of new technology, adaptation of existing technology to new use. Innovative and creativity activities help to produce higher value added products and services which enhance competitiveness.

CHAPTER 2
25
“Capital investment and team spirit towards higher TFP growth”

26 Productivity Report 2011/2012
Box 2.1: Productivity Measurement Using the KLEMS Approach
Malaysia’s productivity and competitiveness depends on new initiatives driven by improvement in quality of capital and the quality of her workforce. With intense competition for Foreign Direct Investment (FDI) and the rising of new market economies, this would compel Malaysia to source for new areas of growth in generating more value added to the economy.
Currently, output and employment are expanding in high-technology industries such as computers and electronics as well as knowledge-based services such as financial and other business services. More resources are being utilised in the production and development of new technologies, in particular, on ICT. Computers and related equipment are now the fastest growing segments of tangible investment. At the same time, a polarisation in Malaysia labour markets is taking place as skilled labour is in demand whereas demand for low-skilled workers is declining.
As such, new methods to measure TFP and its contributing factors is imperative so that more effective strategic measures can be identified to provide inputs for policy evaluation, in particular, for the assessment of the goals concerning competitiveness and economic growth. In view of these dynamic changes, TFP analysis will require a new paradigm and methodology for its measurement.
Measuring TFP using the KLEMS (Capital (K), Labour (L), Energy (E), Material (M) and Services (S)) approach will able to identify the contribution of other input factors, such as material, energy and bought in services besides capital and labour. Detailed analysis of these factors such as impact of investment in education, shift in economic activities can be further analysed by using this methodology. KLEMS is based on the growth accounting methodology which allows the users to assess the relative importance of labour, capital and intermediate inputs to growth and to derive measures of TFP growth.
Accurate measures of labour and capital inputs are based on a breakdown of aggregate hours worked or employment and the aggregate capital stock into various components. Employment is cross classified by various categories of labour types such as high, semi-skilled and low skilled labour. Similarly, capital stock is classified into different asset types. Short-term assets like computers have a much higher productivity to fixed assets assets such as buildings. The contribution of intermediate inputs is broken down into the contribution of energy goods, materials and services.
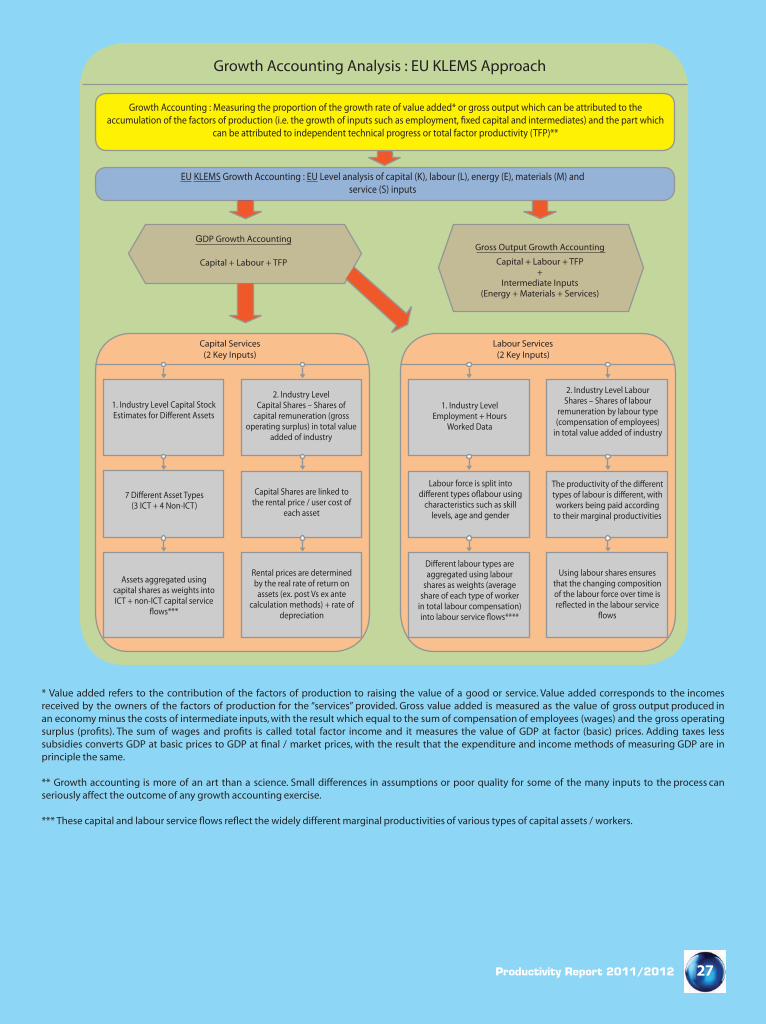
MPC KLEMS project is an on-going effort in which the data are regularly updated and make available for public usage as well as for international comparison. International comparisons also reveal sizeable disparities in investments with regard to quality and quantity of capital and labour. The benefit of KLEMS is to provide better understanding for policy makers on the performance of each of the five inputs. Restrictions concerning labour and product markets, lack of openness to trade and FDI as well as barriers in terms of access to new technologies and in relation to the diffusion of innovations are the constraint towards TFP growth. Below is a chart shown the KLEMS approach used by many European countries for computing their respective TFP growth which Malaysia is adopting.
27Productivity Report 2011/2012
* Value added refers to the contribution of the factors of production to raising the value of a good or service. Value added corresponds to the incomes received by the owners of the factors of production for the “services” provided. Gross value added is measured as the value of gross output produced in an economy minus the costs of intermediate inputs, with the result which equal to the sum of compensation of employees (wages) and the gross operating surplus (profits). The sum of wages and profits is called total factor income and it measures the value of GDP at factor (basic) prices. Adding taxes less subsidies converts GDP at basic prices to GDP at final / market prices, with the result that the expenditure and income methods of measuring GDP are in principle the same.
** Growth accounting is more of an art than a science. Small differences in assumptions or poor quality for some of the many inputs to the process can seriously affect the outcome of any growth accounting exercise.
*** These capital and labour service flows reflect the widely different marginal productivities of various types of capital assets / workers.
Box 2.1: Productivity Measurement Using the KLEMS Approach
Growth Accounting Analysis : EU KLEMS Approach
Growth Accounting : Measuring the proportion of the growth rate of value added* or gross output which can be attributed to the
can be attributed to independent technical progress or total factor productivity (TFP)**
EU KLEMS Growth Accounting : EU Level analysis of capital (K), labour (L), energy (E), materials (M) and service (S) inputs
GDP Growth Accounting
Capital + Labour + TFP
Gross Output Growth Accounting
Capital + Labour + TFP+
Intermediate Inputs(Energy + Materials + Services)
Capital Services(2 Key Inputs)
Labour Services(2 Key Inputs)
1. Industry Level Capital Stock 1. Industry Level Employment + Hours
Worked Data
(3 ICT + 4 Non-ICT)
Labour force is split into
characteristics such as skill levels, age and gender
2. Industry Level Capital Shares – Shares of
capital remuneration (gross operating surplus) in total value
added of industry
2. Industry Level LabourShares – Shares of labour
remuneration by labour type (compensation of employees)
in total value added of industry
Capital Shares are linked to the rental price / user cost of
each assetworkers being paid according
to their marginal productivities
Assets aggregated using capital shares as weights into ICT + non-ICT capital service
Rental prices are determined by the real rate of return on assets (ex. post Vs ex ante
calculation methods) + rate of depreciation
aggregated using labour shares as weights (average
share of each type of worker in total labour compensation)
Using labour shares ensures that the changing composition of the labour force over time is
28 Productivity Report 2011/2012
Box 2.2: Wage Management Framework
All business communities aim to achieve successful business result and performance. This can be achieved through proper managing of employees’ performance such as planning, measuring, appraising, motivating and rewarding employees. One of the performance management system used by companies to reward employees which is based upon both company and employees’ performance is effective wage management framework. This framework will facilitate companies to remain competitive and enables employers to adjust wage costs accordingly in the event of economic downturn and motivates employees by linking rewards to company and personal performance. Performance management plays an important and crucial role in ensuring business success due to the following:
• Inculcates a performance-driven culture in the company;• Ensures every employee is aware that his performance is being measured; • Facilitates companies to structure wages to reflect value of job done by employees;• Helps in managing wages to reflect actual performance of the employees; and • Promotes transparency, mutual trust and sharing culture among management and employees
Factors which are imperative for companies to consider when implementing effective wage management include the following:
• Develop a simple and effective performance appraisal system which enables employees to see the linkage of their jobs and wages to company and their performance;
• Provide clear and specific formula for variable incentives and bonuses payment. This will certainly helps to increase employee’s performance, motivation and satisfaction;
• Establish proper wage structure for jobs. This is to avoid a seniority-based wage system that is not linked to performance or productivity of the employees;
• Able to respond in a fast changing business environment. Minimisation of employee retrenchment at bad times helps companies to maintain skilled and knowledgeable employees within the company; and
• Accesses to reliable market information of the relevant jobs. This is to avoid over-paying or under-paying for jobs and will ensure company offers competitive salaries.
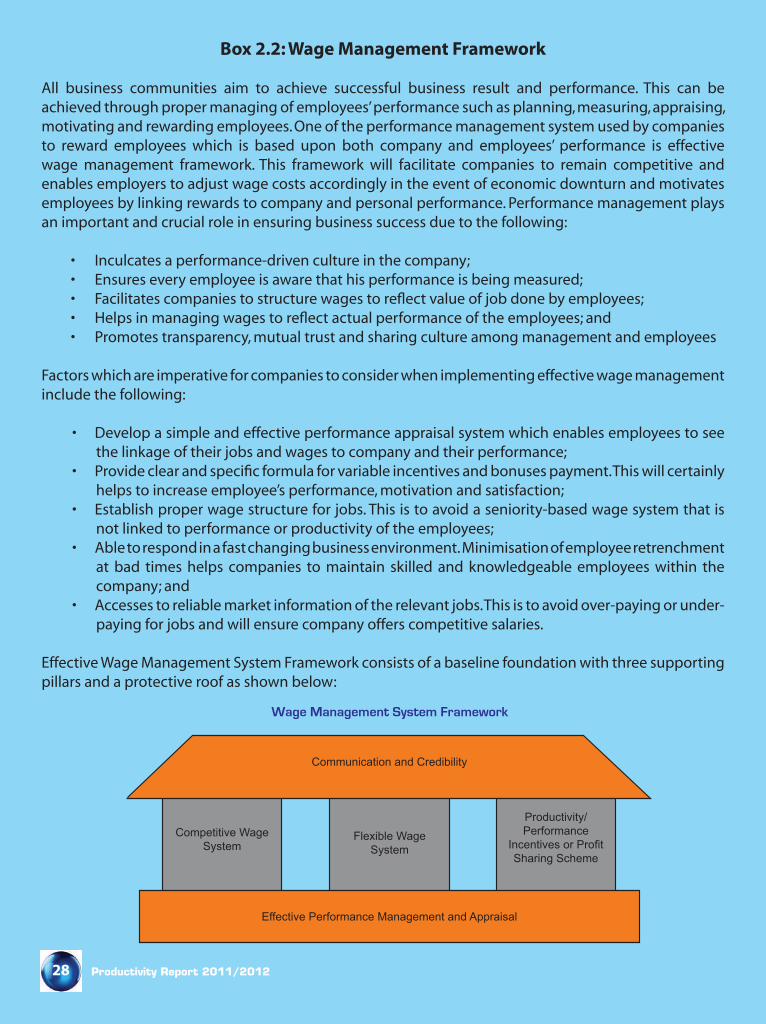
Effective Wage Management System Framework consists of a baseline foundation with three supporting pillars and a protective roof as shown below:
Steps in Developing Effective Baseline Foundation
1Establish company
Key Performance Indicators (KPls)
ò2
Cascade & align the KPls within all levels in the company
ò3
Communicate performance matters regularly
ò4
Document performancematters properly
ò5
Review performance and monitor reward framework
ò6 Determine performance/productivity-based reward system
Competitive Wage System
Flexible Wage System
Productivity/ Performance
Sharing Scheme
Communication and Credibility
Effective Performance Management and Appraisal
Wage Management System Framework
Box 2.2: Wage Management Framework

29Productivity Report 2011/2012
Baseline foundation refers to effective and motivational performance appraisal system that links individual wage to organsational performance. There are six steps in developing the baseline foundation as shown in the chart below:
• Supporting pillars ensure effective and successful implementation of Wage Management System. There are three supporting pillars namely, competitive wage system; flexible wage system and productivity/performance incentive or profit-sharing scheme. i) Competitive wage system has the following characteristics:
a. Market Benchmarking of wage policy in similar industry is made available;b. Competitive Wage Structure whereby salary is based on employees performance and
productivity and not seniority based; andc. Productivity-linked Wage System where wage increase is based on individual performance
and incentive payment linked to company and individual performance.ii) Flexible wage system to respond to changes in business environment with the following attributes:
a. Flexible wage system which is susceptible to changing business environment; andb. It rewards employees based on performance which incorporates flexible incentives that is
linked individual performance and productivity.iii) Productivity/Performance Incentives or Profit-Sharing Scheme has the following characteristics:
a. Motivates employees to achieve their goals and creates wealth for the company; andb. Incorporates variable components that include variable bonus based on profitability,
performance or productivity measurement and done annually.
• Protective Roof where wage is an important component and any change to the wage system should be managed with utmost care and sensitivity. It involves two main characteristics such as:• Management practices an open door policy to ensure that all employees or union understand
how their wages are linked to the company’s performance and productivity; and• Credibility where productivity or performance based wage system is implemented with consensus
from both management and employees. Any change to the remuneration will be discussed and agreed upon by various stakeholders before implementation.
Steps in Developing Effective Baseline Foundation
1Establish company
Key Performance Indicators (KPls)
ò2
Cascade & align the KPls within all levels in the company
ò3
Communicate performance matters regularly
ò4
Document performancematters properly
ò5
Review performance and monitor reward framework
ò6 Determine performance/productivity-based reward system
Competitive Wage System
Flexible Wage System
Productivity/ Performance
Sharing Scheme
Communication and Credibility
Effective Performance Management and Appraisal
Wage Management System Framework
Box 2.2: Wage Management Framework


CHAPTER 3
MALAYSIA AND INTERNATIONAL COMPETITIVENESS
MALAYSIA AND INTERNATIONAL COMPETITIVENESS
32
Overview
As a result of globalisation, countries are competing with each other to maintain its global competitiveness. They compete for export market, technology, skills, and investment for economic growth and to improve their standard of living. The current global uncertainty has compelled Malaysia to strive for economic resilience in order to sustain its competitiveness in the global economy.
Looking ahead, Malaysia is now on a journey towards achieving a developed nation by 2020. The Government has been implementing various transformation programmes in major areas of economics and social to be more competitive for long-term sustainability which is clearly stated in the Tenth Malaysia Plan (2011 – 2015).
The Importance of Competitiveness
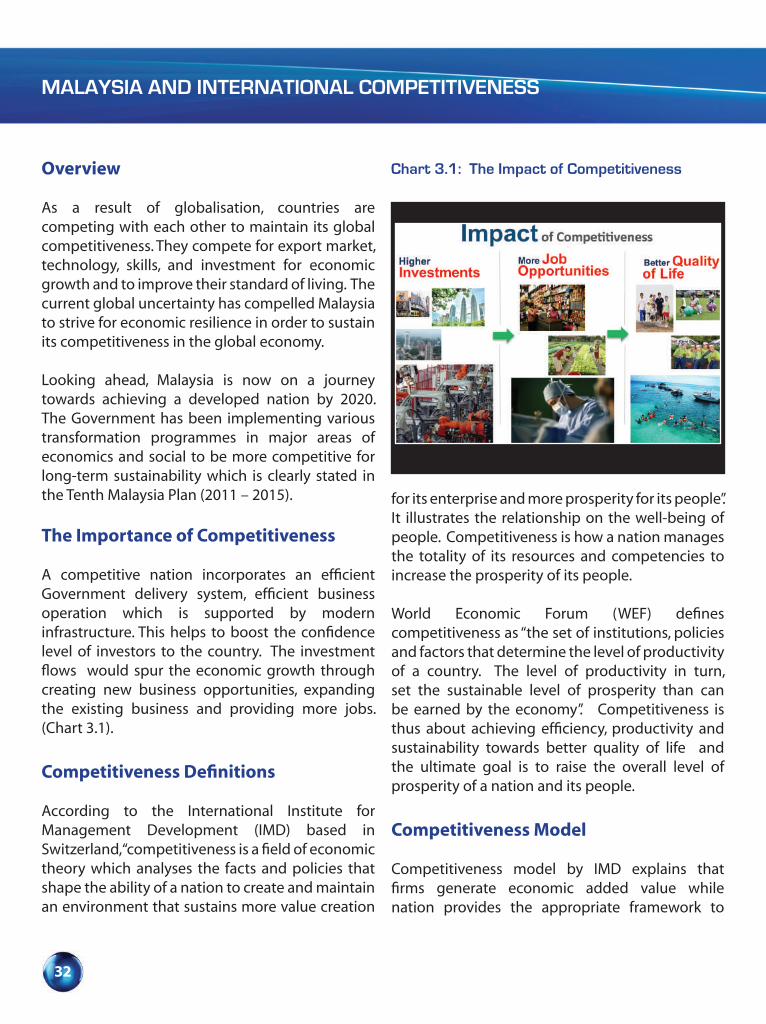
A competitive nation incorporates an efficient Government delivery system, efficient business operation which is supported by modern infrastructure. This helps to boost the confidence level of investors to the country. The investment flows would spur the economic growth through creating new business opportunities, expanding the existing business and providing more jobs. (Chart 3.1).
Competitiveness Definitions
According to the International Institute for Management Development (IMD) based in Switzerland, “competitiveness is a field of economic theory which analyses the facts and policies that shape the ability of a nation to create and maintain an environment that sustains more value creation
for its enterprise and more prosperity for its people”. It illustrates the relationship on the well-being of people. Competitiveness is how a nation manages the totality of its resources and competencies to increase the prosperity of its people.
World Economic Forum (WEF) defines competitiveness as “the set of institutions, policies and factors that determine the level of productivity of a country. The level of productivity in turn, set the sustainable level of prosperity than can be earned by the economy”. Competitiveness is thus about achieving efficiency, productivity and sustainability towards better quality of life and the ultimate goal is to raise the overall level of prosperity of a nation and its people.
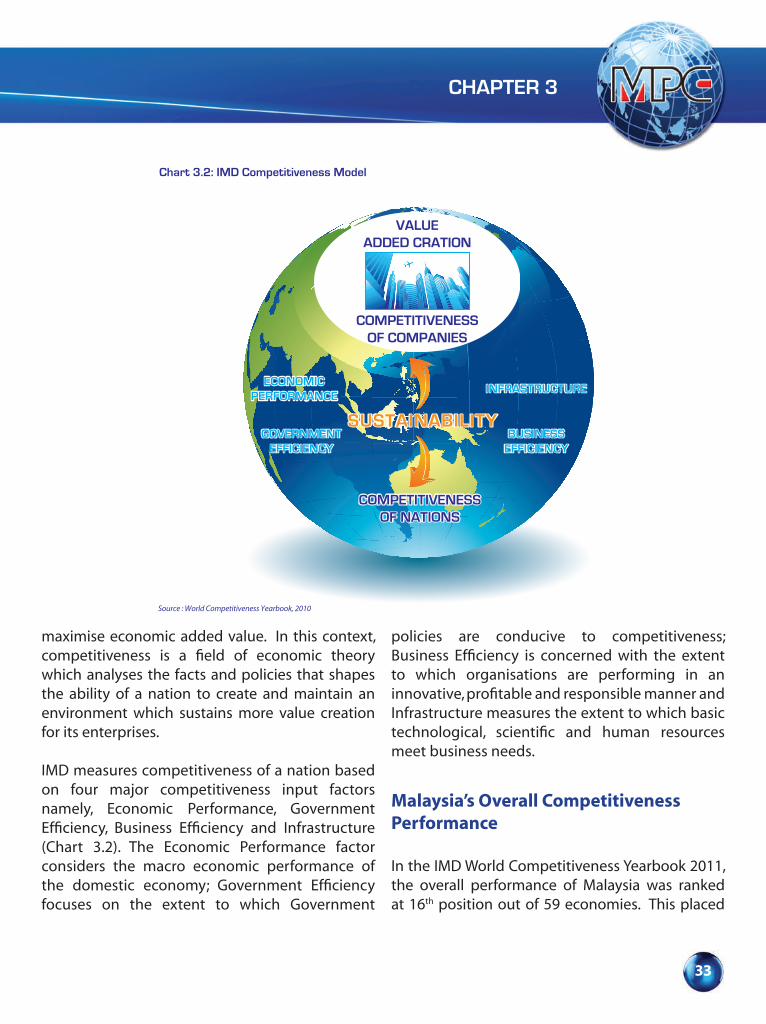
Competitiveness Model
Competitiveness model by IMD explains that firms generate economic added value while nation provides the appropriate framework to
Chart 3.1: The Impact of Competitiveness
CHAPTER 3
33
maximise economic added value. In this context, competitiveness is a field of economic theory which analyses the facts and policies that shapes the ability of a nation to create and maintain an environment which sustains more value creation for its enterprises.
IMD measures competitiveness of a nation based on four major competitiveness input factors namely, Economic Performance, Government Efficiency, Business Efficiency and Infrastructure (Chart 3.2). The Economic Performance factor considers the macro economic performance of the domestic economy; Government Efficiency focuses on the extent to which Government
policies are conducive to competitiveness; Business Efficiency is concerned with the extent to which organisations are performing in an innovative, profitable and responsible manner and Infrastructure measures the extent to which basic technological, scientific and human resources meet business needs.
Malaysia’s Overall Competitiveness Performance
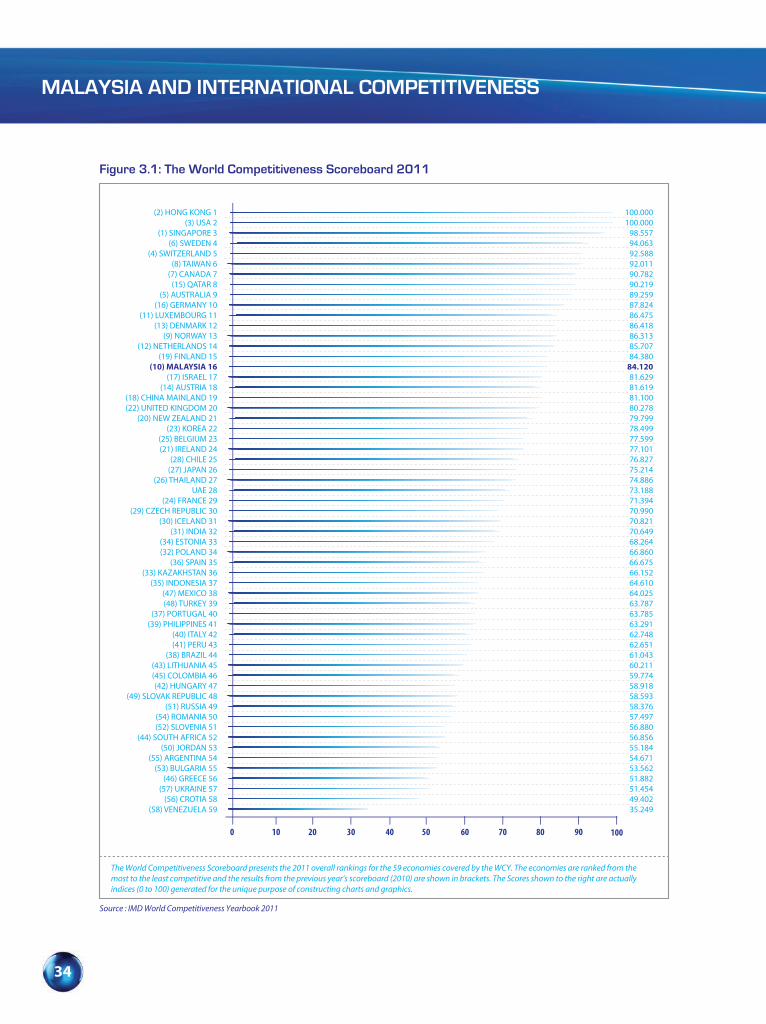
In the IMD World Competitiveness Yearbook 2011, the overall performance of Malaysia was ranked at 16th position out of 59 economies. This placed
Source : World Competitiveness Yearbook, 2010
ECONOMICPERFORMANCE
GOVERNMENTEFFICIENCY
BUSINESSEFFICIENCY
INFRASTRUCTURE
SUSTAINABILITY
COMPETITIVENESSOF NATIONS
Chart 3.2: IMD Competitiveness Model
VALUEADDED CRATION
COMPETITIVENESSOF COMPANIES
MALAYSIA AND INTERNATIONAL COMPETITIVENESS
34
The World Competitiveness Scoreboard presents the 2011 overall rankings for the 59 economies covered by the WCY. The economies are ranked from themost to the least competitive and the results from the previous year’s scoreboard (2010) are shown in brackets. The Scores shown to the right are actuallyindices (0 to 100) generated for the unique purpose of constructing charts and graphics.
Figure 3.1: The World Competitiveness Scoreboard 2011
(2) HONG KONG 1(3) USA 2
(1) SINGAPORE 3(6) SWEDEN 4
(4) SWITZERLAND 5(8) TAIWAN 6
(7) CANADA 7(15) QATAR 8
(5) AUSTRALIA 9(16) GERMANY 10
(11) LUXEMBOURG 11(13) DENMARK 12
(9) NORWAY 13(12) NETHERLANDS 14
(19) FINLAND 15(10) MALAYSIA 16
(17) ISRAEL 17(14) AUSTRIA 18
(18) CHINA MAINLAND 19(22) UNITED KINGDOM 20
(20) NEW ZEALAND 21(23) KOREA 22
(25) BELGIUM 23(21) IRELAND 24
(28) CHILE 25(27) JAPAN 26
(26) THAILAND 27UAE 28
(24) FRANCE 29(29) CZECH REPUBLIC 30
(30) ICELAND 31(31) INDIA 32
(34) ESTONIA 33(32) POLAND 34
(36) SPAIN 35(33) KAZAKHSTAN 36
(35) INDONESIA 37(47) MEXICO 38(48) TURKEY 39
(37) PORTUGAL 40(39) PHILIPPINES 41
(40) ITALY 42(41) PERU 43
(38) BRAZIL 44(43) LITHUANIA 45(45) COLOMBIA 46(42) HUNGARY 47
(49) SLOVAK REPUBLIC 48(51) RUSSIA 49
(54) ROMANIA 50(52) SLOVENIA 51
(44) SOUTH AFRICA 52(50) JORDAN 53
(55) ARGENTINA 54(53) BULGARIA 55
(46) GREECE 56(57) UKRAINE 57
(56) CROTIA 58(58) VENEZUELA 59
0 10 20 30 40 50 60 70 80 90 100
Source : IMD World Competitiveness Yearbook 2011
100.000100.000
98.55794.06392.58892.01190.78290.21989.25987.82486.47586.41886.31385.70784.380
84.12081.62981.61981.10080.27879.79978.49977.59977.10176.82775.21474.88673.18871.39470.99070.82170.64968.26466.86066.67566.15264.61064.02563.78763.78563.29162.74862.65161.04360.21159.77458.91858.59358.37657.49756.88056.85655.18454.67153.56251.88251.45449.40235.249

CHAPTER 3
35
Malaysia among the top 20 with countries such as Canada, Denmark, Finland, Norway and Australia (Figure 3.1). The five most competitive economies were Hong Kong, United States, Singapore, Sweden and Switzerland where these economies were characterised by highly sophisticated and innovative companies, strong R&D collaboration between the business sector and universities as well as supported by world class infrastructure. Malaysia was ranked 5th position ahead of China, New Zealand, Korea,
Japan, Thailand, India and Indonesia among 13 Asia-Pacific countries (Figure 3.2).
Malaysia’s Performance With Selected Countries
Malaysia’s performance with selected Asian and OECD countries is based on the four competitiveness input factors namely, Economic Performance, Government Efficiency, Business Efficiency and Infrastructure as well as their sub-factors.
Figure 3.2: Competitiveness Ranking by Asia-Pacific Region
The World Competitiveness Ranking 2011 (Asia - Paci�c)
Source : IMD World Competitiveness Yearbook 2011
HONG KONG 1SINGAPORE 2
TAIWAN 3AUSTRALIA 4MALAYSIA 5
CHINA MAINLAND 6NEW ZEALAND 7
KOREA 8JAPAN 9
THAILAND 10INDIA 11
INDONESIA 12PHILIPPINES 13
0 10 20 30 40 50 60 70 80 90 100
100.0098.55792.01189.259
84.12081.10079.79978.49975.21474.88670.64964.61063.291

MALAYSIA AND INTERNATIONAL COMPETITIVENESS
36
Economic Performance
Economic Performance measures macro economic evaluation of the domestic economy. Malaysia was ranked at 7th position in 2011. This favorable performance was attributed by the favorable achievement in its sub-factors namely, International Trade (3rd), Prices (6th), International Investment (13th) and Employment (19th). However Domestic Economy sub-factor was ranked at 28th position. This was attributed to lower household and Government consumption expenditure as well as lower GDP per capita.
Malaysia experienced strong performance in external trade, private investment and trade account surplus in 2011. This was justified by a total trade of RM1.3 trillion attributed by expansion in both export and import by 8.7% valued at RM694.5 billion and 8.5% valued at RM574.2 billion respectively. Total trade of Malaysia was 1.8% above the world trade average.
The increase in export was mainly contributed by liquefied natural gas, palm oil, machinery, appliances and parts, rubber products, petroleum, chemical and chemical products, iron and steel product as well as processed food where the major markets were Australia, Japan, China, Indonesia and South Korea which accounted for 71.3% of its total export. China was the largest export destination which recorded a growth of 13.9% amounting to RM91.3 billion in 2011.
Malaysia’s foreign direct investments (FDI) of RM32.9 billion in 2011 had also exceeded the RM29.3 billion recorded in 2010. This reflected the rising investors’ confidence to the economy. Japan led the pack of foreign investors with investment
totaling RM10.1 billion, followed by South Korea (RM5.2 billion), Singapore (RM2.5 billion) and Saudi Arabia (RM2.2 billion).
Trade surplus rose 9.4% to RM120 billion and this was the 14th consecutive year of trade surplus since 1998. Malaysia’s trade performance remained strong despite the slow economic recovery in the USA, debt crisis in Europe and other global uncertainties as it managed to reduce fiscal deficit to 5% of GDP in 2011 (2010 : 5.6%).
Countries such as, the Unites States, Qatar and China were among the top three most competitive nations in Economic Performance (Figure 3.3). Both the United States and China had huge domestic economy receiving FDI at USD345.6 billion and USD49.3 billion respectively. The strong Economic Performance achieved by Qatar was mainly due to its exceptional wealth as an oil-based economy as reflected by its GDP per capita at USD88,160 which was among the world’s highest income per capita.
China, as the world’s largest exporter with a total export amounting USD1,577.8 billion in 2010 was the world’s second largest export contributor at 9.3% of total export share. As one of the fastest growing countries, China registered high GDP growth averaging more than 10% annually from 2001-2010. It also experienced strong domestic economy with high domestic savings rate at 51.4% and a surplus current account balance of 5.2% of GDP with huge investment from abroad amounting USD105.7 billion in 2010. Its productivity grew more than 8.0% since 2002.
Hong Kong, a gateway to China continues to be the largest venture capital centre in Asia. It is also the third largest stock and foreign exchange market

CHAPTER 3
37
Figure 3.3: Economic Performance
USA 1QATAR 2
CHINA MAINLAND 3HONG KONG 4
SINGAPORE 5GERMANY 6
MALAYSIA 7TAIWAN 8
LUXEMBOURG 9THAILAND 10
SWEDEN 11CANADA 12
AUSTRALIA 13UNITED KINGDOM 14
SWITZERLAND 15MEXICO 16
CHILE 17INDIA 18
NETHERLANDS 19PERU 20
UAE 21FRANCE 22
BELGIUM 23AUSTRIA 24
KOREA 25NORWAY 26
JAPAN 27IRELAND 28
PHILIPPINES 29BRAZIL 30
POLAND 31INDONESIA 32
NEW ZEALAND 33CZECH REPUBLIC 34
KAZAKHSTAN 35ISRAEL 36
FINLAND 37ITALY 38
ARGENTINA 39DENMARK 40
COLOMBIA 41RUSSIA 42
SLOVENIA 43HUNGARY 44
UKRAINE 45TURKEY 46
SPAIN 47BULGARIA 48ROMANIA 49
PORTUGAL 50ESTONIA 51ICELAND 52
LITHUANIA 53SOUTH AFRICA 54
JORDAN 55CROATIA 56
SLOVAK REPUBLIC 57GREECE 58
VENEZUELA 59 0 10 20 30 40 50 60 70 80 90 100
Source : IMD World Competitiveness Yearbook 2011
Macro- economic evaluation of the domestic economy
2011100.00
95.0183.7782.1279.8072.67
71.4471.1668.6468.1065.2564.7663.9362.3562.2060.4460.2159.7959.7158.9957.6957.5357.2256.9152.4151.7850.8650.5450.5349.9749.6849.4549.3449.0848.5548.3446.0445.3945.3545.2742.7842.4140.6040.5440.1838.4837.6837.5235.8335.4735.1933.4533.1732.1131.3629.7927.8018.95
0

MALAYSIA AND INTERNATIONAL COMPETITIVENESS
38
in Asia. Hong Kong is a highly attractive market for foreign direct investment, which received FDI amounting USD76.1 billion in 2010, the biggest receiver among Asian countries.
Government Efficiency
Government plays a crucial role for economic development, providing security including domestic and international, protecting property rights and enforcing laws. Government Efficiency aims to measure the extent to which Government policies are conducive to competitiveness. Malaysia was ranked at 17th position (Figure 3.4). This achievement was contributed by sound Fiscal Policy (9th) with low tax burden in collected capital and property taxes (0.01% of GDP), low indirect tax revenue at 4.1% of GDP, moderate performance in Institutional Framework (17th) and resilient Public Finance (19th). Malaysia was ranked at 29th for Societal Framework and 30th position for Business Legislation.
Government Efficiency is a key determinant for economic recovery and future competitiveness of nations especially in the context of managing economic crisis like in the USA and European countries. To cushion the impact of such economic crisis, various initiatives had been undertaken by the Government to enhance delivery system, increase transparency and modernising business regulation. To combat corruption, the Whistleblower Act was established and as a deterrent, the identified offenders will be listed in the Malaysia Anti-Corruption Commission (MACC) website. On top of this, other initiatives to enhance transparency include online tender listing, online Government contract, e-payment facilities and registering properties improvement.
Hong Kong and Singapore were among the top two economies in Government Efficiency with profound institutions that are more transparent, less bureaucratic and efficient in Government delivery system. These economies have the most business-friendly regulations as reflected in their ranking in the ease of doing business where Singapore was the top and Hong Kong at 2nd position among 183 countries in the World Bank “Doing Business 2012”.
Singapore has also been assessed as the best in the world for its Government Efficiency where combating corruption is a priority. This includes declaration of assets and investment, non-acceptance of gifts as well as constant reviewing of work methods to improve work process, procedures and avoid delays in granting of permits, licences and to expedite approvals.
Business Efficiency
Business Efficiency measures the extent to which enterprises are performing in an innovative, profitable and responsible manner. In this factor, Malaysia was ranked at 14th position out of 59 economies. The performance of Malaysia in Business Efficiency was supported by good Management Practices (6th), positive Attitudes and Values (7th), strong Labour Market (8th), strong Financial fundamentals (17th) reflecting banking efficiency. However, the Productivity and Efficiency sub-factor, was ranked at 27th position. In this regard, Malaysia needs to improve further the productivity level across various economic sectors in order to achieve high income economy.
To further enhance Business Efficiency of Malaysia, the Government has set up a Special Task Force to Facilitate Business (PEMUDAH) in 2007 through
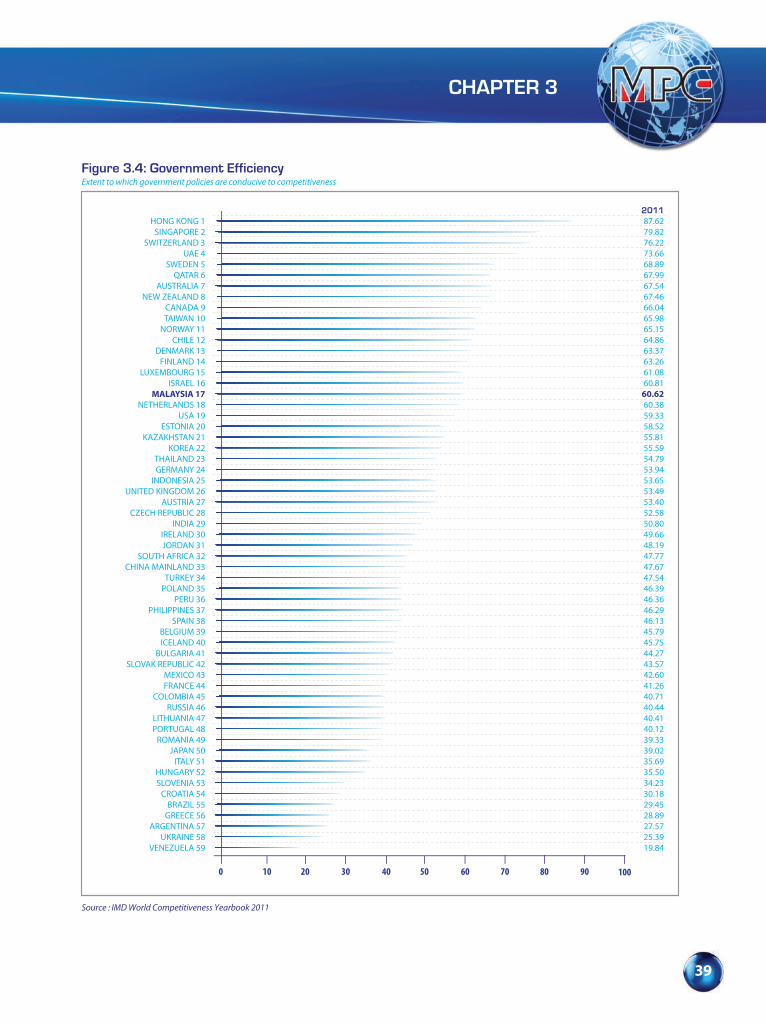
CHAPTER 3
39
HONG KONG 1SINGAPORE 2
SWITZERLAND 3UAE 4
SWEDEN 5QATAR 6
AUSTRALIA 7NEW ZEALAND 8
CANADA 9TAIWAN 10
NORWAY 11CHILE 12
DENMARK 13FINLAND 14
LUXEMBOURG 15ISRAEL 16
MALAYSIA 17NETHERLANDS 18
USA 19ESTONIA 20
KAZAKHSTAN 21KOREA 22
THAILAND 23GERMANY 24
INDONESIA 25UNITED KINGDOM 26
AUSTRIA 27CZECH REPUBLIC 28
INDIA 29IRELAND 30JORDAN 31
SOUTH AFRICA 32CHINA MAINLAND 33
TURKEY 34POLAND 35
PERU 36PHILIPPINES 37
SPAIN 38BELGIUM 39ICELAND 40
BULGARIA 41SLOVAK REPUBLIC 42
MEXICO 43FRANCE 44
COLOMBIA 45RUSSIA 46
LITHUANIA 47PORTUGAL 48
ROMANIA 49JAPAN 50
ITALY 51HUNGARY 52SLOVENIA 53
CROATIA 54BRAZIL 55
GREECE 56ARGENTINA 57
UKRAINE 58VENEZUELA 59
0 10 20 30 40 50 60 70 80 90 100
Source : IMD World Competitiveness Yearbook 2011
201187.6279.8276.2273.6668.8967.9967.5467.4666.0465.9865.1564.8663.3763.2661.0860.81
60.6260.3859.3358.5255.8155.5954.7953.9453.6553.4953.4052.5850.8049.6648.1947.7747.6747.5446.3946.3646.2946.1345.7945.7544.2743.5742.6041.2640.7140.4440.4140.1239.3339.0235.6935.5034.2330.1829.4528.8927.5725.3919.84
Figure 3.4: Government EfficiencyExtent to which government policies are conducive to competitiveness
MALAYSIA AND INTERNATIONAL COMPETITIVENESS
40
close collaboration between public and private sectors. The Task Force focuses on improving Malaysian business environment, enhancing transparency of the public and private sector, liberalising services as well as reducing the number of business-related licences.
A lot of improvements have been achieved by the Task Force such as eliminating or simplifying licences under various ministries and is expected to reduce business licensing compliance cost. The Task Force also looks into the implementation of e-payment facilities in federal, states agencies and local authorities as well as Government–Linked Companies (GLCs) toward enhancing Government delivery system.
The top three most competitive economies in this factor were Hong Kong, Singapore and Taiwan (Figure 3.5). These countries experienced a very dynamic business development, offering conducive business environment with modern business regulations, low tariff and trade barriers as well as efficient goods markets. Singapore performed well in many areas such as labor market, financial sector, services sector productivity and advocates free-market policies and practices.
Infrastructure
Malaysia was ranked at 27th position among 59 countries in Infrastructure factor which measures to what extent basic, technological, scientific and human resources meet the needs of business enterprise. Malaysia’s Infrastructure performance was contributed by its sub-factors namely, Basic Infrastructure (13th), Technological Infrastructure (18th), Scientific Infrastructure (29th), Health and Environment (36th) and Education (35th).
The Government continues to upgrade physical infrastructure to enhance access and connectivity as it plays an important role in supporting the economic development which directly affect domestic businesses, export sector, tourism and investment. As Malaysia aspires to be a developed nation, it needs a strong infrastructure base which emphasises on development and maintenance, advanced infrastructure to support an efficient distribution network and sophisticated transportation system for economic activities.
Nations leading in competitiveness focus highly on developed innovative information and communications technology. In line with this, the Government aims to increase broadband penetration with the National Broadband Initiatives (NBI) and High-Speed Broadband (HSBB) as key economic enablers towards economic growth and enhance connectivity and productivity.
Additionally, the Government has set up several agencies such as Agensi Inovasi Malaysia (AIM) and Talent Corporation. Talent Corporation aims to attract, generate and retain talent to reduce the problem of brain drain. Unit Inovasi Khas (UNIK) was established to identify R&D projects with potentials to be commercialised. Through these initiatives, hopefully, they will support future growth of the National Key Economic Areas (NKEAs) via the enhancement of transformation process towards an innovation-driven economy.
The top three countries for Infrastructure were the United States, Sweden and Denmark (Figure 3.6). These countries have good basic infrastructure, technological and scientific infrastructure as well as excellent education system in tandem with their status as developed economies. These

CHAPTER 3
41
HONG KONG 1SINGAPORE 2
TAIWAN 3SWEDEN 4
QATAR 5DENMARK 6AUTRALIA 7
CANADA 8LUXEMBOURG 9
USA 10SWITZERLAND 11
NORWAY 12NETHERLANDS 13
MALAYSIA 14FINLAND 15
GERMANY 16ISRAEL 17
IRELAND 18THAILAND 19
AUSTRIA 20CHILE 21INDIA 22
BELGIUM 23NEW ZEALAND 24
CHINA MAINLAND 25KOREA 26JAPAN 27
UNITED KINGDOM 28BRAZIL 29
TURKEY 30PHILIPPINES 31
ESTONIA 32INDONESIA 33
ICELAND 34CZECH REPUBLIC 35
KAZAKHSTAN 36COLOMBIA 37
SPAIN 38PERU 39
SOUTH AFRICA 40POLAND 41
SLOVAK REPUBLIC 42MEXICO 43
PORTUGAL 44LITHUANIA 45
UAE 46FRANCE 47
ITALY 48ROMANIA 49HUNGARY 50
ARGENTINA 51JORDAN 52GREECE 53RUSSIA 54
UKRAINE 55SLOVENIA 56BULGARIA 57
VENEZUELA 58CROTIA 59
0 10 20 30 40 50 60 70 80 90 100
Source : IMD World Competitiveness Yearbook 2011
201182.2378.7577.7977.2173.4273.3971.0570.6269.7169.3968.6268.5067.51
67.0566.5264.1563.4763.2162.2761.0960.1459.2456.6756.3256.1455.7355.6153.6452.0551.6451.5449.1649.1647.0846.8445.8545.5643.9843.0341.9841.8341.5940.1439.3039.1238.0835.7235.6935.6831.0429.6829.4628.9226.5726.1521.6820.8520.1918.77
Figure 3.5: Business EfficiencyExtent to which enterprises are performing in an innovative, pro�table and responsible manner
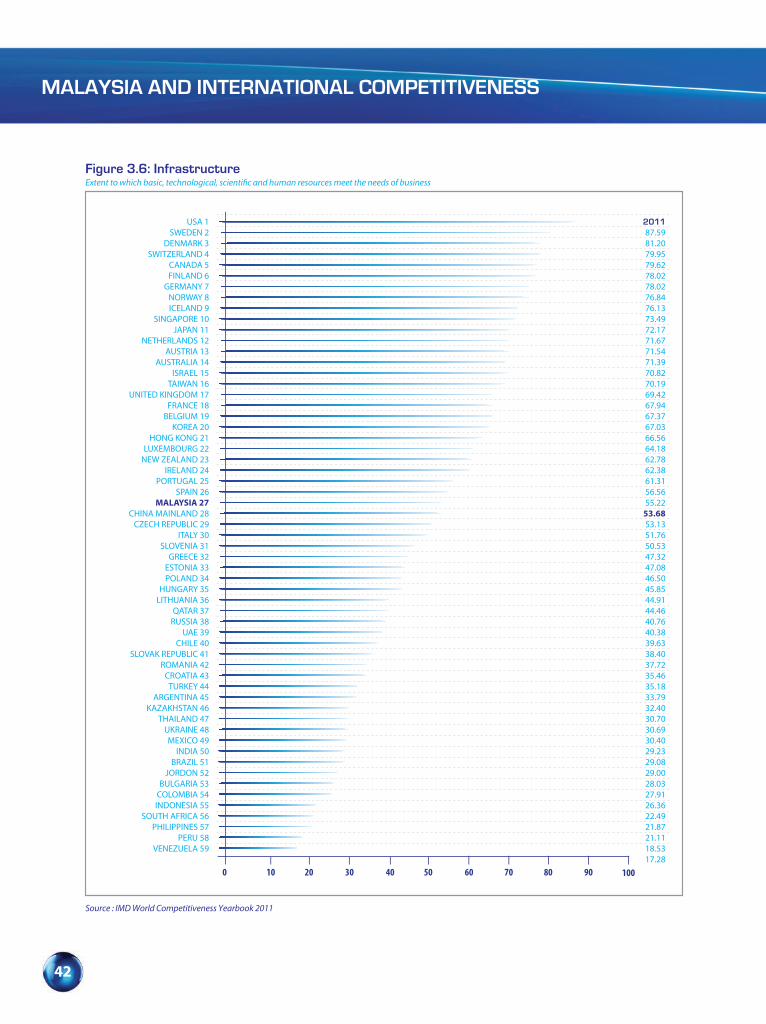
MALAYSIA AND INTERNATIONAL COMPETITIVENESS
42
USA 1SWEDEN 2
DENMARK 3SWITZERLAND 4
CANADA 5FINLAND 6
GERMANY 7NORWAY 8ICELAND 9
SINGAPORE 10JAPAN 11
NETHERLANDS 12AUSTRIA 13
AUSTRALIA 14ISRAEL 15
TAIWAN 16UNITED KINGDOM 17
FRANCE 18BELGIUM 19
KOREA 20HONG KONG 21
LUXEMBOURG 22NEW ZEALAND 23
IRELAND 24PORTUGAL 25
SPAIN 26MALAYSIA 27
CHINA MAINLAND 28CZECH REPUBLIC 29
ITALY 30SLOVENIA 31
GREECE 32ESTONIA 33POLAND 34
HUNGARY 35LITHUANIA 36
QATAR 37RUSSIA 38
UAE 39CHILE 40
SLOVAK REPUBLIC 41ROMANIA 42
CROATIA 43TURKEY 44
ARGENTINA 45KAZAKHSTAN 46
THAILAND 47UKRAINE 48MEXICO 49
INDIA 50BRAZIL 51
JORDON 52BULGARIA 53
COLOMBIA 54INDONESIA 55
SOUTH AFRICA 56PHILIPPINES 57
PERU 58VENEZUELA 59
0 10 20 30 40 50 60 70 80 90 100
Source : IMD World Competitiveness Yearbook 2011
201187.5981.2079.9579.6278.0278.0276.8476.1373.4972.1771.6771.5471.3970.8270.1969.4267.9467.3767.0366.5664.1862.7862.3861.3156.5655.22
53.6853.1351.7650.5347.3247.0846.5045.8544.9144.4640.7640.3839.6338.4037.7235.4635.1833.7932.4030.7030.6930.4029.2329.0829.0028.0327.9126.3622.4921.8721.1118.5317.28
Figure 3.6: InfrastructureExtent to which basic, technological, scienti�c and human resources meet the needs of business
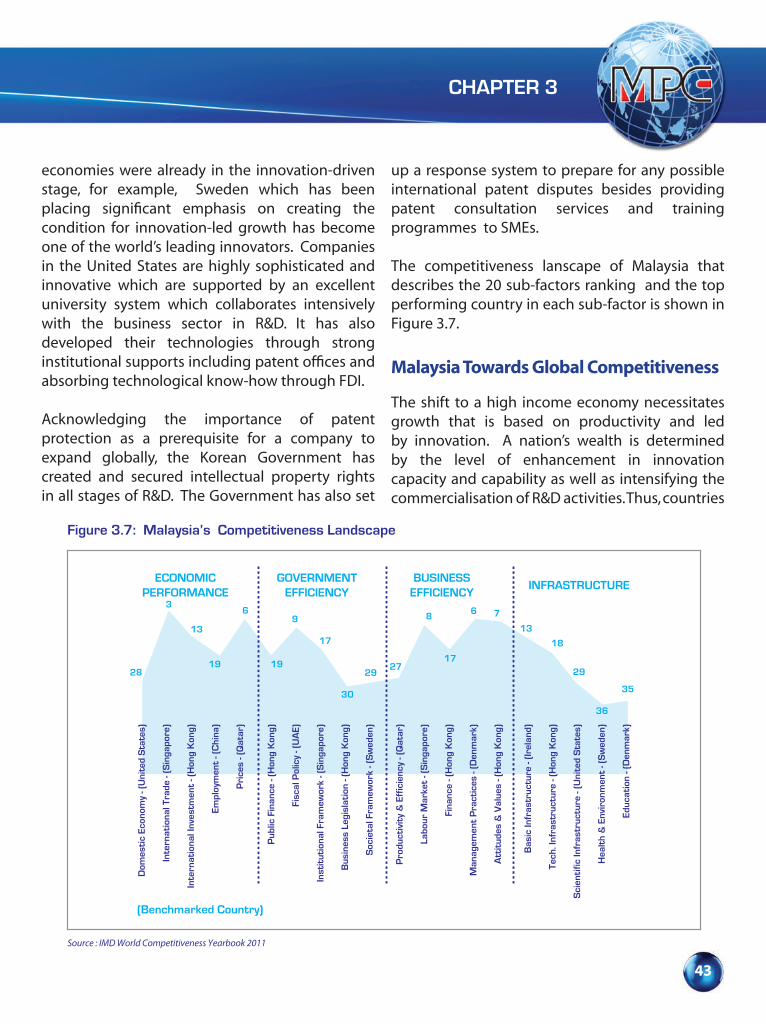
CHAPTER 3
43
economies were already in the innovation-driven stage, for example, Sweden which has been placing significant emphasis on creating the condition for innovation-led growth has become one of the world’s leading innovators. Companies in the United States are highly sophisticated and innovative which are supported by an excellent university system which collaborates intensively with the business sector in R&D. It has also developed their technologies through strong institutional supports including patent offices and absorbing technological know-how through FDI.
Acknowledging the importance of patent protection as a prerequisite for a company to expand globally, the Korean Government has created and secured intellectual property rights in all stages of R&D. The Government has also set
up a response system to prepare for any possible international patent disputes besides providing patent consultation services and training programmes to SMEs.
The competitiveness lanscape of Malaysia that describes the 20 sub-factors ranking and the top performing country in each sub-factor is shown in Figure 3.7.
Malaysia Towards Global Competitiveness
The shift to a high income economy necessitates growth that is based on productivity and led by innovation. A nation’s wealth is determined by the level of enhancement in innovation capacity and capability as well as intensifying the commercialisation of R&D activities. Thus, countries
Figure 3.7: Malaysia’s Competitiveness Landscape
Source : IMD World Competitiveness Yearbook 2011
ECONOMICPERFORMANCE
GOVERNMENTEFFICIENCY
BUSINESSEFFICIENCY
INFRASTRUCTURE
28
3
13
19 19
69
17
30
2927
17
8 76
13
18
29
36
35
(Benchmarked Country)
Dom
esti
c Ec
onom
y - (
Uni
ted
Sta
tes)
Inte
rnat
iona
l Tra
de -
(Sin
gapo
re)
Inte
rnat
iona
l Inv
estm
ent
- (H
ong
Kon
g)
Em
ploy
men
t - (
Chi
na)
Pri
ces
- (Q
atar
)
Pub
lic F
inan
ce -
(Hon
g K
ong)
Fisc
al P
olic
y - (
UA
E)
Inst
itut
iona
l Fra
mew
ork
- (S
inga
pore
)
Bus
ines
s Le
gisl
atio
n - (
Hon
g K
ong)
Soc
ieta
l Fra
mew
ork
- (S
wed
en)
Pro
duct
ivit
y &
Eff
icie
ncy
- (Q
atar
)
Labo
ur M
arke
t - (
Sin
gapo
re)
Fina
nce
- (H
ong
Kon
g)
Man
agem
ent
Pra
ctic
es -
(Den
mar
k)
Att
itud
es &
Val
ues
- (H
ong
Kon
g)
Bas
ic In
fras
truc
ture
- (Ir
elan
d)
Tech
. Inf
rast
ruct
ure
- (H
ong
Kon
g)
Sci
enti
fic In
fras
truc
ture
- (U
nite
d S
tate
s)
Hea
lth
& E
nvir
onm
ent
- (S
wed
en)
Educ
atio
n - (
Den
mar
k)
MALAYSIA AND INTERNATIONAL COMPETITIVENESS
44
that intensified the development of the innovation ecosystem must keep pace with the rapid changes in the global economic architecture and remain competitive.
In achieving an innovation-driven economy, Malaysia faces challenges of rapid value diffusion of new technologies in moving up the global innovation value chain, narrowing innovation wealth gap and competing with developing economies that are also pursuing aggressive strategies to enhance their innovation ecosystems. Malaysia needs to leapfrog in terms of innovative capacity and economic development. It needs to deal with challenges to drive economic growth to a higher level. Some of the initiatives include developing high quality human capital who are knowledgeable, skillful and talented to meet the current market demand.
Malaysia must continue its efforts in enhancing the nation’s competitiveness performance. This is crucial in the context of achieving the high income economy status by 2020. In this regard, Malaysia needs to address the following challenges:
i) Intensifying the contribution of new sources of growth in pursuing economic transformation;
ii) Modernising business regulations for business efficiency, productivity and efficiency;
iii) Retaining and attracting world class talent to strengthen innovation capabilities;
iv) Intensifying R&D activities and commercialisation especially in high end industries; and
v) Enhancing technological infrastructure for higher growth in economic development.
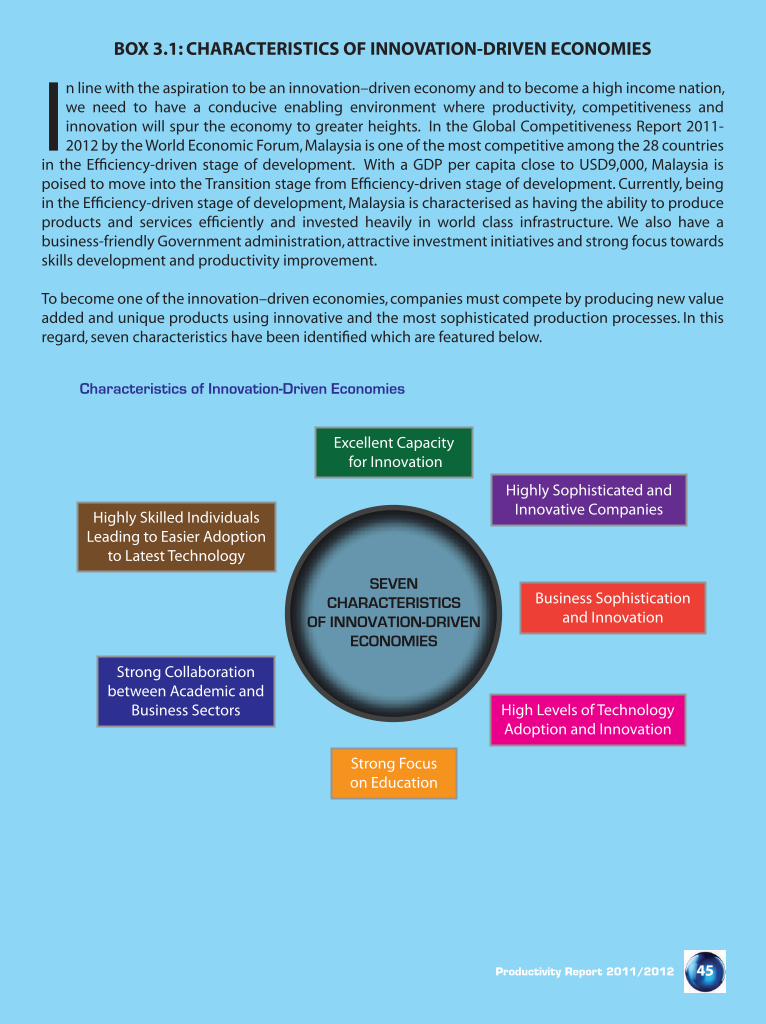
45Productivity Report 2011/2012
BOX 3.1: CHARACTERISTICS OF INNOVATION-DRIVEN ECONOMIES
In line with the aspiration to be an innovation–driven economy and to become a high income nation, we need to have a conducive enabling environment where productivity, competitiveness and innovation will spur the economy to greater heights. In the Global Competitiveness Report 2011-2012 by the World Economic Forum, Malaysia is one of the most competitive among the 28 countries
in the Efficiency-driven stage of development. With a GDP per capita close to USD9,000, Malaysia is poised to move into the Transition stage from Efficiency-driven stage of development. Currently, being in the Efficiency-driven stage of development, Malaysia is characterised as having the ability to produce products and services efficiently and invested heavily in world class infrastructure. We also have a business-friendly Government administration, attractive investment initiatives and strong focus towards skills development and productivity improvement.
To become one of the innovation–driven economies, companies must compete by producing new value added and unique products using innovative and the most sophisticated production processes. In this regard, seven characteristics have been identified which are featured below.
Highly Sophisticated andInnovative Companies
Characteristics of Innovation-Driven Economies
SEVENCHARACTERISTICS
OF INNOVATION-DRIVENECONOMIES
Excellent Capacity for Innovation
Business Sophisticationand Innovation
High Levels of TechnologyAdoption and Innovation
Strong Focuson Education
Strong Collaborationbetween Academic and
Business Sectors
Highly Skilled IndividualsLeading to Easier Adoption
to Latest Technology
46 Productivity Report 2011/2012
To achieve the innovation stage of development, it is fundamental to attract new investment and encourage expansion into high value-added activities through strategic collaboration between the Government and industries. This will be complemented by creating a supportive ecosystem for innovation activities in the entire value chain. Furthermore, it is imperative that technological adoption and readiness need to be enhanced at the firm level.
Business sophistication and innovation need to be enhanced by creating innovation opportunities and incentives for companies to invest and innovate. It is pertinent to have strong collaboration between the academia and business sector. In this regard, the close collaboration could enhance R&D activities, commercialisation of research findings into marketable products and processes.
Among the countries which had been identified as innovation driven economies by the World Economic Forum are Hong Kong, The United States of America, Singapore, Sweden and Switzerland. Their characteristics towards innovation is shown in the table. These economies are characterised by having a healthy, well-educated and trained workforce who are able to adopt the latest technologies.
Hong Kong for instance, has an outstanding quality of infrastructure that provides a conducive environment for innovative activities, supported by openness to foreign ownerships and low trade barriers. The presence of high quality scientific research institutions in the United States provide extensive collaboration in research between universities and industries. Meanwhile, Singapore strongly emphasises on education and skill enhancement among its labour force. Sweden is known as the world’s leading innovator while Switzerland provides an excellent capacity for innovation and has a very sophisticated business culture. These characteristics ensure a better alignment with the changing requirements of firms and also to accelerate the creation of new markets for innovative products and services.
In essence, to be an innovative and competitive nation, it is imperative for Malaysia to continue its efforts in enhancing the nation’s competitiveness performance and to benchmark and deliberate on the characteristics being practiced by the leading economies. Going forward with the initiatives introduced by the Government coupled with efficiency initiatives being implemented by businesses, Malaysia is poised to become one of the innovation–driven economies.
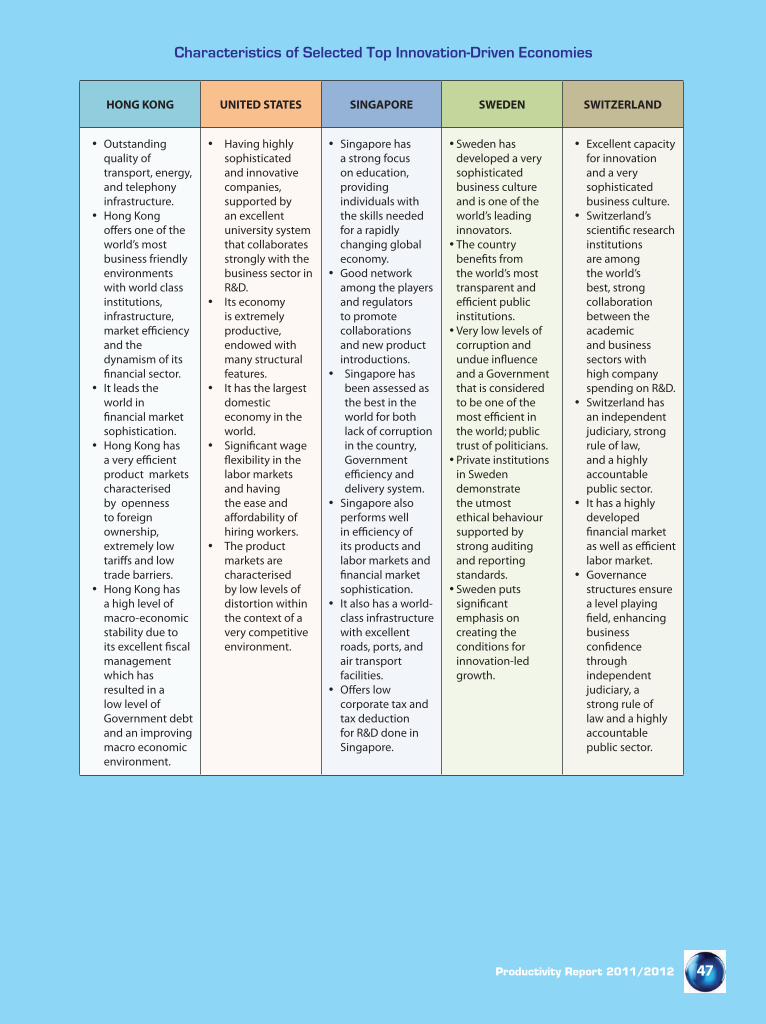
47Productivity Report 2011/2012
Characteristics of Selected Top Innovation-Driven Economies
HONG KONG UNITED STATES SINGAPORE SWEDEN SWITZERLAND
• Outstanding quality of transport, energy, and telephony infrastructure.
• Hong Kong
world’s most business friendly environments with world class institutions, infrastructure,
and the dynamism of its
• It leads the world in
sophistication.• Hong Kong has
product markets characterised by openness to foreign ownership, extremely low
trade barriers.• Hong Kong has
a high level of macro-economic stability due to
management which has resulted in a low level of Government debt and an improving macro economic environment.
• Having highly sophisticated and innovative companies, supported by an excellent university system that collaborates strongly with the business sector in R&D.
• Its economy is extremely productive, endowed with many structural features.
• It has the largest domestic economy in the world.
•
labor markets and having the ease and
hiring workers.• The product
markets are characterised by low levels of distortion within the context of a very competitive environment.
• Singapore has a strong focus on education, providing individuals with the skills needed for a rapidly changing global economy.
• Good network among the players and regulators to promote collaborations and new product introductions.
• Singapore has been assessed as the best in the world for both lack of corruption in the country, Government
delivery system. • Singapore also
performs well
its products and labor markets and
sophistication.• It also has a world-
class infrastructure with excellent roads, ports, and air transport facilities.
• corporate tax and tax deduction for R&D done in Singapore.
• Sweden has developed a very sophisticated business culture and is one of the world’s leading innovators.
• The country benefits from the world’s most transparent and efficient public institutions.
• Very low levels of corruption and undue influence and a Government that is considered to be one of the most efficient in the world; public trust of politicians.
• Private institutions in Sweden demonstrate the utmost ethical behaviour supported by strong auditing and reporting standards.
• Sweden puts significant emphasis on creating the conditions for innovation-led growth.
• Excellent capacity for innovation and a very sophisticated business culture.
• Switzerland’s
institutions are among the world’s best, strong collaboration between the academic and business sectors with high company spending on R&D.
• Switzerland has an independent judiciary, strong rule of law, and a highly accountable public sector.
• It has a highly developed
labor market.• Governance
structures ensure a level playing
business
through independent judiciary, a strong rule of law and a highly accountable public sector.

TRANSFORMATION TOWARDS BUSINESS
EXCELLENCE
PART
2

CHAPTER 4
MODERNISING BUSINESS REGULATION

MODERNISING BUSINESS REGULATION
50
Overview
Regulation is a key instrument used by Government to achieve various policy objectives and ensure the well-being of its citizens. It is also an important tool for protecting the health and safety, the environment and for ensuring a balanced and continuous development of the economy. Well designed regulation also has a vital role to play in overcoming some of the problems that lead to inefficient or inequitable allocation of resources. In contrast, poorly designed regulation may not achieve its objectives and can impose costs on businesses and the communities.
Getting the right type and level of individual regulation and the regulatory framework is essential for productivity growth. As such, it is vital that Government delivers a regulatory framework which promotes competition, innovation, investment and skills which contribute to raise the level of productivity.
Almost all regulations have impact on productivity either through business incentives or reducing compliance costs. A fundamental objective of regulatory governance is to foster high quality regulations that will improve the efficiency of an economy such as attracting foreign and domestic investment to remain competitive. Therefore, it is imperative to have good regulation in a modern and well-functioned economy.
Regulation has become an important requirement in Malaysia whereby business is faced with a significant array of complex and overlapping regulations, some of which are unnecessarily burdensome. The reduction of unnecessary
compliance costs associated with regulations has become an important part of the review process to improve the competitiveness of business and the performance of the economy.
The Rationale of Regulatory Review
The Government recognises that the state of affairs of the regulatory framework in Malaysia can be further improved by facilitating business operations where obsolete and irrelevant regulations should be minimised. Currently, there are about 900 agencies, at both federal and state levels which administer over 3,000 regulatory procedures.
Statistics have revealed that annual cost of regulatory burden expressed as a percentage of GDP is 1.4% in the United Kingdom, 2.4% in Denmark and 3.6 % in the Netherlands. If the regulatory burden constitutes 2.5% of Malaysia’s GDP of RM588 billion in 2011, then the amount of regulatory cost to businesses was RM15 billion. Many countries have set a 25% reduction target for their regulatory burden reduction programmes. If Malaysia can similarly set and achieve the 25% reduction target, the economy could save about RM4 billion of unnecessary regulatory costs per year.
Thus, removing unnecessary regulatory burden through a comprehensive review of regulations that impede business innovation and effectiveness is a priority on the national agenda. This will ensure that Malaysia is at par with global development and on the right track to achieve high income economy status through enhanced productivity and competitiveness at all levels.

CHAPTER 4
51
The Government took a significant step in rationalising regulatory system in 2007 by establishing the Special Task Force to Facilitate Business (PEMUDAH). This task force helps to facilitate business and to alleviate the burden on business from unnecessary regulations. PEMUDAH’s substantial achievements include reducing the process of starting a business from nine procedures and 11 days to three procedures and three days, reducing time taken to register standard property titles from 41 days to two days and reducing time taken for tax refunds to 14 days compared to one year previously.
Another initiative undertaken is “Modernising Business Licensing” which is crucial to create a more favourable and competitive business environment. PEMUDAH works with 23 ministries and agencies aiming to abolish unnecessary licenses, simplify business related procedures and reducing processing time. As a result, 52% from 761 licenses were identified to be eliminated and simplified. This whole initiative resulted in an estimated reduction of RM729 million in business licenses compliance cost and will be realised by the end of 2012.
International Comparison on Regulatory Performance
Measuring the impact of regulation on productivity at the macro level is a constraint due to unavailability of up-to-date measures of competitiveness and the regulatory environment. This is attributed to a wide variety of factors which contribute to productivity performance and the challenge is to determine a direct relationship between regulatory quality and productivity outcome. A number of international institutions
had produced indicators of individual country performance on regulation. These indicators were developed using a number of different methods including self-assessment and surveys of opinions.
Based on the World Bank’s “Doing Business 2012” Report, Malaysia ranked 18th position among 183 economies. For “Global Competitiveness Report 2011-2012” published by the World Economic Forum (WEF), Malaysia was at 8th position for the burden of government regulation indicator.
The International Institute for Management Development (IMD), World Competitiveness Yearbook (WCY) 2011” placed Malaysia at 30th position on business legislation (Figure 4.1). Malaysia continues to be ahead of the United Kingdom (42th) and Korea (43th). However, Singapore, Hong Kong, Qatar and Finland were the top four most competitive nations in terms of ‘Business Legislation’ among the 59 economies.
As shown in Figure 4.1, Malaysia was ranked at 33rd on ‘Openness’, 26th on ‘Competition and Regulation’, and 29th on ‘Labour Regulation’. Among the indicators under ‘Business Legislation’, Malaysia performed very well in terms of ‘Unemployment Legislation’ and ‘Ease of Doing Business’ which were at 5th placing. For the ‘Ease of Doing Business’, Malaysia had overtaken several developed countries such as Denmark (9th), Germany (20th)
and the Netherlands (23rd).
Best Practices in Regulation Development Process
Regulations are essential for the proper functioning of society and the economy. However, the challenge for a Government is to deliver effective and efficient
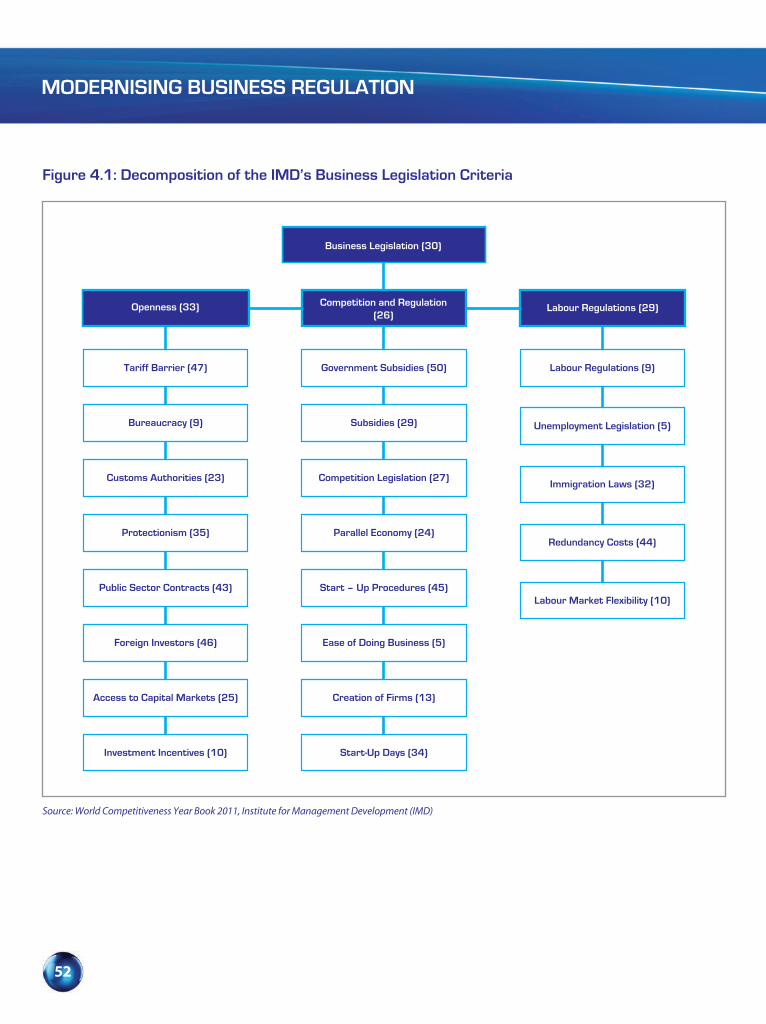
MODERNISING BUSINESS REGULATION
52
Figure 4.1: Decomposition of the IMD’s Business Legislation Criteria
Tariff Barrier (47)
Bureaucracy (9)
Customs Authorities (23)
Protectionism (35)
Public Sector Contracts (43)
Foreign Investors (46)
Access to Capital Markets (25)
Investment Incentives (10)
Government Subsidies (50)
Subsidies (29)
Competition Legislation (27)
Parallel Economy (24)
Start – Up Procedures (45)
Ease of Doing Business (5)
Creation of Firms (13)
Start-Up Days (34)
Labour Regulations (9)
Unemployment Legislation (5)
Immigration Laws (32)
Redundancy Costs (44)
Labour Market Flexibility (10)
Source: World Competitiveness Year Book 2011, Institute for Management Development (IMD)
Business Legislation (30)
Openness (33) Competition and Regulation(26)
Labour Regulations (29)
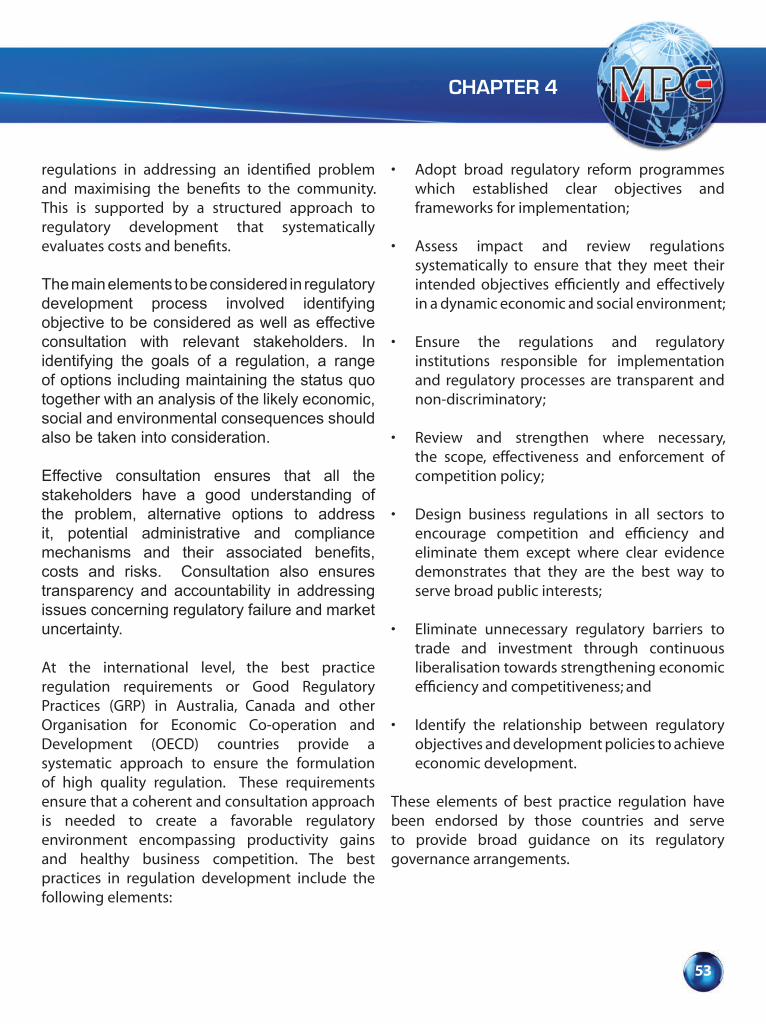
CHAPTER 4
53
regulations in addressing an identified problem and maximising the benefits to the community. This is supported by a structured approach to regulatory development that systematically evaluates costs and benefits.
The main elements to be considered in regulatory development process involved identifying objective to be considered as well as effective consultation with relevant stakeholders. In identifying the goals of a regulation, a range of options including maintaining the status quo together with an analysis of the likely economic, social and environmental consequences should also be taken into consideration.
Effective consultation ensures that all the stakeholders have a good understanding of the problem, alternative options to address it, potential administrative and compliance mechanisms and their associated benefits, costs and risks. Consultation also ensures transparency and accountability in addressing issues concerning regulatory failure and market uncertainty.
At the international level, the best practice regulation requirements or Good Regulatory Practices (GRP) in Australia, Canada and other Organisation for Economic Co-operation and Development (OECD) countries provide a systematic approach to ensure the formulation of high quality regulation. These requirements ensure that a coherent and consultation approach is needed to create a favorable regulatory environment encompassing productivity gains and healthy business competition. The best practices in regulation development include the following elements:
• Adopt broad regulatory reform programmes which established clear objectives and frameworks for implementation;
• Assess impact and review regulations systematically to ensure that they meet their intended objectives efficiently and effectively in a dynamic economic and social environment;
• Ensure the regulations and regulatory institutions responsible for implementation and regulatory processes are transparent and non-discriminatory;
• Review and strengthen where necessary, the scope, effectiveness and enforcement of competition policy;
• Design business regulations in all sectors to encourage competition and efficiency and eliminate them except where clear evidence demonstrates that they are the best way to serve broad public interests;
• Eliminate unnecessary regulatory barriers to trade and investment through continuous liberalisation towards strengthening economic efficiency and competitiveness; and
• Identify the relationship between regulatory objectives and development policies to achieve economic development.
These elements of best practice regulation have been endorsed by those countries and serve to provide broad guidance on its regulatory governance arrangements.

MODERNISING BUSINESS REGULATION
54
Best Practice Regulation in Malaysia
The efforts to improve the quality of new regulations are one of the ways for MPC to assume its new role and function in regulatory review as indicated in the Tenth Malaysia Plan (2011-2015) and Economic Transformation Programme (ETP). A quality regulation is one that has characteristics of good governance and must fulfill “adequacy” and “gatekeeping” requirements. This is to ensure that the quality and effectiveness of a new business regulation would minimise unnecessary compliance costs and fulfills the expectations of the business community. Such good regulatory system has been practiced effectively in Australia, Canada and other OECD countries.
To improve the quality of new regulations, the Government is introducing a national policy to transform the rule-making process in Malaysia. This requirement will be introduced to ensure that regulations are effective in addressing the desired public policy objectives and in serving the country in a balanced and equitable manner and implemented in a transparent manner. It is the Government’s intention to ensure that cumbersome regulations which create unnecessary burdens to society and business discourage competition and innovation are reduced and avoided.
As part of a systematic approach towards regulatory policies, institutions and tools, Regulatory Impact Analysis (RIA) by itself is not a sufficient basis for decisions. Instead, it is best used as a tool with which to improve the quality of political and administrative decision-making, while answering to increasing calls for openness, public involvement and accountability. A RIA is the process of examining the likely impacts of a proposed regulation and a
range of alternative options which could meet the Government’s policy objectives. In addition to RIA, Regulatory Impact Statement (RIS) is a document prepared by the department, agency or authority responsible for a regulatory proposal. It formalises and provides evidence of the key steps taken during the development of the proposal including assessment of the costs and benefits of each option (Chart 4.1).
National Development Planning Committee (NDPC) has been entrusted to assume the role of a Gatekeeper for improving the process and quality of developing a new business regulation. Therefore, the gatekeeping system will be implemented effective from 1 July 2012. Two important documents for ensuring effective implementation of gatekeeping system are National Policy on the Development and Implementation of Regulations as well as Best Practice Regulation Handbook. These documents provide systematic guidelines for the implementation of gatekeeping system. These documents are also based on the experience and Good Regulatory Practices (GRP) in Australia, Canada, United Kingdom other OECD countries.
The National Policy on the Development and Implementation of Regulations are to address the gaps in the management system for regulations. This is to ensure that Malaysia is in the position to meet international best practices in regulations. This will also help to enhance transparency and accountability of regulatory actions and create a climate for a better quality of life and business environment. The Government recognises that these actions will contribute towards building an economy which attracts trade and investment that value good regulatory environment, generate quality jobs and increase national wealth.

CHAPTER 4
55
The Best Practice Regulation Handbook is a tool tofacilitate the implementation of the National Policy. The Handbook should be used in conjunction with the National Policy document and provides guidance for compliance to the policy and process. It is intended that flexibility is available for implementation as far as the principles and key process steps are adhered to. Existing arrangements should be reviewed to ensure that these fulfill the policy and process requirements and changes made when the existing arrangements as indicated.
National Policy on the Development and Implementation of Regulations as well as Best Practice Regulation Handbook have been developed through a consultative process coordinated by the Malaysia Productivity Corporation (MPC). Consultations were held and inputs from a wide range of stakeholders within government that include representatives from all ministries and agencies responsible for the development and implementation of regulations in a number of sessions held in February and March 2012. These documents were made available for review on MPC website and all affected parties were invited to submit their comments on the drafted policy and the Best Practice Regulation Handbook. Many useful and constructive comments received during the consultation sessions and those directly communicated to MPC have been incorporated into the two documents.
The capacity and capability of all parties involved in the management, development and implementation of regulations will be upgraded
and the governance and organisational structures were reviewed to meet the requirements of international best practices. The inter-connected nature of the issues dictate that this change be undertaken in an integrated manner by involving various Ministries, agencies, industries and other stakeholders.
The requirements for Best Practice Regulation in Malaysia include that every Ministry or Regulator should:
1. Appoint Regulatory Coordinator(s) and notify the appointment to the gatekeeper;
2. Develop and maintain a system to manage the regulatory process that meets the requirements;
3. Ensure new regulations to be in accordance with the defined process;
4. Ensure regulations to serve defined objectives. Regulatory authorities proposing new regulatory requirements or regulatory changes must have clear objectives, evidence that a problem has arisen, that Government intervention is required and that new regulatory requirements are necessary;
5. Examine alternatives, assess impact, hold consultations & define implementation strategy; and
6. Explain proposals to stakeholders, maintain process records & train personnel.
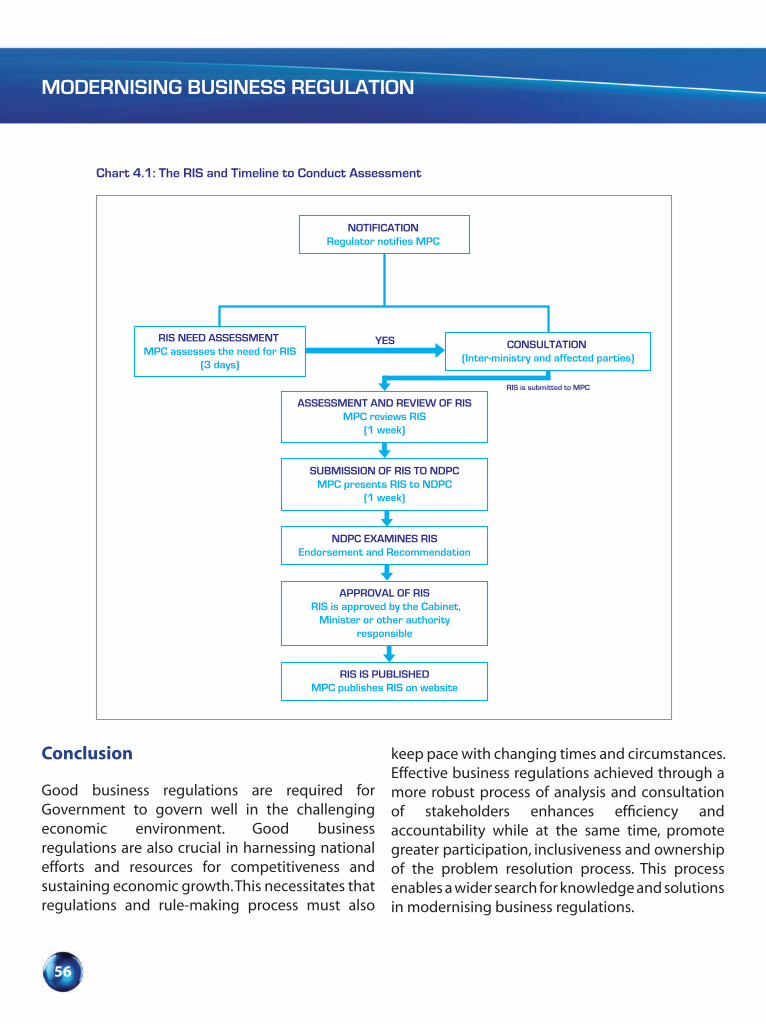
MODERNISING BUSINESS REGULATION
56
Conclusion
Good business regulations are required for Government to govern well in the challenging economic environment. Good business regulations are also crucial in harnessing national efforts and resources for competitiveness and sustaining economic growth. This necessitates that regulations and rule-making process must also
keep pace with changing times and circumstances. Effective business regulations achieved through a more robust process of analysis and consultation of stakeholders enhances efficiency and accountability while at the same time, promote greater participation, inclusiveness and ownership of the problem resolution process. This process enables a wider search for knowledge and solutions in modernising business regulations.
Chart 4.1: The RIS and Timeline to Conduct Assessment
NOTIFICATION Regulator notifies MPC
RIS NEED ASSESSMENT MPC assesses the need for RIS
(3 days)
CONSULTATION (Inter-ministry and affected parties)
RIS is submitted to MPC
NDPC EXAMINES RISEndorsement and Recommendation
APPROVAL OF RIS RIS is approved by the Cabinet,
Minister or other authorityresponsible
RIS IS PUBLISHEDMPC publishes RIS on website
ASSESSMENT AND REVIEW OF RISMPC reviews RIS
(1 week)
SUBMISSION OF RIS TO NDPCMPC presents RIS to NDPC
(1 week)
YES

57Productivity Report 2011/2012
Box 4.1: Enhancing Malaysia’s Competitiveness Through Modernising Business Licensing (MBL)
Realising the needs to enhance efficiency in the public delivery system and facilitate trade investment, the Modernising Business Licensing (MBL) initiative was started in March 2010. The Special Taskforce to Facilitate Business (PEMUDAH), through the Focus Group on Business Process Re-engineering (FGBPR) initiated the programme by working with 23 ministries to review
all procedures related to the application of business-related licenses. The MBL initiative commenced at Federal level (MBL Federal) and will be implemented among the States (MBL States).
The ultimate aim of MBL initiative is to abolish unnecessary licenses and simplify business-related procedures in the country. This will consequently benefit the business community, allowing for faster and more convenient and hassle-free application. At the same time, MBL will add value and integrity to the public delivery system by ensuring easier, more transparent and cost-effective means of dealing with the Government. As such, in line with the Government’s Economic Transformation Programme, the MBL initiative will also help to reduce regulation burden.
52% of the 761 licenses reviewed by FGBPR have been identified for elimination or simplification. In fact, it is estimated that the MBL initiative will generate a reduction of RM729 million in business license compliance cost when the exercise is completed by end of 2012.
In implementing the MBL initiative, FGBPR has adopted the “Guillotine” method which was first introduced in Sweden in the 1980s. This involves direct elimination of selected procedures, licenses and regulations. To further facilitate the initiative, FGBPR is currently working with three agencies. The agencies are Malaysia Productivity Corporation (MPC) acting as the Secretariat, the Malaysia Administrative Modernising and Management Planning Unit (MAMPU) and the Implementation Coordination Unit (ICU) under the Prime Minister’s Department.
MPC will address the quality of licensing administration and practices in ministries by assessing the legality, necessity and appropriateness of the licenses. As such, procedures that do not meet legislative justification and are unnecessary will be abolished, while any requirement that are not business-friendly will be simplified.
MAMPU’s role is streamlining and simplifying the business licenses as well as coordinating and monitoring the implementation of the new and more efficient procedures which will be made available on-line through the Business Licensing Electronic Support System (BLESS). The BLESS portal, managed by ICU, is an on-line one-stop centre for simultaneous applications for licenses, approvals and permits and it also provides information and facilities for starting and operating business license applications. ICU will also monitor the implementation of the on-line system for a more effective public delivery service.
Through the MBL programme, the Malaysian Government hopes to enhance competitiveness and provides a more conducive and attractive environment for foreign direct investment as well as to encourage more local businesses. The reduction in compliance cost will allow entrepreneurs to increase quality and productivity thus enabling them to offer more competitive prices to consumers. Also, the MBL initiative will create more employment opportunities and savings for businessmen who conduct transactions with the Government.

58 Productivity Report 2011/2012
Box 4.2: Improving Efficiency in Dealing with Construction Permits in Kuala Lumpur
A construction permit system is a set of laws, regulations and procedures issued by the respective Local Council that all building practitioners, such as builders, architects, consultants and contractors, have to abide by when engaging in the construction of a new building or in the modification of an existing building that has structural implications. A construction permit
grants legal permission to start construction of a building project. It is granted by Kuala Lumpur City Hall (DBKL) and it enforces Building by-Laws (Building Code) that has been adopted as part of a broader construction law.
The main objective of construction permits is to ensure the health and safety of the community. This has important implications for policy-makers who need to strike the right balance between the cost imposed on industry and the real benefits in safety and health standards.
The construction permit process plays a critical “gate-keeper” role in protecting a range of other public goods such as preventing construction close to airports and protecting the environment or preventing potentially harmful industries to be located in residential areas. These public goods are more fragmented and are not related to structural properties or the risks directly associated to the structural characteristics of the building. When this “gate-keeper” function is not carefully managed and coordinated with the relevant authorities, an insurmountable bureaucracy may emerge which is likely to discourage investment and increase the level of informality.
Carefully managing the “gate-keeper” role is an important factor in the success of improving efficiency in dealing with construction permits in Kuala Lumpur. The objectives of modernising regulations in Kuala Lumpur is primarily driven by the needs to improve safety, improve the performance of building practitioners and transform the authorities to a more efficient enforcement body.
In addition to a main “Building by-Laws”, the practitioners have to follow other code of practices (standards) focusing on specific engineering areas such as:
• Plumbing;• Sewerage;• Firepreventionsystems;and• Telecommunication.
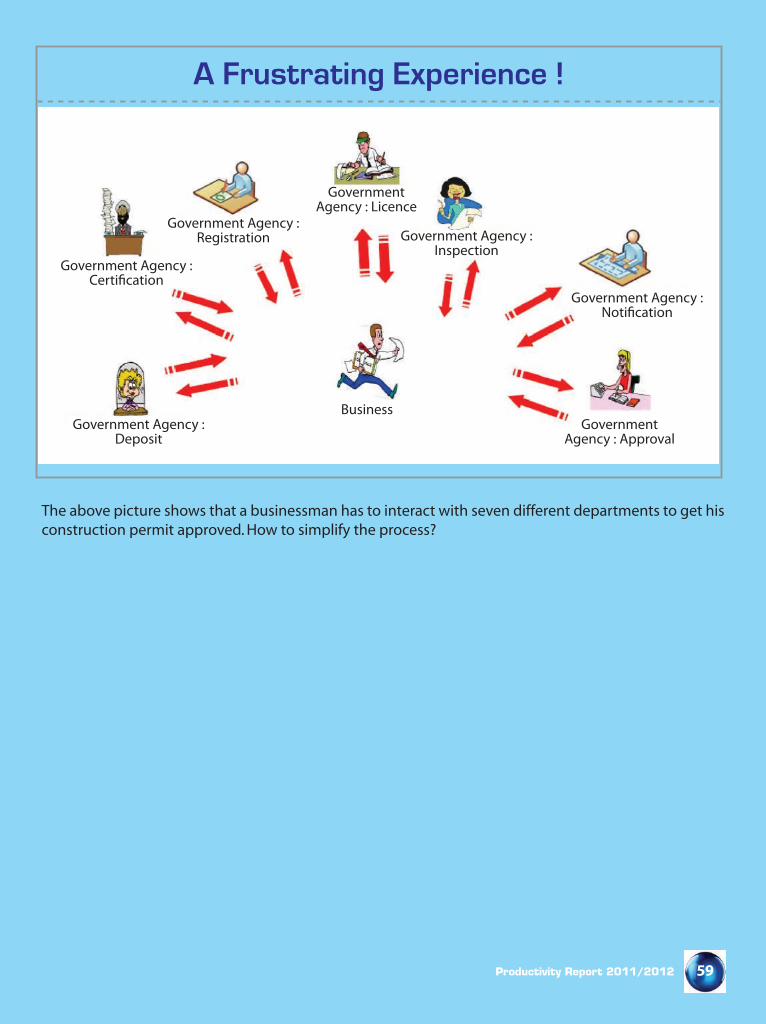
59Productivity Report 2011/2012
The above picture shows that a businessman has to interact with seven different departments to get his construction permit approved. How to simplify the process?
A Frustrating Experience !
GovernmentAgency : Licence
Government Agency :Inspection
Government Agency :Noti�cation
GovernmentAgency : Approval
BusinessGovernment Agency :
Deposit
Government Agency :Certi�cation
Government Agency :Registration
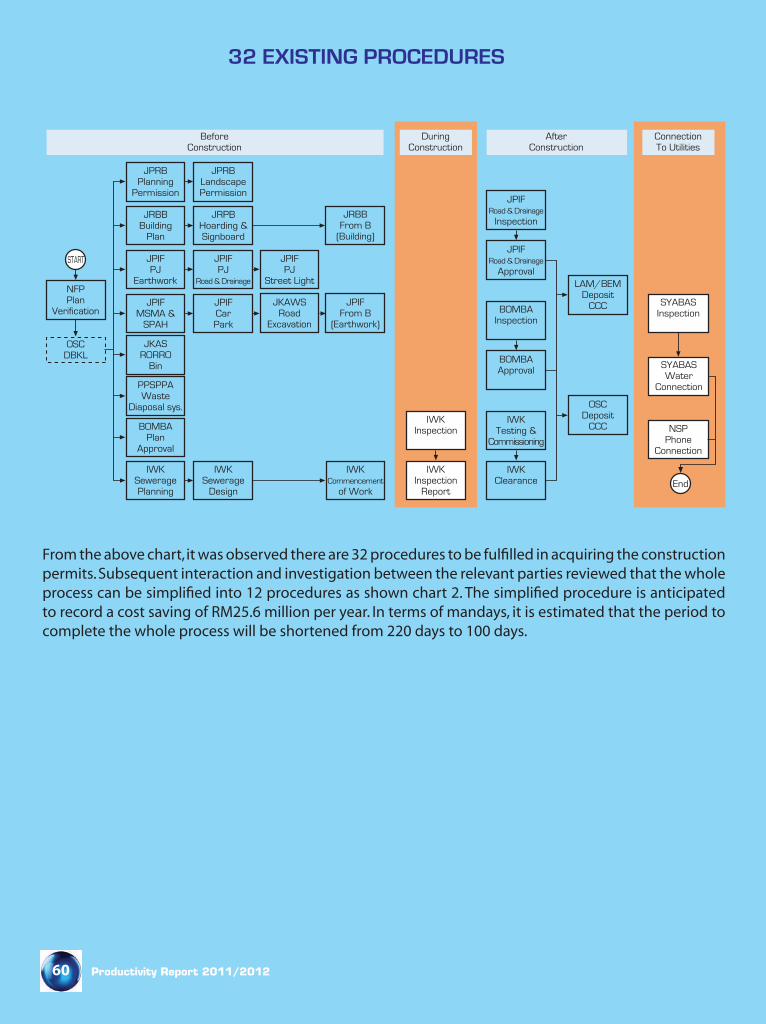
60 Productivity Report 2011/2012
From the above chart, it was observed there are 32 procedures to be fulfilled in acquiring the construction permits. Subsequent interaction and investigation between the relevant parties reviewed that the whole process can be simplified into 12 procedures as shown chart 2. The simplified procedure is anticipated to record a cost saving of RM25.6 million per year. In terms of mandays, it is estimated that the period to complete the whole process will be shortened from 220 days to 100 days.
SYABASWater
Connection
NSPPhone
Connection
OSCDeposit
CCC
LAM/BEMDeposit
CCC
JPIFRoad & Drainage
Approval
JPIFRoad & Drainage
Inspection
BOMBAApproval
BOMBAInspection
IWKClearance
IWKCommencement
of Work
IWKSewerage
Design
IWKSeweragePlanning
JPIFFrom B
(Earthwork)
JKAWSRoad
Excavation
JRBBFrom B
(Building)
JPIFPJ
Street Light
JPIFPJ
Road & Drainage
JPIFPJ
EarthworkNFPPlan
Verification
OSCDBKL
JPIFCarPark
JPIFMSMA &
SPAH
JKASRORRO
Bin
PPSPPAWaste
Diaposal sys.
BOMBAPlan
Approval
JPRBLandscapePermission
JPRBPlanning
Permission
JRPBHoarding &Signboard
JRBBBuilding
Plan
IWKTesting &
Commissioning
SYABASInspection
ConnectionTo Utilities
AfterConstruction
DuringConstruction
32 EXISTING PROCEDURES
BeforeConstruction
End
START
IWKInspection
Report
IWKInspection
Source: Public Consultation Paper ‘ Dealing with Construction Permit in Kuala Lumpur ’

61Productivity Report 2011/2012
Some key activities to improve efficiency in dealing building permit in Kuala Lumpur are as follows:
(a) Simplify procedures and statutory forms through creating risk-based system to differentiating project. Simple or low-risk buildings require less documentation than more complex structures which can be approved much ealier. This saves time for both business and authorities.
(b) Enhancing One-Stop-Centre (OSC) to improve coordination. Before a building plan is approved, appropriate clearances are required to ensure quality and safety. This involves several agencies. To prevent overlapping and ensuring efficiency, many countries have opted to put the agencies in one location. These one-stop-centre improves the coordination of the review process. Hence more resources can be devoted to safety checks rather than to multiple interactions between the entrepreneur and the various agencies.
(c) Strengthening on-line application and approval of construction permits. Allowing documentations and fees to be submitted through on line facilities from the building practitioners to the authorities to speed up the processing.
SYABASWater
Connection
NSPPhone
Connection
OSCDeposit
CCC
LAM/BEMDeposit
CCC
JPIFRoad & Drainage
Approval
JPIFRoad & Drainage
Inspection
BOMBAApproval
BOMBAInspection
IWKClearance
IWKCommencement
of Work
IWKSewerage
Design
IWKSeweragePlanning
JPIFFrom B
(Earthwork)
JKAWSRoad
Excavation
JRBBFrom B
(Building)
JPIFPJ
Street Light
JPIFPJ
Road & Drainage
JPIFPJ
EarthworkNFPPlan
Verification
OSCDBKL
JPIFCarPark
JPIFMSMA &
SPAH
JKASRORRO
Bin
PPSPPAWaste
Diaposal sys.
BOMBAPlan
Approval
JPRBLandscapePermission
JPRBPlanning
Permission
JRPBHoarding &Signboard
JRBBBuilding
Plan
IWKTesting &
Commissioning
SYABASInspection
ConnectionTo Utilities
AfterConstruction
DuringConstruction
NEWLY PROPOSED 12 PROCEDURES
BeforeConstruction
End
START
IWKInspection
Report
IWKInspection
Source: Public Consultation Paper ‘ Dealing with Construction Permit in Kuala Lumpur ’
2
1
3
4
5
6
7
8
9
10
11
12

62 Productivity Report 2011/2012
Box 4.3: Modernising Trade Facilitation Through Business Process Improvement
In today’s global trading environment, modernising regulations in trade facilitation is a key element in ensuring improvement in market access and competitiveness to achieve economic success. Modernising trade facilitation as described by the World Bank “Doing Business Report 2012” involves reducing all the transaction costs, time and documentation associated with the enforcement,
regulation and administration in Trading Across Borders. However, transparency, professionalism of all players and regulatory environment are crucial for developing reform strategies.
An initiative for trade facilitation focusing on document and cycle time reduction for import and export based on a 20-footer full container load via sea mode was conducted as part of the strategy for modernising regulations in trade facilitation for Malaysia. The initiative conducted was focused on improvement in procedures by eliminating non-value adding activities from processes. This will result in a reduction of waiting time, multiple data entry points, errors in documentation and multiple levels of approvals.
The parties involved were:• Importers and Exporters;• Banks;• Logistic Companies;• Customs;• Permit Issuance Agencies; and• Ports.
The initiative was conducted in several phases:• Baseline analysis – to understand the current or actual process performance in each participating
organisation benchmarked against their own client charter or Key Performance Indicators; and• Business Process Analysis – Process bottlenecks in trade were identified by conducting a Business
Process Analysis to understand attributes of business processes involved in trade and their relationships by reviewing:– People who were involved in the processes;– Procedures and documents required for the processes;– The process performance indicator i.e. client charter; and– Related rules and regulations.

63Productivity Report 2011/2012
The following improvements are recommended:a) For the agencies that have processes with high variation, any new process recommended or
implemented must be supported by a review of existing regulations;
b) Where there was waiting time between agencies and redundancy of document/information submission, the current IT infrastructure needs to take into consideration the process bottlenecks at each organisation. This can be overcome by appointing a project champion to integrate and co-ordinate all the various IT systems and ensure that they are in place;
c) Where processes are still manually done and hard copy documentation is used, initiatives should be taken to eliminate these as far as possible. This is to enhance cycle time, process capability and performance improvement in each organisation; and
d) Ensure effective data integration with legacy systems to improve turnaround time (TAT).
The outcome of the improvement plan is envisaged as follows:• Reduction in the number of procedures; • New revised process targets or client charters;• Improved process sigma value to a minimum of 3.5 sigma across all the players involved;• Reduction in the number of documents required for import/ export; • Reduction in TAT for each process; and• Improvement in the ranking for Malaysia in Trading Across Borders.


CHAPTER 5
ESCALATING ENTERPRISE INNOVATION ANG BUSINESS EXCELLENCE
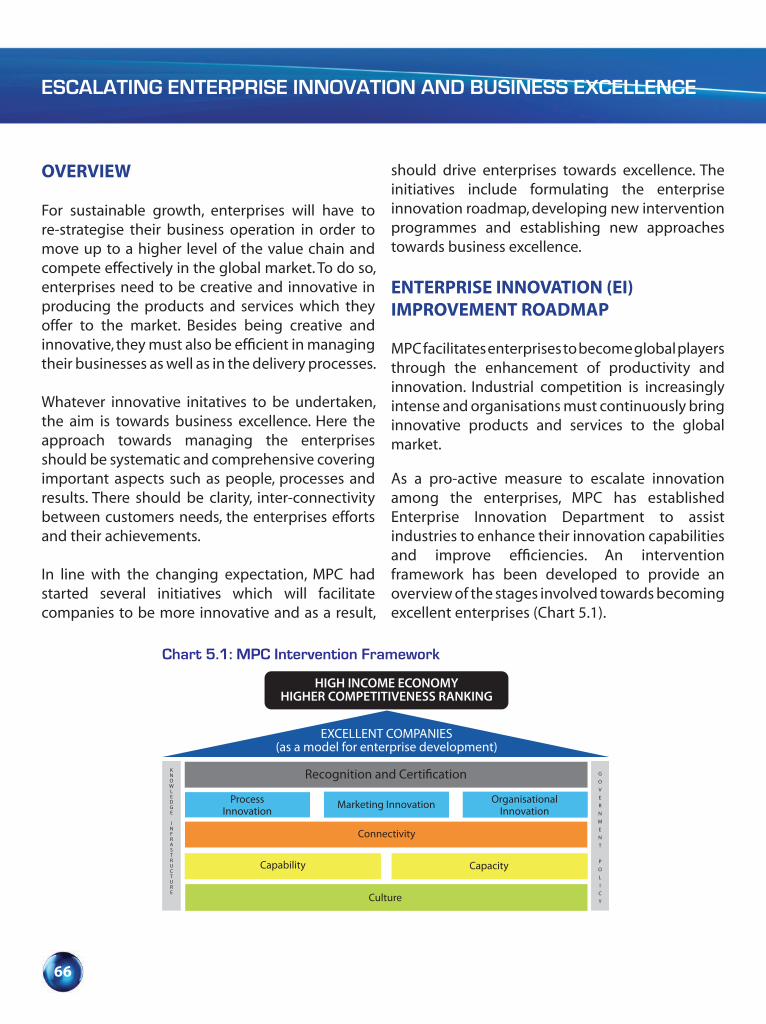
ESCALATING ENTERPRISE INNOVATION AND BUSINESS EXCELLENCE
66
OVERVIEW
For sustainable growth, enterprises will have to re-strategise their business operation in order to move up to a higher level of the value chain and compete effectively in the global market. To do so, enterprises need to be creative and innovative in producing the products and services which they offer to the market. Besides being creative and innovative, they must also be efficient in managing their businesses as well as in the delivery processes.
Whatever innovative initatives to be undertaken, the aim is towards business excellence. Here the approach towards managing the enterprises should be systematic and comprehensive covering important aspects such as people, processes and results. There should be clarity, inter-connectivity between customers needs, the enterprises efforts and their achievements.
In line with the changing expectation, MPC had started several initiatives which will facilitate companies to be more innovative and as a result,
should drive enterprises towards excellence. The initiatives include formulating the enterprise innovation roadmap, developing new intervention programmes and establishing new approaches towards business excellence.
ENTERPRISE INNOVATION (EI) IMPROVEMENT ROADMAP
MPC facilitates enterprises to become global players through the enhancement of productivity and innovation. Industrial competition is increasingly intense and organisations must continuously bring innovative products and services to the global market.
As a pro-active measure to escalate innovation among the enterprises, MPC has established Enterprise Innovation Department to assist industries to enhance their innovation capabilities and improve efficiencies. An intervention framework has been developed to provide an overview of the stages involved towards becoming excellent enterprises (Chart 5.1).
CapacityCapability
Connectivity
Culture
OrganisationalInnovation
Marketing InnovationProcessInnovation
Recognition and Certi�cation
EXCELLENT COMPANIES(as a model for enterprise development)
GOVERNMENT
POLICY
KNOWLEDGE
INFRASTRUCTURE
HIGH INCOME ECONOMYHIGHER COMPETITIVENESS RANKING
Chart 5.1: MPC Intervention Framework

CHAPTER 5
67
This framework focuses on 4Cs initiatives that are culture, capacity, capability and connectivity. The deliverables of these initiatives will be translated into programmes which is known as Enterprise Innovation Intervention Programmes (EIIP). The four Cs of success in EIIP comprise Innovation Culture Building Programmes, Enterprise Innovation Systems, Productivity and Innovation Enhancement Programmes and Innovation Partnership. (Chart 5.2)
Some of the programmes offered by MPC in the EIIP are as listed in Table 5.1
Each programme has its specific objectives, aimed at contributing to the competitiveness of enterprises and their innovative capacity in their own areas.
The overall objectives of EIIP are to support companies in improving their processes, develop their employees knowledge and skills, create and implement systems to improve their productivity and competitiveness as well as to showcase some of the best practices observed.
• Innovation Management System• Performance Measurement System
• Quality Management System• Process Improvement System
ENTERPRISE INNOVATION SYSTEMS(EIS)
PRODUCTIIVITY AND INNOVATION
ENHANCEMENT PROGRAMMES(PIE)
• Process Efficiency Programme• Quality Enhancing Innovation Programme
• Innovation and Creativity Programme• Performance Excellence Programme
• Conventions• Promotion and Sharing Seminars• Mindset Change Programme
INNOVATION CULTUREBUILDING (ICB)
INNOVATION PARTNERSHIP (IP)
• Collaboration Programme• Partnerships Programme• Networking Programme
Connectivity Capability
Culture Capacity
Chart 5.2: Programmes by MPC under EIIP
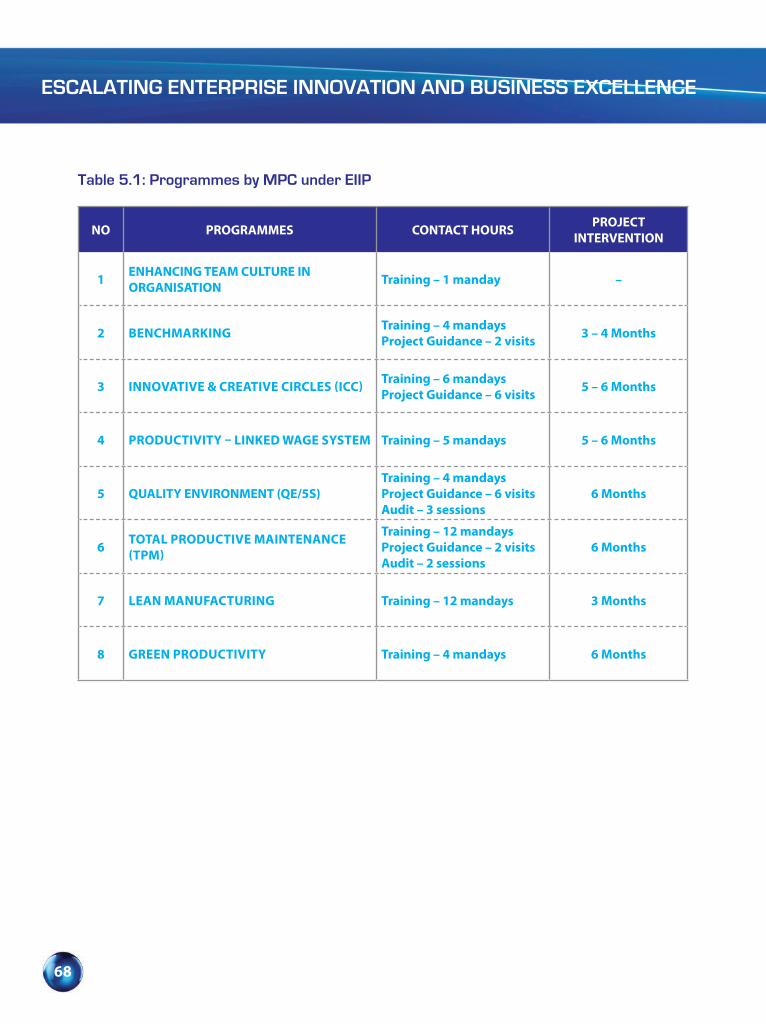
ESCALATING ENTERPRISE INNOVATION AND BUSINESS EXCELLENCE
68
Table 5.1: Programmes by MPC under EIIP
NO PROGRAMMES CONTACT HOURS PROJECT INTERVENTION
1 ENHANCING TEAM CULTURE IN ORGANISATION Training – 1 manday –
2 BENCHMARKING Training – 4 mandaysProject Guidance – 2 visits 3 – 4 Months
3 INNOVATIVE & CREATIVE CIRCLES Training – 6 mandaysProject Guidance – 6 visits 5 – 6 Months
4 PRODUCTIVIT LINKED WAGE SYSTEM Training – 5 mandays 5 – 6 Months
5 QUALITY ENVIRONMENT (QE/5S)Training – 4 mandaysProject Guidance – 6 visitsAudit – 3 sessions
6 Months
6 TOTAL PRODUCTIVE MAINTENANCE Training – 12 mandaysProject Guidance – 2 visitsAudit – 2 sessions
6 Months
7 LEAN MANUFACTURING Training – 12 mandays 3 Months
8 GREEN PRODUCTIVITY Training – 4 mandays 6 Months
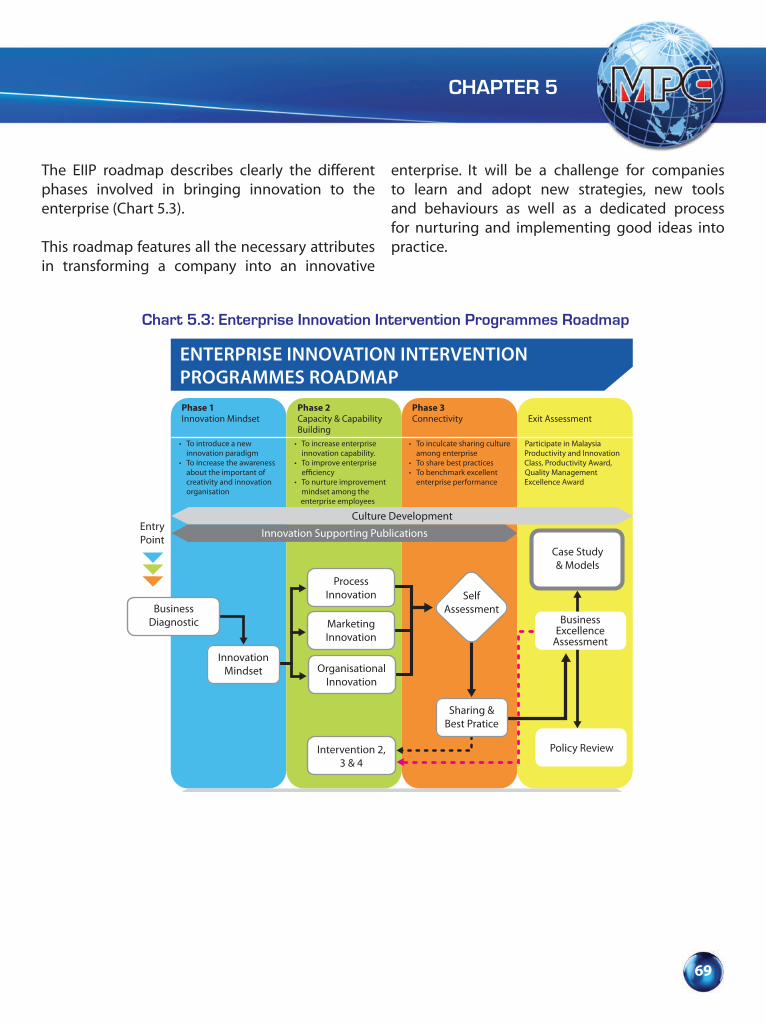
CHAPTER 5
69
The EIIP roadmap describes clearly the different phases involved in bringing innovation to the enterprise (Chart 5.3).
This roadmap features all the necessary attributes in transforming a company into an innovative
enterprise. It will be a challenge for companies to learn and adopt new strategies, new tools and behaviours as well as a dedicated process for nurturing and implementing good ideas into practice.
Research & Survey
Culture Development
Innovation Supporting Publications
Phase 1Innovation Mindset
Phase 2Capacity & CapabilityBuilding
Exit AssessmentPhase 3Connectivity
• To introduce a new innovation paradigm• To increase the awareness about the important of creativity and innovation organisation
• To increase enterprise innovation capability.• To improve enterprise e�ciency• To nurture improvement mindset among the enterprise employees
• To inculcate sharing culture among enterprise• To share best practices• To benchmark excellent enterprise performance
Participate in Malaysia Productivity and Innovation Class, Productivity Award,Quality Management Excellence Award
EntryPoint
ProcessInnovation
MarketingInnovation
OrganisationalInnovation
SelfAssessment
Sharing &Best Pratice
Intervention 2, 3 & 4
Policy Review
Case Study& Models
BusinessExcellence
Assessment
BusinessDiagnostic
ENTERPRISE INNOVATION INTERVENTIONPROGRAMMES ROADMAP
InnovationMindset
Chart 5.3: Enterprise Innovation Intervention Programmes Roadmap

ESCALATING ENTERPRISE INNOVATION AND BUSINESS EXCELLENCE
70
The measure of success of the EIIP is captured through evaluation of results. This evaluation results are important inputs to MPC as they provide information for ensuring the continuing effectiveness and relevance of EIIP.
To the company, the results contribute to the identification of good practices and lessons learned with respect to implementation of the programmes. The expected impacts from EIIP are summarised in Chart 5.4.
The target outcomes based on Key Performance Indicators are as follows:
• Reduce processing costs by 15%;
• Reduce supply chain costs by 10%;• Reduce inventories by approximately 30%;• Improve service levels up to 99%;• Productivity increased by 15%;• Forecast accuracy and stability improved to
95%;• Supply reliability increased to 90%;• Maintenance times reduced by 50%;• Reduce defects to 5 parts per million (ppm);
and• Machine uptime to 90%.
Intervention Programmes
The successful implementation of innovation in an organisation depends on the synergistic effort
Increase Productivity
Improve Innovation CapabilityImprove System
Reduce Waste
Chart 5.4: Outcomes from EIIP
CHAPTER 5
71
among technology, people, organisation and culture. EIIP is oriented towards building up the innovative competency of an organisation. It incorporates a holistic approach by introducing new techniques such as company health check systems, hands-on and project-based activities, productivity tools and techniques, mindset change programmes together with networking activities.
One of the successful projects under the EIIP Roadmap is MyKe. A total of 70 firms participated in the project and had showed impact in terms of productivity improvement, waste reduction, system improvement and also innovative capability.
To thrive and grow, organisations must adopt new work processes, technologies and transform the organisational culture to tap every employee’s capability towards higher productivity. One of the effective employee participative programmes introduced by MPC is Innovative and Creative Circle (ICC). ICC refers to a group of employee in an organisation coming together to proactively propose new ideas in creating or innovating products and services for their customers, companies and themselves. Regardless of the names, whether Six Sigma, Work Improvement Team (WIT), Lean Sigma, all these Small Group Activities (SGA) used problem-solving framework, tools and systematic approaches to accomplish their objectives.
Followings are some of the project innovations implemented by the ICC teams which provided new and improved ways of doing things.
• Invention of a special palm oil extractor without the use of n-Hexane and boiler
basket. As a result of this invention, the entire processing time of oil analysis has been reduced from 2255 minutes to 790 minutes and it also promotes a safe working environment;
• Development of a web-based calculation system of duty / tax to replace manual calculation. This system has been patented by Intellectual Property Corporation of Malaysia (MyIPO);
• Reduction in size change and reduced cycle cleaning tipping in a food industry by 30 minutes. The improvement contributed to 25% reduction in annual budget; and
• Promotion of green earth by increasing glass recycle usage to 9.95% compared to target of 2%, which save up to RM4 million.
Successful projects presented at the National ICC convention organised by MPC will be invited to represent Malaysia at the International Convention on QC Circle (ICQCC). ICQCC is an avenue to share successful case studies, enhance knowledge sharing and learn some of the excellent methods and technologies from teams from other countries.
One of the most tangible contributions from the implementation of ICC projects is the elimination of non-value added activities or waste at the workplace. The outcome was reflected through total cost saving. For a record, a total of RM124 million was saved from the implementation of 153 projects which were presented at the National ICC Convention 2011.
ESCALATING ENTERPRISE INNOVATION AND BUSINESS EXCELLENCE
72
Ability to minimise or eliminate non-value added activities will significantly reduce resources utilised such as time, labour and materials. With a reduction in these resources, expenditure may be reduced significantly. The savings brought about through the reduction of such expenditure may then be used to develop innovative products and services needed to expand business opportunities. One of the popular techniques adopted to reduce costs, improve quality and improve bottom line is lean management.
MPC has been diligently promoting Green Productivity (GP) programmes as a strategy to complement economic growth and environmental protection for overall socio-economic development leading to sustainable improvement in the quality of human life. Green Productivity aims at the integration of two important developmental strategies: action for productivity improvement and environmental protection. One of the tools that MPC uses to strengthen the GP practical activities is Material Flow Cost Accounting (MFCA). MFCA focuses on tracing waste, emissions, product losses, which can help to boost an organisation’s economic and environmental performance. With the adoption of the MFCA, all input materials that are flowing through the production process can be traced and the output in finished products and waste can be measured. MFCA provides both internal and external benefits to an organisation by enabling it to achieve more profits with lesser environmental impact.
Developing a Global Perspective
Enterprises need to be internationally competitive besides being successful in the domestic market.
Innovative capability is one of the factors in sustaining competitiveness. Entrepreneurs, who form a large component of the innovation eco-system have to be supported with continuous capability enhancement. With increasing awareness of global perspectives and a drive for enterprises to speed up innovation, MPC will continuously work together with the industries through collaborative programmes and most of all, deliver value to their quality of work life. After the completion of EIIP which covers areas such as diagnostic, intervention and re-assessment of the enterprises performances, successful enterprises are qualified for participation in industry awards conferred under the Business Excellence Framework (BEF) and subsequently, to export their products and services.
BUSINESS EXCELLENCE FRAMEWORK (BEF)
MPC established a new approach of Business Excellence as a technique to guide companies to manage and review their business performance. Previously BEF is promoted among organisations vying for the Quality Management Excellence Awards (QMEA) managed by MPC under the MITI Industry Excellence Awards. In 2010, MPC has given more emphasis to increase awareness among the industry players on the concept of BEF as an improvement tool. The BEF provides a comprehensive framework in assisting organisations to improve productivity by encouraging them to adopt a total approach in managing their organisations. It is a holistic framework that covers leadership, planning, information, people, processes, customers and results which are the key elements of a well-managed organisation.
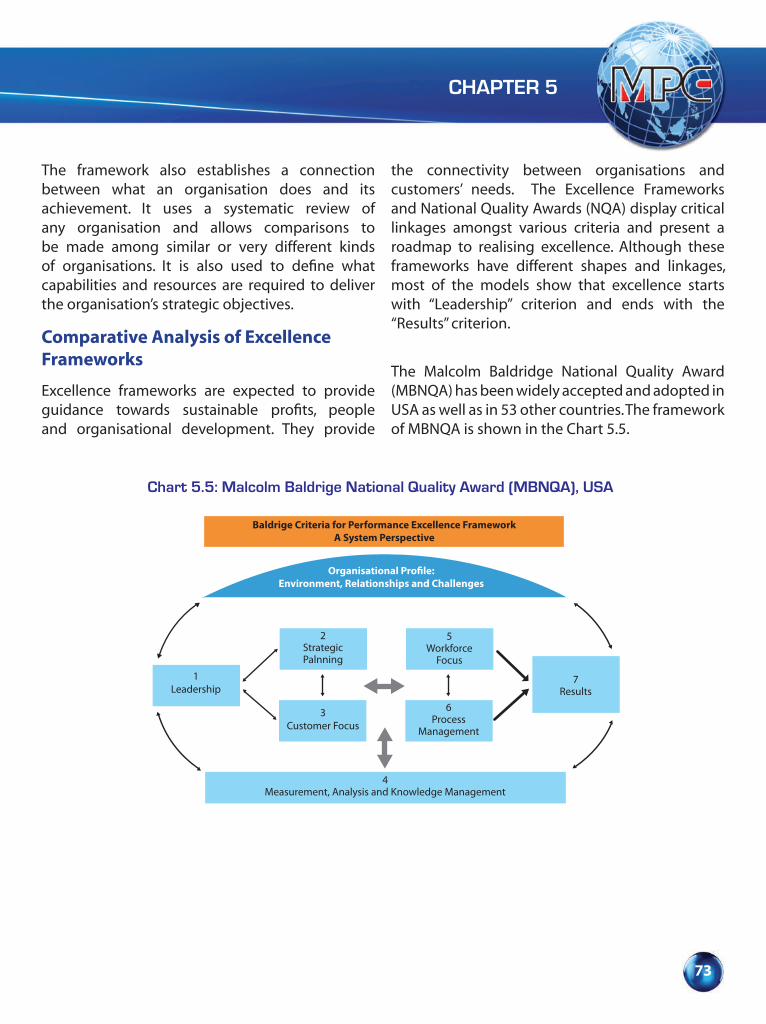
CHAPTER 5
73
The framework also establishes a connection between what an organisation does and its achievement. It uses a systematic review of any organisation and allows comparisons to be made among similar or very different kinds of organisations. It is also used to define what capabilities and resources are required to deliver the organisation’s strategic objectives.
Comparative Analysis of Excellence Frameworks
Excellence frameworks are expected to provide guidance towards sustainable profits, people and organisational development. They provide
the connectivity between organisations and customers’ needs. The Excellence Frameworks and National Quality Awards (NQA) display critical linkages amongst various criteria and present a roadmap to realising excellence. Although these frameworks have different shapes and linkages, most of the models show that excellence starts with ‘‘Leadership’’ criterion and ends with the ‘‘Results’’ criterion.
The Malcolm Baldridge National Quality Award (MBNQA) has been widely accepted and adopted in USA as well as in 53 other countries. The framework of MBNQA is shown in the Chart 5.5.
Organisational Pro�le:Environment, Relationships and Challenges
1Leadership
3Customer Focus
2Strategic Palnning
5Workforce
Focus
6Process
Management
7Results
4Measurement, Analysis and Knowledge Management
Baldrige Criteria for Performance Excellence FrameworkA System Perspective
Chart 5.5: Malcolm Baldrige National Quality Award (MBNQA), USA
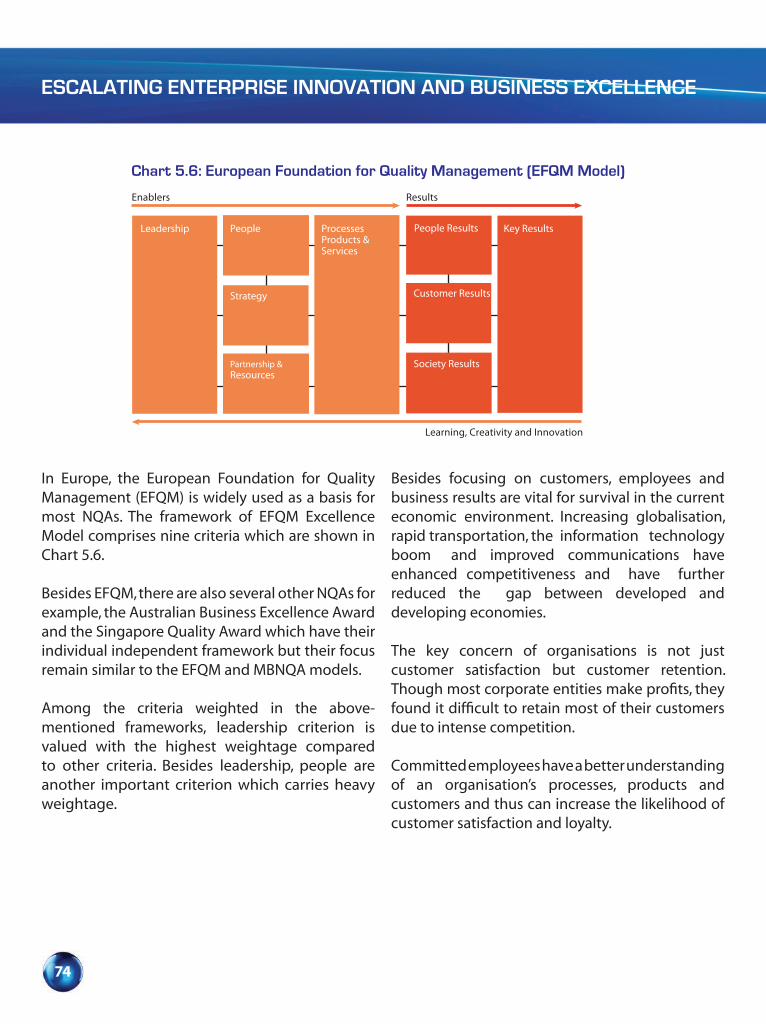
ESCALATING ENTERPRISE INNOVATION AND BUSINESS EXCELLENCE
74
In Europe, the European Foundation for Quality Management (EFQM) is widely used as a basis for most NQAs. The framework of EFQM Excellence Model comprises nine criteria which are shown in Chart 5.6.
Besides EFQM, there are also several other NQAs for example, the Australian Business Excellence Award and the Singapore Quality Award which have their individual independent framework but their focus remain similar to the EFQM and MBNQA models.
Among the criteria weighted in the above-mentioned frameworks, leadership criterion is valued with the highest weightage compared to other criteria. Besides leadership, people are another important criterion which carries heavy weightage.
Besides focusing on customers, employees and business results are vital for survival in the current economic environment. Increasing globalisation, rapid transportation, the information technology boom and improved communications have enhanced competitiveness and have further reduced the gap between developed and developing economies.
The key concern of organisations is not just customer satisfaction but customer retention. Though most corporate entities make profits, they found it difficult to retain most of their customers due to intense competition.
Committed employees have a better understanding of an organisation’s processes, products and customers and thus can increase the likelihood of customer satisfaction and loyalty.
Leadership People
Strategy
Partnership &Resources
ProcessesProducts &Services
People Results
Customer Results
Society Results
Key Results
Learning, Creativity and Innovation
Enablers Results
Chart 5.6: European Foundation for Quality Management (EFQM Model)
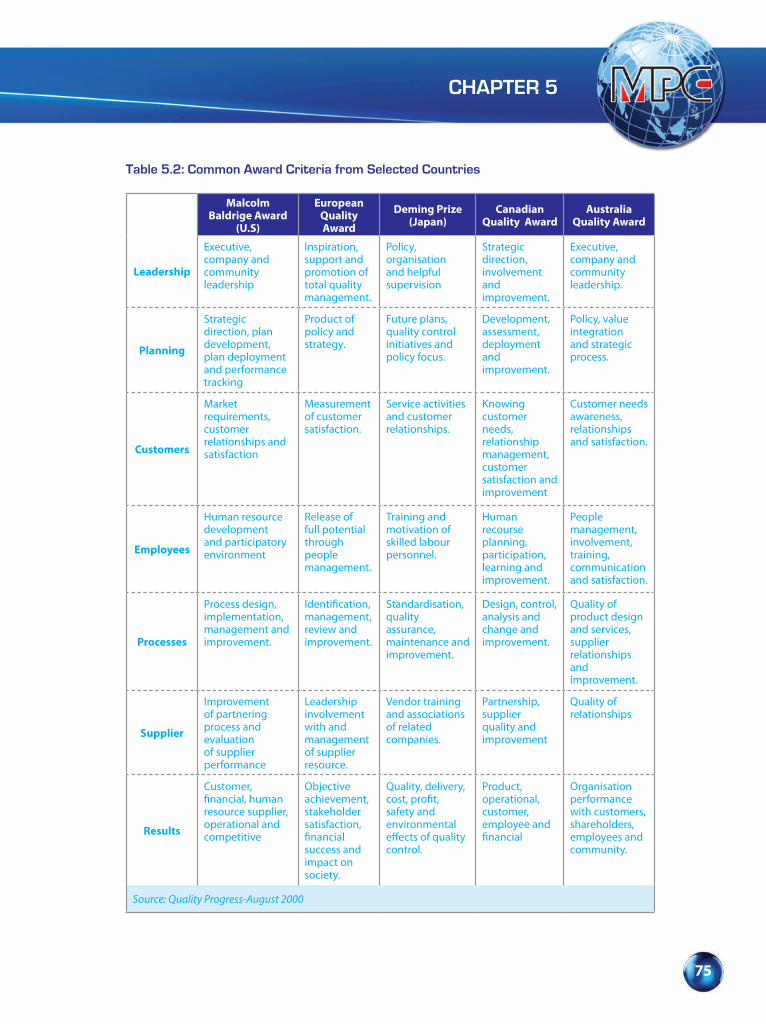
CHAPTER 5
75
Table 5.2: Common Award Criteria from Selected Countries
Malcolm Baldrige Award
(U.S)
European Quality Award
Deming Prize (Japan)
Canadian Quality Award
Australia Quality Award
Leadership
Executive, company and community leadership
Inspiration, support and promotion of total quality management.
Policy, organisation and helpful supervision
Strategic direction, involvement and improvement.
Executive, company and community leadership.
Planning
Strategic direction, plan development, plan deployment and performance tracking
Product of policy and strategy.
Future plans, quality control initiatives and policy focus.
Development, assessment, deployment and improvement.
Policy, value integration and strategic process.
Customers
Market requirements, customer relationships and satisfaction
Measurement of customer satisfaction.
Service activities and customer relationships.
Knowing customer needs, relationship management, customer satisfaction and improvement
Customer needs awareness, relationships and satisfaction.
Employees
Human resource development and participatory environment
Release of full potential through people management.
Training and motivation of skilled labour personnel.
Human recourse planning, participation, learning and improvement.
People management, involvement, training, communication and satisfaction.
Processes
Process design, implementation, management and improvement.
management, review and improvement.
Standardisation, quality assurance, maintenance and improvement.
Design, control, analysis and change and improvement.
Quality of product design and services, supplier relationships and improvement.
Supplier
Improvement of partnering process and evaluation of supplier performance
Leadership involvement with and management of supplier resource.
Vendor training and associations of related companies.
Partnership, supplier quality and improvement
Quality of relationships
Results
Customer,
resource supplier, operational and competitive
Objective achievement, stakeholder satisfaction,
success and impact on society.
Quality, delivery,
safety and environmental
control.
Product, operational, customer, employee and
Organisation performance with customers, shareholders, employees and community.
Source: Quality Progress-August 2000

ESCALATING ENTERPRISE INNOVATION AND BUSINESS EXCELLENCE
76
The above Table 5.2 shows that all the awards have the same seven quality criteria namely, leadership, planning, customers, employees, processes, suppliers and results. Even though they have the same criteria, the approaches and definitions involved in each criterion varies among the awards.
New Malaysia Business Excellence Framework (MBEF)
The revised Business Excellence Framework (BEF) is based on internationally accepted Business Excellence Frameworks. The framework was revised in 2011 to keep abreast with current international practices and to incorporate stakeholders’ proposals to include corporate social responsibility (CSR), innovation and Green Productivity (GP). The revised framework is also to suit the local economic condition.
Malaysia Business Excellence Framework (MBEF) comprises seven dimensions which are Leadership, Planning, Information, Customer, People, Process and Results. It has the following basic elements which are driver, system and results:
• Leadership which addresses how leaders develop and facilitate the achievement of the mission, vision and develop values required for long-term success;
• Planning which addresses on the organisation’s establishment of strategic objectives and action plans, deployment of plans and plans changed if circumstances require a change, how progress is measured and sustained;
• Information which focuses on management
Chart 5.7: New Business Excellence Framework
System(500pts)
Driver(150pts)
Result(350pts)
PLANNING
INFORMATION
CUSTOMER
PEOPLE
PROCESS
RESULTS
LEADERSHIP
LEARN INNOVATE TRANSFORM
CHAPTER 5
77
of information that is essential for promoting organisational improvements and innovations to create unique values, knowledge and the use of comparative data to support decision making and improvements at all levels of the organisation;
• Customer which addresses on customer engagement as an important outcome of an overall learning and performance of excellent strategy, determines customer and market requirements, builds relationship with customers and determines their satisfaction;
• People who addresses how the organisation manages, develops and releases the knowledge and full potential of its people at an individual, team based and organisation wide level. How it plans these activities in order to support its policy and strategy and the effective operation of its processes;
• Process which addresses how the organisation designs, manages and improves its processes in order to support its policy and strategy and fully satisfy and generate increasing value for its customers and other stakeholders. A process can be further defined as a bound set of inter-related work activities, each having prescribed input and output; and
• Results where these criteria are concerned with what an organisation has achieved. An organisation uses a number of key parameters to measure its performance.
Benefits of Malaysia Business Excellence Framework (MBEF) for Organisations
MPC is promoting the MBEF to provide organisation the ability to achieve and maintain their business excellent practices. It has been proven that organisation with BE approach obtains significant operational and financial benefits. This is due to their abilities to adapt to changes in the business environment within the shortest possible time through BEF.
Adoption of the BEF will enable an organisation to understand exhaustively the different functions, units, processes, systems that integrate with each other to produce the synergy effect. BEF also helps management and employees to share a common viewpoint on issues pertaining to the health of their organisation.
By embracing the BEF, organisations could implement a cohesive improvement strategy which integrates a range of improvement initiatives such as Improvement Teams, Lean Management, Statistical Process Control (SPC), ISO9001, ISO 14001 and Balanced Scorecard. It can also be used as a coordinating framework for managing and aligning various organisational improvement initiatives.
Practicing BEF will facilitate organisations to address various business challenges from different perspectives such as:
• Strategic planning to address changes in the business environment such as the financial crisis;
• Work force focus to address human resources, cultural and social issues;

ESCALATING ENTERPRISE INNOVATION AND BUSINESS EXCELLENCE
78
• Operations focus to address multiple legal requirements and international standards; and
• Leadership to address accountability, corporate governance, environmental and societal issues.
Indirectly, regular BE self-assessment can assist some organisations that cannot afford to have independent directors or consultants to assess and appraise the management and health of their organisation on a consistent basis. Regular BE self-assessment also fulfills some of these roles and ensure that due diligence is paid to business development and risks are identified and addressed. Besides, BEF provides a platform to the organisation for learning and sharing of best practices both within and between organisations.
Business Excellence (BE) Community
The BE Community was established as one of the strategies to accelerate the adoption of the BEF among the Malaysian industries on a more integrated approach. Members of the BE Community are from organisations and individuals across different industries with a common goal of developing a culture of business excellence to attain world class standard. Through the BE Community programme, MPC provides assistance to companies to:
• Establish the criteria for business together with an integrated management framework;
• Develop assessment tools to evaluate performance and improvement efforts;
• Provide comprehensive feedback report highlighting organisational strengths and opportunities for improvement; and
• Organise educational presentations, training, workshops and conferences on best practices
MPC extends BE Partner programme to large organisations and GLCs with the aim of continuously improving the operational performance and service delivery while developing business excellence culture across organisations’ systems and processes among their vendors and suppliers. The BE Partner programme with the academia is initiated to create synergy with universities and institutions of higher learning in developing and nurturing potential business excellence practitioners and assessors among graduate students.
The programme also aims to expand the capacity and capabilities of business excellence agents such as the BE assessors, practitioners, and consultants through training and certification programmes. With the relevant knowledge and experience in the business excellence practices, they will be able to lead their own organisation and also others in their journey towards excellence.
MPC will continue to expand and develop the members of the BE Community to ensure they will be provided with a deeper understanding and knowledge of the BEF and in return, be the catalyst in promoting the adoption of BEF among the industry. A total of 1,107 companies have adopt the BEF which comprised 885 SMEs companies in Peninsular Malaysia and 222 SMEs from Sabah and Sarawak in 2011. MPC had nurtured a total of 115 BE Practitioners, BE Assessors and BE Consultants in 2011 in order to develop a more comprehensive understanding and knowledge of BEF among them.
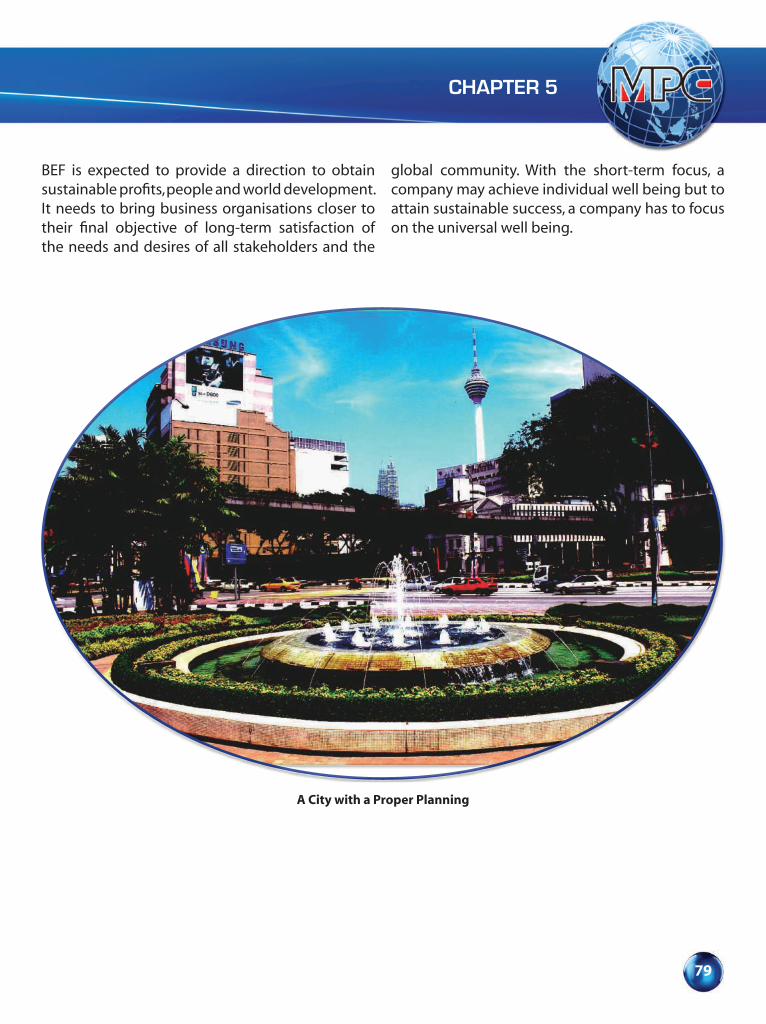
CHAPTER 5
79
BEF is expected to provide a direction to obtain sustainable profits, people and world development. It needs to bring business organisations closer to their final objective of long-term satisfaction of the needs and desires of all stakeholders and the
global community. With the short-term focus, a company may achieve individual well being but to attain sustainable success, a company has to focus on the universal well being.
A City with a Proper Planning

80 Productivity Report 2011/2012
Box 5.1: Knowledge Content Study in Enterprises (MyKe)
The study of Knowledge Content in key economic sectors was an initiative by the Economic Planning Unit, Prime Minister’s Department (EPU), Malaysia, carried out at both industry and sectoral level.
To achieve this, the Knowledge Content (MyKe) Survey, conducted by both the Department of Statistics and EPU in collaboration with the Georgia Institute of Technology, United States was implemented in 2003 (MyKe I) and in 2007 (MyKe II), involving 2,433 firms from 21 economic sectors.
The objective of the MyKe survey was to assess the knowledge content characteristics and constraints of 21 key sectors in Malaysia towards enhancing policy making for the knowledge economy.
MPC has been given the responsibility to implement the intervention programme which targeted to have participation of 70 firms in 2011 and an anticipated 130 firms in 2012. This project depends upon both the innovative and synergistic efforts among technology, people, organisation and culture.
The intervention programme was divided into three phases:1. Phase I – Diagnostic; 2. Phase II – Intervention; and3. Phase III – Business Excellence Assessment Audit;
A number of 70 firms had successfully undergone the intervention programme in 2011.
Phase I – DiagnosticEach firm was diagnosed using the Business Excellence Framework (BEF) assessment. The BEF consists of seven criteria which are Leadership, Planning, Information, Customer, People, Process and Business Result.
Box 5.1: Knowledge Content Study in Enterprises (MyKe)
21 Economic Sectors (Manufacturing, Services and Other Sectors)
1. Agriculture 12. Tertiary Education Services2. Food Processing 13. 3. Chemicals, Petroleum, Pharmaceuticals 14. Tourism Services4. Rubber and Plastic Products 15. Health Services5. Wood-based Products 16. Information Technology Services6. Fabricated Metals 17. Business Services7. Automotive 18. Wholesale and Retail Trade8. Transport Equipment 19. Telecommunications and Courier9. Textile, Wearing Apparel & Footwear 20. Transportation Services (Ports, Airports,
Shipping)10. Electrical and Electronics11. Machinery and Instruments 21. Construction
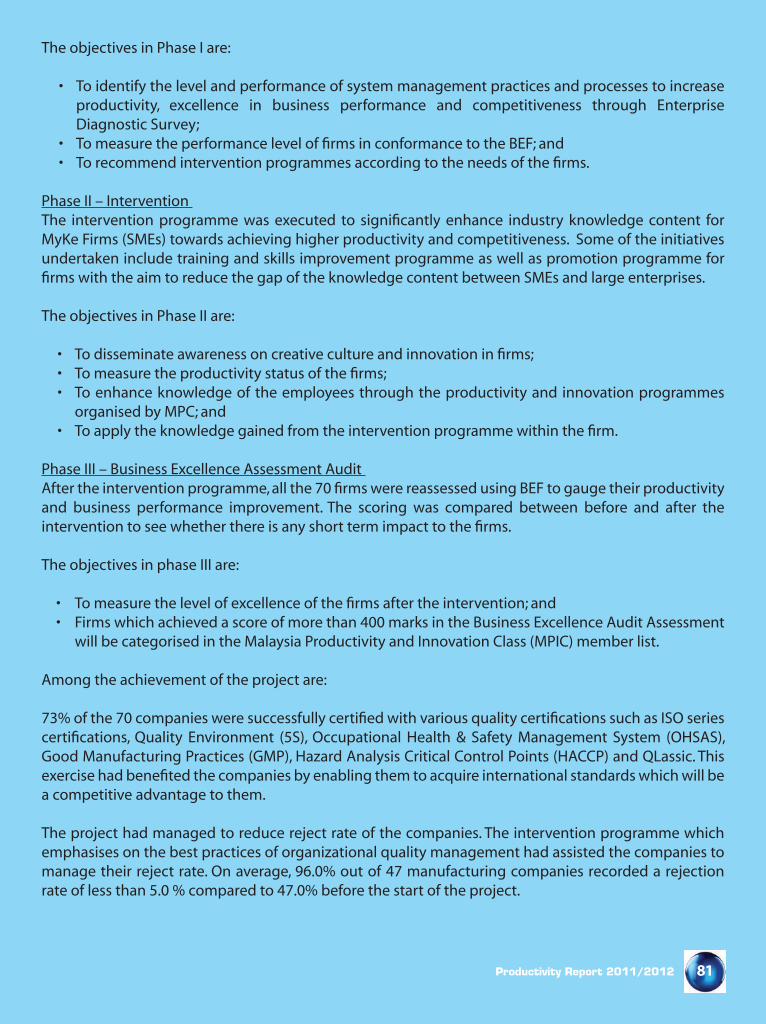
81Productivity Report 2011/2012
The objectives in Phase I are:
• To identify the level and performance of system management practices and processes to increase productivity, excellence in business performance and competitiveness through Enterprise Diagnostic Survey;
• To measure the performance level of firms in conformance to the BEF; and• To recommend intervention programmes according to the needs of the firms.
Phase II – Intervention The intervention programme was executed to significantly enhance industry knowledge content for MyKe Firms (SMEs) towards achieving higher productivity and competitiveness. Some of the initiatives undertaken include training and skills improvement programme as well as promotion programme for firms with the aim to reduce the gap of the knowledge content between SMEs and large enterprises.
The objectives in Phase II are:
• To disseminate awareness on creative culture and innovation in firms;• To measure the productivity status of the firms;• To enhance knowledge of the employees through the productivity and innovation programmes
organised by MPC; and• To apply the knowledge gained from the intervention programme within the firm.
Phase III – Business Excellence Assessment Audit After the intervention programme, all the 70 firms were reassessed using BEF to gauge their productivity and business performance improvement. The scoring was compared between before and after the intervention to see whether there is any short term impact to the firms.
The objectives in phase III are:
• To measure the level of excellence of the firms after the intervention; and • Firms which achieved a score of more than 400 marks in the Business Excellence Audit Assessment
will be categorised in the Malaysia Productivity and Innovation Class (MPIC) member list.
Among the achievement of the project are:
73% of the 70 companies were successfully certified with various quality certifications such as ISO series certifications, Quality Environment (5S), Occupational Health & Safety Management System (OHSAS), Good Manufacturing Practices (GMP), Hazard Analysis Critical Control Points (HACCP) and QLassic. This exercise had benefited the companies by enabling them to acquire international standards which will be a competitive advantage to them.
The project had managed to reduce reject rate of the companies. The intervention programme which emphasises on the best practices of organizational quality management had assisted the companies to manage their reject rate. On average, 96.0% out of 47 manufacturing companies recorded a rejection rate of less than 5.0 % compared to 47.0% before the start of the project.

82 Productivity Report 2011/2012
Efficient delivery time is vital to the businesses. The project had also managed to improve the companies’ delivery time. Before the intervention only 40 out of the 70 firms had 90.0% time delivery achievement. After intervention, an additional 13 firms had achieved the 90.0% time delivery.
Customer satisfaction is very important to measure customers’ acceptance in the market. Before the intervention, 75.0% of the participating firms had achieved a Customer Satisfaction Index (CSI) of more than 75.0%. After the intervention, 98.0% of those participating firms had achieved this CSI score.
In line with this intervention, the project had helped firms to review their business innovation culture as well as improving processes and procedures to facilitate and enhance the industry knowledge content towards achieving high productivity and competitiveness.
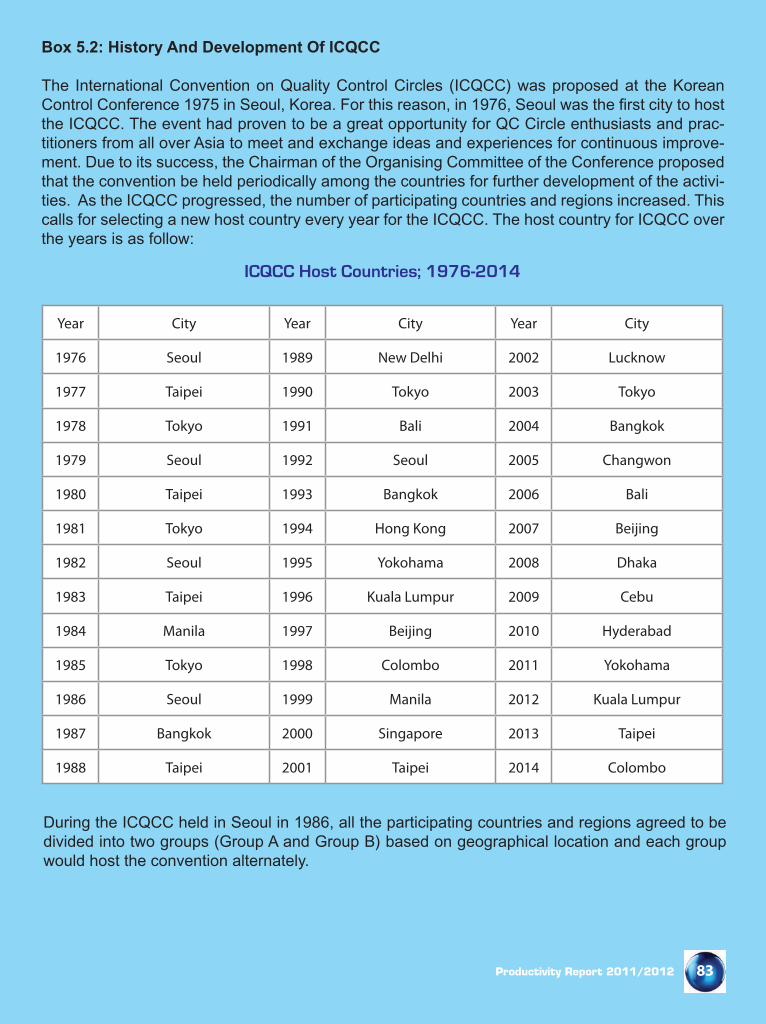
83Productivity Report 2011/2012
Box 5.2: History And Development Of ICQCC
The International Convention on Quality Control Circles (ICQCC) was proposed at the Korean Control Conference 1975 in Seoul, Korea. For this reason, in 1976, Seoul was the first city to host the ICQCC. The event had proven to be a great opportunity for QC Circle enthusiasts and prac-titioners from all over Asia to meet and exchange ideas and experiences for continuous improve-ment. Due to its success, the Chairman of the Organising Committee of the Conference proposed that the convention be held periodically among the countries for further development of the activi-ties. As the ICQCC progressed, the number of participating countries and regions increased. This calls for selecting a new host country every year for the ICQCC. The host country for ICQCC over the years is as follow:
During the ICQCC held in Seoul in 1986, all the participating countries and regions agreed to be divided into two groups (Group A and Group B) based on geographical location and each group would host the convention alternately.ICQCC Host Countries; 1976-2014
Group A (North)
China Association for QualityHong Kong Productivity CouncilUnion of Japanese Scientists and EngineersKorean Standards AssociationProductivity Improvement Circles Association of the PhilippinesThe Association of Pioneer Quality Control Research
ChinaHong KongJapanKoreaPhilippinesTaiwan
Group B (North)
Bangladesh Society for Total Quality ManagementQuality Circle Forum of IndiaIndonesian Quality Management AssociationMalaysia Productivity CorporationSingapore Productivity AssociationSri Lanka Association for the Advancement of Quality & ProductivityThe Association of QC Headquarters of Thailand
BangladeshIndiaIndonesiaMalaysiaSingaporeSri LankaThailand
Box 5.2: History And Development Of ICQCC
ICQCC Host Countries; 1976-2014
Year City Year City Year City
1976 Seoul 1989 New Delhi 2002 Lucknow
1977 Taipei 1990 Tokyo 2003 Tokyo
1978 Tokyo 1991 Bali 2004 Bangkok
1979 Seoul 1992 Seoul 2005 Changwon
1980 Taipei 1993 Bangkok 2006 Bali
1981 Tokyo 1994 Hong Kong 2007 Beijing
1982 Seoul 1995 Yokohama 2008 Dhaka
1983 Taipei 1996 Kuala Lumpur 2009 Cebu
1984 Manila 1997 Beijing 2010 Hyderabad
1985 Tokyo 1998 Colombo 2011 Yokohama
1986 Seoul 1999 Manila 2012 Kuala Lumpur
1987 Bangkok 2000 Singapore 2013 Taipei
1988 Taipei 2001 Taipei 2014 Colombo

84 Productivity Report 2011/2012
Kuala Lumpur , Malaysia as the Host Country for ICQCC 1996
The first time Malaysia was given the honour to host the 21st ICQCC was on 28-30 October 1996 in Kuala Lumpur with the theme ‘Beyond Excellence Through Quality’. The convention provided a platform for the quality experts and top QC Circles from various countries to generate ideas and share their experiences that eventually translated into new ways for producing better products and services.
The official opening by the Minister of International Trade and Industry
The Head of Delegations at the Coordinating Committee Meeting
ICQCC Host Countries; 1976-2014
Group A (North)
China Association for QualityHong Kong Productivity CouncilUnion of Japanese Scientists and EngineersKorean Standards AssociationProductivity Improvement Circles Association of the PhilippinesThe Association of Pioneer Quality Control Research
ChinaHong KongJapanKoreaPhilippinesTaiwan
Group B (North)
Bangladesh Society for Total Quality ManagementQuality Circle Forum of IndiaIndonesian Quality Management AssociationMalaysia Productivity CorporationSingapore Productivity AssociationSri Lanka Association for the Advancement of Quality & ProductivityThe Association of QC Headquarters of Thailand
BangladeshIndiaIndonesiaMalaysiaSingaporeSri LankaThailand
Box 5.2: History And Development Of ICQCC
ICQCC Host Countries; 1976-2014
Year City Year City Year City
1976 Seoul 1989 New Delhi 2002 Lucknow
1977 Taipei 1990 Tokyo 2003 Tokyo
1978 Tokyo 1991 Bali 2004 Bangkok
1979 Seoul 1992 Seoul 2005 Changwon
1980 Taipei 1993 Bangkok 2006 Bali
1981 Tokyo 1994 Hong Kong 2007 Beijing
1982 Seoul 1995 Yokohama 2008 Dhaka
1983 Taipei 1996 Kuala Lumpur 2009 Cebu
1984 Manila 1997 Beijing 2010 Hyderabad
1985 Tokyo 1998 Colombo 2011 Yokohama
1986 Seoul 1999 Manila 2012 Kuala Lumpur
1987 Bangkok 2000 Singapore 2013 Taipei
1988 Taipei 2001 Taipei 2014 Colombo
The Head of Delegations at theCoordinating Committee Meeting
The o�cial opening by the Minister ofInternational Trade & Industry
The Head of Delegations at theCoordinating Committee Meeting
The o�cial opening by the Minister ofInternational Trade & Industry
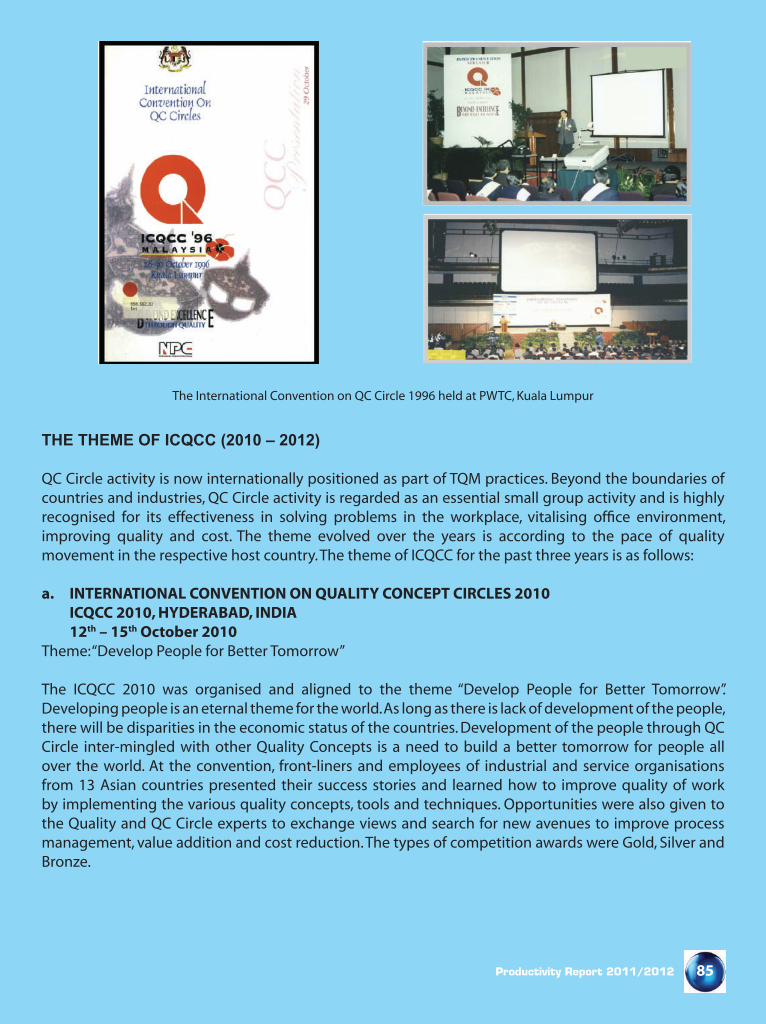
85Productivity Report 2011/2012
THE THEME OF ICQCC (2010 – 2012)
QC Circle activity is now internationally positioned as part of TQM practices. Beyond the boundaries of countries and industries, QC Circle activity is regarded as an essential small group activity and is highly recognised for its effectiveness in solving problems in the workplace, vitalising office environment, improving quality and cost. The theme evolved over the years is according to the pace of quality movement in the respective host country. The theme of ICQCC for the past three years is as follows:
a. INTERNATIONAL CONVENTION ON QUALITY CONCEPT CIRCLES 2010 ICQCC 2010, HYDERABAD, INDIA 12th – 15th October 2010Theme: “Develop People for Better Tomorrow”
The ICQCC 2010 was organised and aligned to the theme “Develop People for Better Tomorrow”. Developing people is an eternal theme for the world. As long as there is lack of development of the people, there will be disparities in the economic status of the countries. Development of the people through QC Circle inter-mingled with other Quality Concepts is a need to build a better tomorrow for people all over the world. At the convention, front-liners and employees of industrial and service organisations from 13 Asian countries presented their success stories and learned how to improve quality of work by implementing the various quality concepts, tools and techniques. Opportunities were also given to the Quality and QC Circle experts to exchange views and search for new avenues to improve process management, value addition and cost reduction. The types of competition awards were Gold, Silver and Bronze.
The International Convention on QC Circle 1996 held at PWTC, Kuala LumpurThe International Convention on QC Circle 1996 held at PWTC, Kuala LumpurThe International Convention on QC Circle 1996 held at PWTC, Kuala LumpurThe International Convention on QC Circle 1996 held at PWTC, Kuala Lumpur
86 Productivity Report 2011/2012
b. ICQCC 2011, YOKOHAMA, JAPAN 11th -14th September 2011
Theme: “Enhancing Organisational Vitality through Further Development of QC Circle Activities”, Yokohama, Japan
Japan determined to fulfill its role to the best of its ability to lead the world in manufacturing at ICQCC’11-Yokohama. The convention was organised by the Union of Japanese Scientists and Engineers (JUSE). The objective of this convention was to provide a platform for practitioners of QC from different countries and regions to exchange views and experiences on initiatives to intensify activities related to improving Productivity and Quality (P&Q) at the organisational level. The theme for the convention was “Enhancing Organisational Vitality Through Further Development of QC Circle Activities”. It was highlighted that team effort had contributed to the success of the QC Circles in organisations. This breaks down the demarcation between departments, divisions and any hierarchy which may lead to specific identification of problems and fast solutions as there are no barriers. A total of 1,168 delegates from 14 nations participated in this event. The awards presented during the convention were Excellent, Outstanding or Meritorious.
c. ICQCC 2012, KUALA LUMPUR, MALAYSIA 14th - 17th October, 2012
Theme: “From Ideas To Reality “
Malaysia, for the second time will be hosting ICQCC 2012 from 14 to 17 October, 2012 in conjunction with the Annual Productivity and Innovation Conference (APIC) in Kuala Lumpur. The event will be held at Kuala Lumpur Convention Centre in the heart of Kuala Lumpur. Participating as observers, circle members, or paper presenters are invited to join this event and making it a reality for all. Objectives of this convention are to:
• Propagating innovative initiatives and creative projects to enhance the effectiveness of service delivery system in organisation;
• Sharing knowledge and experiences in implementing innovative projects and adding values to the QCC project; and
• Providing a platform for benchmarking activities in terms of comparative levels of achievement and organisational impact among the participating countries.
The theme of ICQCC 2012 is “From Ideas to Reality” corresponds with the gist of QCC in bringing ideas of improvement and the continuity of development into reality which will be beneficial to the organisations. A total of 1,200 participants from 12 countries are expected to participate in this event. The awards will be categorised into 3-star, 2-star and 1-star.
87Productivity Report 2011/2012
Box 5.3: Moving Quality Environment (QE)/5S To Lean Management
Quality Environment (QE)/5S philosophy focuses on effective workplace organization and standard workplace procedures. QE/5S simplifies work environment, reduces waste and non-value added activities to improve quality, efficiency and safety.
The QE/5S concept involves sort (seiri), set in order (seiton), shine (seiso), standardise (seiketsu) and sustain (shitsuke).This concept has been introduced and perfected by Toyota in order to make wastes visible and to eliminate it. This is the basic requirement to establish operational stability and to sustain continuous improvement initiatives.
QE/5S is one of the foundations in lean management practices. QE/5S and visual management are the concept which encompasses critical information at the point of needs. It provides the impetus towards this initiative by ensuring all information remains clearly visible, understood and being adhered to. A visual workplace minimises time in motion searching, waiting, retrieving and reworking.
What is Lean management?
The core idea of lean management is to maximise customer value while minimising wastes along the entire value chain. The definition of lean as developed by National Institute of Standard and Technology of USA is “…a systematic approach to identifying and eliminating waste through continuous improvement, flowing the product at the pull of the customer in pursuit of perfection..”
Lean management is derived mostly from Toyota Production System (TPS). The TPS system focuses on the entire process of the product flow. It introduces self-monitoring mechanism to ensure quality. The machines are line-up in the process sequence to smoothen the production flows. The single minute exchange dies (SMED) was introduced to shorten the set-up time. All these initiatives allowed Toyota to obtain low cost, high variety, high quality and rapid throughput time to meet customer needs.
The concept of wastes as mentioned above is usually refer as non-value added activities and popularly known as the seven wastes as listed below. According to Mr.Taiichi Ohno, (co-developer of Toyota Production System), these wastes accounted for up to 80% of working time where 45% of it is total waste (*muda) which is entirely unnecessary in achieving the operational objectives. The remaining percentage is also non-value added activities which are inevitable and have to be incurred under the current working environment.
The seven wastes (muda) are as follows:
a) Over-productionProduce more than the customer demands. Any excess beyond this (buffer or safety stocks, work-in-progress inventories, etc) ties up valuable labour and material resources that might otherwise be used efficiently. This creates excessive lead-time, higher storage cost and difficulty in detecting defects.
88 Productivity Report 2011/2012
Over production is caused by:• Inflexible large batch size;• Poor human resource utilisation; and• Supply, rather than demand driven marketing policy.
b) WaitingThe waste in waiting occurs when goods are not moving or being processed. Typically, such waste includes waiting for materials, information, equipment, tools, etc. Much of product’s lead-time is wasted while waiting for the next process. Waiting is caused by:• Shortage and unreliable supply chain;• Machine downtime/breakdown; and• Ineffective production planning, etc.
c) TransportationTransporting product between processes is a cost which adds no value to the product. Excessive movement and handling cause damage and deterioration to quality. Materials shall be shipped directly from vendor to the location in the assembly line where it will be used. This technique is called point-of-use storage (POUS). Hence the current practice of shipping from vendors to warehouses and subsequently, to the assembly point should be discouraged. The transportation waste is caused by:• Badly designed processes;• Poor value stream flows; and• Complex material flows, etc.
d) Over processing/non-value-added processWaste happens when work is done more than required to meet the customer’s requirements or using expensive high precision equipment where simpler tools would be sufficient. Hence, management is compelled to fully utilise the equipment in order to recover its cost leading to excessive production. Over processing is caused by:• Attitude such as “always do it like this way”;• Not understanding the processes; and• Lack of innovation and improvement, etc;
e) MotionThis waste is related to ergonomic as seen in workers’ movement such as bending, stretching, walking, lifting, and reaching. The unnecessary movement is waste. These movements are also related to safety and health issues. Unnecessary motion is caused by: • Uncoordinated work flow; • Badly designed floor layout; and • Poor housekeeping, etc.

89Productivity Report 2011/2012
f ) InventoryExcess inventory consumes productive floor space and increase the lead time which must be identified and resolved in order to improve operating performance. Excess inventory is caused by:• Production schedule not synchronised along the process flow;• Inflexible large batch size; and • Inaccurate market forecasting, etc.
g) DefectsHaving a direct impact to the bottom line, defects resulting in rework, repair and scrap are additional cost to the company. Associated costs include reinspecting, rescheduling and capacity loss.Production defects and service errors are wasted in the following:
i. Materials consumed;ii. The labour used to produce the parts;iii. Additional labour is required to rework and repair; andiv. Additional labour is required to address any customer complaint.
The defects are caused by:• Poor production and planning of control;• Lack of skill and inadequate training; and• Uncalibrated machine, etc.
*muda – Is a Japanese word for ‘waste’

90 Productivity Report 2011/2012
Box 5.4: Green Productivity (GP) for Sustainable Development
The Earth Summit in Rio de Janeiro (1992), recommended that economic development and environmental protection to be the key strategies for sustainable development. Following this development, GP was launched by the Asian Productivity Organisation (APO) in 1994.
GP is the capacity to produce in a sustainable and ecological manner with little or no detriment to the earth and immediate environment, bringing a new dimension to the term “productivity”. The focus of GP related programmes include such topics like “Greening The Supply Chain”, “Energy Efficiency”, “Environmental Management” and organising Eco-products International Fair (EPIF) which showcase advanced environmental technologies, provide opportunities for business collaboration and promote public awareness of green products and services.
GP, being an evolving concept, aims to integrate two important developmental strategies, namely, action for productivity improvement and environmental protection. GP is also the application of the appropriate techniques, technologies and management systems to produce environmentally sustainable goods and services.
The concepts and strategies for enhancing the environment and abatement efforts vary. However, in order for it to be successful, these concepts and strategies have to take into account, the cost implications and benefits it brings to an organisation and the community.
The methodologies of GP can be applied in the fields of manufacturing, services, agriculture and also to the local communities. The benefits are more evident when GP is practised at the community level and less evident when applied at a factory. At the community level, the GP approach is used to solve community problems such as the cleaning of water supply, management and treatment of solid and liquid wastes to enhance quality of life. In the industries, the direct benefits are increased profitability accrued to the owners and better working conditions for the workers, depending on the decision of the management.
Among the numerous benefits that can be achieved are:
• Improved Quality of Life The improved environment derived from the practices of GP includes cleaner and healthier living
conditions and an improved quality of life within the workplace as well as in the surrounding areas.
• Sustainable Development The ultimate objective of GP is sustainable development. Though by itself, GP cannot be equated
with sustainable development, it operates within the framework of sustainable development. This means that in practice, it strives to ensure ecological sustainability in the productive process. GP aspires to achieve a higher level of productivity and at the same time, enhances the quality of the environment.
91Productivity Report 2011/2012
Actions undertaken by the Government include a more proactive approach to counter the environmental problems to prevent the recurrence of the 1970s and 1980s global environmental crisis.
Malaysia Productivity Corporation (MPC) has been diligently carrying out Quality Environment (QE) programme which encompasses GP, 5S, and Innovative and Creative Circle (ICC). It creates a more conducive, clean and tidy environment. QE is accessible and achievable for all types of organisations where the implementation and practices contribute towards increasing productivity and quality. A successful QE programme also contributes to a change in culture as well as a change in processes and work practices.
MPC has actively organised a number of GP activities including:• Training programmes, seminars and workshops on GP;• Green technology workshops for international participants;• Demonstration projects;• Exhibitions and conferences;• GP printed materials (guide books, GP application cases, Green Procurement and Its Impact On The
Green Supply Chain); and• Nurturing green practices among secondary schoolchildren.
The main focus of the GP programmes carried out by MPC is on the practical approach starting from workplace practice.
The action for environmentally sustainable development in the manufacturing sector starts from the operational areas. Operational areas could produce environmentally sustainable goods of higher quality. This helps to reduce carbon footprint and negative impact such as the release of greenhouse gases.
Pilot projects carried out in an automotive industry had shown that GP practices had resulted in lesser wastage, better resource utilisation and reduced energy consumption. This is a clear indication that productivity enhancement should not necessary be at the expense of the environment.

92 Productivity Report 2011/2012
Box 5.5: Enhancing Productivity through Material Flow Cost Accounting (MFCA)
MFCA is an environmental tool that was developed in Germany in the late 1990s and has been adopted widely in Japan. MFCA focuses on tracing waste, emissions and products which do not add value and can help to boost an organisation’s economic and environmental performance. Through MFCA, all input materials that are flowing through the production process can be traced and the output in the form of finished products and waste can be measured.
In addition, MFCA provides both internal and external benefits to an organisation by enabling it to generate more profit with lesser environmental impact. A typical internal benefit is the enhancing of an organisation’s competitiveness as MFCA enhances both profit and material productivity.
In order to standardise MFCA practices, the development and publication of ISO 14051 was carried out and published in September 2011. It complements the ISO 14000 family of Environmental Management System (EMS) including Life Cycle Assessment (ISO 14040, ISO 14044), Environmental Performance Evaluation (ISO 14031) and the MFCA with ISO 14051.
MPC together with the Asian Productivity Organisation (APO) and the Japan Productivity Centre (JPC) had implemented a pilot project (27 Sept. 2010 – 7 March 2012) aimed at strengthening the Green Productivity (GP) efforts. This pilot project on MFCA involved five model companies consisting of two companies producing automotive components, a transmission cable manufacturing company, an industrial plastic magnet manufacturer and a high precision metal engineering company. Total cost savings achieved at the end of the project was RM 1,635,633.87. The project is very much in line with the GP concept and can be used as one of the tools to implement GP in any organisation or factory.
Introducing MFCA
Model products and lines
Performing MFCA Calculations
MFCA makes losses and their scale visible
(Recognition and surprise)
Identifying and recognisingproblems
Identifying, classifying and stratifying improvement requirements
1) Cost retention
Improvement requirements to be addressed on on-side day-to-day basis
3) Cost Planning
Improvement requirements to be addressed in the development stage of a new products
Set targets for the new product, resolve problems and estimateimprovement e�ect
2) Cost improvement
Improvement requirement that cannot be addressed on manufacturing sites, such as changing design, method or equipment
Set management indicators, and promote improvement on an on-site day-to-day basis
Assess ROI of capital and other investment, and make decisions on implementation
Set Improvement indicators, and promote improvement planning, e�ect evaluation and progress control
How to proceed with management and improvement based on MFCA ?
Introduction and Application of MFCA Management and Improvement MeasuresFeatures of Improvement
Improvement Initiatives Under MFCA
93Productivity Report 2011/2012
Benefits of the MFCA Programme
• The resource productivity of companies improved through MFCA; • Project consultants’ skills and knowledge in MFCA improved due to their involvement;• (Developing and disseminating consultancy materials and manuals on MFCA; and• Recognition on the importance of resource productivity improvement via MFCA applications in
the model company.
The application of Green Productivity (GP) programmes incorporating MFCA is also being explored in many disciplines to disseminate this concept. Issues like Occupational Health and Safety, Energy Management, Hazardous Waste Management, Total Quality Environmental Management, Life Cycle Assessment (LCA), Eco-Design and B2B co-operation for Eco E-commerce (E2-Commerce) have been addressed throughout the years under the various multi-country programmes, Green Productivity Demonstration Programmes (GPDP) and surveys on their practices.
Their inherent linkage with competitiveness and environmental protection is very suitable to the local scenario making GP concept the cornerstone of Malaysia’s sustainable development endeavours. Concurrently, MPC is also developing related services and activities in line under its Enterprise Innovation Intervention Programme (EIIP) with technical cooperation from JPC and APO.

94 Productivity Report 2011/2012
Box 5.6: Achieving Excellence through Quality Management Excellence Award (QMEA)
The Quality Management Excellence Award (QMEA) is one of the industry excellence awards offered by Ministry of International Trade and Industry (MITI), and implemented by MPC. The award was first introduced in 1990 to promote and review the application of quality management practices among enterprises in their daily operations and for strategic decisions. The outcome of this award is recognition to companies that demonstrated effective application of quality management resulting in improved business performance and increase customer and employee satisfactions.
The objectives of QMEA are:• To promote quality awareness among various organisations in the private sector;• To promote the adoption of quality values in organisations;• To encourage healthy competition among organisations towards continuous improvement of
quality; and• To encourage information sharing on successful performance strategies and the benefits derived
from using these strategies.
In order to help organisations remain competitive in the challenging business climate, the award offers a systematic approach that identifies critical areas that need to be further improved. As a result, companies will be able to inculcate good quality culture in managing organisations effectively.
Prior to 2011, organisations were evaluated by seven excellence criteria that served as the basis for the Organisational Excellence Framework which were as follows:
• Top Management Leadership and Management of Quality;• Use of Quality Data and Information;• Human Resource Management;• Customer Focus;• Quality Assurance of External Suppliers;• Process Management; and• Quality and Operational Business Results.
QMEA has been reviewed in 2011 to incorporate more elements on business excellence practices particularly on innovation, green initiatives and corporate social responsibility. The introduction of these new practices in this award is in accordance with the implementation of Business Excellence Framework (BEF). BEF is a business model to promote and assist enterprises to strengthen their management systems, practices and processes for higher performance. This model incorporates elements such as:
• Leadership;• Planning;• Information;• Customer;• People;• Process; and• Results

95Productivity Report 2011/2012
BEF is an established guideline based upon experiences of practitioners from international award organisations which guide companies toward excellence. Companies adopting BEF and scored a commendable level of marks will be recommended to participate in QMEA. Participation in the award allows a third party assessment on the effectiveness of a company’s productivity improvement initiatives and its comparative advantages.
The changes to the framework used for QMEA assessment is based on the latest and similar frameworks adapted from other internationally recognised organisations as well as result of research conducted over the years with the industries. Some of the business excellence models adapted for QMEA include:
• Baldrige Criteria for Performance Excellence;• European Foundation for Quality Management (EFQM);• Singapore Quality Award Model;• Japan Quality Award Model;• Canadian Business Excellence Model; and• Australian Business Excellence Framework.
For the past two years, a total of 119 companies had participated in QMEA, mainly from the small and medium-sized enterprises (SMEs). The increase in participation was due to companies realising the importance of excellence management systems and how they drive performance excellence with consistent results and contribute to organisational success.

SYNERGY THROUGH PUBLIC-PRIVATE
COLLABORATION
PART
3

CHAPTER 6
PRODUCTIVITY PERFORMANCE OF THE SERVICES SECTOR
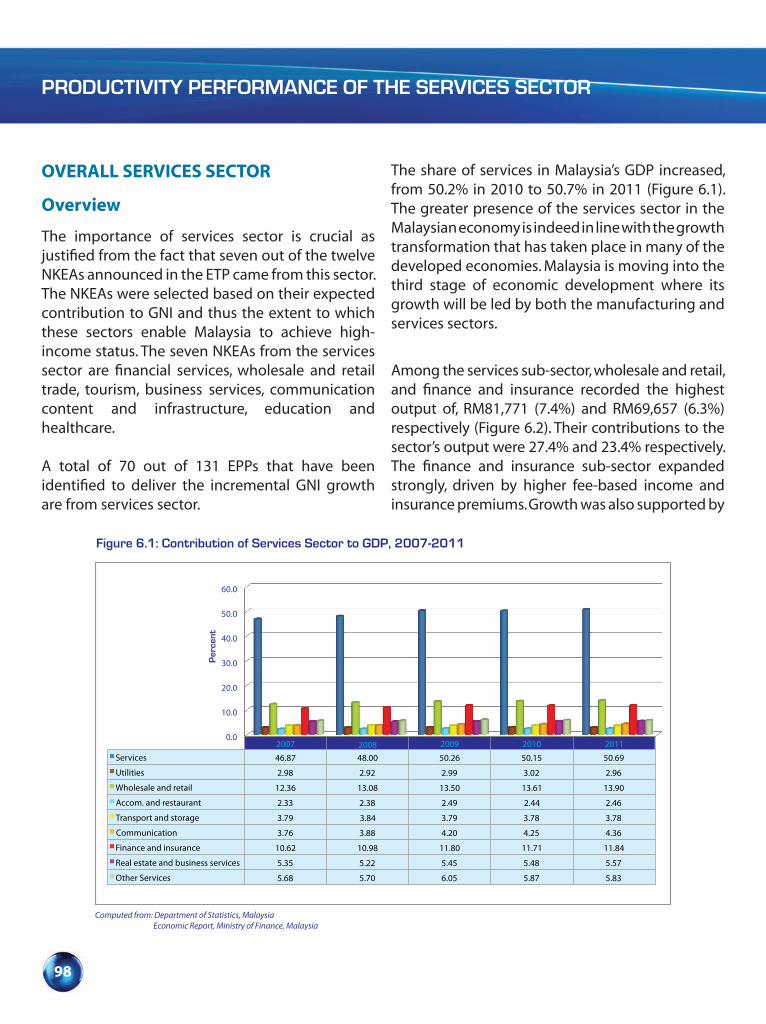
PRODUCTIVITY PERFORMANCE OF THE SERVICES SECTOR
98
OVERALL SERVICES SECTOR
Overview
The importance of services sector is crucial as justified from the fact that seven out of the twelve NKEAs announced in the ETP came from this sector. The NKEAs were selected based on their expected contribution to GNI and thus the extent to which these sectors enable Malaysia to achieve high-income status. The seven NKEAs from the services sector are financial services, wholesale and retail trade, tourism, business services, communication content and infrastructure, education and healthcare.
A total of 70 out of 131 EPPs that have been identified to deliver the incremental GNI growth are from services sector.
The share of services in Malaysia’s GDP increased, from 50.2% in 2010 to 50.7% in 2011 (Figure 6.1). The greater presence of the services sector in the Malaysian economy is indeed in line with the growth transformation that has taken place in many of the developed economies. Malaysia is moving into the third stage of economic development where its growth will be led by both the manufacturing and services sectors.
Among the services sub-sector, wholesale and retail, and finance and insurance recorded the highest output of, RM81,771 (7.4%) and RM69,657 (6.3%) respectively (Figure 6.2). Their contributions to the sector’s output were 27.4% and 23.4% respectively. The finance and insurance sub-sector expanded strongly, driven by higher fee-based income and insurance premiums. Growth was also supported by
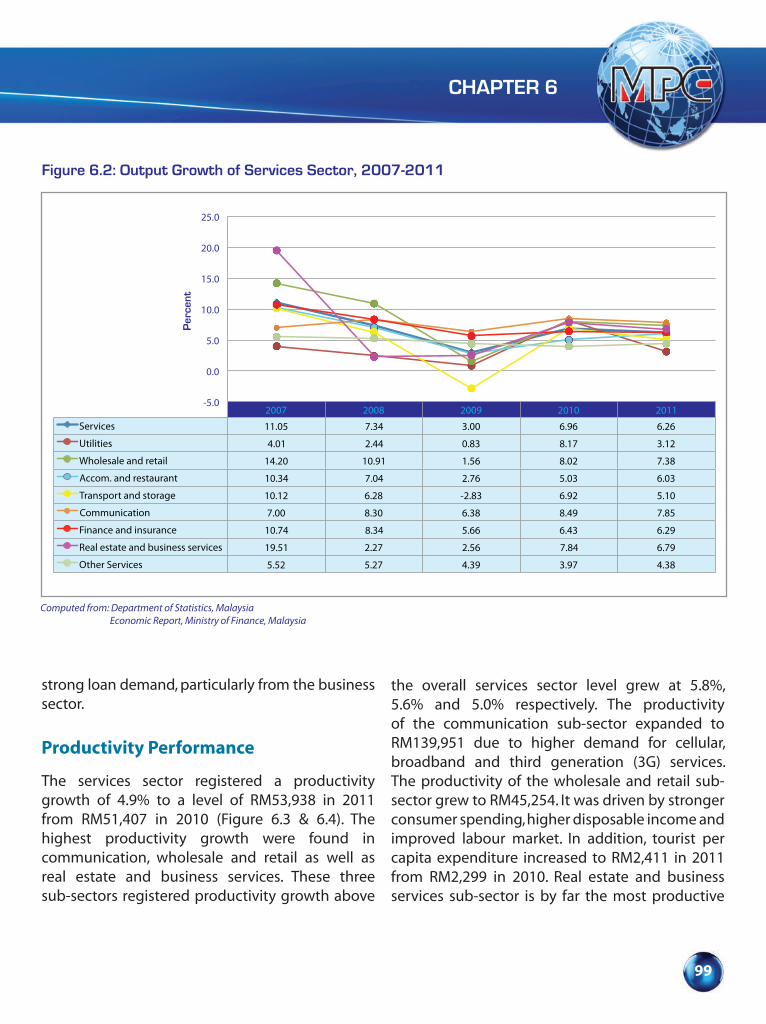
CHAPTER 6
99
strong loan demand, particularly from the business sector.
Productivity Performance
The services sector registered a productivity growth of 4.9% to a level of RM53,938 in 2011 from RM51,407 in 2010 (Figure 6.3 & 6.4). The highest productivity growth were found in communication, wholesale and retail as well as real estate and business services. These three sub-sectors registered productivity growth above
the overall services sector level grew at 5.8%, 5.6% and 5.0% respectively. The productivity of the communication sub-sector expanded to RM139,951 due to higher demand for cellular, broadband and third generation (3G) services. The productivity of the wholesale and retail sub-sector grew to RM45,254. It was driven by stronger consumer spending, higher disposable income and improved labour market. In addition, tourist per capita expenditure increased to RM2,411 in 2011 from RM2,299 in 2010. Real estate and business services sub-sector is by far the most productive
Figure 6.2: Output Growth of Services Sector, 2007-2011
Computed from: Department of Statistics, Malaysia Economic Report, Ministry of Finance, Malaysia
2007 2008 2009 2010 2011
Services 11.05 7.34 3.00 6.96 6.26
Utilities 4.01 2.44 0.83 8.17 3.12
Wholesale and retail 14.20 10.91 1.56 8.02 7.38
Accom. and restaurant 10.34 7.04 2.76 5.03 6.03
Transport and storage 10.12 6.28 -2.83 6.92 5.10
Communication 7.00 8.30 6.38 8.49 7.85
Finance and insurance 10.74 8.34 5.66 6.43 6.29
Real estate and business services 19.51 2.27 2.56 7.84 6.79
Other Services 5.52 5.27 4.39 3.97 4.38
-5.0
0.0
5.0
10.0
15.0
20.0
25.0
Per
cent

PRODUCTIVITY PERFORMANCE OF THE SERVICES SECTOR
100
among the sub-sectors with productivity levels valued at RM214,991. Its growth was attributed mainly to favourable property transactions and shared services and outsourcing (SSO) activities.
The finance sub-sector achieved a productivity growth of 4.3% to a level RM100,664 from RM96,497 in 2010. The sub-sector had benefited from active lending activity and growing bancassurance and takaful business as well as Malaysian Government’s decision to require all foreign workers in the country
to have medical insurance coverage effective from 1 January 2011.
Total Factor Productivity
During the period 2002-2011, the services sector registered a TFP growth of 3.3%. This growth contributed 55.1% to output growth while capital and labour contributed 14.1% and 30.8% respectively. Wholesale and retail trade services recorded the highest TFP growth of
Figure 6.3: Productivity Growth of Services Sector, 2007-2011
Computed from: Department of Statistics, Malaysia Economic Report, Ministry of Finance, Malaysia
2007 2008 2009 2010 2011
Services 7.32 5.42 1.99 4.89 4.92
Utilities 2.05 0.76 -0.77 5.50 2.60
Wholesale and retail 10.09 9.80 1.42 5.28 5.60
Accom. and restaurant 4.63 3.91 0.59 3.89 4.12
Transport and storage 6.05 2.41 -3.29 5.76 4.28
Communication 10.14 10.57 6.44 6.71 5.76
Finance and insurance 9.35 6.50 4.40 4.78 4.32
Real estate and business services 3.10 0.22 4.09 5.99 5.03
Other Services 2.69 3.14 2.39 1.67 4.30
-4.0
-2.0
0
2.0
4.0
6.0
8.0
10.0
12.0
Per
cent

CHAPTER 6
101
5.3%, contributing 74.7% to output growth. The contribution of capital and labour were 7.0 % and 18.3% respectively. The wholesale and retail trade services has seen many changes in recent years, driven mainly by technological and market development. The high TFP contributions were attributed mainly to the widespread adoption of productivity enhancing technologies (for example, bar coding, paperless pick systems and automatic re-ordering processes) which moved the sub-sector from a storage-based system to a
fast flow distribution network. Labour intensities declined in many facets of wholesaling. Retailers’ proactive responses to social and demographic changes (such as the growth in ‘income-rich and time-poor’ consumers) through extended trading hours and locational convenience also contributed to the high TFP. In addition, major initiatives by the Government to increase the large number of hypermarkets, superstores and department stores and TUKAR programme had been successful.
Figure 6.4: Productivity Level of Services Sector, 2007-2011
Computed from: Department of Statistics, Malaysia Economic Report, Ministry of Finance, Malaysia
0
50.0
100.0
150.0
200.0
250.0
2007 2008 2009 2010 2011 Services 45.585 48.058 49.013 51.407 53.938
Utilities 156.005 157.196 155.990 164.573 168.851
Wholesale and retail 36.552 40.135 40.705 42.856 45.254
Accom. and restaurant 15.511 16.118 16.214 16.844 17.538
Transport and storage 40.082 41.046 39.693 41.980 43.775
Communication 105.374 116.510 124.018 132.334 139.951
Finance and insurance 82.837 88.218 92.099 96.497 100.664
Real estate and business services 185.137 185.535 193.125 204.686 214.991
Other Services 24.321 25.085 25.684 26.112 27.234
RM
Tho
usan
d

PRODUCTIVITY PERFORMANCE OF THE SERVICES SECTOR
102
Table 6.1: TFP Growth and Contribution, 2002-2011
Services Sub-sector
TFP Growth (%)
Contribution to Output Growth (%)
TFP Capital Labour
Utilities 2.3 49.1 16.6 34.2
Transport 2.4 38.3 20.7 40.9
Trade 5.3 74.7 7.0 18.3
Finance 4.0 55.8 10.7 33.6
Other Services 2.4 52.3 19.2 28.5
Services 3.3 55.1 14.1 30.8
Financial services recorded the second highest TFP growth of 4.0% during the period 2002-2011. Within financial services, labour contribution remained strong at 33.6% but capital contribution was reduced significantly to 10.7% only. Malaysian banks have been gradually deregulating and two major factors have been at work namely, a significant shift in the best-practice frontier, which was driven by a combination of technological advances, financial innovation and adopting strategies to suit each bank’s business philosophy and risk–return profile and the changing composition of banks’ input–output and reduction in total cost due to improvements in overall efficiency.
The transport and storage cover maritime, aviation and land modes. The sub-sector ranked third in the TFP growth at 2.4% during the period, contributing 38.3% to output growth (Table 6.1). Contribution to output growth came mainly from
Computed from: Department of Statistics, MalaysiaEconomic Report, Ministry of Finance, MalaysiaEconomic Planning Unit, Malaysia
labour at 40.9% and capital at 20.7%, the sub-sector recorded the highest labour contribution to output growth among all the services sub-sectors due to its nature as labour intensity industry. The factors that contributed to the performance include continuous capacity expansion, improved efficiency and competitive pricing by industry players in the sea, air and land transport segments. For example, in port activities, various initiatives were undertaken to attract main line operators such as upgrading infrastructure to accommodate mega vessels, providing efficient facilities to shorten turnaround time and strategic partnership with shipping lines. Furthermore, with the help of information technology, the sub-sector was able to achieve new levels of operating efficiency and service quality through better scheduling and schedule keeping, more efficient ticketing and improved safety.

CHAPTER 6
103
Utilities services registered 2.3% in TFP growth and contributing 49.1% to output growth. The Government’s approval to increase electricity tariff by 7.1% effective from 1 June 2011 had to a certain extent, improved the performance of the sub-sector. The sub-sector was also facing increase in price of materials such as copper, steel, aluminium and gas.
Other services sub-sector encompasses consumer services namely, health, education and business and professional services. The sub-sector witnessed a TFP growth at 2.4%. Even though its TFP grew at a modest rate, its contributions to output growth were significantly high at 52.3% with labour at 28.5% while capital was 19.2%. This implies that significance improvement in managerial system, efficiency and quality of inputs have taken place in the sub-sector.
Strategies and Outlook
The services sector in Malaysia holds enormous potential to accelerate the development of an economy and endorse overall well-being of the society. It offers countless commercial prospects to the investors and possesses the capacity to produce considerable employment opportunities in the economy. Thus, the services sector is considered to be an integral part of the economy and includes various sub-sectors spread across the country.
Services sector’s ability to achieve a high rate of productivity growth was due to deregulation and consequent exposure to the discipline of increased competition. Its capacity to exploit advances in information technology either by integrating these advances successfully into existing operations or using them to develop new services and in some
cases, the industries themselves are recent creations of the IT revolution. To sustain productivity growth, Malaysia needs availability of high quality talent and highly skilled workforce. One of the avenues to achieve this is through the establishment of Talent Corporation by the Government. In addition, Institute of Higher Learning (public and private) needs to ensure the economy has a supply of graduates with not only academically excellent, but also the ability to relate quickly to business processes and business applications. With highly skilled workforce, companies have the abilities to engage and compete in higher-value products such as knowledge process outsourcing in areas such as investment, market and legal services.
The expanding share of services in the economy implies that growth in overall productivity and living standards in the economy will likely be increasingly influenced by productivity development in the services sector. As such, raising productivity in the services sector will be critical for economic growth.
LOGISTICS SERVICES
Overview
Logistics services are vital to economic development and assume a significant role in facilitating trade expansion and economic integration of regions. Importance of the logistics services can be seen by its contribution towards GDP. This is particularly the case for Malaysia which adopts an open and highly trade dependent economy with significant volumes of investment. Total trade for 2011 valued at RM1.3 trillion was transported both domestically and internationally which could benefit from timely, reliable and efficient supply chain, distribution

PRODUCTIVITY PERFORMANCE OF THE SERVICES SECTOR
104
and inventory management for their imports and exports.
Logistics services involve different modes of transport covering shipping, road, rail and air to facilitate movement of goods, people and animals. Central to logistics services are pick up and distribution services, storage and warehousing, transhipment, packaging, and consolidation. In addition to physical movement of goods, logistic services include managing the documentary and information process flows between production and consumption points within the country and around the world.
The scope of logistics services covered in this report is on public bus transport, road haulage, sea, air and inland water transport, shipping and forwarding agencies, train/light rail transit, cargo handling, highway and port operations, stevedoring companies, storage & warehousing, travel agencies and tour operators, post and courier and parking lots service.
Productivity Performance
The logistics services recorded productivity growth of 3.7% to RM134,301 in 2011 as compared to RM129,549 in 2010 (Figure 6.5 and 6.6). The logistics services, comprising transport and storage services, contributed 7.5% to the country’s GDP. This was supported by an increased in labour cost per employee by 3.1% and a slight reduction in unit labour cost by 0.5% from 2010 to 2011.
The positive performance of the logistic services was attributed to the Government support towards logistics-related development to facilitate the country’s strong external trade as well as foreign investment in the country. The introduction of several initiatives such as the GTP and the ETP have created opportunities for the nation’s logistics market to embrace growth The investment-friendly environment has helped to direct the flow of foreign direct investment into the country such as import-export forwarding, shipping and airfreight-related businesses. Malaysia’s total cargo
Figure 6.5: Productivity Level of the Logistics Services, 2007–2011
20112010200920082007
RM Thousands
0 116 118 120 122 124 126 128 130 132 134 136
134.30129.55123.11133.22132.50
Computed from: Department of Statistics, Malaysia

CHAPTER 6
105
volume is projected to increase by 10.1% to 545.13 million tonnes in 2012, from 495.29 million tonnes in 2011, with sea freight being the most favoured mode of transport for cargoes in Malaysia, handling more than 90% of total freight traffic in 2011. Cargo volume by air and rail are also projected to grow by 3.9% and 5.1% respectively.
Innovation and Best Practices
Best practices observed in the logistic services focus on sustainable development. As sustainable construction and energy efficient buildings form an integral part of environmental sustainability, warehouses are designed based on the green concept incorporating environmentally friendly features such as optimising the usage of natural light, advanced air circulation to maintain a
constant warehouse temperature and a systematic rain harvest system. Warehouses comply with international security standards are designed with internationally recognised security features such as 24 hours closed circuit televisions (CCTVs). Prime movers are fitted with vehicle tracking system or the state-of-art technology satellite tracked Global Positioning System (GPS) not only to monitor the movement of the cargo but also to ensure fuel efficient driving behaviour.
The deployment of state-of-art ICT infrastructure is necessary for supply chain success. To this end, some logistic service providers have integrated e-logistic solutions which include information management system, accounting system and a supply chain suite. Among the programmes of choice are Warehouse Management System (WMS),
Figure 6.6: Growth of Labour Cost Competitiveness of the Logistics Services, 2007-2011
Computed from: Department of Statistics, Malaysia
Per
cent
2007 2008 2009 2010 2011
Productivity 2.51 0.54 -7.59 5.23 3.67
Labour cost per employee 0.05 2.27 -0.01 0.13 3.11
Unit labour cost -4.63 -1.37 11.95 -4.94 -0.47
-10.0
-5.0
0
5.0
10.0
15.0
PRODUCTIVITY PERFORMANCE OF THE SERVICES SECTOR
106
Radio Frequency Identification (RFID), e-Supply Chain Management (e-SCM), Transportation Management System (TMS), Route Planning Systems and Syteline Accounting System.
The implementation of advanced technology across supply chain will improve visibility and traceability at part level than just management of transportation assets. The use of smart labelling system, bar-coding system and web-based tracking and reporting tools enable the company to track the delivery progress of its cargo and allow customers to check the real-time details of the shipment progress online.
The one logistics hub concept offers diverse logistics services. It renders fourth-party logistics (4PL) services that not only handles the transportation and distribution of goods but also offers sub-assembly, procurement, consultancy, custom brokerage, air and ocean freight forwarding as well as cargo insurance among others.
With the growing international demand for Halal products, leading logistics services providers offer innovative Halal logistics services such as end-to-end Halal logistics, ensuring Halal compliance handling and storage processes, distribution, shipping, accreditation facilities, validation facilities and decontamination / sterilization processes.
Some successful services providers have set a benchmark in the cold chain logistics industry by introducing Food Safety Management System (FSMS) to ensure that there is no break in the cold chain by maintaining the product temperatures within requirements and ensuring the safe handling of their clients’ products.
The leading postal service provider in Malaysia has harnessed technology to enhance its service quality and performance via the development of Pos Integrated Track and Trace System (PITTIS) to track the delivery progress of its courier items and it allows customers to check the status of items online. In addition, it introduced SMS service for customers to track their shipment. The scanners on web facility were deployed at post offices nationwide to improve its track and trace capability. The above effort allows the Operation Application Layer (OAL) system to provide the latest delivery status for items processed at post offices. The postal service provider also introduced the Electronic Shipping Tools (EST) to premium customers which handle large volume of shipments providing convenience, cost and time savings to customers. More recently, a new service was introduced i.e. the internet marketplace “PostMe.com.my” which is an online shopping and retail mall.
Progress of Entry Point Projects (EPPs) The initiatives under ETP are expected to benefit logistics services providers across all economic sectors. These benefits can be seen through both direct and indirect channel. The former entails direct participation of logistics services providers in programmes such the oil, gas and logistics industrial parks while the latter reflects logistics services providers benefiting from spillover effects of investment by large entities in the EPPs.
The NKEAs under ETP will expand opportunities in logistics business activities through:
• Development of hubs across the identified industry segments like oil, gas and energy, electrical and electronics, retail, healthcare and agriculture;
CHAPTER 6
107
• Values created from upstream and downstream segments of energy and palm oil;
• Driving wholesale, retail and tourism sector to enhance demand for goods and services;
• Development of national and international distribution hubs in the country; and
• Mass rapid transit and high speed rail projects to be rolled out under the Greater KL NKEA.
Under the oil, gas and energy NKEA, EPP 4 aims to transform Malaysia into a regional oil storage and trading hub. With port locations on major shipping routes for crude oil and refined products, close proximity to Singapore, significant land availability and deepwater marine accessibility, Malaysia is well placed to have a significant presence in the oil storage and trading industry. Several large corporations and consortiums have committed to construct and expand on petroleum storage terminals during 2011. Some of the projects under construction are the Independent Deepwater Petroleum Terminal Project at Pengerang, Johor; Labuan oil storage terminal in Pulau Daat; and Tanjong Agas Oil and Gas and Logistics Industrial Park at Tanjung Agas, Pekan, Pahang. They are all at the initial phase of earthworks to be followed by construction of storage tanks in 2012.
Strategies and Outlook
The logistics services competitiveness should be enhanced to improve the position of Malaysia in the global economy. The existing institutional and regulatory framework can increase total export logistics costs and affect service quality. This will hinder the price competitiveness of Malaysian exports, especially those destined for ASEAN’s
main export market. Therefore, institutional and regulatory framework should be improved and user-friendly policies that reduce transport logistics costs and increase reliability should be introduced.
With the growing importance of trade in services at a regional level, ASEAN started its own services liberalisation project to achieve greater and significant integration of logistics services in ASEAN. The liberalisation of the various logistics services are forecast to be completed by 2013. The liberalisation requires Malaysia to strengthen its logistics services and the capabilities of the logistics players and the multi-modal transport infrastructure in order to attract FDI in logistics and trade to Malaysia in future. Malaysia must continue to review and undertake progressive liberalisation of its logistic services. This will enhance the competitiveness of logistics services providers at regional and global levels.
The excessive time taken for documentary process to be completed both for export and import can affect the competitiveness of Malaysian exporters and importers in terms of response capability and costs. Each lost day because of administrative delay, increases firms inventory holding costs as well as results in trade reduction. The information and processes required by related authorities must be simplified and reduced. The logistics related formalities, procedures and documents must be reduced to an absolute minimum. Customs procedures should be improved and modernised to assist the flow of trade across borders rather than hindering such trade. PEMUDAH has been tasked with improving efficiency of cross-border logistics and resolve outstanding issues related to handling, forms processing and inspections at point of entry
PRODUCTIVITY PERFORMANCE OF THE SERVICES SECTOR
108
and exit including reviewing the processes and procedures, laws and policies.
The transportation infrastructure should be further improved so that there is an integration of the various transport modes by the different services providers in order to provide seamless supply chain operations. Good quality roads, railways, ports and airports are essential for the smooth running of many key economic sectors including agriculture, manufacturing, mining and tourism. There is no doubt that improved transport infrastructure will also help Malaysia to integrate into the global economy.
Operational efficiency and service responsiveness are also factors for achieving competitive advantage. In Malaysia, the lack of skilled logistic professionals has been one of the constraints in achieving operational efficiency and service responsiveness. The logistics services should foster human capital development and capacity building. Gaps in human resources related to logistics knowledge should be identified and the Government should support programmes to fill the gaps including the facilitation of regional centres of excellence for training.
The services providers must also leverage on on-going liberalisation initiatives in the various regional and multilateral initiatives such as the ASEAN Cooperation on Transport Facilitation and Logistics, and integrate into regional and global logistics network.
The local logistics services providers should be incentivised to provide integrated logistics services by consolidating or integrating their activities to Form Third or Fourth Party Logistics Services
Providers (3PL, 4PL). In this way, third/fourth party logistics providers can provide service to its customers all their supply chain needs offering end-to-end distribution services from inbound material flow to finished goods warehousing, inventory management, inspection, returns handling and nationwide delivery.
Logistics services providers need to work towards more value-added services while strengthening the intermediate services. Value-added services are those which complement and enhance warehousing, transportation, and logistics offerings such as packing and labelling, reverse logistics, quality assurance and information management.
Green logistics practices are likely to help Malaysia transform itself into a regional logistics hub in the future. Logistics services providers should continue investing in building green warehouses, and co-ordinating sustainable logistics practice in a way that meets customer requirements at minimum cost.
Logistics service providers in Malaysia should focus on specialised logistics solutions for specific industries such as health-care and pharmaceutical segment in the future compared to the current generic logistics services.
The Government should implement a national freight logistics strategy that will ensure smooth trade flows to competitive global markets. The Government should also integrate transportation hubs namely, seaports, airports, terminals and distribution centers with the transport network and develop state-of-the art logistics infrastructure for efficient distribution. Furthermore, the Government should encourage local logistics companies to

CHAPTER 6
109
venture abroad in order to participate in the overall global supply chain.
INFORMATION AND COMMUNICATION TECHNOLOGY SERVICES
Overview
Information and Communication Technologies (ICT) are one of the drivers of economic growth. ICT has become the foundation of every sector as it reduces transaction costs, offers immediate connectivity, expands market boundaries and enormously expands information flow. The widespread utilisation of ICT can improve intellectual capital, workforce skills, productivity and market access and expand business outreach to gain a competitive advantage.
Information and Communication Technology services can be classified into two categories
namely, computer and telecommunication services. The scope of ICT services covered in this report are telephone services (public & mobile), television and radio transmission, data communication, paging, hardware and software consultancy and supply, data processing and database activities, maintenance and repair, content writing and other computer related activities. In this way, ICT describes the entirety of hardware, software, networks as well as the personnel to whom the provision and upkeep of the system is entrusted.
Productivity Performance
The ICT services registered a strong productivity growth of 6.4% to RM400,471 in 2011 as compared to RM376,334 in 2010 (Figure 6.7 & 6.8). Its contribution to GDP was 8.7%. This was reflected through an increase in labour cost per employee by 2.8% and a decline in unit labour cost of 3.7% in 2011. The growth pattern suggested that
Figure 6.7: Productivity Level of the Information and Communication Technology (ICT) Services, 2007–2011
20112010200920082007
RM Thousands
0 50 100 150 200 250 300 350 400 450
400.47376.39350.22342.21302.62
Computed from: Department of Statistics, Malaysia

PRODUCTIVITY PERFORMANCE OF THE SERVICES SECTOR
110
the ICT services had succeeded in enhancing productivity and labour cost competitiveness through investment, technology change, skilled workforce and effective utilisation and diffusion of information technology. This was supported by the rising purchasing power of the growing middle class leading to wider usage in mobile internet devices, mobile data subscribers and adoption of tablet and smart-phone application usage.
Innovation and Best Practices
The growing demand for broadband services has compelled many top companies to transform from a mobile service company into an integrated communication service provider converging multiple services such as telephony, television and broadband services as well as enhanced business services. They offer a wide range of services including local phone service, domestic and international long distance, wireless services, high-speed broadband (HSSB) and data services.
In addition, the leading companies also offer new and innovative ICT services such as mobile trading technology for the financial services across continents, advanced non-coding software development tools and services. It also provides world class software testing solutions and services, Total Airport Management System and services at international airport and Managed Services Unified Platform (MSUP) that provides a common environment for users to manage the entire lifecycle of a data service and offering industries with most comprehensive and flexible solution.
Best practices in ICT observed in banking include introducing enhanced internet and mobile banking service to provide an improved, more secure and seamless e-Banking experience for its customers. The e-Banking services allow customers to use auto-teller machine (ATM) cards and ATM PINs or credit cards and telephone PINs to sign up for the e-Banking services. The system also enables mobile devices such as tablet and smart phones
2007 2008 2009 2010 2011
Productivity -6.90 13.08 2.34 7.47 6.40
Labour cost per employee -0.09 6.85 0.00 3.36 2.84
Unit labour cost 2.77 1.21 -0.77 -3.82 -3.70
Figure 6.8: Growth of Labour Cost Competitiveness of the Information and Communication Technology (ICT) Services, 2007-2011
Computed from: Department of Statistics, Malaysia Economic Report, Ministry of Finance, Malaysia
Per
cent
CHAPTER 6
111
to register for the services. The leading banks have wireless automated teller machines running on 3G wireless network to connect to its main banking network. For security, the customer’s financial information is secured end-to-end by Internet Protocol Security (IPSEC) which is a security level exceeding the banking industry standard. In addition, the implementation of a security image at the login page provides an extra layer of protection from phishing and scam sites.
The rapid growth of online users and smart devices has resulted in some best practice organisations deploying Internet Protocol version 6 (IPv6) technology to be able to communicate with new and existing customers operating with IPv6 in order to maintain a competitive advantage.
With increasing interest around consumerisation of IT, the leading businesses adopt the concepts of Bring Your Own Devices (BYOD), cloud computing, green IT and video conferencing tools to help enhance productivity, save costs and enable sustainable development.
In terms of enhancing interaction between the Government and its citizens, many countries worldwide such as Singapore, New Zealand and Australia have adopted Government 2.0 for Government-to-Citizen (G2C) connectivity improvement. E-Government delivers cost-effective, personalised and relevant e-services in one place that helps enhance democratic dialogue. In today’s business environment, companies operate with thousands of servers delivering web service, social media and simple content delivery applications. To help reduce complexity, energy use, space and costs, a new extreme low-energy server technology was introduced by some of the
leading ICT companies. Utilising this technology allows the sharing of resources including storage, networking, management as well as power and cooling across thousands of servers that pave the way to the future of green computing.
Progress of Entry Point Projects (EPPs)
The ICT services is poised to achieve further growth with the initiation of the country’s ETP. The ETP will spearhead the development of the ICT services through:
• Encouraging development of innovative technologies and capabilities;
• Developing the internet data centre (IDC) industry;
• Developing Malaysia into a Global ICT hub for wealth creation, knowledge creation and social well-being; and
• Providing an enabling environment to build, secure and sustain a national ICT ecosystem.
One of the NKEAs under the ETP is the Communication Content and Infrastructure sector which concerns ICT services. This incremental increase is driven by 10 EPPs. The 10 EPPs that have been developed to deliver significant results within a 10-year timeframe and their impacts are as follows:
• EPP 1: Nurturing Malaysia’s creative content; • EPP 2: Deploying 1Malaysia payments; • EPP 3: Connecting 1Malaysia; • EPP 4: Establishing e-Learning for students and workers; • EPP 5: Launching e-Healthcare;• EPP 6: Deepening e-Government; • EPP 7: Ensuring broadband for al;.

PRODUCTIVITY PERFORMANCE OF THE SERVICES SECTOR
112
• EPP 8: Extending reach; • EPP 9: Offering a smart network; and • EPP 10: Extending the regional network.
The first EPP aims to nurture domestic content creation services and distribution/broadcasting sectors with the ultimate aim of transforming Malaysia into a regional hub for digital content. To date, 35,702 hours of Malaysian content have been digitalised to preserve our national heritage and promote our culture regionally. Two projects are under way to distribute Malaysian content. Using IPTV technology, one of them is promoting Malaysian content to both local and international hotels by distributing to 20,000 hotel rooms in Malaysia, Middle East, Thailand and Indonesia. Meanwhile the second project involves delivering live video and voice into the transportation industry in the country using Transit-TV network. To date, it has pushed the content through its system on 1,500 buses and trains. Future plan includes extending its Transit-TV network system into the LRT and Monorail.
The Track and Trace EPP sees the application of Radio Frequency Identification (RFID) technology as a means to generate economic gains. There are two projects underway. The first project under this EPP is the implementation of RFID in security and trade facilitation system at Royal Malaysian Customs’ checkpoints nationwide. This project enables the monitoring of containers to facilitate clearance within domestic ports and selected high volume routes. This cost-effective payments system is also expected to reduce the time taken for customs clearance by 50% as well as enable the automatic detection of compromised or tampered containers thus facilitating secure and faster trade for users. To date, 18 Customs checkpoints have
been installed with the system. As a result, the clearance process by Customs for each container is quicker by 43 minutes. The second project within the EPP is the Swiftlet Nest Online Traceability System that uses RFID technology to ensure tracking and traceability of high quality and sustainable swiftlet nest production in Malaysia to high value markets in China, Japan and Taiwan. A total of 60% out of 980 birds’ nest houses and processing plants are currently using the system.
Connecting 1Malaysia aims to fast track the adoption of new, value-added communication services for business, household and Government use by creating an ecosystem conducive to the accelerated adoption of these technologies. Within the tele-working and Telepresence focus, a hosted infrastructure platform for Telepresence services has been established in Malaysia. The Telepresence Exchange infrastructure offers a collaborative hub consisting of diverse collaboration services to the private and public sectors in Malaysia and the region. To date, the project has completed 37 sites where Telepresence services are operational. In tandem with this EPP’s aim to increase technical skills and technology transfer, another initiative has seen 30 local people trained in the manufacturing of Carrier Routing System 1(CRS1) that has generated RM400 million worth of revenue from the sale of the product.
The e-Learning EPP aims to establish a common knowledge platform for students and professionals that will enhance teaching methods in terms of quality, interactivity and accessibility, encourage continuous learning for professionals and help to prepare the general population as the country shifts towards a knowledge-based economy. Successful establishment of the domestic E-Learning industry

CHAPTER 6
113
will enable Malaysia to become an educational hub for the entire region. To raise awareness of the benefits of e-Learning, the Education Ministry has been promoting educational online content. To date, a total of 4,166 educational programmes and education-related programmes have been uploaded onto EduWebTV.
The e-Healthcare EPP aims to connect all medical institutions to the Healthnet platform that hosts productivity applications for healthcare providers and gives companies and patients access to healthcare-related services. E-Healthcare also encompasses the deployment of IT equipment to medical institutions and the roll out of applications for personal and remote monitoring of chronic diseases. To date, a total of 1,156 public health facilities have been connected with a broadband speed of 2Mbps. Educating the public on healthcare is the MedikTV channel project. Under the first phase of the project, Medic Channel has deployed 1,410 42-inch television sets to 168 high-traffic locations nationwide. The expected annual viewership is estimated at 24.9 million.
The e-Government EPP uses ICT technology to enhance access and delivery of Government services to the public and businesses. Currently, more than 3,000 Government applications are available online, in line with the goal of zero counter services by 2020. MyEmail project was launched to enable a secured communication channel to Government e-Services that is accessible through all devices. To date, the service had garnered more than 7,000 users.
The goal of EPP 7 is to increase broadband accessibility by designating broadband access as an essential utility for consumers and bridging the
digital divide. The local councils of Kuala Lumpur and Kota Kinabalu have adopted the ‘Connected@City’ programme to increase broadband adoption among SMEs and businesses through an annual license renewal requirement. The Mayors of the two cities have announced that business operators (e.g. food and beverages outlets, hotels, universities, shopping malls) are encouraged to offer wireless internet facilities. Under the KL Wireless Metropolitan project, about 1,500 Wireless@KL access points have been installed in about 700 locations and in and around Kuala Lumpur. Registered users can access in a Wi-Fi zone with a laptop or tablet. Until June 2011, about 387,254 users have registered with Wireless@KL.
The EPPs aims to drive up broadband subscription outreach level in non-urban areas to as much as 90% of households in 2020, resulting in 3.4 million new broadband subscribers. The Community Broadband Centre initiative led by Malaysia Communication and Multimedia Commission (MCMC) focuses on providing ICT services to the community in rural areas. To date, there are 252 centres in operation nationwide, providing internet services at a very affordable rate to the rural community. Another initiative led by MCMC is the Kampung Tanpa Wayar service which has been commissioned in more than 1,300 villages and 215 towers have been erected. A total of 1,588 Kampung Tanpa Wayar, Community Broadband Centres (CBCs) and Rural Wireless Towers have been commissioned in 2011.
Extending the regional network, EPP aims to increase bandwidth capacity and reduces Internet Protocol (IP) transit costs and bandwidth price. Under this EPP, three projects are underway. The first is the formation of a consortium comprising 24
PRODUCTIVITY PERFORMANCE OF THE SERVICES SECTOR
114
telecommunications companies that is expected to address the bandwidth capacity and cost issues. The second project is a cable system consisting of two fibre pairs, designed to provide 1.28 Tbps by adopting Dense Wavelength Division Multiplexing (DWDM) technology to provide upgradable, future-proof transmission facilities. The two fibre pairs will carry 20 Gbps of capacity and connect approximately 400 kilometres of distance between Malaysia and Indonesia. The third project is a two-fibre pair cable system that links Malaysia directly to Japan and Hong Kong that will provide Malaysia with 500 Gbps of capacity when it is put into service in mid-2012.
Strategies and Outlook
An important challenge would be to enhance availability, coverage and affordability of access to ICT infrastructure and broadband. While the mobile subscriber penetration in Malaysia has reached 104% of the country’s population, the household broadband internet penetration achieved was 62% in 2011.
Broadband subscription rates among several groups were very low. The low-income, older generation, less educated and rural groups lack significantly in broadband adoption compared to other groups. Malaysians who lack broadband internet access are deprived of many educational and employment opportunities.
The broadband penetration is also a major concern for private sector as implementation of e-commerce is very important for SMEs to conduct business efficiently in order to gain competitive edge. Currently, SMEs lack ICT capacity and capability to move up along the value chain and take advantage of new opportunities.
In addition to broadband penetration, Malaysia’s broadband speed must also be improved so that it is comparable to neighbouring countries. We need to promote the development of high quality and new communications infrastructure technologies to support the requirements for higher bandwidth and advanced ICT applications.
A knowledge-based economy is dependent on cultivating highly-skilled workforce that is innovative, creative and resourceful. Sufficient human capital is a concern as Malaysia’s ICT industry is substantially lacking especially for highly-skilled IT professionals.
With the rising adaptation of innovative strategic technology such as cloud computing, mobile centric application and managed services, comes new and increasing sophisticated kinds of cyber threats and attacks that threaten to compromise content and erode public trust and privacy. For information society to take hold, the challenge is to enhance trust and confidence in ICT and network systems. This will demand greater security strategies.
Organisations should leverage new tools and technologies to take advantage of opportunities immediately and be more competitive. Desktop virtualisation, managed services, cloud-based computing services and software as a service (SaaS) are some of the new technologies that will significantly outpace traditional software products and become the mainstay.
In the wake of mobile evolution, enterprise mobility i.e. mobile and virtual workforces are becoming increasingly important. Businesses should leverage mobile communications such as smart phones and tablets to stay connected.
CHAPTER 6
115
Local ICT companies must consider cooperating with multinational companies to forge partnerships and alliances and joint ventures for technology transfer to take place. Local telecommunication companies should look at areas in which they can collaborate among themselves to lower the cost of infrastructure and gain economies of scale.
It is increasingly important for the ICT services to look for new ways to compete in the global marketplace. Local ICT companies must increase their international presence by exporting services globally.
Government policies and the level of technological innovation in the country will shape the future of the ICT services. Policy makers must develop policies that strategically foster the growth of the industry for both domestic and international expansion as well as attracting multinationals to invest in this services. The ICT services should look at developing more software and broadband content locally. A strong R&D culture will provide an ideal platform to develop new tools and processes.
The broadband divide should be narrowed to achieve nationwide connectivity for residential and business customers. To close the digital divide, a combination of approaches should be used, including targeted outreach programmes to rural population emphasising the benefits of broadband, reducing broadband access fees to make it more affordable, introducing applications and content that would drive broadband Internet usage as well as increasing investment in network coverage to enable broadband access.
Malaysia should invest in next generation ultra-fast broadband infrastructure and services. This
will help to attract foreign direct investment and improve national competitiveness by facilitating the knowledge-based economy as well as creating knock-on effects in other sectors.
There is a need to invest more in technology training and education. ICT jobs are becoming increasingly complex, demanding and specialised. Developing local expertise and ensuring a ready supply of quality labour is important to ensure long-term sustainable success of ICT services development.
The Government should implement secure computing infrastructure and follow practices that adhere to international best practices. In terms of public outreach, the Government should run more events and programmes to educate the public on cyber security and create greater awareness.
As the world increasingly addresses the causes of global climate change, green technologies will play an increasingly important role in ICT services in the transformation to a low carbon economy. Green ICT initiatives should look into the product lifecycle from design, manufacture, use and disposal of ICT products.
WHOLESALE AND RETAIL TRADE SERVICES
Overview
Continuous development of wholesale and retail trade services is one of the key drivers to economic growth. This services has been growing rapidly due to development of ICT and supply-chain management system that help to increase the effectiveness in managing the business and achieving cost effectiveness.
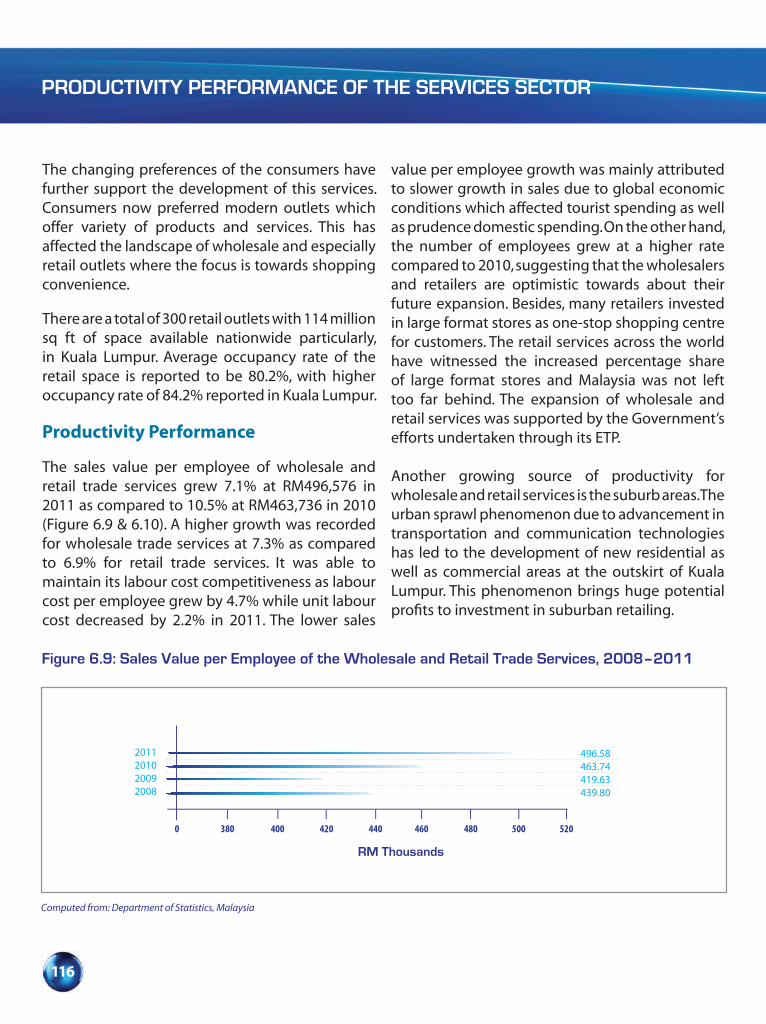
PRODUCTIVITY PERFORMANCE OF THE SERVICES SECTOR
116
The changing preferences of the consumers have further support the development of this services. Consumers now preferred modern outlets which offer variety of products and services. This has affected the landscape of wholesale and especially retail outlets where the focus is towards shopping convenience.
There are a total of 300 retail outlets with 114 million sq ft of space available nationwide particularly, in Kuala Lumpur. Average occupancy rate of the retail space is reported to be 80.2%, with higher occupancy rate of 84.2% reported in Kuala Lumpur.
Productivity Performance
The sales value per employee of wholesale and retail trade services grew 7.1% at RM496,576 in 2011 as compared to 10.5% at RM463,736 in 2010 (Figure 6.9 & 6.10). A higher growth was recorded for wholesale trade services at 7.3% as compared to 6.9% for retail trade services. It was able to maintain its labour cost competitiveness as labour cost per employee grew by 4.7% while unit labour cost decreased by 2.2% in 2011. The lower sales
value per employee growth was mainly attributed to slower growth in sales due to global economic conditions which affected tourist spending as well as prudence domestic spending. On the other hand, the number of employees grew at a higher rate compared to 2010, suggesting that the wholesalers and retailers are optimistic towards about their future expansion. Besides, many retailers invested in large format stores as one-stop shopping centre for customers. The retail services across the world have witnessed the increased percentage share of large format stores and Malaysia was not left too far behind. The expansion of wholesale and retail services was supported by the Government’s efforts undertaken through its ETP.
Another growing source of productivity for wholesale and retail services is the suburb areas. The urban sprawl phenomenon due to advancement in transportation and communication technologies has led to the development of new residential as well as commercial areas at the outskirt of Kuala Lumpur. This phenomenon brings huge potential profits to investment in suburban retailing.
Figure 6.9: Sales Value per Employee of the Wholesale and Retail Trade Services, 2008–2011
2011201020092008
496.58463.74419.63439.80
RM Thousands
0 380 400 420 440 460 480 500 520
Computed from: Department of Statistics, Malaysia

CHAPTER 6
117
Innovation and Best Practices
Wholesale and retail trade performance is purely customer oriented. Hence customer-first programme has become the basis for the success of many retail companies. The industries have invested in refurbishment activities to provide a more comfortable shopping ambience. The industries also emphasised on providing better product mix which includes the introduction of in-house brands to meet the customers’ needs and preferences.
Another key innovative practice is branding to build positive image and to encourage loyalty among its existing customers. This is achieved through many community-based programmes. The retailers recognised the importance of understanding customers’ characteristics. Extensive research on customers’ profile was put forth in order to improve the services delivered. Many retailers in Malaysia have come out with different ideas to give new shopping experience to their customers by recognising the importance of
location, accessibility, good management and the spending power of its customers.
The innovative practices in retail services were not limited to only large retailers. Product mix, store appearance and space management also concerned small retailers. Some of the small retailers involved in services diversified by offering bill payment and tourist guide services. Grocery stores union members were encouraged to use latest technology such as teller machine and point-of-sale system to increase efficiency in managing their stores. They were given hands-on experience and involved in seminars to help them to modernise and adopt changes in retailing. Magazine for small retailers include success stories and guide on how to manage their store effectively, information on what brands are in demand in order to educate the retailers.
TUKAR programme under NKEA provides a win-win situation to both giant retailers as well as the small sundry shops. In this programme, the big players in act as advisors to small retailers to modernise
Figure 6.10: Growth of Labour Cost Competitiveness of the Wholesale and Retail Trade and Services, 2009-2011
Computed from: Department of Statistics, Malaysia
Per
cent
2009 2010 2011
Productivity -4.59 10.51 7.08
Labour cost per employee 6.31 8.07 4.70
Unit labour cost 11.42 -2.21 -2.22
-6.0 -4.0 -2.0
0 2.0 4.0 6.0 8.0
10.0 12.0 14.0
PRODUCTIVITY PERFORMANCE OF THE SERVICES SECTOR
118
and transform their traditional store to a modern format. Young talented and innovative retailers may look at this services differently. Conventional shop may not be the only place to do marketing. For instance, the introduction of more merchandised vending machine is a first step towards a change in retail landscape in the country.
Utilisation of information and communication technology is also a key to increase the productivity of local retailers. Get Malaysian Business Online campaign has been launched aiming to bring more SMEs online to help them transmit the information of their products to the customers. The utilisation of ICT in logistics and warehousing services has also benefited the wholesale and retail services in the form of on time deliveries of products. Many of logistic companies have implemented internet-based stocks and deliveries management systems such as online stock checks and updates, online shipping notice, RFID inventory management systems and Global Positioning System (GPS) tracking.
Progress of Entry Point Projects (EPPs)
Under the ETP wholesale and retail services, a total of 13 EPPs were identified. Some of the EPPs that are more short term in nature have shown its impact on the economy. They are highlighted below:
• Increasing the number of large format stores
To date, there are 121 hypermarkets, 113 superstores, and 133 departmental stores in Malaysia. The EPP targeted to increase the number of these stores by 61, 163, and 356 respectively. Until the end of 2011, 10 hypermarkets and 17 superstores have been identified and are in development across the nation.
• Modernising via TUKAR
TUKAR is so far the most successful EPP under wholesale and retail NKEA. This programme aimed at transforming 5,000 sundry stores to modern retail stores. This programme has received positive response through increase participation from retail experts. Initially, there were 3 hypermarkets involved as consultants in this programme. The number increased to 12 by end of 2011. A total of 519 sundry shops were successfully transformed, surpassing the target of 500 stores for 2011. The highest number of shops which benefited from TUKAR were located in Selangor and Pahang.
Small retailers participated in this programme reported an increase in revenue between 30 to 80% after the transformation. Small retailers’ cooperatives are also encouraging their members to be participants in this programme.
• Developing Pasar Komuniti
The Pasar Komuniti and Pasar Karavan (PAKAR) is a programme undertaken to modernise local markets into large-sized Pasar Komuniti. There were 20 locations identified for PAKAR programme in 2011 in which four sites are under construction.
• Transforming Automotive Workshops
The Automotive Workshop Modernisation (ATOM) project aimed at improving their quality of services. Until December 2011, there were 55 workshops which participated in this programme with the largest number of auto shops located in Penang.
• Organising Unified Malaysia Sales
The Unified Malaysia Sales was launched in June 2011, with the participation from 50 sectors

CHAPTER 6
119
and sub-sectors involving 3,182 companies and retailers. The data on credit card transactions showed a total of RM7.5 billion spending occurred during the unified sales.
• Developing Big Box Boulevards (BBB)
Until the end of 2011, three locations for the first BBB has been identified and the first BBB in Nusajaya, Johor was operationalised in December 2011 and is the first premium outlet in Southeast Asia.
Strategies and Outlook
There are several opportunities with great potential to contribute to the growth of this services. This includes adopting community-based affordable retail shop to cater to the local community. Non-store marketing is yet to be fully explored by local retailers. Retailers in developed countries have benefited from e-tailing which recorded a strong order growth. The Government has outlined the support needed to develop non-store marketing sector through improvement in information and communication technology facilities. Some small retailers have benefited from internet social networking in expanding their business but a consolidated platform is needed to overcome consumer sceptical towards non-store marketing.
Inventory management system is another important strategy that should be developed by local retailers. Grocery industry in Taiwan and many developed countries has benefited from the use of Vendor Managed Inventory (VMI) in terms of reduced costs, improved service levels and create business opportunities for suppliers and retailers in the supply chain. VMI involves strategic
alliances between retailers and suppliers through information sharing to better serve the customers and reduce the costs of unnecessary stocks of inventory and thus reduce the pipeline inventories.
Inventory management system offers increase real-time visibility of inventory which will facilitates stocks holding. The use of VMI allows the products to response to actual demand rather than ‘pushing’ the products into inventories. It allows the retailers to track the demand requirements in order to maximise their service level to the customers. The implementation of inventory management system requires investment in ICT facilities. Integrated sales and inventories tracking system across stores help to maintain the stocks at the appropriate level.
BUSINESS AND PROFESSIONAL SERVICES
Overview
The business and professional services encompasses a large number of industries and professions including accountants, building draughtsman, lawyers, surveyors and tax experts who facilitate and support the growth of an economy. It also includes the architects, engineers and designers that spearhead the expansion of industries as diverse as construction, aerospace and automotive. It consists of sizeable industries in their own rights including IT services and outsourcing and future growth areas such as green technology services.
The rapid growth of the economy has resulted in the establishment of large and diverse range of business and professional services. There are opportunities for this services to leverage the linkages that exist in the financial services particularly, in areas such as
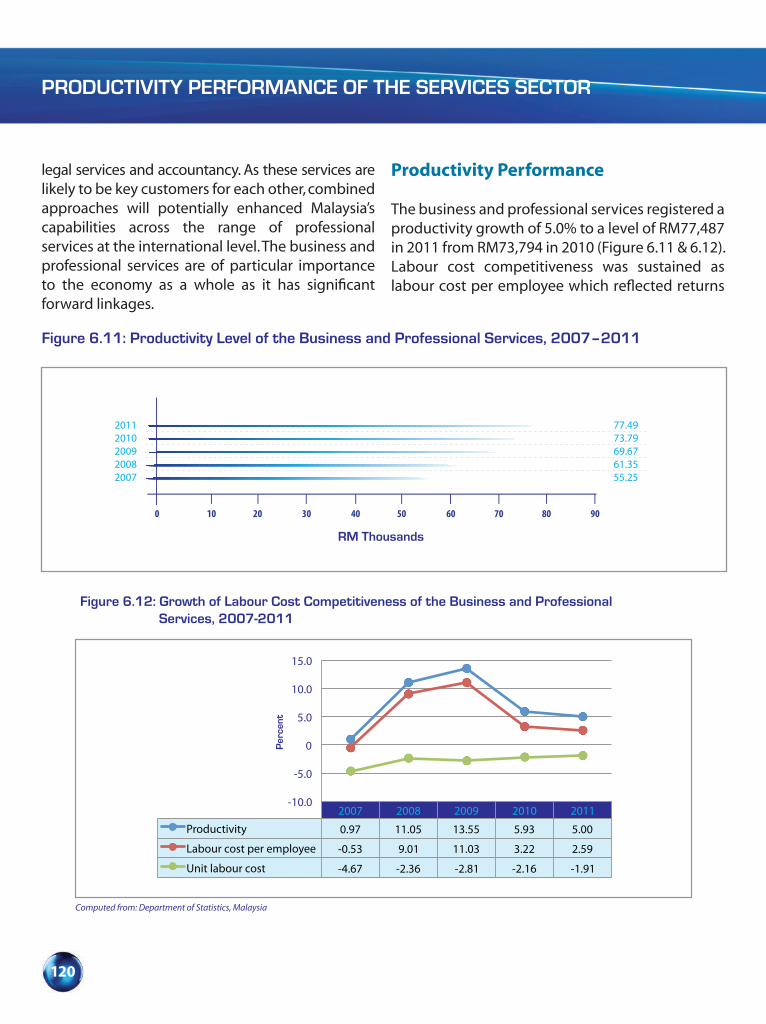
PRODUCTIVITY PERFORMANCE OF THE SERVICES SECTOR
120
legal services and accountancy. As these services are likely to be key customers for each other, combined approaches will potentially enhanced Malaysia’s capabilities across the range of professional services at the international level. The business and professional services are of particular importance to the economy as a whole as it has significant forward linkages.
Productivity Performance
The business and professional services registered a productivity growth of 5.0% to a level of RM77,487 in 2011 from RM73,794 in 2010 (Figure 6.11 & 6.12). Labour cost competitiveness was sustained as labour cost per employee which reflected returns
Figure 6.11: Productivity Level of the Business and Professional Services, 2007–2011
20112010200920082007
77.4973.7969.6761.3555.25
RM Thousands
0 10 20 30 40 50 60 70 80 90
2007 2008 2009 2010 2011
Productivity 0.97 11.05 13.55 5.93 5.00
Labour cost per employee -0.53 9.01 11.03 3.22 2.59
Unit labour cost -4.67 -2.36 -2.81 -2.16 -1.91
-10.0
-5.0
0
5.0
10.0
15.0
Per
cent
Figure 6.12: Growth of Labour Cost Competitiveness of the Business and Professional Services, 2007-2011
Computed from: Department of Statistics, Malaysia
CHAPTER 6
121
to individual employee grew by 2.6% while unit labour cost declined by 1.9% in 2011.
Innovation and Best Practices
Innovation and best practices observed in this services include providing integrated network of legal and related services by some of the established legal firms at the regional level. At the domestic level, they also provide a comprehensive range of services in the legal, trust and corporate secretarial and strategic consulting services.
In an effort to expand their businesses abroad, some local professional firms are forging alliance with their foreign counterparts whereby all transactions are facilitated through the e-payment system. The conventional payment system is gradually being replaced by this e-payment system.
Leading business and professional firms recognise the value of their “intangible assets” and create the right conditions for their employees to thrive. They are more likely to have a human capital strategy in place that has been reviewed and approved at the board level and focus heavily on creating opportunities for personal advancement and growth through planned career assignments and one-to-one coaching. Firms have continued to invest in their employees thus enabling their employees to drive the organisation forward.
Leading business and professional service firms in an effort to provide results-oriented and value-added solutions introduced “Smart Partnership” concept between its clients and the firm. Based on this concept, the firm personalises and emphasises results through implementation and continuous customer satisfaction and eventually become a
long standing bond between its clients and the firm. In addition, the firms are also introducing Customer Loyalty Follow-up (CLF) to ensure the continuity of the systems and adaptations to any future changes in business environment and on improving projects, enhancing quality, profitability and cash flow.
Graduates who join the firms are encouraged to grow and develop their career through firms structured learning opportunities and well-defined career development framework. They support their employees to study towards professional qualifications or other learning programmes specifically to their development needs and in line with firm business objectives. Firms provide assistance such as study costs, time-off to study for associated exams as well as professional association membership reimbursements.
Progress of Entry Point Projects (EPPs)
A total of six EPPs have been identified for these services. These EPPs are:
EPP1: Growing aviation maintenance, repair and overhaul services;
EPP2: Building globally-competitive outsources;EPP3: Positioning Malaysia as a world-class
data centre hub;EPP4: Jump-starting a vibrant green
technology industry;EPP5: Growing large pure play engineering
services; andEPP6: Developing a global Islamic financial
services advisory hub.
Some of the initiatives that have been announced include the development and positioning of Malaysia as an aviation hub for high-value

PRODUCTIVITY PERFORMANCE OF THE SERVICES SECTOR
122
engineering services. The investment will be used mainly for training engineers from the 40 engineers trained in 2011 to an anticipated 350 engineers by 2013.
New and upgrading of current facilities to ensure sufficient data centre floor space to meet increasing demand has been identified as initiatives to make Malaysia as a world-class data centre hub. In another development, collaboration between local firms and a leading Content Delivery Provider in the global market had been established. The partnership aims to draw the attention of major global content providers to host their content within the region and build towards positioning Malaysia as a World-Class Data Centre hub. Realising the potential of new maintenance, repair and overhaul (MRO), facility is being developed in Hyderabad under joint venture partnerships between Malaysia and foreign firms.
Strategies and Outlook
The drive for greater efficiency is through outsourcing corporate functions. Instead of maintaining a large pool of professional internal staff, organisations are now turning to a management model where in-house staff merely coordinates the work of outside vendors. Although hourly costs for outside professionals are higher, organisations save money because the professional services are not required at all times.
Malaysia has gained international recognition as a role model in many aspects of Islamic finance. Industry players can expect better prospects to widen their Islamic finance services in the intermediation and distribution of wealth across borders particularly, to emerging economies.
The shared service and outsourcing (SSO) industries can become major growth engines for Malaysia. Malaysia has become the preferred choice for many international companies which are providing SSO activities ranging from IT outsourcing, business process outsourcing and knowledge process outsourcing at the global level. The reason is due to its low inflation, higher staff retention, a well-educated and multilingual workforce, world-class infrastructures and conducive business environment.
TOURISM SERVICES
Overview
Tourism is one of the 12 NKEAs identified under ETP. With a growing number of amazing and hotspot attractions, Malaysia has been globally recognised as among the world’s top tourist destination. The World Tourism Organisation (UNWTO) had ranked Malaysia as the ninth best place in the world’s top tourist destinations in 2011 based on tourist arrivals. The services is an important source of foreign exchange earner besides providing business opportunities and jobs creation. It also provides the multiplier effect to the growing activities in hotels, restaurants, banking, transportation, shopping and entertainment. Although a large number of travellers are leisure tourists, the tourism services has also diversified into other forms of tourism products and services such as business tourism, eco-tourism, agro-tourism, edu-tourism and health tourism.
Despite the global weak economic performance, Malaysia was able to register positive growth in tourism activities in 2011. The number of tourist arrivals rose to 24.7 million from 24.6 million in 2010. Similarly, receipts also increased to RM58.3 billion

CHAPTER 6
123
from RM56.5 billion in 2010. This success was partly attributed to the various initiatives undertaken by the Ministry of Tourism to promote tourism activities. Events such as 1Malaysia International Shoe Festival, 1Malaysia Contemporary Art Tourism Festival, ‘A Journey through Time’ luxury watch exhibition, the CIMB Asia Pacific Classic Malaysia golf tournament, PETRONAS Malaysia Grand Prix and the Asian Match Racing Championship had contributed to the positive growth.
The majority of the tourists came from Singapore (13.3 million), Indonesia (2.1 million), Thailand (1.4 million), China (1.2 million), Brunei (1.2 million) and India (0.7 million), which accounted for 81% of total tourist arrivals. Tourist arrivals from developed countries came mainly from Australia (0.5 million), the United Kingdom (0.4 million), the United States (0.2 million), France (0.1 million) and Germany (0.1 million), which represented 6% of the total tourist arrivals while tourists from the Middle East were mainly from Iran (0.1 million). Notable growth in tourist arrivals was recorded from markets such as New Zealand (23%), Russia (21%), Iran (20%), South
Africa (19%), France (15%), Myanmar (12%), Taiwan (11%), China (11%) and Brunei (10%). Tourists from the Philippines (-25.6%), Laos (-22.5%), Netherlands (-21%), Indonesia (-15%), Norway (-12.7%) and Japan (-7%) recorded significant negative growth. The success of this services was significantly influenced by factors such as its promotional activities, the opening of new tourism offices abroad, the establishment of more competitive tourism destinations, greater market liberalisation, and the upgrading of aviation facilities and routes.
Productivity Performance
The analysis on productivity covers only activities of accommodation, travel agencies and tour operators. The productivity of tourism services grew by 4.5% to RM57,592 higher than the previous year (Figure 6.13). This services remained competitive with labour cost per employee increased by 2.4% and a corresponding decrease in unit labor cost by 2.2% (Figure 6.14). The hotel industry categorised under accommodation registered high occupancy rate of more than 60% particularly, in Pahang,
Figure 6.13: Productivity Level of the Tourism Services, 2007–2011
20112010200920082007
57.5955.1153.2253.0749.36
RM Thousands
0 44 46 48 50 52 54 56 58 60
Computed from: Department of Statistics, Malaysia
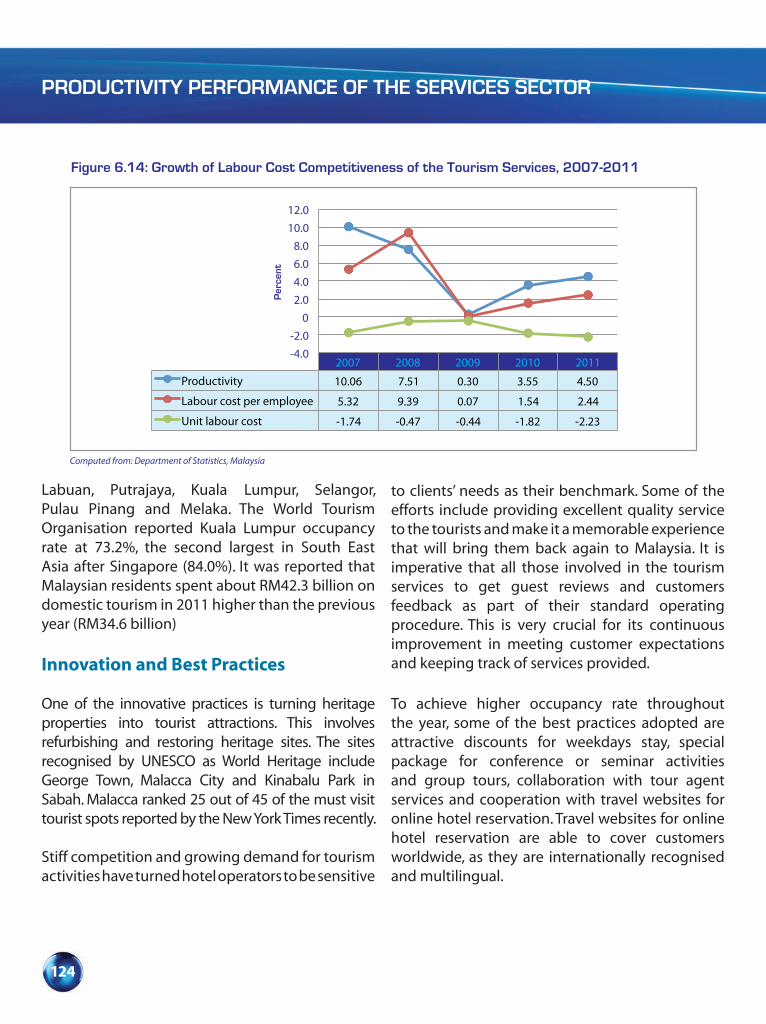
PRODUCTIVITY PERFORMANCE OF THE SERVICES SECTOR
124
Labuan, Putrajaya, Kuala Lumpur, Selangor, Pulau Pinang and Melaka. The World Tourism Organisation reported Kuala Lumpur occupancy rate at 73.2%, the second largest in South East Asia after Singapore (84.0%). It was reported that Malaysian residents spent about RM42.3 billion on domestic tourism in 2011 higher than the previous year (RM34.6 billion)
Innovation and Best Practices
One of the innovative practices is turning heritage properties into tourist attractions. This involves refurbishing and restoring heritage sites. The sites recognised by UNESCO as World Heritage include George Town, Malacca City and Kinabalu Park in Sabah. Malacca ranked 25 out of 45 of the must visit tourist spots reported by the New York Times recently.
Stiff competition and growing demand for tourism activities have turned hotel operators to be sensitive
to clients’ needs as their benchmark. Some of the efforts include providing excellent quality service to the tourists and make it a memorable experience that will bring them back again to Malaysia. It is imperative that all those involved in the tourism services to get guest reviews and customers feedback as part of their standard operating procedure. This is very crucial for its continuous improvement in meeting customer expectations and keeping track of services provided.
To achieve higher occupancy rate throughout the year, some of the best practices adopted are attractive discounts for weekdays stay, special package for conference or seminar activities and group tours, collaboration with tour agent services and cooperation with travel websites for online hotel reservation. Travel websites for online hotel reservation are able to cover customers worldwide, as they are internationally recognised and multilingual.
2007 2008 2009 2010 2011
Productivity 10.06 7.51 0.30 3.55 4.50
Labour cost per employee 5.32 9.39 0.07 1.54 2.44
Unit labour cost -1.74 -0.47 -0.44 -1.82 -2.23
-4.0 -2.0
0 2.0 4.0 6.0 8.0
10.0 12.0
Per
cent
Figure 6.14: Growth of Labour Cost Competitiveness of the Tourism Services, 2007-2011
Computed from: Department of Statistics, Malaysia
CHAPTER 6
125
Progress of Entry Point Projects (EPPs)
Some of the successful EPPs are establishing Malaysia as a duty free shopping destination for tourist goods (EPP1), developing KLCC-Bukit Bintang as a vibrant shopping precinct (EPP2), launching of Johor Premium Outlet (EPP3), organising more international events (EPP7) and expanding sports tourism offering (EPP9). To promote Malaysia as a shopping hub, the development of Johor Premium Outlets is one of the successes of NKRA in tourism activity promoting shopping. Adding more designer brands to the existing one will bring more shoppers to the outlet.
Strategies and Outlook
The most important challenges facing tourism services in the future are the rising costs of food, transportation and accommodation. Undoubtedly, these may remove Malaysia from being a competitive destination. It was reported that Kuala Lumpur ranked 74th in 2011 as the world’s most expensive city compared to its rank at 86th in 2010 based on a report from the Economist Intelligent Unit.
Malaysia is targeting to attract 36 million tourists that would generate about RM168 billion to the economy in 2012. To achieve this, it is crucial to upgrade airport facilities such as a spacious parking lot with cheaper rates, better airport transfer services not only from airport to city but also providing transfer service free of charge between terminals and more affordable flights charges. In addition, safety, cleanliness, traffic, environmental pollution, transportation services and infrastructure need to be monitored closely and improved.
Malaysia has comparative advantage in offering leisure activities throughout of the year such as traditional performance, culture festivals, music, food, sports, and fashion. Malaysia should leverage on its diverse tourist attractions such as hi-tech cities, tropical islands, colonial hill stations, pristine beaches and the world’s oldest tropical rain forest.
Malaysia should organise all year round events to attract more tourists into the country. Some of the latest new tourists attractions include a 76-acre Legoland Malaysia, which is the first Legoland theme park in Asia and Hello Kitty theme park, Nusajaya. Both of these are still under construction.
Malaysia should also compete with neighbouring countries in offering wide range of duty-free products. To offer greater comfort to the tourists, the KLCC-Bukit Bintang was developed into a vibrant shopping precinct through developing Bintang Walk which houses most of the world’s brands and provides easy access to KL Monorail and covered walkway from KLCC to Bukit Bintang.
Malaysia is also a great venue for organising events such as meetings, incentives, conferences, exhibitions (MICE) and festivals. Most of the convention centres in Malaysia like Putrajaya International Convention Centre (PICC), Kuala Lumpur Convention Centre (KLCC), Berjaya Times Square Hotel & Convention Centre (BSCC), Borneo Convention Centre Kuching (BCCK) are world standard, well equipped with high speed and sophisticated telecommunication technology. Events can also be held at beach resorts, island beach resorts or rainforest resorts.
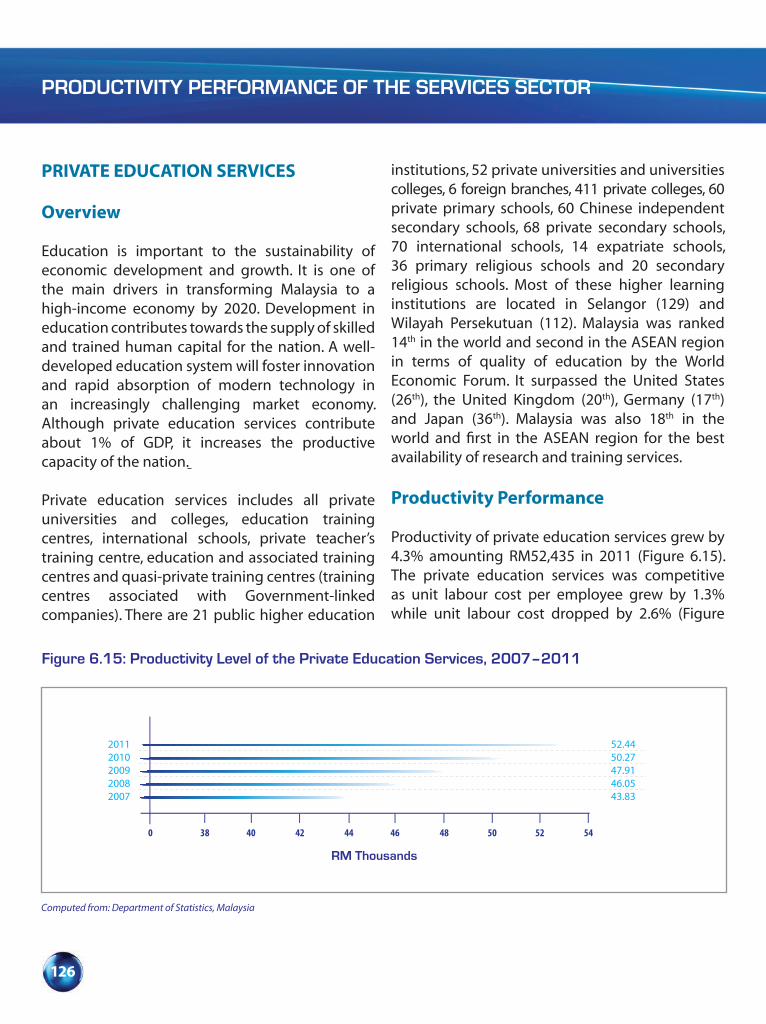
PRODUCTIVITY PERFORMANCE OF THE SERVICES SECTOR
126
PRIVATE EDUCATION SERVICES
Overview
Education is important to the sustainability of economic development and growth. It is one of the main drivers in transforming Malaysia to a high-income economy by 2020. Development in education contributes towards the supply of skilled and trained human capital for the nation. A well-developed education system will foster innovation and rapid absorption of modern technology in an increasingly challenging market economy. Although private education services contribute about 1% of GDP, it increases the productive capacity of the nation.
Private education services includes all private universities and colleges, education training centres, international schools, private teacher’s training centre, education and associated training centres and quasi-private training centres (training centres associated with Government-linked companies). There are 21 public higher education
institutions, 52 private universities and universities colleges, 6 foreign branches, 411 private colleges, 60 private primary schools, 60 Chinese independent secondary schools, 68 private secondary schools, 70 international schools, 14 expatriate schools, 36 primary religious schools and 20 secondary religious schools. Most of these higher learning institutions are located in Selangor (129) and Wilayah Persekutuan (112). Malaysia was ranked 14th in the world and second in the ASEAN region in terms of quality of education by the World Economic Forum. It surpassed the United States (26th), the United Kingdom (20th), Germany (17th) and Japan (36th). Malaysia was also 18th in the world and first in the ASEAN region for the best availability of research and training services.
Productivity Performance
Productivity of private education services grew by 4.3% amounting RM52,435 in 2011 (Figure 6.15). The private education services was competitive as unit labour cost per employee grew by 1.3% while unit labour cost dropped by 2.6% (Figure
Figure 6.15: Productivity Level of the Private Education Services, 2007–2011
20112010200920082007
52.4450.2747.9146.0543.83
RM Thousands
0 38 40 42 44 46 48 50 52 54
Computed from: Department of Statistics, Malaysia
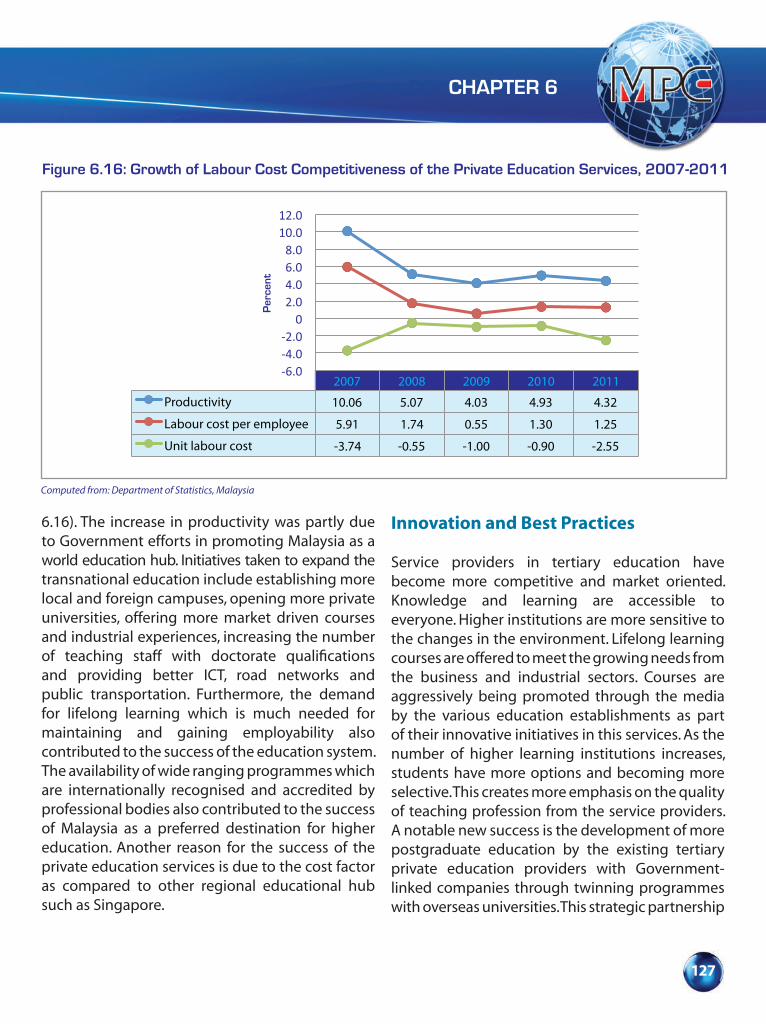
CHAPTER 6
127
6.16). The increase in productivity was partly due to Government efforts in promoting Malaysia as a world education hub. Initiatives taken to expand the transnational education include establishing more local and foreign campuses, opening more private universities, offering more market driven courses and industrial experiences, increasing the number of teaching staff with doctorate qualifications and providing better ICT, road networks and public transportation. Furthermore, the demand for lifelong learning which is much needed for maintaining and gaining employability also contributed to the success of the education system. The availability of wide ranging programmes which are internationally recognised and accredited by professional bodies also contributed to the success of Malaysia as a preferred destination for higher education. Another reason for the success of the private education services is due to the cost factor as compared to other regional educational hub such as Singapore.
Innovation and Best Practices
Service providers in tertiary education have become more competitive and market oriented. Knowledge and learning are accessible to everyone. Higher institutions are more sensitive to the changes in the environment. Lifelong learning courses are offered to meet the growing needs from the business and industrial sectors. Courses are aggressively being promoted through the media by the various education establishments as part of their innovative initiatives in this services. As the number of higher learning institutions increases, students have more options and becoming more selective. This creates more emphasis on the quality of teaching profession from the service providers. A notable new success is the development of more postgraduate education by the existing tertiary private education providers with Government-linked companies through twinning programmes with overseas universities. This strategic partnership
2007 2008 2009 2010 2011
Productivity 10.06 5.07 4.03 4.93 4.32
Labour cost per employee 5.91 1.74 0.55 1.30 1.25
Unit labour cost -3.74 -0.55 -1.00 -0.90 -2.55
Per
cent
Figure 6.16: Growth of Labour Cost Competitiveness of the Private Education Services, 2007-2011
Computed from: Department of Statistics, Malaysia

PRODUCTIVITY PERFORMANCE OF THE SERVICES SECTOR
128
will foster Malaysia’s transformation plan to become a high-income country in 2020 as well as an education hub.
As competition intensifies, many private higher institutions are becoming more specialised with the name of their institution to reflect their core business such as programmes in medical science and pharmaceutical. To strengthen their presence in the market, some of these private local colleges team up with foreign universities to provide world-class education to the people. This innovation is cost-effective, as the learning is not completely done in overseas. The International Student Exchange Programme (ISEP) offers students to pursue their final year studies at foreign universities. The global exposure will strengthen graduates employability. To provide students with multiple experiences, one of the best practices adopted is to allow students to spend a semester or more at different campuses in Malaysia. The cross-campus transfer programme provides opportunity for students to savour a great Malaysian experience.
Another best practice in today’s tertiary education is the intensified effort of advancing the non-traditional method of teaching. Open and distance learning is well received today than before as more students are computer savvy and comfortable with the use of ICT. It was also observed that one of the innovative approaches in teaching and learning is the use of Learning Management System (LMS). This e-learning system provides borderless interaction between students and lecturers. With this system, students can never miss any lecture as it enables them to suit their study preferences. The tertiary education today is providing more students with industrial experiences. This is to provide students with more real work experience
to complement what is offered in the classroom. Current practices in this services are to invite top executives from specified field into the campus and share with the students about the working world and their expectations on the students. The Enrolment to Employment (E2E) approach builds up students’ competencies and new skills through the Business Leadership Series given by the blue-chip companies. The Praxis approach is a work-based learning module at profitable in-house business centres exposing students to the fundamental of industrial practices under a corporate lecturer’s supervision.
In some practices, a degree programme is introduced by combining scientific laboratory research skills and business course. This is to prepare students to be more sensitive to globalisation and marketability as the world economy is a rapidly changing market. Other practices observed include some colleges focusing towards the development of analytical and critical thinking skills, important characteristics much sought after by the top ranking universities and employers. Students who achieved academic excellence are awarded scholarships to study at Ivy-League universities. The development of incubation programmes by some universities is aimed at producing a large pool of qualified human capital for the nation.
Progress of Entry Point Projects (EPPs)
One of the EPPs in NKRA education services that are gaining much response is the international distance learning (EPP6). Efforts towards expanding the international distance learning initiative have received much support from the public. Towards this end, some of the established private universities are offering international distance
CHAPTER 6
129
learning programmes. The aim of this programme is to provide long life learning that can enhance people with skills and knowledge which match with today’s needs and challenges. Partnership programmes between the Government and private universities on areas of strategic research and knowledge transfer are some of the initiatives identified under EPP12 (championing Malaysia’s international education brand).
EduCity Iskandar Malaysia (EduCity) (EPP11) in Nusajaya, Johor marks a significant milestone into turning Malaysia as a regional education hub in South East Asia with world class quality. It has fared well with world-class universities such as the Newcastle University Medical Malaysia (NuMeD) and Netherlands Maritime Institute of Technology (NMIT). The Newcastle University Medical Malaysia (NuMeD) has started its operation with 80 undergraduate medical students on November 2011 offering full UK medical degrees in country. The Marlborough College is almost 40% completed while the Raffles University Iskandar, the University of Southampton Malaysian Campus and the University of Reading Malaysian Campus are to commerce soon. Competitive tuition fee, wide range of courses and existence of some of the top-notch university campuses in EduCity Iskandar Malaysia will drive more students from different part of the world to pursue their studies here.
Strategies and Outlook
Providing education is more challenging than in the past. Globalisation and technology advancement have created a much more intense business environment. In response to this, industrial and corporate sectors are very demanding for graduates to be more innovative, creative and knowledgeable.
For the graduates, higher education qualification is essential for career progression and entering into the job markets. The Government views education as a revolving business landscape to strengthen human capital and transforming the country into an international education hub.
There are several measures that can boost and strengthen the private education services. Programmes offered by private university and colleges should be more industry driven, accredited by the Government and internationally recognised. Private education service providers should actively involved in international events where students can take part in seminars or competition as this can promote excellence, creativity and hence increase productivity.
To encourage a more competitive environment, established foreign universities should be invited to set up campuses in Malaysia. More efforts are needed to increase a larger number of world-class universities in EduCity Iskandar Malaysia (EduCity). Currently, most of the private universities and colleges are concentrated in Kuala Lumpur and Selangor. The newly developed EduCity will provide more balance on education establishment. It also acts as a supplier of talented manpower to the various economic activities in Iskandar Malaysia. It is important that private higher education should be made more accessible and affordable to the students and the Government must monitor closely the tuition fees so that the costs are reasonable.
Malaysia has great potential to diverse its education system and becoming an education hub in the South East Asia region. English has been widely used as a primary medium of instruction in private tertiary institutions. This makes the

PRODUCTIVITY PERFORMANCE OF THE SERVICES SECTOR
130
country a popular choice for education destination coupled with the affordable fees charged by the private institutions as well as internationally recognised programmes. Many of the foreign students are also interested in learning English, courses internationally recognised such as TOEFL (Test of English as a Foreign Language) and IELTS (International English Language Testing System) and English courses offered by English language centres and private tertiary institutions should be promoted to them. Stable political environment, good infrastructure, biodiversity richness and multi-culture people are striking factors for Malaysia to become an education hub.
HEALTHCARE SERVICES
Overview
Healthcare services such as the privately owned, continues to expand since the last decade. To date, the private healthcare providers dominate the market for healthcare services in this country. A total of 62% of all hospitals are owned by private entities. The dual system in healthcare services provides greater accessibility to and at the same time, choices of healthcare institutions. While the public healthcare providers ensure accessibility to all income levels, private providers which are more commercialised, are targeting at population in the higher income brackets. Increasing demand for private health institutions is mainly due to increase in income per capita following deregulation in the supply of healthcare services. Increase in awareness of the public on the importance of healthcare also contributes to changing demand for healthcare services in Malaysia. Access to internet has increased people understanding on the importance of early
treatment for certain critical illnesses such as cancer, kidney failure and diabetes.
There are two forces that influence the healthcare system. First, is change in demographic characteristics of the population and second, is globalisation of the healthcare services. In the years to come, there is an increasing concern over increase share of population in dependent cohort, those in the older age groups which increase the demand for old age care services. Younger generation at the same time has better knowledge about disabilities, especially among children such as autism, attention deficit hyperactivity disorder (ADHD) and dyslexia, contributing to increase in demand for childcare services.
Globalisation brings down the cost of transportation which make cross border medical treatment possible. Many people seek medical service outside the country’s border for different reasons, either they are trying to find a better quality healthcare service or they wanted to seek for the lowest healthcare cost. Countries with excellent healthcare system will benefit the most from the expanding trend of seeking healthcare abroad.
Productivity Performance
The healthcare services recorded a productivity growth of 7.9% amounting to RM72,308 in 2011 from RM67,042 in 2010 (Figure 6.17 & 6.18). The highest productivity growth was recorded by the hospital services. Increase in productivity was reflected through a decline in unit labour cost by 5.0% and labour cost per employee 2.4% in 2011. The increasing level of productivity was mainly attributed by the changing preferences towards

CHAPTER 6
131
a better quality healthcare services as well as the growing attention placed towards health tourism which resulted in added investment in the latest technologies by the healthcare providers, particularly hospitals. This investment consequently led to improve efficiency and productivity in
healthcare as well as reducing the cost of providing the services. The use of ICT in managing patient records is an important innovative investment that helped manage the cost. This is in line with the effort to promote Malaysia as a global health tourism hub.
Figure 6.17: Productivity Level of Healthcare Services, 2007–2011
20112010200920082007
72.3167.0461.4954.9347.86
RM Thousands
0 10 20 30 40 50 60 70 80
Computed from: Department of Statistics, Malaysia
2007 2008 2009 2010 2011
Productivity 6.92 14.78 11.94 9.03 7.86
Labour cost per employee 2.22 23.08 21.72 2.68 2.37
Unit labour cost -4.43 7.29 9.12 -6.95 -4.96
-10.0
-5.0
0
5.0
10.0
15.0
20.0
25.0
Per
cent
Figure 6.18: Growth of Labour Cost Competitiveness of the Healthcare Services, 2007-2011
Computed from: Department of Statistics, Malaysia
PRODUCTIVITY PERFORMANCE OF THE SERVICES SECTOR
132
Malaysia has emerged as the most popular medical tourism destination in the ASEAN region, competing with Thailand and Singapore. It was reported that the biggest pull factors of the Malaysian medical tourism industry are good health infrastructures, Government support through promotional programmes as well as the availability of skilled medical professionals. Cost comparison among different countries for surgical procedures including heart bypass had revealed that Malaysia has the lowest and thus the most competitive cost which serves as another key factor to the bullish demand for health tourism in this country. A Muslim country status also added to Malaysia’s attractiveness score especially among health tourists from Muslim countries.
Innovation and Best Practices
Private healthcare providers are the major contributors to the provision of high quality healthcare services. The innovation in healthcare services focuses mainly towards expanding the capacity of the services involving both physical, human capital and network capacities as well as enhancing the quality of the service.
Continuous upgrading and expanding the number of health institutions are the strategies adopted by private healthcare providers to meet the increasing demand for better healthcare services as well as to attract more health tourists. This includes building hospitals with international standards and providing cutting edge technologies, highly trained consultants and staffs as well as hotel facilities.Investment in state-of-the-art medical technologies contributed to the enhancement of productivity. The use of electronic health record contributed to faster and more accurate database access on the medical records. The effort to improve the quality
of healthcare services is also achieved through collaboration in research and development. The healthcare information system, medical equipment as well as medical procedures are continually being enhanced through research collaborations with private research and development institutions as well as local universities.
Human capital enhancement is achieved through attaining and producing the best talent. The healthcare providers are committed to continuously improving the quality of healthcare services by acquiring medical consultants from various disciplines in order to add to the variety of services to their customers. At the same time, continuous training and enhancement programmes are also provided to empower the existing staffs with knowledge on correct procedures as well as producing talented employees. Outside the training programmes, the employees are exposed to seminars and conferences to get them involved in discussions with peers as well as other experts to benefit from knowledge spillovers.
Partnership with major airlines and tourism agencies is a wise step taken by healthcare providers to offer better health tourism packages. Partnership with the major airlines offering an all-inclusive package for medical travellers which covers the cost of travelling, hotel accommodation, and medical screening at any local medical centre offering comprehensive health screening packages for heart diseases, stroke and cancer had increased the attractiveness of Malaysia as health tourism destination. Besides, many of the healthcare providers have set up their international patient center to cater to the needs of international patients. Language may no longer be a barrier anymore to the health tourists as most of the
CHAPTER 6
133
providers now have employees who are fluent in many languages. The healthcare providers are also willing to provide interpreters to fulfill the needs of international health travellers.
One of the best practices to promote health tourism in Germany is through hospital catalogue which provides information on the range of treatment offered and the quality of results in all Germany hospitals. So far, Malaysia had introduced Health Tourism magazine as well as a website to provide better information to the potential health tourists. Malaysia Health Travel Council (MHTC) is given responsibility to promote Malaysia as health tourism hub. MHTC collaborated with major national airline to promote Malaysia through its in-flight magazine and arrival videos.
The Government provided platform in terms of policies changes and investment incentives. To attract more medical specialists to come to Malaysia, their spouses who qualified as a professional would automatically offered a temporary employment pass.
To encourage productive investment among private hospitals, Government offers a 100% tax exemption of qualifying capital expenditure incurred for a period of five years for the construction of new hospitals or for expansion, modernisation, or refurbishment of existing hospitals. Tax incentive is also given to hospitals that set up International Patients Unit in an effort to increase foreign tourists. The healthcare providers are also encouraged to obtain international accreditation by offering double tax deduction for expenses incurred in obtaining the accreditation.
To attract more health tourists, the Government
has extended the visa period from one month to six months. Foreigners entering Malaysia for medical treatment on emergency via ‘Visa on Arrival’ would be allowed to convert their status to social visit pass upon recommendation of private hospitals registered under the Ministry of Health for promotion of healthcare travel.
To support the development of generic drugs, the Government has shortened the compulsory services for pharmacists from three to one year to increase the supply of pharmacists in the private sector. All of these initiatives were part of Government efforts mapped under ETP in line with its focus to enhance collaboration between public and private sectors.
Progress of Entry Point Projects (EPPs)
There are 13 EPPs and one business opportunity (BO) identified under healthcare services. The EPPs that have direct impact on healthcare services are discussed below:
EPP1: Mandating private insurance for foreign workers
The Government has successfully mandated compulsory insurance scheme on all foreign workers. To date, 25 insurance companies and two third party claims administrators have registered to participate in the scheme. By end of 2011, the total of 1.4 million foreign workers have registered, surpassed the targeted number of 1.2 million.
EPP2: Creating a supportive ecosystem to grow clinical research
A total of seven new Clinical Research Centers

PRODUCTIVITY PERFORMANCE OF THE SERVICES SECTOR
134
(CRCs) had been established to make a total of 27 CRCs nationwide at the end of 2011. A total of 321 ongoing and new clinical trials had been achieved, surpassing the targeted number of 260 trials. Clinical Research Malaysia (CRM), a commercial arm of Ministry of Health’s CRC, was launched in 2011 in an effort to draw clinical trials to Malaysia. The direct beneficiary of this EPP achievement is the pharmaceutical industry, while it indirectly supplies trained doctors to become Key Opinion Leaders (KOLs) who are contributors to healthcare tourism services.
EPP4: Reinvigorating health travel through better customer experience, proactive alliances, and niche marketing
Two private healthcare providers have committed to this EPP through increased investment in building new medical facilities. Foreign patients contributed RM509.77 million to the economy and a total of 578,403 foreigners seek medical treatment in Malaysia in 2011.
EPP5: Creating a diagnostic services nexus to achieve scale in telemedicine for eventual international outsourcing
To date, there are two participating hospitals that have installed the infrastructure and connectivity for telemedicine. This EPP is still at the initial stage of its implementation with the two hospitals serving as pilot projects.
Strategies and Outlook
There is still a lack of awareness on the importance of medical insurance and above all, Malaysia has probably not yet pass the threshold of income
in which private sector can play a major role in providing healthcare and in that case, reduces the burden of the Government. Implementation of insurance for foreign workers is a suitable short-term measure to reduce the financial burden incurred by the Government.
Attaining the best talents in medical works may post another important challenge in achieving an excellent level of healthcare services. The payment system must be alluring enough in order to prevent the lost of talents to foreign countries especially in the case where most of the neighbouring countries are venturing into medical tourism services. This marks an increase in demand for medical practitioners across Southeast Asian region.
Although health tourism provides a promising prospect, there are still important issues to be addressed by the healthcare providers. Firstly, health tourism is deemed as a regional phenomenon. Statistics on the country of origin of health tourists around the world, including Malaysia, showed that a major percentage of health tourists came from neighbouring countries. Studies had also showed that people do not travel too far to get medical treatment. This is proven to be true for the case of Malaysia in which its largest medical tourists come from Indonesia. In order to ensure health tourism sustainability, we have to attract customers from other countries as Indonesia is planning to set up its own medical tourism services. Thailand’s health tourism focuses on domestic medical tourism. Malaysia should emulate Thailand by encouraging locals to seek for medical services domestically. Locals are important consumers as there are now more people who can afford private healthcare services. Currently, many Malaysians visit Singapore for their medical services. This can be achieved by
CHAPTER 6
135
building Malaysia’s own brand names in terms of special niche area that has not yet been offered by other health tourism suppliers. New markets for health tourism currently targeted by private hospitals are Vietnam and Cambodia.
Secondly, is the liberalisation of the services to fulfill the industry needs especially in terms of promotion. Certain deregulations are needed to ensure the competitiveness of local health tourism. For example, regulation on prohibiting healthcare advertising might need to be revised because information on types of services and prices are important for promotion.
Brand trust is the most important factor affecting loyalty and leveraging the relationship from service quality and value of loyalty. The healthcare providers should devote more efforts and resources to develop strong branding because important promoting mechanisms for health tourism are word-of-mouth and peer review/internet reviews.A concerted effort is needed in empowering local healthcare providers especially to produce the best health tourism services. Currently there are eight hospitals and clinical laboratories which had been accredited by Joint Commission International (JCI). To be JCI accredited, the hospitals must subscribe to high level of clinical and service excellence. Hence, the services should take the initiative to have more healthcare providers to be internationally accredited.
Apart but related to health tourism is the market for herbal and traditional treatment that can be further explored by local companies. Malaysia has strong potential to become herbal and traditional treatment hub for the region. There are several brands already in the market but these brands need
further promotion as strong branding is important in order to attain recognition in the international market. The herbal industry is still lacking in terms of technology, research and development effort, intellectual property protection, clinical documentations and standardised accreditation.
The Government through ETP has recognised and highlighted the importance of ICT in providing better healthcare services. A longer term plan for healthcare services is the outsourcing of medical diagnostic through telemedicine which requires improvement in ICT infrastructures of the providers. Malaysia has the potential to be a leader in providing telemedicine services given that proper ICT investment is in place.
CONSTRUCTION SERVICES
Overview
Construction will be one of the key drivers of economic development under the Tenth Malaysia Plan (10 MP) as the world economy experiences a major slow down. The ETP launched in 2010 has identified 12 NKEAs, as drivers of future growth. The Greater Kuala Lumpur/Klang Valley is one of the NKEAs which is targeted to achieve a 6% growth for the construction sector.
The construction sector recorded a GDP growth of 3.5% amounting to RM18.856 billion in 2011 (Figure 6.19). For the three construction sub-sectors, namely, residential, non-residential and civil engineering as well as the non-residential accounted for most of the growth during the period 2007-2011 (Figure 6.20). Based on 2011 data, the previous year 2010 appeared to be the bottoming

PRODUCTIVITY PERFORMANCE OF THE SERVICES SECTOR
136
Figure 6.19: GDP Level and Growth of Construction Sector, 2007–2011
20112010200920082007
RM Billion
0 2 4 6 8 10 12 14 16
Per
cent
Computed from: Department of Statistics, Malaysia
18 20
3.495.145.894.197.30
(18.86)
(18.22)
(17.33)
(16.37)
(15.71)
Figure 6.20: GDP of Construction Sub–Sectors, 2007–2011 at 2000 Constant Prices (RM Billion)
Civil Engineering Non–Residential Residential
Computed from: Construction Industry Development Board Malaysia (CIDB)
2011
2010
2009
2008
2007
0 1 2 3 4 5 6 7 8 9 10
Construction GDP 2007–2011 at 2000 constant prices RM Billion
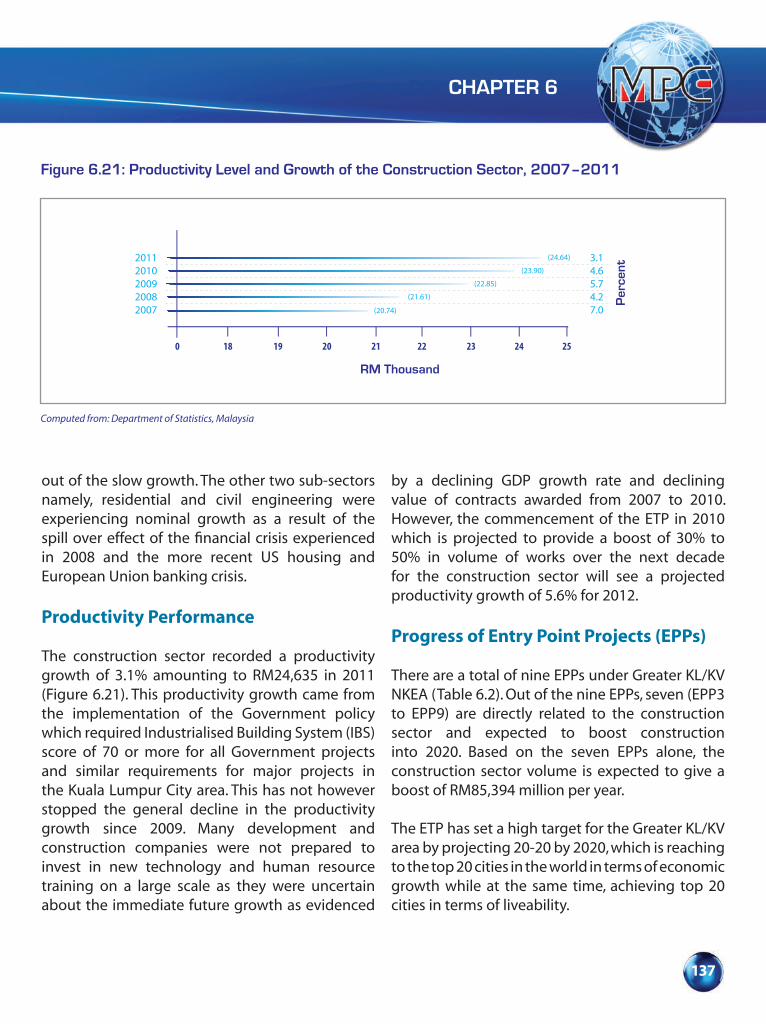
CHAPTER 6
137
out of the slow growth. The other two sub-sectors namely, residential and civil engineering were experiencing nominal growth as a result of the spill over effect of the financial crisis experienced in 2008 and the more recent US housing and European Union banking crisis.
Productivity Performance
The construction sector recorded a productivity growth of 3.1% amounting to RM24,635 in 2011 (Figure 6.21). This productivity growth came from the implementation of the Government policy which required Industrialised Building System (IBS) score of 70 or more for all Government projects and similar requirements for major projects in the Kuala Lumpur City area. This has not however stopped the general decline in the productivity growth since 2009. Many development and construction companies were not prepared to invest in new technology and human resource training on a large scale as they were uncertain about the immediate future growth as evidenced
by a declining GDP growth rate and declining value of contracts awarded from 2007 to 2010. However, the commencement of the ETP in 2010 which is projected to provide a boost of 30% to 50% in volume of works over the next decade for the construction sector will see a projected productivity growth of 5.6% for 2012.
Progress of Entry Point Projects (EPPs)
There are a total of nine EPPs under Greater KL/KV NKEA (Table 6.2). Out of the nine EPPs, seven (EPP3 to EPP9) are directly related to the construction sector and expected to boost construction into 2020. Based on the seven EPPs alone, the construction sector volume is expected to give a boost of RM85,394 million per year.
The ETP has set a high target for the Greater KL/KV area by projecting 20-20 by 2020, which is reaching to the top 20 cities in the world in terms of economic growth while at the same time, achieving top 20 cities in terms of liveability.
Figure 6.21: Productivity Level and Growth of the Construction Sector, 2007–2011
20112010200920082007
RM Thousand
0 18 19 20 21 22 23 24 25
Per
cent
Computed from: Department of Statistics, Malaysia
3.14.65.74.27.0
(24.64)
(23.90)
(22.85)
(21.61)
(20.74)

PRODUCTIVITY PERFORMANCE OF THE SERVICES SECTOR
138
Of the nine EPP projects, the two largest projects, EPP4 MRT and EPP5 River of Life already make up almost half of the EPP forecast. These two projects will commence site works in 2012. Figure 6.22 shows the development from concept to reality of the MRT project. It is projected that by the second quarter of 2012, RM15 billion worth of Phase 1 of the MRT will commence from Kajang to Maluri Station. Phase 2, projected to be awarded in the third and fourth quarters of 2012 will involve
another RM15 billion. This major infrastructure works among other EPP works is projected to record an output growth of 7% and a productivity growth of 5.6% for the construction sector.
The river of life project with a total budget of RM17.9 billion has the major objective of improving the water quality from “unsuitable for body contact” to “recreational use”. Phase 1 of the works worth RM3 billion have already started
Table 6.2: The EPPs Related to the Construction Sector (Construction Volume Per Year)
EPP Projected Spin o� for Construction Sector RM (Million)
*EPP 1
*EPP 2
EPP 3
EPP 4
EPP 5
EPP 6
EPP 7
EPP 8
EPP 9
100 MNC Head Quarters in Greater KL/KV*
Attracting the right mix of internal and external talent
Stations and rail infrastructure for KL-Singapore HSR
Stations and rail infrastructure for integrated MRT
River of Life-Revitalising the Klang River
Greening Greater KL/KV
Creating iconic places and attractions
Creating a comprehensive pedestrian network
Developing an e�cient solid waste management ecosystem
Total for 7 Construction EPPs
*Indirectly related to construction sectorSource: Economic Transformation Programme
Not Construction Related
Not Construction Related
16,500
47,000
17,900
149
240
105
3,500
85,394
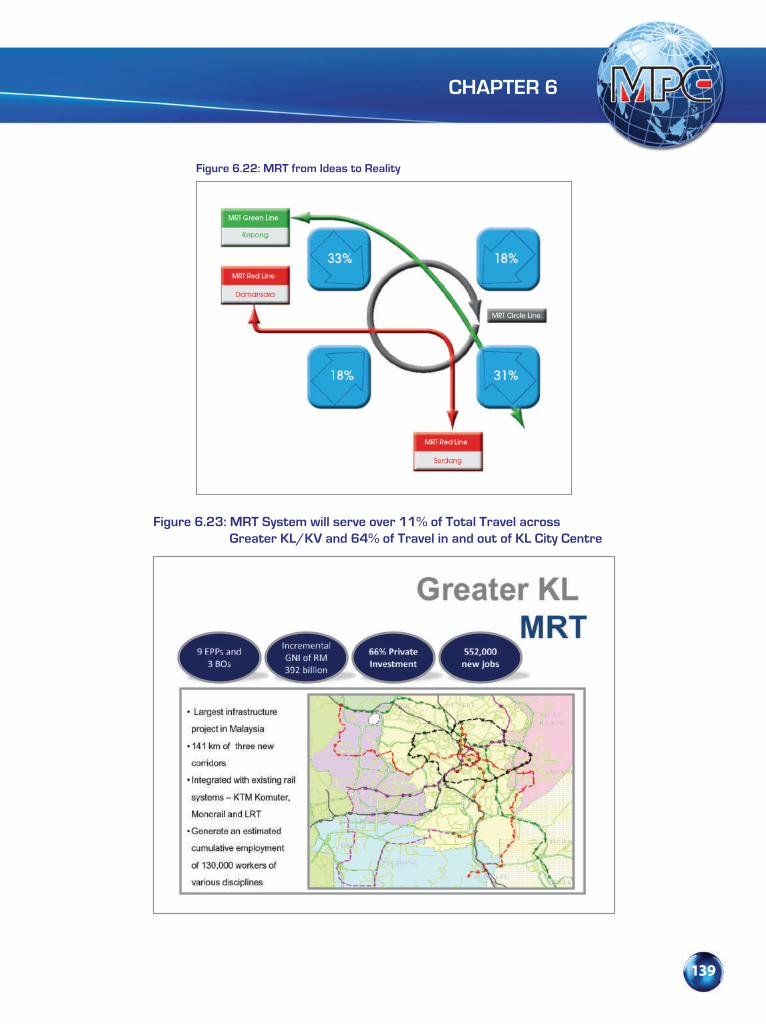
CHAPTER 6
139
Figure 6.22: MRT from Ideas to Reality
Figure 6.23: MRT System will serve over 11% of Total Travel across Greater KL/KV and 64% of Travel in and out of KL City Centre
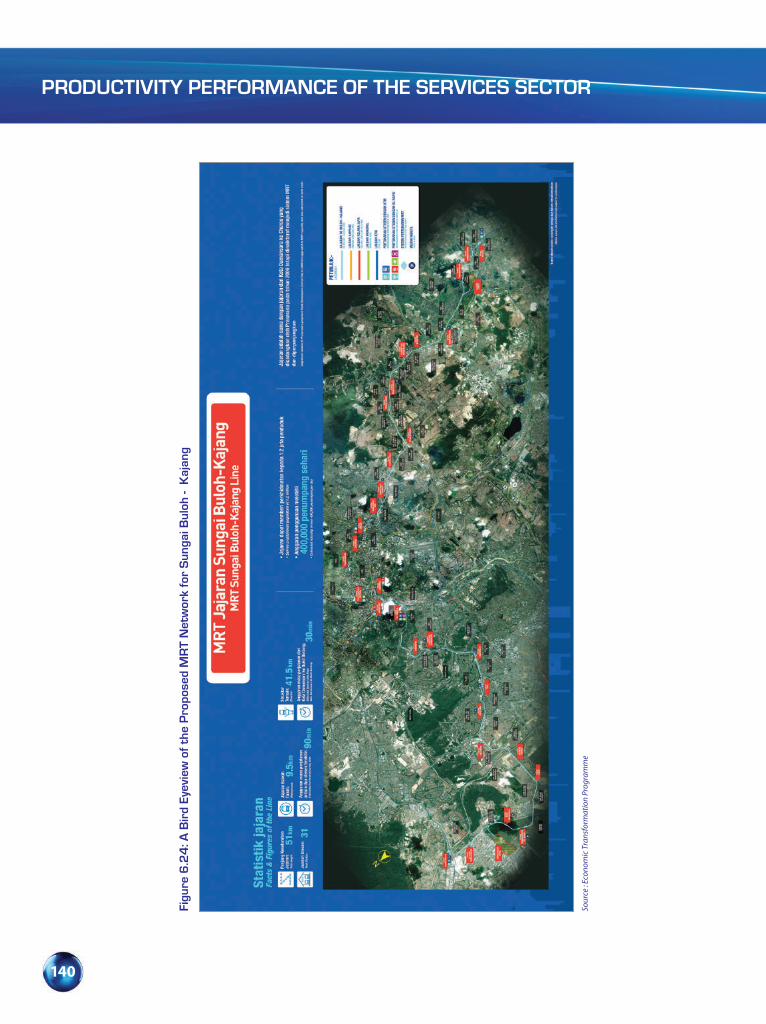
PRODUCTIVITY PERFORMANCE OF THE SERVICES SECTOR
140
Figu
re 6
.24
: A B
ird
Eyev
iew
of
the
Pro
pose
d M
RT
Net
wor
k fo
r S
unga
i Bul
oh -
Kaj
ang
Sour
ce : E
cono
mic
Tra
nsfo
rmat
ion
Prog
ram
me
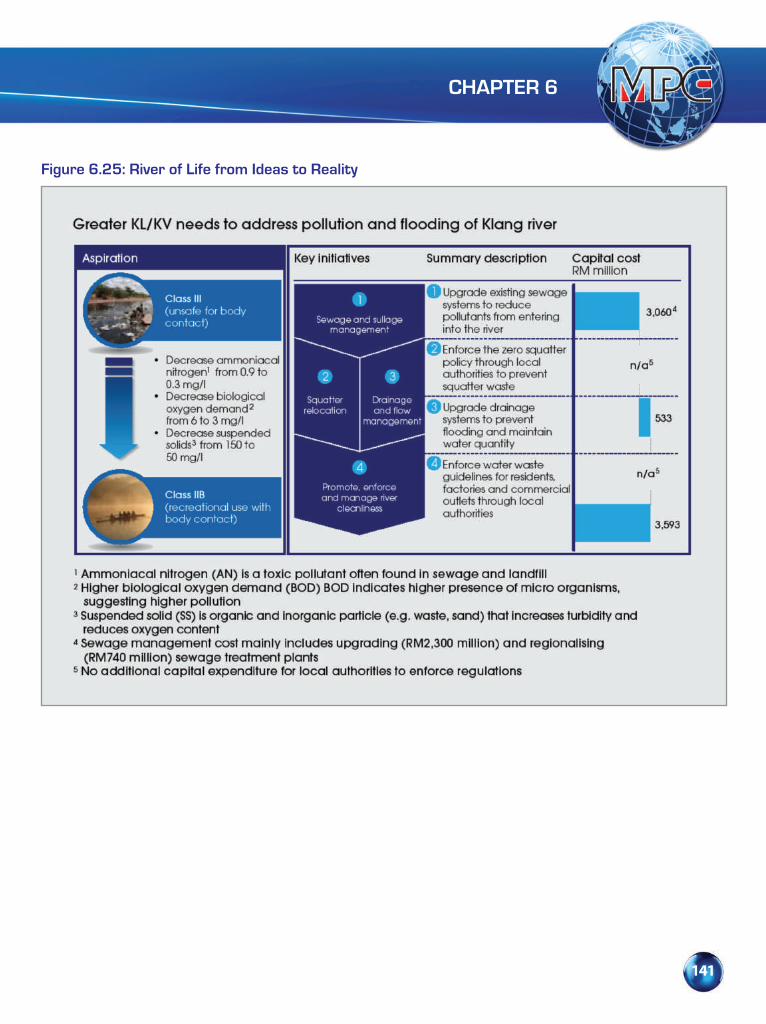
CHAPTER 6
141
Figure 6.25: River of Life from Ideas to Reality
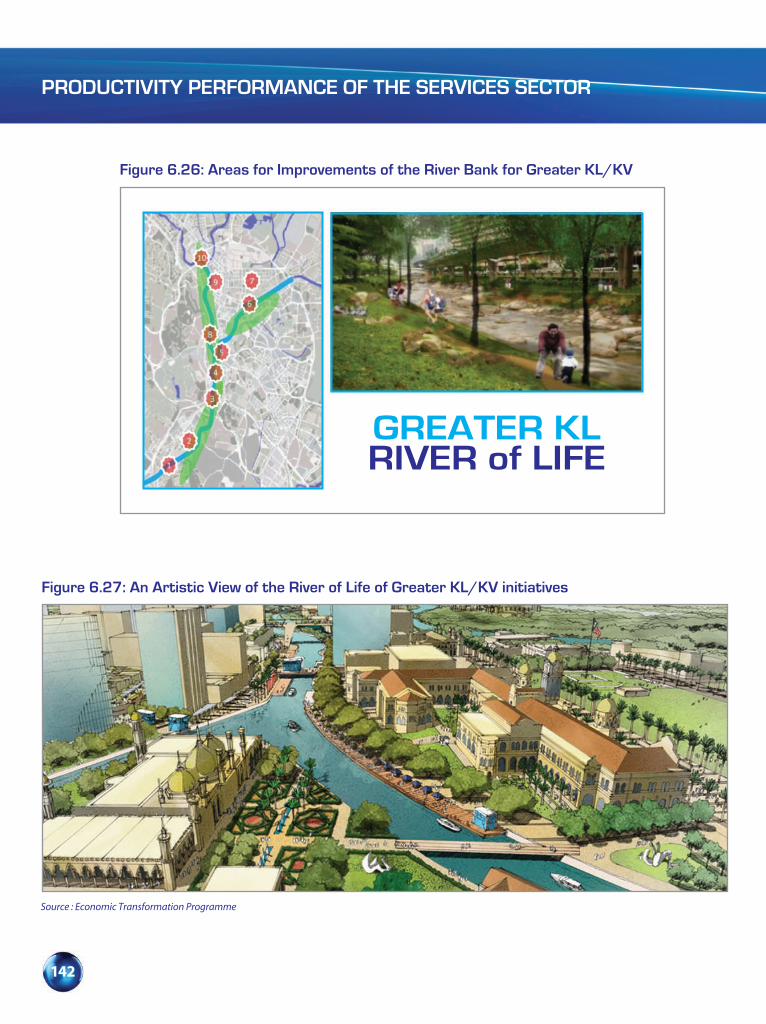
PRODUCTIVITY PERFORMANCE OF THE SERVICES SECTOR
142
Figure 6.26: Areas for Improvements of the River Bank for Greater KL/KV
GREATER KLRIVER of LIFE
Figure 6.27: An Artistic View of the River of Life of Greater KL/KV initiatives
Source : Economic Transformation Programme
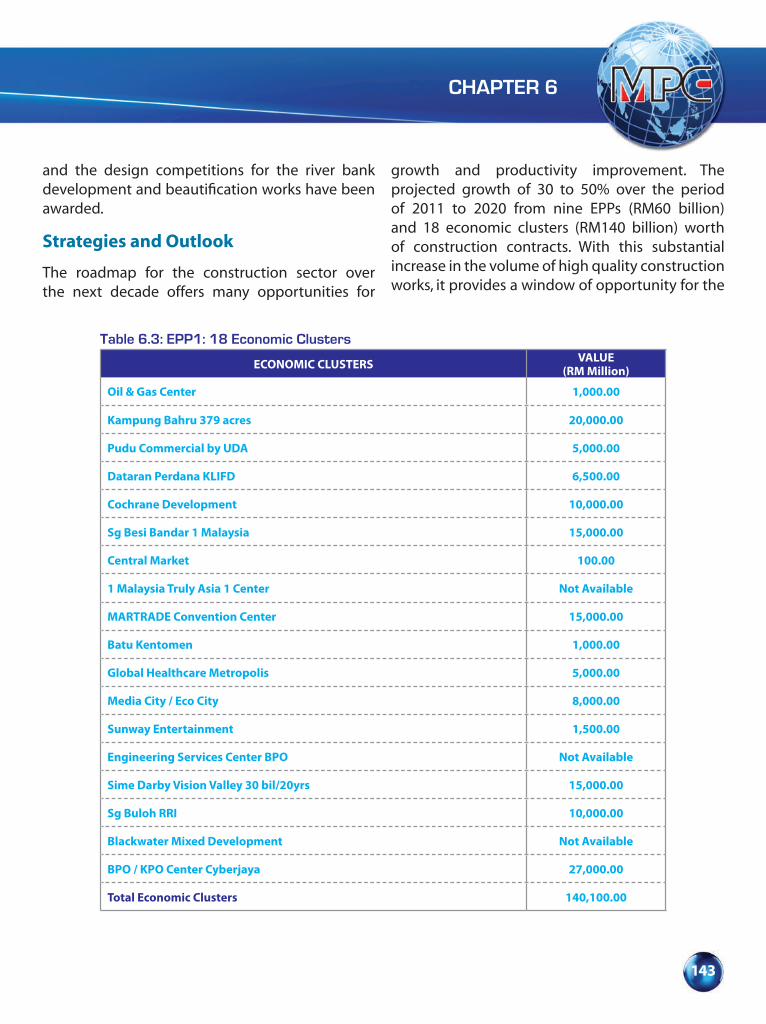
CHAPTER 6
143
Table 6.3: EPP1: 18 Economic Clusters
ECONOMIC CLUSTERS VALUE (RM Million)
Oil & Gas Center 1,000.00
Kampung Bahru 379 acres 20,000.00
Pudu Commercial by UDA 5,000.00
Dataran Perdana KLIFD 6,500.00
Cochrane Development 10,000.00
Sg Besi Bandar 1 Malaysia 15,000.00
Central Market 100.00
1 Malaysia Truly Asia 1 Center Not Available
MARTRADE Convention Center 15,000.00
Batu Kentomen 1,000.00
Global Healthcare Metropolis 5,000.00
Media City / Eco City 8,000.00
Sunway Entertainment 1,500.00
Engineering Services Center BPO Not Available
Sime Darby Vision Valley 30 bil/20yrs 15,000.00
Sg Buloh RRI 10,000.00
Blackwater Mixed Development Not Available
BPO / KPO Center Cyberjaya 27,000.00
Total Economic Clusters 140,100.00
and the design competitions for the river bank development and beautification works have been awarded.
Strategies and Outlook
The roadmap for the construction sector over the next decade offers many opportunities for
growth and productivity improvement. The projected growth of 30 to 50% over the period of 2011 to 2020 from nine EPPs (RM60 billion) and 18 economic clusters (RM140 billion) worth of construction contracts. With this substantial increase in the volume of high quality construction works, it provides a window of opportunity for the
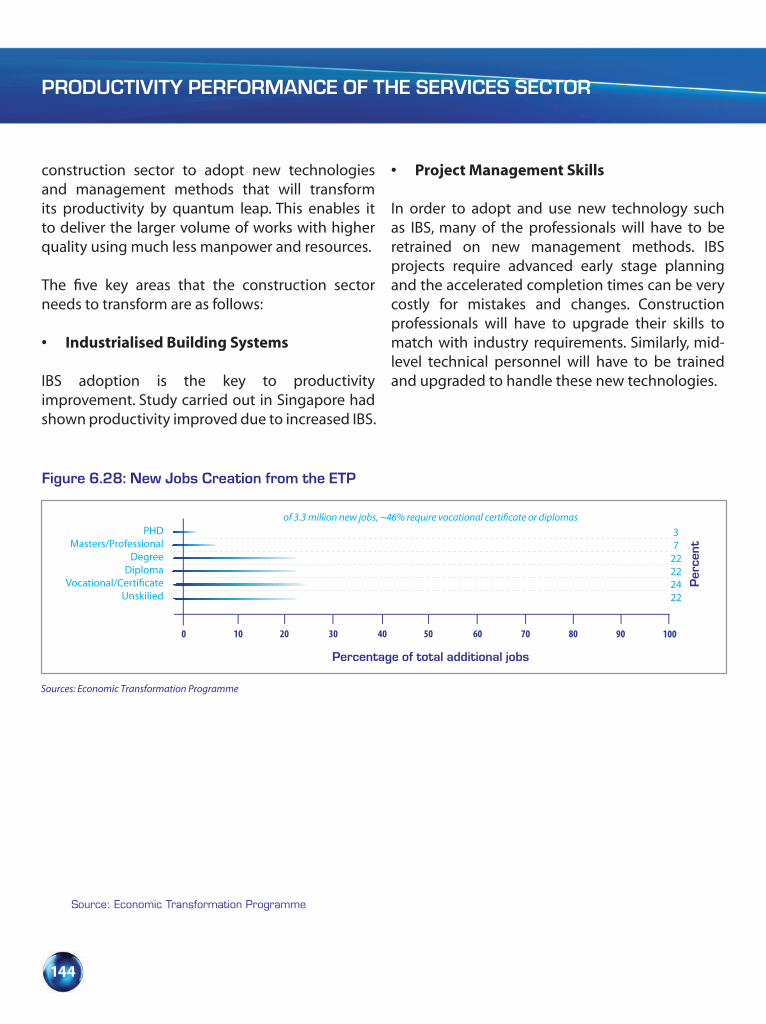
PRODUCTIVITY PERFORMANCE OF THE SERVICES SECTOR
144
construction sector to adopt new technologies and management methods that will transform its productivity by quantum leap. This enables it to deliver the larger volume of works with higher quality using much less manpower and resources.
The five key areas that the construction sector needs to transform are as follows:
• Industrialised Building Systems
IBS adoption is the key to productivity improvement. Study carried out in Singapore had shown productivity improved due to increased IBS.
• Project Management Skills
In order to adopt and use new technology such as IBS, many of the professionals will have to be retrained on new management methods. IBS projects require advanced early stage planning and the accelerated completion times can be very costly for mistakes and changes. Construction professionals will have to upgrade their skills to match with industry requirements. Similarly, mid-level technical personnel will have to be trained and upgraded to handle these new technologies.
Source: Economic Transformation Programme
Figure 6.28: New Jobs Creation from the ETP
PHDMasters/Professional
DegreeDiploma
Vocational/Certi�cateUnskilied
Percentage of total additional jobs
0 10 20 30 40 50 60 70 80
Per
cent
37
22222422
90 100
Sources: Economic Transformation Programme
of 3.3 million new jobs, ~46% require vocational certi�cate or diplomas

CHAPTER 6
145
• Building Information Management
Wider adoption of ICT throughout the construction supply chain will also greatly improve productivity. Studies in several advanced countries had already shown that adoption of BIM reduces design and documentation errors and improved productivity from less re-works and mistakes. There will have to be wider adoption of BIM over the entire supply chain from design and documentation to manufacturing and installation and finally, in building management using the same BIM information set.
• Skilled Construction Work Force
There should be long-term plans to develop the construction workforce at universities, polytechnics and vocational schools. The lack of skilled work force is very evident from the current large numbers of unskilled workers in the industry.
• Research & Development in Building Materials
R&D focused on the development of lower cost, higher quality, substitutes and easier-to-use
materials must be undertaken by universities with the direction given by the industries.
All these transformation initiatives are related to manpower development and are closely aligned to the ETP targets to increase job opportunities in the middle income categories by close to two million jobs. Industry studies have indicated that the lack of construction management skills is still prevalent in the construction sector. The following key areas of improvement will have to be implemented:
• More construction professionals and managers to be trained from universities and technical colleges;
• Wider adoption of Good Construction Management Practices – ISO 9001;
• More re-training and adult education courses in vocational schools, technical colleges and polytechnics; and
• Re-starting the skilled tradesman courses in vocational schools, polytechnics and technical schools.

146 Productivity Report 2011/2012
Box 6.1: Benchmarking for Education Excellence
The MARA Education Excellence Project is a joint venture between MARA Secondary Education Division and Malaysia Productivity Corporation (MPC). It was established in 2003 with the aim to enhance performance of all MARA Junior Science College (MRSM) colleges throughout Malaysia. It also guides MRSM academicians and staff in enhancing benchmarking and best practice activities.
There are nine major elements identified which are vital to inculcate excellence in the MRSM education system. They are:
• Leadership and College Communication;• College’s Objective Planning and Achievement;• Human Capital Development;• Teaching and Learning;• College Continuous Improvement Planning;• College Support Processes Performance;• College Social Cooperation Network;• Focus on Students and Stakeholder and• Data Management and Performance Achievement.
Benefits derived from the MRSM Education Excellence Benchmarking Programme:
• Ability to establish Key Performance Indicators (KPI) and benchmarks which are related to MRSM major processes;
• To identify the strengths and weaknesses of some of the major processes in the departments; • An established Education Excellence Model for all MRSM colleges in Malaysia; and• Development of planned programmes for continuous improvement
Based on the nine elements identified, MRSMs are able to achieve the critical success factors which are vital to their relevance. The benchmarking processes allow each college to know their ranking among the MRSMs. If they are not able to achieve the expected standard, they will then be able to observe, emulate and implement the good practices from other colleges. This proactive and structured approach helps to improve education business operations towards achieving innovation and higher performance. The desire to be the best has become the focus of every individual in the respective MRSM colleges. The subsequent figure shows a framework adopted by MRSM, LEADERSHIP AND COMMUNICATION (component 1) is the most important component or the core business as it can influence the achievement of other components. Leaders play the role as the head (to lead), set the direction and decision making
Components 2 to 7 (the planning and achievement of objectives, development of human capital, R & D, continuous improvement, performance and support processes of social collaboration) are the driving factors or the enablers to improve performance, productivity and quality management, administration and leadership of MRSM. These components provide the impetus for excellence because it is a very important process and must be properly carried out to determine the success and excellence in education organisations.

147Productivity Report 2011/2012
If the component 1 to 7 are excellent, the result or effect is the efficiency of component 8 and 9 (focus on students and stakeholders as well as data management and performance)
Therefore, all MRSM must make periodic assessment of components 1 to 9 each year in order to make comparisons of performance among MRSM. If the performance is not satisfactory at a particular MRSM, benchmarking with other MRSM is good and will assist in making some improvements. The effects of benchmarking and sharing of the best practices create a culture of continuous improvement in all MRSM nationwide.
1. L
eade
rshi
p an
d Co
mm
unic
atio
n
10. Sharing Best Practicesfor Continuous Improvement
8. F
ocus
on
Stud
ents
an
d St
akeh
olde
r9.
Dat
a M
anag
emen
t and
Pe
rfor
man
ce A
chie
vem
ent
Teaching and Learning
ContinuousImprovement
Planning
Support Processes
Performance
Social Cooperation
Network
Objective, Planning And Achievement
Human Capital Development
MARA Junior Science CollegeEducation Excellence
5 4
3
7
6
MARA Junior Science CollegeEducation Excellence
2
MeasureEvaluate
Transform
Framework Adopted by MRSM, Leadership & Communication

148 Productivity Report 2011/2012
Box 6.2: Measuring Performance of Private Hospitals
Malaysia Productivity Corporation undertook an annual benchmarking study on healthcare in private hospitals from 2003 to 2010. The main purpose of the benchmarking study was to assist the participating hospitals to focus on continuously improving the quality of its services by comparing its performance on a number of Key Performance Indicators (KPI). The process provides the participating hospitals to compare between each other.
There were five main areas to be benchmarked namely, Technical Efficiency, Staff and Facilities Utilisation, Clinical Outcome, Patient Satisfaction; and Financial Performance.
Participating hospitals were classified into three categories namely, ‘small’, medium’ and ‘large’. Hospitals with less than 99 beds were classified as ‘small’, hospitals having 100-199 beds were classified as ‘medium’ while hospitals with more than 199 beds were considered as ‘large’.
In terms of Technical Efficiency, overall average length of stay and bed occupancy rate for all clusters of hospitals showed a decreasing trend from 2008 to 2010. Average length of stay decreased from 2.9 days in 2008 to 2.5 days in 2010. Bed occupancy rate recorded was 62% in 2008 followed by 57% and 58% in 2009 and 2010.
PatientSatisfaction
ClinicalOutcome
Sta� &Facilities
Utilisation
FinancialIndicators
TechnicalE�ciency
KeyPerformance
Indicators
Key Performance Indicators (KPIs)

149Productivity Report 2011/2012
On Staff and Facilities Utilisation, for the period of 2008 to 2010, utilisation in Magnetic Resonance Imaging (MRI) recorded 81%, 90% and 88% respectively. Computerized Tomography Scan Utilisation Rate (CT) increased from 36% in 2008 to 46% in 2010.
In the area of Clinical Outcome, 70% of eligible acute myocardial infarction (AMI) patients received treatment within one hour in 2010, a decrease from 83% in both 2008 and 2009.
On Patient Satisfaction, average waiting time admission increased from 22 minutes in 2008 to 30 minutes in 2010. Waiting time for discharge had also increased from 54 minutes to 60 minutes over the same time period.
On Financial performances, the average net revenue per full-time staff had increased from RM143,745 in 2009 to RM169,880 in 2010 while stock turnover ratio decreased from 13.4 times in 2009 to 11.1 times in 2010. Box 6.2: Measuring Performance of Private Hospitals
Trend of selected KPIs
No Key Performance IndicatorsOverall
2008 2009 2010
1 Average length of stay (day) 2.9 2.8 2.5
2 Average bed occupancy rate (%) 62 57 58
Staff and Facilities Utilisation
3 MRI utilisation rate (%) 81 90 88
4 CT scan utilisation rate (%) 36 47 46
Clinical Outcome
5 % of eligible AMI patients - within 1 hour 83 83 70
Patient Satisfaction
6 Waiting time admission (minute) - overall 22 37 30
7 Waiting time for discharge (minute) - overall 54 62 60
Financial
8 Net revenue per total full-time staff (RM) 157,604 143,745 169,880
9 Average stock turnover ratio 10.8 13.4 11.1
150 Productivity Report 2011/2012
Box 6.3: Building Information Modeling For Greater Productivity Of The Construction Sector
Building Information Modelling (BIM) is the future of Design Documentation for the construction industry. It allows architects who are the lead consultants and the source of the initial design drawings to design in 3D with “intelligent” Object Oriented Modelling. This is where the Computer Aided Design (CAD) programmes recognise that each object drawn by an architect is an independent object. For example, lines drawn as walls are recognised as bricks by the programme and given such properties. An architect can then insert windows and doors in the brickworks and the programme will recognise these as compared to 2D programmes where they are treated as lines by the programme and an architect still has to erase out the walls before putting in the doors and windows. It is anticipated that with BIM, an architect can improve his productivity by 30%. The programmes are however more difficult to learn compared to 2D CAD programmes and require more intensive training and higher computer hardware specifications.
An independent survey by Pertubuhan Arkitek Malaysia (PAM) has shown that only about 5% of architects had adopted BIM and 3D CAD in their offices. The capacity of the industry has to be improved as it is projected that by 2020, architects who have not adopted BIM will no longer be competitive. This is similar to the situation of the architects doing manual drawings on tracing paper in the 1990s. By 2000, there were almost no architects doing manual drawings as almost all had switched to 2D electronic drawing boards. Another advantage of BIM is when changes need to be made to the design. With BIM, the architects only need to change the base model drawings and all other drawings such as the plans, elevations and sections are changed automatically and problems of uncoordinated drawings will no longer exist.
BIM drawing databases are also able to output very accurate quantities of all components, thereby eliminating the needs for quantity surveyors to “take off” and re-measure drawings. Any changes made to the base model will generate different quantities of the components, thereby allowing the change quantities to be known quickly and accurately and also enable other related consultants to improve their productivity.
Manufacturers of buildings components such as doors, windows, precast concrete and fittings are also able to independently model their components and make them available to the design industry. They only need to be extracted and “inserted” into the model, thereby reducing the time needed to “re-draw and re-measure” these components. As more manufacturers adopt Computer Aided Design-Computer Aided Manufacturer (CAD-CAM) and computer aided manufacturing as shown in the above figure, BIM will become even more important, as models from architects are transmitted directly to the manufacturers. This will enable them to fabricate custom-made components more readily and accurately by merely detailing the components and moving to CAM immediately, vastly improving productivity and quality.
Builders having access to these more accurate quantities of the base components are able to cost the projects quickly and more accurately. They are also able to source for alternative materials and components with greater confidence as the baseline requirements are readily available from the databases.
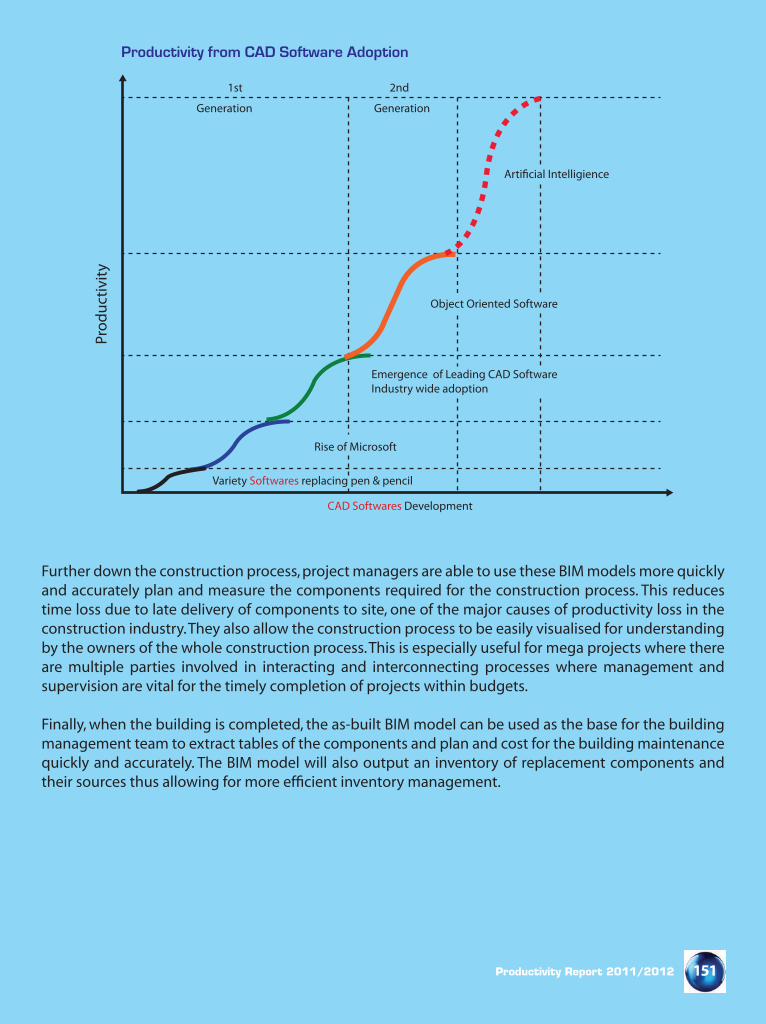
151Productivity Report 2011/2012
Further down the construction process, project managers are able to use these BIM models more quickly and accurately plan and measure the components required for the construction process. This reduces time loss due to late delivery of components to site, one of the major causes of productivity loss in the construction industry. They also allow the construction process to be easily visualised for understanding by the owners of the whole construction process. This is especially useful for mega projects where there are multiple parties involved in interacting and interconnecting processes where management and supervision are vital for the timely completion of projects within budgets.
Finally, when the building is completed, the as-built BIM model can be used as the base for the building management team to extract tables of the components and plan and cost for the building maintenance quickly and accurately. The BIM model will also output an inventory of replacement components and their sources thus allowing for more efficient inventory management.
Generation Generation
Variety Softwares replacing pen & pencil
CAD Softwares Development
Object Oriented Software
Arti�cial Intelligience
Emergence of Leading CAD SoftwareIndustry wide adoption
Rise of Microsoft
1st 2ndPr
oduc
tivity
Productivity from CAD Software Adoption

CHAPTER 7
PRODUCTIVITY PERFORMANCE OF THE MANUFACTURING SECTOR
PRODUCTIVITY PERFORMANCE OF THE MANUFACTURING SECTOR
154
Overview
The manufacturing sector recorded a productivity growth of 2.0% in 2011 amounting to RM54,509 compared to 9.4% in 2010. The lower growth experienced by the manufacturing sector was due to massive reduction from external demand as well as disruptions within the supply chain which mainly affected export oriented industries including the three NKEAs of the manufacturing sector, particularly, the electronics and electrical (E&E) sub-sector. However, relatively high growth of domestic oriented industries (8.9%) due to favourable domestic demand conditions had out-weighed the slower growth in the export oriented industries (3.4%).
Total trade for major products in 2011 was RM694.5 billion, an improvement by 8.7% compared to the previous year (RM638.9 billion). Export for manufactured products in 2011 increased by 3.4% to RM503.4 billion, representing 72.5% from total export. Major export products were electrical and electronic products, palm oil, LNG, chemicals and chemical products (6.9%) and refined petroleum products. Majority of these exports were from three NKEAs of the manufacturing sector, namely, E&E, refined petroleum products and palm oil industry.
E&E products continued to be Malaysia’s leading export earner, valued at RM260.1 billion or representing 37.5% of total export amongst the major products in 2011. However, the E&E sub-sector experienced a slight reduction of 4.1% compared to the volume exported during 2010. This was due to the weakness in external demand and disruptions in the global E&E supply chain. China continued to be the principal export market for electronic products recording a share of 21.2%,
followed by Singapore (15.5%), Hong Kong (11.8%) and United States (12.7%). For electrical products, the principle market comprised United States (14.9%), European Union (13.7%), Japan (12.0%) and Singapore (10.8%).
The oil and gas industry was the second largest contributor to Malaysia’s export contributing RM88.1 billion or 12.7% of the total export share in 2011. The industry experienced significant growth of 20.3% (RM88.1 billion) compared to the previous year (2010: RM73.2 billion). Malaysia’s main export market for crude oil were Australia (29.8%), India (19.6%), Thailand (16.3%) and China (7.5%), while for LNG, the export market were Japan (62.0%), Korea (16.0%) and Taiwan (13.5%). Refined petroleum products contributed RM36.7 billion, representing 5.3% of the total manufacturing export and experienced 25.5% growth in 2011.
Palm oil was the third largest contributor to export income in 2011 amounting to RM60.4 billion with an export share of 8.7%. The industry recorded a substantial increase of 35.1% compared to the previous year (2010: RM44.7 billion; 23.1%). Major export markets were China (21.9%), European Union (11.2%), Pakistan (10.0%) and Middle East (9.6%).
Gross import in 2011 amounted to RM592.6 billion, increased by 8.6% compared to the previous year of RM545.7 billion. In tandem with the moderate growth of the manufacturing sector, import for intermediate goods was significantly lower which recorded only 5.4% growth compared to previous year (2010: 23%). Import of intermediate goods such as parts and components of machineries were severely affected by tsunami which hit Japan during the first half of 2011. During the fourth
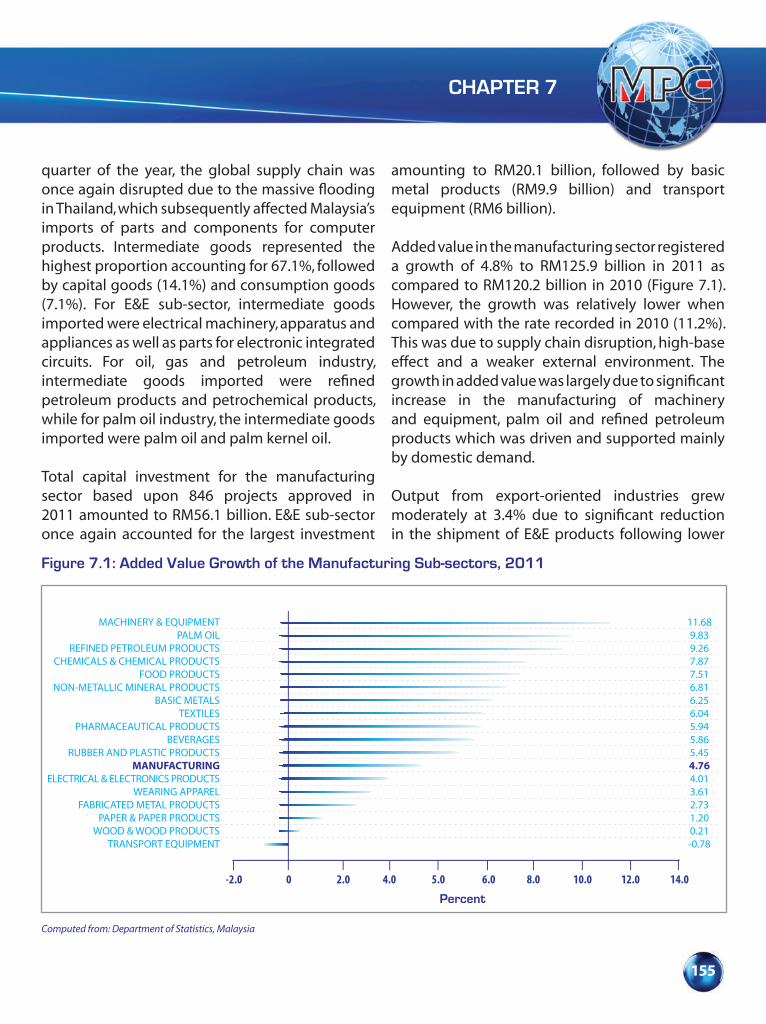
CHAPTER 7
155
quarter of the year, the global supply chain was once again disrupted due to the massive flooding in Thailand, which subsequently affected Malaysia’s imports of parts and components for computer products. Intermediate goods represented the highest proportion accounting for 67.1%, followed by capital goods (14.1%) and consumption goods (7.1%). For E&E sub-sector, intermediate goods imported were electrical machinery, apparatus and appliances as well as parts for electronic integrated circuits. For oil, gas and petroleum industry, intermediate goods imported were refined petroleum products and petrochemical products, while for palm oil industry, the intermediate goods imported were palm oil and palm kernel oil.
Total capital investment for the manufacturing sector based upon 846 projects approved in 2011 amounted to RM56.1 billion. E&E sub-sector once again accounted for the largest investment
amounting to RM20.1 billion, followed by basic metal products (RM9.9 billion) and transport equipment (RM6 billion).
Added value in the manufacturing sector registered a growth of 4.8% to RM125.9 billion in 2011 as compared to RM120.2 billion in 2010 (Figure 7.1). However, the growth was relatively lower when compared with the rate recorded in 2010 (11.2%). This was due to supply chain disruption, high-base effect and a weaker external environment. The growth in added value was largely due to significant increase in the manufacturing of machinery and equipment, palm oil and refined petroleum products which was driven and supported mainly by domestic demand.
Output from export-oriented industries grew moderately at 3.4% due to significant reduction in the shipment of E&E products following lower
Figure 7.1: Added Value Growth of the Manufacturing Sub-sectors, 2011
MACHINERY & EQUIPMENTPALM OIL
REFINED PETROLEUM PRODUCTSCHEMICALS & CHEMICAL PRODUCTS
FOOD PRODUCTSNON-METALLIC MINERAL PRODUCTS
BASIC METALSTEXTILES
PHARMACEAUTICAL PRODUCTSBEVERAGES
RUBBER AND PLASTIC PRODUCTSMANUFACTURING
ELECTRICAL & ELECTRONICS PRODUCTSWEARING APPAREL
FABRICATED METAL PRODUCTSPAPER & PAPER PRODUCTS
WOOD & WOOD PRODUCTSTRANSPORT EQUIPMENT
0
2.0 4.0 5.0 6.0 8.0 10.0 12.0 14.0
11.689.839.267.877.516.816.256.045.945.865.454.764.013.612.731.200.21-0.78
Percent
Computed from: Department of Statistics, Malaysia
-2.0
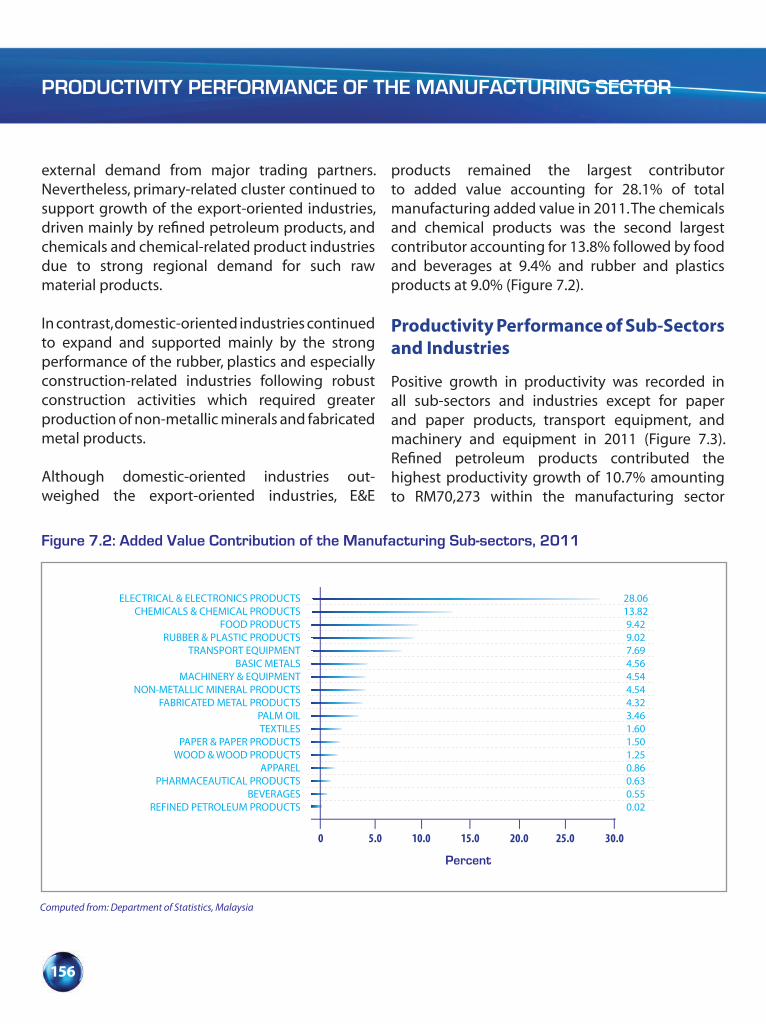
PRODUCTIVITY PERFORMANCE OF THE MANUFACTURING SECTOR
156
external demand from major trading partners. Nevertheless, primary-related cluster continued to support growth of the export-oriented industries, driven mainly by refined petroleum products, and chemicals and chemical-related product industries due to strong regional demand for such raw material products.
In contrast, domestic-oriented industries continued to expand and supported mainly by the strong performance of the rubber, plastics and especially construction-related industries following robust construction activities which required greater production of non-metallic minerals and fabricated metal products.
Although domestic-oriented industries out-weighed the export-oriented industries, E&E
products remained the largest contributor to added value accounting for 28.1% of total manufacturing added value in 2011. The chemicals and chemical products was the second largest contributor accounting for 13.8% followed by food and beverages at 9.4% and rubber and plastics products at 9.0% (Figure 7.2).
Productivity Performance of Sub-Sectors and Industries
Positive growth in productivity was recorded in all sub-sectors and industries except for paper and paper products, transport equipment, and machinery and equipment in 2011 (Figure 7.3). Refined petroleum products contributed the highest productivity growth of 10.7% amounting to RM70,273 within the manufacturing sector
Figure 7.2: Added Value Contribution of the Manufacturing Sub-sectors, 2011
Computed from: Department of Statistics, Malaysia
ELECTRICAL & ELECTRONICS PRODUCTSCHEMICALS & CHEMICAL PRODUCTS
FOOD PRODUCTSRUBBER & PLASTIC PRODUCTS
TRANSPORT EQUIPMENTBASIC METALS
MACHINERY & EQUIPMENTNON-METALLIC MINERAL PRODUCTS
FABRICATED METAL PRODUCTSPALM OILTEXTILES
PAPER & PAPER PRODUCTSWOOD & WOOD PRODUCTS
APPARELPHARMACEAUTICAL PRODUCTS
BEVERAGESREFINED PETROLEUM PRODUCTS
28.0613.829.429.027.694.564.544.544.323.461.601.501.250.860.630.550.02
0 5.0 10.0 15.0 20.0 25.0 30.0
Percent
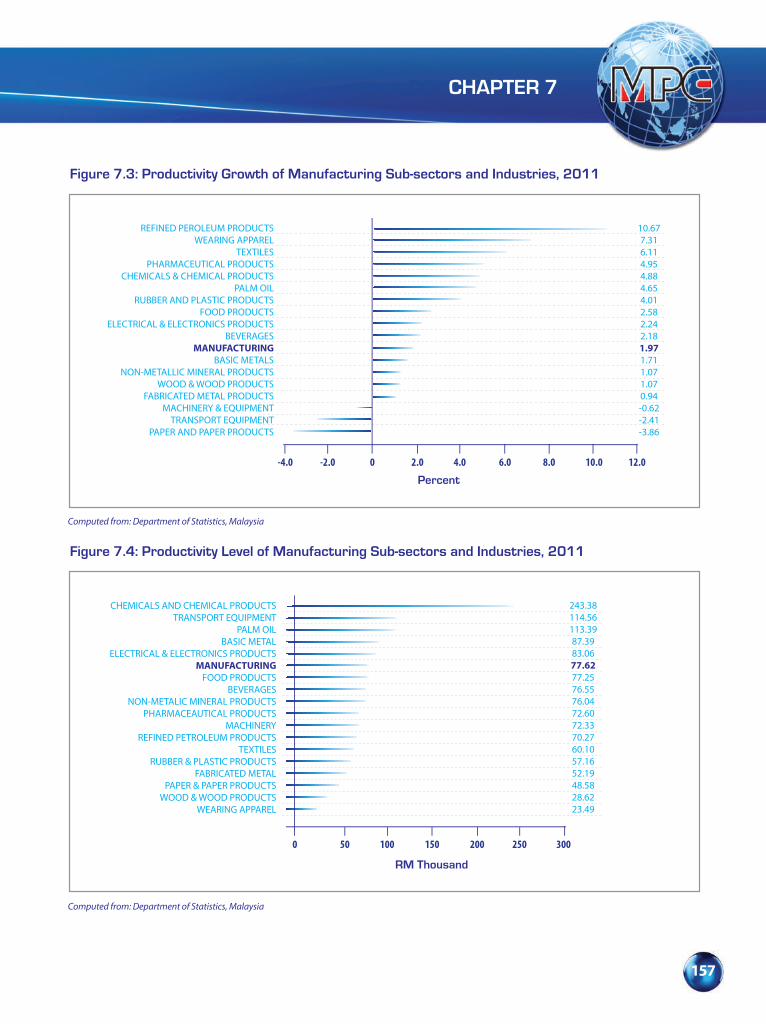
CHAPTER 7
157
Figure 7.3: Productivity Growth of Manufacturing Sub-sectors and Industries, 2011
REFINED PEROLEUM PRODUCTSWEARING APPAREL
TEXTILESPHARMACEUTICAL PRODUCTS
CHEMICALS & CHEMICAL PRODUCTSPALM OIL
RUBBER AND PLASTIC PRODUCTSFOOD PRODUCTS
ELECTRICAL & ELECTRONICS PRODUCTSBEVERAGES
MANUFACTURINGBASIC METALS
NON-METALLIC MINERAL PRODUCTSWOOD & WOOD PRODUCTS
FABRICATED METAL PRODUCTSMACHINERY & EQUIPMENT
TRANSPORT EQUIPMENTPAPER AND PAPER PRODUCTS
10.677.316.114.954.884.654.012.582.242.181.971.711.071.070.94-0.62-2.41-3.86
Percent
-4.0 -2.0 0 2.0 4.0 6.0 8.0 10.0 12.0
Computed from: Department of Statistics, Malaysia
Figure 7.4: Productivity Level of Manufacturing Sub-sectors and Industries, 2011
CHEMICALS AND CHEMICAL PRODUCTSTRANSPORT EQUIPMENT
PALM OILBASIC METAL
ELECTRICAL & ELECTRONICS PRODUCTSMANUFACTURING
FOOD PRODUCTSBEVERAGES
NON-METALIC MINERAL PRODUCTSPHARMACEAUTICAL PRODUCTS
MACHINERYREFINED PETROLEUM PRODUCTS
TEXTILESRUBBER & PLASTIC PRODUCTS
FABRICATED METALPAPER & PAPER PRODUCTS
WOOD & WOOD PRODUCTSWEARING APPAREL
0 50 100 150 200 250 300
RM Thousand
Computed from: Department of Statistics, Malaysia
243.38114.56113.3987.3983.0677.6277.2576.5576.0472.6072.3370.2760.1057.1652.1948.5828.6223.49
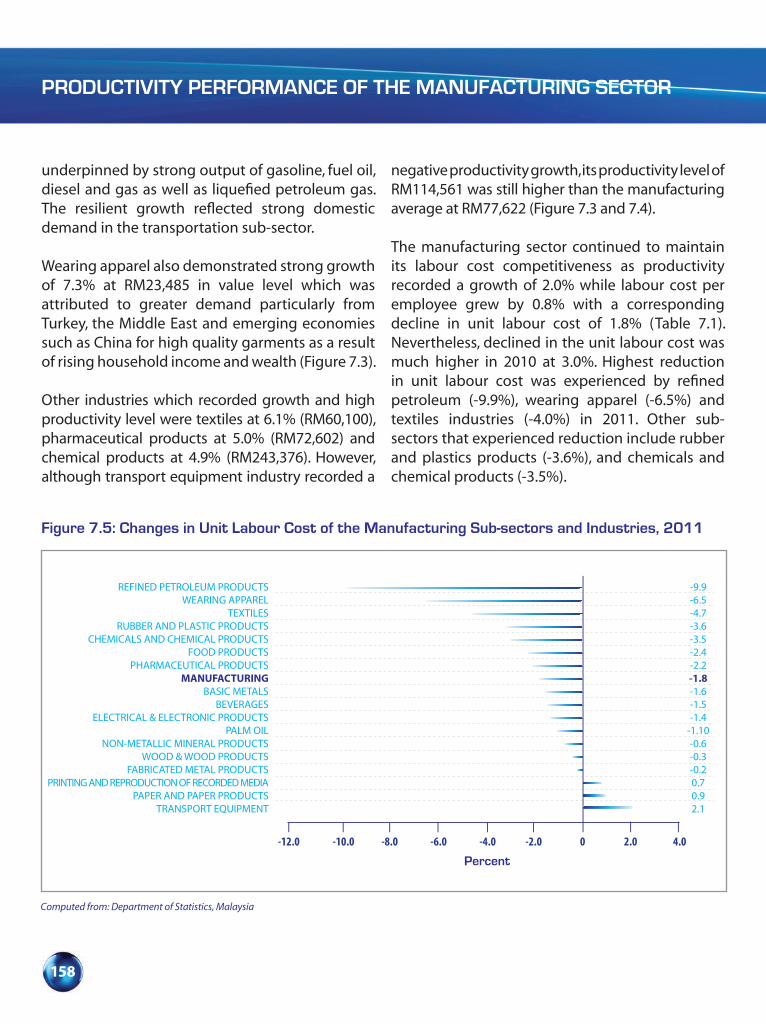
PRODUCTIVITY PERFORMANCE OF THE MANUFACTURING SECTOR
158
underpinned by strong output of gasoline, fuel oil, diesel and gas as well as liquefied petroleum gas. The resilient growth reflected strong domestic demand in the transportation sub-sector.
Wearing apparel also demonstrated strong growth of 7.3% at RM23,485 in value level which was attributed to greater demand particularly from Turkey, the Middle East and emerging economies such as China for high quality garments as a result of rising household income and wealth (Figure 7.3).
Other industries which recorded growth and high productivity level were textiles at 6.1% (RM60,100), pharmaceutical products at 5.0% (RM72,602) and chemical products at 4.9% (RM243,376). However, although transport equipment industry recorded a
negative productivity growth, its productivity level of RM114,561 was still higher than the manufacturing average at RM77,622 (Figure 7.3 and 7.4).
The manufacturing sector continued to maintain its labour cost competitiveness as productivity recorded a growth of 2.0% while labour cost per employee grew by 0.8% with a corresponding decline in unit labour cost of 1.8% (Table 7.1). Nevertheless, declined in the unit labour cost was much higher in 2010 at 3.0%. Highest reduction in unit labour cost was experienced by refined petroleum (-9.9%), wearing apparel (-6.5%) and textiles industries (-4.0%) in 2011. Other sub-sectors that experienced reduction include rubber and plastics products (-3.6%), and chemicals and chemical products (-3.5%).
Figure 7.5: Changes in Unit Labour Cost of the Manufacturing Sub-sectors and Industries, 2011
REFINED PETROLEUM PRODUCTSWEARING APPAREL
TEXTILESRUBBER AND PLASTIC PRODUCTS
CHEMICALS AND CHEMICAL PRODUCTSFOOD PRODUCTS
PHARMACEUTICAL PRODUCTSMANUFACTURING
BASIC METALSBEVERAGES
ELECTRICAL & ELECTRONIC PRODUCTSPALM OIL
NON-METALLIC MINERAL PRODUCTSWOOD & WOOD PRODUCTS
FABRICATED METAL PRODUCTSPRINTING AND REPRODUCTION OF RECORDED MEDIA
PAPER AND PAPER PRODUCTSTRANSPORT EQUIPMENT
-9.9-6.5-4.7-3.6-3.5-2.4-2.2-1.8-1.6-1.5-1.4
-1.10-0.6-0.3-0.20.70.92.1
Percent
-12.0 -10.0 -8.0 -6.0 -4.0 -2.0 0 2.0 4.0
Computed from: Department of Statistics, Malaysia

CHAPTER 7
159
Figure 7.6 shows that labour remuneration as measured by labour cost per employee (LCE) in the manufacturing sector increased by 0.8% in 2011, lower than the previous year, which recorded 2.9% in 2010. This reflected a moderate wage increase within the manufacturing sector. However, refined petroleum products recorded the highest wage increase of 6.9%. This was followed by pharmaceutical products, palm oil and chemicals and chemical products which recorded 3.1%, 2.7% and 2.6% respectively.
However, the wage increase was compensated by relatively higher productivity growth which
reflected positive developments of the respective industries. This was observed in almost all sub-sectors and industries except for transport equipment and paper products industries.
NKEAs Sub-Sector’s Performance Analysis
a) Electrical and Electronics Sub-Sector
Although export for E&E products experienced a declining growth in 2011, the contribution of E&E sub-sector to total output and added value remained high. The total output of this sub-sector
Figure 7.6: Growth in Labour Cost per Employee of the Manufacturing Sub-sectors and Industries, 2011
REFINED PETROLEUM PRODUCTSPHARMACEUTICAL PRODUCTS
PALM OILCHEMICALS AND CHEMICAL PRODUCTS
RUBBER AND PLASTIC PRODUCTSTEXTILES
WEARING APPARELBASIC METALS
WOOD AND PRODUCTS OF WOODELECTRICAL& ELECTRONICS PRODUCTS
BEVERAGESMANUFACTURING
FOOD PRODUCTSFABRICATED METAL PRODUCTS
PRINTING AND REPRODUCTION OF RECORDED MEDIANON-METALLIC MINERAL PRODUCTS
PAPER AND PAPER PRODUCTSTRANSPORT EQUIPMENT
6.93.12.72.61.81.61.51.31.01.00.80.80.70.70.20.1
-0.3-1.4
Percent
-2.0 0 2.0 4.0 6.0 8.0
Computed from: Department of Statistics, Malaysia
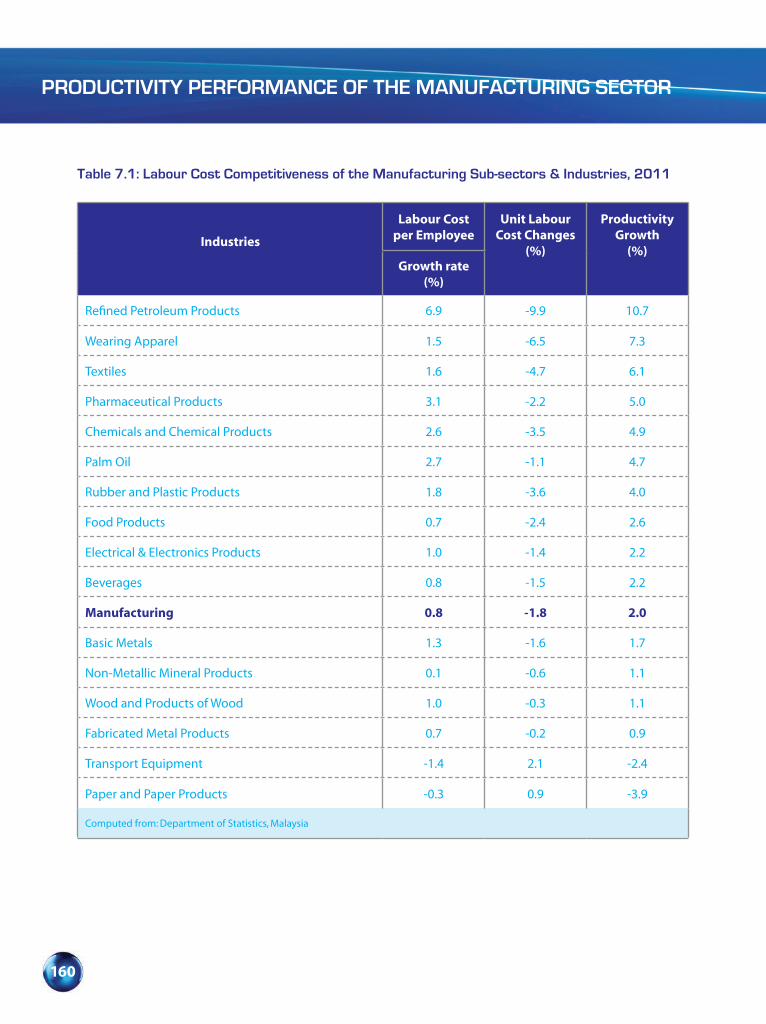
PRODUCTIVITY PERFORMANCE OF THE MANUFACTURING SECTOR
160
Table 7.1: Labour Cost Competitiveness of the Manufacturing Sub-sectors & Industries, 2011
Industries
Labour Cost per Employee
Unit Labour Cost Changes
(%)
Productivity Growth
(%)Growth rate
(%)
Refined Petroleum Products 6.9 -9.9 10.7
Wearing Apparel 1.5 -6.5 7.3
Textiles 1.6 -4.7 6.1
Pharmaceutical Products 3.1 -2.2 5.0
Chemicals and Chemical Products 2.6 -3.5 4.9
Palm Oil 2.7 -1.1 4.7
Rubber and Plastic Products 1.8 -3.6 4.0
Food Products 0.7 -2.4 2.6
Electrical & Electronics Products 1.0 -1.4 2.2
Beverages 0.8 -1.5 2.2
Manufacturing 0.8 -1.8 2.0
Basic Metals 1.3 -1.6 1.7
Non-Metallic Mineral Products 0.1 -0.6 1.1
Wood and Products of Wood 1.0 -0.3 1.1
Fabricated Metal Products 0.7 -0.2 0.9
Transport Equipment -1.4 2.1 -2.4
Paper and Paper Products -0.3 0.9 -3.9
Computed from: Department of Statistics, Malaysia
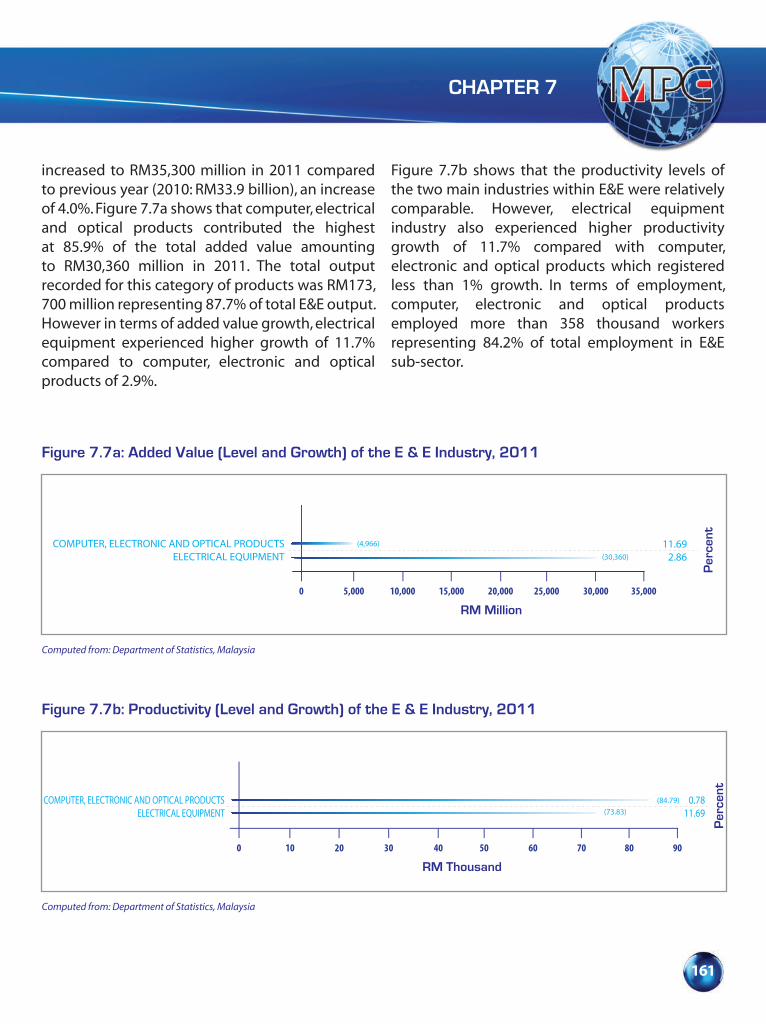
CHAPTER 7
161
increased to RM35,300 million in 2011 compared to previous year (2010: RM33.9 billion), an increase of 4.0%. Figure 7.7a shows that computer, electrical and optical products contributed the highest at 85.9% of the total added value amounting to RM30,360 million in 2011. The total output recorded for this category of products was RM173, 700 million representing 87.7% of total E&E output. However in terms of added value growth, electrical equipment experienced higher growth of 11.7% compared to computer, electronic and optical products of 2.9%.
Figure 7.7b shows that the productivity levels of the two main industries within E&E were relatively comparable. However, electrical equipment industry also experienced higher productivity growth of 11.7% compared with computer, electronic and optical products which registered less than 1% growth. In terms of employment, computer, electronic and optical products employed more than 358 thousand workers representing 84.2% of total employment in E&E sub-sector.
Figure 7.7a: Added Value (Level and Growth) of the E & E Industry, 2011
Computed from: Department of Statistics, Malaysia
RM Million
COMPUTER, ELECTRONIC AND OPTICAL PRODUCTSELECTRICAL EQUIPMENT
0 5,000 10,000 15,000 20,000 25,000 30,000 35,000
11.69 2.86
Per
cent
(30,360)
(4,966)
Figure 7.7b: Productivity (Level and Growth) of the E & E Industry, 2011
Computed from: Department of Statistics, Malaysia
RM Thousand
COMPUTER, ELECTRONIC AND OPTICAL PRODUCTSELECTRICAL EQUIPMENT
0 10 20 30 40 50 60 70 80 90
0.7811.69
Per
cent
(84.79)(73.83)
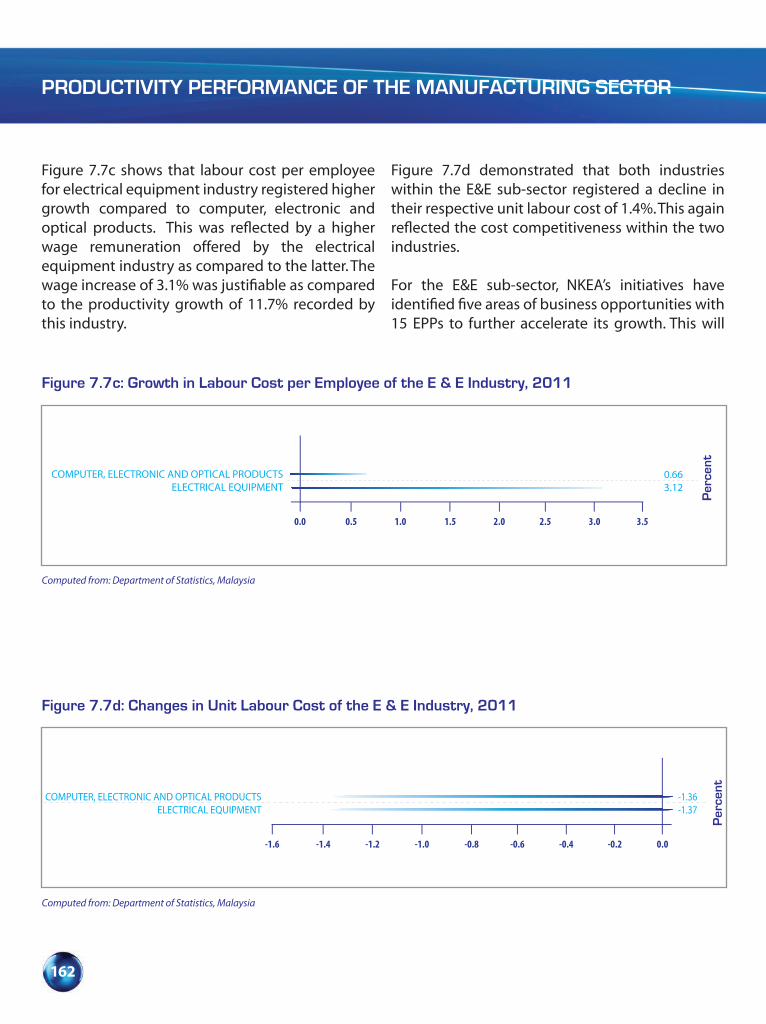
PRODUCTIVITY PERFORMANCE OF THE MANUFACTURING SECTOR
162
Figure 7.7c shows that labour cost per employee for electrical equipment industry registered higher growth compared to computer, electronic and optical products. This was reflected by a higher wage remuneration offered by the electrical equipment industry as compared to the latter. The wage increase of 3.1% was justifiable as compared to the productivity growth of 11.7% recorded by this industry.
Figure 7.7d demonstrated that both industries within the E&E sub-sector registered a decline in their respective unit labour cost of 1.4%. This again reflected the cost competitiveness within the two industries.
For the E&E sub-sector, NKEA’s initiatives have identified five areas of business opportunities with 15 EPPs to further accelerate its growth. This will
Figure 7.7c: Growth in Labour Cost per Employee of the E & E Industry, 2011
Computed from: Department of Statistics, Malaysia
COMPUTER, ELECTRONIC AND OPTICAL PRODUCTSELECTRICAL EQUIPMENT
0.0 0.5 1.0 1.5 2.0 2.5 3.0 3.5
0.663.12
Per
cent
Figure 7.7d: Changes in Unit Labour Cost of the E & E Industry, 2011
Computed from: Department of Statistics, Malaysia
COMPUTER, ELECTRONIC AND OPTICAL PRODUCTSELECTRICAL EQUIPMENT
-1.6 -1.4 -1.2 -1.0 -0.8 -0.6 -0.4 -0.2 0.0
-1.36-1.37
Per
cent

CHAPTER 7
163
enable the sub-sector to face significant challenges as well as greater competition from China, Taiwan, Singapore and other Asian countries.
Although these EPPs were still at their early stage of implementation, several significant achievements had been recorded. For example, anchor companies had been established to provide training in wafer fabrication equipment refurbishment and process, aimed to train a total of 2,500 skilled workers. By end of 2011, 75% of the construction work for the training centre had been completed. In semiconductor assembly and test operation industry, some of the initiatives include producing power semiconductors for energy efficiency application.
For integrated circuit industry (IC), five out of the 10 IC design firms targeted for 2011 had been established. MIDA has been also actively promoting Malaysia to international silicon producers as well as domestic players with the aims to increase the
production from existing 6,000 tonnes to around 170,000 tonnes in 2020.
Under the vendor development programmes, some companies were successful in the production of solar modules. For the solid state lighting (SSL) EPP, three SSL companies have penetrated the global market which surpassed the 2011 KPI target of two firms. EPP’s plan for the transmission industry to set up a high voltage power lab has already been initiated since 2011.
b) Refined Petroleum Sub-Sector
Despite challenging external environment due to weaker global economic performance during 2011, refined petroleum sub-sector continued to expand. Added value for refined petroleum products had increased from RM22,646 million in 2010 to RM24,743 million in 2011 recording a growth of 9.3% (Figure 7.8a). Nonetheless, the growth recorded for 2011 was much lower
Figure 7.8a: Added Value (Level and Growth) of the Refined Petroleum Products, 2010-2011
Computed from: Department of Statistics, Malaysia
RM Million
20112010
0 5,000 10,000 15,000 20,000 25,000 30,000
9.2616.58
Per
cent
(22,646.62)
(24,743.37)
35,000 35,000

PRODUCTIVITY PERFORMANCE OF THE MANUFACTURING SECTOR
164
compared to the previous year (2010: 16.7%). The expansion of petroleum output was supported by strong domestic demand in transportation sector, mainly in the form of gasoline, fuel oil, diesel and gas as well as liquefied petroleum gas.
The global economic slowdown during 2011 has had significant impact on the productivity growth of this sub-sector as reflected in Figure 7.8b. The growth in the productivity of the sub-sector had reduced to only 10.7% in 2011 compared
to previous year which recorded 17.9% (2010). Nonetheless, the productivity level was much higher compared to the previous year (Figure 7.8b). The sub-sector also registered the highest productivity level among the manufacturing sub-sectors and almost five times higher than the manufacturing average (2.0%).
Refined petroleum products involve producing petroleum and petrochemical products at the downstream level. Figure 7.8c shows that labour
Figure 7.8b: Productivity (Level and Growth) of the Refined Petroleum Products, 2010-2011
Computed from: Department of Statistics, Malaysia
RM Thousand
20112010
0 100 200 300 400 500 600
10.6717.93
Per
cent
(635.00)
(702.73)
700 800
Figure 7.8c: Growth in Labour Cost per Employee of the Refined Petroleum Products, 2010-2011
Computed from: Department of Statistics, Malaysia
20112010
0 1.0 2.0 3.0 4.0 5.0 6.0
6.882.94
Per
cent
7.0 8.0

CHAPTER 7
165
cost per employee had significantly increased in 2011 by 6.9% compared with only 2.9% during the previous year (2010). Although this sub-sector experienced an increased in wages, the rate of increase was still relatively lower compared to the industry’s productivity growth which recorded 10.7%.
The substantial increased in the productivity level and growth in refined petroleum sub-sector was mainly due to substantial reduction in the unit labour cost experienced by the sub-sector over the past several years. The sub-sector experienced further decline in its unit labour cost at 9.9% in 2011(Figure 7.8d). Labour efficiency experienced by the sub-sector was due to the nature of the business operations which require highly skilled workers.
Oil and gas industry was selected as one the NKEAs due to its potential growth and significant contribution to the national economy. Under the
NKEA strategies, 12 EPPs have been identified to be developed across four areas such as sustaining oil and gas production; enhancing growth in downstream; making Malaysia the number one Asian hub for oil field services; and building a sustainable energy platform for growth. This is aimed at creating employment opportunities where by 2020, more than 52 thousand jobs will be materialised and 40% of these are highly skilled jobs.
The progress reported for EPP related to enhance oil recovery (EOR) in 2011, include investment to regenerate mature facilities and undertake enhanced oil recovery activities. Efforts will also be made towards the establishment of the largest fabricator in the country covering 488 acres with a production capacity of 69.7 thousand metric tonnes per year.
For energy efficiency EPP, the Ministry of Energy, Green Technology and Water (KeTTHA) has
Figure 7.8d: Changes in Unit Labour Cost of the Refined Petroleum Products, 2010-2011
Computed from: Department of Statistics, Malaysia
20112010
-14.0 -12.0 -10.0 -0.8 -0.6 -0.4 -0.2 0.0
-9.94-10.88
Per
cent
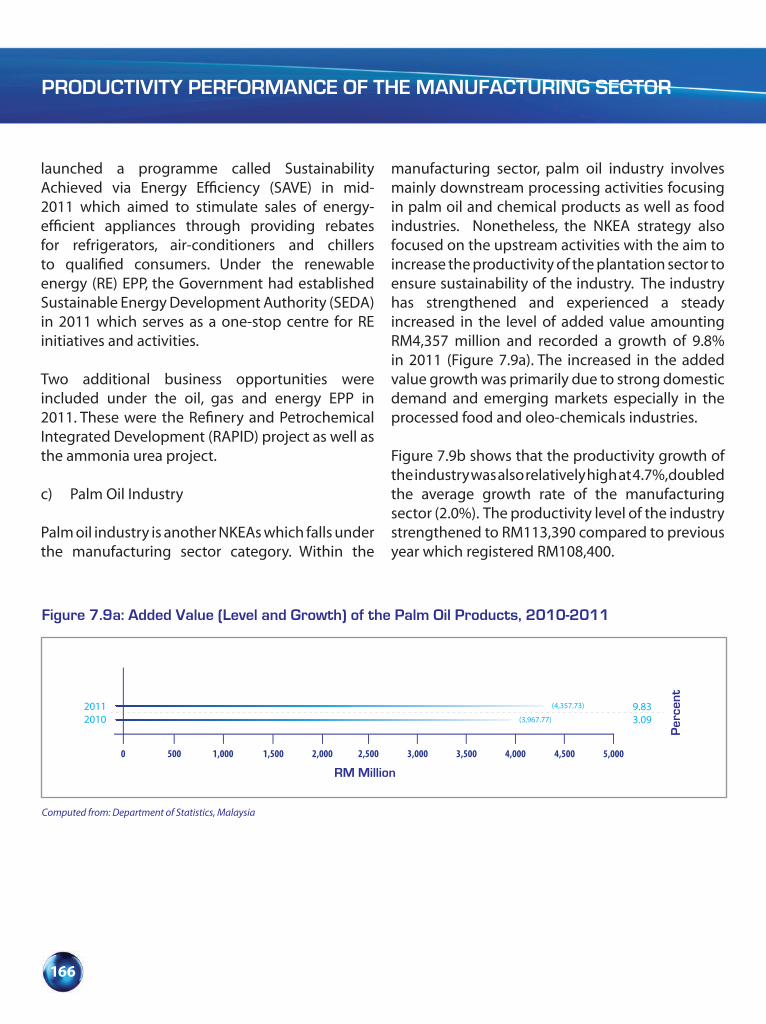
PRODUCTIVITY PERFORMANCE OF THE MANUFACTURING SECTOR
166
launched a programme called Sustainability Achieved via Energy Efficiency (SAVE) in mid-2011 which aimed to stimulate sales of energy-efficient appliances through providing rebates for refrigerators, air-conditioners and chillers to qualified consumers. Under the renewable energy (RE) EPP, the Government had established Sustainable Energy Development Authority (SEDA) in 2011 which serves as a one-stop centre for RE initiatives and activities.
Two additional business opportunities were included under the oil, gas and energy EPP in 2011. These were the Refinery and Petrochemical Integrated Development (RAPID) project as well as the ammonia urea project.
c) Palm Oil Industry
Palm oil industry is another NKEAs which falls under the manufacturing sector category. Within the
manufacturing sector, palm oil industry involves mainly downstream processing activities focusing in palm oil and chemical products as well as food industries. Nonetheless, the NKEA strategy also focused on the upstream activities with the aim to increase the productivity of the plantation sector to ensure sustainability of the industry. The industry has strengthened and experienced a steady increased in the level of added value amounting RM4,357 million and recorded a growth of 9.8% in 2011 (Figure 7.9a). The increased in the added value growth was primarily due to strong domestic demand and emerging markets especially in the processed food and oleo-chemicals industries.
Figure 7.9b shows that the productivity growth of the industry was also relatively high at 4.7%, doubled the average growth rate of the manufacturing sector (2.0%). The productivity level of the industry strengthened to RM113,390 compared to previous year which registered RM108,400.
Figure 7.9a: Added Value (Level and Growth) of the Palm Oil Products, 2010-2011
Computed from: Department of Statistics, Malaysia
RM Million
20112010
0 500 1,000 1,500 2,000 2,500 3,000
9.833.09
Per
cent
(3,967.77)
(4,357.73)
3,500 4,000 4,500 5,000
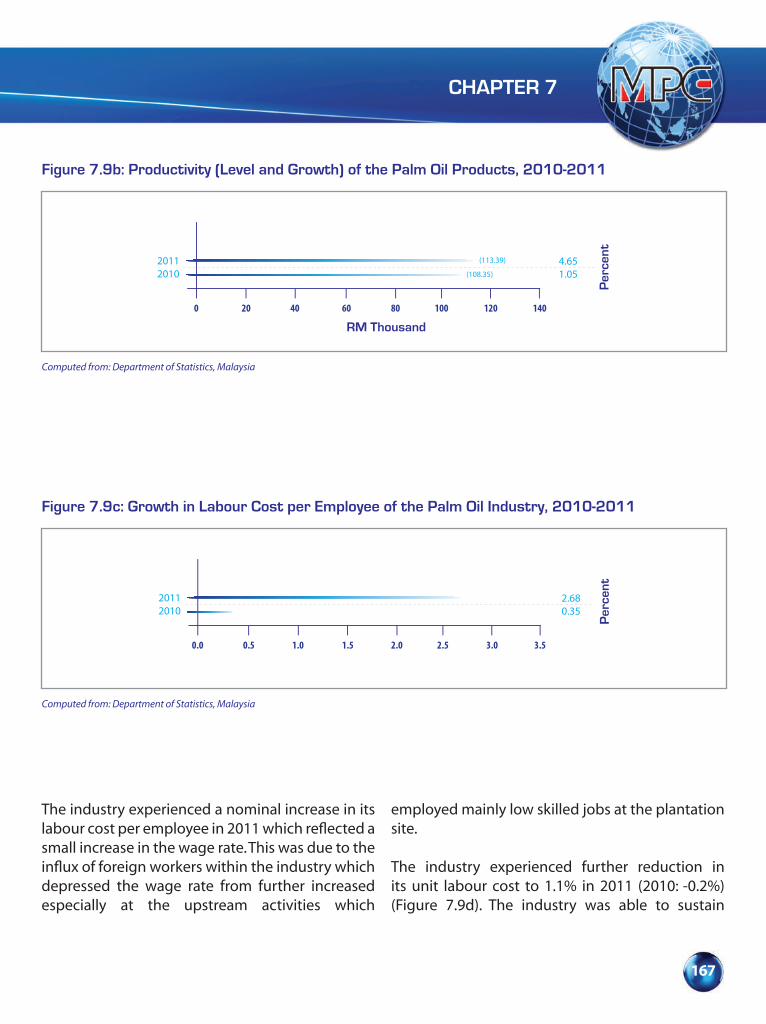
CHAPTER 7
167
The industry experienced a nominal increase in its labour cost per employee in 2011 which reflected a small increase in the wage rate. This was due to the influx of foreign workers within the industry which depressed the wage rate from further increased especially at the upstream activities which
employed mainly low skilled jobs at the plantation site.
The industry experienced further reduction in its unit labour cost to 1.1% in 2011 (2010: -0.2%) (Figure 7.9d). The industry was able to sustain
Figure 7.9b: Productivity (Level and Growth) of the Palm Oil Products, 2010-2011
Computed from: Department of Statistics, Malaysia
RM Thousand
20112010
0 20 40 60 80 100 120
4.651.05
Per
cent
(108.35)
(113.39)
140
Figure 7.9c: Growth in Labour Cost per Employee of the Palm Oil Industry, 2010-2011
Computed from: Department of Statistics, Malaysia
20112010
0.0 0.5 1.0 1.5 2.0 2.5 3.0 3.5
2.680.35
Per
cent
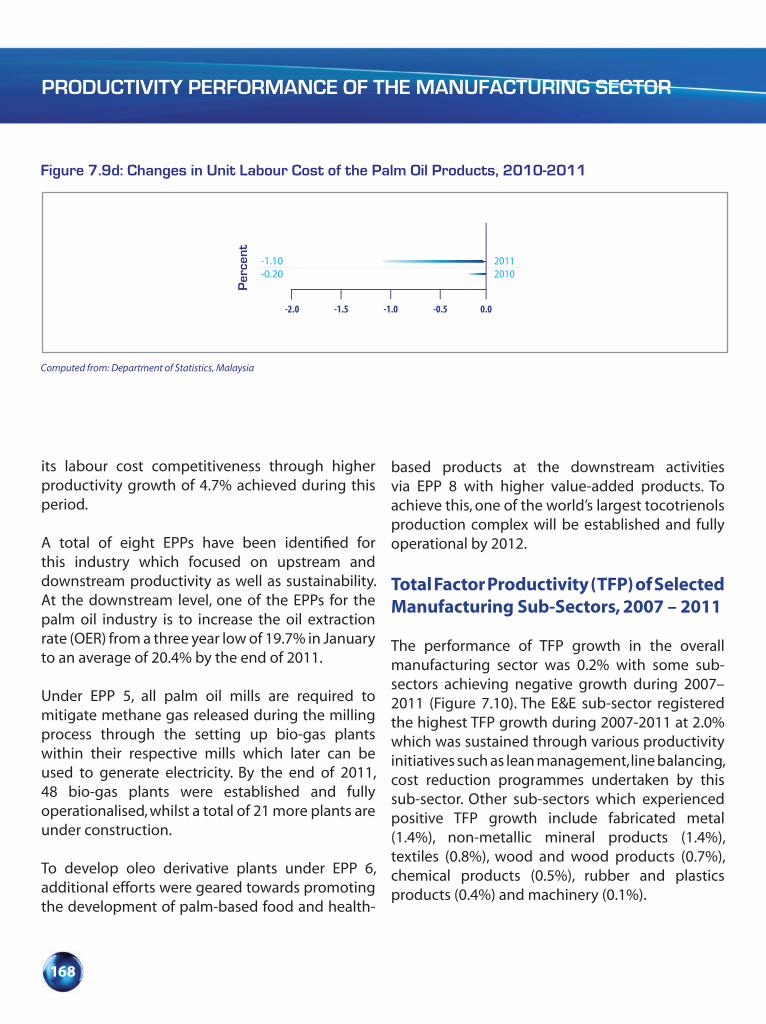
PRODUCTIVITY PERFORMANCE OF THE MANUFACTURING SECTOR
168
its labour cost competitiveness through higher productivity growth of 4.7% achieved during this period.
A total of eight EPPs have been identified for this industry which focused on upstream and downstream productivity as well as sustainability. At the downstream level, one of the EPPs for the palm oil industry is to increase the oil extraction rate (OER) from a three year low of 19.7% in January to an average of 20.4% by the end of 2011.
Under EPP 5, all palm oil mills are required to mitigate methane gas released during the milling process through the setting up bio-gas plants within their respective mills which later can be used to generate electricity. By the end of 2011, 48 bio-gas plants were established and fully operationalised, whilst a total of 21 more plants are under construction.
To develop oleo derivative plants under EPP 6, additional efforts were geared towards promoting the development of palm-based food and health-
based products at the downstream activities via EPP 8 with higher value-added products. To achieve this, one of the world’s largest tocotrienols production complex will be established and fully operational by 2012.
Total Factor Productivity (TFP) of Selected Manufacturing Sub-Sectors, 2007 – 2011
The performance of TFP growth in the overall manufacturing sector was 0.2% with some sub-sectors achieving negative growth during 2007–2011 (Figure 7.10). The E&E sub-sector registered the highest TFP growth during 2007-2011 at 2.0% which was sustained through various productivity initiatives such as lean management, line balancing, cost reduction programmes undertaken by this sub-sector. Other sub-sectors which experienced positive TFP growth include fabricated metal (1.4%), non-metallic mineral products (1.4%), textiles (0.8%), wood and wood products (0.7%), chemical products (0.5%), rubber and plastics products (0.4%) and machinery (0.1%).
Figure 7.9d: Changes in Unit Labour Cost of the Palm Oil Products, 2010-2011
Computed from: Department of Statistics, Malaysia
20112010
-2.0 -1.5 -1.0 -0.5 0.0
-1.10-0.20
Per
cent
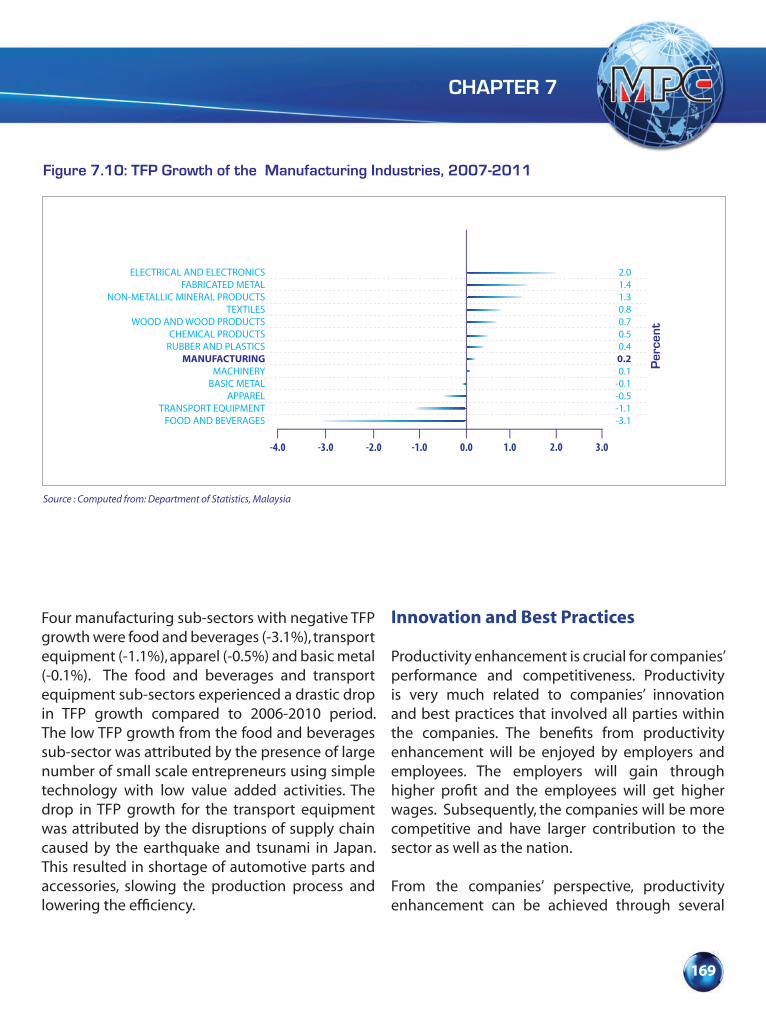
CHAPTER 7
169
Four manufacturing sub-sectors with negative TFP growth were food and beverages (-3.1%), transport equipment (-1.1%), apparel (-0.5%) and basic metal (-0.1%). The food and beverages and transport equipment sub-sectors experienced a drastic drop in TFP growth compared to 2006-2010 period. The low TFP growth from the food and beverages sub-sector was attributed by the presence of large number of small scale entrepreneurs using simple technology with low value added activities. The drop in TFP growth for the transport equipment was attributed by the disruptions of supply chain caused by the earthquake and tsunami in Japan. This resulted in shortage of automotive parts and accessories, slowing the production process and lowering the efficiency.
Innovation and Best Practices
Productivity enhancement is crucial for companies’ performance and competitiveness. Productivity is very much related to companies’ innovation and best practices that involved all parties within the companies. The benefits from productivity enhancement will be enjoyed by employers and employees. The employers will gain through higher profit and the employees will get higher wages. Subsequently, the companies will be more competitive and have larger contribution to the sector as well as the nation.
From the companies’ perspective, productivity enhancement can be achieved through several
-4.0 -3.0 -2.0 -1.0
Source : Computed from: Department of Statistics, Malaysia
2.01.41.30.80.70.50.40.20.1
-0.1-0.5-1.1-3.1
Figure 7.10: TFP Growth of the Manufacturing Industries, 2007-2011
0.0 1.0 2.0 3.0
Per
cent
ELECTRICAL AND ELECTRONICSFABRICATED METAL
NON-METALLIC MINERAL PRODUCTSTEXTILES
WOOD AND WOOD PRODUCTSCHEMICAL PRODUCTS
RUBBER AND PLASTICSMANUFACTURING
MACHINERYBASIC METAL
APPARELTRANSPORT EQUIPMENT
FOOD AND BEVERAGES
PRODUCTIVITY PERFORMANCE OF THE MANUFACTURING SECTOR
170
means such as implementation of total quality management (TQM), Innovative Creative Circle (ICC), green technology, time management practices and kaizen (continuous improvement) .
Some of the best practices observed in E&E sub-sector include using ICC as tool to generate new ideas in producing goods and services, product arrangement as well as design and marketing. Some of the technique includes problem solving to simplify the steps taken to reduce the production processes and the end result is cost saving and increase in production. Innovation involves moving from manual task to automation through technology transfer or R&D. This involves working closely with the various research institutions to develop new processes which require minimum manual labour.
Green technology is the application of the environmental science and conserves the natural resources. This practice is particularly important for natural resource conservation and to avoid environmental pollution.
Total Quality Management (TQM) is an integrative philosophy of management for continuously improving the quality of products and process. It is a tool that strives to generate excellent impact on the quality of products and services to enhance productivity and competitiveness. The main objective of this programme is to sustain customer satisfaction through continuous improvement, which is accomplished by systematic method for problem solving, breakthrough achievement and sustenance of good standardisation. TQM Demonstration Project or the TQM Model Company Project enables enterprises to adopt TQM best practices in the development of a quality system.
Quality management practice is management quality cycle that refers to participation of employees with management as a labour management team in decision pertaining to the operational activities of the organisation. One of the popular quality initiatives is Kaizen. Kaizen involves a continuous improvement of processes in manufacturing, engineering and business management. It refers to activities that continually improve all functions and involve all employees from CEO to assembly line workers. Kaizen aims to eliminate waste and increase efficiency and productivity.
Time management is important to increase efficiency and productivity. It can be done through redesigned, repacked, reallocated equipment and any other kinds of arrangement that can save working time. The utilisation of special tools and automation will definitely save time in the production process.
Strategies and Outlook
Malaysia’s economy is projected to experience a steady pace of growth of more than 4% in 2012, despite facing greater challenges from the external environment. However, the growth will be supported by the acceleration of public investment projects and sustaining strong exports of commodities and resource-based manufactured goods. It will also supported by strong domestic consumer spending as a result of increasing households’ income and employment stability.
The manufacturing sector is expected to grow at 2.3% in 2012 due to lower external demand that affect export-oriented manufacturing sub-sectors,
CHAPTER 7
171
in particular E&E. This sub-sector will be the most affected due to sluggish growth in the advanced economies as it would adversely affect demand for personal computers and semiconductors. This sector also faces competition from the countries in the region like China, Taiwan, Singapore and other Asian countries. Malaysia’s E&E sub-sector remains focused on assembly, which is the lower value added part of the industry while the above-mentioned countries have captured the higher value-added activities in research and development (R&D), design and manufacturing. Nevertheless, the E&E cluster will be supported by new source of growth such as integrated circuits, solar photovoltaic, light emitting diodes and solid state lighting and integrated electronics. Viewing from its diversity, the E&E sub-sector can offer products for unique market characteristics and different global trends. Subsequently, resources can easily be allocated to different products that can capture consumer taste and demand and will sustain a stable growth of this sub-sector.
The oil and gas sub-sector will remain strong in 2012 viewing from its high growth in 2011 and the growth will continuously supported by strong domestic demand. Its strategy to focus on four key thrusts: sustaining oil and gas production, enhancing downstream growth, making Malaysia the number one Asian hub for oil field services and building a sustainable energy platform for growth will help this sector to sustain higher growth. The introduction of incentives to the producers like the approval of the Petroleum Income Tax Act (PITA) Amendment Bill in line with the four strategic thrusts of the NKEA will definitely encourage significant investment in this sector especially by the major industry players.
The palm oil industry will continue to face greater challenges in 2012. This industry must find new upstream activities to be developed as the downstream activities are limited. The primary-related cluster is also projected to grow at the moderate level. However, growth in this industry will be supported by demand by other countries in the region, especially the resource-based products such as chemical products, refined petroleum products, and rubber products. The identification of eight EPPs under this industry, which aims to ensure sustainability, improve productivity and develop the downstream activities, will boost the growth of this industry in the coming years.
The domestic-oriented industries is expected to spur the performance of manufacturing sector in particular the construction related manufacturing sub-sectors which are expected to grow in line with the expansion of the various EPPs. The consumer related cluster is also anticipated to record positive growth due to higher consumer spending.
Despite its slow growth, the manufacturing sector is expected to be driven by higher value-added activities. Product diversification like solar energy and medical devices will help the manufacturing sector to spur and be resilient. The Government efforts to boost SMIs will help this sector to expand and engage in higher value-added activities. Subsequently, the manufacturing sector as a whole will achieve higher growth as SMIs form more than 80% of manufacturing establishments. Apart from this, more EPPs in the pipeline will be implemented and this certainly will boost the growth of the manufacturing sector. The EPPs that had already implemented will yield output and help manufacturing sector to growth in 2012.

172 Productivity Report 2011/2012
Box 7.1: Transforming the Traditional Job into Modern Job
In order to become a high-income nation, The World Bank has highlighted that Malaysia needs to transform her labour force from one that is “traditional” to on one that is “modern”. Malaysia’s source of competitiveness needs to be shifted towards skills and productivity rather than from cost-competitiveness. The industry needs to create more modern jobs which is defined as those that
command higher wages and yield higher productivity.
Malaysia was a low‐income agrarian economy way back before 1957 but now emerged as an upper middle income country. One of the most important contributing factors toward this achievement is closely related to the industrialisation strategies undertaken after Independence. During the earlier period of industrialisation development, the economic growth was driven by an Import Substitution (IS) industrialisation strategy. The important role of manufacturing at that time was to create employment opportunities. As the domestic industry intensified its import dependence, it was forced towards acquiring capital intensive technologies which had adverse consequences on domestic employment. The reflection of this phenomenon was the significantly low elasticity of employment of only 0.35 (Rajah & Zulkifly 1998), which means that output in the manufacturing sector expanded almost three times faster than the growth in employment. As a result, the employment generation capacity of this industrialisation strategy was not encouraging and the unemployment rate could not be reduced.
Subsequently, during the Second Malaysia Plan (1971-1975), Malaysia adopted a labour-intensive export-oriented (EO) industrialisation strategy led by foreign direct investment (FDI). This strategy emphasised labour intensive textiles, apparel and electronics industries. The later activities involved assembly operations which did not require highly skilled labour. This was one of many reasons why more female workers were being employed in the manufacturing sector. Nonetheless, in general, employment generation was successful.
The success of these industries has been contingent on Malaysia’s ability to attract foreign investors seeking to lower production costs (especially labour costs) in order to be more competitive in the international market. But, in early 1980s, the problem of unemployment largely receded and in its place, labour shortages began to make themselves felt. Accordingly, Malaysia’s comparative advantage for the manufacture and export of labour-intensive products had eroded. Other emerging economies, especially China, with ample supply of low-cost labour, have become more competitive and have attracted FDI.
With shortages in low-cost labour, Malaysia started importing unskilled labour from neighbouring countries particularly, from Indonesia, not only for manufacturing but also for other sectors of the economy. In 2010, foreign workers (legal workers) accounted for 15.4% of employment in Malaysia and were mainly engaged in manufacturing (37.0%).

173Productivity Report 2011/2012
Furthermore, it can be observed that the expansion of the manufacturing sector during this period was highly dependent on foreign capital as well as foreign workers due to the level of technology employed though FDI played a dominant role in export oriented industries such as E&E. Thus, if Malaysia fails to undertake major structural changes to reduce labour usage (in particular foreign workers) and capital inputs, the manufacturing sector may likely lose its comparative advantage to other countries. For that reason since 2000, the Government has taken corrective measures by de-emphasising low value-added unskilled labour activities and in contrast, promoting high value-added technology as well as skilled-based manufacturing projects. The new orientation to a high value-added technology has led to the recognition of human resource development as an important policy issue. In fact, recent calls for a national minimum wage in Malaysia have highlighted the Government’s policy towards reducing foreign workers.
Additionally, the Government also offered fiscal incentives for workers’ retraining programmes and enhanced research and development capabilities. Dependence on foreign workers, therefore, would have to continue in the interim, although their composition would progressively incorporate with more skilled categories. Nonetheless, the Government is now putting in place more stringent controls on the recruitment of foreign workers. In fact, during the Ninth Malaysia Plan period (2006-10), the focus of the manufacturing sector was to upscale the sector towards higher value added activities.
Interesting to note, during the course of the structural changes in the economy and the emphasis towards human resource development, the workforce transition in the manufacturing sector has been gaining momentum among others, involving an increasing proportion of high income employment category and more Malaysians are being employed in more highly skilled and higher income occupations. For instance, projects approved by Malaysian Investment Development Authority (MIDA) in 2010 when implemented, are expected to create a total of 97,319 employment opportunities of which 74.2% or 72,221 will be in the high income category. Furthermore, an increasing number of Malaysian managers and engineers are being employed in industries such as solar, advance electronics, medical devices, aerospace as well as oil and gas. Research and development (R&D) and design and development (D&D) activities was also observed within the sector. In line with this new development, the Government had also improved the education system by increasing the scientific, technological and business orientation of the schools’ and universities’ curriculum and at the same time, enhancing intermediate-level technical education.
Contributed by: Associate Professor Dr. Zulkifly Osman School of Economics Faculty of Economics & Management National University of Malaysia (UKM)


CHAPTER 8
PRODUCTIVITY PERFORMANCE OF THE AGRICULTURE SECTOR
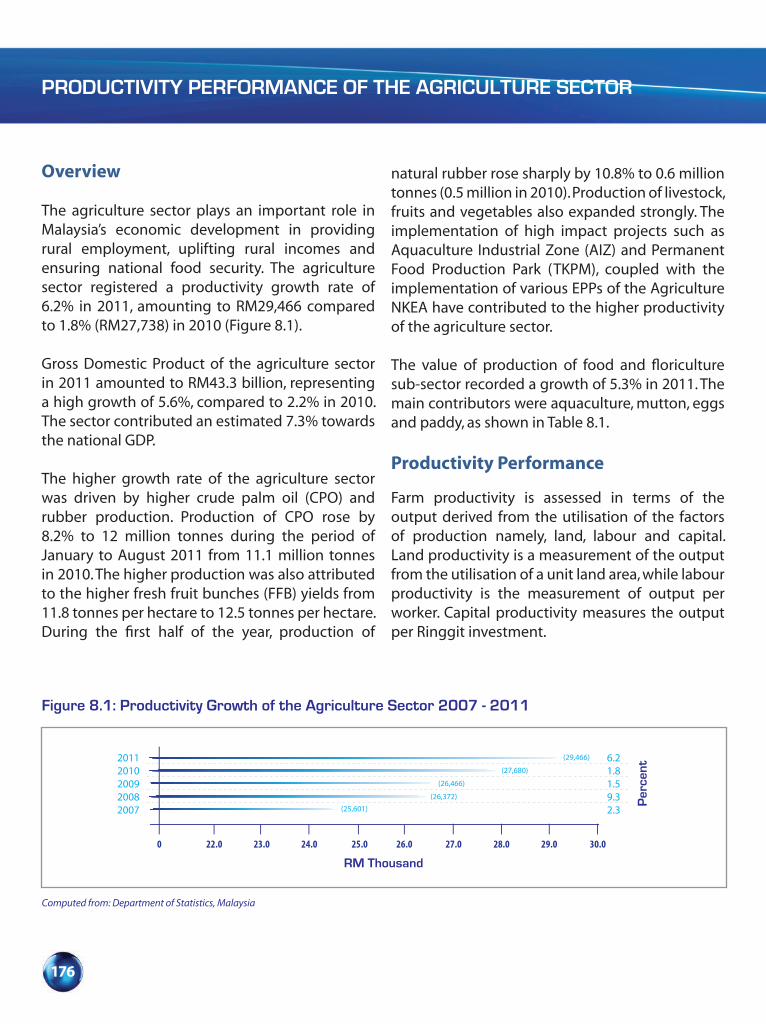
PRODUCTIVITY PERFORMANCE OF THE AGRICULTURE SECTOR
176
Overview
The agriculture sector plays an important role in Malaysia’s economic development in providing rural employment, uplifting rural incomes and ensuring national food security. The agriculture sector registered a productivity growth rate of 6.2% in 2011, amounting to RM29,466 compared to 1.8% (RM27,738) in 2010 (Figure 8.1).
Gross Domestic Product of the agriculture sector in 2011 amounted to RM43.3 billion, representing a high growth of 5.6%, compared to 2.2% in 2010. The sector contributed an estimated 7.3% towards the national GDP.
The higher growth rate of the agriculture sector was driven by higher crude palm oil (CPO) and rubber production. Production of CPO rose by 8.2% to 12 million tonnes during the period of January to August 2011 from 11.1 million tonnes in 2010. The higher production was also attributed to the higher fresh fruit bunches (FFB) yields from 11.8 tonnes per hectare to 12.5 tonnes per hectare. During the first half of the year, production of
Figure 8.1: Productivity Growth of the Agriculture Sector 2007 - 2011
Computed from: Department of Statistics, Malaysia Economic Report, Ministry of Finance, Malaysia
RM Thousand
20112010200920082007
0 22.0 23.0 24.0 25.0 26.0 27.0 28.0 29.0 30.0
6.21.81.59.32.3
Per
cent
(25,601)
(26,372)
(26,466)
(27,680)
(29,466)
natural rubber rose sharply by 10.8% to 0.6 million tonnes (0.5 million in 2010). Production of livestock, fruits and vegetables also expanded strongly. The implementation of high impact projects such as Aquaculture Industrial Zone (AIZ) and Permanent Food Production Park (TKPM), coupled with the implementation of various EPPs of the Agriculture NKEA have contributed to the higher productivity of the agriculture sector.
The value of production of food and floriculture sub-sector recorded a growth of 5.3% in 2011. The main contributors were aquaculture, mutton, eggs and paddy, as shown in Table 8.1.
Productivity Performance
Farm productivity is assessed in terms of the output derived from the utilisation of the factors of production namely, land, labour and capital. Land productivity is a measurement of the output from the utilisation of a unit land area, while labour productivity is the measurement of output per worker. Capital productivity measures the output per Ringgit investment.
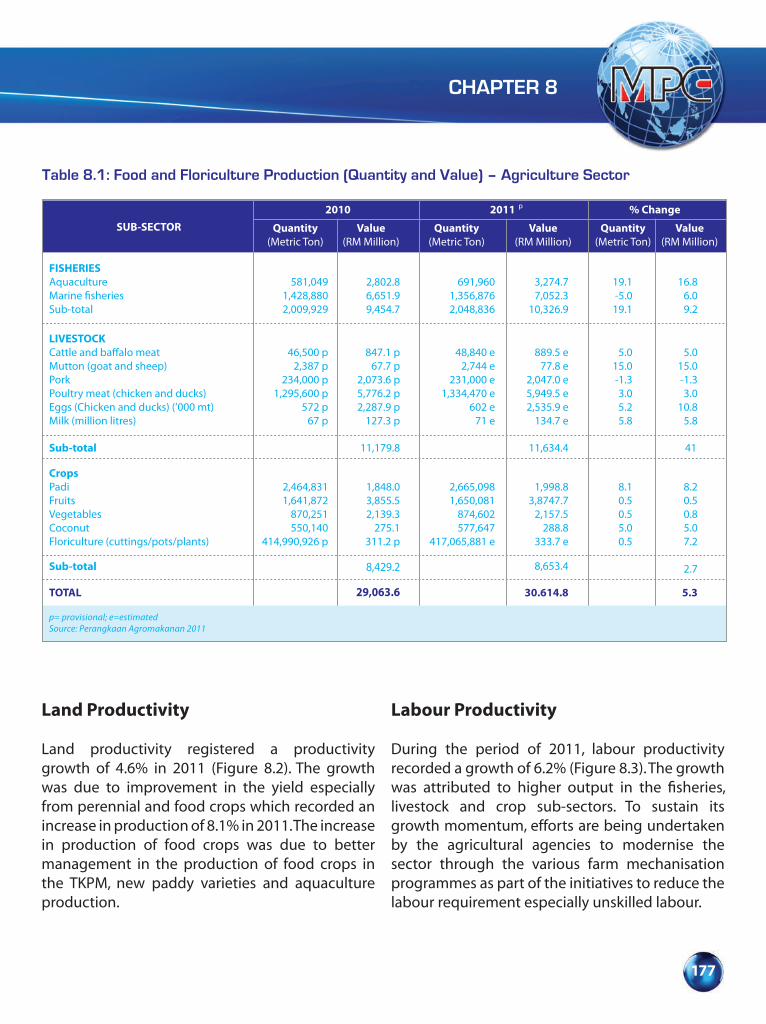
CHAPTER 8
177
Land Productivity
Land productivity registered a productivity growth of 4.6% in 2011 (Figure 8.2). The growth was due to improvement in the yield especially from perennial and food crops which recorded an increase in production of 8.1% in 2011. The increase in production of food crops was due to better management in the production of food crops in the TKPM, new paddy varieties and aquaculture production.
SUB-SECTOR2010 % Change2011 p
FISHERIESAquacultureMarine �sheriesSub-total
Quantity(Metric Ton)
Value(RM Million)
Quantity(Metric Ton)
Value(RM Million)
Value(RM Million)
Quantity(Metric Ton)
2,802.86,651.99,454.7
3,274.77,052.3
10,326.9
691,9601,356,8762,048,836
19.1-5.019.1
16.86.09.2
LIVESTOCKCattle and ba�alo meatMutton (goat and sheep)PorkPoultry meat (chicken and ducks)Eggs (Chicken and ducks) (’000 mt)Milk (million litres)
847.1 p67.7 p
2,073.6 p5,776.2 p2,287.9 p
127.3 p
48,840 e2,744 e
231,000 e1,334,470 e
602 e71 e
889.5 e77.8 e
2,047.0 e5,949.5 e2,535.9 e
134.7 e
5.015.0-1.33.05.25.8
5.015.0-1.33.0
10.85.8
Sub-total 11,179.8 11,634.4 41
CropsPadiFruitsVegetablesCoconutFloriculture (cuttings/pots/plants)
581,0491,428,8802,009,929
46,500 p2,387 p
234,000 p1,295,600 p
572 p67 p
2,464,8311,641,872
870,251550,140
414,990,926 p
1,848.03,855.52,139.3
275.1311.2 p
2,665,0981,650,081
874,602577,647
417,065,881 e
1,998.83,8747.7
2,157.5288.8
333.7 e
8.20.50.85.07.2
8.10.50.55.00.5
TOTAL 29,063.6 30.614.8 5.3
Sub-total 8,429.2 8,653.4 2.7
p= provisional; e=estimatedSource: Perangkaan Agromakanan 2011
Table 8.1: Food and Floriculture Production (Quantity and Value) – Agriculture Sector
Labour Productivity
During the period of 2011, labour productivity recorded a growth of 6.2% (Figure 8.3). The growth was attributed to higher output in the fisheries, livestock and crop sub-sectors. To sustain its growth momentum, efforts are being undertaken by the agricultural agencies to modernise the sector through the various farm mechanisation programmes as part of the initiatives to reduce the labour requirement especially unskilled labour.
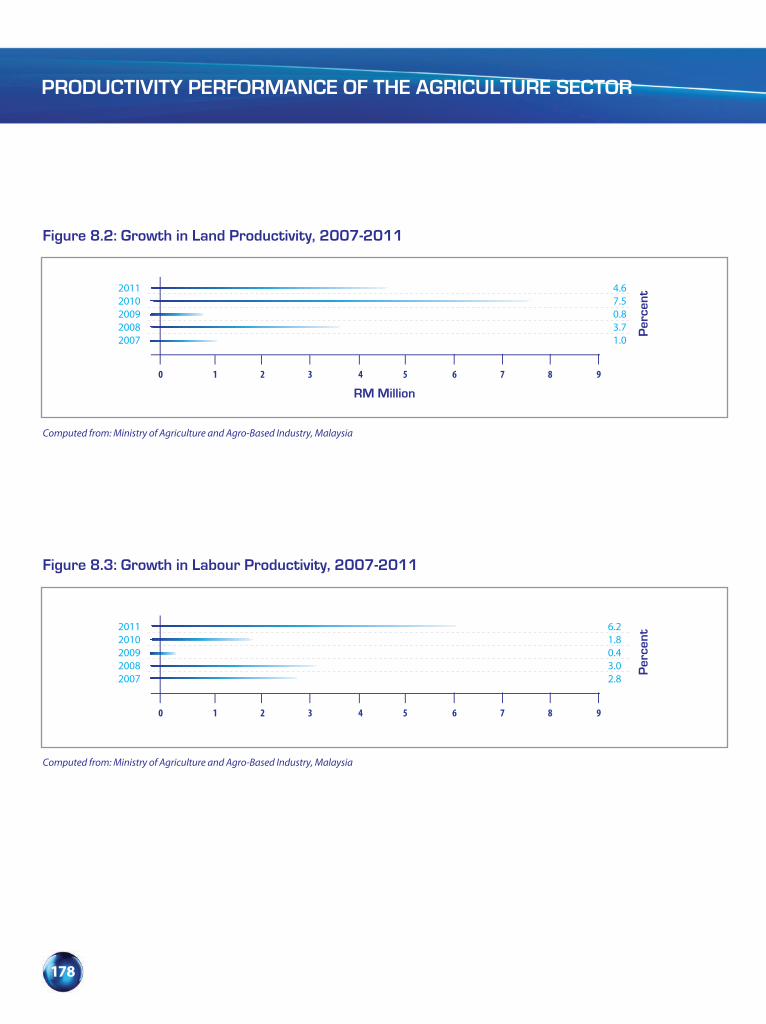
PRODUCTIVITY PERFORMANCE OF THE AGRICULTURE SECTOR
178
Figure 8.3: Growth in Labour Productivity, 2007-2011
Computed from: Ministry of Agriculture and Agro-Based Industry, Malaysia
20112010200920082007
0 1 2 3 4 5 6 7 8 9
6.21.80.43.02.8
Per
cent
Figure 8.2: Growth in Land Productivity, 2007-2011
Computed from: Ministry of Agriculture and Agro-Based Industry, Malaysia
RM Million
20112010200920082007
0 1 2 3 4 5 6 7 8 9
4.67.50.83.71.0
Per
cent

CHAPTER 8
179
Capital Productivity
Capital productivity recorded a growth of 4.0% in 2011 (Figure 8.4). The higher growth was due to the EPPs where the focus is on the production of high value-added products as identified in the agriculture NKEA.
International Agricultural Productivity Comparison
The productivity capacity of Malaysian agricultural workers recorded a growth of 0.5% from
Figure 8.4: Growth in Capital Productivity, 2007-2011
Computed from: Ministry of Agriculture and Agro-Based Industry, Malaysia
20112010200920072006
-4 -3 -2 -1 0 1 2 3 4 5
4.01.5
-2.51.20.3
Per
cent
USD19,360 in 2009 to USD19,448 in 2010. However, they continued to surpass the productivity levels of agricultural workers in ASEAN agriculture-based economies such as Philippines, Indonesia and Thailand (Figure 8.5). In the Asian region, Taiwan, Korea and Japan with their continuous focus in the adoption of modern farming technologies have maintained their lead positions with its agricultural workers’ productivity level at USD23,456, USD23,293 and USD22,318, respectively.
Figure 8.5: International Productivity Comparison for Selected Asian Countries (2010)
Source: World Competitiveness Yearbook, 2011
TAIWANKOREAJAPAN
MALAYSIAPHILIPPINESINDONESIA
INDIATHAILAND
CHINA
23,45623,29322,31819,4484,0573,3763,6353,3343,166
US Dollar
0 5,000 10,000 15,000 20,000 25,000 30,000 35,000 40,000 45,000

PRODUCTIVITY PERFORMANCE OF THE AGRICULTURE SECTOR
180
Human Resource Capacity Development
Human capital is a critical success factor in the transformation of agriculture to agribusiness. Recognising the importance of human resource capacity development, the Ministry of Agriculture and Agro-based Industry (MOA), through the National Agriculture Training College (NATC), conducts various training programmes to develop a pool of agricultural technicians and entrepreneurs to meet the manpower requirements of the sector. Table 8.2 shows the number of trainees who attended the training programmes conducted by NATC from 2007-2011.
847 participants were trained in 2011, with the majority (310 trainees) attaining Level 3 in the Malaysian Skill Certificate (MSC) Programme.
The most popular training module was in crop skills with 83 trainees achieving the MSC and 17 trainees achieving the MSD in 2011, as shown in Table 8.3. This was followed by the veterinary skills training module with 64 trainees at the MSC level and 16 trainees at the MSD level. The food processing module was equally popular; 60 trainees were awarded MSC and 17 trainees the MSD. The aquaculture module was also popular with 43 and 12 trainees at the MSC and MSD levels respectively.
Besides the training programmes conducted by the NATC, the agriculture agencies and departments also conducted various technical and entrepreneurship programmes to prepare youths and entrepreneurs to meet the skills requirements for the development of the agriculture sector.
Table 8.2: Number of Trainees, 2007-2011
ENROLMENTYEAR
MALAYSIAN SKILLCERTIFICATE (MSC)
2007 2008 2009 2010 2011
MALAYSIAN SKILLDIPLOMA (MSD)
MALAYSIAN SKILLADVANCED DIPLOMA (MSAD)
225184103
436272133
200256310
TOTAL 985 972 587 919 847
75 73 81
Level 1Level 2Level 3
Level 5
Level 4
402338244
-
1 - 5 -
44534
129
64
-
*MSC – Malaysia Skill Certificate**MSD – Malaysia Skill Diploma***MSAD – Malaysia Skill Advanced Diploma

CHAPTER 8
181
Innovation and Best Practices
Agriculture has been identified as one of the 12 NKEAs that would significantly contribute to the growth of the economy particularly the Gross National Income (GNI). A total of 16 EPPs have been identified to transform agriculture through integrated, clustered and large scale agribusinesses with well-managed value chains. Agriculture production will be both market and demand-driven, focusing on considerations of food safety, convenience, nutritional content, and sustainability. In this transformation process, the
private sector will be the key driver and the MOA is responsible for supporting and facilitating the implementation of the 16 EPPs by ensuring that the five key enablers are in place:
• Providing Incentives for Anchor Companies
Anchor companies will play a key role in transforming agriculture to agribusiness. The Agriculture NKEA has formalised the use of this approach in the implementation of the EPPs. Prospective anchor companies, besides having a minimum paid up capital depending on the sub-
Table 8.3: Number of Trainees Who Completed Various Fields of Training
FIELD OF TRAINING2009
Aquaculture
Fruits
Marketing
Food Processing
Food Distribution
Poultry
Vegetables
Crops
Captured Fisheries Technology
Veterinary
TOTAL
MSD
10
-
15
-
-
-
-
22
-
8
55
MSC
39
-
22
52
4
-
-
32
31
79
259
MSD
16
-
14
14
-
1
-
21
-
19
85
MSAD
-
-
1
1
-
-
-
2
-
1
5
MSC
43
-
26
60
-
-
-
83
10
64
286
MSD
12
-
-
17
-
-
-
17
-
16
62
170
0
198
236
4
1
0
335
69
311
1324
Source: Ministry of Agriculture and Agro-based Industry, Malaysia*MSC - Malaysian Skill Certi�cate** MSD - Malaysian Skill Diploma***MSAD - Malaysian Skill Advanced Diploma
2010 2011TOTAL
MSC
15
-
41
54
-
-
-
77
9
45
241
PRODUCTIVITY PERFORMANCE OF THE AGRICULTURE SECTOR
182
sector, must demonstrate the ability to organise small farmers as contract suppliers based on principles of fair trade as well as to provide extension services and ensuring Good Agricultural Practices (GAP) compliance. Anchor companies are also required to work on an integrated supply chain that includes post-harvest management, logistics, marketing and branding. Incentives include reimbursable expenses, mainly in the horticulture and aquaculture sub-sectors.
• Strengthening Logistics Infrastructure
The increased production of fresh produce for example, premium shrimp, fresh fruits and vegetables and cut flowers, would require expanded cold and cool chain facilities at ports and airports to meet the requirements for export markets. These centres will also be equipped with Sanitary and Phytosanitary facilities for vapour heat treatment, fumigation, hot water treatment and irradiation.
• Strengthening the Adoption of Good Agricultural Practices (GAP) and Good Manufacturing Practices (GMP)
Compliance with international standards for fresh agriculture produce and processed foods will ensure food safety and enhance market access for Malaysian exports. Malaysia has developed a number of voluntary farm certification schemes for quality assurance. These include: Skim Amalan Ladang Baik Malaysia (SALM) for fresh fruit and vegetables, Skim Amalan Ladang Ternakan (SALT) for livestock, Skim Pensijilan Ladang Akuakultur Malaysia (SPLAM) for fisheries and aquaculture and Skim Organik Malaysia (SOM) for organic farming. SALM-certified farms qualify as preferred suppliers
and are eligible to use the Malaysia is Best branding logo of the Federal Agricultural Marketing Authority (FAMA). On the export front, through a bilateral agreement with Singapore, SALM-certified farm consignments receive preferential treatment. In 2011 there were 356 SALM-certified farms and 75 SOM-certified organic farms.
GMP certification will ensure that processed food is manufactured in accordance with best practices in manufacturing, and is a prerequisite to Hazard Analysis and Critical Control Point (HACCP) certification.
• Ensuring Sufficient Supply of Human Capital
A four-pronged strategy will be adopted to address the current shortage of human capital. Firstly, farming will be promoted as a high-income occupation with the objective of attracting a new generation of Malaysians to this industry. Existing course syllabi at local universities will be reviewed to emphasise core subjects such as agronomy, animal breeding and husbandry, and agriculture ICT. Local universities will ensure sufficient student enrolment in newer fields such as aquaculture and aquaculture systems engineering. Lastly, internship programmes will be established to provide graduates with field experience. Aside from students, human capital can also be tapped from both the public and private sector retirees and retraining them as agropreneurs.
• Changing Regulations and Policies
MOA will review the relevant acts and regulations pertaining to the fresh and processed food industry which also include the livestock and fisheries sub-sectors. Additionally, the MOA is also looking to
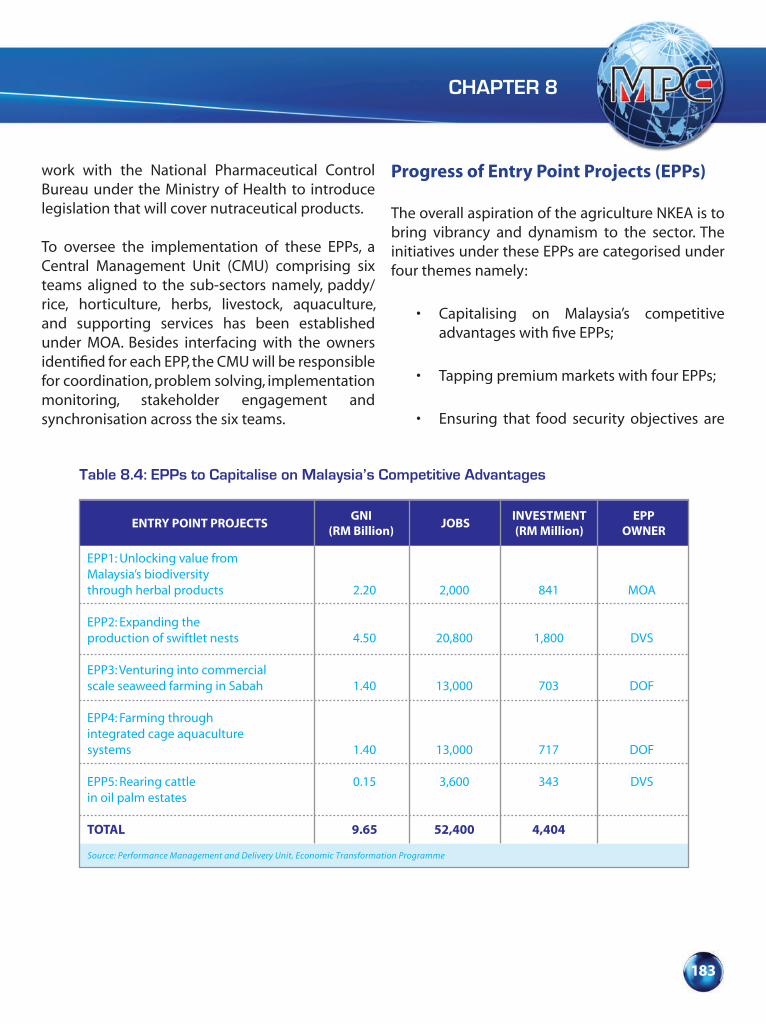
CHAPTER 8
183
work with the National Pharmaceutical Control Bureau under the Ministry of Health to introduce legislation that will cover nutraceutical products.
To oversee the implementation of these EPPs, a Central Management Unit (CMU) comprising six teams aligned to the sub-sectors namely, paddy/rice, horticulture, herbs, livestock, aquaculture, and supporting services has been established under MOA. Besides interfacing with the owners identified for each EPP, the CMU will be responsible for coordination, problem solving, implementation monitoring, stakeholder engagement and synchronisation across the six teams.
Progress of Entry Point Projects (EPPs)
The overall aspiration of the agriculture NKEA is to bring vibrancy and dynamism to the sector. The initiatives under these EPPs are categorised under four themes namely:
• Capitalising on Malaysia’s competitive advantages with five EPPs;
• Tapping premium markets with four EPPs;
• Ensuring that food security objectives are
Table 8.4: EPPs to Capitalise on Malaysia’s Competitive Advantages
ENTRY POINT PROJECTS GNI(RM Billion) JOBS INVESTMENT
(RM Million)EPP
OWNER
EPP1: Unlocking value fromMalaysia’s biodiversitythrough herbal products
EPP2: Expanding theproduction of swiftlet nests
EPP3: Venturing into commercialscale seaweed farming in Sabah
EPP4: Farming throughintegrated cage aquaculturesystems
EPP5: Rearing cattlein oil palm estates
TOTAL
2.20
4.50
1.40
1.40
0.15
9.65
2,000
20,800
13,000
13,000
3,600
52,400
841
1,800
703
717
343
4,404
MOA
DVS
DOF
DOF
DVS
Source: Performance Management and Delivery Unit, Economic Transformation Programme
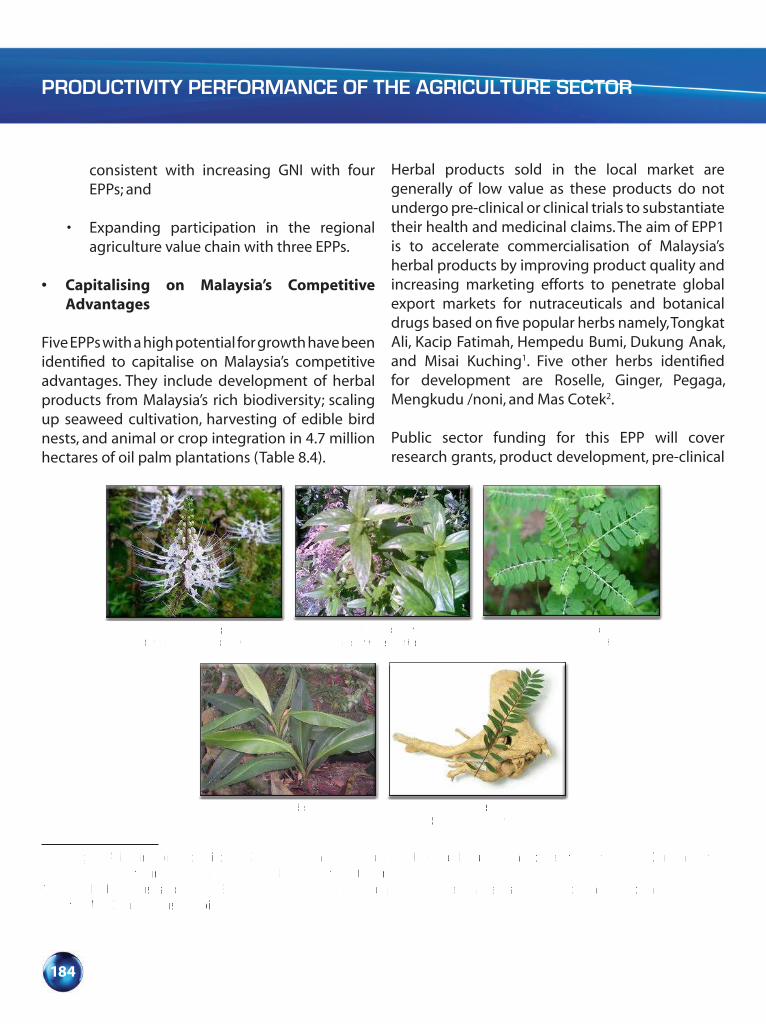
PRODUCTIVITY PERFORMANCE OF THE AGRICULTURE SECTOR
184
consistent with increasing GNI with four EPPs; and
• Expanding participation in the regional agriculture value chain with three EPPs.
• Capitalising on Malaysia’s Competitive Advantages
Five EPPs with a high potential for growth have been identified to capitalise on Malaysia’s competitive advantages. They include development of herbal products from Malaysia’s rich biodiversity; scaling up seaweed cultivation, harvesting of edible bird nests, and animal or crop integration in 4.7 million hectares of oil palm plantations (Table 8.4).
Herbal products sold in the local market are generally of low value as these products do not undergo pre-clinical or clinical trials to substantiate their health and medicinal claims. The aim of EPP1 is to accelerate commercialisation of Malaysia’s herbal products by improving product quality and increasing marketing efforts to penetrate global export markets for nutraceuticals and botanical drugs based on five popular herbs namely, Tongkat Ali, Kacip Fatimah, Hempedu Bumi, Dukung Anak, and Misai Kuching1. Five other herbs identified for development are Roselle, Ginger, Pegaga, Mengkudu /noni, and Mas Cotek2.
Public sector funding for this EPP will cover research grants, product development, pre-clinical
Misai kucing (Orthosiphon stamineus)
Hempedu bumi (Andrographis paniculata)
Dukung anak(Phyllanthus niruri)
Kacip Fatimah(Labisa pumila)
Tongkat Ali(Eurycoma longifolia)
1 Tongkat Ali (Eurycoma longifolia), Kacip Fatimah (Labisa pumila), Hempedu Bumi (Andrographis paniculata), Dukung Anak (Phyllanthus niruri), and Misai Kuching (Orthosiphon stamineus).
2 Roselle (Hibiscus sabdariffa), Ginger (Zingiber officinale),Pegaga (Centilla aesthetica),Mengkudu /noni (Morinda citriflolia), and Mas Cotek (Ficus deltoidea).

CHAPTER 8
185
and clinical studies and development of the herbal park. The private sector will invest in the herbal park and extraction facilities. In terms of policy, the newly formed Herbal Development Council will set the strategic directions to drive the growth of the industry.
Three anchor companies have embarked on five pre-clinical trials using contract research organisations (CRO). The requirement for these anchor companies to source at least 30% of the raw materials locally and the rest from farmers linked to these anchor companies, will result in higher incomes for farmers involved in the cultivation of these herbs. Anchor companies in this EPP will be reimbursed 100% for pre-clinical and clinical trials as there are no Good Laboratory Practices (GLP) accredited laboratories in Malaysia for animal testing.
Four Herbal Centres of Excellence will be responsible for coordinating research among research institutions, establishing strategic research collaboration with local and international institutions, producing quality research outputs, and obtaining intellectual property rights on research findings. Each Centre of Excellence will have the following R&D clusters: Discovery (UPM and FRIM); Agronomy (MARDI); Standardisation and Product Development (USM); Pre-clinical and Clinical Trials (IMR); and Processing Technology (IBD at UTM).
Four herbal cultivation parks will be established in the East Coast Economic Region (ECER) in Terengganu, Pahang, and Kelantan. In these parks, 40% of the land in each herbal park will be allocated to outgrowers, who will benefit in terms of technical skills development, product quality
assurance, and marketing by the anchor company. Design work has been completed for two of the herbal cultivation parks totalling 567 hectares in 2011.
Malaysia is currently the world’s second largest producer of swiftlet nests or edible bird nests (EBN), and its strength lies in the consistent quality of its output which fetches a premium of 20% in the global market. The aim of this EPP is to capture 40% of the global market share by 2020 with increased production to 870 tonnes for processing through a number of means, including an additional 8,500 EBN premises in East Malaysia and 4,500 premises in Peninsular Malaysia, and the development of downstream products.
The launching of the 1GP (Good Animal Husbandry Practices for Edible Nest Swiftlet Aerodermus Species Ranching and its Premises) by Department of Veterinary Services (DVS) in 2011 is a first step towards the regulation of the swiftlet ranching industry. These comprehensive guidelines would ensure sustainability of harvesting, animal welfare, consumer health and safety for the regulated premises. A total of 3,379 EBN premises were registered by DVS under 1GP in 2011. Of these, 807 premises have received SALT certification.
With the implementation of Radio Frequency Identification Technology (RFID), Malaysia is the first country in the world to have an online traceability system to track and trace the export of EBN to China. Each registered premise is given a RFID wall plug and security tag which identifies its location. During harvest, RFID-tagged containers are used to store the harvested EBN in order to track the consignment to the next destination.
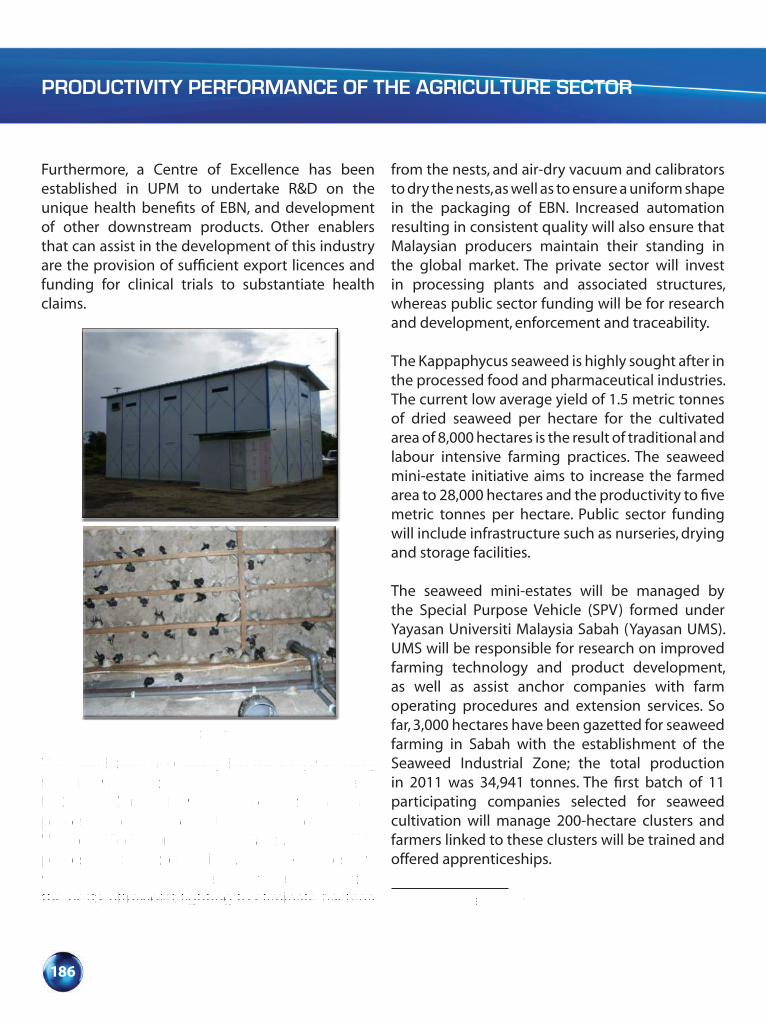
PRODUCTIVITY PERFORMANCE OF THE AGRICULTURE SECTOR
186
Furthermore, a Centre of Excellence has been established in UPM to undertake R&D on the unique health benefits of EBN, and development of other downstream products. Other enablers that can assist in the development of this industry are the provision of sufficient export licences and funding for clinical trials to substantiate health claims.
from the nests, and air-dry vacuum and calibrators to dry the nests, as well as to ensure a uniform shape in the packaging of EBN. Increased automation resulting in consistent quality will also ensure that Malaysian producers maintain their standing in the global market. The private sector will invest in processing plants and associated structures, whereas public sector funding will be for research and development, enforcement and traceability.
The Kappaphycus seaweed is highly sought after in the processed food and pharmaceutical industries. The current low average yield of 1.5 metric tonnes of dried seaweed per hectare for the cultivated area of 8,000 hectares is the result of traditional and labour intensive farming practices. The seaweed mini-estate initiative aims to increase the farmed area to 28,000 hectares and the productivity to five metric tonnes per hectare. Public sector funding will include infrastructure such as nurseries, drying and storage facilities.
The seaweed mini-estates will be managed by the Special Purpose Vehicle (SPV) formed under Yayasan Universiti Malaysia Sabah (Yayasan UMS). UMS will be responsible for research on improved farming technology and product development, as well as assist anchor companies with farm operating procedures and extension services. So far, 3,000 hectares have been gazetted for seaweed farming in Sabah with the establishment of the Seaweed Industrial Zone; the total production in 2011 was 34,941 tonnes. The first batch of 11 participating companies selected for seaweed cultivation will manage 200-hectare clusters and farmers linked to these clusters will be trained and offered apprenticeships.
Swiflet Premises
The establishment of Malaysian-owned processing facilities will enable EBN to be processed locally. In 2011, 10 new EBN collection and raw-clean processing centres were built, along with seven VHM-certified3 processing plants. New EBN processing technologies include auto-air pressure vacuum machines for the separation of fur from the nests, ultraviolet lighting to eliminate bacteria 3 Veterinary Health Mark

CHAPTER 8
187
Aquaculture production will be promoted on a large-scale by anchor companies using cage farming systems focusing on three species of high export value, namely; tilapia, grouper and sea bass. Potential areas for establishment of cage aquaculture systems have been identified in 11 locations in Kedah, Perak, Terengganu, Johor and Sarawak. A total of 20 participants were selected to undertake synergy farming of tilapia in 2011, each operating two cages with a capacity of 100 metric tonnes per production cycle. The total number of cages is 40 units or two modules4.
Tapping Premium Markets
Increasing affluence is driving consumer awareness on health and food safety, variety and convenience in food consumption, and on environmental sustainability. Accordingly, agricultural products
which meet these concerns capture a premium. Four EPPs from the horticultural and aquaculture subsectors are well primed to capitalise on this trend. (Table 8.5)
The Integrated Zones for Aquaculture (i-ZAQs) will replicate success models for large scale aquaculture farming to produce high quality certified shrimp for the premium export market. Each i-ZAQ will have integrated infrastructure consisting of hatcheries, grow-out areas, a processing plant, and feed-mills on a 1,000 hectare site. Up to 10 i-ZAQ projects will be established in the states of Kedah, Pahang, Sabah, Sarawak and Terengganu.
Each i-ZAQ project will be led by an anchor company and best practices will be adopted to ensure compliance with certification requirements.
4 A module is a grouping of 20 cages of 20-metre diameter connected to an anchoring system.
Table 8.5: EPPs to Tap into Premium Markets
ENTRY POINT PROJECTS GNI( RM Billion) JOBS INVESTMENT
(RM Million)EPP
OWNER
EPP6: Replication of IntegratedZone for Aquaculture (i-ZAQ)
EPP7: Premium markets forfresh fruits and vegetables
EPP8: Strengthening exportcapability of processed food industry
EPP9: Fragrant rice varietyfor non-irrigated areas
TOTAL
1.27
1.60
0.883
0.133
3.89
12,000
9,100
5,000
4,998
31,098
3,150
1,400
574
19.2
5,143.2
DOF
DOA
MOA
MARDI
Source: Performance Management and Delivery Unit, Economic Transformation Programme

PRODUCTIVITY PERFORMANCE OF THE AGRICULTURE SECTOR
188
The skills-training centre in each i-ZAQ project will be linked to public universities which will assist in certification and training. Five anchor companies were selected in 2011 from Perak, Terengganu, Pahang, Johor and Sabah respectively.
While private sector investors will develop and operate the i-ZAQ projects, public sector funding will cover development of basic infrastructure such as access roads, electricity and clean water supplies for each of the sites. The respective State Government will provide access to land. A total of 4,107 hectares were earmarked for i-ZAQs in 2011.
Malaysia has the potential to tap into the world market for premium fresh tropical fruits and vegetables if compliance to global food safety standards is addressed. Premium tropical fruits such as the eksotika papaya, MD2 pineapple, KR1 Rockmelon, B10 starfruit, J32 jackfuit, Cavendish banana and three highland vegetables namely, tomato, capsicum and lettuce fall within this category.
Anchor companies selected to lead in the implementation of this EPP will use the extended supply chain model in managing contract farmers and coordinate production, processing, and distribution activities, including post-harvest management facilities (for example, transportation) in compliance with international standards such as GAP, GMP and HACCP.
Thus far, four anchor companies have been identified. Investment by these anchor companies includes modern one-stop processing and packaging centres for fruits and vegetables, as well as opening new farms and engaging local farmers. Several TKPM have also been identified to
Malaysian Premium Tropical Fruits
be linked to anchor companies; infrastructure will be upgraded and crop processing and packaging centres (CPPCs) will be built in these TKPMs. The export volume of premium fruits and vegetables increased to 21,628 metric tonnes in 2011.
The increasing demand for processed food posts potential opportunities for SMEs. The target is to strengthen the export capability of the processed food industry by reorganising and scaling up the industry through domestic anchor companies, which will be responsible for product certification, packaging, branding and managing suppliers. A total of four integrated food parks will be developed
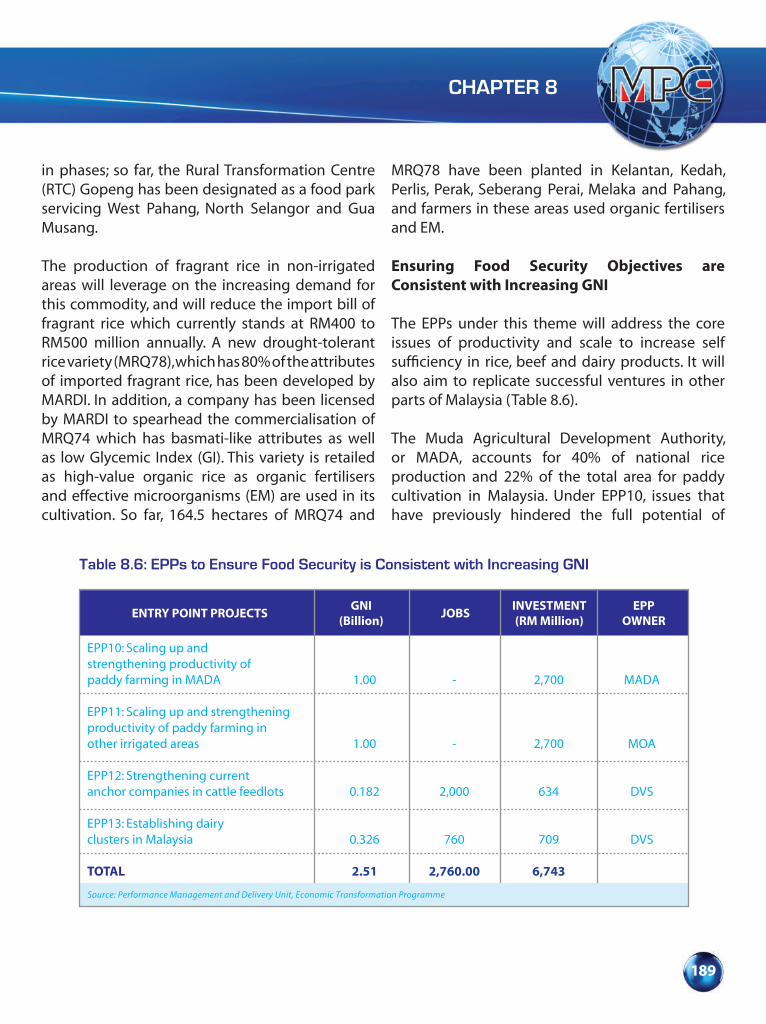
CHAPTER 8
189
in phases; so far, the Rural Transformation Centre (RTC) Gopeng has been designated as a food park servicing West Pahang, North Selangor and Gua Musang.
The production of fragrant rice in non-irrigated areas will leverage on the increasing demand for this commodity, and will reduce the import bill of fragrant rice which currently stands at RM400 to RM500 million annually. A new drought-tolerant rice variety (MRQ78), which has 80% of the attributes of imported fragrant rice, has been developed by MARDI. In addition, a company has been licensed by MARDI to spearhead the commercialisation of MRQ74 which has basmati-like attributes as well as low Glycemic Index (GI). This variety is retailed as high-value organic rice as organic fertilisers and effective microorganisms (EM) are used in its cultivation. So far, 164.5 hectares of MRQ74 and
MRQ78 have been planted in Kelantan, Kedah, Perlis, Perak, Seberang Perai, Melaka and Pahang, and farmers in these areas used organic fertilisers and EM.
Ensuring Food Security Objectives are Consistent with Increasing GNI
The EPPs under this theme will address the core issues of productivity and scale to increase self sufficiency in rice, beef and dairy products. It will also aim to replicate successful ventures in other parts of Malaysia (Table 8.6).
The Muda Agricultural Development Authority, or MADA, accounts for 40% of national rice production and 22% of the total area for paddy cultivation in Malaysia. Under EPP10, issues that have previously hindered the full potential of
Table 8.6: EPPs to Ensure Food Security is Consistent with Increasing GNI
ENTRY POINT PROJECTS GNI(Billion) JOBS INVESTMENT
(RM Million)EPP
OWNER
EPP10: Scaling up andstrengthening productivity ofpaddy farming in MADA
EPP11: Scaling up and strengtheningproductivity of paddy farming inother irrigated areas
EPP12: Strengthening currentanchor companies in cattle feedlots
EPP13: Establishing dairyclusters in Malaysia
TOTAL
1.00
1.00
0.182
0.326
2.51
-
-
2,000
760
2,760.00
2,700
2,700
634
709
6,743
MADA
MOA
DVS
DVS
Source: Performance Management and Delivery Unit, Economic Transformation Programme
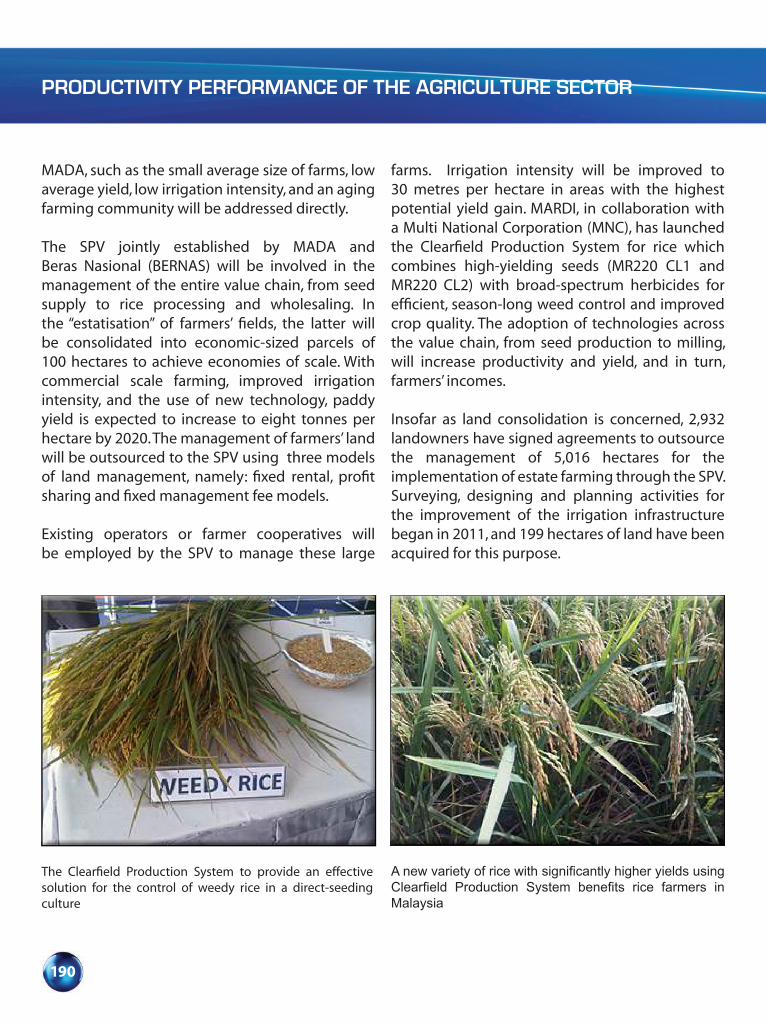
PRODUCTIVITY PERFORMANCE OF THE AGRICULTURE SECTOR
190
MADA, such as the small average size of farms, low average yield, low irrigation intensity, and an aging farming community will be addressed directly.
The SPV jointly established by MADA and Beras Nasional (BERNAS) will be involved in the management of the entire value chain, from seed supply to rice processing and wholesaling. In the “estatisation” of farmers’ fields, the latter will be consolidated into economic-sized parcels of 100 hectares to achieve economies of scale. With commercial scale farming, improved irrigation intensity, and the use of new technology, paddy yield is expected to increase to eight tonnes per hectare by 2020. The management of farmers’ land will be outsourced to the SPV using three models of land management, namely: fixed rental, profit sharing and fixed management fee models.
Existing operators or farmer cooperatives will be employed by the SPV to manage these large
farms. Irrigation intensity will be improved to 30 metres per hectare in areas with the highest potential yield gain. MARDI, in collaboration with a Multi National Corporation (MNC), has launched the Clearfield Production System for rice which combines high-yielding seeds (MR220 CL1 and MR220 CL2) with broad-spectrum herbicides for efficient, season-long weed control and improved crop quality. The adoption of technologies across the value chain, from seed production to milling, will increase productivity and yield, and in turn, farmers’ incomes.
Insofar as land consolidation is concerned, 2,932 landowners have signed agreements to outsource the management of 5,016 hectares for the implementation of estate farming through the SPV. Surveying, designing and planning activities for the improvement of the irrigation infrastructure began in 2011, and 199 hectares of land have been acquired for this purpose.
The Clearfield Production System to provide an effective solution for the control of weedy rice in a direct-seeding culture
A new variety of rice with significantly higher yields using Clearfield Production System benefits rice farmers in Malaysia
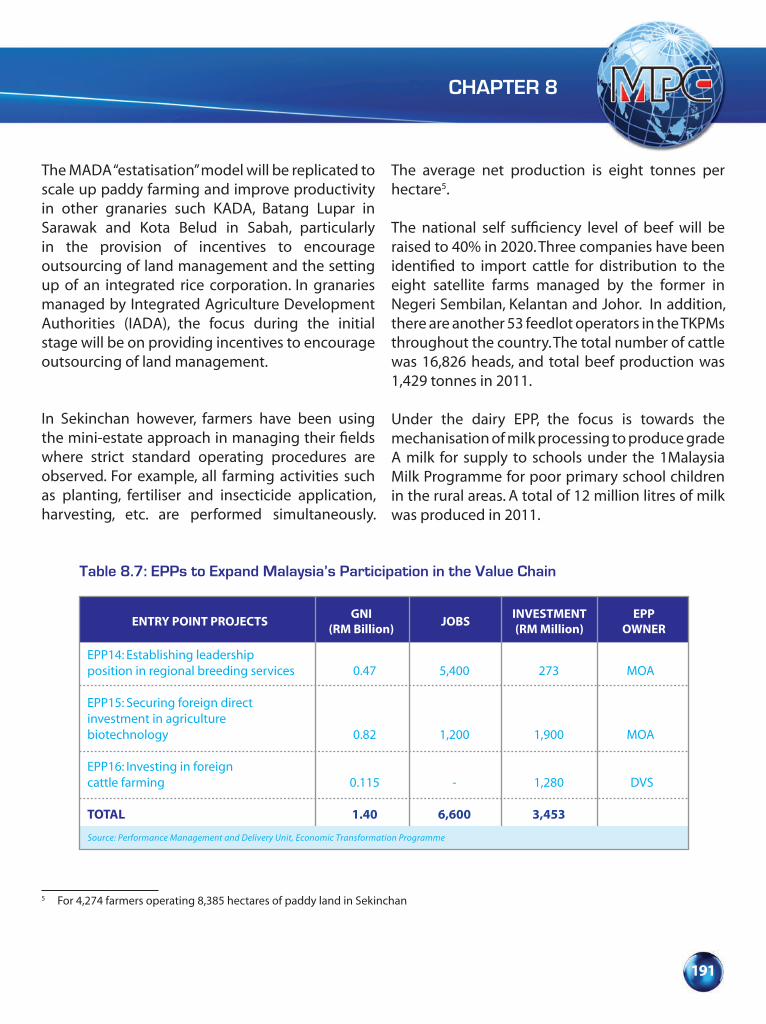
CHAPTER 8
191
The MADA “estatisation” model will be replicated to scale up paddy farming and improve productivity in other granaries such KADA, Batang Lupar in Sarawak and Kota Belud in Sabah, particularly in the provision of incentives to encourage outsourcing of land management and the setting up of an integrated rice corporation. In granaries managed by Integrated Agriculture Development Authorities (IADA), the focus during the initial stage will be on providing incentives to encourage outsourcing of land management.
In Sekinchan however, farmers have been using the mini-estate approach in managing their fields where strict standard operating procedures are observed. For example, all farming activities such as planting, fertiliser and insecticide application, harvesting, etc. are performed simultaneously.
The average net production is eight tonnes per hectare5.
The national self sufficiency level of beef will be raised to 40% in 2020. Three companies have been identified to import cattle for distribution to the eight satellite farms managed by the former in Negeri Sembilan, Kelantan and Johor. In addition, there are another 53 feedlot operators in the TKPMs throughout the country. The total number of cattle was 16,826 heads, and total beef production was 1,429 tonnes in 2011. Under the dairy EPP, the focus is towards the mechanisation of milk processing to produce grade A milk for supply to schools under the 1Malaysia Milk Programme for poor primary school children in the rural areas. A total of 12 million litres of milk was produced in 2011.
Table 8.7: EPPs to Expand Malaysia’s Participation in the Value Chain
ENTRY POINT PROJECTS GNI(RM Billion) JOBS INVESTMENT
(RM Million)EPP
OWNER
EPP14: Establishing leadershipposition in regional breeding services
EPP15: Securing foreign directinvestment in agriculturebiotechnology
EPP16: Investing in foreigncattle farming
TOTAL
0.47
0.82
0.115
1.40
5,400
1,200
-
6,600
273
1,900
1,280
3,453
MOA
MOA
DVS
Source: Performance Management and Delivery Unit, Economic Transformation Programme
5 For 4,274 farmers operating 8,385 hectares of paddy land in Sekinchan
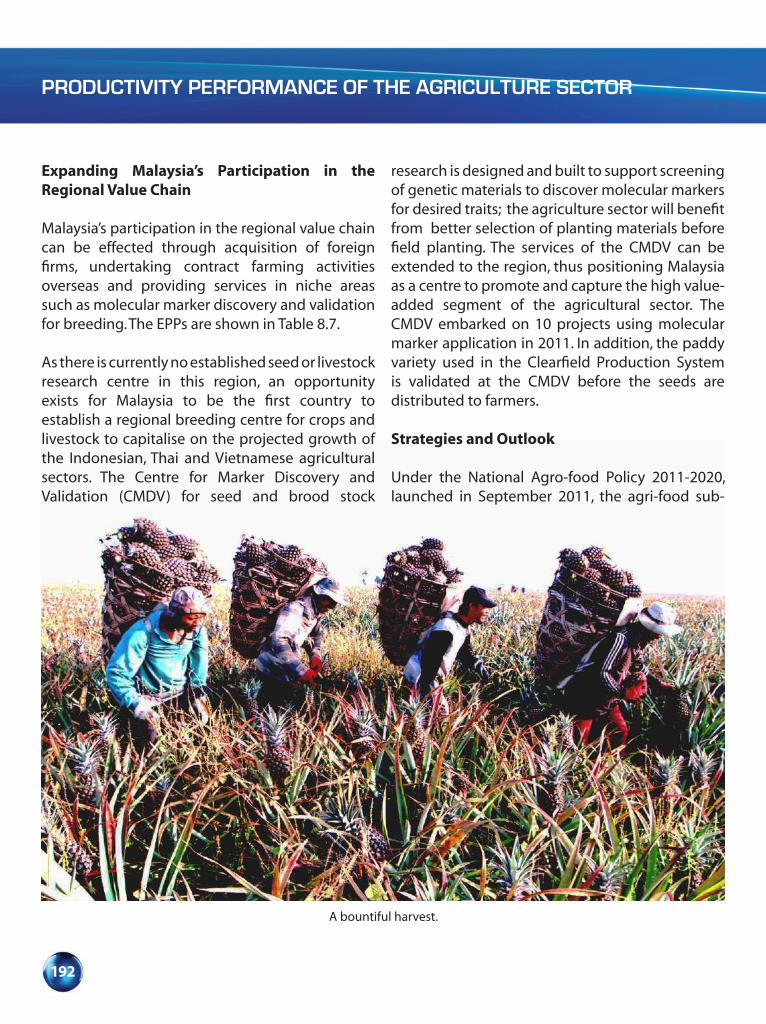
PRODUCTIVITY PERFORMANCE OF THE AGRICULTURE SECTOR
192
Expanding Malaysia’s Participation in the Regional Value Chain
Malaysia’s participation in the regional value chain can be effected through acquisition of foreign firms, undertaking contract farming activities overseas and providing services in niche areas such as molecular marker discovery and validation for breeding. The EPPs are shown in Table 8.7.
As there is currently no established seed or livestock research centre in this region, an opportunity exists for Malaysia to be the first country to establish a regional breeding centre for crops and livestock to capitalise on the projected growth of the Indonesian, Thai and Vietnamese agricultural sectors. The Centre for Marker Discovery and Validation (CMDV) for seed and brood stock
research is designed and built to support screening of genetic materials to discover molecular markers for desired traits; the agriculture sector will benefit from better selection of planting materials before field planting. The services of the CMDV can be extended to the region, thus positioning Malaysia as a centre to promote and capture the high value-added segment of the agricultural sector. The CMDV embarked on 10 projects using molecular marker application in 2011. In addition, the paddy variety used in the Clearfield Production System is validated at the CMDV before the seeds are distributed to farmers.
Strategies and Outlook
Under the National Agro-food Policy 2011-2020, launched in September 2011, the agri-food sub-
A bountiful harvest.
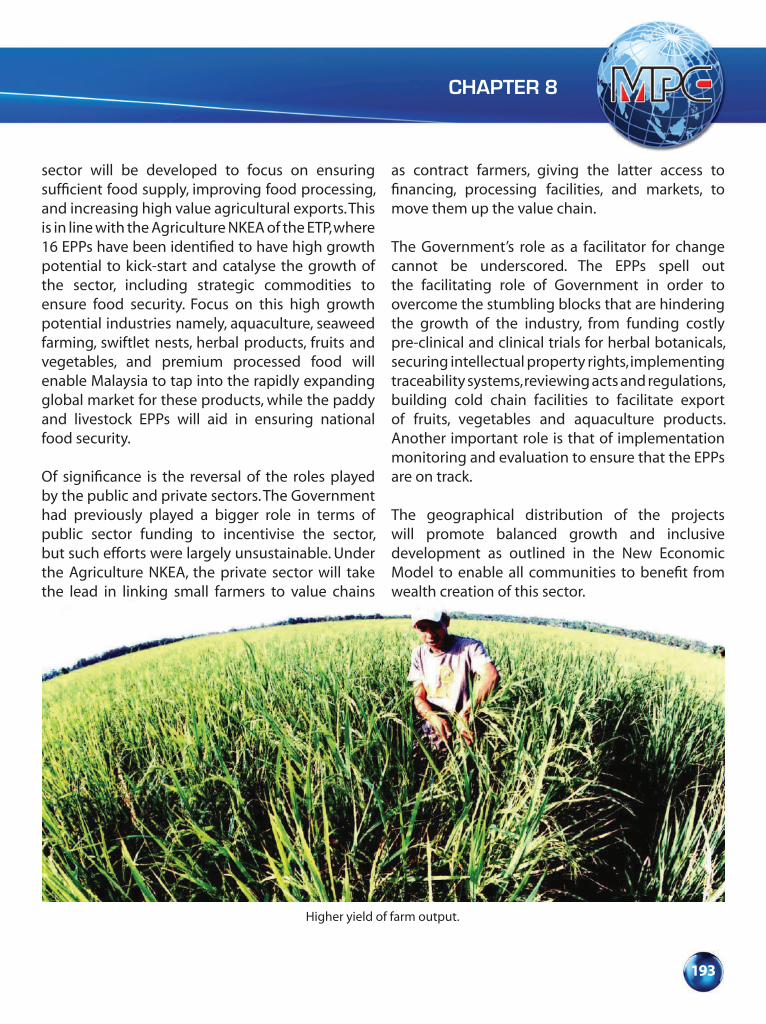
CHAPTER 8
193
sector will be developed to focus on ensuring sufficient food supply, improving food processing, and increasing high value agricultural exports. This is in line with the Agriculture NKEA of the ETP, where 16 EPPs have been identified to have high growth potential to kick-start and catalyse the growth of the sector, including strategic commodities to ensure food security. Focus on this high growth potential industries namely, aquaculture, seaweed farming, swiftlet nests, herbal products, fruits and vegetables, and premium processed food will enable Malaysia to tap into the rapidly expanding global market for these products, while the paddy and livestock EPPs will aid in ensuring national food security.
Of significance is the reversal of the roles played by the public and private sectors. The Government had previously played a bigger role in terms of public sector funding to incentivise the sector, but such efforts were largely unsustainable. Under the Agriculture NKEA, the private sector will take the lead in linking small farmers to value chains
as contract farmers, giving the latter access to financing, processing facilities, and markets, to move them up the value chain.
The Government’s role as a facilitator for change cannot be underscored. The EPPs spell out the facilitating role of Government in order to overcome the stumbling blocks that are hindering the growth of the industry, from funding costly pre-clinical and clinical trials for herbal botanicals, securing intellectual property rights, implementing traceability systems, reviewing acts and regulations, building cold chain facilities to facilitate export of fruits, vegetables and aquaculture products. Another important role is that of implementation monitoring and evaluation to ensure that the EPPs are on track.
The geographical distribution of the projects will promote balanced growth and inclusive development as outlined in the New Economic Model to enable all communities to benefit from wealth creation of this sector.
Higher yield of farm output.

194 Productivity Report 2011/2012
Box 8.1: Innovative Farming Practices: “From Ideas to Reality”
Presently, globalisaton, climate change, biodiversity loss, soil degradation, water pollution, and increasing pressure on natural resources are amongst the most pressing challenges for agriculture. It plays an important part in both causing harm and offering solutions to meet these challenges. Under conventional farming practices, there is limited opportunity to reduce emissions
significantly, rather, agriculture is a major contributor to emission, soil erosion and the associated loss of soil organic carbon, the most meaningful sign of soil productivity. Thus farming practices must be made to shape agriculture towards innovative and best practices which will meet the above challenges. This is what we call modern agriculture which pushes for innovation, stewardship and advancement being continually made by farmers to produce high quality products with a reduced environmental impact.
Agriculture has relied heavily on conventional methods to produce, increase and sustain food production. There was extensive use of chemical fertilisers to supply plant nutrients and chemicals to combat pest and diseases. What this calls for is a system of agriculture that involves sustainable management of natural resources while progressively enhancing soil quality, biodiversity, and productivity. Among the ideas that has been practiced is Good Agricultural Practices (GAP) which stands on four pillars of economic viability, environmental sustainability, social acceptability and food safety and quality. This is in line with globalisation that brings new opportunities for agricultural producers, along with new challenges to meet growing demands for food safety and quality. Farming practices that are in line with the GAP include protected environment production system, integrated pest management (IPM), precision farming, biofertiliser, and biopesticide.
Protected environmental agriculture is to improve nutrient water use efficiency and obtaining better pest management in crop production for quality produce. It is a sustainable crop production system incorporating soilless culture and fertigation whereby, the application of fertilisers, soil amendments or other water soluble products was made through an irrigation system. This allows for precise, minimal, sustainable quantity of chemical inputs in the production process. The aim is to manipulate the root environment to generate root signals that play a major role in plant metabolism against root stress, pests, diseases and other related plant injuries that will disrupt water and nutrient uptake and distribution. It is expected to become an important agribusiness industry with greater impact on the national economy than was traditionally perceived due to escalating costs in agricultural inputs. It can have precise control over the growing environment and avoid wastages, and uncertainties in the water and nutrient status of the growing media and overcome the problem of salinity, pests and diseases.
Integrated Pest Management is to promote sustainable pest management control. It is a natural way of suppressing pest population to lower density either permanently or temporarily through the use of the existing natural enemies of the agricultural crop pests. This could be achieved through the release of natural enemies or enhance natural enemies densities by improving their shelters.
195Productivity Report 2011/2012
Precision farming is an innovative method to optimise resources. It is a management system based primarily on a combination of information technologies including network computing, satellite monitoring and automated guidance systems for farm machinery. Precision farming can save time and energy by reducing unnecessary application of chemicals and irrigation leading to a more ecological farming with higher yields. Chemical inputs, particularly fertilisers and pesticides when applied, using the precision agriculture approach could reduce load accumulation and disposition. As a result, the undesirable effects of excess chemical loading to the environment leading to soil and water contamination and productivity loss due to insufficient inputs application can be averted.
Biofertilisers are used to improve the fertility of the land using biological wastes. It does not contain any chemicals which are detrimental to the living soil. They are extremely beneficial in enriching the soil with those micro-organisms which produce organic nutrients for the soil and help combat diseases. The farm produce does not contain traces of hazardous and poisonous materials.
Biopesticides are certain types of pesticides derived from such natural materials such as animals, plants, bacteria and certain minerals. Biopesticides are usually inherently less toxic than conventional pesticides and generally affect only the target pest and closely related organisms in contrast to broad spectrum conventional pesticides that may affect organisms.
The successful use of agriculture wastes such as rice straws and husks, empty oil palm fruit bunches, saw dust, animal droppings are also positive steps undertaken to reduce the dependence on chemicals. This is a move towards more natural and healthier methods of food production and to optimise the use of resources on a sustainable basis. Integrated and mixed farming is one successful way of optimising the use of resources for maximising income.
Food safety is an attribute that is increasingly being demanded by consumers. The authority has responded to food safety and quality by establishing a Quality Assurance Programme for primary producers by introducing the Farm Accreditation Scheme of Malaysia (SALM) in 2002 and the Malaysian Organic Scheme (SOM) in 2003. The SOM accords recognition to farmers who cultivate crops according to the requirements outlined in the National Organic Standard, MS 1529. This standard on organic production is modelled after the FAO/WHO Codex Alimentarius Commission Guidelines and IFOAM Organic Standard.
Prof Dr Mad Nasir ShamsudinDean, Faculty of Agriculture, Universiti Putra Malaysia
SUSTAINING THE QUALITY
OF LIFE
PART
4

CHAPTER 9
NATION’S QUALITY OF LIFE ASPIRATION
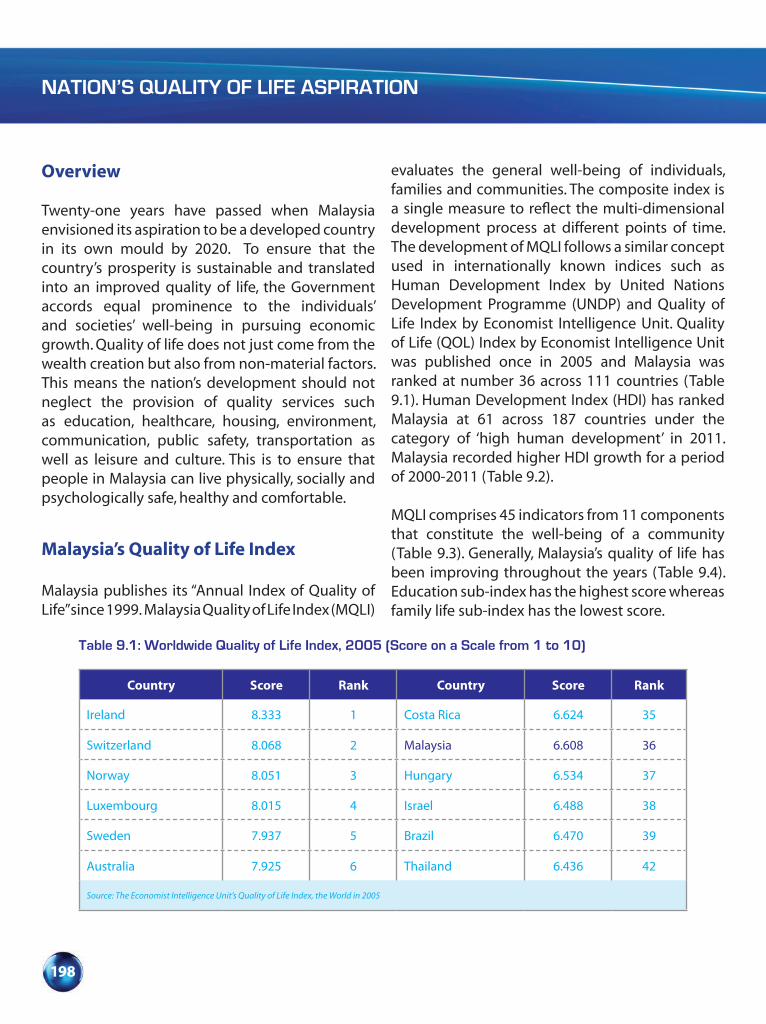
NATION’S QUALITY OF LIFE ASPIRATION
198
Overview
Twenty-one years have passed when Malaysia envisioned its aspiration to be a developed country in its own mould by 2020. To ensure that the country’s prosperity is sustainable and translated into an improved quality of life, the Government accords equal prominence to the individuals’ and societies’ well-being in pursuing economic growth. Quality of life does not just come from the wealth creation but also from non-material factors. This means the nation’s development should not neglect the provision of quality services such as education, healthcare, housing, environment, communication, public safety, transportation as well as leisure and culture. This is to ensure that people in Malaysia can live physically, socially and psychologically safe, healthy and comfortable.
Malaysia’s Quality of Life Index
Malaysia publishes its “Annual Index of Quality of Life” since 1999. Malaysia Quality of Life Index (MQLI)
evaluates the general well-being of individuals, families and communities. The composite index is a single measure to reflect the multi-dimensional development process at different points of time. The development of MQLI follows a similar concept used in internationally known indices such as Human Development Index by United Nations Development Programme (UNDP) and Quality of Life Index by Economist Intelligence Unit. Quality of Life (QOL) Index by Economist Intelligence Unit was published once in 2005 and Malaysia was ranked at number 36 across 111 countries (Table 9.1). Human Development Index (HDI) has ranked Malaysia at 61 across 187 countries under the category of ‘high human development’ in 2011. Malaysia recorded higher HDI growth for a period of 2000-2011 (Table 9.2).
MQLI comprises 45 indicators from 11 components that constitute the well-being of a community (Table 9.3). Generally, Malaysia’s quality of life has been improving throughout the years (Table 9.4). Education sub-index has the highest score whereas family life sub-index has the lowest score.
Table 9.1: Worldwide Quality of Life Index, 2005 (Score on a Scale from 1 to 10)
Country Score Rank Country Score Rank
Ireland 8.333 1 Costa Rica 6.624 35
Switzerland 8.068 2 Malaysia 6.608 36
Norway 8.051 3 Hungary 6.534 37
Luxembourg 8.015 4 Israel 6.488 38
Sweden 7.937 5 Brazil 6.470 39
Australia 7.925 6 Thailand 6.436 42
Source: The Economist Intelligence Unit’s Quality of Life Index, the World in 2005
Table 9.2: Human Development Report 2011- HDI Rank
Very High Human Development
High Human Development
Medium Human Development
Low Human Development
1. Norway 48. Uruguay 95. Jordan 142. Solomon Island
2. Australia 49. Palau 96. Algeria 143. Kenya
3. Netherlands 50. Romania 97. Sri Lanka 145. Pakistan
….. ….. ….. …..
25. Luxembourg 60. Antigua & Barbuda 103. Thailand 150. Cameroon
26. Singapore 61. Malaysia 112. Phillipines 152. Tanzania
… ….. …. ….
47. Barbados 94. Tunisia 141. Bhutan 187. Congo,Dem.Rep
Source: Human Development Report, United Nations Development Programme (UNDP), 2011
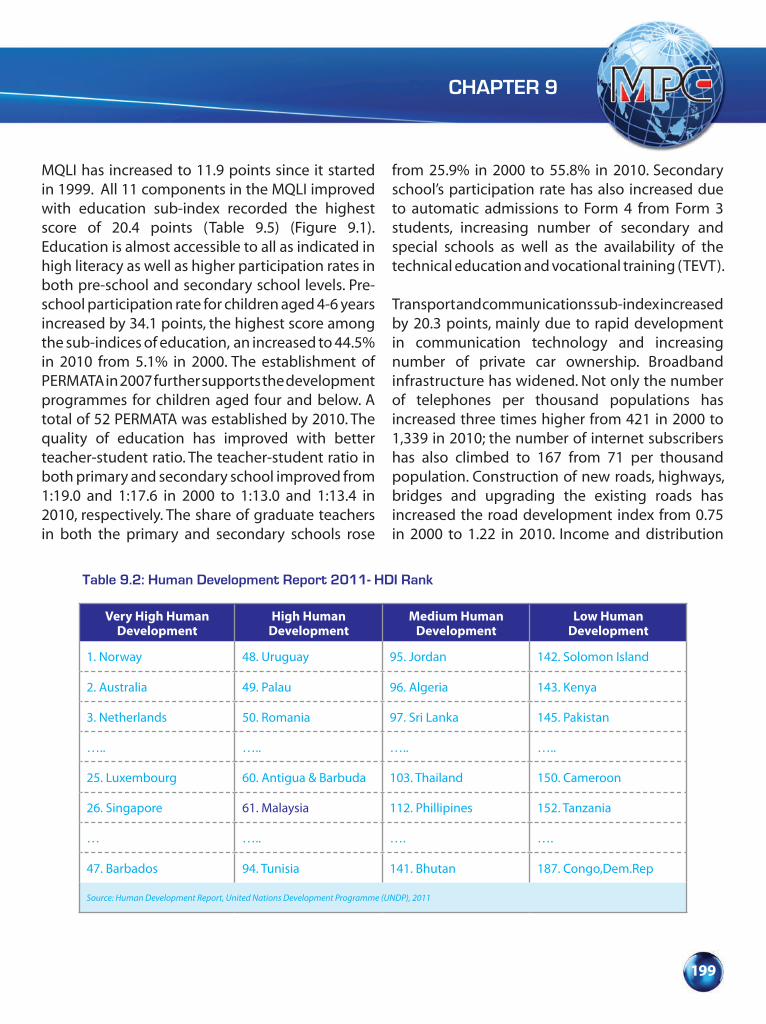
CHAPTER 9
199
MQLI has increased to 11.9 points since it started in 1999. All 11 components in the MQLI improved with education sub-index recorded the highest score of 20.4 points (Table 9.5) (Figure 9.1).Education is almost accessible to all as indicated in high literacy as well as higher participation rates in both pre-school and secondary school levels. Pre-school participation rate for children aged 4-6 years increased by 34.1 points, the highest score among the sub-indices of education, an increased to 44.5% in 2010 from 5.1% in 2000. The establishment of PERMATA in 2007 further supports the development programmes for children aged four and below. A total of 52 PERMATA was established by 2010. The quality of education has improved with better teacher-student ratio. The teacher-student ratio in both primary and secondary school improved from 1:19.0 and 1:17.6 in 2000 to 1:13.0 and 1:13.4 in 2010, respectively. The share of graduate teachers in both the primary and secondary schools rose
from 25.9% in 2000 to 55.8% in 2010. Secondary school’s participation rate has also increased due to automatic admissions to Form 4 from Form 3 students, increasing number of secondary and special schools as well as the availability of the technical education and vocational training (TEVT).
Transport and communications sub-index increased by 20.3 points, mainly due to rapid development in communication technology and increasing number of private car ownership. Broadband infrastructure has widened. Not only the number of telephones per thousand populations has increased three times higher from 421 in 2000 to 1,339 in 2010; the number of internet subscribers has also climbed to 167 from 71 per thousand population. Construction of new roads, highways, bridges and upgrading the existing roads has increased the road development index from 0.75 in 2000 to 1.22 in 2010. Income and distribution
Table 9.1: Worldwide Quality of Life Index, 2005 (Score on a Scale from 1 to 10)
Country Score Rank Country Score Rank
Ireland 8.333 1 Costa Rica 6.624 35
Switzerland 8.068 2 Malaysia 6.608 36
Norway 8.051 3 Hungary 6.534 37
Luxembourg 8.015 4 Israel 6.488 38
Sweden 7.937 5 Brazil 6.470 39
Australia 7.925 6 Thailand 6.436 42
Source: The Economist Intelligence Unit’s Quality of Life Index, the World in 2005
Table 9.2: Human Development Report 2011- HDI Rank
Very High Human Development
High Human Development
Medium Human Development
Low Human Development
1. Norway 48. Uruguay 95. Jordan 142. Solomon Island
2. Australia 49. Palau 96. Algeria 143. Kenya
3. Netherlands 50. Romania 97. Sri Lanka 145. Pakistan
….. ….. ….. …..
25. Luxembourg 60. Antigua & Barbuda 103. Thailand 150. Cameroon
26. Singapore 61. Malaysia 112. Phillipines 152. Tanzania
… ….. …. ….
47. Barbados 94. Tunisia 141. Bhutan 187. Congo,Dem.Rep
Source: Human Development Report, United Nations Development Programme (UNDP), 2011

NATION’S QUALITY OF LIFE ASPIRATION
200
Table 9.3: Components and Indicators of the Malaysia Quality of Life Index
Components Indicators
Income & Distribution • Real Per Capita Income • Incidence of Poverty
•
Working Life Condition • Unemployment Rate• Man-days Lost Due to Industrial
Actions• Gender Equality in Labour
Workforce
• Trade Disputes • Industrial Accident Rate
Transport & Communications
• Private Motorcars & Motorcycles•
• Internet Subscribers• Road Development Index
Health • Male Life Expectancy at Birth• Female Life Expectancy at Birth• Doctors Population Ratio
• Infant Mortality Rate• Maternal Mortality Rate
Education • Literacy Rate• Pre-School Participation Rate• Secondary School Participation
Rate• Tertiary Participation Rate
• Graduate Teachers• Secondary School Teacher-Student
Ratio• Primary School Teacher-Student
Ratio
Housing • Low-Cost Housing Units• Housing Units With Electricity
• Housing Units With Piped Water
Environment • Air Quality• Water Quality
• Forested Land
Family Life • Divorces• Household Size
• Juvenile Crimes• Average Household Income
Social Participation • Membership in Registered Non-
• Registered Voters
• Number of Registered Residents’ Associations
Public Safety • Crimes • Road Accidents
Culture & Leisure • Membership in Public Library• TV Viewers• Domestic Hotel Guests
• Istana Budaya Viewers• Visitors to Muzium• Cinema Viewers
Source: Economic Planning Unit, Prime Minister Department
Table 9.4: Malaysia Quality of Life Index, 2010
Base Year 2000 = 100
Components Index
Education Transport & Communication HousingCulture & LeisureIncome & DistributionPublic SafetyHealth Social ParticipationEnvironmentWorking Life ConditionFamily Life
120.4120.3115.7113.5113.3110.8110.5110.1106.6104.6104.6
MQLI 111.9
Source: Economic Planning Unit, Prime Minister Department
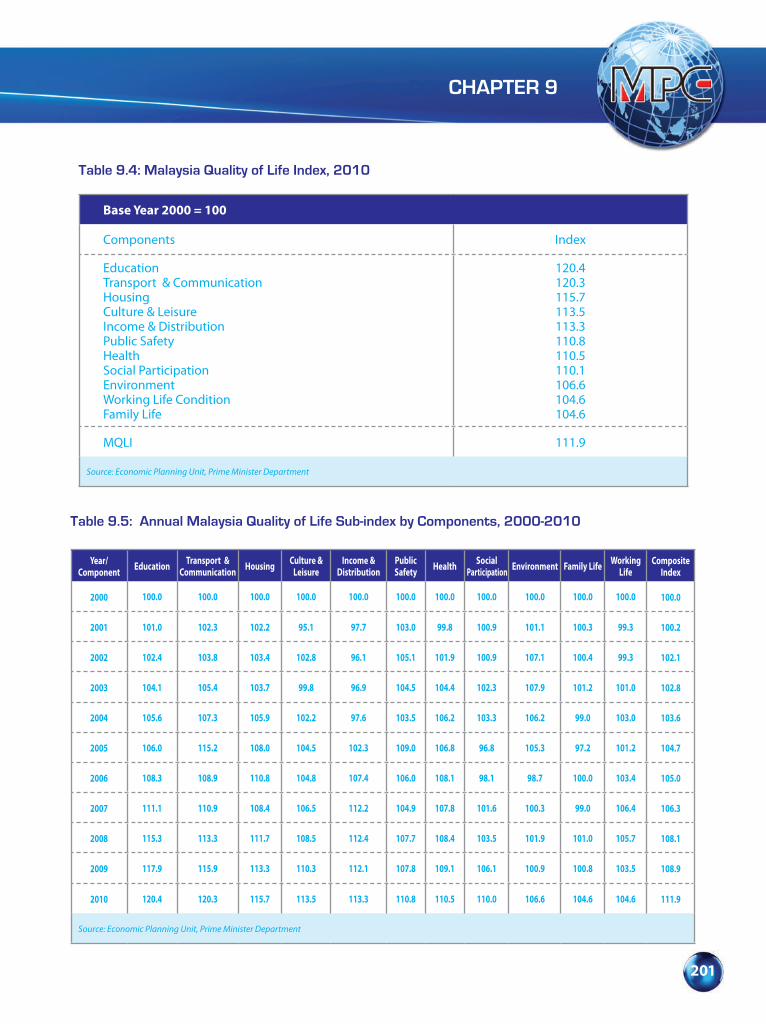
CHAPTER 9
201
Table 9.3: Components and Indicators of the Malaysia Quality of Life Index
Components Indicators
Income & Distribution • Real Per Capita Income • Incidence of Poverty
•
Working Life Condition • Unemployment Rate• Man-days Lost Due to Industrial
Actions• Gender Equality in Labour
Workforce
• Trade Disputes • Industrial Accident Rate
Transport & Communications
• Private Motorcars & Motorcycles•
• Internet Subscribers• Road Development Index
Health • Male Life Expectancy at Birth• Female Life Expectancy at Birth• Doctors Population Ratio
• Infant Mortality Rate• Maternal Mortality Rate
Education • Literacy Rate• Pre-School Participation Rate• Secondary School Participation
Rate• Tertiary Participation Rate
• Graduate Teachers• Secondary School Teacher-Student
Ratio• Primary School Teacher-Student
Ratio
Housing • Low-Cost Housing Units• Housing Units With Electricity
• Housing Units With Piped Water
Environment • Air Quality• Water Quality
• Forested Land
Family Life • Divorces• Household Size
• Juvenile Crimes• Average Household Income
Social Participation • Membership in Registered Non-
• Registered Voters
• Number of Registered Residents’ Associations
Public Safety • Crimes • Road Accidents
Culture & Leisure • Membership in Public Library• TV Viewers• Domestic Hotel Guests
• Istana Budaya Viewers• Visitors to Muzium• Cinema Viewers
Source: Economic Planning Unit, Prime Minister Department
Table 9.4: Malaysia Quality of Life Index, 2010
Base Year 2000 = 100
Components Index
Education Transport & Communication HousingCulture & LeisureIncome & DistributionPublic SafetyHealth Social ParticipationEnvironmentWorking Life ConditionFamily Life
120.4120.3115.7113.5113.3110.8110.5110.1106.6104.6104.6
MQLI 111.9
Source: Economic Planning Unit, Prime Minister Department
Table 9.5: Annual Malaysia Quality of Life Sub-index by Components, 2000-2010
Year/ Component Education Transport &
Communication Housing Culture & Leisure
Income & Distribution
Public Safety Health Social
Participation Environment Family Life Working Life
Composite Index
2000 100.0 100.0 100.0 100.0 100.0 100.0 100.0 100.0 100.0 100.0 100.0 100.0
2001 101.0 102.3 102.2 95.1 97.7 103.0 99.8 100.9 101.1 100.3 99.3 100.2
2002 102.4 103.8 103.4 102.8 96.1 105.1 101.9 100.9 107.1 100.4 99.3 102.1
2003 104.1 105.4 103.7 99.8 96.9 104.5 104.4 102.3 107.9 101.2 101.0 102.8
2004 105.6 107.3 105.9 102.2 97.6 103.5 106.2 103.3 106.2 99.0 103.0 103.6
2005 106.0 115.2 108.0 104.5 102.3 109.0 106.8 96.8 105.3 97.2 101.2 104.7
2006 108.3 108.9 110.8 104.8 107.4 106.0 108.1 98.1 98.7 100.0 103.4 105.0
2007 111.1 110.9 108.4 106.5 112.2 104.9 107.8 101.6 100.3 99.0 106.4 106.3
2008 115.3 113.3 111.7 108.5 112.4 107.7 108.4 103.5 101.9 101.0 105.7 108.1
2009 117.9 115.9 113.3 110.3 112.1 107.8 109.1 106.1 100.9 100.8 103.5 108.9
2010 120.4 120.3 115.7 113.5 113.3 110.8 110.5 110.0 106.6 104.6 104.6 111.9
Source: Economic Planning Unit, Prime Minister Department
Table 9.6: Work Environment
Work Environment
Positive % Agreeing
Overall, morale is good in this organisation 81.6
Most people seem to enjoy coming to work 70
People are treated fairly in this organisation 62
Working for this organisation is fun 60
Negative
Some people in this organisation will put you down if it helps them to get on 41.2
A blame culture exists in this organisation 53.1
I have seen people being treated unfairly in this organisation 50
51
Sources: Preliminary Report, Malaysia QoWL 2012

NATION’S QUALITY OF LIFE ASPIRATION
202
sub-index increased by 13.3 points mainly due to higher per capita income in the encouraging economic condition in 2010. The per capita income in current price increased to RM26,175 or USD8,417 in 2010 from RM13,939 or USD3,668 in 2000 as the economy registered a remarkable growth of 7.2% in 2010. A decreasing value of Gini coefficient from 0.449 to 0.441 reflects a more equal wealth distribution. The implementation of targeted poverty programmes in both rural and urban areas has successfully reduced poverty to 3.8% in 2010 from 7.6% in 2000. The 10MP also gives greater attention to the provision of comprehensive social safety net programmes for the disadvantaged
groups especially among the elderly, disabled and single mothers. The Government has introduced 1Malaysia Welfare Programme (KAR1SMA) to assist children, disabled and senior citizens, eligible widow of former soldiers and policemen
Housing sub-index showed an upward trend of 15.7 points. A significant rise of low cost housing units and the percentage of housing units with piped water as well as a wider coverage of electricity contributed to the upward trend of the index. The launching of My First Home Scheme and 1Malaysia Housing Programme (PR1MA) in 2011 will further enhance accessibility to affordable
113.3
104.6
120.3
110.5
120.4
115.7 106.6
104.6
110.0
110.8
113.5
111.9
Income & Distribution
Working Life
Transport & Communications
Health
Education
Housing
Environment
Family Life
Social Participation
Public Safety
Culture & Leisure
Composite Index
Figure 9.1: Malaysia Quality of Life Sub-index by Components
2000 2005 2010
CHAPTER 9
203
and high quality homes particularly for lower and middle income groups.
Higher life expectancy at birth, both for male and female is the most important factor for the higher healthcare sub-index which grew by 10.5 points. Between 2000 and 2010, the male life expectancy improved by 17.2% to 71.7 years. Comparatively, the female life expectancy improved by 18%, which means the average Malaysian woman lives up to 76.6 years. The longer lifespan of the population is an outcome of the enhanced healthcare delivery. A better doctor-population ratio also fosters greater access for health services. A significant improvement in doctor-population ratio from 1:1,504 in 2000 to 1:899 in 2010, foster greater access for best quality of health services to the people. The establishment of Klinik 1Malaysia, for example, has enabled the expansion of primary care services to reach the urban poor and also the under served areas. Klinik Bergerak 1Malaysia was recently introduced in 2011 to further augment healthcare delivery efforts to remote areas.
Public safety sub-index has improved by 10.8 points. Both number of crimes and accidents have decreased. Concerted efforts to reduce crime rate by Royal Malaysian Police and other agencies in creating safer city such as the roll out of CCTV and visibility of the police in hot spot areas contributed to the sub-index. Volunteerism such as The People’s Volunteer Corps (RELA) and Community Oriented Policing System (Rakan Cops) also played important roles in reducing crime rates.
A substantial increase in the number of registered resident’s association and larger membership in non-profit organisation or society contributed
significantly to higher social participation sub-index by 10.0 points. This positive development indicates that Malaysian society is moving toward a better understanding in expressing their views and concerns through associations or organisations. Environmental sub-index increased slightly to 6.6 points. The implementation of several environment-related policies such as National Green Technology Policy and National Climate Change Policy further enhance the environmental awareness in Malaysia. Families in Malaysia today have improved quality of life than those who lived a decade ago as shown by a small upward trend of the family life sub-index by 4.6 points. A decline in the juvenile crime as percentage to population aged 10 – 18 years is the most significant factor to the improvement of the sub-index. The juvenile crime has decreased by 50% in the last 10 years. However an increasing number of divorce as percentage of population aged 18-50 years has softened the overall performance of sub index. The Government implemented National Family Policy (NFP) on 19 March 2011 to build resilient families by emphasising on the development of family well-being.
Working life sub-index showed a mere increment of 4.6 points in 2010. Low numbers of industrial accidents, trade disputes and man-days lost due to industrial actions reflected better working environment and healthier employer-employees relationship. However, higher unemployment rate of 3.4% in 2010 as compared with 3.0% in 2000 negated the performance of the working life sub-index. The establishment of National Institute of Occupational Safety and Health (NIOSH) has increased the awareness on the importance of safety and health in the working place.
NATION’S QUALITY OF LIFE ASPIRATION
204
Increasing number of domestic hotel guests, museum visitors and cinema viewers as well as higher membership in public libraries have contributed to higher culture and leisure sub-index to 13.5 point. This is supported by increase in the number of viewers of Istana Budaya by 78.9% from 85,002 in 2000 to 152,085 persons in 2010. Numbers of visitors to museum also reached to almost three million people in 2010 from 1.7 million in 2000.
The Quality of Work Life (Malaysia) 2012
One of the components highlighted in the MQLI is Working Life Conditions which look at the working environment in Malaysia such as the unemployment rate and trade dispute. Another perspective is to look at the quality of working life which is satisfaction of employees needs through resources, activities and outcomes stemming from participation in the workplace as measured through Quality of Work Life Index.
Quality of Work Life (QoWL) enhances business performance through better design of the work environment. It helps organisations to improve productivity as well as employee satisfaction and individual well-being. There is a positive relationship between QoWL initiatives and productivity. QoWL initiatives help firms to:
• Significantly strengthen the corporatebottom line;
• Enhanceindividualproductivity;• Improveemployeemorale;• Improve employee health and well-being;
and • Retainemployeesandreduceabsenteeism.
Preliminary study on “Quality of Work Life (Malaysia)” carried out in 2012 by some of the
research institution have examined the perception of managers about their workplace and how they attribute the changes in the evolving patterns of work and organisational structures that affect their working and non-working lives. The study explores four themes such as:
• Perceptionsoforganisationandworkplace;• ManagementandLeadershipStyles;• Working hours and the effects of working
hours have on managers; and • StrategicPerformanceofOrganisations.
Theme 1: Perceptions of Organisation and Workplace
Malaysian managers are generally positive about their organisations. Although 40.0-50.0% (Table 9.6) of respondents showed some reservations on certain aspects of the work environment such as blame culture (53.1%) and lack of resources (51.0%), 81.6% of respondents thought that morale is good in their organisations. A majority (70.0%) indicated that they enjoyed coming to work and find work to be an enjoyable activity. Nonetheless, a significant number also indicated the negative aspects of work. The overall positive work environment seemed to offset the negative work environment. This is consistent with the general belief that organisational politics and conflict exist in all organisations but as long as it is not excessive, it is unlikely to have disastrous impact on the overall organisational well-being.
As evidenced by the data in Table 9.7 that 78.0% of respondents supported the view that organisations look after their well-being. Moreover, 74.5% of respondents felt secure in their jobs and 70.0% of them felt value as the most important human capital (Table 9.8). On the positive side, 62.8% found that they were encouraged and rewarded for creative

CHAPTER 9
205
Table 9.5: Annual Malaysia Quality of Life Sub-index by Components, 2000-2010
Year/ Component Education Transport &
Communication Housing Culture & Leisure
Income & Distribution
Public Safety Health Social
Participation Environment Family Life Working Life
Composite Index
2000 100.0 100.0 100.0 100.0 100.0 100.0 100.0 100.0 100.0 100.0 100.0 100.0
2001 101.0 102.3 102.2 95.1 97.7 103.0 99.8 100.9 101.1 100.3 99.3 100.2
2002 102.4 103.8 103.4 102.8 96.1 105.1 101.9 100.9 107.1 100.4 99.3 102.1
2003 104.1 105.4 103.7 99.8 96.9 104.5 104.4 102.3 107.9 101.2 101.0 102.8
2004 105.6 107.3 105.9 102.2 97.6 103.5 106.2 103.3 106.2 99.0 103.0 103.6
2005 106.0 115.2 108.0 104.5 102.3 109.0 106.8 96.8 105.3 97.2 101.2 104.7
2006 108.3 108.9 110.8 104.8 107.4 106.0 108.1 98.1 98.7 100.0 103.4 105.0
2007 111.1 110.9 108.4 106.5 112.2 104.9 107.8 101.6 100.3 99.0 106.4 106.3
2008 115.3 113.3 111.7 108.5 112.4 107.7 108.4 103.5 101.9 101.0 105.7 108.1
2009 117.9 115.9 113.3 110.3 112.1 107.8 109.1 106.1 100.9 100.8 103.5 108.9
2010 120.4 120.3 115.7 113.5 113.3 110.8 110.5 110.0 106.6 104.6 104.6 111.9
Source: Economic Planning Unit, Prime Minister Department
Table 9.6: Work Environment
Work Environment
Positive % Agreeing
Overall, morale is good in this organisation 81.6
Most people seem to enjoy coming to work 70
People are treated fairly in this organisation 62
Working for this organisation is fun 60
Negative
Some people in this organisation will put you down if it helps them to get on 41.2
A blame culture exists in this organisation 53.1
I have seen people being treated unfairly in this organisation 50
51
Sources: Preliminary Report, Malaysia QoWL 2012
Table 9.7: Health and Well-being
Health and Well-being
Positive % Agreeing
My well-being is taken seriously in this organisation 78
Negative
Many people in this organisation feel stressed out 56.9
Many people have a sense of powerless in this organisation 51
44
I have witnessed bullying in this organisation 24
Sources: Preliminary Report, Malaysia QoWL 2012
Table 9.8: Reward, Equity and Value
Reward, Equity and Value
Positive % Agreeing
This organisation will provide me with a secure job for the foreseeable future 74.5
Creativity is rewarded in this organisation 62.8
Employees are treated as this organisations most important asset 70
Poor performance is quickly dealt with in this organisation 66
Negative
Compliance is rewarded in this organisation 64.7
I often feel that I am being exploited in this organisation 32.7
46
Sources: Preliminary Report, Malaysia QoWL 2012

NATION’S QUALITY OF LIFE ASPIRATION
206
behavior. However, at the same time, there was also a strong feeling 64.7%, that their companies expected and rewarded them for compliance behavior to the chain of command. This was indicative of presence of a hierarchical structure. In terms of health and well-being, pressures to work well beyond contracted hours accounted for 44.0%, surface in terms of a sense of alienation and powerlessness (51.0%) and stress (56.9%) (Table 9.7). For rewards, equity and value, 32.7% felt that they were exploited by their organisations (Table 9.8). Among the programmes under the work-life balance are corporate concierge, maternity, paternity and adoption support and eldercare and child care services which are designed to help reduce stress and to ease their personal life. It was able to significantly reduce absenteeism, retain
the best and loyal employees and increased in employee’s productivity which indirectly pushed the company forward.
In spite of some negativities, Malaysians were upbeat about the companies for which they work (Table 9.9). An overwhelming majority claimed a strong sense of loyalty (86.3%) and felt proud (86.3%) to work for their organisations. They expressed confidence in being able to realise career aspiration in their organisations (84.3%).
Theme 2: Management and Leadership Styles
This theme explores how management and leadership styles affect quality of work life. Senior
Table 9.7: Health and Well-being
Health and Well-being
Positive % Agreeing
My well-being is taken seriously in this organisation 78
Negative
Many people in this organisation feel stressed out 56.9
Many people have a sense of powerless in this organisation 51
44
I have witnessed bullying in this organisation 24
Sources: Preliminary Report, Malaysia QoWL 2012
Table 9.8: Reward, Equity and Value
Reward, Equity and Value
Positive % Agreeing
This organisation will provide me with a secure job for the foreseeable future 74.5
Creativity is rewarded in this organisation 62.8
Employees are treated as this organisations most important asset 70
Poor performance is quickly dealt with in this organisation 66
Negative
Compliance is rewarded in this organisation 64.7
I often feel that I am being exploited in this organisation 32.7
46
Sources: Preliminary Report, Malaysia QoWL 2012
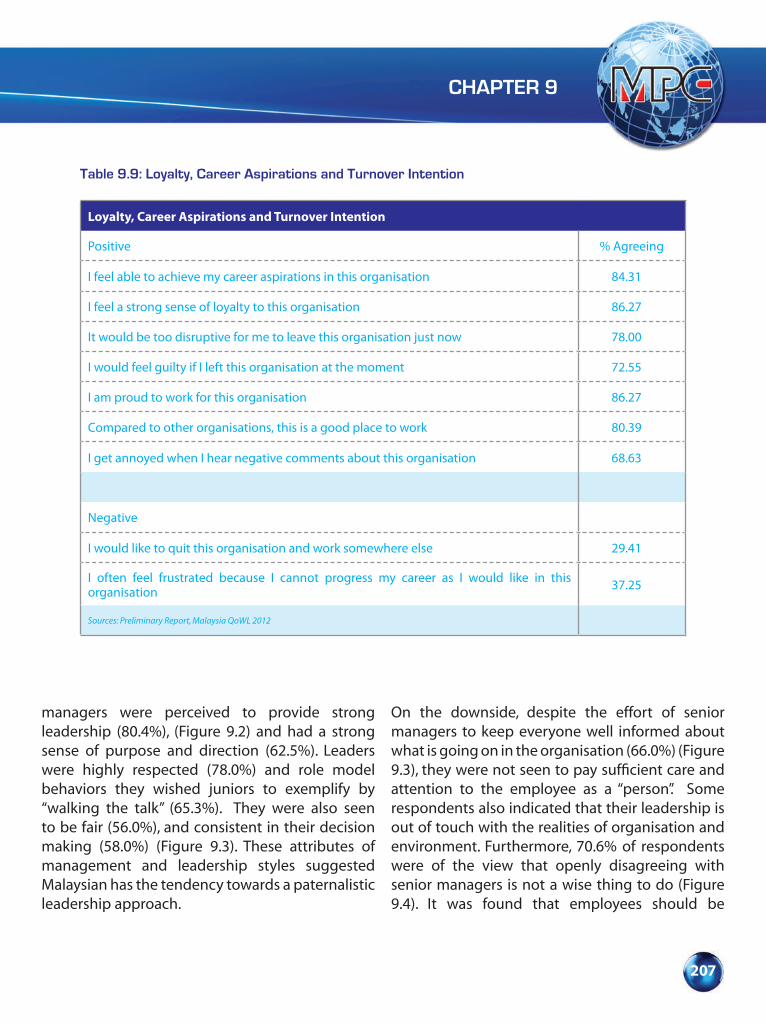
CHAPTER 9
207
managers were perceived to provide strong leadership (80.4%), (Figure 9.2) and had a strong sense of purpose and direction (62.5%). Leaders were highly respected (78.0%) and role model behaviors they wished juniors to exemplify by “walking the talk” (65.3%). They were also seen to be fair (56.0%), and consistent in their decision making (58.0%) (Figure 9.3). These attributes of management and leadership styles suggested Malaysian has the tendency towards a paternalistic leadership approach.
On the downside, despite the effort of senior managers to keep everyone well informed about what is going on in the organisation (66.0%) (Figure 9.3), they were not seen to pay sufficient care and attention to the employee as a “person”. Some respondents also indicated that their leadership is out of touch with the realities of organisation and environment. Furthermore, 70.6% of respondents were of the view that openly disagreeing with senior managers is not a wise thing to do (Figure 9.4). It was found that employees should be
Table 9.9: Loyalty, Career Aspirations and Turnover Intention
Loyalty, Career Aspirations and Turnover Intention
Positive % Agreeing
I feel able to achieve my career aspirations in this organisation 84.31
I feel a strong sense of loyalty to this organisation 86.27
It would be too disruptive for me to leave this organisation just now 78.00
I would feel guilty if I left this organisation at the moment 72.55
I am proud to work for this organisation 86.27
Compared to other organisations, this is a good place to work 80.39
I get annoyed when I hear negative comments about this organisation 68.63
Negative
I would like to quit this organisation and work somewhere else 29.41
I often feel frustrated because I cannot progress my career as I would like in this organisation 37.25
Sources: Preliminary Report, Malaysia QoWL 2012
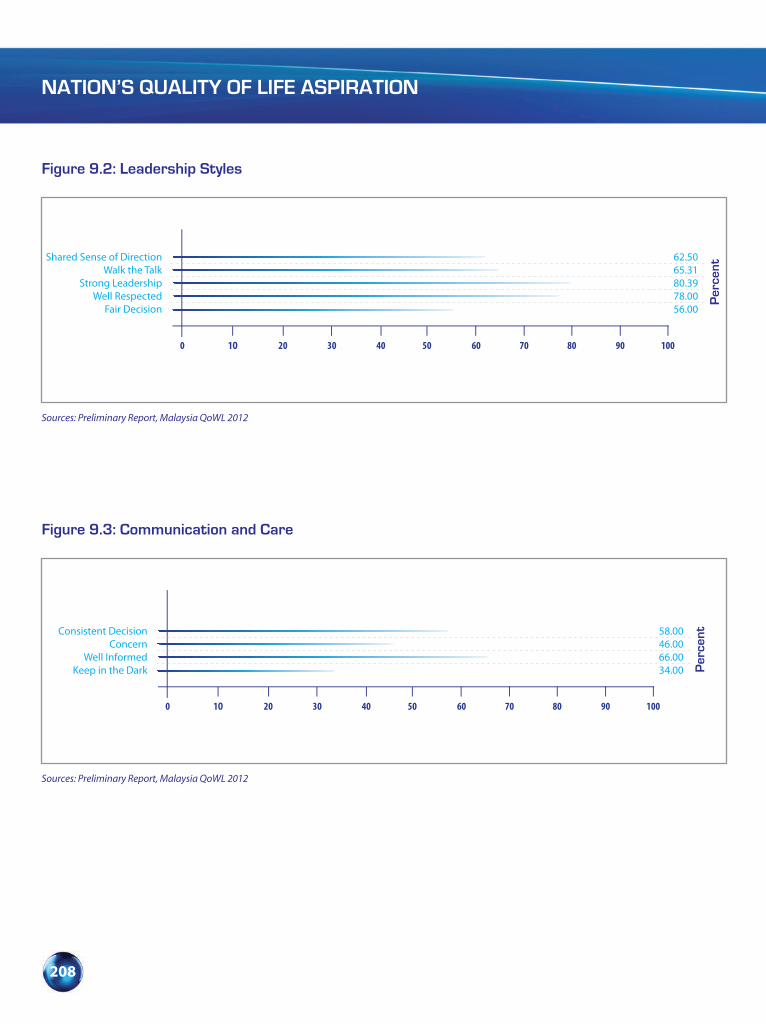
NATION’S QUALITY OF LIFE ASPIRATION
208
Figure 9.2: Leadership Styles
Shared Sense of DirectionWalk the Talk
Strong LeadershipWell Respected
Fair Decision
62.5065.3180.3978.0056.00
0 1O 20 30 40 50 60 70 80
Per
cent
Sources: Preliminary Report, Malaysia QoWL 2012
90 100
Figure 9.3: Communication and Care
Consistent DecisionConcern
Well InformedKeep in the Dark
58.0046.0066.0034.00
0 1O 20 30 40 50 60 70 80P
erce
nt
Sources: Preliminary Report, Malaysia QoWL 2012
90 100
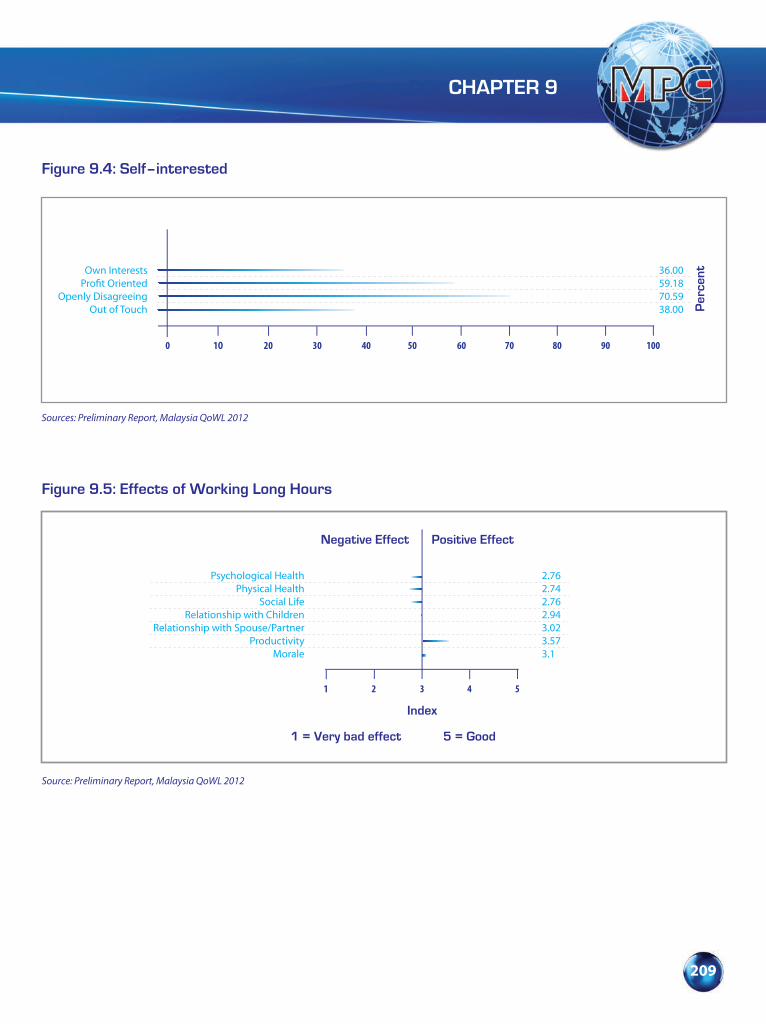
CHAPTER 9
209
Figure 9.4: Self–interested
Own InterestsPro�t Oriented
Openly DisagreeingOut of Touch
36.0059.1870.5938.00
0 1O 20 30 40 50 60 70 80
Per
cent
Sources: Preliminary Report, Malaysia QoWL 2012
90 100
Figure 9.5: Effects of Working Long Hours
Source: Preliminary Report, Malaysia QoWL 2012
Index
Negative Effect Positive Effect
Psychological HealthPhysical Health
Social LifeRelationship with Children
Relationship with Spouse/PartnerProductivity
Morale
3 4 5
2.762.742.762.943.023.573.1
1 = Very bad effect 5 = Good
21

NATION’S QUALITY OF LIFE ASPIRATION
210
submissive to their leaders which reinforced that Malaysian organisations are highly hierarchical in nature.
Leaders were seen to be highly profit driven (59.2%) and showed lower concern for people (46.0%) (Figure 9.3 & 9.4). About 36.0% of respondents suggested that senior managers merely look after their own interests (Figure 9.4).
Theme 3: Working Hours and the Effects of Working Hours have on Managers
On average, Malaysian managers work 50 hours per week. In addition to this, they work eight hours of overtime per week. A detailed analysis on the effect of overtime work is presented in Figure 9.5. Overall, respondents viewed working long hours, well beyond the contracted hours, helped improve organisation’s productivity (mean scores
= 3.57). This sense of performance reciprocated into positive morale (3.1). Unfortunately, these organisational gains were at a cost to the individual. Long work hours were seen to have a negative impact towards family relationships with the spouse/partner (3.02), children (2.94) and social life (2.76). However, the strongest negative impact of these extended working hours was felt in the deterioration of physical health (2.74) and psychological illness (2.76).
Theme 4: Strategic Performance of Organisations
Organisations were perceived to display average to above average strategic performance compared to the highest performers (Figure 9.6). In terms of distribution, 26.1% of the respondents felt they were working in the best performing organisations while only 2.2% of the respondents felt that their
Figure 9.6: Strategic Performance of Organisations
BadlyAverage
WellAs well as the best
2.1739.1332.6126.09
0 1O 20 30 40 50 60 70 80
Per
cent
Sources: Preliminary Report, Malaysia QoWL 2012
90 100
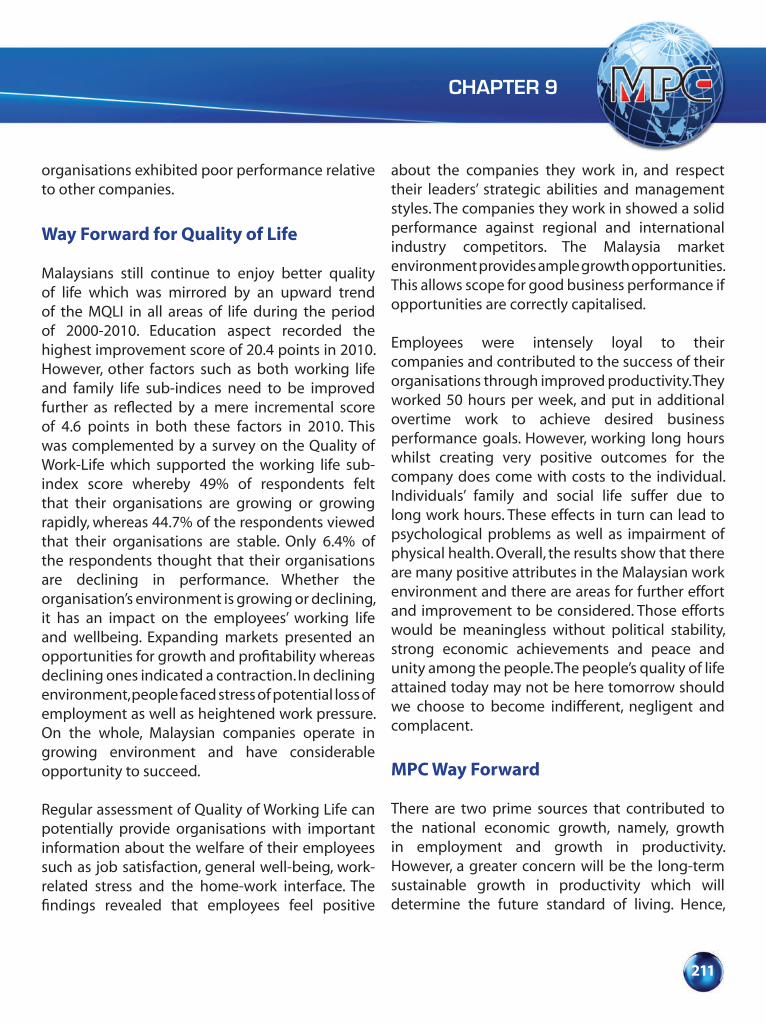
CHAPTER 9
211
organisations exhibited poor performance relative to other companies.
Way Forward for Quality of Life
Malaysians still continue to enjoy better quality of life which was mirrored by an upward trend of the MQLI in all areas of life during the period of 2000-2010. Education aspect recorded the highest improvement score of 20.4 points in 2010. However, other factors such as both working life and family life sub-indices need to be improved further as reflected by a mere incremental score of 4.6 points in both these factors in 2010. This was complemented by a survey on the Quality of Work-Life which supported the working life sub-index score whereby 49% of respondents felt that their organisations are growing or growing rapidly, whereas 44.7% of the respondents viewed that their organisations are stable. Only 6.4% of the respondents thought that their organisations are declining in performance. Whether the organisation’s environment is growing or declining, it has an impact on the employees’ working life and wellbeing. Expanding markets presented an opportunities for growth and profitability whereas declining ones indicated a contraction. In declining environment, people faced stress of potential loss of employment as well as heightened work pressure. On the whole, Malaysian companies operate in growing environment and have considerable opportunity to succeed.
Regular assessment of Quality of Working Life can potentially provide organisations with important information about the welfare of their employees such as job satisfaction, general well-being, work-related stress and the home-work interface. The findings revealed that employees feel positive
about the companies they work in, and respect their leaders’ strategic abilities and management styles. The companies they work in showed a solid performance against regional and international industry competitors. The Malaysia market environment provides ample growth opportunities. This allows scope for good business performance if opportunities are correctly capitalised.
Employees were intensely loyal to their companies and contributed to the success of their organisations through improved productivity. They worked 50 hours per week, and put in additional overtime work to achieve desired business performance goals. However, working long hours whilst creating very positive outcomes for the company does come with costs to the individual. Individuals’ family and social life suffer due to long work hours. These effects in turn can lead to psychological problems as well as impairment of physical health. Overall, the results show that there are many positive attributes in the Malaysian work environment and there are areas for further effort and improvement to be considered. Those efforts would be meaningless without political stability, strong economic achievements and peace and unity among the people. The people’s quality of life attained today may not be here tomorrow should we choose to become indifferent, negligent and complacent.
MPC Way Forward
There are two prime sources that contributed to the national economic growth, namely, growth in employment and growth in productivity. However, a greater concern will be the long-term sustainable growth in productivity which will determine the future standard of living. Hence,
NATION’S QUALITY OF LIFE ASPIRATION
212
enhancement in productivity will subsequently leads to improvement in national competitiveness ranking. To sustain such competitiveness ranking, it is imperative that initiative such as modernising business regulations be institutionalised.
At the firm level, it is pertinent that continuous enterprise innovation and adopting the relevant business excellence framework be pursued in order to ensure a better quality of life. Towards this end, the Tenth Malaysia Plan has identified MPC to lead the review of business regulations and enterprise innovation. As such, MPC is currently being organised along a five-departmental model comprising Global Competitiveness, Regulatory Review, Knowledge Management, Enterprise Innovation, and Business Excellence to meet its requirements.
The roles of the five departments are explained below:
1. Global Competitiveness (GC).
• Develop global and national macroeconomic knowledge based upon Malaysia’s competitiveness ranking.
• Expands such ranking and analysis tostate level benchmarking and support international benchmarking for regulatory review.
2. Regulatory Review (RR)
• Monitor, review, assess and providerecommendations for policy/regulatory changes and on new regulations to enhance national productivity and innovation.
• Providesupport forexistingcommitteesonfacilitating businesses.
3. Enterprise Innovation (EI)
• Improveinnovationatcompaniesbycreatingand implementing ecosystems to address the entire innovation value chain.
4. Business Excellence (BE)
• Measure and certify companies andshowcase role models to spur competition and set best practices for others to emulate.
• Setandenhance innovationstandardswiththe Health Check Framework.
5. Knowledge Management (KM)
• Create knowledge base with productivityand industry reports and provide fact based on productivity and innovation.
• Support Regulatory Review and EnterpriseInnovation with research output.
ENHANCING MALAYSIA’S COMPETITIVENESS
Recent global development and uncertainties would certainly have a direct impact on Malaysia’s economic growth not only in the short-term but also in the long-term as well. In this regard, Malaysia will have to define and strengthen its strategic initiatives if it aims to sustain its competitiveness in the long-run.
CHAPTER 9
213
Hence, MPC will be the agency that spearheads and monitors Malaysia’s competitiveness performance in undertaking various initiatives to ensure that Malaysia’s aspiration of being a high income nation by the year 2020 is on the right track. The initiatives are outlined under four main activities as follows:
• CollaboratetoCompete
Enhancing Malaysia’s competitiveness to achieve the aspirations of being the Top 5 in the World Competitiveness Yearbook, Top 10 in the Doing Business Report as well as to progress into the Innovation Driven Stage of Development in the Global Competitiveness Report by 2015 requires concerted efforts of all ministries and agencies. As such, a taskforce and a working group have been set up under the auspices of Ministry of International Trade and Industry (MITI) to enhance MPC’s role in monitoring Malaysia’s competitive performance and to formulate strategies to further enhance Malaysia’s competitiveness.
• ManagingPerceptionIssues
In determining a nation’s competitiveness position, quantitative and qualitative data are taken into consideration. Qualitative or perception data are collected to complement non-quantifiable elements as documented by both the World Competitiveness Yearbook and Global Competitiveness Report. It is therefore crucial that continuous engagement at various levels be carried out to provide information on the latest development and Government initiatives through continuous communication and interaction with business community and the public.
• HardDataVerification
Accurate and updated data is of utmost importance in a report. Issues relating to the hard data of the WCY have been identified as another initiative to be addressed by MPC. Among the action plans to be continuously undertaken are data verification at the ministry level and engagement with international data sources will be continually carried out.
• EngagementActivities
International partnership and collaboration aim to foster long-term collaborative arrangements between MPC as a partner institute with international ranking agencies, research houses and consultants. It is hoped that through such engagement, MPC will be able to increase its outreach in the international landscape which would serve as a source of reference to help the Government and business communities.
The unique network between MPC and the ranking agencies would give MPC the extra mileage in terms of understanding the challenges facing the global business environment and the various frameworks used in analysing competitiveness.
MODERNISING BUSINESS REGULATIONS
MPC has been entrusted in the Tenth Malaysia Plan to spearhead initiative on modernising business regulations through PEMUDAH, for upgrading quality of existing regulations and National Development Planning Committee (NDPC) and MPC for improving quality of new regulations. MPC
NATION’S QUALITY OF LIFE ASPIRATION
214
targeted to reduce RM1 billion compliance cost savings to business yearly.
Some of the projects for 2012 towards upgrading quality of existing regulations are as follows:
• Stocktaking, Review and Monitoring LicensingFramework of 23 Ministries (Second Wave);
• ReviewRegulatoryBurdenonBusinessofFiveSectors (Tourism, Whole & Retails, Health Care, Electrical and Electronics as well as Oil and Gas);
• Review Quality of Regulation on Dealing withConstruction Permits and Getting Electricity Improving Quality of New Regulations;
• ImplementationNewRegulatoryQualitySystem(MPC to assess quality of new regulations); and
• Pursue structural changes under Trans-PacificPartnership (TPP) in promoting trade and investment.
EXPEDITING ENTERPRISE INNOVATION
In supporting the private sector towards innovation development, the Enterprise Innovation Department of MPC focuses on innovation programmes that will create and implement systems to address the entire value chain. The developed systems would assist the organisation to:
• Diagnosetheproductivityandinnovativeness;
• Improve innovative processes along theinnovation value chain; and
• Monitor the success of intervention programmes in enhancing the innovation of companies.
The target is to facilitate high impact productivity and innovation drives between 2010 and 2015 that would enable the nation to achieve an average productivity growth of 4.6%.
• Enterprise Innovation Intervention Programme
The objectives of EIIP are to support companies in improving productivity and competitiveness, develop their knowledge on productivity and competitiveness, create and implement systems to help companies improve their productivity and competitiveness and showcase role models. Companies are expected to increase productivity, reduce waste, improve system and innovation capability through EIIP.
FAST-TRACKING TOWARDS BUSINESS EXCELLENCE
MPC is currently promoting the Business Excellence Framework in all economic sectors. Business Excellence programme helps organisations to know the status of their journey towards excellence. This is done through an assessment of an organisation’s performance against the requirements of an internationally benchmarked Business Excellence Framework. Based on the outcome of the assessment; organisations scoring between 400 to 699 points will be invited to be a member of Malaysia Productivity and Innovation Class (MPIC). Among others, the MPIC

CHAPTER 9
215
is a recognition to organisations which had achieved a standard of excellence based on the Business Excellence Framework. The membership will facilitate intervention and the nurturing of companies to alleviate their business performance and indirectly prepare them to become a global player.
Among the programmes proposed in 2012 are:
• BusinessExcellencefortheServicesSector
Recognising the importance of the services sector’s contribution to the economy, a new Business Excellence instrument for the services sector will be developed in 2012. The objective is to enhance the capacity of the services providers to meet the challenges of liberalisation and the dynamic global economic changes.
• Strengthening Strategic Alliancesand Collaboration
MPC has identified several GLCs and large anchor companies to intensify its efforts in promoting the Business Excellence Framework.
• HigherEducationInstitutions
MPC proposed to introduce the Business Excellence Framework in two modules:
i. To the post-graduates as part of their practical business projects (hands-on); and
ii. To the undergraduate as one of their elective
subjects. This is with the objective of giving prior exposure to those in pre-employment so that they can embrace the philosophy of business excellence and put them into practice when they start work.
• Regional/InternationalCollaboration
Exposure to international practices and acquired knowledge of best practices and benchmarks in the region for example Singapore and Thailand.
• CertificationProgrammes
MPC is introducing Certification Programmes for Business Excellence practitioners, assessors and consultants. The objective of the programme is to develop expertise and expand the capabilities of the Business Excellence Communities.
INSTITUTIONALISING KNOWLEDGE MANAGEMENT CULTURE
Knowledge Management (KM) is an integrated approach and multi-disciplinary system for creating, sharing and applying knowledge to enhance organisational productivity, competitiveness, profitability and growth.
KM two key functions are firstly, knowledge transformation which is taking the initiatives by translating information and data into knowledge through data analysis, provide real time knowledge for effective decision making and expand both tangible and intangible productivity indicator

NATION’S QUALITY OF LIFE ASPIRATION
216
measures. Secondly, knowledge accessibility is to make knowledge accessible by enhancing knowledge sharing, storage and application. This is to accelerate the learning curve and time to information, knowledge and experience by reducing duplication of work and doing right the first time.
MPC is preparing the new database on productivity by improving the productivity measurement methodology. The tangible productivity measures is TFP analysis using KLEMS approach. The project is conducted in collaboration with Department of Statistics, Central Bank of Malaysia, Malaysian Institute of Economic Research, Economic Planning Unit and academic researchers.
KLEMS approach provides users with the knowledge on sources of economic growth, including growth of the five inputs (Capital, Labour, Energy, and Material and Services) and productivity at the industry level. Users will have real time information to research on sources of economic growth and structural change at the macro level and analysis on quality of labour market (by skills, education level, gender, age, etc.), technological progress and innovation using firm level database for micro level analysis
The intangible productivity measures will complement tangible productivity and economic indicators besides enabling organisations to understand the needs and expectations of their customers for improvement. The National Customer Satisfaction Index (NCSI) will be MPC nationwide effort to boost excellence services to both the public sector and industries. This measure will be one of the MPC’s national effort to assist
industries to consistently deliver excellent goods and services as well as to make Malaysian industries to be recognised internationally.
MoWL focuses on specific work-related aspects of quality of work life. The measures include assessment of employees job satisfaction such as individual personal characteristics and organisational cultural climate which will be assessed. The results enable management to plan appropriate action to be taken to enhance an individual’s performance and provide an opportunity for more cost-effective interventions in the workplace.
Boosting Productivity Growth and Innovative Transformation
Productivity growth is one of the key economic indicators of innovation for the country. Strategies based on technology and innovative transformation are required to boost the productivity growth. These include:
• Reducing regulatory burden and compliance cost through regulatory review initiatives and modernising business regulation.
• Enhancing the application of ICT-based technologies to strengthen innovative efforts in productions, services and marketing.
• Transforming traditional jobs and conventional ways of doing things into modern jobs with high values. These can be achieved through: i. Product innovation, process innovation and
marketing innovation; andii. Inculcating Business Excellence culture
through total employees participation in
CHAPTER 9
217
activities such as benchmarking, awards, standardisation and best practices across the global arena.
• Ensuring the country’s workforce to be more efficient and innovative where the industries:
i. Need to continuously invest in human capital training and development;
ii. Establish a strong communication system; and
iii. Monitor performance through productivity measurement.
A Knowledgeable Society

218 Productivity Report 2011/2012
Box 9.1: Best Practices in Work Life Balance
The success of work-life balance depends upon one’s ability to make decisions about what to do at any given moment. Basically, it means dividing your time between leisure and work. This involves prioritising between ‘work’ (career and ambition) and on the other hand, ‘life’ (health, pleasure, leisure, family and spiritual development). For example, a career woman could maintain a work life balance while preparing dinner before going to work and warm-up the food upon returning from work so that she can spend more quality time with family and children. Some of the attributes of work-life balance include:
Flexible Working
Offers a range of flexible working and part-time working arrangements such as extended lunch break to enable care of elderly relatives, variable hours to enable staff to complete school pick-up and a gradual change in hours to facilitate the return to full-time working for parents of young children.
Maternity and Childcare
• Recruit a dedicated childcare and work life balance adviser to provide specialist guidance to staff and students to help them find appropriate childcare solutions or working practices to suit their individual family circumstances.
• Create a support group to link women planning maternity leave with those who had recently returned from maternity.
• Allow maternity leavers with research grants to go on sabbatical while the faculty employs research assistant from the grant as temporary teaching staffs.
• Ensure lighter teaching and administrative loads for women returning from maternity leave to enable them to achieve a work life balance and re-establish their research base.
• Provide one term of sabbatical leave without teaching commitments for research-active academicians returning from maternity, extended career or long-term sickness leave. This leave will accomodate staff to re-establish their research activity.
• Develop a childcare package that includes after-school and long holiday provision.• Give all staff with caring responsibilities, the opportunity to apply for unpaid leave under a career
break policy in addition to maternity and paternity leave entitlements.
Homeworking / Teleworking
The main advantages to employers of having employees who work from home are potential savings in accommodation plus the possibility of recruiting and retaining experienced staff. Working from home offers employees greater flexibility in the organisation and control of their work, make it easier to combine work and domestic responsibilities and provide savings in time and cost of travelling.
Issues that should be considered by the management are:
• Whether staff is able to apply to work from home all the time or some of the time;• The provision of office equipment;• Any payment for other costs of working from home;

219Productivity Report 2011/2012
• Systems of communication and reporting;• How performance will be monitored;• Training needs; and• Health and safety assessments.
Job-sharing
Job sharing is used by employers as a way of offering reduced hours while maintaining the covering of a full-time post and thereby helping with the recruitment or retention of staff. For employees, job sharing is often a way of remaining in a relatively senior post while working part-time.
Issues to be considered when finding a job-share partner include:
• Decisions on dividing the hours and responsibilities of the post;• Communication and overlapping of job functions between the job share partners; and• What happens if one job share partner resign?

220 Productivity Report 2011/2012
Box 9.2: National Customer Satisfaction Index
Customer satisfaction index has been widely used by companies to gauge their performance in Malaysia. However, most of the time, it was done on an ad hoc basis. As the country is moving towards a high-income economy by 2020, it is vital to establish a National Customer Satisfaction Index (NCSI), at the macro economic level to complement the measurement of GDP. This NCSI also provides benchmarks with other countries in the quest towards competitiveness.
The Development of National Customer Satisfaction Index in Malaysia
Malaysia has adopted the American Customer Satisfaction Index (ACSI) methodology and framework in developing the national customer satisfaction index. The list of countries that have adopted the ACSI model include Barbados, Colombia, Great Britain, Indonesia, Mexico, Singapore, South Korea, Sweden and Turkey. The development of an international system of customer satisfaction measurement is based on a common methodology which provides opportunities for cross-national satisfaction benchmarking. As economic globalisation advances, the ability to compare companies across diverse national markets and even to compare the relative satisfaction performance of industries and sectors in different nations, will provide an essential tool for gauging national economic competitiveness.
Why do We Need CSI ?
People
- To manage quality of life in Malaysia.
- To educate people mindset towards better quality of product and services.
Nation
- To provide intangible productivity measures that complement economic indicators.
- To be able to benchmark wirh other countries towards competitiveness.
Business
- CSI has been conducted selectively but in isolation by organisations.
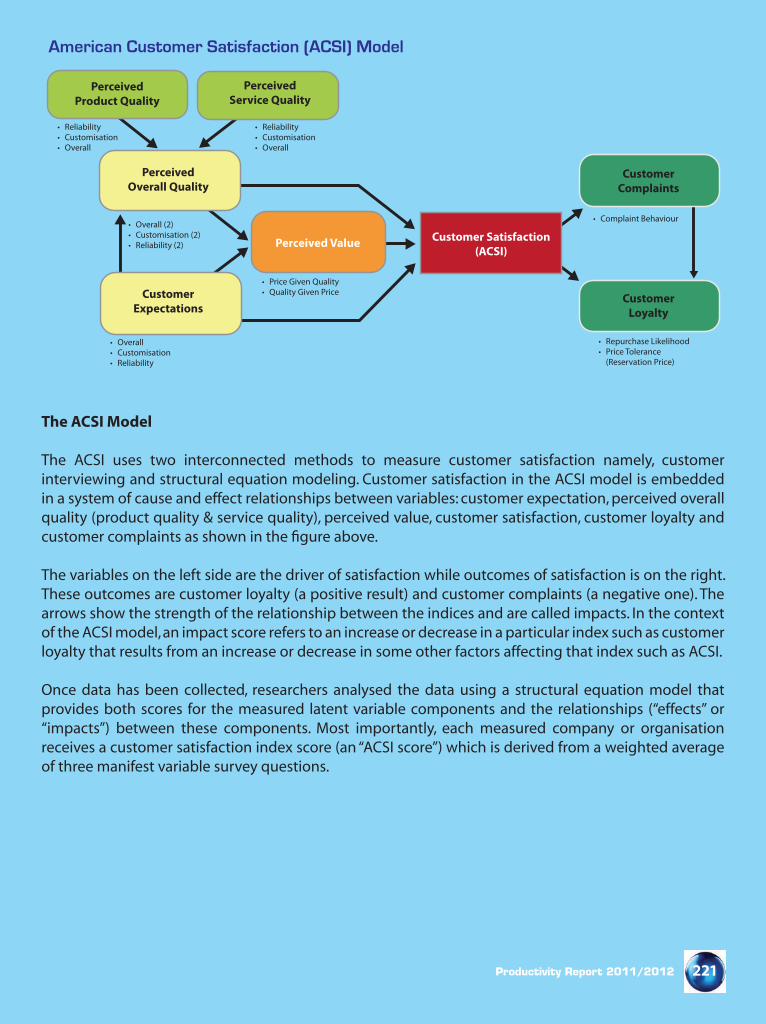
221Productivity Report 2011/2012
The ACSI Model
The ACSI uses two interconnected methods to measure customer satisfaction namely, customer interviewing and structural equation modeling. Customer satisfaction in the ACSI model is embedded in a system of cause and effect relationships between variables: customer expectation, perceived overall quality (product quality & service quality), perceived value, customer satisfaction, customer loyalty and customer complaints as shown in the figure above.
The variables on the left side are the driver of satisfaction while outcomes of satisfaction is on the right. These outcomes are customer loyalty (a positive result) and customer complaints (a negative one). The arrows show the strength of the relationship between the indices and are called impacts. In the context of the ACSI model, an impact score refers to an increase or decrease in a particular index such as customer loyalty that results from an increase or decrease in some other factors affecting that index such as ACSI.
Once data has been collected, researchers analysed the data using a structural equation model that provides both scores for the measured latent variable components and the relationships (“effects” or “impacts”) between these components. Most importantly, each measured company or organisation receives a customer satisfaction index score (an “ACSI score”) which is derived from a weighted average of three manifest variable survey questions.
• Overall• Customisation• Reliability
PerceivedOverall Quality
• Price Given Quality• Quality Given Price
• Overall (2)• Customisation (2)• Reliability (2)
• Reliability• Customisation• Overall
• Reliability• Customisation• Overall
CustomerExpectations
Perceived Value Customer Satisfaction(ACSI)
CustomerComplaints
CustomerLoyalty
PerceivedProduct Quality
PerceivedService Quality
• Complaint Behaviour
• Repurchase Likelihood• Price Tolerance (Reservation Price)
American Customer Satisfaction (ACSI) Model
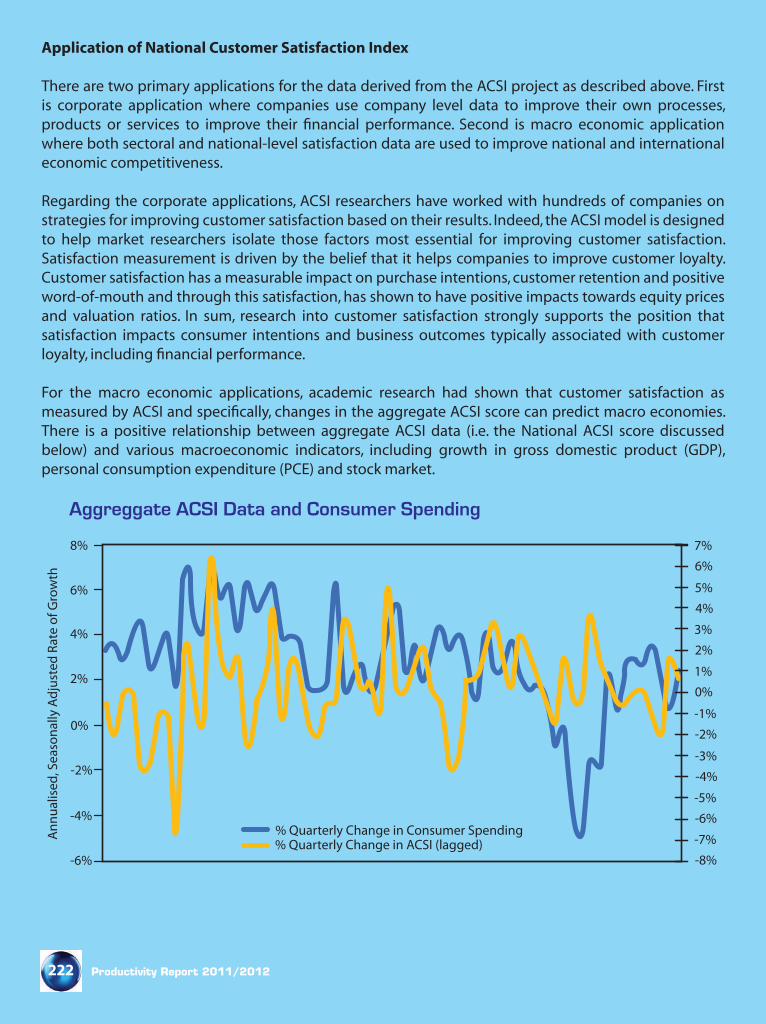
222 Productivity Report 2011/2012
Application of National Customer Satisfaction Index
There are two primary applications for the data derived from the ACSI project as described above. First is corporate application where companies use company level data to improve their own processes, products or services to improve their financial performance. Second is macro economic application where both sectoral and national-level satisfaction data are used to improve national and international economic competitiveness. Regarding the corporate applications, ACSI researchers have worked with hundreds of companies on strategies for improving customer satisfaction based on their results. Indeed, the ACSI model is designed to help market researchers isolate those factors most essential for improving customer satisfaction. Satisfaction measurement is driven by the belief that it helps companies to improve customer loyalty. Customer satisfaction has a measurable impact on purchase intentions, customer retention and positive word-of-mouth and through this satisfaction, has shown to have positive impacts towards equity prices and valuation ratios. In sum, research into customer satisfaction strongly supports the position that satisfaction impacts consumer intentions and business outcomes typically associated with customer loyalty, including financial performance.
For the macro economic applications, academic research had shown that customer satisfaction as measured by ACSI and specifically, changes in the aggregate ACSI score can predict macro economies. There is a positive relationship between aggregate ACSI data (i.e. the National ACSI score discussed below) and various macroeconomic indicators, including growth in gross domestic product (GDP), personal consumption expenditure (PCE) and stock market.
Ann
ualis
ed, S
easo
nally
Adj
uste
d Ra
te o
f Gro
wth
7%
6%
5%
4%
3%
2%
1%
0%
-1%
-2%
-3%
-4%
-5%
-6%
-7%
-8%
8%
6%
4%
2%
0%
-2%
-4%
-6%
% Quarterly Change in Consumer Spending% Quarterly Change in ACSI (lagged)
Aggreggate ACSI Data and Consumer Spending
223Productivity Report 2011/2012
Benefits of CSI can be examined from the following perspectives:
• Government There is a strong predictive relationship between customer satisfaction as measured by the
ACSI and consumer spending and GDP growth. A national customer satisfaction index scores is an economic indicator containing important information about the health and direction of a country’s economy.
• Company Subscribers to individual industry/company results learn key diagnostic and benchmarking
information about themselves and competitors. While the model itself is not detailed enough to drive specific improvement strategies, it provides an important roadmap for companies to tie to their consulting relationship as a way to drive improvement in customer satisfaction.
• Investors There is a strong linkage between a company’s customer satisfaction score and its financial
performance, for instance, revenue growth and stock value.
• Consumers Publication of customer satisfaction index showing scores for several high market share companies
in various consumer industries allows consumers to see who are the best providers of products and services in their economy which helps to shape their purchase and consumption decisions.


APPENDICES
APPENDIX A – PRODUCTIVITY
226
TERMINOLOGY AND DEFINITION
1. PRODUCTIVITY is the relationship between the amount of output produced and the amount of input used to produce the output. Higher productivity means achieving more with the same or lesser amount of input resources. Increase in productivity will lead to benefits such as higher standard of living, enhanced competitiveness and better quality of life.
2. Total Factor Productivity (TFP) TFP measures the efficiency of the utilisation of both capital and human resources. It is also regarded
as a measure of the degree of technological advancement associated with economic growth. Higher TFP growth indicates efficient utilisation and management of resources, materials and inputs necessary for the production of goods and services.
At the national level, Total Factory Productivity (TFP) growth reflects the portion of the growth in the Gross Domestic Product (GDP) other than growth in inputs such as employment, capital investment and natural resources.
At the firm level, TFP growth implies the upgrading of skills and technical manpower, application of technology and creation of new technologies, adoption of best management practices and institutionalised corporate culture and work ethics.
3. Added Value Added value measures the wealth generated by collective efforts of those who work in an enterprise
(the employees) and the capital providers for example, investors and shareholders. Added value is different from sales revenue or value of production because it does not include the wealth created by the suppliers to the enterprise.
Methods of Added Value Calculation There are two ways added value can be calculated:
i. Addition Method This is called the wealth distribution method.
Added Value = Labour Cost + Interest + Tax + Depreciation + Profit
It is called wealth distribution because the added value created is used to pay those who have contributed to its creation in terms of wages & salaries (labour cost) for the employees, interest and loan for capital providers, taxes to the Government, depreciation for capital equipment usage and profits to the owners.

APPENDIX A – PRODUCTIVITY
227
ii. Subtraction Method This is called the wealth creation method.
Added Value = Total Output less Bought-In Materials and Services (BIMS)
In order to produce goods or services, a company has to purchase the necessary raw materials and other inputs. The difference between the total value of output and total cost of inputs i.e. all inputs and services bought from another company is called added value.
4. Total Output (TO) It is defined as value of products manufactured (ex-factory value) + value of construction work
done + change in Work-In-Progress (WIP) + capital expenditure on own construction + income from services rendered + income from sales of goods purchased in same condition.
5. Total Input (TI) It is defined as value of materials consumed + value of supplies consumed + cost of printing +
cost of goods sold in same condition + water + electricity + fuels + lubricants + supplies + salaries and wages + fees paid to non-working directors + payments to contractors + payment in kind to paid employees + value of free wearing apparel + employer’s contribution to Government funds + payments for industrial work done by others + payments for non-industrial services + interest charges + depreciation + indirect taxes.
6. Labour Cost (LC) It is defined as payments in the form of gross salaries and wages, bonuses, and other cash allowances
paid to employees + allowances, fees, bonuses and commissions paid to working directors + fees paid to non-working directors for their attendance at the Board of Directors’ meetings + payments in kind to paid employees + value of free wearing apparel provided + employer’s contribution to Government funds.
7. Bought-In Materials And Services (BIMS) It is defined as Bought-In Materials plus Bought-In Services where Bought-In Materials is the value of
materials consumed in production (including transport charges incurred and taxes and duties paid on the materials); while Bought-In Services is the value of supplies consumed such as packaging materials, consumable stores (including stationery and office supplies, materials for repairs and maintenance) + cost of printing + lubricants + cost of goods sold in same condition as purchases + water + electricity + fuels + payments to contractors + payments for industrial work done by others + supplies + payments for non-industrial services.

APPENDIX A – PRODUCTIVITY
228
8. Productivity Indicators The followings are the productivity indicators mentioned in this Report.
8.1 Labour Competitiveness8.2 Labour Productivity8.3 Capital Productivity8.4 Capital Intensity8.5 Process Efficiency8.6 Added Value Content
8.1 Labour Competitiveness Competitiveness in terms of labour cost indicates the comparability of the industry in producing
products or services at the lowest possible labour cost. Three competitiveness ratios which include Added Value per Labour Cost, Labour Cost per Employee and Unit Labour Cost are explained below:

APPENDIX A – PRODUCTIVITY
229
8.2 Labour Productivity It can be used as one of the ways of gauging the productivity performance of the industry. The
commonly used indicator is Added Value Per Employee.

APPENDIX A – PRODUCTIVITY
230
8.3 Capital Productivity Capital productivity indicates the degree of utilisation of fixed assets and how efficient these
assets are being utilised. It is defined as Added Value generated per Ringgit of Fixed Assets. High ratio indicates better performance of the assets.
8.4 Capital Intensity Capital intensity measures the amount of fixed assets allocated to each employee. It is also
known as Fixed Assets per Employee or simply capital-to-labour ratio. This ratio measures whether an industry is relatively capital-intensive or labour-intensive.

APPENDIX A – PRODUCTIVITY
231
8.5 Process Efficiency Process Efficiency measures how efficient the business utilises its own resources namely, labour,
plant and machinery and capital to generate Added Value while minimising the bought-in materials and services.
8.6 Added Value Content Added value content measures the proportion the Added Value to Total Output. A high
Value Content indicates efficient utilisation of resources resulting in more added value being generated.

APPENDIX B – INNOVATION
232
TERMINOLOGY AND DEFINITION
INNOVATION is a wide concept and can be interpreted in many ways. Innovation adds values to products and services, stimulating sales growth, exploiting new markets and formulating new organisational methods. Hence there are different perspectives of innovation namely,
• Product Innovation involves new products and new characteristics of old product; process may be the same but the product has completely changed;
• Process Innovation entails a new or significantly improved production or delivery method;• Marketing Innovation is concern with creating a new marketing method incorporating significant
changes in product design or packaging product placement, product promotion or pricing; and• Organisational Innovation involves introducing new organisational methods in the firm’s business
practices, workplace or external relations.
The input to any innovation begins with ideas depending upon the pool of ideas available and the ability to generate new ideas and the ability to reintroduce new products, services and processes. Ideas and innovations within the organisational context are contributions made with the objective of improving the operations of the organisation.
Creativity is the process of developing new or interesting ideas, while innovation is the implementation and transformation of those ideas into valuable or profitable solutions. Innovation finds the value in creativity, so innovation is really about how organisations can profit from their ideas.
Source : SMART Innovation by Vadim Kotelnikov, Inventor & Founder, Ten 3 Business e-Coach.www.100ventures.com, (2001)
- Synergistic marketing and selling- Customer value creation/CRM- Di�erentiation strategies
- New product types- New product design- New product metrics
- Sustaining competitive advantage- Competitive strategies- Strategies alliance
- Process thinking- Aligning IT and business- Business process outsourcing- Managing innovation
- Towards K-workers and knowledge-driven organisation- Team culture- Entrepreneurial creativity
- Radical versus Incremental
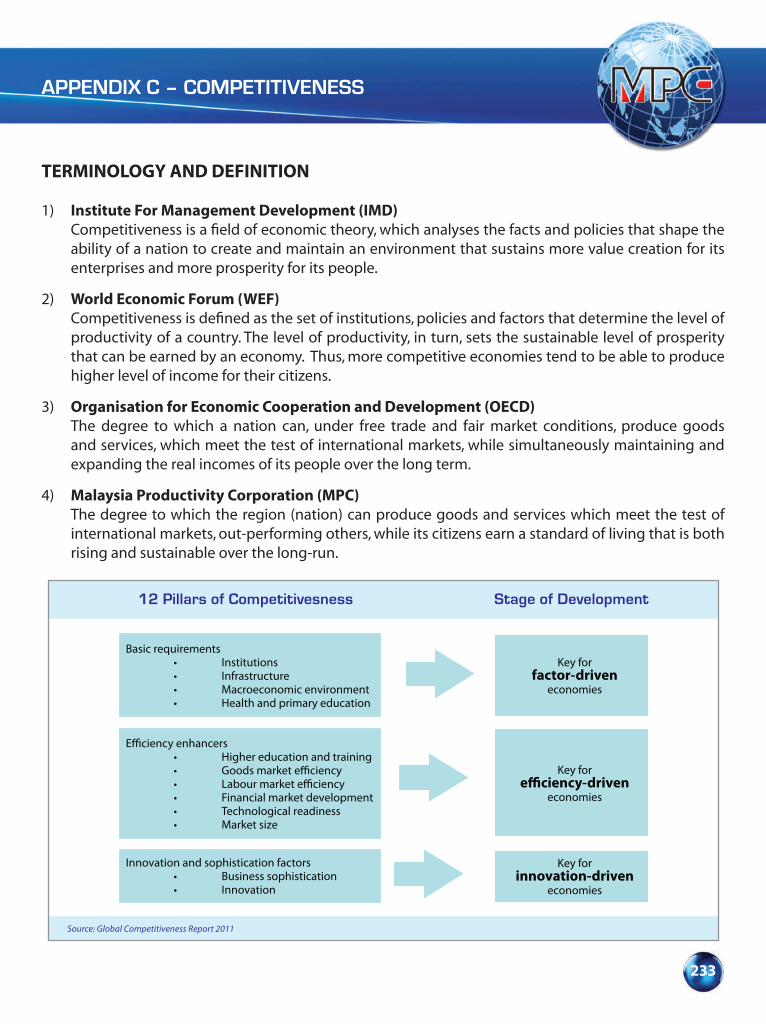
APPENDIX C – COMPETITIVENESS
233
TERMINOLOGY AND DEFINITION
1) Institute For Management Development (IMD) Competitiveness is a field of economic theory, which analyses the facts and policies that shape the
ability of a nation to create and maintain an environment that sustains more value creation for its enterprises and more prosperity for its people.
2) World Economic Forum (WEF) Competitiveness is defined as the set of institutions, policies and factors that determine the level of
productivity of a country. The level of productivity, in turn, sets the sustainable level of prosperity that can be earned by an economy. Thus, more competitive economies tend to be able to produce higher level of income for their citizens.
3) Organisation for Economic Cooperation and Development (OECD) The degree to which a nation can, under free trade and fair market conditions, produce goods
and services, which meet the test of international markets, while simultaneously maintaining and expanding the real incomes of its people over the long term.
4) Malaysia Productivity Corporation (MPC) The degree to which the region (nation) can produce goods and services which meet the test of
international markets, out-performing others, while its citizens earn a standard of living that is both rising and sustainable over the long-run.
Basic requirements • Institutions • Infrastructure • Macroeconomic environment • Health and primary education
Innovation and sophistication factors • Business sophistication • Innovation
• Higher education and training • Goods market e�ciency • Labour market e�ciency • Financial market development • Technological readiness • Market size
Key forfactor-driven
economies
Key forinnovation-driven
economies
Key for
economies
Source: Global Competitiveness Report 2011
12 Pillars of Competitivesness Stage of Development

234
Stage of development
1) Factor-Driven Economies – Basic factor conditions such as low-cost labour and unprocessed natural resources are the dominant basis of competitive advantage and exports. Factor driven economies are highly sensitive to world economic cycles, commodity prices, and exchange rate fluctuations.
2) Efficiency-Driven Economies – A country’s advantage comes from producing more advanced products and services highly efficiently. Heavy investment in efficient infrastructure, business friendly government administration, strong investment incentives, improving skills and better access to investment capital allow major improvements in productivity.
3) Innovation-Driven Economies – The ability to produce innovative products and services at the global technology frontier using the most advanced methods becomes the dominant source of competitive advantage. An innovation driven economy is characterised by distinctive producers and a high share of services in the economy and is quite resilient to external shocks.
APPENDIX C – COMPETITIVENESS

235
APPENDIX D – REGULATORY REVIEW
TERMINOLOGY AND DEFINITION
Australian Government Productivity CommissionThe Australian Government Productivity Commission (AGPC) constitutes the Australian Government’s independent research and advisory body on a range of economic, social and environmental issues affecting the welfare of Australian citizens. It reviews existing regulations and undertakes comprehensive research on important policy issues, for instance, identifying the drivers or factors influencing productivity and trade regulations.
Business LicensingBusiness licensing is a term that is normally used to describe an ex-ante process of approval for a firm’s core business activity. In the context of regulatory review, business licensing is a process of approving a firm’s core business activity prior to the official granting of a business license to commence operation.
Business Licensing Electronic Support SystemBusiness Licensing Electronic Support System (BLESS) is a portal that provides information and facilitates companies to apply licenses or permits to start operating business in Malaysia. It is a virtual One-Stop Service Centre that assists companies to obtain business licenses on a timely and organized manner. BLESS is developed and administered by the Implementation Coordination Unit (ICU), Prime Minister’s Department, Malaysia.
Business Process Re-engineeringBusiness process re-engineering (BPR) refers to the analysis and design of workflows, processes, business process redesign, business transformation or business process change management.
Code of practiceCode of practice is simply a set of rules specifying appropriate conduct or behavior for certain aspects of business. Generally, the set of rules are not mandatory or compulsory. However, in certain countries (for example United Kingdom), code of practice refers to a set of formally binding rules issued by a body of an agency and they are known as mandatory codes of conduct.
Compliance costsCompliance costs are basically the direct additional costs to businesses for undertaking the various tasks associated to complying with government regulations. They are not just merely the direct charges or fees imposed by the government but also include any costs arising from the necessity of having to comply with the regulations concerned, for example facilitating inspection.
APPENDIX D – REGULATORY REVIEW

236
ConsultationConsultation is a systematic public engagement which involves seeking, receiving, analysing and responding to feedback from stakeholders or affected parties including the general public. Public consultation gives citizens and business the opportunity to provide an active input in regulatory decisions.
Gate-keeperRegulatory burden is the regulatory costs incurred by businesses when applying for licenses, filling up forms as well as when reporting and meeting notification requirements for the government. It also includes the payment of certain fees or investment in specific equipment as well as the administrative compliance costs encompassing time and money spent on formalities and paperwork necessary for compliance with regulations. In other words, administrative burdens are the costs incurred by businesses when complying with obligatory information arising from government regulations.
Good Regulatory Practices Good regulatory practices (GRP) can be defined as a set of principles which is intended to provide guidelines to regulatory management. Generally, it is intended to assist regulators in the adoption of efficient regulatory arrangements which should improve the consistency and transparency of regulations which will be introduced or reviewed. Therefore, the main goal of GRP is to ensure quality regulation whereby it meets the desired objectives as well as minimise costs and market distortions.
International Good Regulatory Practices.The core principle of Guillotine Approach specifies that any regulation required for future policy needs for market-led development, which is not successfully justified as legal will be eliminated. Besides, it also specifies that any regulation that is needed but not business-friendly will be simplified as far as possible. The Guillotine Approach was pioneered by Sweden in the 1980s and was subsequently used in various forms by Hungary, South Korea, and Mexico.
National Development Planning CommitteeThe National Development Planning Committee (NDPC) is the highest policy-making forum for development planning that deliberates economic and socio-economic matters in Malaysia. The NDPC is a committee of senior government officials, chaired by the Chief Secretary to the Government. Heads of all economic development ministries, including the Governor of the Central Bank, are members of this Committee. The NDPC is responsible for formulating and reviewing all plans for national development and making recommendations on the allocation of resources. It also oversees the implementation of the national development plans.
APPENDIX D – REGULATORY REVIEW
237
APPENDIX D – REGULATORY REVIEW
National Policy on the Development and Implementation of RegulationsThe National Policy on the Development and Implementation of Regulations is meant to address the gaps in the management system for regulations to put Malaysia in a position to meet international best practices in regulations or Good Regulatory Practices (GRP). Therefore, the objective of the Policy is to ensure that the Malaysia’s regulatory regime effectively supports the country’s aspirations to be a high-income and progressive nation whose economy is competitive and subscribes to sustainable development and inclusive growth. The Policy is developed through a consultative process which involves a range of stakeholders within the government.
Non-RegulationNon-regulation is a regulatory control exercised by individual businesses or industry associations without government involvement or interference. Non-regulation option should be considered whenever:• There is no strong public interest concern, especially no major public health and safety concern;• The problem is a low-risk event with minimal impact or insignificance; and• The problem can be fixed by the market itself. For instance, there may be an incentive such as industry
survival or market advantage for individuals and groups to develop and comply with self-regulatory arrangements.
One-Stop-Centre“One-Stop-Centre” is a tool to improve regulatory access. Through this tool, government authorities provide accessibility to many regulatory services in a single physical location. One-Stop-Centre is cost-effective for small and medium size enterprises (SMEs) whereby their transition costs related to regulation are relatively high.
PermitPermit is a regulatory tool that authorizes actions related to the core business activities. For example, an authorization to complete a single instance of an activity ( to build a warehouse).
Regulatory burdenRegulatory burdens are the regulatory costs incurred by businesses when applying for licenses, filling up forms as well as when reporting and meeting notification requirements for the government. It also includes the payment of certain fees or investment in specific equipment as well as the administrative compliance costs encompassing time and money spent on formalities and paperwork necessary for compliance with regulations. In other words, administrative burdens are the costs incurred by businesses when complying with obligatory information arising from government regulation.
APPENDIX D – REGULATORY REVIEW
238
Regulatory Impact AnalysisRegulatory Impact Analysis (RIA) is a process or technique in determining the impact of regulatory review. RIA is used to examine selectively the potential impacts arising from government action or non-action as well as to disseminate the information to decision-makers and the public. RIA is also known as Regulatory Impact Assessment.
Regulatory Impact StatementRegulation Impact Statement (RIS) is vital to the Regulatory Impact Analysis (RIA) process. The RIS is a government agency document which is different from a Cabinet paper that represents a minister’s document. It provides a summary of the agency’s best advice to its Minister and Cabinet on the problem definition, objectives, identification and analysis of the full range of practical options, as well as information on implementation arrangements. Whereas, the Cabinet paper presents the Minister’s advice or recommendations to Cabinet.
ReviewReview or revision clause refers to a provision in regulation that requires a review to be conducted within a certain period, but however the outcome in terms of status quo, revision or repeal is not pre-determined.
SimplificationSimplification refers to measures that reduce administrative burdens in dealing with government regulations, which are paperwork and informational requirements imposed by governments on enterprises, citizens and the civil service.
TransparencyTransparency is a key pillar of effective regulation. It sustains confidence in the legal environment, making regulations more secure and accessible, less influenced by special interests, and thus more open to competition, trade and investment. This incudes public engagement.
APPENDIX D – REGULATORY REVIEW
239
APPENDIX E – TECHNICAL NOTES
TERMINOLOGY AND DEFINITION
Employees (ILO)Employees are all those workers who hold the type of job defined as paid employment jobs. Employees with stable contracts are those employees who have had, and continue to have, an explicit (written or oral) or implicit contract of employment, or a succession of such contracts, with the same employer on a continuous basis.
Employers (ILO)Employers are those workers who, working on their own account or with one or a few partners, hold the type of job defined as a self-employed job, and in this capacity, on a continuous basis (including the reference period) have engaged one or more persons to work for them in their business as employees.
Foreign Direct Investment (FDI)Foreign direct investment (FDI) is the category of international investment that reflects the objective of a resident entity in one economy to obtain a lasting interest in an enterprise resident in another economy.
Gross Domestic Product (GDP)Gross domestic product is the sum of gross value added by all resident producers in the economy plus any product taxes and minus any subsidies not included in the value of the products. It is calculated without making deductions for depreciation of fabricated assets or for depletion and degradation of natural resources. The total market value of all final goods and services produced in a country in a given year; equals total consumer, investment and government spending, plus the value of exports minus the value of imports.
Gross National Income (GNI)Gross national income (GNI) (formerly gross national product, or GNP) is the sum of gross value added by all resident producers plus any product taxes (less subsidies) that are not included in the valuation of output plus net receipts of income from abroad.
InflationBroad increased in prices. In practical terms, inflation means goods and services are being valued as more desirable than money. This also affects wages; periods of high inflation tend to be marked by increases in average income. Inflation can be caused by either too few goods offered for sale, or too much money in circulation.
APPENDIX E – TECHNICAL NOTES
240
APPENDIX E – TECHNICAL NOTES
Interest paymentInterest is payable by units that incur certain kinds of liabilities, namely deposits, securities other than shares, loans and accounts payable. Including interest to non-residents, to residents other than general government and to other general government units.
Real GDP GrowthConstant price estimates. In theory, the price and quantity components of a value may be identified and base periods prices are substituted for those of the current period. Methods are used in practice to calculate variables at constant prices. Another method, commonly referred to as price deflation, involves dividing price indexes into the observed values to obtain volume estimates. The price indexes used are constructed from prices of the major items of each value.
Total labour forceThe total labour force, or currently active population, comprises all persons who fulfill the requirements for inclusion among the employed or the unemployed during a specified brief reference period.
UnemploymentUnemployment is defined as people who are jobless, looking for jobs, and available for work. Unemployed persons comprise persons aged 15 to 64 who were: without work during the reference week, i.e. neither had a job nor were at work (for one hour or more) in paid employment or self-employment; currently available for work, i.e. were available for paid employment or self-employment before the end of the two weeks following the reference week; actively seeking work, i.e. had taken specific steps in the four weeks period ending with the reference week to seek paid employment or self-employment or who found a job to start later, i.e. within a period of at most three months.
Linkages and Multiplier Approach We measure the Malaysian economic development by employing interindustry I-O based production model that includes linkages and multiplier approach. Linkages measure interconnectedness of sectoral link, where multiplier measures the effect when a unit of increment of “autonomous” investment causes an initial increase in income which generates successive rounds of consumer spending and incomes, each round producing numerically smaller increments until the process worked itself out, i.e. has reached its equilibrium. It summarize the total impact that can be expected from changes in a given economic activity. For instance, a new manufacturing facility and an increase in export by a local firm are economic changes which can spur ripple effects or spin-off activities. Multipliers measure these impacts generally on how much inputs to be used to produce a certain unit of output.
241
APPENDIX E – TECHNICAL NOTES
Output MultiplierOutput multiplier is a measure of a weighted average of all sector’s ouput multiplier and describes an increase in the economy’s overall output resulting from a Ringgit increase in final demand, assuming ceteris paribus. It describes initially an increase in inputs after many rounds of effects comprising direct, indirect and induced effects produced an increased output effects.
Income MultiplierIncome multipliers is the weighted average of all sector’s salaries and wages multipliers and it describes and increase in overall salaries and wages resulting from a Ringgit increase in final demand. With additional employment in sectors that generate the economy more goods and services can be yielded. This will in turn churned more output which can be marketed in the domestic market and exported which will increase the country’s income. Thus, the higher the employment multiplier the higher output level and spin as a catalyst for economic development of the country.
Employment MultiplierThe overall employment multiplier is a weighted average of all sector’s employment in the economy and describe an increase in employment resulting from a particular output of a thousand Ringgit increase in the final demand quadrant. Thus, if an output of one industry expanded it generated more than its initial impact from an impact such as increase in investment.
APPENDIX E – TECHNICAL NOTES
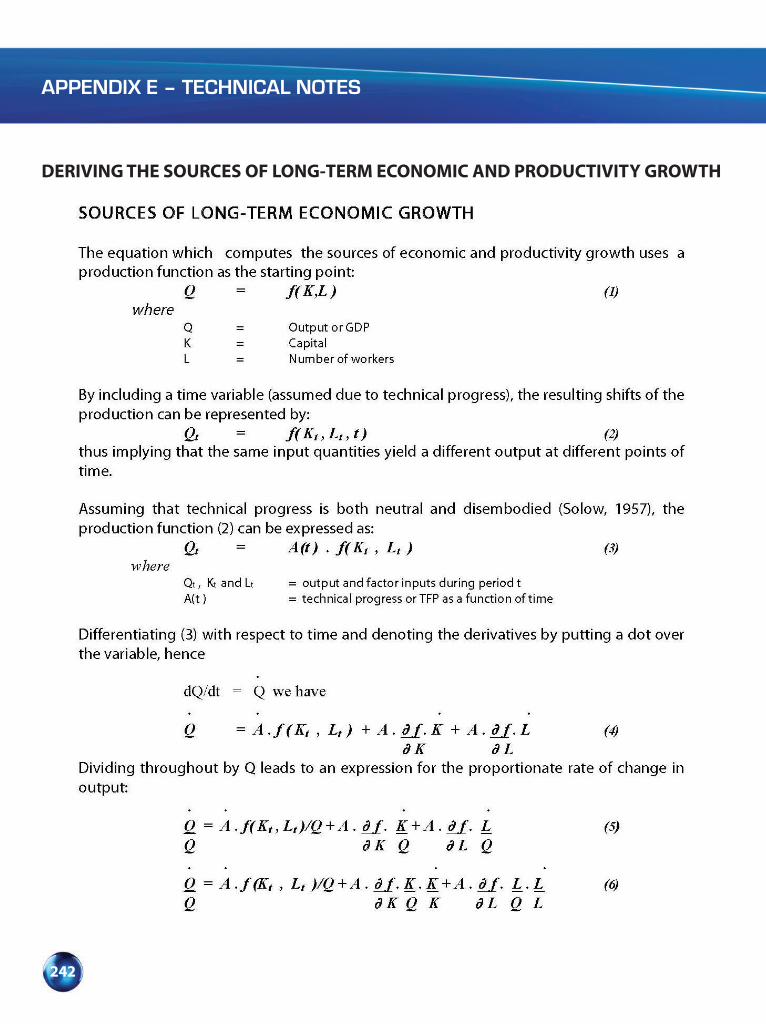
242
APPENDIX E – TECHNICAL NOTES
DERIVING THE SOURCES OF LONG-TERM ECONOMIC AND PRODUCTIVITY GROWTH

243
APPENDIX E – TECHNICAL NOTESAPPENDIX E – TECHNICAL NOTES
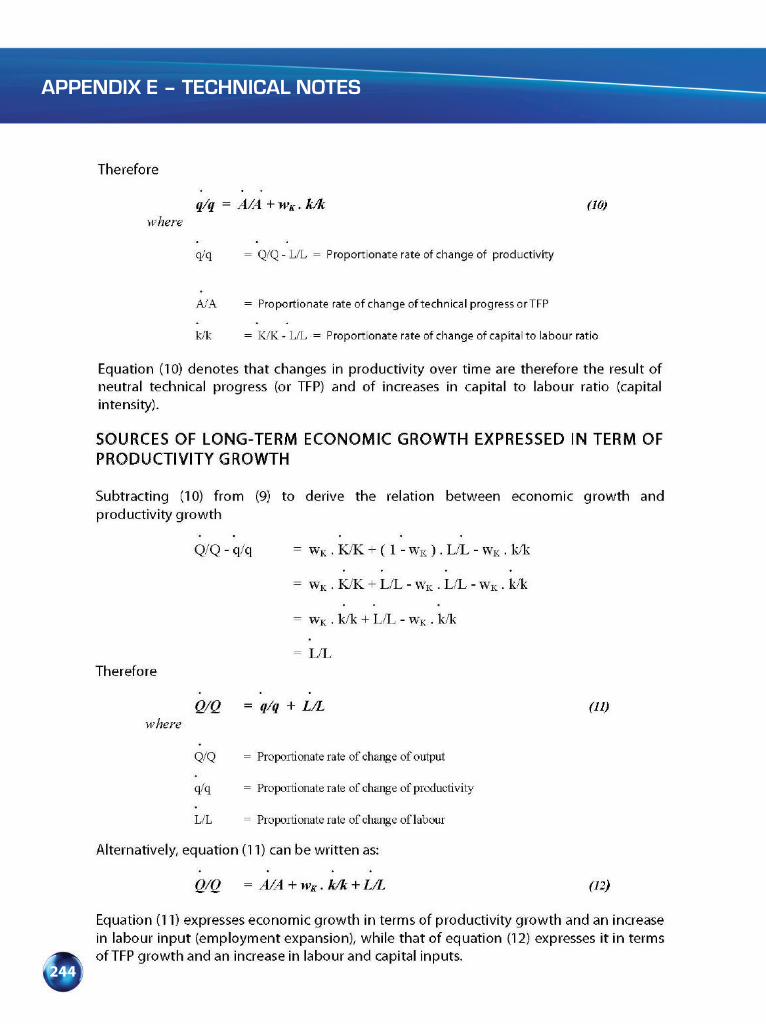
244
APPENDIX E – TECHNICAL NOTES
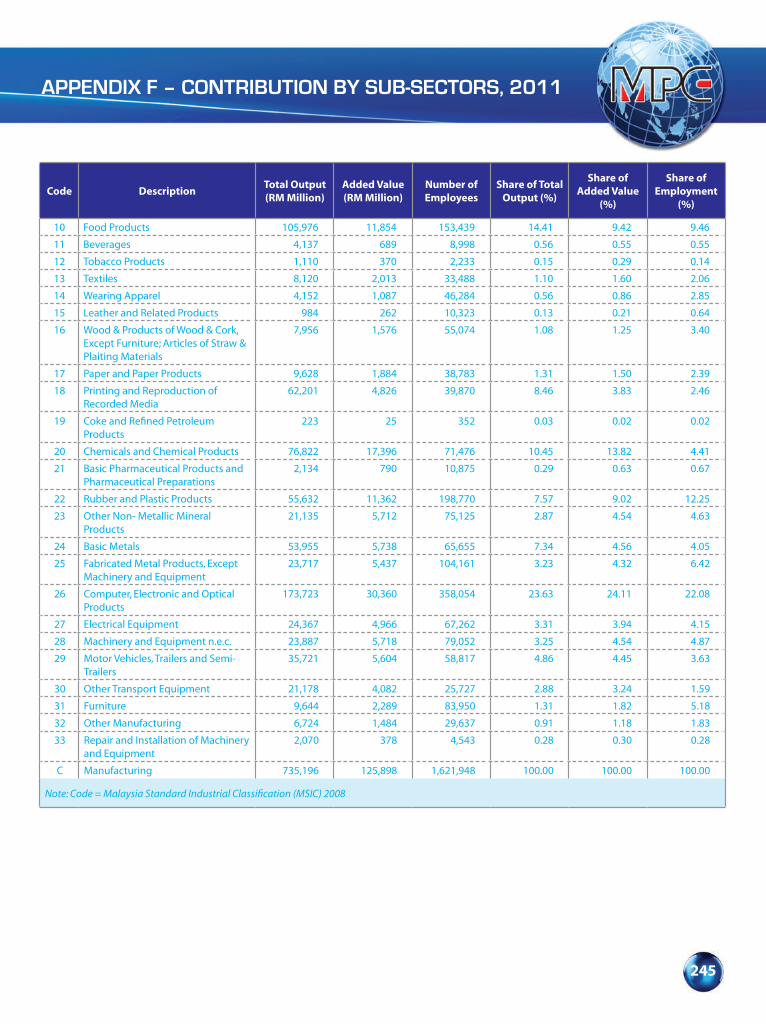
245
APPENDIX F – CONTRIBUTION BY SUB-SECTORS, 2011
Code DescriptionTotal Output (RM Million)
Added Value (RM Million)
Number of Employees
Share of Total Output (%)
Share of Added Value
(%)
Share of Employment
(%)
10 Food Products 105,976 11,854 153,439 14.41 9.42 9.46
11 Beverages 4,137 689 8,998 0.56 0.55 0.55
12 Tobacco Products 1,110 370 2,233 0.15 0.29 0.14
13 Textiles 8,120 2,013 33,488 1.10 1.60 2.06
14 Wearing Apparel 4,152 1,087 46,284 0.56 0.86 2.85
15 Leather and Related Products 984 262 10,323 0.13 0.21 0.64
16 Wood & Products of Wood & Cork, Except Furniture; Articles of Straw & Plaiting Materials
7,956 1,576 55,074 1.08 1.25 3.40
17 Paper and Paper Products 9,628 1,884 38,783 1.31 1.50 2.39
18 Printing and Reproduction of Recorded Media
62,201 4,826 39,870 8.46 3.83 2.46
19 Coke and Refined Petroleum Products
223 25 352 0.03 0.02 0.02
20 Chemicals and Chemical Products 76,822 17,396 71,476 10.45 13.82 4.41
21 Basic Pharmaceutical Products and Pharmaceutical Preparations
2,134 790 10,875 0.29 0.63 0.67
22 Rubber and Plastic Products 55,632 11,362 198,770 7.57 9.02 12.25
23 Other Non- Metallic Mineral Products
21,135 5,712 75,125 2.87 4.54 4.63
24 Basic Metals 53,955 5,738 65,655 7.34 4.56 4.05
25 Fabricated Metal Products, Except Machinery and Equipment
23,717 5,437 104,161 3.23 4.32 6.42
26 Computer, Electronic and Optical Products
173,723 30,360 358,054 23.63 24.11 22.08
27 Electrical Equipment 24,367 4,966 67,262 3.31 3.94 4.15
28 Machinery and Equipment n.e.c. 23,887 5,718 79,052 3.25 4.54 4.87
29 Motor Vehicles, Trailers and Semi-Trailers
35,721 5,604 58,817 4.86 4.45 3.63
30 Other Transport Equipment 21,178 4,082 25,727 2.88 3.24 1.59
31 Furniture 9,644 2,289 83,950 1.31 1.82 5.18
32 Other Manufacturing 6,724 1,484 29,637 0.91 1.18 1.83
33 Repair and Installation of Machinery and Equipment
2,070 378 4,543 0.28 0.30 0.28
C Manufacturing 735,196 125,898 1,621,948 100.00 100.00 100.00
Note: Code = Malaysia Standard Industrial Classification (MSIC) 2008
MPC BOARD OF DIRECTORS
246
CHAIRMAN
Y. Bhg. Tan Sri Azman Hashim AmBank Group
DEPUTY CHAIRMAN
Y. Bhg. Dato’ Nik Rahmat Nik Taib Ministry of International Trade and Industry
MEMBERS
Y. Bhg. Tan Sri Dato’ (Dr.) Ir. Wan Abdul Rahman Minconsult Sdn. Bhd.Hj. Wan Yaacob
Y.Bhg. Prof. Tan Sri Dato’ Dzulkifli Abdul Razak Universiti Sains Malaysia
Y. Bhg. Tan Sri Datuk Mustafa Mansur Federation of Malaysian Manufacturers
Y. Bhg. Dato’ Azman Shah Dato’ Seri Harun Antara Holiday Villas Sdn. Bhd.
Y. Bhg. Dato’ Seri Zainal Rahim Seman Ministry of Human Resource
Y. Bhg. Dato’ Mohd Hashim Abdullah Ministry of Agriculture and Agro-based Industry Y. Bhg. Datuk Abang Haji Abdul Karim Sarawak Chamber of Commerce and Industry (SCCI) Tun Abang Haji Openg
Y. Bhg. Datin Yasmin Ahmad Merican Trax Associates Sdn. Bhd.
Mr. Muhamad Abd. Rahaman Economic Planning Unit
Mr. Zamzuri Abdul Aziz Mnistry of Finance
Mr. A. Balasubramaniam MalaysiaTrade Union Congress
Mr. Mohd Razali Hussain Malaysia Productivity Corporation

247
MPC CONSULTATIVE PANELS
CONSULTATIVE PANEL FOR AGRICULTURE
CHAIRMAN
Y. Bhg. Dato’ Sabri Ahmad Felda Global Ventures Holdings Sdn. Bhd.
MEMBERS
Y. Bhg. Dato’ Lee Yeow Chor IOI Corporation BerhadY. Bhg. Dato’ Hj. Aliasak Haji Ambia National Association of Smallholders MalaysiaY. Bhg. Prof. Mad Nasir Shamsudin Universiti Putra MalaysiaMr. Muhammad Salimi bin Sajiri Ministry of Agriculture & Agro-Based IndustryMr. Wan Darman Wan Abdullah Department of AgricultureMs. Normah Omar MARDIMr. Muhammad Arif Hj. Ariffin TH Plantations Sdn. Bhd.Mr. Mustamir Mohamad Sime Darby Plantation Sdn. Bhd.Mr. Mohd Azizul Azmi Bank Pertanian Malaysia Berhad (Agrobank)Mr. Chua Piak Chwee International Tropical Fruits Network (TFNet)
CONSULTATIVE PANEL FOR CONSTRUCTION
CHAIRMAN
Y. Bhg. Tan Sri Dato’ (Dr.) Ir. Wan Minconsult Sdn. Bhd.Abdul Rahman Hj. Wan Yaacob
MEMBERS
Y. Bhg. Dato’ Hj. Mokhtar Samad Malay Contractors Association Malaysia Y. Bhg. Dato’ Sri Ir. Dr. Judin Abdul Karim Construction Industry Development Board Y. Bhg. Dato’ Ng Kee Leen Master Builders Association Malaysia (MBAM)Y. Bhg. Dato’ Tan Gim Foo IJM Corporation BerhadProf. Dr. Ahmad Farhan Mohd Sadullah Universiti Sains MalaysiaIr. Hj. Mohd Mazlan Mohd Ismail Merican Institute of Engineers Malaysia (IEM)Ar. Lim Pay Chye Malaysian Institute of ArchitectsMr. Mohd Uzir Mahidin Department of Statistics

MPC CONSULTATIVE PANELS
248
CONSULTATIVE PANEL FOR CREATIVITY AND INNOVATION
CHAIRMAN
Y. Bhg. Prof. Tan Sri Dato’ Dzulkifli Abdul Razak Universiti Sains Malaysia
MEMBERS
Y. Bhg. Prof. Madya Dr. Dato’ Mohamed Universiti Pendidikan Sultan IdrisNajib Ahmad DawaY. Bhg. Datuk Ahmad Shukri Tajuddin Senai Hi-Tech ParkY. Bhg. Datuk Kamaruzaman Che Mat Bank Rakyat Y. Bhg. Dato’ Abd. Ghafar Mahmud Ministry of Education Y. Bhg. Dato’ Nik Zainiah Nik Abdul Rahman Ministry of International Trade and IndustryProf. Dr. Zainul Fadziruddin Zainuddin Universiti Sains Malaysia Dr. Sidney Yee Universiti Sains Malaysia Dr. Raslan Ahmad Malaysian Foundation for Innovation (YIM)Ms. Yasmin Mahmood Malaysian International Chamber of Commerce and Industry (MICCI)Mr. Misrun Timin Ministry of Science, Technology and Innovation (MOSTI)
CONSULTATIVE PANEL FOR HEALTHCARE
CHAIRMAN
Y. Bhg. Tan Sri Dato’ Dr. Abu Bakar Suleiman International Medical University
MEMBERS
Y. Bhg. Datuk Dr. Noor Hissam Abdullah Ministry of Health Y. Bhg. Puan Sri Datuk Dr. Suraiya Hani Hussein Malaysian Society for Quality in Health (MSQH)Y. Bhg. Dato’ Dr. Jacob Thomas Association of Private Hospitals of Malaysia (APHM)Y. Bhg. Prof. Dato’ Dr. Syed Mohamed Al –Junid UNU International Institute for Global HealthY. Bhg. Datin Paduka Siti Sa’diah Sheikh Bakir KPJ Healthcare BerhadY. Bhg. Prof. Madya Dr. Muhammad Kadar Marikar Malaysian Society for Quality in Health (MSQH)Dr. Mary Suma Cardosa Malaysian Medical Association (MMA) Dr. Ahmad Razid Salleh Ministry of HealthMr. Wan Latiff Wan Musa Malaysia External Trade Development CorporationMr. Mohd Rasli Muda Malaysian Industrial Development Authority

MPC CONSULTATIVE PANELS
249
CONSULTATIVE PANEL FOR TOURISM
CHAIRMAN
Y. Bhg. Dato’ Azman Shah Dato’ Seri Harun Antara Holiday Villas
MEMBERS
Y. Bhg. Datuk Mohd Ilyas Zainol Abidin Malaysia Association of HotelsY. Bhg. Dato’ Anthony Yeo Resorts World BerhadY. Bhg. Dato’ Mohd Khalid Harun Malaysia Association of Tour and Travel AgentsY. Bhg. Prof. Madya Dr. Za’faran bt Hassan Universiti Teknologi MARADr. Junaidah Lee Abdullah Ministry of TourismY.M. Engku Morris Engku Hussin Holiday Villa Hotels & ResortsMs. Azizah Ariffin Ministry of Human ResourceMr. Christopher Raj Shangri-La Hotel PutrajayaMr. Hisham Tan Abdullah The Malaysian Food and Beverage Executive AssociationsMs. Amutha Muniandy Sunway Resort Hotel & SpaMr. Mohd Nadzri Jelas Eastpine Sdn. Bhd.Mr. Shahruddin M Saaid Malaysian Association of Hotel OwnersMs. Zahriah Abdul Kadir Rangkaian Hotel Seri Malaysia Sdn. Bhd.Mr. Zulkifli Mat Said Tourism Malaysia
CONSULTATIVE PANEL FOR MANUFACTURING
CHAIRMAN
Y. Bhg. Dato’ Dr. Ir. Andy Seo Kian Haw Federation of Malaysian Manufacturers MEMBERS
Y. Bhg. Dato’ Dr. Ong Eng Long Kossan Rubber Industries BerhadMr. Nik Rahmat Nik Taib Ministry of International Trade and IndustryIr. Woo Mun Meng Enviri Industries Sdn. Bhd.Mr. A.H. Yong Toprank Corporation Sdn. Bhd.Mr. Chin Hon Meng Sun Rubber Industry Sdn. Bhd.Mr. Choy Ming Bil Expertise Resource AssociationMr. Mohd. Shafie BP Mammal National Union of Telecommunication Employee

MPC CONSULTATIVE PANELS
250
CONSULTATIVE PANEL FOR QUALITY OF WORK LIFE
CHAIRMAN
Y. Bhg. Tan Sri Ismail Adam Hay Group Sdn. Bhd.
MEMBERS
Y. Bhg. Tan Sri Datuk Yong Poh Kon Federation of Malaysian ManufacturersY. Bhg. Dato’ Seri Zainal Rahim Seman Ministry of Human ResourceY. Bhg. Dato’ Sri Abd. Ghafar Mahmud Ministry of EducationY. Bhg. Dato’ Azman Shah Dato’ Seri Harun Malaysian Employers FederationY. Bhg. Dato’ Prof. Dr. Rujhan Mustafa Ministry of Higher EducationMs. Liew Siew Lee Economic Planning UnitMr. Khoo Boo Seng Ministry of International Trade and Industry
251
Economic Planning Unit (EPU), Prime Minister Department
Department of Statistics, Malaysia
Faculty of Economics & Management, National University of Malaysia (UKM)
Faculty of Economics and Administration, University of Malaya
Members of Consultative Panel; and
Representatives from Industry Associations
PARTNERSHIP
252
MPC MANAGEMENT TEAM
DIRECTOR GENERAL Mr. Mohd Razali Husssain
DEPUTY DIRECTOR GENERAL I Mr. Ahmad Fadzil Mahmud
DEPUTY DIRECTOR GENERAL II Mr. Abdul Latif Abu Seman
SENIOR DIRECTORS Ms. Shahuren Ismail Ms. Lee Saw Hoon Mr. Ab. Rahim Yusoff
DIRECTORS Mr. Ab. Razak Omar Mr. Burhanuddin Saidin Ms. Chan Kum Siew Mr. Kamaruddin Mohamad Mr. Megat Akhbaruddin Megat Ismail Mr. Nik Mustafa Raja Salleh Dr. Rahmat Md. Smail Ms. Rauzah Zainal Abidin Mr. Zahid Ismail
SENIOR MANAGERS Mr. Aroni Mat Isa Mr. Kabir Ahmad Mohd Jamil Mr. Zaki Ibrahim Dr. M. Sugumaran Ms. Nor Aini Ab. Talib Dr. Roslina Md. Isa Ms. Roziana Hj. Othman Ms. Sharifah Normah Syed Omar Ms. Zainon Bakar
REGIONAL DIRECTORS Ms. Sarimah Misman Mr. Kamaruzzaman Kasim Ms. Norzirin Ariffin Mr. Suhaimy Abdul Talib Mr. Zainudin Hj. Elias
MPC CONSULTATIVE PANELS
253
HEADQUARTERS
Malaysia Productivity Corporation
Lorong Produktiviti, Jalan Sultan46200 Petaling JayaSelangor Darul Ehsan, Malaysia
Tel : 603-7955 7266/7955 7050/7955 7085Fax : 603-7957 8068/7955 1824/7958 1697Website : www.mpc.gov.myEmail : [email protected]
Malaysia Productivity Corporation(Petaling Jaya Office)
A-06-01, Level 6, Block A, PJ 8, No. 23, Jalan BaratSection 8, 46050 Petaling Jaya, Selangor, Malaysia
Tel : 603-7960 0173/7960 0176/7960 0178/ 7960 0191Fax : 603-7960 0211Email : [email protected]
MPC OFFICE ADDRESSES
MPC REGIONAL OFFICES
Malaysia Productivity Corporation(Northern Region Office)
Locked Bag 206, Jalan Bertam13200 Kepala Batas, Pulau Pinang, Malaysia
Tel : 604-575 4709Fax : 604-575 4410Email : [email protected]
Malaysia Productivity Corporation(Southern Region Office)
No. 8, Jalan Padi Mahsuri, Bandar Baru UDA81200 Johor Bahru, Johor, Malaysia Productivity CorporationTel : 607-237 7422/237 7644Fax : 607-238 0798Email : [email protected]
Malaysia Productivity Corporation(East Coast Region Office)
Level 7, Wisma TNB, Jln. Gambut25000 Kuantan, Pahang, Malaysia Productivity Corporation
Tel : 609-513 1788/513 1789Fax : 609-513 8903Email : [email protected]

254
Malaysia Productivity Corporation(Kelantan Office)
Level 3, Wisma PERKESO, Jalan Kota Darulnaim15538 Kota Bharu, Kelantan, Malaysia
Tel : 609-741 6260/741 6262Fax : 609-741 6263Email : [email protected]
Malaysia Productivity Corporation(Terengganu Office)
No. 23-03 KT Business Centre, Jalan Sultan MohamadPadang Hiliran, 21100 Kuala Terengganu, Terengganu, Malaysia
Tel : 609-622 8215Fax : 609-631 6010Email : [email protected]
MPC OFFICE ADDRESSES
Malaysia Productivity Corporation(Sabah Region Office)
Level 2, MAA Tower, No. 6, Lorong Api-Api 188000 Kota Kinabalu, Sabah, Malaysia
Tel : 6088-233 245/456/498Fax : 6088-242 815Email : [email protected]
Malaysia Productivity Corporation(Sarawak Region Office)
Lot 894, Lorong Demak Laut 3ADemak Laut Industrial Park93050 Kuching, Sarawak, Malaysia
Tel : 6082-439959/960Fax : 6082-439969Email : [email protected]
MPC CONSULTATIVE PANELS
255
REFERENCES
A. Kadir, et. al. (2005). Factors Affecting Construction Labour Productivity for Malaysian Residential Projects.
Building Futures Council (BFC) (2005). Measuring Productivity and Evaluating Innovation in the U.S. Construction Industry.
Chong Mek Zhin (2012). It’s a Bumper Harvest, The Star, 26 March.
The Economist Intelligence Unit’s Quality-of-Life Index: the World in 2005.
The Edge Financial Daily: Second Premium Outlets in the Pipeline, 5 December 2011.
Elshayeb, S.A., Hasnan, K., and Chua, Y.Y. (2010). Improving Supply Chain Traceability Using RFID technology. In: International Journal of Network and Mobile Technologies Vol.1 (1), p: 22-27.
The Global Competitiveness Report 2011- 2012. Geneva, Switzerland.
Haskell, Preston H. (2004) Construction Industry Productivity: its History and Future Direction.
Helble, M. (2010) WHO Bulletin. The Movement of Patients Across Borders: Challenges and Opportunities for Public Health.
IMD World Competitiveness Yearbook (2011). Lausanne, Switzerland.
Latin America and Caribbean Agriculture and Rural Development, LCSAR (2008), Agriculture for Development, 2008 World Development Report. Washington, World Bank.
Malaysia. Department of Statistics. Domestic Tourism Survey (2011).
Malaysia. Ministry of Finance. Economic Report (2010/2011). (Various Issues).
Malaysia. Prime Minister Department. Economic Transformation Programme Annual Report 2011 (2012).
Malaysia. Department of Statistics (2011). Monthly External Trade Statistics.
Malaysia. Prime Minister Department. Economic Transformation Programme (2010): a Roadmap for Malaysia.
Malaysia. Ministry of Finance. Economic Report 2011/2012.
Malaysia. Ministry of Finance (2011). Quarterly Malaysian Economy, Fourth Quarter.
Malaysia. Ministry of International Trade and Industry (2012). Malaysia External Trade Statistics.
Malaysia. Ministry of Education (2011). Education Statistics.

256
Malaysia. PIKOM Annual Report 2010/2011 (2012). The National ICT Association of Malaysia.
Malaysia. Ministry of International Trade and Industry. Third Industrial Master Plan (IMP3) 2006-2020.
Malaysia. Ministry of Tourism. (2011). Tourism Arrivals to Malaysia (January-December).
Patrick Lim et. al. An Empirical Study of the Relationship between Buildabilty and Productivity in Singapore: Lessons for Hong Kong SARS.
Property Quotient. Issue 12, May 2011.
Rojas, Eddy M. (2008) Construction Productivity: a Practical Guide for Building and Electrical Contractors.
United Nations Development Programme (UNDP) (2011). Human Development Report.
UNWTO World Tourism Barometer Vol.10 March 2012 Statistical Index.
Website
Economic Transformation Programme (http://etp.pemandu.gov.my/).
Malaysia. Prime Minister Department. Economic Planning Unit. (www.epu.gov.my).
New Straits Times (www.nstp.com.my).
Performance Management and Delivery Unit (PEMANDU) 2011, (http://etp.pemandu.gov.my/upload/etp_handbook_chapter_15_agriculture.pdf ).
Performance Management and Delivery Unit (PEMANDU) (2012): Agriculture. (http://etp.pemandu.gov.my/Agriculture-@-More_on _Agriculture.aspx ).
Tourism Malaysia, Ministry of Tourism (www.tourism.gov.my).
REFERENCES
MPC CONSULTATIVE PANELS
257
ACRONYMS AND ABBREVIATIONS
10 MP – 10th Malaysia Plan2D – Two Dimension3D – Three Dimension3G – Third Generation3PL – Third-Party Logistics4PL – Fourth-Party Logistics5S – Quality EnvironmentACSI – American Customer Satisfaction IndexADHD – Attention Deficit Hyperactivity DisorderAIM – Agensi Inovasi Malaysia AIZ – Aquaculture Industrial ZoneAPIC – Annual Productivity and Innovation ConferenceAPO – Asian Productivity OrganisationASEAN – Association of Southeast Asian NationsATOM – Automotive Workshop ModernisationBBB – Big Box BoulevardsBCCK – Borneo Convention Centre KuchingBE – Business ExcellenceBEF – Business Excellence FrameworkBERNAS – Beras Nasional BIM – Building Information ModelingBSCC – Berjaya Times Square Convention CentreBYOD – Bring Your Own DevicesCAD – Computer Aided DesignCAM – Computer Aided ManufacturerCBC – Community Broadband CentresCCTV – Closed Circuit TelevisionCEO – Chief Executive OfficerCLF – Customer Loyalty Follow-UpCMDV – Centre for Marker DiscoveryCMU – Central Management UnitCPO – Crude Palm OilCPPC – Crop Processing Packaging CentresCRC – Clinical Research CentresCRM – Clinical Research Malaysia CRO – Contract Research OrganisationCRS1 – Carrier Routing System 1CSR – Corporate Social ResponsibilitiesCT – Computerised TomograhyDBKL – Kuala Lumpur City HallDVS – Department of Veterinary ServiceDWDM – Dense Wavelength Division Multiplexing
e-SCM – e-Supply Chain ManagementE&E – Electrical and Electronic E2E – Enrolment to EmploymentEBN – Edible Bird NestECER – East Coast Economic RegionEFQM – European Foundation for Quality ManagementEI – Enterprise InnovationEIIP – Enterprise Innovation Intervention ProgrammesEOR – Enhance Oil RecoveryEPIF – Eco-Products International FairEPP – Entry Point ProjectsEPU – Economic Planning UnitEST – Electronic Shipping ToolsETP – Economic Transformation ProgrammeEU – European UnionFDI – Foreign Direct InvestmentFFB – Fresh Fruit BunchesFGBPR – Focus Group on Business Process Re-engineeringFRIM – Forest Research Institute MalaysiaFSMS – Food Safety Management SystemG2C – Government to CitizensGAP – Good Agricultural PracticesGBI – Green Building IndexGbps – Gigabyte Per SecondGC – Global CompetitivenessGDP – Gross Domestic ProductsGKL/KV – Greater Kuala Lumpur/Klang Valley GLC – Government Linked CompaniesGLP – Good Laboratory PracticesGMP – Good Manufacturing PracticesGNI – Gross National IncomeGP – Green ProductivityGPS – Global Positioning SystemGRP – Good Regulatory PracticesHACCP – Hazard Analysis Critical Control PointsHDI – Human Development IndexHSBB – High-Speed BroadbandI-ZAQ – Integrated Zones for AquacultureIADA – Integrated Agriculture Development Authorities
258
IBS – Industrialised Building SystemICC – Innovative and Creative CircleICQCC – International Convention on QC Circle ICT – Information and Communication TechnologyICU – Implementation Coordination UnitIDC – Internet Data CentreIELTS – International English Language Testing SystemIMD – Institute for Management DevelopmentIP – Internet Protocol IPSEC – Internet Protocol SecurityIPv6 – Internet Protocol Version 6ISEP – International Student Exchange ProgrammeIWK – Indah Water KonsortiumJCI – Joint Commission InternationalJKAS – Health & Environment DepartmentJKAWS – Civil Engineering & Drainage DepartmentJPC – Japan Productivity CentreJPIF – Infrastructure Planning DepartmentJPRB – Town Plan DepartmentJRBB – Urban Design & Building DepartmentJUSE – The Union of Japanese Scientists and EngineersKeTTHA – Ministry of Energy, Green TechnologyKLCC – Kuala Lumpur City CentreKLCC – Kuala Lumpur Convention CentreKLEMS – Capital, Labour, Energy, Material and ServicesKM – Knowledge ManagementKOLs – Key Opinion Leaders KPI – Key Performance IndicatorsLAM – Board of Architects MalaysiaLJM – Board of Engineers MalaysiaLMS – Learning Management SystemLNG – Liquid Natural GasMACC – Malaysia Anti-Corruption CommissionMADA – Muda Agricultural Development AuthorityMAMPU – Malaysia Administrative Modernising and Management Planning Unit
MARA – Majlis Amanah RakyatMARDI – Malaysian Agricultural Research and Development InstituteMBEF – Malaysia Business Excellence FrameworkMBL – Modern Business LicensingMBNQA – Malcolm Baldridge National Quality AwardMbps – Megabyte Per SecondMCMC – Malaysia Communication and Multimedia CommissionMFCA – Material Flow Cost AccountingMHTC – Malaysia Health Travel CouncilMICE – Meetings, Incentives, Conferences and ExhibitionsMIDA – Malaysian Investment Development AuthorityMITI – Ministry of International Trade and IndustryMNC – Multi National CorporationMOA – Ministry of Agriculture and Agro-Based IndustryMPC – Malaysia Production CorporationMPIC – Malaysia Productivity and Innovation ClassMQLI – Malaysia’s Quality Life IndexMRI – Magnetic Resonance ImagingMRO – Maintenance, Repair and OverhaulMRSM – MARA Junior Scince College MSAD – Malaysian Skill Advanced DiplomaMSC – Malaysian Skill CertificateMSD – Malaysian Skill DiplomaMSMA – Urban Stormwater Management Manual for MalaysiaMyIPO – Intellectual Property Cooperation of Malaysia MyKE – Knowledge ContentNATC – National Agriculture Training CentreNBI – National Broadband InitiativesNCSI – National Customer Satisfaction IndexNDPC – National Development Planning CommitteeNFP – National Family PolicyNFP – Network Facility Provider
ACRONYMS AND ABBREVIATIONS
MPC CONSULTATIVE PANELS
259
NIOSH – National Institute of Safety and HealthNKEAs – National Key Economic AreasNMIT – Netherlands Maritime Institute of TechnologyNQA – National Quality AwardsNSP – Network Service ProviderNuMED – Newcastle University Medical Malaysia OAL – Operation Application LayerOECD – Organisation for Economic Co-operation and DevelopmentOER – Oil Extraction RateOHSAS – Occupational Health & Safety Management SystemOSC – One Stop CentreOSC – One Stop CounterPAKAR – Pasar Komuniti dan Pasar KaravanPAM – Pertubuhan Arkitek Malaysia PEMUDAH – Special Taskforce to Facilitate BusinessPERMATA – Permata ProgrammePICC – Putrajaya International Convention CentrePITA – Petroleum Income Tax ActPITTIS – POS Integrated Track and Trace SystemPPSPPA – Solid Waste Management and Public Cleansing CorporationPR1MA – My First Home SchemeQE – Quality EnvironmentQMEA – Quality Management Excellence AwardQOL – Quality of LifeQoWL – Quality of Work LifeR&D – Research and DevelopmentRAPID – Refinery and Petrochemical Integrated DevelopmentRE – Renewable EnergyRELA – The People’s Volunteer Corps
RFID – Radio Frequency IdentificationRIA – Regulatory Impact AnalysisRIS – Regulatory Impact StatementRoL – River of LifeRR – Regulatory ReviewSEDA – Sustainable Energy Development Authority SGA – Small Group ActivitiesSMI – Small Medium IndustriesSPAH – Rain Management SystemSPC – Statistical Process ControlSPV – Special Purpose VehicleSSO – Shared Services and OutsourcingTbps – Terabyte Per SecondTEVT – Technical Education and Vocational TrainingTFP – Total Factor ProductivityTKPM – Permanent Food Production ParkTMS – Transportation Management SystemTOEFL – Test of English as a Foreign LanguageTPS – Toyota Production SystemTQM – Total Quality ManagementTUKAR – Small Retailer Transformation ProgrammeUMS – Universiti Malaysia SabahUNDP – United Nations Development ProgrammeUNESCO – United Nations Educational, Scientific and Cultural OrganizationUNIK – Unit Inovasi KhasUNWTO – The United World Tourism OrganisationUPM – Universiti Putra Malaysia USM – Universiti Sains Malaysia VMI – Vendor Managed InventoryWEF – World Economic Forum
ACRONYMS AND ABBREVIATIONS
INDEX
260
A
Accommodation and restaurant 4, 8, 14Accountability 53, 54, 56, 78Adequacy 54Aggregate 26, 27, 222Agribusiness 180, 181, 194Agriculture Sector 2, 9, 13, 20, 176, 177, 180, 192Agropreneurs 182Anchor 10, 21, 163, 181, 185, 186, 187, 215Application 57, 61, 90, 91, 92, 93, 94, 103, 106, 110, 111,
112, 113, 114, 115, 163, 170, 191, 192, 194195, 216, 222
Aquaculture 10, 20, 176, 177, 180, 181, 182, 183, 187, 193Assessment 26, 51, 54, 56, 69, 72, 75, 78, 80, 81, 92, 93, 95,
147, 211, 214, 216, 219Authority 54, 56, 166, 173, 182, 189, Automation 170, 186
B
Balanced Scorecard 77Baseline 28, 29, 62, 150Benchmark 43, 46, 62, 69, 106, 124, 146Benchmarking 29, 68, 86, 146, 147, 148, 212, 216, 220Best practices 53, 54, 67, 78, 81, 110, 121, 128, 133, 147,
170, 194, 212Bilateral 182Biodiversity 130, 184, 194Biofetiliser 194Biopesticide 194Broadband 4, 5, 13, 40, 99, 110, 111, 113, 114, 115, 199Building Information Modelling 21, 150Bureaucratic 38, 212 Business Environment 13, 28, 29, 40, 51, 54, 77, 111, 121, 122,
129 Services 3, 6, 26, 80, 98, 110
C
Capability 13, 43, 55, 63, 67, 71, 106, 114, 188, 214
Capacity 11, 43, 44, 46, 55, 67, 78, 90, 102, 108, 113, 126, 150, 165, 179, 187
Capital 13, 18, 19, 20, 21, 22, 23, 24, 26, 27, 36, 38, 44, 52, 92, 100, 101, 102, 103, 108, 109, 114, 121, 126, 128, 129, 132, 133, 146, 147, 155, 172, 173, 176, 179, 180, 181, 183, 204
Intensity 18 Stock 26 Certification 78, 81, 182, 185, 188Charter 62, 63Clinical 133, 135, 148, 149, 184, 186, 193Clusters 13, 143, 148, 156, 171, 181, 185Collaboration 35, 40, 46, 67, 80, 90, 112, 122, 132, 146,
185, 190Commercial farming 10Commercialisation 43, 46, 184, 189Communication 3, 4, 13, 23, 28, 29, 40, 58, 74, 80, 98, 100,
109, 111, 112, 114, 116, 118, 119, 146, 198, 208, 213, 217
Communication content and infrastructure 98, 111Competition 24, 26, 50, 51, 53, 66, 74, 85, 94, 103, 124, 128,
143, 163, 212 Competitive pricing 102Competitiveness 23, 24, 32, 33, 34, 35, 36, 37, 38, 40, 41,
43, 44, 45, 50, 51, 56, 57, 67, 72, 74, 81, 82, 92, 107, 115, 120, 135, 158, 162, 168, 170, 172, 212, 213, 214, 215
Compliance 40, 50, 51, 53, 54, 55, 57, 106, 182, 187, 188, 206, 214, 216
Connectivity 40, 66, 67, 73, 109, 111, 115, 134Conservation 21, 170Consignment 182, 185Construction sector 10, 14, 21, 135, 137, 143, 145, 150Consultation 43, 53, 55, 56Consumption 5, 12, 36, 91, 104, 155, 187, 222, 223Content delivery provider 122Contract 38, 137, 143, 182, 185, 188, 192, 193, 206Contraction 21, 211Contribution 9, 18, 19, 20, 21, 23, 26, 44, 71, 98, 101, 102,
103, 109, 159, 165, 169Creativity 24, 69, 129, 206Crop 20, 177, 180, 184, 188, 190, 192, 194, 195Cultivation 10, 184, 185, 186, 189
INDEX
261
Culture 28, 46, 47, 67, 71, 78, 80, 81, 91, 94, 112, 115, 125, 147, 198, 204, 216
D
Declaration 38Design and development (D&D) 173Diffusion 26, 44, 110Domestic consumption 5, 12Domestic oriented industries 13, 154, 156, 171Downstream 14, 107, 165, 166, 185, 186 Activities 168, 171 Level 164, 168Dynamic 26, 40, 53, 215
E
E-Business 20E-payment 38, 40, 121Eco system 72, 212Economic resilience 32Economic sectors 20, 24, 38, 80, 106, 108, 214Economic Transformation Programme (ETP) 3, 11, 13,
14, 54, 98,104, 106, 111, 115, 118, 122, 133, 135, 137, 145, 193
Education 7, 12, 26, 40, 46, 47, 78, 80, 98, 103, 113, 115, 126, 127, 128, 129, 130, 146, 173, 198, 199, 200, 211, 216
Effective 24, 26, 28, 29, 51, 53, 56, 57, 63, 71, 77, 87, 94, 100, 103, 110, 189, 215
Efficiency 18, 32, 33, 35, 38, 44, 45, 50, 53, 57, 58, 61, 87, 90, 102, 103, 107, 108, 117, 122, 131, 147, 148, 163, 169, 170, 194
Efficient 8, 13, 24, 32, 38, 40, 51, 57, 58, 66, 82, 102, 103, 105, 108, 151, 190, 217
Elimination 57, 71Emerging 9, 22, 122, 158, 166, 172Emissions 72, 92, 194Energy efficiency 90, 163, 165, 166Enforcement 53, 58, 62, 186Enterprise 32, 33, 38, 40, 66, 67, 68, 69, 70, 72, 81, 93, 94,
95, 114, 170, 212, 214
Enterprise Innovation Intervention Programme 67, 69, 93, 214
Entrepreneurs 57, 72, 169, 180Entry Point Projects 10, 106, 111, 118, 121, 125, 128, 133,
137, 183, 187, 189, 191European Foundation for Quality Management 74, 95Evaluation 26, 36, 70, 75, 92, 193Evidence 53, 54, 55, 204Expenditure 27, 36, 72, 99, 133, 222Export 11, 12, 24, 32, 36, 40, 62, 63, 72, 104, 107, 115, 154,
155, 156, 170, 172, 173, 182, 184, 185, 186, 187, 188, Oriented industries 24, 154, 155, 156, 173External demand 154, 156, 170Extraction 168, 185
F
Facilitate 13, 28, 38, 51, 55, 57, 66, 76, 77, 82, 104, 112, 119, 193, 214, 215, 218
Finance and insurance 6, 98Financial assistance 12Fiscal 36, 38, 173Fisheries 177, 181, 182Flexibility 23, 55, 218Floriculture 176Foundation 28, 87, 109Fragmented 58Framework 212, 213, 220Free-market 40Fundamental 11, 38, 46, 50, 128
G
Gatekeeping 54Global education network 7Global supply chain 109, 155Globalisation 32, 74, 128, 129, 130, 194, 220Governance 50, 53, 55, 78Green Building Index 21Green logistics practices 108Green productivity (GP) 72, 76, 90, 92, 93Green technology 91, 119, 121, 165, 170, 203
INDEX
262
Guidelines 54, 185, 195
H
Handbook 54, 55Hazard 81, 182Health tourism 7, 122, 131, 132, 133, 134, 135Healthcare 7, 98, 106, 111, 113, 130, 131, 132, 133, 134,
135, 148, 198, 203Herbal 135, 183, 184, 193 Cultivation 10, 185High speed broadband 13, 40Horticulture 182, 183
I
Impact 26, 32, 38, 50, 53, 54, 55, 70, 71, 81, 89, 91, 111, 118, 133, 164, 170, 176, 194, 204, 210, 211, 212, 221, 222
Imperative 23, 24, 26, 28, 46, 50, 124, 212Inclusiveness 56Incomes 6, 21, 27, 36, 38, 43, 45, 50, 98, 99, 130, 134, 145,
154, 158, 170, 171, 172, 176, 181, 185, 190, 195, 199, 200, 202, 203, 213
Indicators 29, 51, 62, 70, 148, 198, 215, 216, 220, 222Industrialisation 172Industrialised Building System 10, 21, 137, 144Infrastructure 13, 32, 33, 35, 40, 44, 45, 46, 63, 98, 102, 105,
107, 108, 111, 112, 114, 115, 122, 125, 130, 132, 134, 135, 138, 186, 187, 188, 190, 199
Innovation 20, 22, 23, 24, 26, 40, 43, 44, 45, 46, 50, 54, 66, 67, 68, 69, 71, 72, 74, 76, 78, 81, 82, 86, 88, 94, 102, 115, 121, 126, 128, 132, 169, 170, 194, 212, 213, 214, 216
Innovative and Creative Circle (ICC) 71, 91Innovators 43, 47Institutions 12, 32, 38, 46, 51, 53, 78, 113, 126, 127, 128,
129, 130, 132, 170, 185Integrated 55, 78, 105, 106, 108, 110, 119, 121, 155, 163,
166, 171, 181, 187, 188, 191, 194, 195, 215Integrated Circuit Industry (IC) 163Integrity 57
International Convention on QC Circle 71, 82, 84, 85, 86Internet protocol 111, 113Investing 22, 108Investors 32, 36, 103, 172, 188, 223Irrigation 190, 194, 195
J
Judiciary 47
K
Kaizen 170Key opinion leader 134KLEMS 26, 27 Knowledgeable 28, 44, 129
L
Laboratory 128, 185Labour Cost competitiveness 110, 116, 120, 158, 168 Cost per employee 104, 109, 116, 120, 123, 126, 130,
158, 159, 162, 167 Efficiency 165 Quantity 20, 22, 23 Remuneration 159Law 38, 47, 58, 108, 119Legality 57Legislation 38, 51, 183Legislative 57Liberalisation 53, 107, 108, 123, 215Liberalising 40Licenses 51, 57 Livestock 176, 177, 182, 183, 192, 193Logistics services 103, 104, 106, 107, 108Low-skilled 26
M
Macro economic 33, 47

INDEX
263
Malcolm Baldrige National Quality Award 73Manufacturing sector 91, 154, 155, 156, 158, 159, 166,
168, 170, 171, 172, 173Marginally 20Marketing 24, 69, 88, 118, 119, 134, 170, 182, 184, 185,
216Material Flow Cost Accounting 72, 92, 93Mindset 67, 69, 71, 220Minimum wage 173Mining sector 10, 14, 21Ministry 55, 94, 123, 133, 165, 180, 213Model 21, 32, 33, 69, 73, 74, 92, 93, 94, 95, 122, 146, 150,
170, 187, 188, 190, 191, 193, 207, 212, 214, 220, 221, 222, 223
Modern Business Licensing 13Modern jobs 172, 216Modernising 38, 44, 56, 57, 58, 62, 118, 212, 213, 216Molecular 192Monitoring 57, 87, 112, 113, 193, 195, 213, 214, 217
N
National Agro-Food Policy 13, 192National Quality Award 73NKEA 20, 40, 98, 106, 107, 111, 117, 118, 122, 135, 137,
154, 162, 165, 166, 171, 179, 181, 183, 193
O
OECD 11, 35, 53, 54Openness 26, 46, 47, 51, 54Organic 182, 189, 194, 195Outcome 27, 51, 63, 70, 71, 77, 94, 148, 149, 203, 204, 211,
214, 221, 222Output 18, 20, 21, 22, 24, 26, 72, 77, 92, 98, 100, 101, 102,
103, 138, 150, 155, 158, 159, 161, 164, 172, 176, 177, 185, 193, 212
Outsourcing 6, 100, 103, 119, 122, 134, 191Ownership 46, 47, 56, 199
P
Paperless pick systems 101Patent 43PEMUDAH 13, 38, 51, 57, 107, 213Permit 38, 57, 58, 59, 60, 61, 62 Pillars 28, 29, 194Polarisation 26Policies 32, 33, 38, 40, 53, 54, 107, 108, 115, 133, 182, 203Precision 88, 92, 194, 195Product diversification 171Productivity-driven 13 Profitable 33, 38, 128Proposals 55, 76Prosperity 24, 32, 198Protectionism 52Public investment 170
Q
Quality Management Excellence Award 69, 72, 94Quality of Life Index 198, 200, 201Quality of Work Life 72, 204, 206, 211, 216
R
R&D Intensity 24Ranked 33, 35, 36, 38, 40, 51, 102, 122, 124, 125, 126, 198, Real estate and business service 3, 6, 99 Realisation 21Reform 53, 62Regulation 38, 40, 44, 53, 54, 55, 56, 57, 58, 62, 63, 135,
182, 185, 193, 212, 213, 214, 216, Regulatory 24, 50, 51, 53, 54, 55, 62, 107, 212, 214, 216Renewable energy (RE) 166Research and development (R&D) 24, 35, 40, 43, 44, 46,
50, 115, 145, 170, 171, 173, 185, 186, Retrenchment 28Revenue 38, 112, 118, 149, 223
INDEX
264
Review 28, 29, 38, 50, 53, 54, 55, 57, 60, 61, 62, 63, 69, 72, 73, 75, 83, 94, 107, 108, 124, 135, 182, 212, 214, 216
Roadmap 66, 69, 71, 73, 143, 223
S
Semi-skilled 26Services sector 13, 20, 40, 66, 98, 99, 101, 102, 103, 104,
108, 110, 114, 215Shared services outsourcing 6, 100, 121, 122Sharing scheme 28, 29Simplification 57Six sigma 71Small group activities 71Solid state lighting (SSL) 163Sophisticated 35, 40, 43, 45, 46, 47, 114, 125Source of growth 44Stakeholders 29, 53, 55, 56, 76, 77, 79, 147Standard 29, 32, 47, 51, 58, 75, 78, 81, 84, 87, 92, 103, 105,
111, 124, 125, 132, 182, 188, 191, 195, 211, 212, 215Statutory 61Strategy 24, 55, 62, 72, 77, 108, 119, 121, 166, 171, 172,
182Subsidies 27Supply chain disruption 155Surplus 27, 36Sustainability 32, 33, 90, 105, 134, 166, 168, 171, 181, 185, 187Sustainable 14, 32, 66, 73, 79, 90, 91, 93, 105, 108, 111,
112, 165, 166, 194, 195Sustainable Achieved via Energy Efficiency (SAVE) 166Swiftlet breeding 10, 20
T
Talent 40, 44, 103, 132, 134Tariff 40, 103Taxes 27, 38Technological Capabilities 24Technology 24, 26, 32, 40, 71, 74, 80, 87, 91, 103, 105, 106,
109, 110, 111, 112, 113, 114, 115, 116, 119, 121, 125, 126, 129, 135, 137, 144, 165, 169, 170, 173, 181, 186, 190, 199, 203, 216
Tender 38 Theory 32, 33Time management 170Total Factor Productivity (TFP) 18, 19, 20, 21, 22, 23, 24,
25, 26, 27, 100, 101, 102, 103, 168, 169, 216Total Quality Management (TQM) 85, 170Tourism 7, 8, 40, 80, 98, 107, 108, 122, 123, 124, 125, 131,
132, 133, 134, 135, 170Traceability 106, 112, 185, 186, 193Trading 62, 63, 101, 107, 110, 156Transactions 57, 100, 119Transition 45, 173 Transparency 28, 38, 40, 53, 54, 57, 62 Transparent 38, 47, 53, 54, 57Transport and storage 7, 102, 104Turnaround 63, 102
U
Unit labour cost 104, 109, 116, 121, 126, 127, 130, 158,162, 165, 167
Upstream activities 166, 167, 171Utilisation 18, 88, 91, 101, 109, 110, 118, 148, 149, 170, 176Utilised 26, 72Utilities 8, 103
V
Veterinary 180, 185Vintage 22
W
Wages 22, 24, 27, 28, 29, 165, 169, 172Waste reduction 71Weighted 22, 74, 221Well-being 32, 50, 103, 111, 198, 203, 204, 206, 211Wholesale and retail trade 5, 80, 98, 100, 101, 115, 116,
117Wireless technology 13Work improvement team 71
www.mpc.gov.my
TRANSFORMATION INNOVATION PARTNERSHIP
PRO
DU
CTIV
ITY REPO
RT 2011/2012