productivity: no puzzle about it - tuc - changing the ... · productivity: no puzzle about it esad,...
TRANSCRIPT

Productivity: no puzzle about it
How austerity has held back productivity and why growth is the only way to boost it

Productivity: no puzzle about it ESAD, February 2015 2
1.1 Key points
• Much economic commentary says falling real wages and weak economic growth are due to poor productivity
• But the poor productivity record, in the UK and across most advanced economies, has been caused by austerity sucking demand out of economies. In previous recessions inadequate demand had been reflected in high levels of unemployment. But this time the effect has been different. Instead of being loaded onto the jobless, the misery has been shared more widely through squeezed and insecure household incomes, made worse in the UK by the government’s mistaken austerity programme.
• The so-called productivity puzzle, that has seen UK productivity remain substantially below pre-crisis levels, is therefore not really a puzzle at all. It is a consequence of the labour market adjusting to meet lower economic growth. As the OECD and the IMF are now beginning to realise, productivity performance will not improve until demand is strengthened. Poor growth results in poor productivity, not – as many argue – the other way round.
• Increased productivity and higher living standards can only be achieved with higher levels of demand in the economy. We certainly need supply-side changes such as investment in skills and better access to finance, but these will only make a significant difference if coupled with an end to austerity economics.

Productivity: no puzzle about it ESAD, February 2015 3
2.1 1. Introduction
The 2008 crash caused the economy and GDP growth to collapse. Productivity – measured as output per head or per hour – also fell sharply. While economic growth has recovered a little since the crisis, productivity has yet to see significant gains. This is often shown as the level of productivity over recent years set against a projected pre-crisis trend; Chart 1 from the Bank of England is typical.
Chart 1: Whole economy labour productivity per hour
The chart suggests that at the start of 2015 productivity was around 20 per cent below its previous performance. Much economic debate has been about why productivity has been so much worse than we might expect. It has even been given a name: the productivity puzzle. But while demand and supply may both have played a role, the majority of commentary has concentrated on supply-side explanations such as poor capital stock, a dysfunctional financial system or poor workforce skill levels.
The supposed productivity puzzle is deployed against arguments that the weakness of the economy and the collapse in living standards have been caused by

Productivity: no puzzle about it ESAD, February 2015 4
weak demand. Some go further to argue that poor productivity has become a permanent and inevitable part of the post-crisis UK economic model, and that therefore we might never have real wages growth or secure employment.
This analysis is deployed by those who say that only an approach based on deregulation and lower taxes, sometimes leavened by calls to boost skills, can boost competitiveness. Wages can only recover, they say, when the UK’s businesses are less regulated and their workers better skilled.
The view that poor productivity is now permanent is used by those arguing for further large public spending cuts. This group argues that poor productivity reduces the ability of the economy to grow. In turn this means that the UK now faces a larger structural deficit (the part of the deficit that will remain even when the economy is working at its maximum output) as poor productivity means that we are already close to reaching the UK’s full economic potential.
Significant cuts in public spending are therefore needed, they argue, to restore the public finances to better health as there is not much prospect of generating more tax income from a growing economy. Higher interest rates have also been demanded by this group as they see little scope for growth to increase without inflation rising, although this argument has faded as fears of deflation grow.
But this analysis is flawed as it does not ask what causes our poor productivity performance. Since the financial crisis the UK economy has undoubtedly under-performed. But has it really permanently lost so much capacity?
This report takes a more optimistic view. There is potential to improve productivity through securing stronger economic growth and boosting demand in the economy. Weak demand (rather than over-regulated labour markets or over-taxed companies) is the primary factor behind poor productivity, although of course there are other weaknesses such as a lack of access to finance to support new businesses and skills shortages in some industries. Action on these is needed, but it is hard to see a significant boost to productivity without a revival in demand.
The TUC first set out this argument in its Economic Review of February 2013, which drew heavily on academic research by Bill Martin and Bob Rowthorn. Martin and Rowthorne (2012) contest the view that poor productivity was causing poor growth. They point out that ahead of the crisis there was no evidence the economy was operating beyond capacity, as price and wage inflation were benign.
Since then, many others have come to similar conclusions. Across developed countries, especially the EU, international organisations are now more strongly emphasising the role of demand rather than supply in improving outcomes and hence productivity. The OECD (2014) has begun to explore the impact of depressed demand for deflation concluding that “Macroeconomic policies have an important role to play” in strengthening growth. More decisively the IMF has begun to argue for infrastructure spending, a position supported by The

Productivity: no puzzle about it ESAD, February 2015 5
Economist magazine. While they abstract from productivity, the ball is moving back into the court of demand.
The analysis in this report strengthens the case that it is a stronger recovery that will turn round the UK’s poor productivity performance.
In section 2, our analysis looks at outcomes for productivity over time and across countries to show how closely aligned productivity trends are with the overall economic cycle.
In section 3, we look at the role of demand in holding back productivity, showing how austerity has reduced overall spending and GDP growth. We show that the labour market has been forced to accommodate this reduction in growth, and that this has mainly happened through severe cuts in real earnings.
In section 4, we apply a similar analysis to all OECD countries. This shows that the UK experience is typical, not exceptional – and that there have been even worse labour outcomes in some countries.
In section 5, we look at the standard prescription that countries should improve productivity through supply-side measures so that they can trade their way out of recession. Both the IMF and OECD now seem to concede that this prescription has failed, as it has caused significant harm for domestic demand which has more than offset any trade gains.
The paper concludes in section 6 that we need policies to restore demand, including initiatives to increase wages and public infrastructure spending. Under such conditions, our genuine supply weaknesses can be better addressed. Industrial policy, easier access to finance and raising skills all work far better in a growing economy, not one bumping along the bottom that provides few attractive investment opportunities.
An approach to policy that says that economic growth, higher living standards and recovery has to wait for productivity to improve gets economics the wrong way round. Higher productivity requires – and will be a likely result of - a growing economy.
2. Empirical assessment of productivity
The idea that relatively short-term outcomes are due to some sudden change in productivity potential looks odd. Longer term trends, or changes when the system is at capacity (when there is no more potential to grow without causing inflation), might be thought to be dependent on productivity changes but shorter term changes are usually thought of as determined by demand. As Ben Broadbent, Deputy Governor of the Bank of England, explains1
1 Note, however, that he uses this explanation to motivate his own supply-side account: “... the period since the financial crisis began in mid-2007 confounds these patterns. ...On the face of it, this looks more like a contraction in supply...” (Ben Broadbent, 2012).
:

Productivity: no puzzle about it ESAD, February 2015 6
“[W]e are brought up to believe that economic cycles are determined purely by demand-side factors – consumer or business confidence, for example, or conventional macroeconomic policy ... – while supply-side factors ... matter only for the long-run level of output (Ben Broadbent, 2012).
Productivity and the economic cycle
Looking at how aggregate productivity estimates mirror underlying economic performance and the ups and downs of the economic cycle affirms the importance of demand. This link (cyclicality in economic jargon) has been recognised by policymakers, including the Bank of England (Barnett et al, 2014) in Chart 2.
Chart 2: Productivity growth

Productivity: no puzzle about it ESAD, February 2015 7
Productivity growth closely tracks GDP growth in the chart. In particular it collapses when economic growth collapses and grows strongly when the economy expands rapidly.
The most recent figures clearly show that productivity growth has been low for an unprecedented period, but equally the present crisis has been longer and deeper than any since the great depression. Some claim that the trends before the crash should in retrospect be regarded as unsustainable or illusory, but these growth rates were well in line with historical outcomes.
The majority of commentary, however ignores this history, and tends to discuss recent events in isolation. The Office for Budgetary Responsibility (OBR) (2012, Box 3.2) has set out a useful summary/overview of the various explanations for poor productivity performance (both supply and demand). In some cases, they estimate how much of the shortfall these different explanations explain.
Measurement: While the OBR says that Office for National Statistics’ (ONS) revisions will lead to future changes in measured productivity, these are not expected to materially alter the position. So they do not think that data error is driving the trend.
Slowdown in investment growth: The OBR estimates that weaker investment has meant reduced capital per worker. They think that this accounts for 1.5 percentage points of the 15 point productivity fall.
Composition: The shift in the UK economy from high to low productivity sectors (e.g. from finance and construction) is understood to account for 1.0 percentage points of the change.
Labour market explanations: Some say that firms are ‘hoarding’ labour, hanging onto workers they do not need to be ready for a revival in demand. There has also been a move to part-time and self-employment, often at lower productivity. The OBR thinks these changes could play a role.
Credit rationing and impaired financial markets: Impaired markets may prevent efficient firms getting credit, and conversely ‘zombie’ firms may be being kept afloat. At the same time, lack of credit may hold back R&D, which is a key means to boost productivity. The OBR also thinks that trends in this area are responsible for part of the productivity puzzle.
But even though they can only quantify a small part of the productivity fall, the OBR sees a significant proportion of the shortfall in productivity as structural, resulting from real and permanent flaws in the economy rather than short-run / cyclical demand factors.
Ultimately their explanation is one of association (or lack of association). As poor productivity has been associated with poor growth they assume that productivity is the cause.

Productivity: no puzzle about it ESAD, February 2015 8
But in contrast, our analysis has the causality running the other way. The factors the OBR identify are mainly a result of weak demand in the UK economy.
International comparisons
Discussions of productivity have tended to ignore international comparisons. When other countries are considered it is usually to argue that the UK performance is somehow exceptional and poor.
For example the Bank of England (ibid., 116) has argued that, “The United Kingdom’s productivity performance, particularly relative to its pace of growth prior to the crisis, has been considerably weaker than that of most other advanced economies”, presenting Chart 3 in support of this view.2
But this analysis ignores a substantial decline in measured productivity across nearly all countries compared to the period before the crisis. It is not the differences between countries that are remarkable, but the scale of the change in productivity over time. It is not that the UK sticks out, but that the great majority of countries have ‘productivity puzzles’.
2 Martin Weale’s recent speech, ‘The UK productivity puzzle: an international perspective’, goes further in recognising that the UK is not alone, but is resolutely supply-orientated, so that there are 30ish puzzles to explain rather than one; but the idea that a coordinated collapse in productivity might indicate a synchronised fall in demand and hence support a demand interpretation is not entertained.
Productivity: no puzzle about it ESAD, February 2015 9
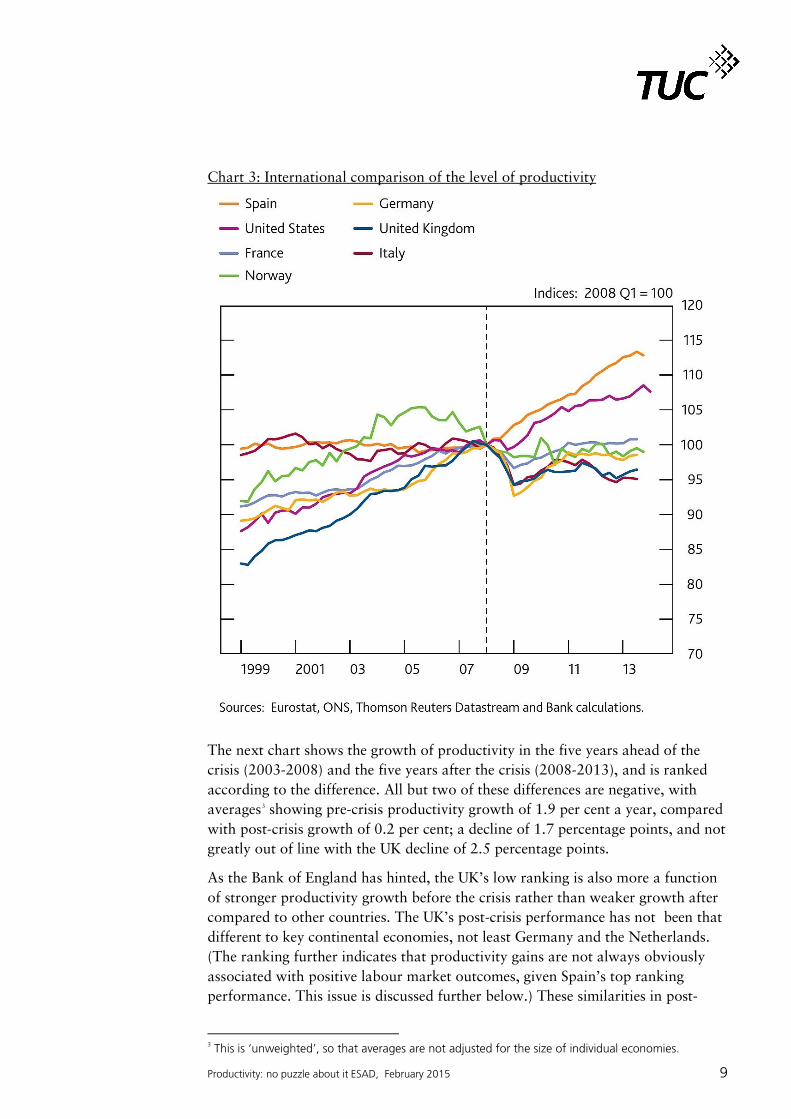
Chart 3: International comparison of the level of productivity
The next chart shows the growth of productivity in the five years ahead of the crisis (2003-2008) and the five years after the crisis (2008-2013), and is ranked according to the difference. All but two of these differences are negative, with averages
3
As the Bank of England has hinted, the UK’s low ranking is also more a function of stronger productivity growth before the crisis rather than weaker growth after compared to other countries. The UK’s post-crisis performance has not been that different to key continental economies, not least Germany and the Netherlands. (The ranking further indicates that productivity gains are not always obviously associated with positive labour market outcomes, given Spain’s top ranking performance. This issue is discussed further below.) These similarities in post-
showing pre-crisis productivity growth of 1.9 per cent a year, compared with post-crisis growth of 0.2 per cent; a decline of 1.7 percentage points, and not greatly out of line with the UK decline of 2.5 percentage points.
3 This is ‘unweighted’, so that averages are not adjusted for the size of individual economies.

Productivity: no puzzle about it ESAD, February 2015 10
crisis productivity performance (and the prevalence of post- crisis labour market challenges across all developed economies) suggests a strong cyclical element to recent productivity trends, rather than some special affliction hitting the UK.
Chart 4: International comparison of productivity growth, average annual percentage growth
3. A demand-side explanation
A demand-side view explains weak productivity as the result of weak economic activity (driven by government spending cuts) and a consequent and structural shift to a low-cost and insecure labour market.
While this view recognises that structural change can account for some recent productivity performance, it maintains that weak demand is the primary driver. Consequently, exclusive action on the supply-side is unlikely to have much impact on productivity.
-6 -4 -2 0 2 4 6
Turkey
Estonia
Luxembourg
Czech Republic
Hungary
Greece
Iceland
Finland
United Kingdom
Slovak Republic
Norway
Netherlands
Sweden
Mexico
Korea
Chile
Belgium
Switzerland
Denmark
Japan
Germany
Israel
Austria
Italy
Poland
France
Ireland
Australia
United States
Canada
New Zealand
Portugal
Spain
difference
post-crisis
pre-crisis

Productivity: no puzzle about it ESAD, February 2015 11
Austerity and weak GDP growth
Since the coalition government took office, aggregate demand has been withdrawn by reducing the growth of government expenditure. This has led directly to a reduction in the rate of GDP growth measured in cash terms. Chart 5 shows cash increases in government final demand (including wages and salaries, procurement and investment) in cash terms were very subdued relative to increases in previous years. The post-crisis annual increase in spending was £2.5 billion a year, compared to the pre-crisis years at around £19.5 billion.4 This is still a net injection of demand, but only just.
Chart 5: General government final demand, annual change £ billion
Chart 6 compares economic growth with government spending growth. GDP slowed from an average of 5.0 per cent a year before the crisis (2004-08) to 3.7 per cent after the crisis (2010-13).
The standard way of understanding such changes is through ‘contributions’ to GDP growth.5
4 The analysis across Charts 5 to 10 is based on nominal /cash figures. This approach is used for three main reasons. First, cash figures are not distorted by the way real terms figures for government spending are based on ‘output’ indicators. Second, productivity outcomes depend fundamentally on the way weakness in economic growth is allocated between wages and employment, which can only be understood in cash terms. Third, when it comes to extending the analysis, goals for policy are based on the public finances which are set in cash terms.
Chart 7 shows the contributions of the various ‘expenditure components’ to GDP growth.
5 GDP is measured in three ways: the output (or strictly the value added, turnover minus intermediate consumption) of firms producing goods and services, by adding the different types of expenditure (household consumption, government consumption, stockbuilding, investment (housing, business and government) and exports and imports), and by adding incomes across the economy (mainly wages and profits).
-5
0
5
10
15
20
25
30
35
40
1998 1999 2000 2001 2002 2003 2004 2005 2006 2007 2008 2009 2010 2011 2012 2013

Productivity: no puzzle about it ESAD, February 2015 12
The first column shows these in the run-up to the crisis, the second what happened under the coalition government, and the third shows the difference between the two.
Chart 6: Nominal GDP and government final demand growth, per cent
The chart shows very clearly that the whole of the shortfall in growth of 1.3 percentage points during this period is accounted for by the reduced contribution of government (-1.31 of -1.30 percentage points).
Chart 7: Contributions to annual average GDP(E) growth, percentage points
-3
-2
-1
0
1
2
3
4
5
6
7
2004 2005 2006 2007 2008 2009 2010 2011 2012 2013
Government final demand GDP
-3 -2 -1 0 1 2 3 4 5 6
2004-08 2010-13 difference
other
net trade
investment
government
consumer
GDP

Productivity: no puzzle about it ESAD, February 2015 13
The government expected reduced spending (and ‘hence’ improved public sector finances) to boost confidence in the private sector and lead to a strengthening in activity. But, as the chart shows, this did not happen. Investment spending was only very slightly increased and consumer demand fell.
Although the OBR argues that the slowdown in the economy followed from weakening overseas demand (in the eurozone), in both the pre- and post-crisis periods net trade has made a negligible contribution. Globalisation means that there must be a confidence factor that goes wider than any individual component, but it is the reduction in government spending that has reduced GDP growth, suggesting that it is austerity that has been the key driver of poor economic performance in recent years.
Income and labour market outcomes
The impact of recent poor economic performance on the labour market has come in two ways. First, reduced GDP growth is allocated between profits and labour; second, income is allocated within the labour market between earnings and employment. Chart 8 shows contributions to the income measure of GDP (compossed predominantly of employee pay and company profits),6 across the same periods as the preceding chart.
Chart 8: Contributions to annual average GDP(I) growth, percentage points
6 Strictly, compensation of employees (wages and salaries plus employees’ pension contributions), gross operating surplus (broadly profits), other income (self-employment income and an imputation for owner occupiers’ housing costs) and an adjustment for expenditure taxes (like VAT).
-3
-2
-1
0
1
2
3
4
5
6
2004-08 2010-13 difference
taxes
other income
profits
labour income
GDP
Productivity: no puzzle about it ESAD, February 2015 14
The chart shows that reduced GDP growth is a result of both reduced labour income (strictly, compensation of employees) and reduced profits (gross operating surplus), with each seeing broadly comparable percentage falls. Other income – which includes self-employment income – is little changed; while there has been rapid growth in numbers, earnings in this group are very low.
The only component of GDP to rise (on this cash basis) is taxes, which follows from the government’s 2010 increase in VAT. With both labour and profit income falling, their respective shares have remained fairly stable over this period, although as both have fallen they have each made substantial contributions to reduced output.
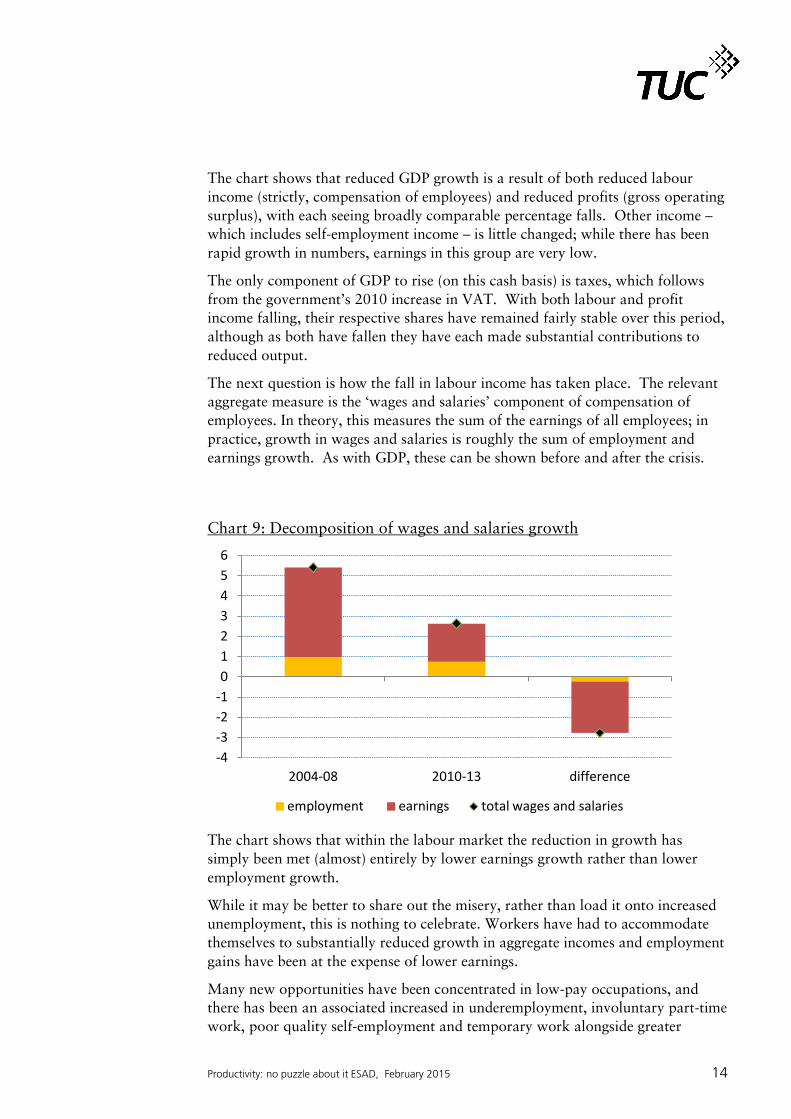
The next question is how the fall in labour income has taken place. The relevant aggregate measure is the ‘wages and salaries’ component of compensation of employees. In theory, this measures the sum of the earnings of all employees; in practice, growth in wages and salaries is roughly the sum of employment and earnings growth. As with GDP, these can be shown before and after the crisis.
Chart 9: Decomposition of wages and salaries growth
The chart shows that within the labour market the reduction in growth has simply been met (almost) entirely by lower earnings growth rather than lower employment growth.
While it may be better to share out the misery, rather than load it onto increased unemployment, this is nothing to celebrate. Workers have had to accommodate themselves to substantially reduced growth in aggregate incomes and employment gains have been at the expense of lower earnings.
Many new opportunities have been concentrated in low-pay occupations, and there has been an associated increased in underemployment, involuntary part-time work, poor quality self-employment and temporary work alongside greater
-4 -3 -2 -1 0 1 2 3 4 5 6
2004-08 2010-13 difference
employment earnings total wages and salaries

Productivity: no puzzle about it ESAD, February 2015 15
insecurity through zero-hours contracts, agency work and other insecure or short-term contracts.
The government may claim that recent labour market performance vindicates its policies; in effect all that has happened is that the impact of austerity has been expressed as a hit on wages and job quality rather than a hit on jobs. Workers’ incomes have taken a far larger hit than employment rates. Given the large increase in the population, on a per head basis incomes have fallen continuously in real terms, now for the seventh year in succession.
Productivity performance
Labour market changes have been forced by weaker growth. Productivity outcomes can only be understood with reference to years of economic underperformance.
The change in productivity over the pre- and post-crisis episodes under discussion in this report is defined as the change in GDP against the change in labour input (for simplicity, employment).7
The adjustment to lower income growth in the labour market has been mainly on the earnings side rather than lower employment. The calculation for productivity therefore sets disproportionately higher employment growth against lower economic growth. The low productivity figures are therefore a statistical consequence of the manner of adjustment of the economy and labour market, through price (earnings) rather than quantity (employment).
8
It also follows, then, that the relationship between wages and productivity is effect, rather than cause, as part of an accounting identity/relationship. If economic growth is depressed, higher employment means on the one hand lower earnings growth and on the other lower productivity growth.
This outcome is therefore an effect; it has no causal force.
9
The main cause of low productivity and lower earnings, and therefore the key to better economic performance, is aggregate demand.
7 While the discussion so far has focussed on cash figures, strictly the former is adjusted for prices, effectively through the GDP deflator: which falls to an annual average of 2.2 per cent in the post-crisis period from 2.8 per cent in the pre-crisis. Note too that this change is also distorted by the way in which government spending is measured in volume terms. 8 If people have to work more lower-paid hours to make ends meet, this only exacerbates the weakness. 9 Under these conditions productivity is perhaps better understood as ‘measured productivity’; it provides a specific (peculiar) interpretation of aggregate outcomes. Given components of GDP(I) must adjust exactly to meet any change in GDP, measured productivity gives special place to adjustments that are achieved mainly through employment rather than earnings. If the profit share rose at the expense of employment, the measured productivity gains would be greater still. But in all cases the total amount of the cash adjustment must be the same, and it is hard to see why there should be any premium on employment adjustment. Matters are of course very different at full employment, when the aim is to squeeze more out of the system through efficiency, and gains legitimately accrue as earnings or profit.

Productivity: no puzzle about it ESAD, February 2015 16
4. Interpretation of international position
The same approach can be applied to other countries. On an expenditure view, growth has slowed in the post-crisis period for almost every country. Cuts in government spending growth have led across the board to parallel falls in the growth of other sources of demand. Moreover the figures strongly suggest the extent of the reduction in GDP growth follows closely the extent of the cuts in government spending growth.10
A broad guide to productivity outcomes follows from looking at a decomposition of the associated reduction in wages and salaries growth (Chart 10).
Chart 10: Decomposition of change in wages and salaries growth, ranked by change in GDP growth
The chart shows that there is substantial variation in the way in which workers have lost income. Some countries have seen substantial falls in employment and fewer effects on wages for those with jobs while in others, wages and salaries have taken the brunt.
Countries where the reductions in employee incomes have been skewed to earnings will have had the largest relative deteriorations in productivity (although
10An alternative perspective on the international figures is presented in a companion paper on austerity (TUC, 2015) (forthcoming).
-18
-16
-14
-12
-10
-8
-6
-4
-2
0
2
4
Gree
ce
Slov
enia
Spai
n
Esto
nia
Slov
ak R
epub
lic
Czec
h Re
publ
ic
Port
ugal
Net
herla
nds
Nor
way
Irela
nd
Pola
nd
Hung
ary
Aust
ralia
Switz
erla
nd
Finl
and
Italy
Luxe
mbo
urg
Denm
ark
Aust
ria
Fran
ce
Mex
ico
Belg
ium
Swed
en
Uni
ted
King
dom
Uni
ted
Stat
es
Cana
da
Kore
a
Isra
el
Germ
any
Japa
n
employment
earnings
GDP

Productivity: no puzzle about it ESAD, February 2015 17
they may not be the countries that have seen the largest impacts overall on employee income across the economy).
This is because they still have reduced output but have kept more people in work. For example, while the GDP falls in Australia and Switzerland have been similar, employment has fallen far more in the former than the latter. This means that productivity will be poorer in Switzerland, even through the growth and employee income challenges the countries face are broadly similar.
The analysis also offers context for the UK adjustment. This analysis shows that it is nothing exceptional. Switzerland, Sweden, the US and Canada all took the majority of the adjustment to employee income on earnings rather than on jobs. The countries where employment took the biggest hit were accession and periphery countries of the EU (broadly). Only Germany, Israel and Japan registered overall gains in growth for employees (accompanied also by increases in government spending growth).11
11 To reiterate, actual productivity outcomes follow also from changes in inflation before and after the crisis (as measured by the GDP deflator) and the extent of the adjustment on labour as a whole relative to profits. Higher profit growth means lower incomes, likely relatively lower employment and higher productivity. But again, the latter situation is still a statistical artefact of the manner of the adjustment of incomes across the economy as a whole.

Productivity: no puzzle about it ESAD, February 2015 18
5. Productivity and post-crisis policy
In much contemporary economic debate productivity has not only been used to explain outcomes, but action to improve it is seen as an important policy recommendation. Countries have been encouraged to export their way out of recession through gains to competitiveness, achieved through productivity improvements (i.e. efficiency gains, or alternatively holding down wages or cutting jobs).
Chart 4 (above) showed that some countries delivered; there was significant post-crisis productivity growth for nearly all periphery economies. But the OECD and IMF are now worried that gains in productivity came at the expense of domestic demand (the result of high unemployment and depressed earnings), and are a factor in emerging deflationary pressures.
Chart 11 confirms that, since recovery from the great recession began, for most countries export growth has been relatively strong (although not for the UK), and this is particularly so for periphery countries.
Chart 11: Export growth, percentage change from 2009Q2 to 2014Q1
But across countries the effect of robust exports on overall GDP growth has been negligible, and in some cases negative. Figures 11a (gross) and 11b (net)12
12 The former shows both exports and imports separately, the latter just the difference as net trade.
rank countries by growth since the trough of the crisis, with a decomposition showing contributions from the different sources of demand. They show very clearly that gross and net trade have been most important in the weakest countries. But no matter how strong trade has been, in periphery countries this has not been enough to offset weakness in domestic demand. Moreover the scale of the contribution of net trade to growth varies in a fairly arbitrary manner; the decisive factor in growth is the extent of domestic demand and not the extent of trade.
-10 0
10 20 30 40 50 60 70 80
Nor
way
Fi
nlan
d N
ew Z
eala
nd
Uni
ted
King
dom
De
nmar
k Ic
elan
d Ch
ile
Cana
da
Luxe
mbo
urg
Swed
en
Belg
ium
Ire
land
Fr
ance
Sw
itzer
land
Au
stria
N
ethe
rland
s Ita
ly
Euro
pean
Uni
on (2
8 …
Euro
are
a (1
8 …
Aust
ralia
Sl
oven
ia
Uni
ted
Stat
es
Port
ugal
Sp
ain
Germ
any
Isra
el
Hung
ary
Pola
nd
Japa
n Cz
ech
Repu
blic
Tu
rkey
Ko
rea
Slov
ak R
epub
lic
Esto
nia

Productivity: no puzzle about it ESAD, February 2015 19
Figure 11a: GDP and contributions to growth (gross), 2009Q2 to 2014Q1
Figure 11b: GDP and contributions to growth (net), 2009Q2 to 2014Q1
-60
-40
-20
0
20
40
60
80
Port
ugal
Sp
ain
Italy
Sl
oven
ia
Net
herla
nds
Icel
and
Euro
are
a De
nmar
k Fi
nlan
d Hu
ngar
y EU
(28)
Ire
land
Cz
ech
Repu
blic
Fr
ance
Be
lgiu
m
Nor
way
Au
stria
U
nite
d Ki
ngdo
m
Japa
n Sw
itzer
land
Lu
xem
bour
g U
nite
d St
ates
Ge
rman
y N
ew Z
eala
nd
Cana
da
Slov
ak R
epub
lic
Aust
ralia
Sw
eden
Po
land
Es
toni
a M
exic
o Is
rael
Ko
rea
Chile
Tu
rkey
imports
exports
investment
government
consumer
GDP
-20
-10
0
10
20
30
40
Port
ugal
Sp
ain
Italy
Sl
oven
ia
Net
herla
nds
Icel
and
Euro
are
a De
nmar
k Fi
nlan
d Hu
ngar
y EU
(28)
Ire
land
Cz
ech
Repu
blic
Fr
ance
Be
lgiu
m
Nor
way
Au
stria
U
nite
d Ki
ngdo
m
Japa
n Sw
itzer
land
Lu
xem
bour
g U
nite
d St
ates
Ge
rman
y N
ew Z
eala
nd
Cana
da
Slov
ak R
epub
lic
Aust
ralia
Sw
eden
Po
land
Es
toni
a M
exic
o Is
rael
Ko
rea
Chile
Tu
rkey
net trade
investment
government
consumer
GDP

Productivity: no puzzle about it ESAD, February 2015 20
Very clearly on both charts positive government, investment and consumer demand make all the difference to aggregate GDP growth. So in the current economic context productivity gains achieved through increased competitiveness have not led to substantial improvements in GDP.
This further strengthens the argument that productivity should be understood as an inevitable consequence of poor demand, not as a causal force. Where productivity gains have been seen, this analysis shows that they reflect increased unemployment rather than structural improvements in economic capacity. Without stronger domestic demand, higher employment and higher wages (and consequently sustainable future growth prospects) will not be achieved.
6. The policy response
This report shows the importance to the UK’s future economic prospects of government acting to boost demand, rather than more austerity. Securing a strong, sustainable recovery where rising employment is accompanied by substantial increases in earnings and falling under-employment should be the government’s central priority.
The TUC has given specific consideration to policy solutions which could help deliver such an approach to improving our public finances. In May 2013 the TUC outlined proposals for £30bn spending on infrastructure projects, to boost growth in the short term and increase potential in the longer term. More specifically, HS2 investment will be a huge opportunity for employment gains, given investment in key destination hubs and should be accompanied by substantial further investment in regional transport networks.
New green energy infrastructure is essential to secure the UK’s climate change objectives as well as modernise the economy. Investment in carbon capture and storage technology and in domestic energy efficiency are two standout priorities.
The entrenched housing shortage has a detrimental effect on the nation’s health, education and labour mobility. The National Housing Federation has estimated that every 10,000 new homes built adds £1.1 billion to the UK economy. The government needs to support and incentivise the large-scale building of social and affordable housing.
Pay is another area for priority action. The earnings of hard-working public servants have been held back for five years, and in some cases for even longer. A substantial demand boost could be delivered through lifting pay caps. Wider action is also needed to bosst the national minimum wage and lift wages for low and middle earners across the economy.
The TUC has also long argued that there are long-standing supply-side weaknesses with the economy. These coincide with a number of factors that have been used by others to explain weak productivity. But while they do not explain the recent productivity puzzle, these supply factors are still relevant to the

Productivity: no puzzle about it ESAD, February 2015 21
performance of the economy on longer horizons. Moreover, some of these policies aimed at improving supply in the long term will also work with a demand boost in the short term.
UK investment has under-performed against other economies for decades, and is close to the bottom of a league table of investment as a share of GDP.
In part this has been driven by failure in the UK’s banking system. For decades the banking system fostered a speculative rather than productive economy, based on asset and debt inflation, skewed against manufacturing and externally facing sectors. Reform is needed to the entire structure of the banking system, so that it is based on a diverse range of institutions (e.g. regional, mutually owned), including the establishment of a state investment bank capitalised on a large scale and able to create credit. The Green Investment Bank, vital to securing the funds necessary to boost technological innovation, needs to be expanded and given powers to borrow from the capital market.
Corporate governance based on shareholder primacy is also increasingly leading to a divergence between national economic priorities and institutional interests, driving a culture of short-termism that holds back growth. Changes are required that give primacy to securing long-term corporate growth, including reframing directors’ duties and restricting shareholder corporate governance rights.
An active industrial policy is now increasingly recognised as essential. We need a commitment to increase expenditure in support of supply chains, a major study of trading possibilities with China, and increased funding for the Technology Strategy Board (now called Innovate UK).
The skills challenges faced by the UK are also widely understood. Skill budgets should be fully reinstated; there should be training tax relief for adults and reimbursement schemes for younger people for necessary expenses.
The UK economy faces both demand and supply-side challenges – but the latter will not be met unless we boost demand. The government needs to reverse austerity and act on the wider structural challenges the UK economy has faced for many decades.
7. Conclusions
Policymakers who ignore demand factors continue to explain failures of economic outcome as productivity problems. Their inability to understand the root demand causes leads them to describe this failure as the productivity puzzle.
But there is no puzzle about it. It is simply a failure to see the economic consequences of austerity and the need to promote growth, earnings and employment.
What is more, future outcomes risk becoming affected by this lacuna so that judgements become self-fulfilling and make austerity longer and deeper. As a

Productivity: no puzzle about it ESAD, February 2015 22
result, the economy may operate substantially below potential on a permanent basis and the structural challenges the UK economy faced before the crash may become even further exacerbated.
The analysis in this report shows how wrong those who claim productivity is the cause of our economic woes are. Austerity has led directly to weaker economic growth, not only in the UK but across the world. Weaker growth has meant reduced growth in total labour income, and in the UK this has been met through greatly reduced wages growth. Lower productivity follows simply as an arithmetic consequence of this adjustment, with lower economic growth set against ongoing growth in the employment headcount. As the current poor level of productivity is caused by weak demand, it will be boosted by stronger demand growth.
The TUC has long recognised potential supply-side weaknesses and the need for associated policies aimed at banking, industry, public and private fixed investment and skills, and as this report has shown continues to make the case for their resolution. But the fundamental conclusion of the analysis here is that any such changes come in second place to the necessity of increased demand to aggregate outcomes.
8. Bibliography
Barnett, Alina, Sandra Batten, Adrian Chiu, Jeremy Franklin and Maria Sebastia-Barriel (2014) ‘The UK productivity puzzle’, Bank of England Quarterly Bulletin, 2014 Q2, 114-28.
Broadbent, Ben (2012) ‘Productivity and the allocation of resources’, Speech at Durham Business School, 12 September.
Bill Martin and Robert Rowthorn (2012) ‘Is the British economy supply constrained II? A renewed critique of productivity pessimism’, Centre for Business Research, University of Cambridge, May.
Office for Budgetary Responsibility (2012) Economic and fiscal outlook, December.
OECD (2014) OECD Employment Outlook 2014, OECD publishing.
Weale, Martin (2014), ‘The UK productivity puzzle: an international perspective’, Speech to the Mile End Group, Queen Mary, University of London, 8 December.