productivity dynamics in india’s service sector: an industry-level perspective · 2016-10-07 ·...
TRANSCRIPT

ISSN No. 2454 – 1427
CDE October 2016
PRODUCTIVITY DYNAMICS IN INDIA’S SERVICE SECTOR: AN INDUSTRY-LEVEL PERSPECTIVE
K L KRISHNA Email: [email protected]
Centre for Development Economics, Delhi School of Economics, Delhi, India
DEB KUSUM DAS
Email: [email protected] Department of Economics
Ramjas College, University of Delhi, India
ABDUL A ERUMBAN Email: [email protected]
The Conference Board and University of Groningen
SURESH AGGARWAL Email: [email protected]
Department of Business Economics University of Delhi, South Campus, India
PILU CHANDRA DAS
Email: [email protected] Dyal Singh Evening College
University of Delhi, India
Working Paper No. 261
http://www.cdedse.org/pdf/work261.pdf
CENTRE FOR DEVELOPMENT ECONOMICS DELHI SCHOOL OF ECONOMICS
DELHI 110007

Productivity Dynamics in India’s Service Sector: An Industry-level Perspective
K L KRISHNA
Centre for Development Economics, Delhi School of Economics, Delhi, India
DEB KUSUM DAS Department of Economics
Ramjas College, University of Delhi, India [email protected]
ABDUL A ERUMBAN The Conference Board and University of Groningen
SURESH AGGARWAL Department of Business Economics
University of Delhi, South Campus, India [email protected]
PILU CHANDRA DAS Dyal Singh Evening College
University of Delhi, India [email protected]
Abstract
The rapid rise of service sector in India, as in its developing counterparts in Asia, follows the pattern of skipped industrialization and raises concern for sustaining economic growth in India. While the share of services in India’s GDP has risen over much of the post-independence period, the economic liberalization in the 1990s paved the way for the emergence of service sector as a key player in India’s growth story. The present paper examines the productivity dynamics in service sector at detailed industry level—the India KLEMS (K = capital, L = labor, E = energy, M = materials, and S = services) panel dataset version 2015. Our results suggest that labor productivity in Indian service sector has been growing substantially over decades, and much of this productivity gain is accruing through acceleration in market services labor productivity. This observed productivity gain in market services, and in particular information and communications technology (ICT) intense services, might indicate the role of increasing ICT in contributing to labor productivity growth. The labor reallocation effect is positive for the period 1980–2011 and has increased in the 2000s, suggesting a structural transformation which is growth enhancing. The paper also examines the dynamics of total factor productivity in the service sector, measured using KLEMS growth accounting framework. The observed growth pattern in the service sector has not been uniform across all services in India. The performance of market-based ICT intensive sectors is impressive, especially in telecommunications and financial services. However, by and large, we find a dominance of capital deepening in accounting for growth. Key words: labor productivity, resource allocation, services, India JEL classification: 041; 047; 053
October 2016
This paper is a revised version of the paper prepared as part of the deliverables 2015 of the “Disaggregate Industry Level Productivity Analysis for India: The KLEMS Approach” research project at Centre for Development Economics (CDE), Delhi School of Economics. The paper was presented at the session “Service Sector in Asia” at The Economics of Services: Microfoundations, Measurement, and Productivity Policy,the 2nd Hitotsubashi Summer Institute, Sano Shoin Hall, Hitotsubashi University, Tokyo, August 4-5, 2016. The authors thank Rupa Chanda (IIM Bangalore) for comments on an earlier version of the paper. We also thank Arup Mitra for his comments as discussant on the presentation of the paper at the annual workshop in CDE on December 17, 2015. Shomak Chakraborty provided research

2
assistance including drafting the review of services in India. The authors thank B N Goldar for research guidance on the paper. The authors gratefully acknowledge the financial support from Reserve Bank of India in building the India KLEMS dataset. The usual disclaimers apply. For correspondence, email: [email protected]
3
1. Introduction Understanding the drivers of economic growth is hugely beneficial for low-income countries like India as it is directly related to improving the living standards of its population. Often productivity improvements in manufacturing industries are considered as one of the major sources of growth. This idea is analogous to the traditional structural transformation hypothesis that as a country develops, resources move from primary to manufacturing and subsequently to services (see Kuznets, 1966). The experience in India, however, seems to suggest that the country has been pioneering a stage of development that defies the conventionally hypothesized structural transformation. Indian economy has been witnessing a service-driven growth, particularly since 1990s, though it still remains in the category of low-middle income emerging countries. While the share of services in India’s GDP has risen over much of the post-independence period, there was a marked acceleration in the trend since the early 1990s. Similarly, the relative importance of services sector in employment generation has also increased substantially. Moreover, the export share of services has been large and increasing in recent years (Eichengreen and Gupta, 2012). The economic reforms of the 1990s paving the way for trade liberalization along with major policy changes in domestic business environment may have helped the emergence of service sector as a key player in India’s growth story. Traditionally, services have been a regulated activity. This was particularly true in areas of banking, insurance and telecommunication, which are among the sectors that witnessed massive improvement in the post-reform period. Further, this sector has evolved as a prominent sector in terms of contribution to national and state incomes, trade flows, FDI, and employment. The emergence of services as the most dynamic sector of the Indian economy has in many ways been a revolution. The most visible and well-known dimension of the take-off in services has been in software and information technology (IT)–enabled services (including call centers, software design, and business process outsourcing), which to some extent also help increase innovation capabilities in the sector (Lema et al., 2012). However, growth in services in India has been much more broad-based than IT (Gordon and Gupta, 2004). There have been many studies looking into India’s service-driven economy (Eichengreen and Gupta, 2009, 2010), and its sluggish manufacturing. While studies on structural transformation suggest that the observed structural transformation in India has been growth enhancing (McMillan and Rodrik, 2011; Bosworth and Collins, 2008; Vries et al., 2012), evidence on services sector suggests that the observed growth surge is mainly due to higher productivity growth in this sector (Verma, 2012). However, there has hardly been any attempt to explain the observed momentum in the service economy in detail, particularly by looking into how productive the sector is and what are the factors that drive the productivity in this sector. This paper attempts to revisit the “Services-led Growth” hypothesis for the Indian economy by undertaking detailed analysis of the service industries in terms of labor productivity and multifactor productivity growth. An attempt is made to explore the factors that drive productivity performances in the service sector. Yet another aspect that has been overlooked in the literature is the complementarities between service sector growth and manufacturing performance, which calls for understanding why productivity improvement in the manufacturing sector continues to be slow and low. The examination of the above issues constitutes the core of our paper. In order to understand the empirics of India’s growth performance, we undertake a growth accounting exercise based on the KLEMS production function approach due to Jorgenson, Gollop and Fraumeni (1987). The gross output production function incorporating KLEMS as inputs allows us to evaluate the relative significance of multifactor productivity growth Vis a Vis input accumulation in accounting for output growth. Using the newly created comprehensive India KLEMS dataset version 2015 for the Indian economy for the period 1980-2011, we compute productivity trends for the service sector. We analyze

4
sources of labor productivity in 9 subsectors of the service economy—trade, hotels and restaurants, transport and storage, post and telecommunication, financial services, public administration, education, health and other services. These 9 subsectors are further reclassified into market services and nonmarket services, within which we also examine ICT intensive and non-ICT service segments separately. Our measure of productivity is based on the gross output approach at industry level as it accurately reflects the contribution of intermediate inputs. The paper makes a number of contributions to the existing literature. First, in contrast to previous productivity studies in the Indian context, we use more measures of factor inputs, which will have important consequences for productivity analysis (see OECD, 2001, Productivity manual). Both labor and capital inputs are measured as Tornqvist indices of different types of workers and asset types. Labor input, which is inclusive of self-employment, is measured using five education categories of employment, with the growth of each category being weighted by its relevant cost share. In the case of capital input, previous studies have used a measure of capital stock, often making no adjustment for depreciation of various asset types. Such an approach ignores the importance of heterogeneity in capital asset due to the existence of multiple vintages and various asset types. In our measurement, we use a measure of capital services using 3 different asset types, asset-specific depreciation rates and an external rate of return (see Diewert, 2003; Schreyer, 2002). Our second contribution is in providing a detailed sectoral perspective on India’s service sector. Since there is substantial heterogeneity within service sector, and the contribution of different segments of the sector to aggregate service sector growth is substantially different, we examine the productivity dynamics in service sector at detailed industry level. Our detailed focus on several sectors also helps in understanding the respective position of market services as against nonmarket based services, and ICT using and producing services as against non-ICT services in the overall service sector performance in India. Third, at industry level we use a gross output production function, which includes contribution of intermediate inputs in the production accounts. The time period of the study pertains from 1980-81 (1980) till 2011-12(2011) and is split into three distinct periods of Indian Economy. We adopt the classification provided by Panagariya et al. (2014)1 as period 1 (1980-1993)—a period where India’s per capita GDP grew at an average annual rate of 2.9 percent. The second period consists of years 1993-2002, during which India’s per capita GDP grew at an annual rate of 3.9 percent. The final period is from 2003-2011 when the per capita GDP grew at the rate of 6.9 percent.
The paper is structured as follows. Following the introduction, Section 2 provides an overview of service sector in India with a focus on policy as well as regulatory environment and its impact on value added, employment. The methodology and dataset including the construction of variables are outlined in Section 3. Trends in productivity in the services sector are analyzed in Section 4. In particular, using a value added framework we decompose the sources of observed labor productivity growth and the role of TFP versus factor inputs is addressed via the gross output-based KLEMS framework. The final section concludes the paper.
2. Service Sector in India: Policies and Performance
1 Refer to Chapter 2: Growth and Development in the Indian States - An overview in Panagariya et al. (2014), State
level Reforms, Growth and Development in Indian States.
5
Unlike the East Asian model, the service sector played a predominant role in the transformation of India from its “Hindu rate of growth” phase to one of the fastest growing countries in the world. This rather unique feature of the Indian economy makes a detailed analysis of the service sector a pertinent topic in the literature. In what follows, we first provide some of the basic concepts of the Service Sector in the Indian context. This is succeeded by the reforms and policies that have been aimed at this sector. We end this section by giving an overview of the performance of the service sector in India and comparing it with the traditional driver of economic growth—manufacturing. The service sector encompasses within itself a plethora of diverse and heterogeneous economic activities. It is for this basic reason that it has become increasingly difficult to give a precise definition to the activities pertaining to this sector. In India’s National Accounts Statistics, the service sector consists of the following economic activities: wholesale and retail trade, hotels and restaurants, transport services, storage services, communication services, financial services, real estate, ownership of dwellings and renting services, business services and other social, community and personal services. In terms of measurement, it is probably more difficult to measure than goods, as services often represent a process by which a consumer is charged—hence there are conceptual problems in both “quantity” and “quality” of services (Melvin, 1995). For collection of data and analysis, the subsectors are further categorized into public, private organized, and private unorganized. The public sector estimates of gross value added are obtained from data on output and intermediate outputs from budget documents. For some sectors of the private organized segment and most of the private unorganized segment, value added is computed using the ‘labor input’ method—multiplying the estimates of value added per worker in a benchmark year with the estimated labor force from census surveys (Nayyar, 2012). However, each of the methods of measurement has their own problems. Given that output of service sector has often measured in terms of employee compensation, an increase in wages would imply an increase in real output even with the same actual activities. On the other hand, the quality of the crucial components of the ‘labor input’ method—estimates of the workforce and estimates of value added per worker—are pretty low (Tendulkar, 2007). Lastly, the lack of suitable service sector price index depletes the precision of constant price estimates of this sector. With these limitations and concepts in mind, it is interesting to ascertain the role of the Service Sector as the primary driver of India’s growth performance. The two panels in Table 2.1 provide a comprehensive analysis of the Service Sector’s contribution to Gross Value Added (GVA) and employment. Services contribution to GVA stands at around 55 percent per annum in 2010 from around 40 percent in 1980, with market based services as the largest component. At the outset, it may be argued that the growth in services can be attributed to increase in relative prices or as a result of outsourcing of activities (or splintering) causing the growth of final demand for industrial or agricultural products to raise the share of services in GDP. Yet, none of these arguments hold true from data—implicit GDP price deflators during 1993-2010 did not increase noticeably. Moreover, increase in the use of services inputs by other sectors over time cannot explain the recent surge in the growth of the services sector (Gordon and Gupta, 2004; Nayyar, 2012). Thus services growth in India was real rather than a statistical artifice. Unlike agriculture, services contribution to employment remains low and noncommensurate with the movement in Service’s share in GVA. Yet we find there has been a consistent upward movement as far as “jobs in service sector” is concerned from 16 percent share in total employment in 1980. As in the case of value added, we find the employment share in market services (16%) exceeds that of nonmarket services (11%). There may be many reasons for the relatively low employment absorption in the services sector. Nayyar (2012) finds that educational requirements vary across different subsectors in the service sector and manifests itself through low quality of employment.

6
Table 2.1 Relative contribution of services industries to gross value added and employment
Panel A: Gross value added share by services industry, 1980-2010 Description 1980 1990 2000 2010
Total services 39.53 44.07 50.98 54.64
Market services 19.38 23.55 29.93 34.86
ICT intensive services 14.74 17.35 22.51 27.19
Trade 10.68 11.69 13.21 15.77
Financial Services 2.97 3.86 5.41 5.66
Post and Telecommunication 0.57 0.91 1.52 1.10
Business Services 0.52 0.90 2.37 4.65
ICT non-intensive services 4.64 6.20 7.42 7.68
Hotels and Restaurants 0.80 0.96 1.32 1.48
Transport and Storage 3.84 5.25 6.10 6.19
Non-market services 20.15 20.52 21.05 19.78
Public Administration and Defense 5.01 5.89 6.52 6.10
Education 2.45 3.08 4.13 3.94
Health and Social Work 0.93 1.22 1.60 1.53
Other services 11.76 10.34 8.80 8.22
Panel B: Labour employment share by services industry, 1980-2010
Description 1980 1990 2000 2010
Total services 16.94 20.03 23.69 28.20
Market services 9.12 11.84 15.27 17.99
ICT intensive services 6.43 8.35 10.73 12.42
Trade 5.80 7.35 9.16 9.79
Financial Services 0.31 0.51 0.58 0.90
Post and Telecommunication 0.14 0.18 0.34 0.40
Business Services 0.18 0.30 0.66 1.33
ICT non-intensive services 2.70 3.50 4.54 5.57
Hotels and Restaurants 0.80 0.92 1.18 1.47
Transport and Storage 1.90 2.58 3.37 4.10
Non-market services 7.81 8.18 8.42 10.21
Public Administration and Defense 2.75 2.85 2.49 2.00
Education 1.58 1.63 2.17 2.79

7
Health and Social Work 0.58 0.56 0.72 0.91
Other services 2.90 3.15 3.04 4.51
Source: Authors’ computation from National Accounts Statistics, Government of India Our observation from contribution of services’ exports in terms of domestic and foreign value added is addressed in Figure 2.1 where we find that service content of India’s exports are higher than the OECD average. Further, this points to the fact that the services’ exports are more than 60 percent of total exports and are performing better than comparable countries like China and Brazil. It also points towards the growth and sustainability of services in India. Figure 2.1: Service contents of gross exports: India and others (2011)
Source: Trade in Value Added-India, OECD-WTO, October 2015 A proper appraisal of the performance of India’s Service Sector is incomplete without providing an overview of the policies and reforms that governed this sector. Post World War II India has been historically known to be one of the most regulated economies at the time. “Inward” looking policies and the “license-raj” constrained the economy to a very low growth path. This historical trend was overturned through a series of liberalization policies that brought an end to excessive governmental monopoly and regulation. On a more conceptual level, the different policies aspects governing the service sector in India can be categorized into: (1) general issues and (2) sector specific issues. General issues are broadly connected with foreign direct investment (FDI), tariff and taxes; credit and finance. In addition issues connected with domestic regulation, market access, bilateral and multilateral negotiations are significant policy issues when addressing reforms in service sector in India. Major sector specific issues are primarily connected with the level of permissible FDI and thereby the extent of foreign competition allowed in those subperiods. Prasad and Sathish (2010) provides comprehensive analysis of the policies undertaken in the service sector in recent years (see Table A of Appendix). To take a few examples, entry of foreign firms through partnerships/joint ventures in insurance firms as well allowing FDI in health insurance have characterized the Banking and Insurance sector in recent times. In the banking sector, though foreign investment cap of 74 percent is allowed, still issues remain regarding licensing requirements, etc. Health care has no FDI cap, but there remains barrier on

8
foreigners providing medical services for profit. Education services in India come under the jurisdiction of both state and federal governments and there are regulations on setting up of new education services in some fields like medicine, etc. Thus, as it stands now, there are regulators for some services (banking, insurance, telecom, and ports), whereas most professional services lack independent regulators resulting in unevenness of standards across professional services.2 For example, Prasad and Sathish (2010) argue that lack of a proper all-India accredited system legitimizes foreign restrictions. This is particularly true in case of services like Bar Councils of India, Medical, Dental and Nursing Councils of India and Institute of Chartered Accountants of India to name a few. Nonetheless, the large scale liberalization measures have shown a positive impact in the contribution of services to India’s trade flows. This share has been on the rise since the 1990s, going up from 0.6 percent in 1990 to around 3 percent in 2009-10. Despite the impressive performance of services trade in India, it would be correct to point out that exports of services still remain constrained by domestic and external barriers (infrastructure, technical, standards financial) and regulatory aspects. It is important to bear in mind that many services sectors provide crucial inputs to other sectors and hence more efficient services sector could enhance competitiveness in the overall economy. We began this section by pointing out the fact that India’s growth story is unique and distinct from the other East Asian Models. Most of them have treaded the traditional path of growth being driven by an upsurge in manufacturing. Hence, it may be interesting to compare the dynamics of manufacturing vis-a-vis services in the Indian context to shed light on the unique growth path that has taken shape in the country. The broad path of the two sectors can be seen in Figure 2.2.3 The share of manufacturing has remained stagnant at around 15 percent throughout the entire period while that of services show a clear upward trend, especially since the 1990s. There has been a considerable amount of studies that look into the demand and supply side factors affecting the services growth in India. Supply side factors that played a major role include an abundant supply of skilled workers as well as the liberalization reforms undertaken in the 1990s. For instance, (Kochar et al., 2006). Liberalization, on the other hand, affected the service sector both directly and indirectly—directly through opening up to FDI and private ownership, and indirectly through easier and cheaper access to factor services (Murthy, 2004). On the demand side, the government final consumption doesn’t seem to be a significant factor in the services story. However, business services exports seem to be an important demand side contributor. On the contrary, there are studies which attribute high income elasticity of demand from services as a major factor in the growth of the services sector (Rakshit, 2007; Eichengreen and Gupta, 2010). These results are corroborated in the analysis provided in Nayyar, 2012. Services trades, GDP levels, liberalization and private consumption are found to significantly affect the share of services in GDP while enrolment rates in higher education and relative price of service output do not show any impact. Moreover, the 1980s saw the emergence of sizeable middle class and the growing demand for services (Jain and Ninan, 2010). On the other side of the spectrum, it may be argued that it takes several decades for manufacturing performance to respond to changes in the policy environment. Many studies have pointed towards lagged impact of trade liberalization on manufacturing productivity in general and in India (Das, 2005). Figure 2.2: Gross value added shares (%) in manufacturing and service sectors, 1980–2011 2 Prasad and Sathish (2010) argue that lack of a proper all-India accredited system legitimizes foreign restrictions. This is
particularly true in case of services like Bar Council of India, Medical, Dental and Nursing Councils of India and Institute of Chartered Accountants of India, to name a few.
3 It is important to note that unlike many developing countries, India showed considerable resilience to the global economic crisis by recording a growth of 6.7 percent in 2008-09 and service sector being the main driver of this growth by contributing around 88 percent of the observed growth (Das, Banga and Kumar, 2011).

9
Source: Authors’ computation from National Accounts Statistics, Government of India Breaking up into three time periods, Figure 2.3 clearly depicts that service sector absorbs more workforce in relation to manufacturing in India. It is evident from the above that services led manufacturing as far as employment creation goes, however we need to delve beyond these numbers to ascertain the kind and quality of employment that services are generating in India. It will be interesting to note that Nayyar (2009) argued that generally subsectors of services in India are providers of both “good” and “bad” employment and prevalence of low quality employment with low educational requirements typifies the Service Sector. In addition, the service sector is relatively more skill demanding than manufacturing and therefore service sector is unlikely to be a destination for the millions of low skilled job seekers in India (Ramaswamy et al., 2012). The bottom panel of Figure 2.3 corroborates the gap between the shares of services and manufacturing seen in Figure 2.2. Looking at the 32-year period 1980–2011, we find on an average a growth of 7 percent per annum. The growth momentum of the 1990s accelerated to an average of 9 percent per annum in the period of 2003-2011 and substantiates the role played by services growth in India even during the period of global financial crisis. Figure 2.3: Comparison of growth rates between manufacturing and services; 1980–2011
(% per annum) Panel A: Comparison of growth rates of employment, 1980–2010
Panel B: Comparison of growth rates of gross value added, 1980–2010
0.00
10.00
20.00
30.00
40.00
50.00
60.00
1980
1981
1982
1983
1984
1985
1986
1987
1988
1989
1990
1991
1992
1993
1994
1995
1996
1997
1998
1999
2000
2001
2002
2003
2004
2005
2006
2007
2008
2009
2010
2011
Manufacturing Services
2.18
2.24
1.23
1.92
3.73
3.29
3.00
3.39
0.00 0.50 1.00 1.50 2.00 2.50 3.00 3.50 4.00
1980 -93
1994-02
2003-11
1980-11
Services Manufacturing

10
Source: Authors’ computation from National Accounts Statistics, Government of India The broad trends characterizing the services growth do indeed bring out some interesting aspects on India’s growth story. However, given the variety of economic activities that the Service Sector encompasses, it is worth looking at the trends at the subsector level. We observe from Figure 2.4 that service sector growth is widespread across activities. In accounting for growth in value added in different sectors, we find that post and telecommunication shows the maximum growth (around 15% per annum) for the period 1980-2011. If we consider the period 2003-2011, we find that post and telecommunications and financial services exhibiting high growth rates of around 23 percent and 12 percent respectively. The telecommunication liberalization began in 1994 with the private sector being allowed to offer telecom services. The rapid innovation in IT makes it a dynamic contributor to the growth of the Indian economy by itself (Singh, 2014). The domestic IT and hardware market has also become substantial in size and scope, although the value added for the latter is probably less than software and ITES. On the contrary, the employment generating potential of service sector in India has been the subject of intense debate on sustainability of service sector growth in India. Issues related to skilled versus unskilled nature of labor force requirements have been at the core, based on access to education and training. A glance at the panel B of Figure 2.4 shows that post and telecommunication and financial services have been the major providers of employment. Further, majority of the sectors show an employment growth of around 3 percent for the period 1980-2011. Figure 2.4: Growth rates of value added and employment, 1980 to 2011 (% per annum)
Panel A: Growth rates of gross value added
0.00 1.00 2.00 3.00 4.00 5.00 6.00 7.00 8.00 9.00
1980 -93
1994-02
2003-11
1980-11
5.16
6.39
8.51
6.49
6.29
7.37
8.93
7.37
Services Manufacturing

11
Panel B: Growth rates of employment
Source: Authors’ computation from National Accounts Statistics, Government of India While there is broad agreement about the dynamism of the service sector, questions have been raised about the sustainability of services growth (Acharya 2002; Bosworth, Collins & Virmani 2007; Panagariya 2008). Singh (2006A) argues that services had proportionately the largest inducing effect in terms of backward linkages as well as forward linkages (albeit weaker than backward linkages). These linkages, the author argue, had an important impact in the reduction of transaction costs during the 1980s and 1990s and subsequently stimulated the entire economy to an extent. Moreover, introduction of a range of rural ICT services provides spillovers from ICTS through knowledge acquisition and information access Singh (2006B). Several policy implications emerge from the analysis—tackling education and technological bottlenecks and some labor market reforms that improve the innovation capabilities in the economy can go a long way to solve the service sector to increase its scope and labor absorption abilities and continue to remain dynamic for leading India’s economic growth. We need to infer if the driver of the service sector growth in India can be explained through improvements in resource use efficiency (both labor and total factor productivity growth)? The rest of the paper will make an attempt in this direction.4
4 Rubina Verma (2012) attempts to account for the rapid growth of the service sector observed in India during 1980-2005. A growth accounting exercise shows that total factor productivity (TFP) growth was the fastest for services sector
0.05.0
10.015.020.025.0
1980 -93 1994-02 2003-11 1980-11
-2.00.02.04.06.08.0
10.012.0
1980 -93 1994-02 2003-11 1980-11
12
3. Methodology and Dataset In this section, we discuss the respective frameworks for computing productivity in the individual industries in the services sector in Indian economy. The concept of labor productivity used in the present paper is defined as real output per unit of labor input. Typically, the labor input is measured in terms of hours worked. However in the case of India, the data on hours worked are either not available or are of low quality and hence labor input is measured in terms of the number of persons.5 Further, TFP, which is defined as real output per unit of all (combined) inputs (also called multifactor productivity) is also computed. It is often assumed that TFP is a measure that corresponds to the theoretical concept of technological progress. However, in practice TFP captures the impact of several factors (such as improvements in organization and in the quality of labor and capital), such that its evolution cannot automatically be associated with purely technological advances. The relationship between labor productivity and TFP, as well as other determinants of real output per capita growth, can be illustrated using the standard growth accounting framework.6
Measuring Productivity Growth for Individual Industries
Sectoral TFP growth is measured using the standard growth accounting approach (see Jorgenson et al., 2005) using both gross output—using factor inputs capital (K), labor (L), energy (E), material (M) and services (S)— and value added functions—using K and L only. In the latter case, it is assumed that gross output production is separable in capital, labor and technology. Let the production function for industry j be denoted by
𝑌𝑌𝑗𝑗 = 𝑓𝑓𝑗𝑗(𝐾𝐾𝑗𝑗, 𝐿𝐿𝑗𝑗,𝐸𝐸𝑗𝑗,𝑀𝑀𝑗𝑗, 𝑆𝑆𝑗𝑗,𝐴𝐴𝑗𝑗) (3.1) Where Y is industry gross output, K is capital input, L is labor input, E is energy input, M is material input S is services input, and A is an indicator of technology, in any industry j. All variables vary over time t, but the t subscript is not shown explicitly, for the sake of simplicity. Assuming constant returns to scale, and perfect competition, industry output can be decomposed into the contribution of factor inputs and TFP using a Tornvqvist aggregation in the following manner:
∆𝑙𝑙𝑙𝑙𝑌𝑌𝑗𝑗 = �̅�𝑣𝐾𝐾,𝑗𝑗𝑌𝑌 ∆𝑙𝑙𝑙𝑙𝐾𝐾𝑗𝑗 + �̅�𝑣𝐿𝐿,𝑗𝑗
𝑌𝑌 ∆𝑙𝑙𝑙𝑙𝐿𝐿𝑗𝑗 + �̅�𝑣𝐸𝐸,𝑗𝑗𝑌𝑌 ∆𝑙𝑙𝑙𝑙𝐸𝐸𝑗𝑗 + �̅�𝑣𝑀𝑀,𝑗𝑗
𝑌𝑌 ∆𝑙𝑙𝑙𝑙𝑀𝑀𝑗𝑗 + �̅�𝑣𝑆𝑆,𝑗𝑗𝑌𝑌 ∆𝑙𝑙𝑙𝑙𝑆𝑆𝑗𝑗 + ∆𝑙𝑙𝑙𝑙𝐴𝐴𝑗𝑗𝑌𝑌 (3.2)
and the gross output-based TFPG is obtained as a residual, which is as follows:
∆𝑙𝑙𝑙𝑙𝐴𝐴𝑗𝑗𝑌𝑌 = ∆𝑙𝑙𝑙𝑙𝑌𝑌𝑗𝑗 − �̅�𝑣𝐾𝐾,𝑗𝑗𝑌𝑌 ∆𝑙𝑙𝑙𝑙𝐾𝐾𝑗𝑗 − �̅�𝑣𝐿𝐿,𝑗𝑗
𝑌𝑌 ∆𝑙𝑙𝑙𝑙𝐿𝐿𝑗𝑗 − �̅�𝑣𝐸𝐸,𝑗𝑗𝑌𝑌 ∆𝑙𝑙𝑙𝑙𝐸𝐸𝑗𝑗 − �̅�𝑣𝑀𝑀,𝑗𝑗
𝑌𝑌 ∆𝑙𝑙𝑙𝑙𝑀𝑀𝑗𝑗 − �̅�𝑣𝑆𝑆,𝑗𝑗𝑌𝑌 ∆𝑙𝑙𝑙𝑙𝑆𝑆𝑗𝑗 (3.3)
or equivalently as follows: 5 The number of persons employed in India refers to persons usually employed either in principal or in subsidiary activities for major period of the year. 6 In this context, real output per capita (YPC) can be decomposed into two main factors: labor productivity and labor utilization (defined here as hours worked per head of total population). Both main factors can be decomposed further into a number of components. Labor productivity is a function of TFP, capital intensity (i.e., capital per unit of labor input K/H) and labor quality (LQ). Labor utilization can be decomposed into four components: average hours worked; the unemployment rate (UR); the participation rate (PR); and the share of the working age.

13
∆𝑙𝑙𝑙𝑙𝐴𝐴𝑗𝑗𝑌𝑌 = ∆𝑙𝑙𝑙𝑙𝑌𝑌𝑗𝑗 − ∑ �̅�𝑣𝑖𝑖,𝑗𝑗𝑌𝑌 ∆𝑙𝑙𝑙𝑙𝑋𝑋𝑖𝑖,𝑗𝑗𝑆𝑆
𝑖𝑖=𝐾𝐾 (3.4) Where Xi,j = capital, labor, energy, material and services inputs in industry j; v�i,jY= compensation share of input i in total nominal output, averaged through year t and t-1, i.e., �̅�𝑣𝑖𝑖,𝑗𝑗𝑌𝑌 = 0.5(�̅�𝑣𝑖𝑖,𝑗𝑗,𝑡𝑡
𝑌𝑌 + �̅�𝑣𝑖𝑖,𝑗𝑗,𝑡𝑡−1𝑌𝑌 ), with �̅�𝑣𝑖𝑖,𝑗𝑗,𝑡𝑡
𝑌𝑌 = 𝑃𝑃𝑥𝑥𝑥𝑥,𝑗𝑗,𝑡𝑡.𝑋𝑋𝑥𝑥,𝑗𝑗,𝑡𝑡
𝑃𝑃𝑌𝑌,𝑗𝑗,𝑡𝑡.𝑌𝑌𝑗𝑗,𝑡𝑡 , the compensation share of input i in total industry
nominal output. Where Pxi is the price of input i, and Py is the output price. The assumption of constant returns to scale implies ∑ �̅�𝑣𝑖𝑖,𝑗𝑗𝑌𝑌 = 1𝑖𝑖 and allows the use of observed value shares for the calculation of TFP growth in Equation 3.4.
In the similar way, assuming that gross output production is separable in capital, labor and technology, we can compute TFP and factor contribution using a value added function as follows:
∆𝑙𝑙𝑙𝑙𝐴𝐴𝑗𝑗𝑍𝑍 = ∆𝑙𝑙𝑙𝑙𝑙𝑙𝑗𝑗 − �̅�𝑣𝐾𝐾,𝑗𝑗𝑍𝑍 ∆𝑙𝑙𝑙𝑙𝐾𝐾𝑗𝑗 − �̅�𝑣𝐿𝐿,𝑗𝑗
𝑍𝑍 ∆𝑙𝑙𝑙𝑙𝐿𝐿𝑗𝑗 (3.5)
where ∆𝑙𝑙𝑙𝑙𝐴𝐴𝑗𝑗𝑍𝑍 is the growth rate of real value added and v�K,jZ and v�L,j
Z are the compensation shares of capital and labor in nominal value added respectively, so that the sum of the two is unity, under constant returns to scale assumption. The above equation can also be rewritten to decompose the growth rate of industrial labor productivity. Subtracting growth rate of employment (H)7 from both sides, TFPG can be computed as the difference between labor productivity growth and contribution from capital deepening:
∆𝑙𝑙𝑙𝑙𝐴𝐴𝑗𝑗𝑍𝑍 = ∆𝑙𝑙𝑙𝑙 �𝑍𝑍𝐻𝐻�𝑗𝑗− �̅�𝑣𝐾𝐾,𝑗𝑗
𝑍𝑍 ∆𝑙𝑙𝑙𝑙 �𝐾𝐾𝐻𝐻�𝑗𝑗 (3.6)
Aggregate Services Sector Productivity Growth and Sectoral Contributions
Aggregate service sector growth is computed as the sum of sectoral growth rates weighted using their nominal share in total service sector value added. Using a Tornqvist index and defining aggregate service sector value added growth as
∆𝑙𝑙𝑙𝑙𝑙𝑙 = ∑ �̅�𝑣𝑗𝑗𝑍𝑍∆𝑙𝑙𝑙𝑙𝑙𝑙𝑗𝑗𝑗𝑗 (3.7) where ∆lnZ is the aggregate service sector value added growth rate, v�jZ is the nominal share of industry j in aggregate service sector value added (averaged over current and previous years), and ∆lnZj is the growth rate of value added in sector j. Assuming that aggregate service sector employment (H) is the sum of industry employment (Hj), so that
∆𝑙𝑙𝑙𝑙𝑙𝑙 = ∆∑ 𝑙𝑙𝑙𝑙𝑙𝑙𝑗𝑗𝑗𝑗 (3.8) Aggregate service sector labor productivity is obtained as follows:
∆𝑙𝑙𝑙𝑙 �𝑍𝑍𝐿𝐿� = ∑ �̅�𝑣𝑗𝑗𝑍𝑍∆𝑙𝑙𝑙𝑙 �
𝑍𝑍𝐻𝐻�𝑗𝑗𝑗𝑗 (3.9)
Aggregate service sector TFPG is also obtained as in (3.9) using value added weights in the following manner:
∆𝑙𝑙𝑙𝑙𝐴𝐴𝑍𝑍 = ∑ �̅�𝑣𝑗𝑗𝑍𝑍∆𝑙𝑙𝑙𝑙𝐴𝐴𝑗𝑗𝑍𝑍𝑗𝑗 (3.10)
7 Note that we measure labor input by taking account of heterogeneity among different type of employees, in terms of education, and therefore, the concept of labor input (L) is different from the concept of employment (H), where the latter is measured as the number of workers.

14
Data and Variables
This section provides a description of the data sources, methodology of construction of variables and the industrial classifications used in the study. The data used in the empirical analysis of this study is the India KLEMS dataset version 2015 compiled from National Accounts Statistics (NAS), published annually by the Central Statistical Organization. This data is supplemented by Input-Output tables, and various rounds of National Sample Survey Organizations (NSSO) surveys on employment & unemployment. In what follows we discuss these sources more specifically with regard to each of the variables used in our analysis. The present paper requires industry wise data on nominal and real value added, investment by asset type, number of employees and labor compensation by type of workers and intermediate inputs. In the following paragraphs, we describe the source and construction of these variables in detail. Gross value added: NAS provides estimates of Gross Domestic Product (GDP or gross value added) by industries at both current and constant prices since 1950. We use the data for the period 1980 to 2010 from the most recent National Accounts series which provides constant price data in 2004-05 prices. GDP estimates are adjusted for Financial Intermediation Services Indirectly Measured (FISIM). The value of such services forms a part of the income originating in the banking and insurance sector and, as such, is deducted from the GVA Gross output: Gross Output series for Services sectors and has been constructed using information from Input–Output Transaction Tables (IOTT) of the Indian economy published by CSO. GVO to GVA ratios for Services sectors are obtained from IOTT benchmark years of 1978-79, 1983-84, 1989-90, 1993-94, 1998-99, 2003-04 and 2007-08. These ratios are linearly interpolated for intervening years and applied to GVA series of NAS to derive the output estimates consistent with NAS at current prices.8 The nominal estimates are then deflated with implicit GVA deflators from NAS to arrive at constant price series. Employment and labor composition: Employment data is basically obtained from the quinquennial rounds of Employment and Unemployment Surveys (EUS) published by National Sample Survey Office (NSSO). Using the EUS, we estimate the total workforce by industry groups, as per the National Industrial Classification (NIC). The work participation estimates obtained from EUS are adjusted for population, using various population censuses. In the EUS, the persons employed are classified on the basis of their activity status into usual principal status (UPS), usual principal and subsidiary status (UPSS), current weekly status (CWS) and current daily status (CDS). UPSS is the most liberal and widely used of these concepts. Despite that the UPSS has some limitations9 this seems to be the best measure to use given the data and hence we estimate the number of employed persons using UPSS definition.
8 It is to be noted that for government-owned sector Public Administration and Defense, no intermediate inputs
are given in IOTT tables. Consequently, value added to output ratio from System of National Accounts tables have been applied to nominal GVA figures of NAS to estimate the output for this sector.
9 Problems in using UPSS includes: (1) the UPSS seeks to place as many persons as possible under the category of employed by assigning priority to work; (2) no single long-term activity status for many as they move between statuses over a long period of one year; and (3) usual status requires a recall over a whole year of what the person did, which is not easy for those who take whatever work opportunities they can find over the year or have prolonged spells out of the labor force.

15
We use number of workers estimated using UPSS assumption as our measure of employment, and our measure of labor input in any industry j (Lj) is computed as a Tornqvist volume index of persons worked by individual labor types ‘l’ as follows:
∆lnLj = ∑ v�l,jL ∆lnLl,jl (3.11)
We use five education categories (n=5 in the above equation) namely- up to primary, primary, middle, secondary & higher secondary, and above higher secondary. The weights �̅�𝑣𝑙𝑙,𝑗𝑗𝐿𝐿 in the above equation are obtained as the compensation share of employee category l in total wage bill of industry j, averaged through current and previous year, i.e.,
�̅�𝑣𝑙𝑙,𝑗𝑗𝐿𝐿 =𝑃𝑃𝑙𝑙,𝑗𝑗𝐿𝐿 𝐿𝐿𝑙𝑙,𝑗𝑗
∑ 𝑃𝑃𝑙𝑙,𝑗𝑗𝐿𝐿 𝐿𝐿𝑙𝑙,𝑗𝑗𝑙𝑙
Subtracting (3.8), the growth rate of aggregate employment from (3.11), we obtain the labor composition growth rates. The wages for regular and casual persons employed is directly estimated from EUS of NSSO; however wages of self-employed have been estimated using suitable econometric techniques.10 Capital services: As in the case of labor input (3.11) we measure capital input jK as a Tornqvist volume index of individual capital assets as follows:
∆𝑙𝑙𝑙𝑙K𝑗𝑗 = ∑ �̅�𝑣k,𝑗𝑗K ∆𝑙𝑙𝑙𝑙Kk,𝑗𝑗k (3.12)
where ∆𝑙𝑙𝑙𝑙K𝑗𝑗 is the growth rate of aggregate capital services in any given industry j, ∆𝑙𝑙𝑙𝑙K𝑘𝑘,𝑗𝑗 is the growth rate of capital stock in asset k (we distinguish between 4 types of capital assets; construction, machinery and transport equipment,) and the weights �̅�𝑣k,𝑗𝑗
K are given by the period average shares of each type of asset in the total value of capital compensation, such that the sum of shares over all capital types add to unity.
�̅�𝑣𝑘𝑘,𝑗𝑗𝐾𝐾 =
𝑃𝑃𝑘𝑘,𝑗𝑗𝐾𝐾 𝐾𝐾𝑘𝑘,𝑗𝑗
∑ 𝑃𝑃𝑘𝑘,𝑗𝑗𝐾𝐾 𝐾𝐾𝑘𝑘,𝑗𝑗𝑘𝑘
Where individual capital stocks KK are estimated using standard Perpetual Inventory Method (PIM) with geometric depreciation rates :
𝐾𝐾𝑘𝑘,𝑡𝑡 = 𝐾𝐾𝑘𝑘,𝑡𝑡−1(1− 𝛿𝛿𝑘𝑘) + 𝐼𝐼𝑘𝑘,𝑡𝑡 And the rental prices of capital K
jkp , are computed as
𝑃𝑃𝑘𝑘,𝑡𝑡𝐾𝐾 = 𝑃𝑃𝑘𝑘,𝑡𝑡−1
𝐼𝐼 𝑖𝑖𝑡𝑡∗ + 𝛿𝛿𝑘𝑘𝑃𝑃𝑘𝑘,𝑡𝑡𝐼𝐼
where I
kp is the investment price of asset k, i* is real external rate of return11 δk is the assumed geometric depreciation rate of asset k. We measure the real external rate of return, i* by a long-run average of real bond rate and market interest rate, obtained from Reserve Bank of India.
10 For details of methodology, refer to Aggarwal and Erumban( 2015), mimeo. 11 In the India-KLEMS database version 2015, we use an external rate of return. However, one can also use an
internal rate of return, which will ensure complete consistency with NAS [see Jorgenson and Vu (2005)]. This will be attempted in the future. See Erumban (2008) for a discussion on alternative approaches to the measurement of rental prices.

16
Labor income share: There are no published data on factor income shares in Indian economy at a detailed disaggregate level. National Accounts Statistics (NAS) of the CSO publishes the NDP series comprising of compensation of employees (CE), operating surplus (OS), and mixed income (MI) for the NAS industries. The income of the self-employed persons, i.e., mixed income (MI) is not separated into the labor component and capital component of the income. Therefore, to compute the labor income share out of value added, one has to take the sum of the compensation of employees and that part of the mixed income which are wages for labor. The computation of labor income share involves two steps. First, estimates of CE, OS, and MI have to be obtained for each of the study industries from the NAS data which are available only for the NAS sectors. Second, for splitting the labor and nonlabor components out of the mixed income of self-employed, the unit level data of NSS employment-unemployment survey are used along with the estimates of CE, OS, and Mi basically obtained from the NAS. Intermediate inputs: The methodology for measuring, intermediate inputs was developed by Jorgenson, Gallop and Fraumeni (1987) and extended by Jorgenson (1990). Following a similar approach as explained in Jorgenson et al. (2005, Chapter 4) and Timmer et al. (2010, Chapter 3), the time series on intermediate inputs for the Indian economy has been constructed. The cornerstone of this approach is the use of input–output (IO) tables which gives the flows of all commodities in the economy, as well as payments to primary factors. As the starting point, a concordance table between the industrial classifications used in our study and the IOTT has been prepared. For the Benchmark IOTT years of 1978, 1983, 1989, 1993, 1998, 2003 and 2007 proportions of Material Inputs, Energy Inputs, and Service Inputs in Total Intermediate Inputs are calculated. Proportions for intervening years are obtained by linear interpolation of the benchmark proportions. This involves an implicit assumption for each IO sector that technological change or efficiency improvement in input use between two benchmark IOTT years indicated by the corresponding two IO tables occurred progressively between the benchmark years, by an equal amount in each intervening year to be more specific. Next, to ensure consistency with National Accounts series, the projected input vector has been proportionately adjusted to match the gap between gross output and value added of NAS such that when we aggregate all the inputs at current price, it should exactly match the intermediate input of NAS. To transform the nominal intermediate input series to volumes weighted WPI deflators are used. The weights are based on the column of the relevant industry in the Input–Output tables. Different weights have been used for different time periods. Two IOTT has been used for deriving weights—1989 and 2003. The price series based on 1989 table has been used from 1980 to 1993, and the 2003 table has been used for the price series from 1993 to 2011. Once the two series have been formed, these have been spliced. The deflators for Material, Energy and Service Inputs for each sector have been used to deflate the Current price Intermediate Input series to Constant price.
4. Productivity Trends in India’s Service Sector
Several empirical studies (Balakrishnan and Parameswaran, 2007; Bosworth et al. (2007); Rakhsit 2007, Bosworth and Maertens, 2007) have all documented service sector as the driver of India’s economic growth. Further some of the studies have analyzed using growth accounting tools if such it such observed growth is led by efficiency of resource use (TFP) or input accumulation. Nayyar (2012) however argues that such studies are only at aggregative level and hence do not take into account the Intra-industry group differences within services industries. These differences could arise because of structural characteristics—(i) organized-unorganized, (ii) intermediate-final, and (iii) public-private. In addition, these industries differ due to barriers to entry for job seekers, technology in use, and factor use—(1) capital intensity (2) Skill intensity. Therefore, it is essential that we figure out the channel via which growth is taking place across these industries—Growth through increases in capital accumulation or

17
through employment expansion or even some sectors in unorganized services boosting growth through employing unskilled workers.12 The present empirical analysis is an attempt towards recognizing that service industries are heterogeneous in several respects and, thereby, a disaggregated industry level perspective is needed to understand productivity—both labor and multifactor as well as role of productivity in explaining overall growth in services.
In this section, we provide estimates of labor productivity growth using a value added framework for the subsectors of services in India. Using this approach, we also detail the sources of labor productivity growth. Measurement and analysis of productivity at the disaggregate level as well as for the aggregate services, when based on value-added version of the production function, ignores the explicit role of intermediate inputs in the production process. In the present paper, we have considered three intermediate inputs- energy, material, and services, and this is important as we may find that intermediate inputs are the primary component of some industries’ outputs.13 Failure to quantify intermediate inputs leads us to miss both the role of key industries that produce intermediate inputs and the importance of intermediate inputs for the subsectors that use them (Jorgenson, Ho and Stiroh (2005), Productivity, volume 3). Our measure of labor input incorporates the qualitative aspects of the labor force in terms of education in defining a new and refined measure of labor input as the product of labor person and quality index. The capital input defined in terms of capital service takes the asset heterogeneity in account as against a measure of capital stock which is devoid of it. In the following subsections, we discuss the sources of labor productivity and output growth using the value added and gross output version of the production function.
Sources of Labor Productivity Growth
The service sector performance in terms of labor productivity is summarized in Table 4.1. Our main observation is that labor productivity in India’ service sector has been growing substantially over decades, and much of this productivity gain is accruing through acceleration in market services productivity. For the first two decades, nonmarket services showed higher labor productivity relative to the market services, with the reverse happening in the decade of 2000s, a period of rapid slow down in the global economy. A closer examination of this further suggests that ICT intensive sectors, in particular telecom and financial services have driven much of the service sector productivity growth. For the period as a whole, labor productivity in services have grown at the rate of close to 4 percent per annum. Turning attention to the individual sectors within services, we find that majority of the sectors show labor productivity growth higher than the sectoral average, the exceptions being transport and storage, public administration, and other services which register low growth in labor productivity in the region of 2to 3 percent.
Table 4.1: Labour productivity growth in service industries by subperiod: 1980–2011 (% per annum)
Description of the industry 1980 to 1993
1994 to 2002
2003 to 2011
1980 to 2011
12 Refer to Tables 5.13 and 5.14 in Nayyar (2012) for exploring the heterogeneity of services and listing of services
as clusters across sectors and characteristics and the documenting of different services industries into multiple characteristics prevailing within Indian service sector.
13 Consider, the semi-conductor (SC) industry, which is a key input to the computer hardware industry. Much of the output is invisible at the aggregate level because semi conductor products are intermediate inputs to other industries rather than deliverables to final demand-consumption and investment goods. Moreover, SC plays a role in the improvements in quality and performance of other products like computers, communication equipments, and scientific instruments.

18
Total Service 2.55 4.08 5.93 3.98 Market services 1.95 4.43 7.81 4.37 ICT intensive services 2.13 5.14 8.67 4.90 Trade 1.19 4.35 6.77 3.73 Financial Services 3.22 6.31 6.44 5.05 Post and Telecommunication 1.73 9.14 19.68 9.09 Business Service 1.69 6.35 5.47 4.14 ICT non intensive 1.51 2.47 5.08 2.83 Hotels and Restaurants 2.95 4.49 4.05 3.72 Transport and Storage 1.01 2.16 5.45 2.63 Non Market Services 3.34 3.90 2.38 3.22 Public Administration and Defence; Compulsory Social Security 3.80 6.52 7.96 5.80 Education 3.29 3.69 3.04 3.33 Health and Social Work 5.21 3.49 1.20 3.55 Other services 2.57 3.04 -0.62 1.78 Source: Authors’ calculations based on India KLEMS dataset version 2015 A few interesting developments from the disaggregated picture of Table 4.1 is worth observing. Four market services sectors- Hotels and Restaurant, Post and Telecommunications, Trade and Transport and Storage showed large improvements in productivity from a very low base in the decade of 1980s. All the sectors mentioned above had significant changes in their business environment beginning 1980s covering regulation as well as policy measures. For road transport; we find reforms from early 1990s covering entry of private players, amendments in motor vehicle laws, setting up of National Highways Act. In case of telecom services, most of the manufacturing services were totally under governmental domain and entry of private firms in providing telecommunication services started in 1992 with the introduction of value added services. In the financial services especially banking services, substantial reforms were undertaken pertaining to new banks, licensing policies. Reforms in the insurance sector commenced in the latter part of 1990s and securities markets were also streamlined. Except for public administration, all other subsectors of nonmarket services registered lower levels of labor productivity growth for the period 1980-2011. We next look at the contribution of individual sector’s labor productivity growth to the aggregate labor productivity growth in service sector for the period 1980-2011. The aggregate productivity growth is the weighted sum of industry productivity growth plus a reallocation term R. The reallocation term is positive if value added shifts from low productivity industries towards high productivity industries. Table 4.2 summarizes the contributions of major service groups (market services- ICT and non-ICT intensive and nonmarket services) and reallocation effect to labour productivity growth in the service sector. Table 4.2: Industry contributions to aggregate labour productivity growth by subperiod; 1980-2011
Description of Industry 1980 to 1993
1994 to 2002
2003 to 2011
1980 to 2011

19
Aggregate service sector Labour Productivity Growth 2.55 4.08 5.93 3.98 of which
Market services 0.84 2.73 4.26 2.38 ICT intensive services 0.65 2.37 3.47 1.97 Trade 0.32 1.17 1.91 1.03 Financial Services 0.27 0.71 0.66 0.51 Post and Telecommunication 0.04 0.28 0.53 0.25 Business Service 0.03 0.21 0.37 0.18 ICT non intensive 0.19 0.37 0.79 0.41 Hotels and Restaurants 0.06 0.11 0.12 0.09 Transport and Storage 0.13 0.26 0.66 0.32 Non Market Services 1.54 1.77 1.02 1.46 Public Administration and Defence; Compulsory Social Security 0.50 0.81 0.87 0.70 Education 0.21 0.27 0.22 0.23 Health and Social Work 0.13 0.10 0.04 0.10 Other services 0.69 0.59 -0.11 0.43 Reallocation 0.18 -0.43 0.65 0.14 Source: Authors’ calculations based on India KLEMS dataset version 2015 Labor productivity in Indian service sector has been growing substantially over decades, and much of this gain is accruing through acceleration in the contribution of market services labor productivity to aggregate service labor productivity growth. While the nonmarket services productivity contribution declined from about 2 percent in 1980s and 1990s to 1.3 percent in 2000s, market services has witnessed an increase in its contribution from less than 1 percent (1980-93) to above 4 percent (2003-2011). A closer look at this further suggests that ICT intensive sectors-post and telecom, trade and financial services has led much of the service sector productivity growth. Within ICT nonintense services transport and storage sector has contributed a major part of aggregate productivity improvement. Almost all nonmarket services have shown a deceleration in their contribution to aggregate service sector productivity in the 1990s, while Health sector improved slightly its contribution in the 2000s. Aggregate service labor productivity has improved in the 1990s (4.08%) compared to that of 1980s (2.55%). However, market services did witness an improvement in its contribution to aggregate service sector productivity growth both in 1990s and 2000s with larger improvement, again visible in ICT intense sectors. This observed productivity increase in the contribution of the market services, and in particular ICT intense services, to aggregate service sector productivity might indicate the role of increasing ICT in contributing to labor productivity growth. The labor reallocation effect is positive in most periods, and has increased in the 2000s, suggesting a structural transformation which is growth enhancing. Resources seem to be moving from less productive services to more productive services. Finally, we investigate the sources of observed labor productivity growth across different components of services. The standard growth accounting exercise attributes the main source of increases in labor productivity per person employed to TFP growth and capital deepening. Figure 4.1 below provides a decomposition of labor productivity growth in terms of total factor productivity (TFP) capital deepening and labor quality.

20
Figure 4.1: Sources of labour productivity growth by services industry, 1980-2011, (% per annum)
Source: Authors’ calculations based on India KLEMS dataset version 2015 We observe that TFP growth accounts for improvements in labor productivity in telecommunication, financial services and public administration and to some extent in transport. In rest of the sectors, it is by and large small. In nonmarket services, we find very low or negligible contributions from overall productivity growth in accounting for labor productivity growth. We also report negligible role of labor quality in explaining labor productivity in services, while capital deepening remains large for many sectors including health and education.
Sources of Output Growth14
The major observation to be drawn from the previous section is that the main contributor to labor productivity growth across different service sectors is to be found in total factor productivity, not in differences in the intensity of the production factors especially labor and capital. The estimates of TFP growth in this section for subsectors of services are calculated using gross output as the measure of output, and primary inputs of capital (K) and labor (L) along with the trio of the inputs of energy (E), materials (M) and services (S) together constitute intermediate inputs in what has come to be known as the KLEMS framework for measuring productivity.15
14 The period under consideration is 1980-2011. 15 See for example OECD (2001), Jorgenson et al. (2005), Diewert and Nakamura (2007) and Timmer et al. (2010)
for detailed accounts of the new approach. Jorgensen et al. (2005) and Timmer et al. (2010) have exploited the
-2.0 0.0 2.0 4.0 6.0 8.0 10.0
Trade
Hotels and Restaurants
Transport and Storage
Post and Telecommunication
Financial Services
Public Administration and Defense; Compulsory SocialSecurity
Education
Health and Social Work
Business Services
Other services
Capital-Labour Ratio Labour Composition TFP
21
Figure 4.2: Growth of total factor productivity across services sector by subperiod, 1980-2011 (% per
annum)
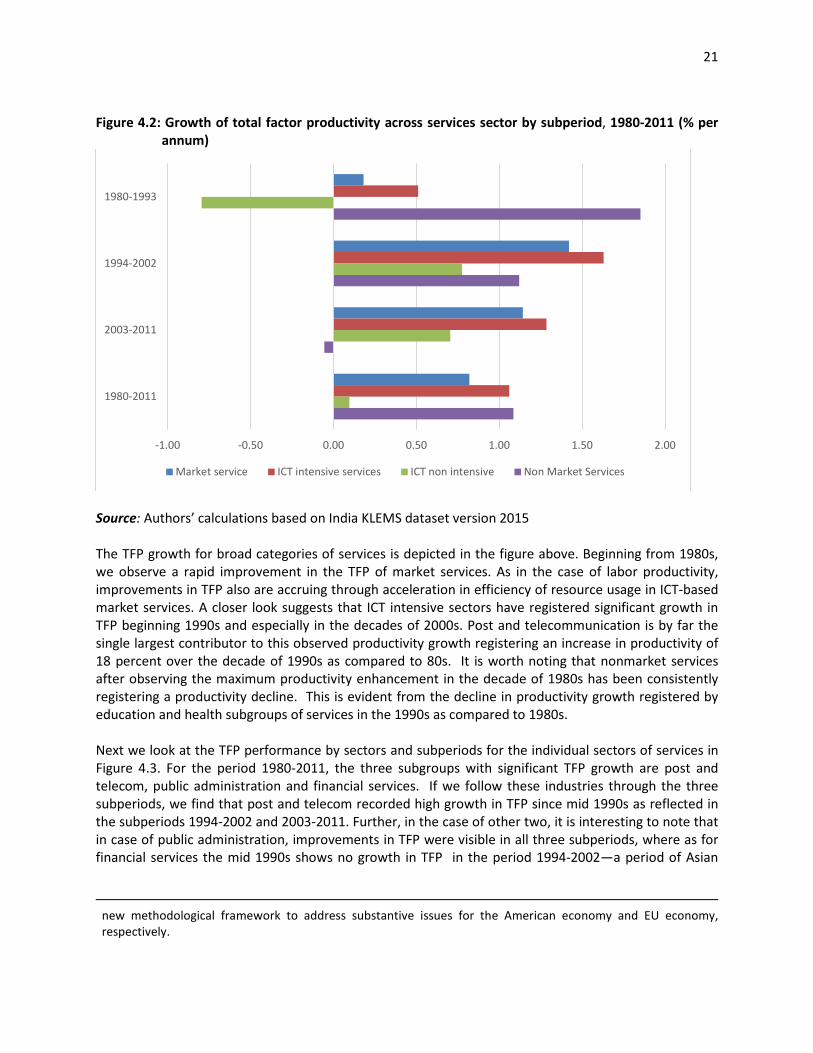
Source: Authors’ calculations based on India KLEMS dataset version 2015 The TFP growth for broad categories of services is depicted in the figure above. Beginning from 1980s, we observe a rapid improvement in the TFP of market services. As in the case of labor productivity, improvements in TFP also are accruing through acceleration in efficiency of resource usage in ICT-based market services. A closer look suggests that ICT intensive sectors have registered significant growth in TFP beginning 1990s and especially in the decades of 2000s. Post and telecommunication is by far the single largest contributor to this observed productivity growth registering an increase in productivity of 18 percent over the decade of 1990s as compared to 80s. It is worth noting that nonmarket services after observing the maximum productivity enhancement in the decade of 1980s has been consistently registering a productivity decline. This is evident from the decline in productivity growth registered by education and health subgroups of services in the 1990s as compared to 1980s. Next we look at the TFP performance by sectors and subperiods for the individual sectors of services in Figure 4.3. For the period 1980-2011, the three subgroups with significant TFP growth are post and telecom, public administration and financial services. If we follow these industries through the three subperiods, we find that post and telecom recorded high growth in TFP since mid 1990s as reflected in the subperiods 1994-2002 and 2003-2011. Further, in the case of other two, it is interesting to note that in case of public administration, improvements in TFP were visible in all three subperiods, where as for financial services the mid 1990s shows no growth in TFP in the period 1994-2002—a period of Asian
new methodological framework to address substantive issues for the American economy and EU economy, respectively.
-1.00 -0.50 0.00 0.50 1.00 1.50 2.00
1980-1993
1994-2002
2003-2011
1980-2011
Market service ICT intensive services ICT non intensive Non Market Services

22
financial crisis and slowing down of the global economy. The performance of other subgroups especially non-ICT and nonmarket services seem to broadly reflect the macro picture of the last figure.

23
Figure 4.3: TFP growth in service industries: 1980-2011 and subperiods
Source: Authors’ calculations based on India KLEMS dataset version 2015 Table 4.3 below presents the decomposition of output growth for the period 1980-2011 for the different subsectors of services in the Indian economy. The contribution of an input is defined as the product of value share of the input and the growth rate of the input. Thus each input contributes to output in proportion to its value share, while TFP contributes to output growth point for point. The first column gives the output growth and the other columns give the contributions of the factor inputs—labor, capital, material, energy and services and the final column provides TFP growth.16 We observe wide variations in output growth across different services industries with over 10 percent growth in business services, financial services and telecom sectors in the period 1980-2011. TFP is the dominant source of output growth in 3 industries- telecom, public admin and financial services.17 When we compare the contribution of factor inputs, we find that capital services makes the largest contribution to the output growth across different industries-trade, telecom, financial services, education, health, business services18 and others. In the remaining two, hotels and transport, we find material input is the dominant source of output growth. In the case of telecommunications sector, we have witnessed major deregulation starting from 1992 along with the onset of major liberalization in manufacturing and trade sectors. Further, it may be important to note that the reform policies in this sector have recognized the need to have many more participants than the incumbent operator in the
17 The high TFP reflected in public administration and defense arises due to low input accumulation and relatively high rates of growth in value added as well as output. IO tables does not provide details distribution of material, energy and services inputs in total intermediate inputs for public administration and defense. We used the ratio of individual commodities to all commodities in total Government Final Consumption Expenditure for computing each of the intermediate inputs and this may reflect possible measurement issues. 18 In case of business services, low TFP reflects the major contribution by capital input in accounting for the overall growth. We argue that the fall in prices of capital goods industries especially office, computing and accounting machinery and parts as reflected by the sharp fall in nominal tariff rates from around 62 percent (1990s) toa round 17 percent (2000s) could have been the trigger for increased role of capital input in the observed growth.
-2.00 0.00 2.00 4
Health and Social…Hotels and…Education
Transport and…Business Service
TradeOther services
Financial ServicesPublic…
Post and…
1980-2011
-2.00 0.00 2.00 4.00 6.00
1980-93
-2.00 0.00 2.00 4.00 6.00 8.00
1994-2002
-5.00 0.00 5.00 10.00 15.00
2003-11

24
process of telecommunications network expansion and service development thereby bringing in competition which made the sector efficient in terms of TFP dynamics.19
19 Refer to the Annex III – The chronology of Telecom Deregulation in India by Singh, H. V., A. Soni, and R. Kathuria (2005), “Telecom Policy Reform in India”.

Table 4.3 : Sources of output growth, 1980-2011 ( % per annum)
Panel A : Contribution of factor inputs and TFP to gross output growth
Industry description GVO Growth
Contribution of Labour
Input
Contribution of Capital
Service
Contribution of Material
Input
Contribution of Energy
Input
Contribution of Service
Input TFPG
Trade 6.42 1.39 3.60 0.21 0.12 0.72 0.39
Hotels and Restaurants 7.36 0.65 1.61 3.61 0.19 1.47 -0.18
Transport and Storage 7.33 1.11 1.25 1.43 1.36 2.00 0.17
Post and Telecommunication 14.37 2.03 4.34 1.44 0.26 0.72 5.57
Financial Services 10.24 2.04 4.06 0.31 0.13 1.42 2.28
Public Administration and Defence; Compulsory Social Security 5.99 0.54 0.61 0.35 0.05 1.39 3.05
Education 6.66 2.23 3.97 0.05 0.01 0.56 -0.17
Health and Social Work 4.71 1.18 2.61 1.33 0.02 0.68 -1.12
Business Service 13.35 1.91 5.92 1.85 0.26 3.20 0.22
Other services 5.27 1.53 2.42 0.47 0.01 0.39 0.45
Panel B : Contribution of factor inputs and TFP to gross value added growth
Industry Description GVA growth
Contribution of Capital
stock
Contribution of Capital
Quality
Contribution of Labour
Person
Contribution of Labour
Quality TFPG
Trade 7.02 4.54 -0.06 1.48 0.32 0.74 Hotels and Restaurants 7.71 4.91 0.03 1.71 0.27 0.78 Transport and Storage 6.77 2.40 0.43 2.09 0.32 1.53 Post and Telecommunication 13.92 4.92 0.41 2.07 0.36 6.15 Financial Services 10.27 4.58 0.42 2.28 0.23 2.76 Public Administration and Defense; Compulsory Social Security 6.06 0.79 0.06 0.19 0.59 4.42 Education 7.01 4.11 0.37 2.17 0.34 0.01 Health and Social Work 6.88 4.43 0.36 1.94 0.31 -0.16 Business Service 12.82 8.80 0.09 2.69 0.14 1.09
Other services 5.21 2.66 0.12 1.38 0.37 0.68
Source: Authors’ calculations based on India KLEMS dataset version 2015

Panel B provides break down of value added growth in terms of quality and quantity components for labor and capital inputs. The quantity component reflects increases in the number of units, while the quality component capture substitution towards heterogeneous inputs with relatively high marginal products- a computer or a university educated worker. We observe that capital input measured in terms of capital stock makes a bigger contribution to value added growth across majority of the sectors than labor input In terms of labor we find that labor person dominates labor quality in all subgroups of services. As with gross output specification, we observe the strong dominance of capital input in explaining output growth.
It is evident from the decomposition of output growth (as well as growth in value added) that capital input, namely capital services, makes a significant contribution to the observed growth. In addition, for certain sectors namely health, education, financial services, trade including wholesale and retails, hotels and restaurants capital services account for substantial contribution to improvements in labor productivity during the period 1980-2011. This might indicate the role of increasing ICT in contributing to labor productivity growth.
Figure 4.3: Contribution of capital services and TFP growth; 1980-2011 (% per annum)
Source: Authors’ calculations based on India KLEMS dataset version 2015
Further, we note from Table 4.3 that for market-based ICT intensive sectors—financial services, post and telecommunication and trade, capital service contribution is overwhelmingly large when compared to other inputs, thereby reflecting sharp inter-industry variations in the contribution of capital deepening within services. It would suggest that Indian services are becoming highly intensive in capital on the one hand and on the other hand the share of capital intensive sectors within the service sector is increasing. We observe that education and health show low or negative growth in TFP despite capital accumulation.20 20 The health sector in India has witnessed large investment in hospital services, diagnostic services, diagnostic products, medical devices, medical technology, e-Health service, clinical trial services, and clinical research organizations through 100 percent FDI route. Further the hospital sector is a highly regulated sector in India and hence conducting proper due diligence for regulatory approvals and licenses is very crucial thereby limiting competition in this sector. The low TFP may be reflecting these aspects. In case of education,
-2.00 0.00 2.00 4.00 6.00 8.00
Health and Social Work
Hotels and Restaurants
Education
Transport and Storage
Business Service
Trade
Other services
Financial Services
Public Administration and Defense;Compulsory Social Security
Post and Telecommunication
TFPG
Contribution ofCapital Service

27
The share of ICT intensive sectors (trade, post and telecommunication, financial services) within market services stands at almost 40 percent of total services (2009-10). This may be due to a number of reasons, including import of capital goods following liberalization of trade policy especially lowering of tariffs and easing of nontariff barriers in the capital goods sector.21 It may also reflect the onset of many new technologies (ICT) that enhances capital deepening through liberalization of trade in services. We provide a table below which capture changes in trade policy—nominal tariffs as well as resultant import competition brought about by such changes. It is evident from the Table 4.4 that for all categories of capital goods, there has been substantial downward shifts in nominal tariff rates as captured by nominal rate of protection. We find across the board decline in tariff rates from around 50 percent to almost below 20 percent during the decades of 1990s and 2000s. We find that for office and other computing machineries there is a substantial decline of more than 50 percentage point decline. Table 4.4: Trade policy indicators for capital goods sector: 1990s versus 2000s
Industry Description Import Penetration Ratio
Nominal Rate of Protection
Capital Goods Industries 1990-1999
2000-2009
1990-1999
2000-2009
350 Agri machinery and equipments and parts thereof 0.01 0.03 44.76 18.10 351 construction and mining industries 0.71 1.24 44.39 17.45 352 Prime movers, boilers, steam generating plants
nuclear reactors 0.42 0.92 44.39 17.45
353 Industrial machinery for food and textile industry 0.41 0.82 45.10 17.76 354 Industrial machinery other than food and textile 0.56 1.12 44.39 17.45 356 General purpose Machinery 0.61 1.24 50.54 17.98 357 Machine tools parts and accessories 0.09 0.27 46.51 17.39 358 Office, computing and accounting machinery and
parts 1.16 1.05 62.73 12.37
359 Special purpose machinery and equipment /component/accessories
0.93 1.45 50.54 17.98
360 Electrical industrial machinery 0.07 0.17 48.87 17.72 361 Insulated wires and cables 0.02 0.09 71.80 19.45 362 Primary cells and primary batteries 0.03 0.12 79.63 21.02
365+366 Radio and TV apparatus 0.20 0.43 63.38 12.78 368 Electronic valves and tubes 0.71 0.75 63.38 12.78 369 X-ray Machines and Electrical equipments nec. 1.18 0.97 63.38 12.78 370 Ship and boat building 0.31 0.89 52.19 18.93 371 Locomotives and parts 0.15 0.42 46.88 18.15 372 Railway/tramway wagons and coaches 0.05 0.12 46.88 18.15 379 Transport and equipments and parts 0.01 0.01 72.46 21.27
Source: Das D K (2015): Trade Liberalization Indicators by Industry—India DATABASE— unpublished
regulatory and taxation aspects still remain a major deterant for improving the efficiency of this sector through investment and foreign collaboration. 21 Das (2007) shows that effective rate of protection for capital goods sector declined from an average 62 percent in 1980s to around 30 percent by the end of 1999. In case of nontariff barriers, the decline was even steeper from a near 100 percent to around 8 percent by the end of the decade 1990-2000. In another related study, Das (2015) has shown that the trade policy changes have further consolidated to low levels with a band of 0-10 percent for tariff rates for major industry categories.

28
The observed growth pattern in the service sector has not been uniform across all services in India. The performance of market-based ICT intensive sectors is impressive especially telecommunications and financial services. However by and large, we find a dominance of capital deepening in accounting for growth. We need to ascertain if information and communication technology (ICT) remained an important source of both capital deepening and total factor productivity growth within services in India. We conclude that import liberalization has been a principal component of the economic reforms undertaken in India and along with complementary policies like technology import policy have to a large extent contributed to the import and adaptation of ICT equipments and technology in the observed capital deepening within services. Services and Aggregate TFP The evolution of TFP is a key determinant of long-run economic growth of a country. Further, the service led growth momentum in India has been questioned on grounds of ‘sustainability.” To this end, we examine the contribution of different sectors to productivity growth at the aggregate economy level. The decomposition of output growth into its sources is shown for different broad sectors and the economy. The whole period 1980 to 2011 is considered for the analysis. The contributions of different inputs to output growth are shown in the Table 4.5. TFP has played an important role in the growth of the Services sector. TFP growth accounted for about a fourth of the real GVA growth achieved by the Services sector. Besides productivity growth, labor, and capital input growths also contributed to services sector growth. Table 4.5 : Contribution of factor inputs and TFP to GVA growth by broad sectors: 1980 to 2011
(% per annum)
BROAD SECTOR Real value added growth
Contribution of Labour persons
Contribution of Labour quality
Contribution of Capital services
TFP growth
Agriculture 3.00 0.24 0.23 1.83 0.70 Mining and Quarrying 5.38 0.67 0.50 5.35 -1.14 Manufacturing 6.64 0.96 0.38 5.27 0.03 Electricity, Gas and Water Supply 6.90 1.10 0.32 3.66 1.82
Construction 6.20 5.43 0.34 2.39 -1.96 Services 7.34 1.56 0.35 3.80 1.62 Total Economy 6.03 1.35 0.32 3.53 0.83
Source: Authors’ calculations based on India KLEMS dataset version 2015 The vast heterogeneity that exists in the aggregate TFP growth in the form of a few subgroups dominating the growth of output and productivity over extended periods of time can often give a distorted scenario, as the role of the leading industries, however, can shift dramatically the TFP scenario observed over a period of time. An examination of the industry-wise contribution to aggregate TFP growth for the period 1980 to 2011 is given in Figure 4.4. The three top contributors to aggregate TFP growth include public administration and defense, agriculture, hunting, forestry and fishing, and financial services. It is important to note that besides financial services, there are other service sectors—telecom, other services, and transport and trade that also have significant contribution to aggregate TFP. This substantiates our assertion about the growing importance of services in the overall economy and to a considerable extent it also evident that high productivity growth in many service sectors underlies the current dynamism in service sector growth.

29
Figure 4.4 : Industry contributions to aggregate TFP growth, 1980-2011
Source: Authors’ calculations based on India KLEMS dataset version 2015
5. Drivers of Service Sector Growth
Service sector in India has also grown rapidly in the last decade (2000-10) and its growth has in fact been higher than the growth in agriculture and manufacturing. It remains to be seen however whether growth in services will lead to inclusive overall growth in India. The growth and productivity performance of services in India highlighted in this paper offers several issues that need attention in the form of future research endeavors. The service sector revolution seems to be a spin-off of the manufacturing reforms. There is definitely a momentum in the sectoral productivity, which is driven by service sector. There is a clear sign of increase in the importance of market services, financial services and trade and distributive services both in terms of value added share and their contributions to value added and productivity growth after the late 1990s. However, one may question the meaning of productivity decline or improvement in the nonmarket services, which does not follow the market principles. The improvement in market services, however, might indicate the effect of information and communication technology, which needs further analysis. Since the production of ICT is heavily concentrated in the advanced countries, where evidences also suggest the effect of ICT on manufacturing sector through ICT producing sectors, India seems to have benefitted more in ICT using sectors, which is predominantly the service sector. However, to make such a strong conclusion we need further detailed analysis. Our study makes an attempt to document the observed trends in service sector productivity. Eichengreen and Gupta (2010) examine proximate determinants of service sector growth in value
-0.15 -0.10 -0.05 0.00 0.05 0.10 0.15 0.20 0.25 0.30Construction
Wood and Products of woodMining and Quarrying
Coke, Refined Petroleum Products and Nuclear fuelBasic Metals and Fabricated Metal Products
EducationHealth and Social Work
Textiles, Textile Products, Leather and FootwearOther Non-Metallic Mineral Products
Machinery, nec.Rubber and Plastic Products
Transport EquipmentPulp, Paper,Paper products,Printing and Publishing
Business ServiceHotels and Restaurants
Manufacturing, nec; recyclingElectrical and Optical Equipment
Food Products,Beverages and TobaccoElectricity, Gas and Water Supply
Chemicals and Chemical ProductsTrade
Transport and StorageOther services
Post and TelecommunicationFinancial Services
Agriculture,Hunting,Forestry and FishingPublic Administration and Defense; Compulsory Social…

30
added. The results confirm that the growth of value added in services increases with per capita income.22 Given the impressive TFP growth in India’ services, we need to look at the possible determinants of the productivity trends. We argue that capital deepening reflects the outcome of trade liberalization attempts at capital goods sector especially imports of machinery and equipments. There could be other equally strong determinants; in particular, skill intensity of workforce, labor market regulations, availability of infrastructure, technology, etc., to name a few. The issue of skill intensity of workforce raises issues connected with levels of education, gender and age.23 Issues of labor market rigidities have been at the forefront of policy debates in India especially in organized manufacturing in India. In India, labor law is a federal subject as well as central subject and thus there are variations within the states. Given the linkages between organized manufacturing and services it would be interesting to see if labor laws impact of services growth. Substantial investment in infrastructure continues to be required in order to sustain growth in India’s services. The country’s capacity to absorb and benefit from new innovations depends on the availability and quality of infrastructure support including power and transportation. Finally, technology transfer is viewed as taking place either by reverse engineering via purchases of imported products/inputs, by training of local workers who move out of the TNC to domestic firms or start their own enterprise. There is hardly any study which addresses these and other possible determinants of observed service sector LP/TFP performance in a rigorous quantitative framework. The Table 5.1 captures the service-organized manufacturing linkage in terms of share of service input within total intermediate inputs of manufacturing industries. We find that on an average the share of services input to total intermediate inputs is around 25 percent for most manufacturing industries. Our analysis for three periods shows that the share has remained more or less stable over the years with minor fluctuations. Table 5.1: Services input share in total intermediate input for manufacturing sector
Industry Description 1980-93 1994-02 2003-11
Food Products, Beverages and Tobacco 19 26 27 Textiles, Textile Products, Leather and Footwear 26 33 34 Wood and Products of wood 21 28 30 Pulp, Paper, Paper products, Printing and Publishing 26 26 24 Coke, Refined Petroleum Products and Nuclear fuel 13 15 6 Chemicals and Chemical Products 23 23 22 Rubber and Plastic Products 24 24 18 Other Non-Metallic Mineral Products 33 31 29 Basic Metals and Fabricated Metal Products 24 27 25 Machinery, nec. 26 26 21 Electrical and Optical Equipment 28 25 27 Transport Equipment 24 30 23 Manufacturing, nec; recycling 26 21 32 Total Manufacturing 23 26 24
Source: India KLEMS database (2015)
22 Determinants of services exports have been an important research issue for service sector in India, given
India’s impressive performance in services trade as opposed to goods trade. Refer to Eichengreen and Gupta (2013). In addition, see Das, Banga and Kumar (2011) for the impact of slowdown on global GDP growth on export demand for India’s services.
23 Ramaswamy and Agrawal (2012) have argued that the growth in service sector is relatively more skill demanding than manufacturing at higher skill levels.
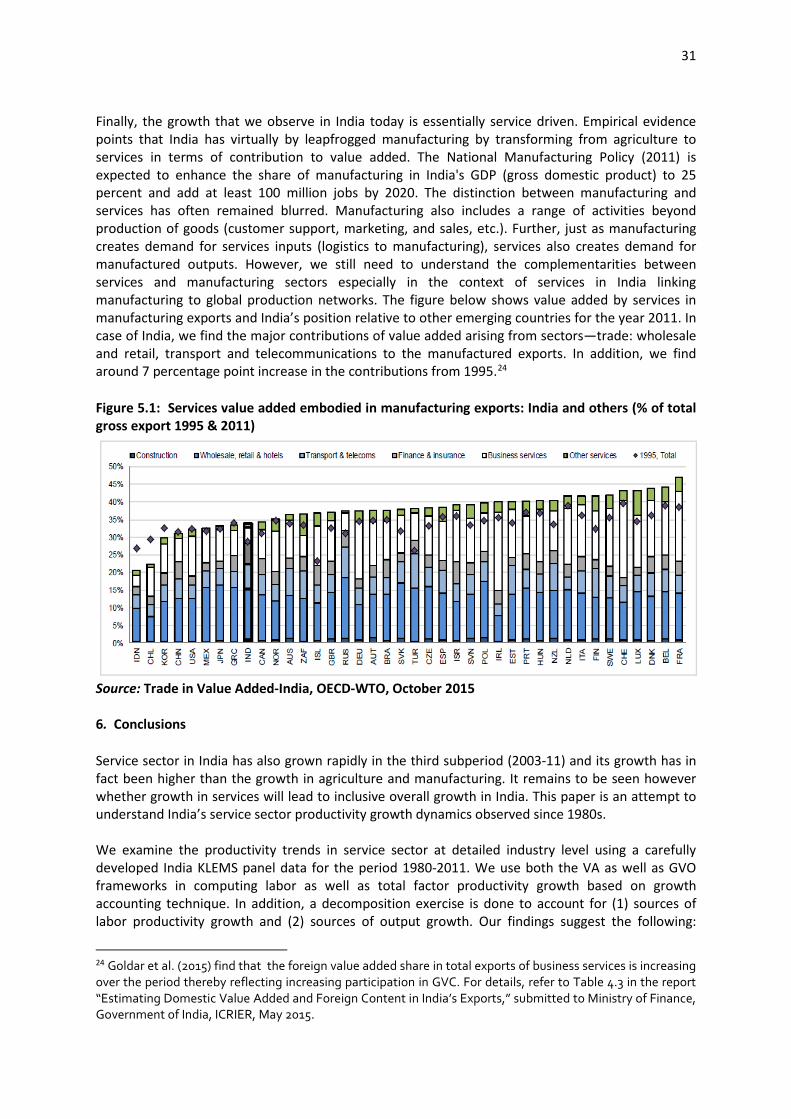
31
Finally, the growth that we observe in India today is essentially service driven. Empirical evidence points that India has virtually by leapfrogged manufacturing by transforming from agriculture to services in terms of contribution to value added. The National Manufacturing Policy (2011) is expected to enhance the share of manufacturing in India's GDP (gross domestic product) to 25 percent and add at least 100 million jobs by 2020. The distinction between manufacturing and services has often remained blurred. Manufacturing also includes a range of activities beyond production of goods (customer support, marketing, and sales, etc.). Further, just as manufacturing creates demand for services inputs (logistics to manufacturing), services also creates demand for manufactured outputs. However, we still need to understand the complementarities between services and manufacturing sectors especially in the context of services in India linking manufacturing to global production networks. The figure below shows value added by services in manufacturing exports and India’s position relative to other emerging countries for the year 2011. In case of India, we find the major contributions of value added arising from sectors—trade: wholesale and retail, transport and telecommunications to the manufactured exports. In addition, we find around 7 percentage point increase in the contributions from 1995.24
Figure 5.1: Services value added embodied in manufacturing exports: India and others (% of total gross export 1995 & 2011)
Source: Trade in Value Added-India, OECD-WTO, October 2015 6. Conclusions
Service sector in India has also grown rapidly in the third subperiod (2003-11) and its growth has in fact been higher than the growth in agriculture and manufacturing. It remains to be seen however whether growth in services will lead to inclusive overall growth in India. This paper is an attempt to understand India’s service sector productivity growth dynamics observed since 1980s. We examine the productivity trends in service sector at detailed industry level using a carefully developed India KLEMS panel data for the period 1980-2011. We use both the VA as well as GVO frameworks in computing labor as well as total factor productivity growth based on growth accounting technique. In addition, a decomposition exercise is done to account for (1) sources of labor productivity growth and (2) sources of output growth. Our findings suggest the following:
24 Goldar et al. (2015) find that the foreign value added share in total exports of business services is increasing over the period thereby reflecting increasing participation in GVC. For details, refer to Table 4.3 in the report “Estimating Domestic Value Added and Foreign Content in India’s Exports,” submitted to Ministry of Finance, Government of India, ICRIER, May 2015.

32
Labor productivity in Indian service sector has been growing substantially over decades, and much of this productivity gain is accruing through acceleration in market services based industries. This observed productivity gain in the market services, and in particular ICT intense services, might indicate the role of increasing ICT in contributing to labor productivity growth. The labor reallocation effect is positive in all the periods, and has increased in the 2000s, suggesting a structural transformation which is growth enhancing. Our observed TFP estimates based on KLEMS production function for services sector indicate impressive growth in TFP for market based services. The nonmarket-based services on the other hand indicate a progressive decline in resource use efficiency in the recent decades. It is evident from the decomposition of output growth that capital input makes a significant contribution to the observed growth. This indicates a dominance of capital deepening in accounting for growth. We need to ascertain if information and communication technology (ICT) remained an important source of both capital deepening and total factor productivity growth within services in India. We infer that import liberalization has been a principal component of the economic reforms undertaken in India and along with complementary policies like technology import policy have to a large extent contributed to the import and adaptation of ICT equipments and technology in the observed capital deepening in the services industries. Finally, the growth and productivity performance of services in India highlighted in this paper offers several issues that need attention in the form of future research endeavors. One final aspect which needs mention is to undertake international comparison of services in emerging economies like India. However, for this we need to create internationally comparative datasets for engaging in meaningful comparisons. To a large extent, this has been solved by the India KLEMS dataset, which follows the EU KLEMS classification. However, problems remain with several other aspects of data pertaining to service sector. Nayyar (2012) has raised several concerns about the service sector data base and the present study addresses several of them. First,to a large extent, the methods for measuring service sector output have improved from current practices being followed in the present study. We, however, find that there remain several issues pertaining to markets services output. A study by Timmer et al. (2010) analyzes in details the issues within different categories of market services with respect to not only measuring services output, but also price deflators for each of the service industries in general. Second, we agree that issue of an appropriately constructed variable like capital input for service sector holds significance. The construction of capital services variable used in estimating total factor productivity estimates in our study is the first estimates of capital input in terms of capitals services for Indian economy at an industry level and covers all the 9 subgroups of services. Third, as regards the importance of individual segments of service sector, this study addresses the issues of sources of growth at both the broad sectors of services—market versus nonmarket services or ICT-intensive services versus non-ICT intensive services as well as different industries within the services. Further, questions are also raised about the need for more data for covering aspects like rural-urban decomposition of service industries to understand where the does the dynamism lies? Further, we also need more field surveys to understand the occupational structure of informal sector—hawkers, transport drivers, and even domestic servants? Finally, the need for understanding the drivers of growth in services in two emerging markets—China and India—is also very important. As part of the future research agenda, the present study intends to do a follow-up comparative study of service industry in India and China using the KLEMS dataset for each country. We end with the quote,

33
“If the data is so dodgy, should all analysis on the services sector be called off? As is evident, this would mean the entire economy, since services account for more than a half of GDP. Conversely, should economists be like the drunk who looks for a lost key under the lamp-post because that is the only place where there is light? Given the need for analysis, there can be only one answer.” (Jain and Ninan, 2010).

34
Appendix: Table A: Selected policies of services in India—A schematic view Issues Policies FDI - Allowing 100 percent retail trade
- Raising FDI cap in Insurance sector ( from 26 per cent) and in Banking ( allowed 74 percent FDI+FII)
- 100 percent FDI allowed in Construction - FDI open for entertainment sector- news and current affairs TV channel - FDI in air transport services - FDI for modernization of railways
Disinvestment − Disinvestment of public sector units both within central and state governments
Tariff and Tax specific sector issues − Shipping services( tonnage tax issues, zero rating input services, seafarer
taxation issues, customs duty/excise duty exemptions, withholding tax) − Tourism services ) rationalizing tax structure, ATF taxation, state luxury tax, per
seat passenger tax, fees for monuments and tax payment modes) − Entertainment Services (tax credit issues) − Health care services (zero tariff for medical equipments; exemptions at state
level for capital goods used in hospitals) − Telecommunications (customs bonding, taxability of items between federal and
state governments; service tax on IT software) − Air transport services( sales tax issues, import duty of spare parts, turnover tax
by airports) − engineering services ( customs and excise duties, stamp duties)
Other related issues Clarity on service tax refund policy on input services used
− Transfer pricing issues − Single return for service tax and excise tax − Reduction of tax deducted at source
Credit and Finance − Withholding tax on interest paid on ECB − Issues connected with venture capital funding − Extending dedicated lines of credit
General issues − Showcasing India’s services overseas − Measures for promoting service exports − Standardization of services − Consolidation of service providers in each category − Service portal − Preferential system for overseas investor and government
Source: Authors’ compilation from Prasad and Sathish (2010)

35
References
Acharya, Shankar (2002). 'Macroeconomic Management in the Nineties', Economic and Political Weekly, 37 (16), 1515-38.
Aggarwal Suresh and Abdul Azeez Erumban (2015), “Labor Input for Measuring Productivity Growth in India: Methodology and Estimates,” Mimeo.
Balakrishnan, P., & Parameswaran, M. (2007). Understanding economic growth in India: A prerequisite. Economic and Political Weekly, 2915-2922.
Bosworth B., and Maertens A. (2007), “Economic Growth and Employment Generation: The Role of the Service Sector”, in “The Service Revolution in South Asia” ed. by Ejaz Ghani, Oxford University Press, 2010
Bosworth, Barry and Susan M. Collins (2008), “Accounting for Growth: Comparing China and India,” Journal of Economic Perspectives, American Economic Association, winter, 22(1): 45-66.
Bosworth Barry, Susan M Collins and Arvind Virmani (2007): Sources of Growth in Indian Economy, NBER Working Paper 12901.
Chanda Rupa and Pralok Gupta, P (2011) “Service Sector Liberalization in India: Key Lessons and Challenges,” South African Institute of International Affairs; Economic Diplomacy Program; Occasional Paper No.88.
Chanda, Rupa and Pralok Gupta (2013), "Services Reforms in India: Update and Challenges," Chapter 11 in Services Liberalization, (eds.) P. Dee and R. Findlay, ANU Press (forthcoming 2013)
Das, Abhijit, Banga, Rashmi and Kumar, Dinesh, (2011), "Global Economic Crisis: Impact and Restructuring of the Services Sector in India," ADBI Working Papers 311, Asian Development Bank Institute.
Das D. K. (2005), “Improving Industrial Productivity Does Trade Liberalization Matter? Evidence from Indian Intermediate and Capital Goods Industries” in Tendulkar, Suresh D et al (Edited), India: Industrialization in a Reforming Economy, Academic Foundation, New Delhi.
Das D. K. (2015), “ Trade Policy and Manufacturing Performance: Exploring the Level of Trade Openness in India’s Organized Manufacturing in the Period 1990-2010” Development Research Group (DRG) Study #41, Department Economic and Policy research, Reserve Bank of India,
Diewert, W. E. (2003),"Measuring Capital," NBER Working Papers 9526, National Bureau of Economic Research, Inc.
Diewert, W.E. and A.O. Nakamura (2007), “The Measurement of Productivity for Nations,” in J.J. Heckman and E.E. Leamer (ed.), Handbook of Econometrics, Vol. 6, Chapter 66, Amsterdam: Elsevier, pp. 4501-4586
Barry Eichengreen and Poonam Gupta, (2009), "The Two Waves of Service-Sector Growth," Development Economics Working Papers 22914, East Asian Bureau of Economic Research.
Eichengreen, Barry and Poonam Gupta (2010), “The Service Sector as India’s Road to Economic Growth?” Indian Council for Research on International Economic Relations (ICRIER) Working Paper Series No. 249. New Delhi: ICRIER

36
Eichengreen, Barry and Poonam Gupta (2012), "The Real Exchange Rate and Export Growth: Are Services Different? “ MPRA Paper 43358, University Library of Munich, Germany.
Erumban, A.A (2008), Rental Prices, Rates of Return, Capital Aggregation and Productivity: Evidence from EU and US, Cesifo Economic Studies, 3.
Goldar et al. (2015), “Estimating Domestic Value Added and Foreign Content in India’s Exports,” submitted to Ministry of Finance, Government of India, ICRIER, May 2015
Gordon Jim and Poonam Gupta (2004), “Understanding India’s Services Revolution.” IMF Working paper WP/ 04/171.
ICRIER (2015), ”Estimating Domestic Value Added and Foreign Content in India’s Exports” research report submitted to the Ministry of Finance, Government of India, May.
Jain Sunil and T.N. Ninan (2010), “Servicing India’s GDP Growth,” in Shankar Acharya and Rakesh Mohan (Ed), India's Economy: Performance and Challenges: Essays in Honour of Montek Singh Ahluwalia, Oxford University Press, Delhi .
Jorgenson, D Gollop, FM and BM Fraumeni (1987), “Productivity and U.S. Economic Growth” Harvard University Press.
Jorgenson, D (1990), “Growth,” in Fifty Years of Economic Measurement, Studies in Income and Wealth, Vol. 54, , 19-118. Chicago: University of Chicago Press, 1990.
Jorgenson, D and K Vu (2005), “Information Technology and the World Economy,” Scandinavian Journal of Economics 107(4), 631–650, 2005.
Jorgenson D W, Mun S. Ho and Kevin J. Stiroh (2005), Information Technology and the American Growth Resurgence, The MIT Press.
Kochhar, K., Kumar, U., Rajan, R., Subramanian, A., & Tokatlidis, I. (2006). India's pattern of development: What happened, what follows?. Journal of Monetary Economics, 53(5), 981-1019.
Kuznets S (1966), Modern Economic Growth, Yale University Press, New Haven
Lema, Rasmus, Ruy Quadros, and Hubert Schmitz (2012), Shifts in Innovation Power to Brazil and India: Insights from the Auto and Software Industries, IDS Research Reports, 73.
McMillan M S and D Rodrik (2011), “Globalization, Structural Change and Productivity,” NBER Working Papers 17143, National Bureau of Economic Research, Inc.
Melvin, J. R. (1995). History and measurement in the service sector: a review. Review of Income and Wealth, 41(4), 481-494.
Murthy, N. (2004). The impact of Economic reforms on industry in India: A case study of the Software Industry. India’s emerging economy, 217-222.
Nayyar Gaurav (2009), “The Nature of Employment in India’s Services Sector: Exploring the Heterogeneity,” No 452, September 2009, Discussion Paper Series, Department of Economics, University of Oxford, Oxford.
Nayyar Gaurav (2012), The Service Sector in India’s Development, Cambridge University Press, New York
OECD (2001): OECD Productivity Manual, Paris.

37
Panagariya, Arvind (2008), India: The Emerging Giant. Delhi: Oxford University Press.
Panagariya, A., Chakraborty, P., & Rao, M. G. (2014). State level reforms, growth, and development in Indian states (Vol. 3). Oxford University Press, USA.
Prasad, H A C and R Sathish (2010), “Policy for India’s Services Sector, “Working Paper No.1/2010-DEA, March 2010, Department of Economic Affairs, Ministry of Finance, Government of India.
Rakshit, M. (2007). Services-led Growth. Money and Finance.
Ramaswamy K.V and Tushar Agrawal (2012), Services-led Growth, Employment and Job Quality: A Study of Manufacturing and Service-sector in Urban India, Indira Gandhi Institute of Development Research, Mumbai.
Schreyer P. (2002), “Computer Price Indices and International Growth Comparisons,” Review of Income and Wealth (2002).
Singh, H. V., Soni, A., & Kathuria, R. (2005). Telecom Policy Reform in India.
Singh, Nirvikar. (2006A). Services-Led Industrialization in India: Assessment and Lessons. (Singh, Nirvikar. (2006). Services-Led Industrialization in India: Assessment and Lessons. Department of Economics, UCSC. UC Santa Cruz: Department of Economics, UCSC. Retrieved from: http://www.escholarship.org/uc/item/8jn2b8z6.) eScholarship, University of California.
Singh, N. (2006B). ICTs and rural development in India. Santa Cruz, Calif: Univ. of California at Santa Cruz, Dep. of Economics.
Singh, N. (2014). Information technology and its role in India's economic development: A review. Santa Cruz, Calif: Univ. of California at Santa Cruz, Dep. of Economics.
Tendulkar, S. D. (2007). India's Growing Services Sector: Database Problems and Issues. Economic and Political Weekly, 3721-3722
Timmer, Marcel P.; Robert Inklaar; Mary O’Mahony and Bart van Ark (2010), Economic Growth in Europe: A Comparative Industry Perspective, Cambridge: Cambridge University Press.
Trade in Value Added-India, OECD-WTO. https://www.oecd.org/sti/ind/tiva/CN_2015_India.pdf
Verma R (2012) Can Total Factor Productivity Explain Value Added Growth in Services? Journal of Development Economics, Volume 99, Issue 1, September 2012.
Vries, D E, A.A. Erumban, M. P. Timmer, I. Voskoboynikov and H. Wu (2012), "Deconstructing the BRICs: Structural Transformation and Aggregate Productivity Growth," Journal of Comparative Economics.