productivity commission study into “the impact of … · productivity commission study into...
TRANSCRIPT
SUBMISSION BY THE
MEDICAL INDUSTRY ASSOCIATION OF AUSTRALIA Inc
TO THE
Productivity Commission Study into
“The impact of advances in medical technology on healthcare expenditures in Australia”
January 2005
Tel : (02) 9437 1151 Fax : (02) 9437 3177 Email : [email protected] Level 2, 82 Christie St., St Leonards NSW 2065 P.O. Box 299 St Leonards NSW 1590
27th January 2005 Productivity Commission Attention: Ms. Helen Owens Locked Bag 2, Collins Street East Melbourne VIC 3000 Dear Ms. Owens Study of the Impact of Advances in Medical Technology on Healthcare Expenditure in Australia Medical Industry Association of Australia Inc (MIAA) appreciates the opportunity to lodge this submission. The impact of medical devices and in-vitro diagnostics on health outcomes is frequently not well recognized. While a crude analysis suggests that medical technology is a major driver of Australian healthcare expenditure, advances in devices and diagnostics have been responsible for significant improvements in clinical practices and outcomes, and thus the quality of life of patients. While the need for regulation of the safety and efficacy of devices and in-vitro diagnostics is critically important and unquestioned, regulations affecting access to breakthrough technologies should be reasonable and thoughtfully applied. Medical technology is a global business. In “first world countries” the expectations of consumers are not markedly different, nor are the actual needs of the respective populations. To ensure timely and affordable access to the benefits of technology, it is essential that government regulations not increase product development costs (and thus the costs to consumers) or lead to excessive delays in technology access, particularly when effective technologies are already available in other countries. The market size for medical devices and in-vitro diagnostics in Australia approximates just over one percent of the global market. 90% of the products used in Australia are imported. Already it is clear that certain technologies do not find their way into Australia due to the difficulty faced in recovering outlays in a small market. It ought to be an important consideration that changes to health technology assessment requirements, or other processes which impact patient access generally, do not reduce healthcare delivery options and potentially, the quality of medical support available to the community.

It would be sensible in our view, to look at the work completed in technology assessment in comparable countries, then to work forward from this base such that repetition of effort was avoided while ensuring that outcomes were tied to Australia’s particular healthcare deliver system. The apparent trend towards trying to evaluate medical devices and in-vitro diagnostics for reimbursement using assessment techniques applied to drugs under the Pharmaceutical Benefits Scheme, should be strenuously avoided. The funding and reimbursement processes for devices and in-vitro diagnostics must recognize that they are very different from pharmaceuticals. For instance, because they are constantly being improved, product lifetimes for devices are usually much shorter than those of prescription drugs, and their successful use is highly dependent on the skills of the operating surgeon (and often the particular anatomical characteristics of the patient). Taken together, this means that techniques routinely applied to assess the cost effectiveness of medicines are unsuitable for devices and in-vitro diagnostics. In addition, it must be recognised that not only do medical device manufacturers invest heavily in R&D, they incur large hidden costs through patient/product/surgeon education, training and other forms of support, which are not reimbursed. Evaluation systems that fail to recognize this vital element are likely to under-value medical technologies, leading to reduced access for patients. New generations of medical technology may reduce the current growth rates of total healthcare expenditure if they facilitate better diagnoses and allow new treatments. In prospect are better health and functional outcomes, gains in life expectancy and quality of life. To ensure these benefits are available, new and innovative funding methods are needed to pay for breakthrough medical technologies ; MIAA would be pleased to contribute to the development of a preferred evaluation and funding methodology to ensure Australians receive the benefits that exciting new medical technologies can deliver for them. Yours sincerely,
Brian Vale Chief Executive Officer

i
ACKNOWLEDGEMENTS
This submission to the Productivity Commission was prepared on behalf of the Medical Industry Association of Australia Inc (MIAA), by Mr Paul Gross, Health Group Strategies Pty Ltd, in collaboration with the MIAA Medical Technology Special Interest Group:
Chair: Dr Eugene Salole (Guidant) Members: Ms Robyn Chu (Johnson & Johnson Medical)
Mr George Faithfull (Stryker) Dr Robert Kitchen (Alcon) Dr George Koumantakis (Roche Diagnostics) Dr Ken Nicol (St Jude Medical) Mr Hal Rikard-Bell (Stryker) Ms Vicki Trench (Medtronic)
MIAA: Mr Brian Vale, CEO Mr David Ross, Director Healthcare Access Ms Pam Davis, National Administration Manager
MIAA acknowledges with appreciation the provision of case studies, other reports and expert comments from its member companies.
© Medical Industry Association of Australia Inc, January 2005
ii
TABLE OF CONTENTS
1 EXECUTIVE SUMMARY v 1 COMPANIES REPRESENTED BY THE MEDICAL INDUSTRY ASSOCIATION
OF AUSTRALIA 1 2 GENERAL FOCUS AND MAJOR CONCERNS OF THIS SUBMISSION 2 3 SPECIFIC MIAA COMMENT ON THE SIX TERMS OF REFERENCE OF THIS
STUDY 6 3.1 TERM OF REFERENCE 1: IDENTIFY THE KEY DRIVERS OF MEDICAL
TECHNOLOGY DEMAND 6 3.1.1 A conceptual framework for assessing the demand for and impact of
medical technology on healthcare expenditures 6 3.1.2 The demand for new medical technologies 9 3.1.3 SUMMARY: The demand for new medical technologies 15
3.2 TERM OF REFERENCE 2: IDENTIFY THE NET IMPACT OF ADVANCES IN MEDICAL TECHNOLOGY ON HEALTHCARE EXPENDITURE OVER THE PAST TEN YEARS 17 3.2.1 Empirical data on the major determinants of healthcare expenditure
growth in the past four decades, including the impact of medical technology 17
3.2.2 SUMMARY: Any growth in the cost of medical technologies should be related to their benefits in added life expectancy, productivity and quality of life across the life cycle, including their potential role in end-of-life care 26
3.3 TERM OF REFERENCE 3: IDENTIFY THE LIKELY IMPACT OF ADVANCES IN MEDICAL TECHNOLOGY ON HEALTHCARE EXPENDITURE OVER THE NEXT FIVE TO TEN YEARS, AND IDENTIFY THE AREAS OF SIGNIFICANT POTENTIAL GROWTH 28 3.3.1 Emerging medical devices and diagnostics that seem likely to influence
health expenditures and health outcomes 29 3.3.1.1 Molecular imaging and earlier treatment of serious diseases 30 3.3.1.2 New medical devices for heart disease and stroke 31 3.3.1.3 New devices for diagnosis and control of insulin-dependent
diabetes mellitus (IDDM) 33 3.3.1.4 New diagnostic tools for cancer 33 3.3.1.5 New medical devices for pain management 34 3.3.1.6 New medical devices for hearing deficiencies 35 3.3.1.7 New medical devices for eye diseases 36 3.3.1.8 Minimally invasive surgery 38 3.3.1.9 Wound care technologies 39
3.3.2 Four recent studies estimating potential economic savings that are possible in the diagnosis and treatment of major disorders 41
3.3.3 SUMMARY: Possible cost scenarios in the next 5-10 years that justify further review by the Productivity Commission 48

iii
3.4 TERM OF REFERENCE 4: IDENTIFY EXISTING MECHANISMS AND PROCESSES FOR ENSURING COST-EFFECTIVENESS IN THE USE OF MEDICAL TECHNOLOGY, AND ANY GAPS IN THESE PROCESSES 51 3.4.1 Factors that distinguish prescribed drugs and medical devices and
diagnostics, and which should affect evaluation of cost-effectiveness 51 3.4.2 Processes affecting the regulation of safety, efficacy and cost-
effectiveness of devices in Australia 52 3.4.2.1 National Health Act, Schedule 5: requirements for device pricing 53 3.4.2.2 Health technology assessment: MSAC and the value of medical
devices 56 3.4.2.3 Health technology assessment: ASERNIP-S, NHSU and
processes affecting surgical devices 60 3.4.2.4 NSW Health model policy for new interventional procedures in clinical practice: 61 3.4.2.5 Proposed Trans-Tasman Agency (TTA) 63 3.4.2.6 Summary of the above regulatory processes 64
3.4.3 International developments in regulatory and pricing processes that would cause significant problems if introduced in Australia 64
3.4.4 MIAA opinion on desirable alternative methods and processes of fast- tracking innovative medical technology 68
3.4.5 MIAA opinion on other reimbursement solutions, including central registries, budget holding, patient co-payments, proportional payments and expanded health insurance 71
3.4.6 SUMMARY 71 3.5 TERM OF REFERENCE 5: EXAMINE THE IMPACT OF CHANGES IN
MEDICAL TECHNOLOGY ON THE DISTRIBUTION OF COSTS AND FINANCIAL INCENTIVES ACROSS DIFFERENT PARTS OF THE HEALTH SYSTEM, INCLUDING WHETHER ADVANCES IN ONE TECHNOLOGY AREA RESULT IN REDUCED COSTS IN OTHERS 73 3.5.1 Impacts of specific medical devices on the demand for other services,
and the relative costs of diagnosis, therapy and rehabilitation 73 3.5.2 Identifying the dysfunctional effects of different methods of
reimbursement and payment on access to devices that can change care patterns and health system costs 75
3.5.3 SUMMARY 76 3.6 TERM OF REFERENCE 6: INVESTIGATE THE NET IMPACT OF
ADVANCES IN OVERALL AND INDIVIDUAL HEALTH TECHNOLOGIES ON ECONOMIC, SOCIAL AND HEALTH OUTCOMES (INCLUDING EXPLORING WHICH DEMOGRAPHIC GROUPS ARE BENEFITING FROM ADVANCES IN HEALTH TECHNOLOGY), AND THE OVERALL COST-EFFECTIVENESS OF HEALTHCARE DELIVERY 77 3.6.1 Net impact of access to medical technology, particularly those devices
identified in this submission 77 3.6.2 Limitations of cost-effectiveness analysis in assessing net impacts 77 3.6.3 MIAA comment on data gaps and methodologies affecting the
measurement of the full economic impact of medical technologies 77

iv
3.6.4 SUMMARY: MIAA’s views of the impact of government policies and consumer expectations, and the Productivity Commission’s pivotal role78
ANNEXURES 79 ANNEX 1: OVERVIEW OF THE MEDICAL DEVICES AND DIAGNOSTICS
INDUSTRY 80 ANNEX 2: TERMS OF REFERENCE 82 ANNEX 3: NEW DIAGNOSTIC TOOLS FOR PNEUMONIA 83 ANNEX 4: CORONARY HEART DISEASE AND STENTS 86 ANNEX 5: TREATING INSULIN-DEPENDENT DIABETES MELLITUS BY
CONTINUOUS INSULIN INFUSION 95 ANNEX 6: TOTAL KNEE ARTHROPLASTY: IMPACT ON HEALTHCARE COSTS
AND PATIENT OUTCOMES 107 ANNEX 7: COMPUTER-ASSISTED KNEE REPLACEMENT 111 ANNEX 8: HEARING DEFICIENCIES AND COCHLEAR IMPLANTS 120 ANNEX 9: DIFFERENCES BETWEEN THE PHARMACEUTICAL AND MEDICAL
DEVICES INDUSTRIES 126 ANNEX 10: REGULATORY REQUIREMENTS FOR PROSTHESES AND DRUGS129 ANNEX 11: MIAA SUBMISSION TO THE MEDICAL SERVICES ADVISORY
COMMITTEE REVIEW 2004 135 ANNEX 12: EUCOMED POSITION PAPER ON HEALTH TECHNOLOGY
ASSESSMENT FOR MEDICAL DEVICES IN EUROPE 142 ANNEX 13: UNCOMPENSATED COSTS EMBEDDED IN THE PURCHASE PRICE
OF A PACEMAKER OR IMPLANTABLE CARDIOVERTER-DEFIBRILLATOR (ICD) 157
ANNEX 14: GLOSSARY 159

v
1 EXECUTIVE SUMMARY The Medical Industry Association of Australia Inc is pleased to contribute to the Productivity Commission’s study of the impact of medical technology on healthcare expenditure. . We first identify some over-arching issues, and then summarise our conclusions on each of the Commission’s six terms of reference.
OVER-ARCHING ISSUES
1. The impact of medical technology is not always recognized. While a crude analysis of healthcare expenditure trends suggests that medical technology has been a major driver of national healthcare expenditures over the past 10 years, many micro-studies have shown that medical technology has been responsible for significant improvements in mortality, morbidity (including disability) and quality of life in all age groups. New US data summarized in this submission suggest that selected technologies have caused a 1-2% per year decrease in the quality-adjusted costs of specific disorders in the period 1960-1997. A preoccupation with the cost impacts has often outweighed an equal recognition of the benefits of medical technology. That balance needs to be achieved through government policies which recognise that the next generation of medical technology requires investment in R&D, and that such investment is retarded by excessive government regulation. 2. Innovative funding methods are needed to pay for breakthrough medical technologies. The next generation of medical technology is emerging daily in clinical practice, or is being developed in laboratories or in clinical trials around the world. New medical technology may reduce the current growth rates of national healthcare expenditures if it facilitates better diagnoses and treatments not now available. More patients will be eligible for such interventions. Any proposals to design funding methods to pay for new technologies should first identify unmet needs, provide fast-track funding for breakthrough interventions, restructure payment methods to achieve better health and functional outcomes, and indicate how higher investment in healthcare and in new technologies could produce gains in life expectancy and quality of life across all age groups and many disease conditions. 3. Chronic disease, ageing and disability require new strategies to fund technologies that reduce the consequences of disability. The disease burden in Australia today is heavily weighted by the big killers (heart disease, stroke, cancer), the big disablers (musculoskeletal disorders, mental disease, diabetes), trauma due to falls and other accidents that can be prevented, and by chronic disorders that cause high, hidden losses of quality of life through pain, disability and loss of normal functioning. Investment in medical technologies that avert or reduce disability has not had any priority in healthcare funding. Australia is facing a large increase in the economic and social burden of obesity, eye and hearing

vi
disorders, and the related costs of falls in the elderly and non-participation of the sight and hearing disabled in schools and society.
4. Regulations affecting public access to breakthrough technologies should be subject to reasonableness tests. The need for effective government regulation of safety and efficacy is not in dispute. Given the global nature of the health sector and the use of medical technologies, it is essential that such government regulations not increase product development costs and the costs to consumers. All regulations of safety and efficacy should be subject to government cost impact assessments, to ensure that regulatory hurdles already passed in nations with high standards are not repeated or extended in Australia, leading to delays in patient access to effective interventions already available in other nations. Equally, the imposition of the 100% cost recovery policies add to the cost burden of smaller medical device companies.
5. The funding and reimbursement processes for new medical devices should recognize that devices and drugs are two very different technologies. There is a large dichotomy in the funding of access to proven medical devices in public and private hospitals in Australia. It is essential that access to breakthrough diagnostics and medical devices be determined by patient need, not by the chosen point of access to care, or by the exigencies of federal-state cost-sharing arrangements, or by the complexities of the National Health Act that require manufacturers of prosthetic devices to negotiate with many health insurers. The MIAA is concerned by proposals that medical devices be approved and priced using the same techniques used for PBS drugs. Medical devices are constantly improved, product lifetimes are often shorter than those of prescribed drugs, and medical device manufacturers incur large hidden costs in patient/product/surgeon support that are not reimbursed today. Generic pricing tools that reduce devices to the point of being commodities are singularly inappropriate for diagnostics and medical devices that improve the health status and reduce the disability of Australians.
6. There is a real danger that health technology assessment will become a “go/no go” determinant of whether a new technology is made accessible to doctors and patients. In the absence of any consensus that the methods, assumptions and appropriateness of HTA are sufficiently advanced worldwide, the danger of applying HTA to all technologies is immense, particularly if its major effect is to create a fourth regulatory hurdle (after establishment of safety, efficacy and quality for pre-market approval) prior to funding or reimbursement. While some national HTA bodies separate an “assessment” (a review of all available evidence of the clinical and cost-effectiveness of a technology) from an “appraisal” (a study of effectiveness of a particular technology used in a particular healthcare setting), attempts to harmonise safety and performance approval review of devices at the international level will be offset by regulatory delays at the fourth hurdle, and by the higher costs falling on manufacturers of new devices.
vii
MIAA CONCLUSIONS ON THE SIX TERMS OF REFERENCE
TERM OF REFERENCE 1: the demand for new medical technologies The growth of technological intensity in hospital and medical practice is a function of many factors. The Commission will, no doubt, reflect on the impact of the demands of clinicians and patients to have access to the most effective breakthrough technologies. Apart from the willingness of entrepreneurs and some governments to invest in innovative research at the basic and applied level, MIAA does not believe that there is a single explanation for the growth of medical technology in the last four decades. In most societies, there is a constant search for health, safety and productivity gains through applications of technology. Many of the new medical devices identified in this MIAA submission allow substitution of capital for labour, and many others replace professional care with technology-guided self-diagnosis and care. This submission contains examples that might increase recognition of the documented impact of research and development on technological innovation in hospital and medical practice, and in self-diagnosis and care.
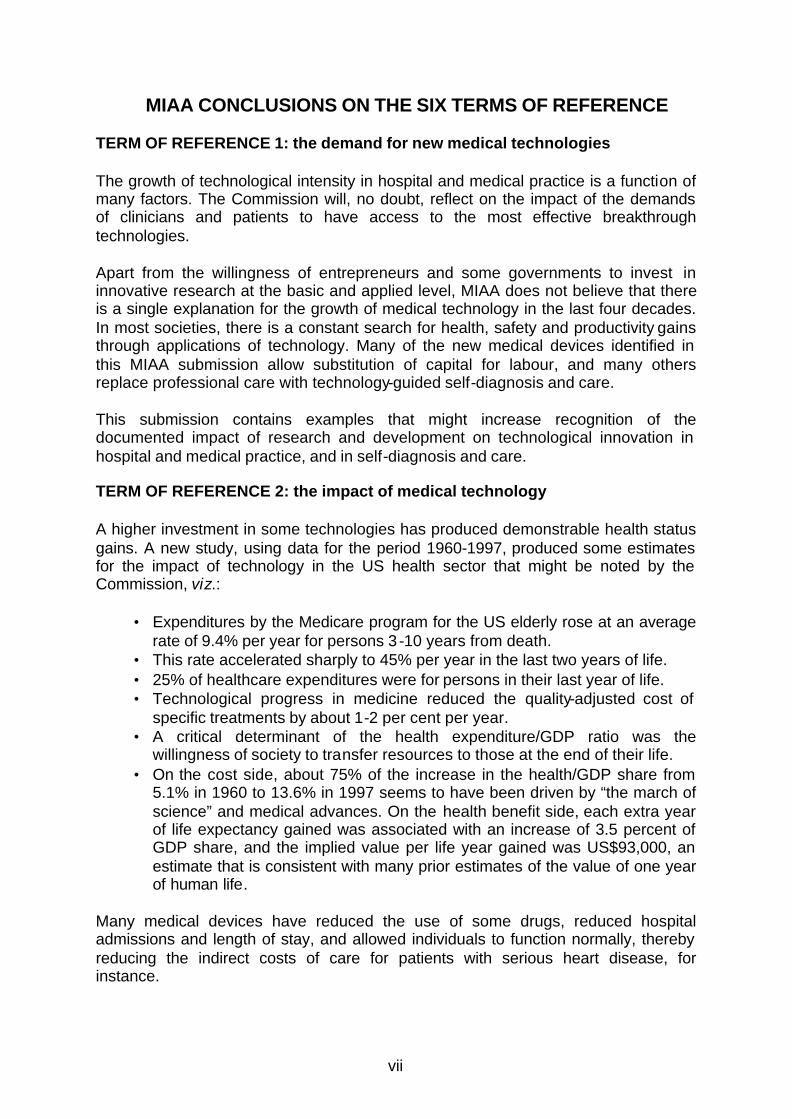
TERM OF REFERENCE 2: the impact of medical technology A higher investment in some technologies has produced demonstrable health status gains. A new study, using data for the period 1960-1997, produced some estimates for the impact of technology in the US health sector that might be noted by the Commission, viz.:
• Expenditures by the Medicare program for the US elderly rose at an average rate of 9.4% per year for persons 3 -10 years from death.
• This rate accelerated sharply to 45% per year in the last two years of life. • 25% of healthcare expenditures were for persons in their last year of life. • Technological progress in medicine reduced the quality-adjusted cost of
specific treatments by about 1-2 per cent per year. • A critical determinant of the health expenditure/GDP ratio was the
willingness of society to transfer resources to those at the end of their life. • On the cost side, about 75% of the increase in the health/GDP share from
5.1% in 1960 to 13.6% in 1997 seems to have been driven by “the march of science” and medical advances. On the health benefit side, each extra year of life expectancy gained was associated with an increase of 3.5 percent of GDP share, and the implied value per life year gained was US$93,000, an estimate that is consistent with many prior estimates of the value of one year of human life.
Many medical devices have reduced the use of some drugs, reduced hospital admissions and length of stay, and allowed individuals to function normally, thereby reducing the indirect costs of care for patients with serious heart disease, for instance.

viii
MIAA believes that any forecasts of future healthcare expenditures should take account of possible movements in the site, volume, price and net costs of care that might accrue from policy changes that allow access to breakthrough medical devices. TERM OF REFERENCE 3: the future impacts of medical technology We present data on a wide range of emerging medical devices and diagnostics. We summarise four new studies identifying some of the possible cost impacts in the next 5-10 years that justify further review by the Commission. Some recent forecasts suggest that significant reductions in the disease burden may occur within the next 20 years. Given the predictions of some observers that the potential gross cost impacts of some technologies, such as drug-eluting stents and defibrillators, will place some health insurers at risk, these dismal predictions have little or no regard to the net costs to payers (i.e., gross costs less the cost reductions caused downstream by such technologies) or to the increases in functioning that may allow a normal life, reductions in welfare payments and mortality gains. MIAA believes strongly that the Commission’s report should assess the “future impacts” of technology on health benefits as well as on costs . TERM OF REFERENCE 4: ensuring the cost-effective use of medical technology MIAA accepts without question the need to regulate the safety of medical devices, drugs and other interventions. In international assessments of the other dimensions of a medical technology, MIAA can see an enthusiasm to incorporate processes that link efficacy and costs. Cost-effectiveness analysis assumes that all technologies can be subject to the same techniques of economic appraisal. MIAA has serious reservations about this assumption and notes that not all nations have followed the same path that created agencies such as NICE in the UK. MIAA believes that the Commission’s review of particular paths to cost-effective use of medical devices and diagnostics should consider strategies that:
• recognise that medical devices are fast-changing products that are not like drugs, and that assessments of such devices too early in the product innovation cycle are inappropriate and invalid;
• recognise that some medical devices are used in very small numbers of vulnerable patients (such as devices used in end-stage heart disease), and that clinical trials may not be a cost-effective strategy;
• assemble evidence from all credible sources; • apply a range of criteria similar to the Blue Cross and Blue Shield Association
TEC multi-criteria guidelines, not just economic appraisals; • leave value-based decisions to the clinician facing an individual patient with
unique characteristics;
ix
• overcome the shortfalls in evidence-based strategies noted in several articles in the January-February 2005 issue of the journal Health Affairs; particularly where assessments involve a new technology that is embedded in established clinical practice;
• provide safeguards and appeals processes in an improved process of healthcare technology assessment that is transparent and non-redundant;
• identify how any savings achieved with more elaborate regulation and economic analysis will improve health outcomes and ensure access to breakthrough technologies for the broader community.
MIAA proposes a number of options to measure the value of breakthrough medical devices that change the site, volume, cost and quality of care, including four types of healthcare technology assessment process that might justify discussion in the Commission’s report, viz.:
• methods that, with preliminary data showing the efficacy and safety impacts of new technologies or innovations that change the site, volume, quality and outcomes of care, allow fast-track approval and early payment for such breakthrough technologies (we call this the breakthrough technology method);
• methods that systematically commence payments for new and expensive treatments and diagnostic tests conditional on agreements to pay for evaluative studies of the impact of the new interventions on patient outcomes;
• methods that recognise the known limits of randomised clinical trials and which involve extensive post-marketing surveillance and use of claims databases to evaluate effectiveness and safety in large populations (we call this extended post-marketing surveillance database evaluation);
• methods that recognise the hidden value-add component of a device. TERM OF REFERENCE 5: measuring the relative impact of different technologies The relative impact of specific technologies is difficult to measure when restraints of regulatory approval delays, government budgets, health fund reimbursement, payment strategies, and shortages of key health personnel influence the site, volume, price and quality of care. MIAA hopes that the Commission will comment on these factors, and on the extent to which under-use of technology may have impeded changes (that have occurred in other nations) in health care supply and cost in Australia. TERM OF REFERENCE 6: measuring the net economic and social impact of medical technology MIAA believes that government policies are shaped by the expectations of patients and the general public. We are hopeful that the Commission will comment on available survey data showing the willingness of citizens in most nations to pay more for health care, particularly

x
new data from EU nations showing that the general public realizes that tax-based healthcare creates demonstrable limits on access. The Commission’s draft report on ageing, released on 24 November 2004, will help focus the public debate on the choices that Australia faces in paying for the care of an ageing population. The MIAA submission suggests that ageing alone is not the major driver of healthcare expenditures, which means that we need to focus on some of the other cost drivers, and on the potential role of breakthrough technologies in containing healthcare costs.
1
1 COMPANIES REPRESENTED BY THE MEDICAL INDUSTRY ASSOCIATION
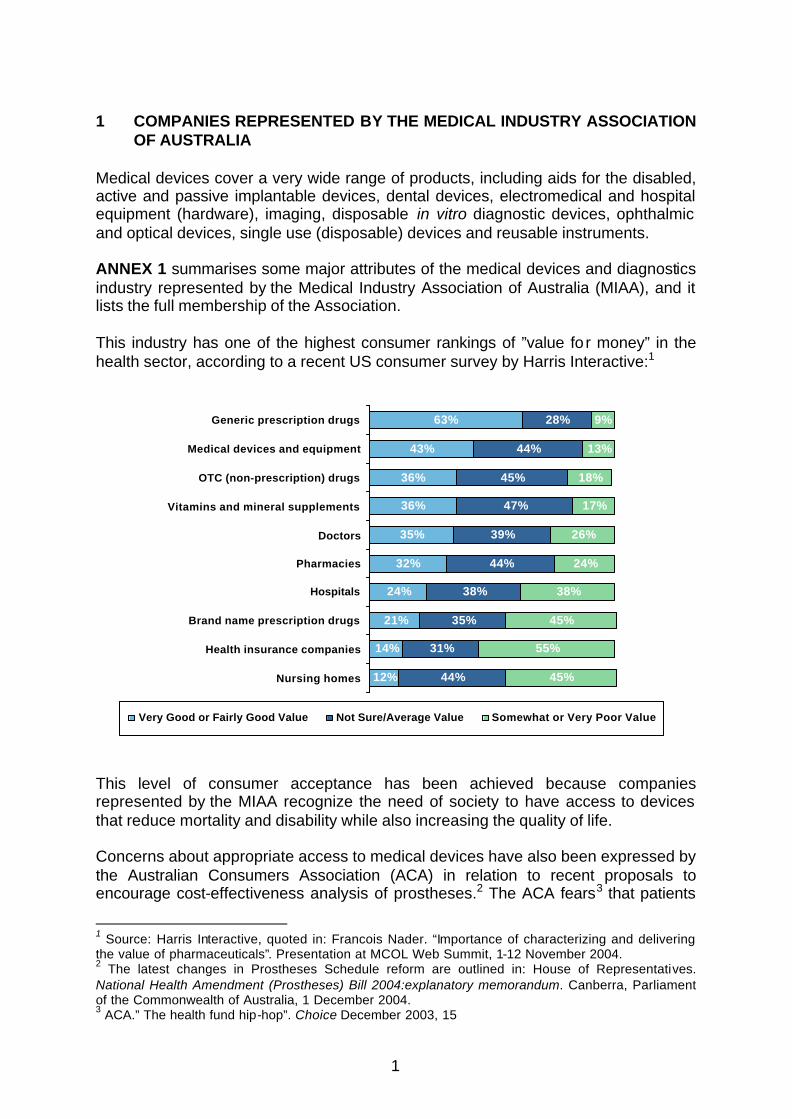
OF AUSTRALIA Medical devices cover a very wide range of products, including aids for the disabled, active and passive implantable devices, dental devices, electromedical and hospital equipment (hardware), imaging, disposable in vitro diagnostic devices, ophthalmic and optical devices, single use (disposable) devices and reusable instruments. ANNEX 1 summarises some major attributes of the medical devices and diagnostics industry represented by the Medical Industry Association of Australia (MIAA), and it lists the full membership of the Association. This industry has one of the highest consumer rankings of ”value fo r money” in the health sector, according to a recent US consumer survey by Harris Interactive:1 This level of consumer acceptance has been achieved because companies represented by the MIAA recognize the need of society to have access to devices that reduce mortality and disability while also increasing the quality of life. Concerns about appropriate access to medical devices have also been expressed by the Australian Consumers Association (ACA) in relation to recent proposals to encourage cost-effectiveness analysis of prostheses.2 The ACA fears3 that patients
1 Source: Harris Interactive, quoted in: Francois Nader. “Importance of characterizing and delivering the value of pharmaceuticals”. Presentation at MCOL Web Summit, 1-12 November 2004. 2 The latest changes in Prostheses Schedule reform are outlined in: House of Representatives. National Health Amendment (Prostheses) Bill 2004:explanatory memorandum. Canberra, Parliament of the Commonwealth of Australia, 1 December 2004. 3 ACA.” The health fund hip-hop”. Choice December 2003, 15
12%
14%
21%
24%
32%
35%
36%
36%
43%
63%
44%
31%
35%
38%
44%
39%
47%
45%
44%
28%
45%
55%
45%
38%
24%
26%
17%
18%
13%
9%
Nursing homes
Health insurance companies
Brand name prescription drugs
Hospitals
Pharmacies
Doctors
Vitamins and mineral supplements
OTC (non-prescription) drugs
Medical devices and equipment
Generic prescription drugs
Very Good or Fairly Good Value Not Sure/Average Value Somewhat or Very Poor Value

2
will have to pay extra for a new prosthesis if the surgeon wants to use one that is more expensive than one listed by the health funds. In its Issues Paper, the Productivity Commission (PC) has indicated that “…community expectations for access to the latest procedures are unlikely to abate”. The MIAA agrees. The above consumer ratings of the value of medical devices and equipment are shaped by many factors. We believe that providers of care, and the community at large, are able to discern that medical devices and diagnostics have many potential attributes and impacts as noted by Geisler:4
• a physical perspective (technology is becoming increasingly miniaturised, some are even nanotechnology size);
• an information perspective (they convey self-care management information to a diabetic or an emergency signal to the specialist or nurse in an ICU);
• a knowledge perspective (they gather, analyse and store data, or require specialist knowledge of their clinical use);
• a process perspective (they measure the stage of progression of an illness, and they have specific outcomes at different stages of diagnosis, treatment and rehabilitation);
• a change perspective (they cause clinicians or end-users to respond to a signal and take alternative actions); and they function as
• an enabling resource that builds on the core competencies of doctors, nurses, other health personnel and patients to enable the patient to achieve added years of life, more mobility, more effective pain control, higher quality of life and other desirable outcomes.
Because of obvious constraints, this submission does not discuss all six attributes for every major medical technology. Instead, in the body of this submission and in detailed appendices MIAA has focused on some key attributes of medical technologies that impact on the rates of change in clinical practice, the accompanying changes in healthcare expenditures, and the health and functional outcomes achieved with such expenditures. 2 GENERAL FOCUS AND MAJOR CONCERNS OF THIS SUBMISSION The Productivity Commission study of the impact of medical technology has been given the Terms of Reference listed in ANNEX 2. While this submission makes a comment on most Terms of Reference, the MIAA has a particular interest in the first four Terms of Reference. MIAA has therefore restricted its focus to particular types of medical technology (viz., surgical products and in vitro diagnostics), and in particular to cardiovascular products, diagnostics, minimally invasive surgery, ophthalmology, orthopaedics, wound care, and emerging and evolving technology (including deep brain stimulation and insulin pumps).
4 Geisler E. “Multiple perspectives model of medical technology”. Health Care Management Review 1999;24: 55-63
3
These medical technologies are and will continue to be accessed by an ageing population whose chronic conditions restrict quality of life by their effects on disability and chronic pain. It is appropriate that, in addition to those technologies that have reduced mortality, this PC study will identify the past and likely future impact of disability-reducing technologies.. While some medical devices embed drugs in their technology, this submission does not attempt to measure the impact of modern medicines on healthcare costs and health outcomes. As we note en passant, new medical technologies are likely to blur the drug-device divide.
Most of the MIAA recommendations in this submission relate to particular issues and questions in the PC Issues Paper dated September 2004, viz.,
• identifying the key drivers of demand for medical technology; • identifying the net impact of medical technology on public and private
healthcare expenditure, now and in future; • assessing the impact of medical technology on health and social outcomes; • ensuring the cost-effectiveness of medical technology; and • ensuring access to advanced medical technology.
In this submission, MIAA draws the Commission’s attention to some major concerns.
1.The impact of medical technology is not always recognized: While the crude residuals method of analysis of healthcare expenditure trends (see Section3.2.1) suggests that medical technology is a major driver of national healthcare expenditures in the past 10 years, many micro-economic studies have shown that medical technology has been responsible for significant improvements in mortality, morbidity (including disability) and quality of life in all age groups over the same period. New data summarized in Section 3.2 suggest that selected technologies have caused a 1-2% decrease per year in the quality-adjusted costs of specific disorders in the period 1960-1997. A preoccupation with the cost impacts has often outweighed an equal recognition of the achievements of medical technology. That balance needs to be achieved through government policies that recognise that the next generation of medical technology requires investment in R&D, and that such investment is retarded by excessive5 government regulation. 2.Innovative funding methods are needed to pay for breakthrough medical technologies: The next generation of medical technology is emerging daily in clinical practice, or is being developed and evaluated in laboratories or in clinical trials around the world. This next generation of technology may reduce the current growth rates of national healthcare expenditures if the new technology
5 “Excessive” is the key word here. In the health sector, no company will survive if it does not meet public expectations about the safety and efficacy of its products and, in a global industry, there must be effective national government regulation of safety and efficacy. The regulation of price is another matter, and MIAA members adhere to the belief that the level of innovation and the competitive market are the best arbiters of price, particularly given the short lifespans of most devices due to new product developments.

4
facilitates better diagnoses and treatments not now available. More patients will be eligible for such interventions. Any proposals to design funding methods to pay for new technologies should first identify unmet needs, provide fast-track funding for breakthrough interventions, restructure payment methods to achieve better health and functional outcomes, and indicate why and how higher investment in healthcare and in new technologies could produce gains in life expectancy and quality of life across all age groups and many important conditions. 3.Chronic disease and disability require new strategies to fund technologies that reduce the consequences of disability: The disease burden in Australia today is heavily weighted by ‘the big killers’ (heart disease, stroke, cancer), ‘the big “disablers‘ (musculoskeletal disorders, mental disease), trauma due to falls and other preventable accidents, and by chronic disorders that cause high but often hidden losses of quality of life through pain, disability and loss of normal functioning. Investment in medical technologies that avert or reduce disability has not been a conspicuous priority in healthcare funding. For instance, Australia is facing a large increase in the economic and social burden of disorders of the eye and hearing disorders, and the related costs of falls in the elderly and non-participation of the sight and hearing disabled in schools and society. 4.Regulations affecting public access to breakthrough technologies should be subject to reasonableness tests: The need for effective government regulation of safety and efficacy is not in dispute. However, given the global nature of the health sector and of the use of medical technologies, it is essential that such government regulation does not increase product development costs and costs to consumers. All regulations of safety and efficacy should be subject to government cost impact assessments, to ensure that regulatory hurdles already passed in nations with high standards are not repeated or extended in Australia, leading to delays in patient access to effective interventions already available in other nations. Equally, the imposition of the 100% cost recovery policy adds to the cost burden of smaller medical device companies. 5.The funding and reimbursement processes for new medical devices should recognize that devices and drugs are two very different technologies: There is a large dichotomy in the funding of access to proven medical devices in public and private hospitals in Australia. It is essential that access to breakthrough diagnostics and medical devices be determined by patient need and not by the chosen point of access to care, the exigencies of federal-state cost-sharing arrangements, or the complexities of the National Health Act that require manufacturers of devices to negotiate funding with many health insurers. However, the MIAA is concerned by proposals that medical devices be approved and priced by the same techniques currently used for drugs subsidized under the Pharmaceutical Benefits Scheme (PBS). Medical devices are constantly improved, product lifetimes are often shorter than pharmaceuticals and medical device manufacturers incur large hidden costs in patient/product/surgeon support that are not reimbursed today. Generic pricing tools that reduce devices to the point of being commodities are singularly

5
inappropriate for diagnostics and medical devices that improve the health status and reduce the disability of Australians. 6.There is a real danger that health technology assessment (HTA) will become a “go/no go” determinant of whether a new technology is made accessible to doctors and patients. In the absence of any consensus that the methods, assumptions and appropriateness of HTA are sufficiently advanced worldwide, the danger of applying HTA to all technologies is immense- particularly if the major effect is to create a fourth regulatory hurdle, after clinical trials and pre-market approval but before access and reimbursement. While some national HTA bodies can distinguish between an “assessment” (a review of all available evidence of the clinical and cost-effectiveness of a technology) and an “appraisal” (a study of effectiveness of a particular technology used in a particular healthcare setting), any benefits from international attempts to harmonise pre-approval safety and performance review of devices will be offset by local regulatory delays at this fourth hurdle, and by the higher costs falling on suppliers of new devices.
6
3 SPECIFIC MIAA COMMENT ON THE SIX TERMS OF REFERENCE OF THIS
STUDY 3.1 TERM OF REFERENCE 1: IDENTIFY THE KEY DRIVERS OF MEDICAL
TECHNOLOGY DEMAND The terms of reference suggest that in this study the government is seeking a broad-brush analysis of the relationships between advances in medical technology, health outcomes and healthcare expenditures. The time periods of major interest are the last ten years and the next 5-10 years. We first propose a framework for assessing some of these relationships (Section 3.1.1), and then summarise some recent empirical evidence on the determinants of demand for medical technology (Section 3.1.2). 3.1.1 A conceptual framework for assessing the demand for and impact of
medical technology on healthcare expenditures Much has been written on the impact of ageing and medical technology on healthcare expenditures. Research since the early 1990s has shown repeatedly that ageing per se is not the major driver of healthcare expenditures. The recent international literature has considered more complex and enlightened theories of why healthcare expenditures continue to rise as a share of GDP, while also clarifying the role of medical technology in aggregate or as individual technologies. One framework for commenting on these matters is FIGURE 1 below. This figure expands the schematic used by Thomas6 by adding two more boxes, one reflecting the demand for medical technology (Term of Reference 1 of this study), and the other identifying age-related disability. The heavy lines defining the bottom oval of FIGURE 1 suggest that total direct healthcare expenditures are the product of two variables: the numbers of persons in each population age-sex group, and the expenditure per person in each of the age-sex groups
6 C.Thomas. “Health status, technological innovation, and health care expenditures”. Brandeis University, Background paper prepared for the Council on the Economic Impact of Health System Change, February 1999, 30 pages

7
FIGURE 1: Factors affecting the demand for medical technology and the drivers of national healthcare expenditures: a framework
Biomedical innovations Pharmaceuticals Genetics & disease prevention Tissue replacement Medical device
Health status Changing chronic disease patterns
Decreasing disability
Improved risk behaviours
Lifestyle and public health initiatives
Disease management Improved efficiencies in treatment (not captured in usual care) that shift the site, volume, price and quality of care New treatment modalities that coordinate care better
Increased longevity Expenditures
in last 3-10 years of life
Additional economic forces Inflation (economy-wide and medical non-technology-driven) Income Health insurance coverage Changes in medical practice and healthcare delivery Technology pricing policy and silo-budgeting Regulatory policy of governments
Population by age
and sex
Age and sex -specific health expenditures
Total Direct
Healthcare Expenditures
X
Age & disability-specific health expenditures
Demand for medical technology Investment in R&D Consumer expectations Ease of use by clinicians/patients Payment strategies Patent and IPR protection

8
In the top two boxes at the left of this framework, the rate of biomedical innovation in healthcare is driven by five factors:
• investment in research and development (R&D) of medical technologies; • the demands of consumers for better health and productivity; • the needs of providers of care to have access to a range of innovations to
prevent, treat or rehabilitate those with a widening array of health disorders; • payment strategies of governments and health insurers that enable
innovative biomedical companies to recover some of the up-front costs of R&D; and
• patents and intellectual property rights that give some protection to innovators who invest in such R&D.
This framework assumes that the health status of society (middle box on the second line) is directly affected by three sets of factors:
• the rate of biomedical innovation; • the improved risk behaviours of individuals and communities; and • improvements in the disease management system that arise from efficiency
gains (e.g., the ability to treat a patient outside the hospital and avert a hospital admission, thereby changing the site, volume, price and quality of care), and new treatment modalities that organize and finance access to care in such a way as to cause more appropriate use of prevention, cure or rehabilitation (as is now occurring in the management of chronic disorders such as asthma, diabetes, heart failure, chronic obstructive lung disease and many high cost diseases).
The health status of the population is measured by the changing patterns of disease, morbidity, mortality and quality of life. It should be noted that this framework depicts the determinants of direct healthcare expenditures, and does not make reference to the indirect costs that arise from changes in health status (such as workforce participation, attendance at school, work-loss or loss of productivity). Many medical devices reduce these indirect costs that are usually borne by patients, their informal carers and their employer. In this simplified model, we show two measures of health outcome: increased life expectancy and reduced disability. Health status influences the size and age composition of the population, and each age-sex cohort generates an aggregated healthcare expenditure per person in that age-sex cohort. Those estimates of age-sex specific expenditures are influenced by five paths indicated by lines in FIGURE 1:
• the extent of biomedical innovation; • changes in age and sex-specific disability; • the extent of effective disease management; • the extent of care given in the last years of life; and • “general economic forces” (a catch-all box including government pricing
and regulatory policies, household income, health insurance status and non-healthcare related inflation).

9
Two of those paths are of particular importance to this study into the economic impact of medical technology. The first is the path from biomedical innovation to age- and sex-specific health expenditures. Two new studies of the US health sector, summarized in Section 3.2 below, indicate that over the period 1960-1997 there was a 1-2% reduction per year in the quality-adjusted cost of specific disorders because of medical technology, despite significant increases in costs in the last years of life. The second path of interest is from the box marked “Additional economic forces” to age and sex-specific expenditures. While we note below some estimates of medical inflation on healthcare expenditures, available data does not enable useful estimates of the effects of changes in household income or health insurance coverage on expenditures on particular technologies to be made. Other parts of this submission will address the remaining factors in the “Additional economic forces” box, viz., payment policies for medical devices, silo-budgeting and government regulatory policies affecting the listing and pricing of medical devices. 3.1.2 The demand for new medical technologies Given the obvious constraints, we cannot summarise all the factors that influence the demand for medical technologies, so we provide an overview. In the top left hand box of FIGURE 1, we have listed some factors that have been measured in studies of the health sector since the 1970s. We focus here on:
• research and development, and the protections afforded by patents and other intellectual property rights;
• the search by doctors for technology that offers ease of use at the bedside or in self-care;
• patient preferences; • rising household income; • payments by health insurers and governments; and • changes in medical practice and specialisation.
Research and development supported by patents and other intellectual property rights: The literature on R&D and innovation makes fairly clear the contributing role of government policies affecting technology regulation, pricing, R&D incentives, industry policy and trade policy. These policies have been topics of debate on desirable changes in the pharmaceutical industry in Australia and New Zealand in the last 25 years, and were reviewed by the Productivity Commission in its 2001 report.7 The extent to which investment in medical technologies is influenced by incentives to innovation is illustrated by four examples.
7 Productivity Commission. International pharmaceutical price differences: research report . Melbourne, Productivity Commission, 2001.

10
• In Germany, medical technology companies employ some 108,000 persons. An unfavourable political climate caused a decline in investment in R&D from 10% to 7% of turnover in less than 10 years.8
• In New Zealand, identifying government drug pricing and intellectual property rights as the culprits, the Researched Medicines Industry Association indicated that “…the knowledge and investment developed here in biomedical research remain in grave danger of melting away as research funds reduce…In the space of a few years, New Zealand has built a reputation for having the world’s most hostile operating environments for the pharmaceutical industry…”9
• In the United States, the foreshadowed health policies of the Clinton administration caused investment in pharmaceutical R&D to fall away in the early 1990s.
• Redwood produced an impressive case study of Japan in the period 1960-2000. 10 He argued that in the 1970’s, Japan had a strong chemical industry with good process technology. It pursued product copying in the absence of pharmaceutical product patents and it controlled a pharmaceutical market in a prosperous country in which high drug prices were affordable under national social insurance schemes. The effect of a new patent system in Japan on its subsequent percentage share of the world-wide origination of major global drugs, and the percentage increase in multinational investment
in R&D over the period 1960-2000, were estimated by Webber as follows:11
Period Share of major global drugs 1960s <1.0% 1970s 3.5% [1976] 1980s 13.7% 1990s 21.4% 2000 28.8%
Period Percent increase in multinational investment in R&D 1960s =100% 1970s 46.8% [1976] 1980s 125.8% 1990s 147.4% 2000 187.0%2
Notes: 1. Average yearly investment of Top 30 multinational pharmaceutical companies only. 2. 2000 value estimated due to incomplete data of year 2000.
Webber concluded that the following lessons emerge from Japan in this period:
8 JM Schmitt.” Financing innovative medical technologies in the German healthcare system”. Business Briefing: Medical Device Manufacturing & Technology 2004, 4 pages. 9 RMI, 2000, quoted in: Access Economics. Exceptional returns…, op.cit , pages 51-52. 10 D Webber, Paper presented at Beijing Roundtable with Government of China, 26 October 2001.Beijing, FRPIA, October 2001 11 H Redwood. “Price Regulation & Pharmaceutical Research”, JAPM, Novartis, quoted by D Webber, Beijing Roundtable, 26 October 2001.

11
• Japan demonstrated the transformation from a former copying culture into one that now aims at originality and therapeutic innovation.
• Multinational investment in pharmaceutical R&D in Japan took an upward swing
after strong patent protection was introduced. Thus far, we have concentrated on R&D as a driver of demand for new technology, and to complete the picture we should summarise some evidence of the linkages between R&D and health status in FIGURE 1. First, a study by Cutler and Kadiyala 12 focused on reductions in heart disease in the USA since 1970. In this period, acute events such as heart attacks and strokes were treated with new technologies, many of which were new drugs. This study concluded that a number of factors contributed to this reduction, as follows:
Medical technology 33% - acute 20% - preventive pharmaceuticals 13% Public information 65% Public action 10%
Thus the lower boundary of the likely benefits from medical research is assumed to be 20% of the reduction in mortality, with another 13% associated with the use of new drug therapies and treatment protocols that reduced blood pressure and cholesterol. However the authors note that “...some fraction of the other two-thirds also should go to research since gains attributed to changes in public policy and individual behaviour depend on research-derived information”. This information includes education and patient information supplied by pharmaceutical companies. 13
Murphy and Topel estimated that the total economic value to Americans of reductions in deaths from heart disease averaged US$ 1.5 trillion in the twenty-year period 1970-1990. So if we assume that only 33% of this gain came from medical research, the return on investment would be US$ 500 billion per year. This estimate is 20 times the value of average annual spending on medical research in the USA. The following opinion of independent US economists about the likely economic gains from research into particular diseases is worthy of note as the Commission assesses
12 D Cutler and S Kadiyala. summarised in “Exceptional returns: the economic value of America’s investment in medical research”. Chicago, Lasker Trust, May 2000. Original paper accessible at http:// www.fundingfirst.org/. The messages of this path-breaking report have been repeated in two subsequent reports- see: PF Gross. The economic value of innovation: measuring the linkages of pharmaceutical research, use of innovative drugs and productivity gains . Sydney, Institute of Health Economics and Technology Assessment for the Pharmaceutical Partnership, March 2003; and Australian Society for Medical Research- see: AMSR and Access Economics. Exceptional returns: the value of investing in health R&D in Australia. Canberra, September 2003. 13 A new study by Massachusetts General Hospital and Harvard University researchers found that direct-to-consumer (DTC) advertising of prescription drugs led to significant benefits for patients, including lifestyle changes such as cessation of smoking and drinking. The study found that 35% of the 3,000 adults surveyed by Harris Interactive had discussed the advertised drug or other health concerns with their doctor as a result of DTC advertising. While consumers rely on many sources of information, the authors concluded that “…our results suggest that (drug advertising) is a potentially powerful source of consumer health information with effects that include, but also transcend, promoting the use of advertised drugs”. See: www.healthaffairs.org/WebExclusives/Pharma_Web_Excl_022603.htm)

12
the resources needed to care for a growing population in which chronic illness is more prevalent:14
“The economic gains from increasing life expectancy rise over time and the economic returns to improved health are greater the larger is the population, the higher are the average lifetime incomes, the greater is the existing level of health, and the closer are the ages of the population to the onset of disease. Growth and aging of the population alone will raise the economic returns to advances against many diseases by almost 50% between 1990 and 2030, (and) projected increases in real income and life expectancy will add at least that much again”. Ease of use at the bedside or in self-care: Advances in in vitro diagnostics have aided clinicians in better patient management of chronic diseases that, for a long time, have placed huge pressure on the health care system (e.g., diabetes and cardiovascular disease, including heart failure). Over the last 10 years in vitro diagnostic technology has been pushing the limits of clinical laboratory and patient-based testing. We highlight below some advances in diagnostic tools that have been widely accepted in clinical practice and rapidly diffused because they:
• lower the limits of detection: o Immunoassay enhancements o New labels and conjugation technologies o Amplification technologies o Single molecule detection
• move testing closer to the patient: o Minimally invasive technologies o Wireless applications/data communication o Robust technologies o In vivo sensors
• widen the scope of detection of disorders and conditions: o Multi-analyte platforms o Microarrays o Mass spectrometry applications o Bioinformatics applications
• reduce the size of devices: o Microchips o Nanotechnology o Integration and macro/nano interface o Microfluidics
Doctor and patient preferences: The rapid diffusion of specific medical technologies is easy to understand from a patient perspective if a family is at risk of, or suffers from, the most prevalent diseases. We use as an example the application of a range of medical devices in the diagnosis and treatment of heart disease, Australia’s most costly health disorder. Research and development by the medical devices and diagnostics industry has produced devices that: 14 Murphy and Topel, op cit, p. 96

13
• help reduce risk factors (e.g., blood pressure monitoring devices), • reduce the long term complications of often related chronic disease (e.g.,
diabetes complications as shown in the large DCCT and UKPDS trials, ANNEX 5)
• monitor symptoms and diseases (e.g., diagnostic devices for heart disease and stroke),
• distinguish patients who will benefit from drug therapy from those that will show no benefit due to genetic predisposition (e.g., pharmacogenomics and devices such as the Amplichip C450)
• aid diagnosis and treatment (e.g., drug-eluting stents, and ‘smart’ cardiac defibrillators), and
• accelerate rehabilitation, enabling individuals to lead normal lives or attain a higher quality of life (e.g., ambulatory heart monitors).
Advances in technology have also facilitated the development and utilisation of complex surgical procedures. For instance, prostheses used in total joint replacement have evolved with the success of the procedure. Originally prostheses were inserted into old or inactive patients, with the expectation that the device would outlast the patient. However, success of the procedure and modern designs, which accommodate greater activity and range of movement and biological age of the recipient bone, have resulted in prostheses being implanted into younger and more active patients – and the realization that in time the prosthesis may have to be replaced. Rising household income: Researchers have observed that, using cross-national macro-data (e.g., OECD Health Data 2004), the elasticity of healthcare expenditures with respect to income is of the order of 1.4, i.e., for every 10% increase in income, healthcare expenditures increase by 14%.15 At the micro-level of the individual, income elasticities are less than 1.0 16 in the United States, where health insurance with deductibles and coinsurance may have blunted consumer demand for new technologies. Recently, economic studies of healthcare expenditure growth have tried to resolve this difference in income elasticity in the macro- and micro-data. A recent paper found that “…the rising health share (of GDP) occurs as consumption continues to rise, but consumption grows more slowly than income. The intuition for this result is that life is valuable, and as people get richer, the most valuable channel for spending is to purchase additional years of life”.17 It is reasonable to assume that the demand for hospital-based medical technology in Australia is a function of household education, income and health insurance status,
15 See for example: U-G Gerdtham and B Jonsson.” International comparisons of health expenditures: theory, data and econometric analysis”. In: AJ Culyer and JP Newhouse. Handbook of Health Economics. North Holland, 2000. 16 JP Newhouse.” Medical care costs: how much welfare loss?” Journal of Economic Perspectives Summer 1992; 6(3): 3-21. 17 Robert E. Hall and Charles I. Jones. “The Value of Life and the Rise in Health Spending”. Berkeley, University of California, Department of Economics, 1 November , 2004 , Version 2.0 (downloaded 10 November 2004 from: http://elsa.berkeley.edu/~chad )
14
particularly if major budget constraints in public hospitals limit access to certain interventions, for some of which hospital waiting times are excessive (e.g., knee and hip replacements, drug-eluting stents and ICDs). It is also reasonable to assume that access to non-drug medical technology in non-hospital-based medical practice is not as dependent on these three factors, because medical services in this sector attract public subsidies under Medicare, notwithstanding the co-payments on such services that have to be met from household disposable income. Changes in payment for health services and medical technology: Worldwide, private health insurance is growing as governments of all political persuasions reduce their dependence on tax revenue. There are three facets of public funding on which MIAA members have specific concerns that might be addressed in the PC study, viz.,
• the limitations of current funding of access to essential medical technologies from government tax revenue, private health insurance and patient out-of-pocket payments, and the associated trends in such funding;
• the implications of trends away from public provision for patients already lacking adequate access to essential medical devices; and
• the potential for existing and proposed regulatory hurdles to slow patient access to devices.
As indicated in ANNEX 1, MIAA companies represent about 85% of the Australian medical device and diagnostic market, with the top 20 companies generating annual revenue of just over $2.6 billion.18 This revenue is split about 50:50 between public and private hospitals,19 but because of palpable budget constraints affecting most public hospitals, it is likely that the public hospital share will continue to fall as specialties such as orthopaedics, ophthalmology and cardiovascular disease treat more of their patients in private hospitals. ANNEX 8 summarises the funding of cochlear implants for children and adults, indicating the limitations of public funding on access and the waiting times for the device. The demand for the device is constrained by the methods of public and private reimbursement and payment. One recent US study has suggested that “…technology’s impact on costs is influenced by systemic changes in health care reimbursement”. 20 It would be very useful to have data on any similar relationships of reimbursement methods and the costs of medical technology in Australia, but MIAA does not have access to the needed data.
18 The revenue of all companies in the industry is estimated to exceed $3 billion. 19 Source: MIAA. Market Barometer Online Survey Summary Data, Top 20 Australian Medical Device Companies, MBOS No. 6:Quarter 2, 2004. 20 PE Mohr et al., The impact of medical technology on future health care costs: final report. Bethesda (Md), Project HOPE for HIAA and Blue Cross and Blue Shield Association, 28 February 2001, 52 pages plus appendices

15
Changes in medical practice and specialization: While all of the above technological developments are emerging, medical practice is restructuring through specialisation of hospital and medical practice. Consider the three examples below:
TREND IMMEDIATE IMPACT DOWNSTREAM IMPACT
Stand-alone multi-specialty ambulatory surgery centres owned by doctors 21
Same-day gastro units, diagnostic units and physiotherapy units in hospitals
Shifts of care to high volume units
Concierge medicine22 Higher charges for exclusive treatment on demand
Two-class access at doctors’ offices
More non-insured services
Single-specialty medical groups 23
Cardiovascular, orthopaedics, neurology, ophthalmology, oncology
Higher leverage with PHI funds
Loss of access by public patients
US private health insurers and governments are now contracting with specialist networks in key specialties24 (cardiology, cardio-thoracic surgery, general surgery, orthopaedic surgery, gastroenterology, and obstetrics and gynaecology). They are also paying higher prices to specialists willing to measure the quality of the care offered, including adherence to evidence-based clinical practice guidelines. The same trend may emerge at a slower rate in Australia. We already see the consolidation of the specialties of orthopaedics and ophthalmology in private clinics and hospitals, with obstetrics not far behind because of the recent medical indemnity crisis. Some new diagnostic technologies may cause intrusions of one specialty onto another specialty’s traditional turf.25 It is difficult to predict the impact of such scenarios on the future demand for medical technology. 3.1.3 SUMMARY: The demand for new medical technologies The growth of technological intensity in hospital and medical practice is a function of many factors. The Commission will, no doubt, reflect on the impact of the demands of clinicians and patients to have access to the most effective breakthrough technologies. 21 L Butcher. “OP’s Nueterra thrives with specialty health care centers”. The Business Journal of Kansas City 12 March 2004. 22 P Neurath. "Debate grinds on about concierge medicine”. Puget Sound Business Journal (Seattle edition) 12 March 2004 23 LP Casalino et al. “Growth of single-specialty medical groups”. Health Affairs 2004; 23(2): 82-90; HH Pham et al., “Financial pressures spur physician entrepreneurialism”. Health Affairs 2004; 23(2): 70-81 24 J Carroll. ”Narrow networks’ broader vision”. Managed Care Magazine circa April 2004 25 The US health system is seeing such disputes now: see for example: G Kolata.” Heart scanner stirs new hope and a debate”. New York Times 17 November 2004 (downloaded 24 November 2004 from: http://www.nytimes/2004/11/17/science/17scan.html )

16
Apart from the willingness of entrepreneurs and some governments to invest in innovative research at the basic and applied level, MIAA does not believe that there is a single explanation for the growth of medical technology in the last four decades. In most societies there is a constant search for health, safety and productivity gains through applications of technology. Many of the new medical devices identified in the remainder of this submission allow substitution of capital for labour, and many others replace professional care with technology-guided self- diagnosis and care. The following sections of the MIAA submission contain examples that justify a fuller recognition of the impact of research and development on technological innovation in hospital and medical practice, and on self-diagnosis and care.

17
3.2 TERM OF REFERENCE 2: IDENTIFY THE NET IMPACT OF ADVANCES IN
MEDICAL TECHNOLOGY ON HEALTHCARE EXPENDITURE OVER THE PAST TEN YEARS
Continuing with the schematic in FIGURE 1, the MIAA analysis of this second Term of Reference identifies the drivers of health expenditure growth in last 10 years, having particular regard to recent studies that measure the impact of technology on health expenditures (Section 3.2.1). We then summarise some of the studies measuring or predicting the impact of selected medical technologies on healthcare expenditure growth (Section 3.2.2). 3.2.1 Empirical data on the major determinants of healthcare expenditure
growth in the past four decades, including the impact of medical technology
What have been the major causes of the increase in national healthcare expenditures since the 1960s? The draft report of a study by the Commission into the ageing of the population, released on 24 November 2004, concluded that ageing will have a significant impact on the growth of federal government budgets in the next 30 years. Ageing alone is not the most powerful driver of healthcare expenditures. Eminent economists such as Professor Joseph Newhouse26 came to this conclusion in the early 1990s, and many other analysts confirmed his conclusion in subsequent research in the 1990s. In 2005 we hope that the Commission’s deliberations will move the debate on national health expenditures away from the role of ageing per se by focussing on other possible linkages to healthcare expenditures, as depicted in FIGURE 1. There are at least four methods by which the Commission could attempt to assess some of the linkages depicted in FIGURE 1 and their impact on healthcare expenditures over the past 5-10 years. No single method produces a complete explanation. All four methods could be used in reaching defensible conclusions about the past and possible future impact of medical technology on national health expenditures. A fifth method, the so-called “bottom-up” method,27 assesses the impact of specific technologies on the costs of specific disorders, and we will discuss some findings of this method in Section 3.3 under Term of Reference 3. METHOD 1- the residuals or top-down approach: In the so-called “top-down” or “residuals” method, the growth rate of nominal national healthcare expenditure (i.e., direct expenditure on healthcare not adjusted for inflation) between two periods is
26 JP Newhouse.” Medical care costs: how much welfare loss?” Journal of Economic Perspectives Summer 1992; 6(3): 3-21. 27 This method was used in a US study in 2001-see: PE Mohr et al. The impact of medical technology on future health care costs. Bethesda (Md), Project HOPE for the Health Insurance Association of America and Blue Cross and Blue Shield Association, 28 February 2001, 52 pages plus annexes.

18
assumed to be a function of the growth rates in three factors: population, wage and price inflation, and a residual that is usually labelled ‘technological intensity’.28 One estimate of the relative impacts of inflation, population growth and “technological intensity” is contained in the annual health expenditure estimates by AIHW. The latest edition29 (page 17) estimated that the major sources of the 51.7% growth in nominal health expenditure over the previous decade were inflation (39.4%), population growth (15.4%) and real expenditure per person (45.1%). The last figure is a rough aggregated indicator of technological intensity. Within the 45.1% share of “technological intensity”, there are two subcomponents: the per capita encounter rate with the health system and the amount of medical technology used per encounter. From available Australian data MIAA cannot estimate these two sub-components at the aggregate level, nor for most individual medical devices.30 The relative impact of these three factors varies across nations depends on many factors that are not common to all nations (e.g., the “Additional economic forces” box in the bottom right-hand corner of FIGURE 1 includes economic and government policies that vary significantly). The latest OECD Health Data 2004 allow us to summarise for the past decade the percentage contributions of these three factors across seven nations that vary in their population ageing, economic development and health financing systems (see chart below)31. Observing the OECD data in the chart below, “technological intensity”, as measured by the residuals approach, seems to vary across nations in the same time period. It is likely that this apparent variability is more a function of the residuals method than of inexplicably wide variations in disease prevalence, health care use, unit costs per treatment, and the intensity of use of medical technology in these nations. US studies using the residual method have shown wide variation in the “contribution” of medical technology, from less than 5% to over 60%.32
28 The residuals method, as used by the US government actuaries to project US health spending, uses an accounting identity that separates the effects of five factors: population, economy-wide inflation, excess prices in the health sector, the age-sex composition of the population, and the residual measure of real healthcare expenditures per unit of service. For an assessment of the methodological holes in this method in measuring price changes when there is rapid technological change in different parts of the health sector and changes in disease patterns and service mix, see: ibid., 11-13 29 AIHW. Health Expenditure Australia 2002-03. Canberra, Australian Institute of Health and Welfare, September 2004, 128 pages. 30 It may be feasible to do so for individual drugs subsidized on the Pharmaceutical Benefits Scheme because data on prices and volumes can be linked to MBS data on medical services under the usual privacy restrictions. 31 The total of the three bars for each nation is 100%. 32 Mohr et al. op. cit. page 21 ; and L Di Marco.The macro determinants of health expenditure in the United States and Canada : assessing the impact of income, age distribution and time. Health Policy 2005 ; 71 : 23-42.

19
We summarise here the measured accuracy of US forecasts that rely essentially on the top-down residuals approach. The table below shows the differences between 10 year forecasts and actual US healthcare expenditures over different periods from 1980-2000. As the table shows,33 the forecasting of healthcare expenditures over 10 years is not a precise science, even if the forecast has access to data half-way through the decade, and while absolute values are large, over- and under-estimates are common. Authors Period of forecast Projected annual
real growth rate-% Actual real annual growth rate-%
Percentage difference in rates
Freeland and Schendler, 1981
1979-1990 4.1 5.4 -24.4
Arnett et al, 1986 1984-1990 3.1 5.7 -45.3 Sonnefield et al, 1991
1990-2000 4.4 3.3 31.0
Burner, Waldo and McKusick, 1992
1990-2000 5.5 3.3 65.4
Burner and Waldo, 1995
1990-2000 4.0 3.3 19.5
METHOD 2- life expectancy gains and cost reductions with medical technology: This method, which can be reviewed in detail at the website indicated, 34 offers some new insights on the aggregated impact of medical technology on some of the other factors depicted in FIGURE 1, such as life expectancy, income,
33 Congressional Budget Office. “Projections of DoD’s future medical spending under current policies”. Chapter 2 in : DOD. Growth in medical spending by the Department of Defense. Washington DC, CBO, September 2003, 5 pages (downloaded 17 October 2004 from: http://www.cbo.gov/showdoc.cfm?index=4520&sequence=3 ) 34 CI Jones.” Why have health expenditures as a share of GDP risen so much?” Department of Economics, University of California (Berkeley), manuscript Version 3, 5 May 2004 (downloaded November 2004 from: http://elsa.berkeley.edu/~chad ); and RE Hall and CI Jones.” The value of human life and the rise in health spending”. Department of Economics, University of Berkeley, manuscript version 2.0, 1 November 2004 (downloaded November 2004 from: http://elsa.berkeley.edu/~chad )
0
10
20
30
40
50
60
70
80
Aus
t
Can Fra
Ger
Net
h
UK
US
A
Prices/wages
Population growth
Technologicalintensity
20
government transfer payments (e.g., government subsidies to the poor and aged), healthcare expenditure increases in the last years of life, and the share of national healthcare expenditures in GDP. The model assumes that healthcare expenditures change with life expectancy, and that persons with lower life expectancy will have higher direct healthcare expenditures for two reasons: they have more serious conditions (requiring more complex care), and basic treatments for such conditions have been only recently discovered (and so cost-reducing technological progress has had less time to change the condition). Using data for the period 1960-1997, this model produced some estimates for the impact of technology in the US health sector35 that might be noted by the Commission, viz.,
• Expenditures by the Medicare program for the US elderly rose at an average rate of 9.4% per year for persons 3 -10 years from death.
• This rate accelerated sharply to 45% per year in the last two years of life. • 25% of healthcare expenditures were for persons in their last year of life. • Technological progress in medicine reduced the quality-adjusted cost of
specific treatments by about 1-2 per cent per year. • A critical determinant of the health expenditure/GDP ratio was the
willingness of society to trans fer resources to those at the end of their life. • On the cost side, about 75 percent of the increase in the health/GDP share
from 5.1% in 1960 to 13.6% in 1997 seems to have been driven by “the march of science” and medical advances. On the health benefit side, each extra year of life expectancy gained was associated with an increase of 3.5 percent of GDP share, and the implied value per life year gained was US$93,000, an estimate that is consistent with many prior estimates of the value of one year of human life.
METHOD 3- disaggregation to major health disorders: This less aggregated method of estimating some of the relative impacts of the factors listed in FIGURE 1 evaluates the disease-specific drivers of national health expenditures. Australian data to guide such assessments are not available so we turn to a recent US paper36 on the contribution of fifteen major diseases, all prevalent in Australia, to explain what caused the growth in nominal US national health expenditures between 1987 and 2000. Exhibit 3 of that paper, reproduced below, indicates that the growth rates in three factors were key: population, treated prevalence, and cost per treated case.
35 There are significant differences in the healthcare systems of USA and Australia that render comparisons problematical. While the demography may be similar, the share of healthcare expenditures in Australian GDP is about two thirds the US ratio. 36 KE Thorpe, CS Florence, and P.Joski. Which Medical Conditions Account For The Rise In Health Care Spending? Health Affairs Web Exclusive August 2004

21
Some findings of this US analysis are relevant to the Commission’s study. First, these fifteen disorders were associated with about 56% of the increase in US national healthcare expenditures between 1987 and 2000, with five disorders (heart disease, mental disorders, pulmonary disorders, cancer and trauma) accounting for 31% of the overall change. Second, while population growth was associated with 20-35% of the change in expenditures on different disorders (see the right-hand column), the increase in treated prevalence was highest for pulmonary disorders, mental disorders, stroke, diabetes, back problems, endocrine disorders and kidney disorders.37Third, the increase in cost per treated case was highest for heart disease, cancer, hypertension, trauma, arthritis, skin disorders, pneumonia and infectious diseases. This type of study is not yet feasible in Australia because we have not invested resources in the national surveys required, and Australian privacy regulations render futile any attempt to link existing data on MBS and PBS claims to data held by private health insurers. If all else fails, and noting our earlier caveat on international comparisons, the Commission might want to base some of its estimates of future expenditures in Australian healthcare on the fifteen disorders listed in the above table, extrapolating into the forecast reasonable assumptions about the likely growth
37 The high end of that range of 20-35% is broadly consistent with the estimated contribution of ageing per se (36%) in: Productivity Commission. Economic implications of an Ageing Australia. Draft research report, November 2004, page 6-27.

22
in treated patients in Australia, and an increased cost per treated case that discounts US costs of treatment (our average costs per patient could be 30% lower than US equivalents if current OECD data are any indication, but our hospital admission rates are 2-3 times higher than US rates). METHOD 4- disaggregation of healthcare expenditures to age/sex by disability and chronic conditions: Seeking explanations for the causes of healthcare expenditure growth in Netherlands and the USA, in 1998 Dutch researchers provided an early clue by including data on disability at different ages.38 They noted that”…the major determinants of healthcare use in the Netherlands are old age and disabling conditions, particularly mental disability”. This fourth method of disaggregating the impact of the factors depicted in FIGURE 1 measures the impact of many of the above-listed chronic diseases and their associated disability on national health expenditures. With suitable data lacking in Australia, we again turn to recent US data based on surveys that are not used in Australia and which provided the same data sets as used in METHOD 3 above.39 The chart below, based on unique US datasets for 2001 that reveal the value of record-linked data drawn from large representative national surveys, shows the effects of chronic disorders (CI), disability (D) and functional limitations (FL) on the rate of hospital admissions (in percent), the number of doctor visits and the number of drug prescriptions.
38 WJ Meerding, L Bonneux, JJ Polder et al.,” Demographic and epidemiological determinants of healthcare costs in Netherlands: cost of illness study”. British Medical Journal 1998; 317: 111-115. 39 G Anderson, JR Krickman.” Changing the chronic care system to meet people’s needs”. Health Affairs 2001; 20 (6): 146-160.
3.4
7.6
17.0
34.432.9
1.7
4.6
8.37.99.6
2.2
11.0
23.522.2
33.5
0
5
10
15
20
25
30
35
Percenthospitalised
Mean doctorvisits
Mean Rx
No CICICI+DCI+FLCI+D+FL
23
As we move from left to right in each set of bars for these three crude aggregated indicators of the utilisation rates of healthcare resources (percent hospitalised, mean doctors visit rate and mean number of prescribed drugs), we can see that once a chronic illness (CI) appears, the utilisation rates of hospitals, doctors and drugs start to increase. Once disability and a chronic illness appears (CI+D), there is an even more pronounced jump in utilisation rates. Finally, once a functional limitation occurs in a person with both a disability and a chronic illness (CI+D+FL), there is a large increase in the utilisation rates of hospitals and drugs. A new study of the impact of disability across a wide age spectrum was released recently by the RAND Corporation.40 This analysis of US Medicare program expenditures on the population aged over 65 years found that, even with assumptions that disability has fallen slightly in the USA, the US Medicare expenditures from 2020 will increase because of disability among the ‘young elderly’. Forecasts that assumed that disability among today’s younger generations would increase yielded even more pessimistic forecasts. These two studies suggest that if Australian forecasts of future healthcare expenditures are to be useful, the forecasting methodology should embed plausible estimates of age and disability-specific utilisation rates by sex, and the growth rates of associated unit costs of treatments by age/disability level/sex. These two refinements in forecasting method could incorporate changes in disease prevalence, cost per treated case and population growth, as proposed in METHOD 3 above. OTHER MODEL REFINEMENTS Two other model refinements may be justified, one dealing with changes in major risk factors and the other dealing with the costs of end-of-life care. Risk factors, age and disability: Extending the above discussion of the effects of disability from chronic illnesses and other causes, the obesity epidemic has brought forth the first estimates of the impact on health expenditures of treatment of overweight and obese persons. Australia has similar rates of obesity as the United States. If Australia had invested in the risk factor surveillance surveys that are used in the United States, we might be in a stronger position to model the impact of obesity on disability from many disorders (such as stroke, diabetes, heart disease, and depression), and its impact on the costs of treatments of those disorders. US data suggest that severe obesity is associated with 60-68% higher healthcare costs than normal weight, and moderate obesity with 18-31% higher costs. The recent empirical analysis concludes that disability rates will increase by 1% per year more in the age group 50-69 than if there were no further weight gain.41 Such data might enable better forecasts of the future cost impacts of uncontrolled obesity and the health and economic benefits of different interventions, including bariatric surgery. A new study by Kaiser Permanente released in December 2004
40 J Bhattacharya, D Cutler, DP Goldman et al., Disability forecasts and future Me dicare expenditures. Santa Monica, RAND, nd but circa October 2004, 21 pages and 10 tables. 41 R Sturm, JS Ringel and T Andreyeva.” Increasing obesity rates and disability trends”. Health Affairs 2004; 23(2): 199-205.
24
observed cost reductions of US$800 per member from specific actions to reduce weight gain. End of life costs: The costs of care in the last years of life should be recognised in the forecasting method. Five recent studies firmly locate the heaviest expenditures in the last ten years before death.42 As we live longer, total healthcare expenditures could be expected to increase with age, chronic illness, and use of hospitals 43 and long-term care near death. First, US researchers44 showed that amongst the beneficiaries of US Medicare programs (the federal program for the aged), 27% of beneficiaries generated 75% of expenditures over 5 years, 18% of them were in the top quartile of spending for at least two consecutive years, and this 18% generated 57% of the 75%. The other 9% (of the 27%) generated the remaining 18% of expenditures. The study concluded that: “6.6% of Medicare recipients who died accounted for 22% of program expenditures, a pattern that has changed little over time”. A second UK study45 confirmed some of these US findings. The healthcare expenditure increase started 15 years prior to death. About 50% of patients hospitalised in their final year were not admitted after age 65 years. There was an increase in costs from 5 years before death, which overshadows a 30% increase from age 65 to 85 years.46 A third German study47 revealed the relationship of inpatient and outpatient costs in the insurance claims of deceased and living members. There was an insignificant difference between the per capita claims with and without the deceased, but the inpatient claims rose with age. The fourth study, 48 quoted earlier and based on US health expenditure growth from 1960 to 1987, showed that
• Medicare expenditures (on the elderly) rose at the rate of 9.4% per year for persons 3-10 years from death.
42 The draft report of the Productivity Commission on the economic implications of ageing, released on 24 November 2004, did not review the salient literature, and its forecasts in Appendix E were based on crude estimates of extra costs in each age-sex cohort in the last two years of life. 43 About 53% of Australians die in a hospital, versus under 40% in the United States. Deaths following intensive care also add to the end-of-life costs at all ages. 44 DP Kessler and MB McClellan. ”Advance directives and medical treatment at the end of life ”.Journal of Health Economics 2004; 23: 111-127. 45 M Seshamani and AM Gray.” A longitudinal study of the effects of age and time to death on hospital costs”. Journal of Health Economics 2004; 23: 217-235. 46 This finding renders less defensible some of the conclusions of the draft report by the Productivity Commission about end-of-life costs and ageing. The modeling by the Commission assumes that only the last 1-2 years of life may be more costly (pages C-5 and C-6), and the modeling method outlined in Box C.2 might need to be changed to reflect the Seshamani and Gray (2004) and the Jones (2004) findings. The potential impact of advanced directives on costs in the last year of life might also be modeled. 47 S Rodrig and H-O Wiesemann.” Der einfluss des demographischen wandels auf die ausgaben der krankenversicherung”. Zeitschrift Fur Die Gesamte Versicherungswissenschaft 2004; 1: 17-46 48 CI Jones.” Why have health expenditures as a share of GDP risen so much?” Department of Economics, University of California (Berkeley), manuscript Version 3, 5 May 2004 (downloaded November 2004 from: http://elsa.berkeley.edu/~chad ).
25
• This rate accelerated sharply to 45% per year in the last two years of life. • 25% of national healthcare expenditures were for persons in their last year of
life. Fifth, a forthcoming study49 of the growth of healthcare expenditures in the United States and Canada assessed the impact of income, ageing and time. Using econometric models the study found that, if ageing was measured by the population over 65, about 10-20% of US healthcare expenditure growth was associated with “ageing”, and time (a proxy for medical technology, policy shifts and other factors) contributed about 62%. In Canada, the proportion of the population over 65 contributed about two-thirds of the increase in real per capita total provincial government spending. Looking at the policy implications of the findings, the author concluded that “…while an ageing population’s impact on health expenditures appears modest, it is concentrated in the 75 and over age category that supports the hypothesis that “the cost-of-dying” is anticipated to drive up expenditures”. The findings of these five studies may persuade governments and private insurers to create more efficient ways of financing care of the dying and of other high cost cases, including access to remote monitoring technology that MIAA members believe could sustain patients in their own homes. 50 The funding of such technology is not a cost-free process, but the benefits of such enabling home care technology and home hospice services are now being evaluated worldwide. Under its Term of Reference 2, MIAA encourages the Commission to reflect on the potential impacts on healthcare expenditures of advance directives, home hospice care and technology-supported palliative care, including the potential role of new medical devices for pain management, respiratory support and infusion pumps and the cost reductions that might accrue. MIAA also notes that in an earlier UK review of the impact of medical technology, the first Wanless Report in 2002 contained forecasts of UK healthcare expenditures under three scenarios: where there was “solid progress” in reducing smoking and obesity, a “slow uptake” of such measures, and a “fully engaged” public accelerating risk factor reductions. The UK government then asked Wanless to focus on one of these options, which led to a second study to estimate the costs of securing good health for the whole of the population. Wanless provided some useful road maps, but 49 L Di Marco.The macro determinants of health expenditure in the United States and Canada : assessing the impact of income, age distribution and time. Health Policy 2005 ; 71 : 23-42. 50 One strategy is evaluating a live audio and video linkage of trained nurses with 700 homecare patients in the Dutch province of Gelderland. It is a trial joint venture between the government and two Dutch private sector providers, the trial offers the service free, and beyond the trial the cost will be less than US$ 24 per month, far less than the cost of the care it replaces -see: A Deutsch.”Dutch patients start using online nursing”. Seattle Post-Intelligencer 11 May 2004 (downloaded on 13 May 2004 from: http://seattlepi.nwsource.com/printer.ap.asp?category=1700&slug=Online%20Nursing ). A second strategy, initiated by Aetna, uses a new insurance benefit design that covers hospice care while also paying for expensive treatments, thereby ensuring that those in hospice care do not give up their right to curative care-see: A Petersen.” Insurers test expanded hospice coverage”. Wall Street Journal 29 April 2004 (downloaded 30 April 2004 from: http://online.wsj.com/article_print/0,,SB108319045654996504, 00.html ). A third strategy uses advance directives by a patient indicating his/her wish that no heroic interventions be attempted in the last stage of his/her life-see: DP Kessler and MB McClellan. ”Advance directives and medical treatment at the end of life.” Journal of Health Economics 2004; 23: 111-127.

26
no firm estimates, arguing inter alia for a strong public health research strategy. While its members have an understandable preoccupation with medical devices, MIAA believes that the Commission’s forecasts of the impact of medical technology should not exclude the impact of validated public health technologies financed at levels that achieve risk factor reduction and the reduction of disability. 3.2.2 SUMMARY: Any growth in the cost of medical technologies should be
related to their benefits in added life expectancy, productivity and quality of life across the life cycle, including their potential role in end-of-life care
In discussing the growth rate of national healthcare expenditures, it is easy to label “medical technology” as the culprit behind expenditure growth. Many articles assessing the role of medical technology in the 1990s used the words “villain” and “culprit” in analyses of health care expenditures. The MIAA makes the following broad observations about such labelling and the need to recognize the benefits achieved with medical technology, particularly in the light of new economic evidence summarized above. First, if judged by the top-down “residuals” data presented in METHOD 1 above, the three aggregate drivers of national healthcare expenditures are price and wage inflation, population growth and composition, and the factor that we labelled “technological intensity”. This last factor has two subcomponents: contacts per person with each provider of care and the amount of “technology” (diagnosis, drug, medical device, prosthesis and surgical intervention) used per contact with those providers or in self-care. It is difficult to measure these two subcomponents with available data in Australia. Accurate measurement requires appropriate and timely data collections on use rates per person, the type/amount of “technology” per patient contact, and prices charged in the major sites of care. Australia needs to invest in better market basket designs and pricing indices to measure these variables. In the absence of such data, the available aggregated data suggest that in recent decades, while “technology” is a significant driver of healthcare expenditures, both aggregate and technology-specific data reveal that many technologies are cost-reducing, some are cost-effective, some also improve quality of life and others have fewer side-effects. The Australian PBS system values these attributes and pays more for drugs that have them. Unfortunately the reimbursement systems for medical devices in Australian healthcare do not yet pay for innovations, a matter discussed under Terms of Reference 3 and 4 below. Second, we noted new evidence suggesting that specific types of medical technology have had a positive impact on life expectancy and been associated with a 1-2% reduction per year in the quality-adjusted costs of specific treatments over the period 1960-1997. Noting these US findings about the chronic illness burden, ageing, care in the last years of life and their specific effects on healthcare expenditures, we fully recognize the limitations of reliance on US data, but there are no equivalent data available from Australian surveys. MIAA believes that any forecasts of future healthcare expenditures should incorporate measures of disability and chronic illness along the lines of METHODS 2-4 above, and also measures of
27
the potential impact of disability-reducing technologies on such expenditures. We believe that estimates given in the draft report of the Commission’s study of the impact of ageing, released November 2004, may need revisiting to assess the impact of the omitted variables used in METHODS 2-4 above. Third, in the development of specific medical devices in the last ten years, medical device manufacturers have subjected the devices to rigorous trials of efficacy, safety and cost-effectiveness. A higher investment in some technologies has produced demonstrable health status gains that explain why the above 1-2% reduction per year in the quality-adjusted costs of some disorders might have occurred. Those devices have reduced the use of drugs, reduced hospital admissions and length of stay and allowed the individual to function normally, thus reducing the indirect costs of caring for patients with serious disease. MIAA believes that any forecasts of future healthcare expenditures should take account of possible movements in the site, volume, price and net costs of care that might accrue from policy changes that allow access to breakthrough medical devices. Fourth, the consideration of benefits as well as costs of medical technology has been largely absent from the Australian health policy debate, a gap that the Commission’s report on the impact of new medical technology could fill. We hope that the Commission will reflect on the cumulative evidence presented in the pioneering studies by Murphy and Topel51, Nordhaus52, Cutler and McClellan53 and Lichtenberg54. Fifth, as emphasized in our comments under Terms of Reference 3-6, the Commission may want to consider how any future change in payment for innovative medical devices could accelerate access to technologies with a demonstrable breakthrough impact on the site, total cost and quality of care, so that Australia achieves the gains in life expectancy and the 1-2% annual reductions in the quality-adjusted cost of specific treatments observed in these US studies. The access to and the application of medical technology that influences both the costs and quality of life at the end of life must also have a high priority in future reforms of healthcare funding and reimbursement.
51 KM Murphy and R Topel.’ The economic value of medical research”. In: Murphy and Topel (eds). Measuring the gains from medical research. Chicago, University of Chicago Press, 2003. 52 WD Nordhaus. “The health of nations: the contribution of improved health to living standards”. In: Murphy and Topel (eds). Measuring the gains from medical research. Chicago, University of Chicago Press, 2003. 53 DM Cutler and M McClellan. “Is technological change in medicine worth it?” Health Affairs 2001; 20(5): 11-29. 54 F. Lichtenberg. “Do (more and better) drugs keep people out of hospitals?” American Economic Review 1996;86: 384-388; F. Lichtenberg. “The effect of pharmaceutical utilization and innovation on hospitalization and mortality”. In: B vab Ark, SK Kuipers and G Kuper (eds). Productivity, Technology, and Economic Growth. Kluwer Academic Publishers, 2000; F. Lichtenberg. “The effect of changes in drug utilization on labor supply and per capita output”. Cambridge, National Bureau of Economic Research Working Paper 9139, September 2002, 31 pages plus tables; F Lichtenberg.” The economic benefits of new drugs” . Economic Realities in Health Care Policy. 2002; 2(2):18 (East Brunswick, Pfizer Inc); F Lichtenberg. Sources of U.S. longevity increase, 1960-1997. Cambridge (Mass), National Bureau of Economic Research Working Paper 8755, 2002; and F Lichtenberg. “ The impact of new drug launches on longevity: evidence from longitudinal, disease-level data from 52 countries, 1982-2001”. New York, Columbia University and National Bureau of Economic Research, 16 February 2003, 21 pp plus tables and figures.

28
3.3 TERM OF REFERENCE 3: IDENTIFY THE LIKELY IMPACT OF ADVANCES
IN MEDICAL TECHNOLOGY ON HEALTHCARE EXPENDITURE OVER THE NEXT FIVE TO TEN YEARS, AND IDENTIFY THE AREAS OF SIGNIFICANT POTENTIAL GROWTH
This term of reference seeks to identify the likely impact of a range of emerging and current medical technologies on the growth of healthcare expenditures in the next 5-10 years, while highlighting the impact of specific high-cost technologies. We make two comments at the outset. First, many commentators are sceptical of the value of long-term forecasts of healthcare expenditures, described by one critic as “… an enterprise in comparative fancy”.55 Nonetheless, we agree with one recent observation by US experts that forecasts are useful for providing estimates of the uncertainty surrounding them. While there is no single view on which forecasting models are superior over different timeframes,56 we believe that the different models outlined in Section 3.2.1 above deserve scrutiny by the Commission as it attempts to forecast the broad impact of medical technology in the next 5 -10 years. Second, while the MIAA submission identifies the impact of a large range of medical devices used in clinical practice today, in this section we emphasise our belief that the PC study should highlight the emergence and potential impact of the next generation of devices and diagnostics on the under-use of medical technology in addressing three large deficits in health care in Australia, viz.,
(1) the many health disorders that are inadequately treated today, (2) medical error rates that can be reduced with appropriate funding of patient
safety devices and expanded information technology, and (3) chronic conditions that are inadequately monitored, or where disability rates
can be reduced by remote monitoring and by devices that facilitate mobility. We first identify nine areas of healthcare in which medical devices seem likely to diffuse rapidly in the next 5-10 years, influencing the outcomes of care of patients with chronic and acute conditions (Section 3.3.1).57 We then summarise four recent estimates of potential savings from groups of medical technologies and individual devices (Section 3.3.2).
55 Cited in : R Lee and T Miller.” An approach to forecasting health expenditures, with application to the U.S. Medicare system”. Health Services Research 2002; 37 (5): 1365-1386. 56 The different requirements of forecasting over 1 year, 5 years and longer time horizons are summarized in T Getzen.” Forecasting health expenditures: short, medium, and long (long) term”. Journal of Health Care Financing 2000:26 (3): 56-72. Getzen argues that over one year, the prior year growth in healthcare expenditure is the best predictor of the next year figure. Over 5 years, he argues for real per capita income as the major predictor of real per capita healthcare expenditures, and over the long term (50 years), it is appropriate to forecast the healthcare expenditure share of GDP using estimates of national income, assessment of the public’s willingness to pay, and speculation about the future shape and organizational structure of health care. He does not seem to view “technological change” as a significant predictor in the last two time frames. For other views on the virtues of the probabilistic forecasting model see Lee and Miller, op cit 57 Some of them are already used in clinical practice, others have been approved by regulatory authorities in the United States or Europe, and others are being evaluated in ongoing clinical trials.

29
3.3.1 Emerging medical devices and diagnostics that seem likely to influence health expenditures and health outcomes
In the research laboratories of the companies represented by MIAA, the next generation of in vitro diagnostics and medical devices is emerging.
• Heart failure is a condition that is inadequately treated in Australia. Around 40,000 patients are admitted to Australian hospitals every year. The total costs of today’s care has been estimated to be 5% of total healthcare expenditures in the United States and UK. Under-diagnosis in all clinical settings is a major problem. The clinical utility of new in vitro diagnostic tests as a prognostic marker of heart failure has been recognized in Europe,58 and such tests have been shown to be cost-effective because they reduce the cost per detected case in screening for heart failure.59 When used in the Emergency Dept they reduce serious adverse events, the number of echocardiograms, initial hospitalizations and length of stay. 60
• We are about to see the convergence of nanotechnology, 61 information systems and biotechnology which will repair damaged heart muscles and produce cells to cure Type 1 diabetes, 62 a disorder that affects more than 100,000 Australians and whose incidence is increasing.63
• Developments in biventricular pacing are likely to produce sustained benefits in patients with atrial fibrillation treated with catheter ablation therapy
58 The clinical utility of the B-type natriuretic peptides has been recognized by the European Society of Cardiology (Remme WJ et al. European Heart Journal 2001;22:1527-1560. A recent trial in 2,230 inpatients in one hospital in Denmark found that these tests can differentiate between normal and impaired left ventricular ejection fraction, and a second study suggests that the test might also have clinical utility in primary care (Nielson LS et al. Journal of Internal Medicine 2001;250: 422-428). 59 See for example: Neilsen OW, McDonagh TA, Robb SD, Dargie HJ.Retrospective analysis of the cost-effectiveness of using plasma brain natriuretic peptide in screening for left ventricular systolic dysfunction in the general population. Journal of the American College of Cardiology 2003; 41: 113-120. 60 See for example: Mueller C,Scholer A, Laule-Kilian K et al. Use of B-type natriuretic peptide in the evaluation and management of acute dyspnea. New England Journal of Medicine 2004; 350: 647-654; and U Siebert. Cost-effectiveness of NT-proBNP in the diagnostic assessment and management of patients with dyspnea in the emergency department (PRIDE Study). Hamburg, International Society for Pharmacoeconomics & Outcomes Research (ISPOR) Conference, 22-26 October 2004. 61 Nanotechnology involves the convergence of therapeutics diagnostics, imaging, biosensors, artificial organs and other fields of research. It involves products that are measured in billionths of a meter, about the same size of a living cell that can sustain or kill them (viruses range in size from 30 to 200 nanometers)-see: BJ Feder.” Doctors use nanotechnology to improve health care”. New York Times 1 November 2004 (downloaded 3 November 2004 from: http://www.nytimes.com/2004/11/01/technology/01nano.html ), and Panel Session. “Integration of nanotechnology and medicine”. California, Medical Device R&D and Manufacturing Summit, 4-5 November, 2004. 62 See: W. van Antwerp.” The convergence of nanotechnology, advanced information systems and biotechnology in medical device research and product development”. California, Medical Device R&D and Manufacturing Summit, 4-5 November, 2004. 63 Research Australia. Beyond discovery: exploring the research origins and commercial experiences of 100 health biotech companies in Australia. Sydney, Research Australia Ltd 8th November 2004 (downloaded 3 December 2004 from: http://www.researchaustralia.org/aboutResearch.asp?id=204&parent_id=93)

30
(recently validated in its own right64), compared with single-chamber right ventricular pacing.65
• Pacemakers are being developed that will be less susceptible to microbial adhesion and biofilm formation that reduce their efficacy. Non-invasive, real-time monitoring of biofilms is now being trialled in animals.66
• Beyond the drug-eluting stent lies the plastic absorbable stent,67 the metal nanofilm-coated drug-eluting stent and the next generation of combination drug-devices for site-specific drug delivery, including alternative treatments for Hepatitis C using implantable devices68 and non-viral gene therapy.69 Also emerging are new devices that close up arterial access after revascularization procedures, leading to the rapid ambulation of and lower pain levels in patients.70
• Nanoparticles may also be used in the future to deliver heat to cancer cells and kill them.71
With these developments in mind, we summarise below nine areas of healthcare where new devices seem likely to change the patterns, costs and outcomes of care, and where it is reasonable to assume that gross expenditures on such devices will grow in the next 5-10 years, offset in part by savings elsewhere in the healthcare system.
3.3.1.1 Molecular imaging and earlier treatment of serious diseases It is now possible to design molecules that can find and attach to cells that indicate the presence of heart disease, cancer and Alzheimer’s disease. These molecules (called probes) light up when scanned by an imaging device (such as a PET scanner) and the resultant digital picture can be read. These devices, now being tested on animals, will enable earlier diagnosis conditions such as Alzheimer’s, whereas today’s treatments begin only when symptoms of the disease appear.72 On 15 June 2004, the US government agency responsible for the Medicare program announced that it will pay for PET scanning for patients suspected of having Alzheimer’s disease. Those diagnosed with dementia and those who have
64 LF Hsu, B Jais, P Sanders et al. Catheter ablation for atrial fibrillation in congestive heart failure. New England Journal of Medicine 2004 ; 351 (23): 2373-2383. 65 Rahul N. Doshi. Presented at the Late Breaking Clinical Trials, American College of Cardiology Annual Scientific Sessions, New Orleans, 2004. 66 J. Kadurugamuwa. “Biophotonic monitoring of infections associated with medical implants and treatment in experimental animal models”. California, Medical Device R&D and Manufacturing Summit, 4-5 November, 2004. 67 BJ Feder.”Boston Scientific will invest in developer of a plastic stent”. New York Times 17 November 2004 (downloaded 24 November 2004 from: http://www.nytimes.com/2004/11/17/technology/17stent.html ) 68 P Gardner. “ Microfabricated nanochannels creat e novel delivery mechanism for an implantable drug delivery device”. California, Medical Device R&D and Manufacturing Summit, 4-5 November, 2004. 69 R Bawa. “ Nanotechnology in drug delivery and drug devices”. California, Medical Device R&D and Manufacturing Summit, 4-5 November, 2004. 70 CP Juergens et al.,” Patient tolerance and resource utilization associated with an arterial closure versus an external compression device after percutaneous coronary intervention”. Catheterisation and Cardiovascular Interventions 2004; 63: 166-170. 71 Feder, ibid
72 P. Patsuris.” Catching disease before it catches us”. Forbes.com 3 May 2004.

31
experienced a six-month decline in cognitive function will be eligible for coverage. There are 4 million Americans with Alzheimer’s and a PET test costs US$ 1,500. The cost implications of this initiative are significant,73 but so are the potential savings from improved targeting of treatment. The market for PET scanners, already growing at about 14% per year, will grow rapidly if such molecular imaging enables treatment to commence 10 years earlier for a range of diseases that are debilitating when diagnosed late. ANNEX 3 summarises new developments in testing for pneumonia, a disease that causes premature deaths across all age groups. Such tests allow earlier treatment before the disease progresses.
3.3.1.2 New medical devices for heart disease and stroke Cardiovascular disease (including ischaemic heart disease, stroke, and other conditions) is Australia’s most expensive disorder, with treatment costs in 2000/01 being 11% of national healthcare expenditures.74 ANNEX 4 summarises data on heart disease in Australia. The next 5-10 years are likely to see the expansion of use of a wide range of medical devices that are now in the early stages of diffusion in Australia or are being tested in clinical trials around the world. The table below lists some of the innovative devices in this area. MIAA believes that any estimates of their indicative unit costs in 2004 (which are influenced by higher volume use, rising labour costs, the hidden costs of the value-adding services of the supplier and competitive market forces) should be assessed against some of the benefits already evident in early clinical testing. In the absence of appropriate trial data, nobody can yet say that all the listed devices will diffuse rapidly or at all into clinical practice, but their potential impacts on healthcare should be noted.
73 “ Medicare to cover diagnostic tool for Alzheimer’s”. Wall Street Journal 16 June 2004, page D9. PET scans have a 90% accuracy in diagnosis of Alzheimer’s. 74 AIHW. Health system expenditure on disease and injury in Australia 2000-01. Canberra, AIHW Cat No HWE 26, May 2004, 10
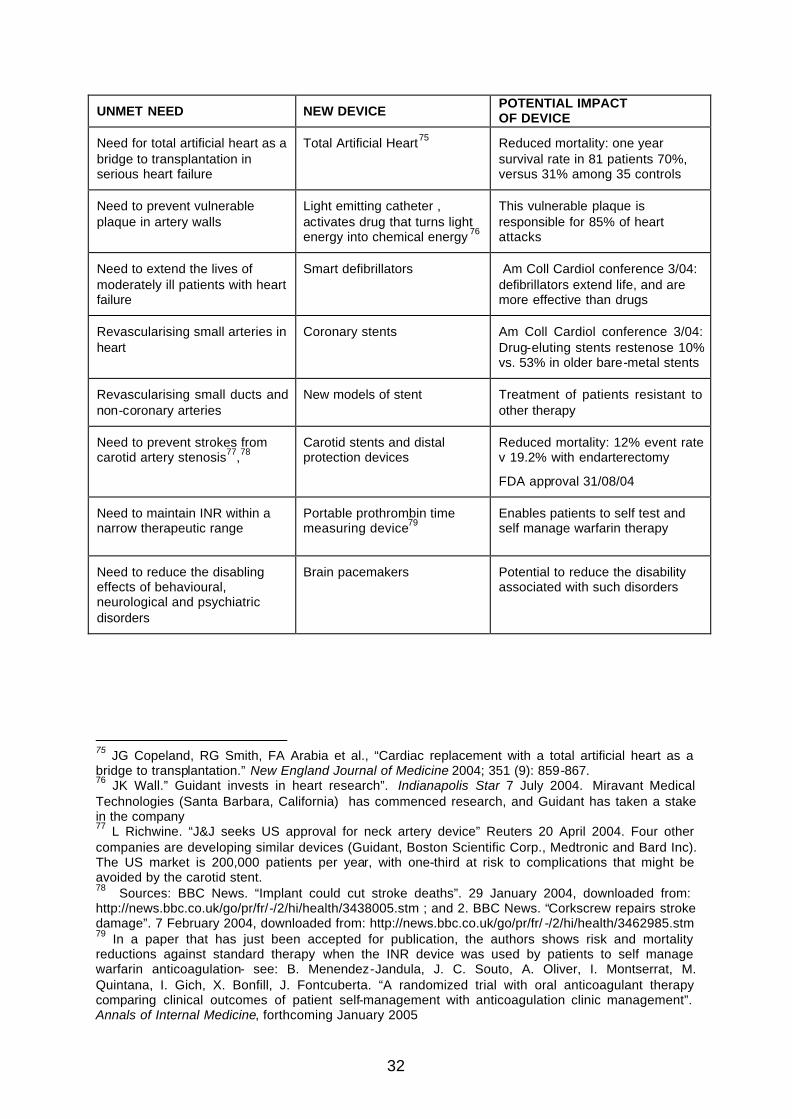
32
UNMET NEED NEW DEVICE POTENTIAL IMPACT OF DEVICE
Need for total artificial heart as a bridge to transplantation in serious heart failure
Total Artificial Heart75 Reduced mortality: one year survival rate in 81 patients 70%, versus 31% among 35 controls
Need to prevent vulnerable plaque in artery walls
Light emitting catheter , activates drug that turns light energy into chemical energy 76
This vulnerable plaque is responsible for 85% of heart attacks
Need to extend the lives of moderately ill patients with heart failure
Smart defibrillators Am Coll Cardiol conference 3/04: defibrillators extend life, and are more effective than drugs
Revascularising small arteries in heart
Coronary stents Am Coll Cardiol conference 3/04: Drug-eluting stents restenose 10% vs. 53% in older bare-metal stents
Revascularising small ducts and non-coronary arteries
New models of stent Treatment of patients resistant to other therapy
Need to prevent strokes from carotid artery stenosis77,78
Carotid stents and distal protection devices
Reduced mortality: 12% event rate v 19.2% with endarterectomy
FDA approval 31/08/04
Need to maintain INR within a narrow therapeutic range
Portable prothrombin time measuring device79
Enables patients to self test and self manage warfarin therapy
Need to reduce the disabling effects of behavioural, neurological and psychiatric disorders
Brain pacemakers Potential to reduce the disability associated with such disorders
75 JG Copeland, RG Smith, FA Arabia et al., “Cardiac replacement with a total artificial heart as a bridge to transplantation.” New England Journal of Medicine 2004; 351 (9): 859-867. 76 JK Wall.” Guidant invests in heart research”. Indianapolis Star 7 July 2004. Miravant Medical Technologies (Santa Barbara, California) has commenced research, and Guidant has taken a stake in the company 77 L Richwine. “J&J seeks US approval for neck artery device” Reuters 20 April 2004. Four other companies are developing similar devices (Guidant, Boston Scientific Corp., Medtronic and Bard Inc). The US market is 200,000 patients per year, with one-third at risk to complications that might be avoided by the carotid stent. 78 Sources: BBC News. “Implant could cut stroke deaths”. 29 January 2004, downloaded from: http://news.bbc.co.uk/go/pr/fr/-/2/hi/health/3438005.stm ; and 2. BBC News. “Corkscrew repairs stroke damage”. 7 February 2004, downloaded from: http://news.bbc.co.uk/go/pr/fr/ -/2/hi/health/3462985.stm 79 In a paper that has just been accepted for publication, the authors shows risk and mortality reductions against standard therapy when the INR device was used by patients to self manage warfarin anticoagulation- see: B. Menendez-Jandula, J. C. Souto, A. Oliver, I. Montserrat, M. Quintana, I. Gich, X. Bonfill, J. Fontcuberta. “A randomized trial with oral anticoagulant therapy comparing clinical outcomes of patient self-management with anticoagulation clinic management”. Annals of Internal Medicine, forthcoming January 2005
33
3.3.1.3 New devices for diagnosis and control of insulin-dependent diabetes mellitus (IDDM)
With 70,000 sufferers reported in 2003, IDDM accounts for 10% of known diabetes cases in Australia. While diabetes generated about $900 million or 2% of national healthcare expenditures in 2000/01,80 the total economic burden of diabetes in Australia is estimated to be as high as $1.4 billion because of its hidden indirect costs of lost productivity and premature mortality. IDDM, also known as Type 1 diabetes or juvenile diabetes, is a disease that results from the body's failure to produce insulin - the hormone that "unlocks" the cells of the body, allowing glucose to enter and fuel them. Since glucose cannot enter the cells, it builds up in the blood and the body's cells literally starve to death. This is most often the result of an autoimmune process in which the body's immune system attacks and destroys the insulin-producing islet cells of the pancreas. Unfortunately, diabetic symptoms do not appear until 80 to 90% of the pancreatic islet cells have been destroyed. The onset therefore cannot be prevented and there is no cure. Insulin therapy must be used to replace or supplement the patient's diminished or absent capacity to generate insulin. Frequent blood glucose monitoring (at least 4 times per day) is necessary. Insulin pump therapy (CSII) can improve glycaemic control in individuals with Type 1 diabetes who are unable to achieve acceptable control on multiple daily injection (MDI) regimens. These people have often been given the labels of "hard to control", "labile" or "brittle". Every endocrinologist has patients of this type, and so there are many studies that have shown the efficacy of CSII when compared with the usual MDI regimens in treating this group of patients. These studies have shown a reduction in HbA1C of 0.5 to 2.0% (indicating improved glycaemic control) is maintained for up to 5 years post CSII initiation. In Australia as CSII is still in its infancy (being reintroduced in 1997 and its widespread usage adopted again in 1999), Australian studies on its efficacy are limited. Currently there are 1,500 patients on insulin pumps in Australia, and their use will probably increase given the developments listed in ANNEX 5.
3.3.1.4 New diagnostic tools for cancer Generating 5.6% of national healthcare expenditures in 2000/01 and the second largest cause of death after cardiovascular disease,81 cancer is another highly visible high expenditure area in health care. To illustrate the potential impact of new diagnostic devices, we summarise three new diagnostic tools for colon cancer and one new diagnostic device for lung cancer.
80 AIHW. Health system expenditure on disease and injury in Australia 2000-01. Canberra, AIHW Cat No HWE 26, May 2004, 12 81 AIHW. Health system expenditure on disease and injury in Australia 2000-01. Canberra, AIHW Cat No HWE 26, May 2004, 14

34
TECHNOLOGY MEDICAL NEED
Immunodiagnostic assays for tumour markers
Early identification of patients with developing cancer, monitoring of therapy and relapse
Capsule Endoscopy 82 More accurate diagnosis of Crohn’s disease, coeliac disease and intestinal tumours
3-D Virtual Colonoscopy 83 Less intrusive diagnosis than regular colonoscopy84
Evaluations of wireless capsule technology in patients with suspected small-intestinal disease have indicated its effectiveness in particular patients. 85 On 12 July 2004, the US FDA approved a new diagnostic device for lung cancer.86 It uses computer-aided tomography that picks up very small nodules in the lung as they become cancerous. The potential health benefits from earlier diagnosis are evident: the US 5-year survival rate for lung cancer is 14% using today’s diagnostic tools but this figure jumps to 42% when cancer is found at its earliest stage.
3.3.1.5 New medical devices for pain management Chronic pain is caused by many disorders and is often associated with ageing. In 1990, the total cost of chronic pain in Australia (i.e., direct plus indirect costs) was estimated at about $1 billion. We focus here on new devices affecting just two common sites of pain. Back pain: New developments in the surgical management of low back pain87 include artificial spinal discs that seem likely to replace spinal fusions. The first artificial lumbar disc, already used in Europe and in Australia, will be available in the USA in 2005,88 followed in 2007 by another device. The artificial disc is designed to
82 P Condon. “Pill helps doctors see digestive tract”. Yahoo News 2 December 2003. The evaluation of this device by the BCBS Technology Evaluation Center in December 2003,concluded that “…the use of wireless capsule endoscopy meets the TEC criteria for evaluation of obscure gastrointestinal bleeding” –see: TEC. Wireless capsule endoscopy for small-bowel diseases other than obscure GI bleeding. Assessment Program Volume 18 number 18, December 2003, 5 pages. 83 G Kolata.” A gentler type of colonoscopy proves effective”. New York Times 2 December 2003, reporting on study reported in NEJM on 4 December 2003. 84 This device has a higher detection rate for polyps 8-10 mm in size, and higher screening rates seem likely in the future. One clinical issue is when to refer patients for regular colonoscopy, since if a polyp is less than 10 mm, treatment costs will increase if every polyp is excised. 85 See for example the Blue Cross Blue Shield review of all available evidence in December 2003 in:TEC. Wireless capsule endoscopy for small bowel diseases other than obscure GI bleeding. TEC Assessment Program Volume 18, No. 18, December 2003. 86 “FDA allows new computer detection of lung cancer”. Yahoo! News 12 July 2004. The device, manufactured by R2 Technology Inc, has been available in the EU for 2 years. There are about 1.2 million cases of lung cancer worldwide. 87 In five years these may include nucleoplasty, where, in an outpatient setting, a catheter is injected into the disc where it emits radio waves to break up tissue. 88 On 26 October 2004, the device received FDA approval for use in the lower spine- see: BJ Feder.” Artificial spinal disk gains approval from FDA”. New York Times 27 October 2004 (downloaded 28 October 2004 from: http://www.nytimes.com/2004/10/27/business/27disc.html ). It has already been implanted on thousands of European patients since the mid -1980’s. Similar devices will emerge from Medtronic and Synthes-Stratec.

35
last 40 years, it is likely to cost US$11,000 per unit (slightly above fusion), and seems likely to be accepted in back surgery.89 It reduces the time of disability while recovering from surgery. Spinal fusion requires three months in brace and uses a bone graft that is painful. The new disc is inserted through the abdomen, which will mean that surgeons trained in fusion through the back will need retraining. A Phase III clinical trial comparing the new device against a spinal cage fusion device found that two years beyond surgery there was a 25% improvement in pain with no device failure or complications. Patients also felt better sooner- which is likely to mean a more rapid return to normal functioning and work. Osteoarthritis: Osteoarthritis exacts a large toll through pain and disability. In 2002/03, there were about 28,000 knee replacements, of which nearly 10% were revisions to existing surgery. As summarized in ANNEX 6, knee replacements outnumbered hip transplants for the first time in 2003, growing at 7.3% over the number in 2002.90 The world market for knee replacement is predicted to grow at an annual rate of 5.2% to 2009.91 As summarized in ANNEX 7, advances in computer-assisted knee replacement may overcome the current problems that surgeons face with poor alignment of implants; instability, loosening, dislocation, infections and fracture, and blood loss, while reducing the number of pre- and post-operative CT scans and X-rays, and length of hospital stay. 92
3.3.1.6 New medical devices for hearing deficiencies In Australia, a permanent bilateral hearing loss is estimated to occur in 0.12% to 0.57% of live births, with a much higher rate (2-4%) noted in infants in US intensive care units. There are more than 1.8 million Australians with impaired hearing. Hearing loss causes large societal costs through direct medical costs of treatment and the indirect costs of reduced work productivity, premature mortality and disability. One US study estimated that profound hearing loss cost US society $US$ 297,000 over the lifetime of the affected individual.93 We focus on one device that is an Australian creation, and whose use is likely to increase worldwide. ANNEX 8 summarises the impact of the cochlear implant on hearing deficiencies that are the most prevalent disability in developed nations The economic impact of the cochlear implant has been measured in Australia and in the United States. First, in Australia the cost-utility of the cochlear implant has been
89 D Rosenberg.” Artificial spinal disc offers cure touted as improvement over fusion.” Wall Street Journal 12 May 2004 (downloaded 13 May 2004 from: http://online.wsj.com/article_print,,SB108430942478908430,,00.html ) 90 Australian Orthopaedic Association National Joint Replacement Registry Annual Report 2004. 91 Frost and Sullivan, 2003. 92 DePuy Australia. “Computer Assisted Knee Replacement”. Submission to the Productivity Commission Study into the Impact of Advances in Medical Technology on Healthcare Expenditure in Australia. 2 November 2004,19 pages. 93 PE Mohr, JJ Feldman, JL Dunbar et al.” The social costs of severe to profound hearing loss in the United States”. International Journal of Technology Assessment in Health Care 2000; 16 (4): 1120-1135.

36
evaluated in three target groups.94 The ranges of cost per quality-adjusted life-year gained were $5-11,000 for children, for profoundly deaf adults it was $12-38,000, and for partially deaf adults it was $14-41,000, all suggesting that investment in the implant is a defensible use of society’s resources. A second study by Johns Hopkins University specialists of its use in 10 school-age children showed cost savings of US$30,000 to $200,000 from the subsequent decrease in special education support services.95 A third cost-utility study by the same specialist unit96 of 78 profoundly deaf children given the cochlear implant (average age 7.5 years) found that using three different measures for valuing the utility of the device, the cost per quality-adjusted life-year gained was US$ 5,200- 9000, close to the results observed in the Australian study. Finally, a fourth study by the same unit97 of its use in adults found that the cost per quality-adjusted life -year gained was about US$ 13,000. Forward estimates of the future demand for cochlear implants are rendered difficult by uncertainties in the government budgets available for such devices.
3.3.1.7 New medical devices for eye diseases Over 480,000 Australians are visually impaired in both eyes (50,000 of them are blind), and over 300,000 Australians have visual impairment due to refractive error, while a further 180,000 have impairments that cannot be corrected by spectacles. There are predictions that with increasing age, the percentage of the population aged over 40 with visual impairment will increase from 5.4% today to 6.5% by 2024.98 The total direct costs of treatment today are $1.8 billion, exceeding the costs of heart disease, stroke, arthritis or depression, and it is estimated that this cost will double by 2020 due to ageing.99 The indirect costs of visual impairment are nearly double the direct costs. The major causes of visual impairment and blindness are summarized below: DISORDER Causes of visual impairment-% Causes of blindness-% Cataracts 14 12 Macular degeneration 10 48 Glaucoma 3 14 Diabetic eye disease 2 11 (incl. renal disease) Refractive error 62 4
94 R Carter and D Hailey.” Economic evaluation of the Cochlear Im plant”. International Journal Of Technology Assessment in Health Care 1999;15 (3): 520-530. 95 HW Francis, MA Koch JR Wyatt and JK Niparko.” Trends in educational placement and cost-benefit considerations in children with Cochlear Implants”. Arch Otolaryngol Head Neck Surg 1999; 125: 499-505. 96 AK Cheng, HR Rubin, NR Powe et al.” Cost-utility analysis of the Cochlear Implant in children”. Journal of the American Medical Association 2000; 284: 850-856. 97 AK Cheng and JK Niparko.”Cost-utility of the Cochlear Implant in adults”. Arch Otolaryngol Head Neck Surg 1999; 125: 1214-1218. 98 Access Economics. The economic impact and cost of vision loss in Australia. Canberra, Access Economics for Eye Research Australia and Clear Insight, August 2004. 99 ibid.,6.

37
About 70% of visual impairment and 50% of blindness is caused by conditions that are preventable or treatable.100 The prevalences in Australia and current treatments for these five conditions are summarised below101: DISEASE
ESTIMATED PATIENTS
(2004)
ESTIMATED PATIENTS
(2024)
NUMBER VISUALLY IMPAIRED
(2004)
NUMBER BLIND (2004)
CURRENT TREATMENTS
Cataracts 160,000 280,000 69,000 6,200 Surgery
Macular degeneration
130,000 208,000 50,000 30,000 Lasers, laser-activated drugs High-dose antioxidant vitamins
Glaucoma 210,000 (50%
undiagnosed)
357,000 14,000 9,000 Eye drops, drugs, laser surgery and surgical techniques listed below
Diabetic retinopathy
60-75,000 over 40 years
700,000 8,000 NA Laser therapy, surgery Better control of diabetes
Refractive error1
1,800,000 2,500,000 297,000 1,900 Prescription glasses, contact lenses
1: Totals include those with hyperopia > 3 diopters, and myopia > 1 diopter
Coming fast behind these existing treatments are new medical technologies to reduce the burden of impaired vision. Two of these four technologies102 have a high capital cost, most of them seem likely to enable the patient to avoid cataract surgery, and their gross cost will be offset by any such savings.
TECHNOLOGY MEDICAL NEED IMPLICATIONS
Conductive keratoplasty Approved for hyperopia in 2002 Approved for common near-vision problems in March 2004
Cost :US$ 58,000 per device
Corrective effects may weaken after 5 years
Lasik surgery As above Cost: US$ 325,000 per device
Intraocular multifocal lens implant for cataract patients
Reduce problems with close-up and long distance viewing, likely approval 2005
Cost: US$ 600 per lens but are likely to avoid cataract surgery later
Implant to continuously deliver drug to back of eye
Prevent or stop macular degeneration
In early stage research in 2004
100 Taylor, 2003, quoted in ibid. Cataracts are the leading cause of blindness, and estimated to be growing at 3% per year to 2024, about the same rate are the numbers of persons with macular degeneration, diabetic retinopathy and glaucoma. While these are US estimates, we should note that Australia’s age profile is not very different. 101 Associated Press.” Funds are sought for aging eyes”. Wall Street Journal 13 April 2004 (downloaded 17 April 2004 from: http://online.wsj.com/article_print,,SB108180670857880667,00.html ) 102 M Freudenheim. “To read the menu, baby boomers turn to eye treatments”. New York Times 11 April 2004 (downloaded on 17 April 2004 from nytimes.com )

38
The direct and indirect costs of eye diseases are large. The benefits of new interventions are sufficiently documented that we believe that there will a major campaign in the next 10 years to reduce such costs the associated disability and the numbers of premature deaths due to accidents and falls brought about by vision problems.103 Any forecast of future healthcare expenditure on eye disease should recognise that the diffusion of new drugs and devices over the past two decades has changed the site and costs of care, and the outcomes of treatment. Glaucoma drugs have increased in number and use rates, refractive surgery did not exist in 1981 and most ocular surgery now involves same-day procedures.104 The level of innovation and speed of change are not likely to diminish in the next 5 -10 years.
3.3.1.8 Minimally invasive surgery We summarise here some developments in total knee replacement where one technology is a refinement on its predecessor, illustrating the speed of innovation that distinguishes a device from a drug, and the likely demand for the technology in the next 5-10 years. Total knee replacement: ANNEXES 6 and 7 summarise developments in total knee replacement (TKR) and refinements that are now occurring with computer-assisted knee replacement (CAKR). First, the demand in Australia for TKR has increased rapidly in the last ten years. In 2003, there were 28,003 knee replacements (or 140.8 procedures per 100,000 population), of which 9.3% were revisions necessary because of complications of the earlier surgery. The demand grew 7.3% between 2002 and 2003. US growth rates are forecast to grow at 5.2% per year to 2009 and are unlikely to be lower in Australia. Second, the new technique CAKR stands on the shoulders of many predecessor types of TKR still used in Australia, where the skill levels of the surgeon, coupled with surgical preplanning using diagnostic scans and the knee replacement materials, are critical to patient outcomes. There is now a shortage of orthopaedic surgeons in Australia, and any new surgical procedure must minimise the demands on both the clinician and health system by reducing the need for revision surgery. Third, randomised trials have compared the impact of CAKR against conventional TKR techniques on a wide range of outcomes (improved alignment and accuracy; ease of surgical planning; blood loss in total knee surgery; post-operative pulmonary
103 See for example: G McGwin, C Owsley and S Gauthreaux.” The association between cataract and mortality among older adults”. Ophthalmic Epidemiology 2003; 10 (2): 107-119; and C Owsley et al.,” Impact of cataract surgery on motor vehicle crash involvement by older adults’. Journal of the American Medical Association, 2002; 288: 841-849. The last study showed that cataract surgery had half the crash involvement during the follow-up period of 4-6 years compared with cataract patients who did not undergo surgery. 104 National Eye Institute.” Updating the Hu 1981 estimates of the economic costs of visual disorders and disabilities. Statistics and Data, June 2004.
39
embolism rate; use of analgesics in the short and long term; elimination of pre- and post-op scans; surgical vision; theatre and anaesthesia time). These outcomes are expected to lead to reductions in average length of stay, physiotherapy visits, increased life spans of the implants and fewer surgical revisions.
3.3.1.9 Wound care technologies Advances in wound care technology have been significant over the last 10-20 years and generally there has been greater adoption of these advancements in the acute hospital setting than in the community or non-hospital settings. Significant opportunities for advanced wound care technologies exist within community settings, focusing on patients who are treated by GPs, seen by visiting / district nurses, and patients in aged care institutions. In the main, these patients have very limited access to advanced wound care products because of cost. Unlike pharmaceuticals, which are heavily subsidised via the PBS, no such scheme exists for wound care requirements (the exception being Dept of Veterans’ Affairs patients).Accordingly, patients requiring advanced products for optimal care often revert to traditional gauze or similar low-tech wound products, simply because they cannot afford technologically advanced products. Product access is usually via the community pharmacy. The examples below indicate some of the reasons why wound care products should be viewed as a technology that helps shift the site, quality and costs of healthcare. Venous leg ulcer (VLU) management: Approx 30,000 VLUs are present in the community at any time105. Four-layer bandage treatments are available that are clinically proven to heal 75-80% of VLUs within 12 weeks (based on a once per week application) 106. However, as this type of product costs over $50 at the pharmacy, patients tend to revert to lower cost options, e.g. gauze. Because GP visits are subsidized through Medicare, VLU patients can visit their GP regularly at little personal cost. However they often do not resolve their wound problem because they confront non-subsidised treatment options that they cannot afford. Accordingly, the community faces greater cost to support GP visits; the patient possibly faces hospital admittance if their condition worsens; and quality of life is compromised - yet a highly cost-effective, technologically advanced solution is available. Potentially the solution is simple; government could subsidise the cost of advanced wound care in the same manner they subsidise medicines. Such schemes exist in other OECD countries, e.g., UK, France and Germany.
105 Callam MJ, Ruckley CV, Harper DR, Dale JJ. Chronic ulceration of the leg: extent of the problem and provision of care.British Medical Journal (Clin Res Ed). 1985 Jun 22;290 (6485):1855-6; and Carr L, Phillips Z, Posnett J. Comparative cost effectiveness of four-layer bandaging in the treatment of venous leg ulceration. Journal of Wound Care 1999; 8 (5) 106 Moffatt CJ, Simon DA, Franks PJ, Connolly M, Fielden S, Groake L, McCollum, CN. Randomised trial comparing two four layer bandage systems in the management of chronic leg ulceration. Phlebology .1999; 14:139-142.

40
In Australia, the treatment of leg ulcers is a key contributor to the estimated $500 million per annum spent on chronic wounds107 . Treating venous leg ulcers with compression has increased healing rates compared with no compression108. In a recent study, the use of a four-layer compression bandaging system for the treatment of venous leg ulceration was shown to be a source of potential cost savings compared to the ad hoc combination of treatments by ‘usual care’109. This study concluded that a treatment regimen using four-layer compression bandaging could save an average UK health authority serving a population of 500,000 people between £350,000 and £1.08 million annually. The key to achieving these savings was to co-ordinate treatment policies to make use of the most cost-effective treatments, in this case four-layer bandaging. Advanced wound care intervention in residential aged care settings: Currently, wound care treatment standards vary dramatically in aged care residential settings. Often, the available budget for patients with wounds ends up reverting to traditional, and superficially cheaper, options such as gauze. Accordingly, patients who have common complications such as pressure ulcers suffer far longer than they need to considering the availability of advanced wound care solutions. A recent report commissioned by Department of Health & Aging 110 found that an intervention program in nursing homes, using trained staff with technologically advanced wound care products, greatly reduced the time to heal and the cost of overall treatment. The benefits were clear: enhancing quality of life while freeing up nursing time to focus on other duties. One option may be for Government to subsidise wound care products for this group of patients. The irony is that the Australian government is willing to subsidise advanced drug therapy via the PBS for internal ulcers, but provides no subsidy for advanced wound care treatment products to treat external ulcers (venous leg or pressure) suffered by patients in the community. Surgical gowns, theatre hygiene and hospital infections: The developments in minimally invasive surgery and steady reductions in average length of hospital stay noted above have reduced the wound infection rates usually associated with open surgery. However, surgical site infections still occur in 2-13% of hospital patients, depending on the type of surgery.111 Health Insurance Commission data suggest that about 6 million procedures were performed in Australia in 2003/04, and about 4 million of these would have been
107 Sussman G. Wound Healing and cost impacts of interventions by pharmacists in community settings. Report to the Department of Health and Ageing through the Pharmacy Guild of Australia, 2003. 108 Cullum N, Nelson EA, Fletcher AW, Sheldon TA. Compression for venous leg ulcers (Cochrane Review) In: The Cochrane Library, Issue 3, 2004. Chichester, UK: John Wiley & Sons Ltd. 109 Carr L, Phillips Z, Posnett J. Comparative cost effectiveness of four-layer bandaging in the treatment of venous leg ulceration. Journal of Wound Care May, Vol 8, No5, 1999. 110 Sussman G. Wound Healing and cost impacts of interventions by pharmacists in community settings. Report to the Department of Health and Ageing through the Pharmacy Guild of Australia,2003 111 Kimberly-Clark, November 2004
41
surgical interventions, where sterile environments and hygiene were paramount. A study in 2001 estimated that surgical site infections cost an extra $268 million per year112, and the estimate would be higher in 2005. A major cause of wound infections is the use of reusable surgical drapes and gowns that retain microparticles.113 New developments in wound care will reduce hospital infection rates. These developments include the application of infection control guidelines,114 and the use of non-woven surgical barrier products. MIAA cannot provide any estimates of potential savings at this stage, but the Commission may be in a position to assess the impact of some of these outcomes, particularly if an ageing society is likely to experience higher wound infection rates in hospitals and aged care facilities. 3.3.2 Four recent studies estimating potential economic savings that are
possible in the diagnosis and treatment of major disorders We now summarise the findings of four recent studies that might provide guidance to the Commission as it formulates its views about an appropriate method for evaluating the likely impact of medical technology in the next 5-10 years. The studies are:
• the Project HOPE study of nine non-drug technologies in US health care; • the RAND Corporation study of technological developments in four clinical
areas affecting future care of the aged and future expenditures of the US Medicare program;
• the Medical Technology Group summary of the impact of medical devices in UK health care; and
• the TECH Global Research Network cross-national study of treatments for acute myocardial infarction in 21 nations.
Project HOPE study of nine emerging non-drug technologies, 2001:115 This study is one of many “bottom-up” studies of the impact of new technologies in US health care. 116 112 “National surveillance of healthcare associated infection in Australia”. Draft report, April 2001. 113 Truscott W. The impact of microscopic foreign debris on post surgical complications”. Surgical Technology International 2004; 12: 114 See for example: DOHA. Infection control guidelines for the prevention of transmission of infectious diseases in the healthcare setting. Canberra, Department of Health and Aging, 2004 115 PE Mohr et al., The impact of medical technology on future health care costs: final report . Bethesda (Md), Project HOPE for HIAA and Blue Cross and Blue Shield Association, 28 February 2001, 52 pages plus appendices. 116 See for example: AA Scitovsky.”Changes in the costs of treatment of selected illnesses, 1951-1965”. American Economic Review 1967; 57: 1182-1195; AA Scitovsky.”Changes in the costs of treatment of selected illnesses, 1971-1981” . Medical Care 1985; 23: 1345-1357; C Mueller et al., ”Estimating changes in Medicare inpatient operating costs from scientific technological advances in FY 1994: final report to the Prospective Payment Assessment Commission”. Project HOPE Center for Health Affairs, 1993; L Baker and J Spetz. Managed care and medical technology growth. New York, National Bureau of Economic Research Working Paper Series No. 6894, 1999; and D Cutler and S Kadiyala. summarised in “Exceptional returns: the economic value of America’s investment in medical research”. Chicago, Lasker Trust, May 2000. Original paper accessible at http:// www.fundingfirst.org/
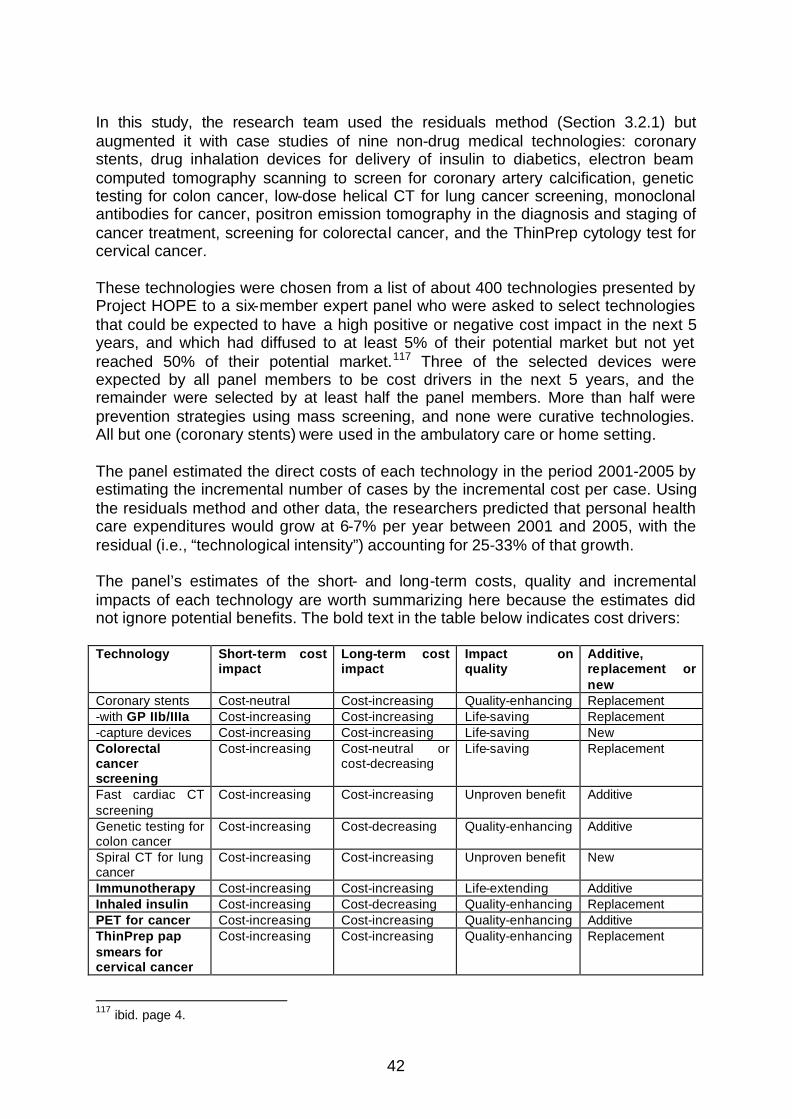
42
In this study, the research team used the residuals method (Section 3.2.1) but augmented it with case studies of nine non-drug medical technologies: coronary stents, drug inhalation devices for delivery of insulin to diabetics, electron beam computed tomography scanning to screen for coronary artery calcification, genetic testing for colon cancer, low-dose helical CT for lung cancer screening, monoclonal antibodies for cancer, positron emission tomography in the diagnosis and staging of cancer treatment, screening for colorectal cancer, and the ThinPrep cytology test for cervical cancer. These technologies were chosen from a list of about 400 technologies presented by Project HOPE to a six-member expert panel who were asked to select technologies that could be expected to have a high positive or negative cost impact in the next 5 years, and which had diffused to at least 5% of their potential market but not yet reached 50% of their potential market.117 Three of the selected devices were expected by all panel members to be cost drivers in the next 5 years, and the remainder were selected by at least half the panel members. More than half were prevention strategies using mass screening, and none were curative technologies. All but one (coronary stents) were used in the ambulatory care or home setting. The panel estimated the direct costs of each technology in the period 2001-2005 by estimating the incremental number of cases by the incremental cost per case. Using the residuals method and other data, the researchers predicted that personal health care expenditures would grow at 6-7% per year between 2001 and 2005, with the residual (i.e., “technological intensity”) accounting for 25-33% of that growth. The panel’s estimates of the short- and long-term costs, quality and incremental impacts of each technology are worth summarizing here because the estimates did not ignore potential benefits. The bold text in the table below indicates cost drivers: Technology Short-term cost
impact Long-term cost impact
Impact on quality
Additive, replacement or new
Coronary stents Cost-neutral Cost-increasing Quality-enhancing Replacement -with GP IIb/IIIa Cost-increasing Cost-increasing Life-saving Replacement -capture devices Cost-increasing Cost-increasing Life-saving New Colorectal cancer screening
Cost-increasing Cost-neutral or cost-decreasing
Life-saving Replacement
Fast cardiac CT screening
Cost-increasing Cost-increasing Unproven benefit Additive
Genetic testing for colon cancer
Cost-increasing Cost-decreasing Quality-enhancing Additive
Spiral CT for lung cancer
Cost-increasing Cost-increasing Unproven benefit New
Immunotherapy Cost-increasing Cost-increasing Life-extending Additive Inhaled insulin Cost-increasing Cost-decreasing Quality-enhancing Replacement PET for cancer Cost-increasing Cost-increasing Quality-enhancing Additive ThinPrep pap smears for cervical cancer
Cost-increasing Cost-increasing Quality-enhancing Replacement
117 ibid. page 4.
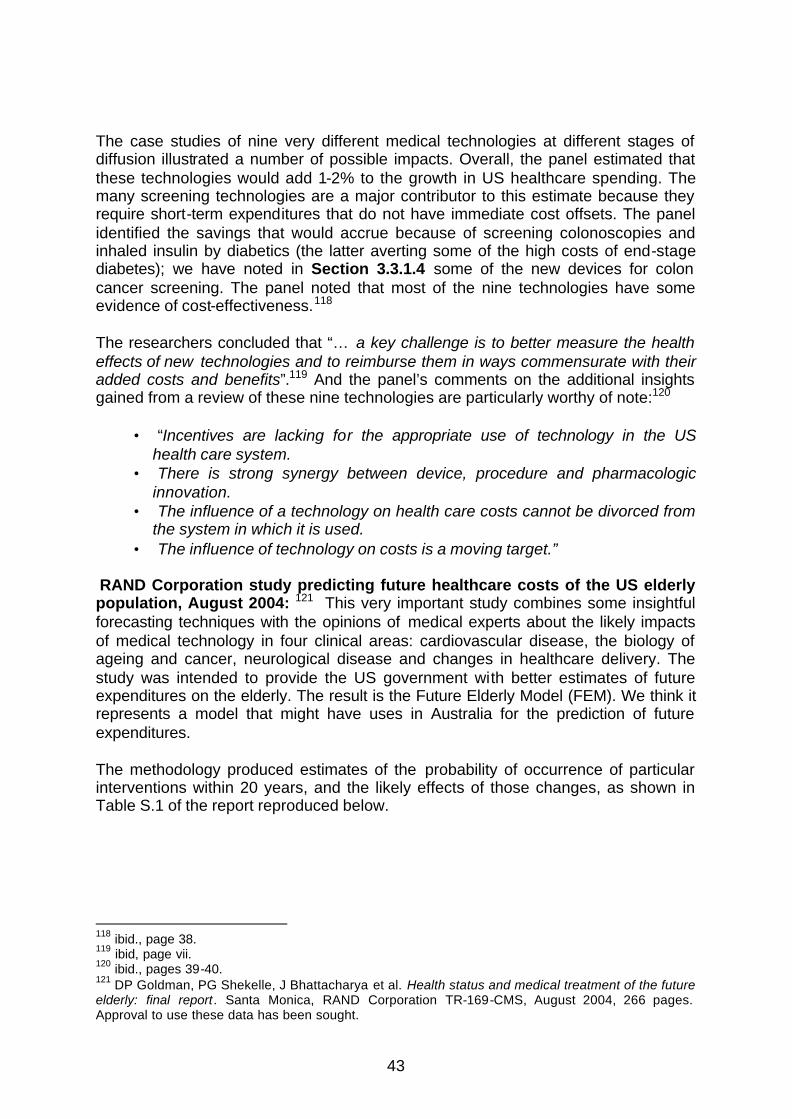
43
The case studies of nine very different medical technologies at different stages of diffusion illustrated a number of possible impacts. Overall, the panel estimated that these technologies would add 1-2% to the growth in US healthcare spending. The many screening technologies are a major contributor to this estimate because they require short-term expenditures that do not have immediate cost offsets. The panel identified the savings that would accrue because of screening colonoscopies and inhaled insulin by diabetics (the latter averting some of the high costs of end-stage diabetes); we have noted in Section 3.3.1.4 some of the new devices for colon cancer screening. The panel noted that most of the nine technologies have some evidence of cost-effectiveness.118 The researchers concluded that “… a key challenge is to better measure the health effects of new technologies and to reimburse them in ways commensurate with their added costs and benefits”.119 And the panel’s comments on the additional insights gained from a review of these nine technologies are particularly worthy of note:120
• “Incentives are lacking for the appropriate use of technology in the US health care system.
• There is strong synergy between device, procedure and pharmacologic innovation.
• The influence of a technology on health care costs cannot be divorced from the system in which it is used.
• The influence of technology on costs is a moving target.” RAND Corporation study predicting future healthcare costs of the US elderly population, August 2004: 121 This very important study combines some insightful forecasting techniques with the opinions of medical experts about the likely impacts of medical technology in four clinical areas: cardiovascular disease, the biology of ageing and cancer, neurological disease and changes in healthcare delivery. The study was intended to provide the US government with better estimates of future expenditures on the elderly. The result is the Future Elderly Model (FEM). We think it represents a model that might have uses in Australia for the prediction of future expenditures. The methodology produced estimates of the probability of occurrence of particular interventions within 20 years, and the likely effects of those changes, as shown in Table S.1 of the report reproduced below.
118 ibid., page 38. 119 ibid, page vii. 120 ibid., pages 39-40. 121 DP Goldman, PG Shekelle, J Bhattacharya et al. Health status and medical treatment of the future elderly: final report. Santa Monica, RAND Corporation TR-169-CMS, August 2004, 266 pages. Approval to use these data has been sought.

44
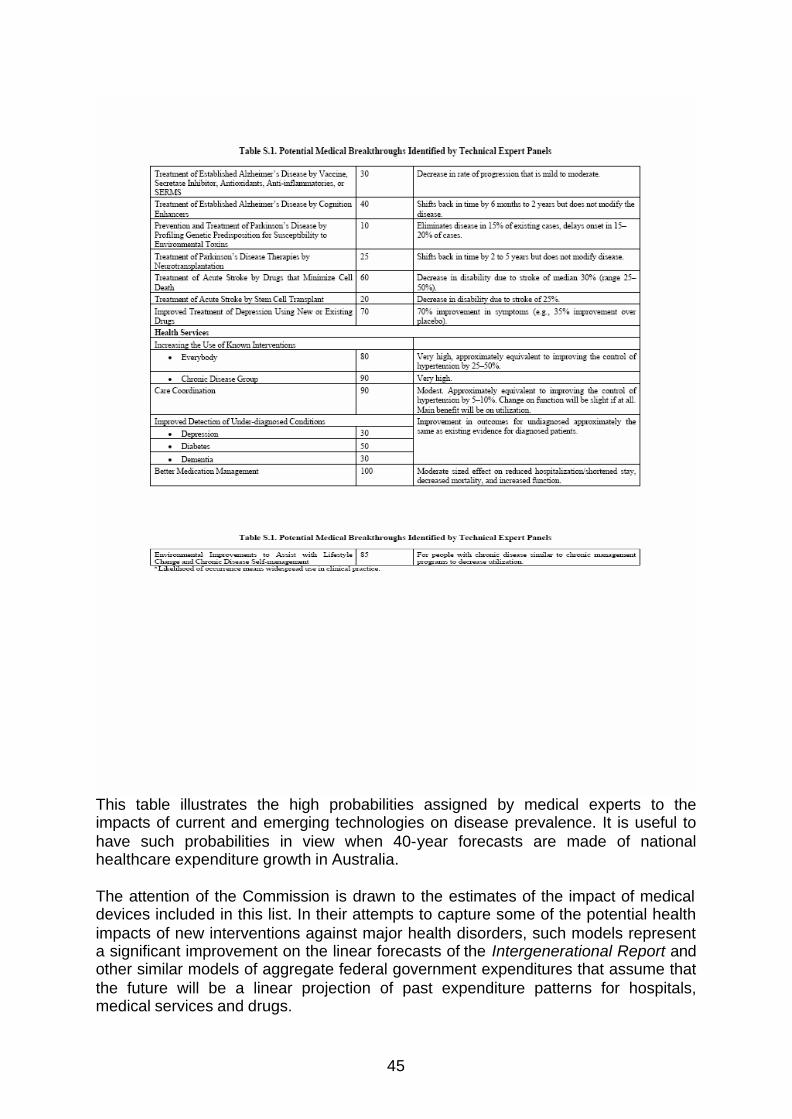
45
This table illustrates the high probabilities assigned by medical experts to the impacts of current and emerging technologies on disease prevalence. It is useful to have such probabilities in view when 40-year forecasts are made of national healthcare expenditure growth in Australia. The attention of the Commission is drawn to the estimates of the impact of medical devices included in this list. In their attempts to capture some of the potential health impacts of new interventions against major health disorders, such models represent a significant improvement on the linear forecasts of the Intergenerational Report and other similar models of aggregate federal government expenditures that assume that the future will be a linear projection of past expenditure patterns for hospitals, medical services and drugs.
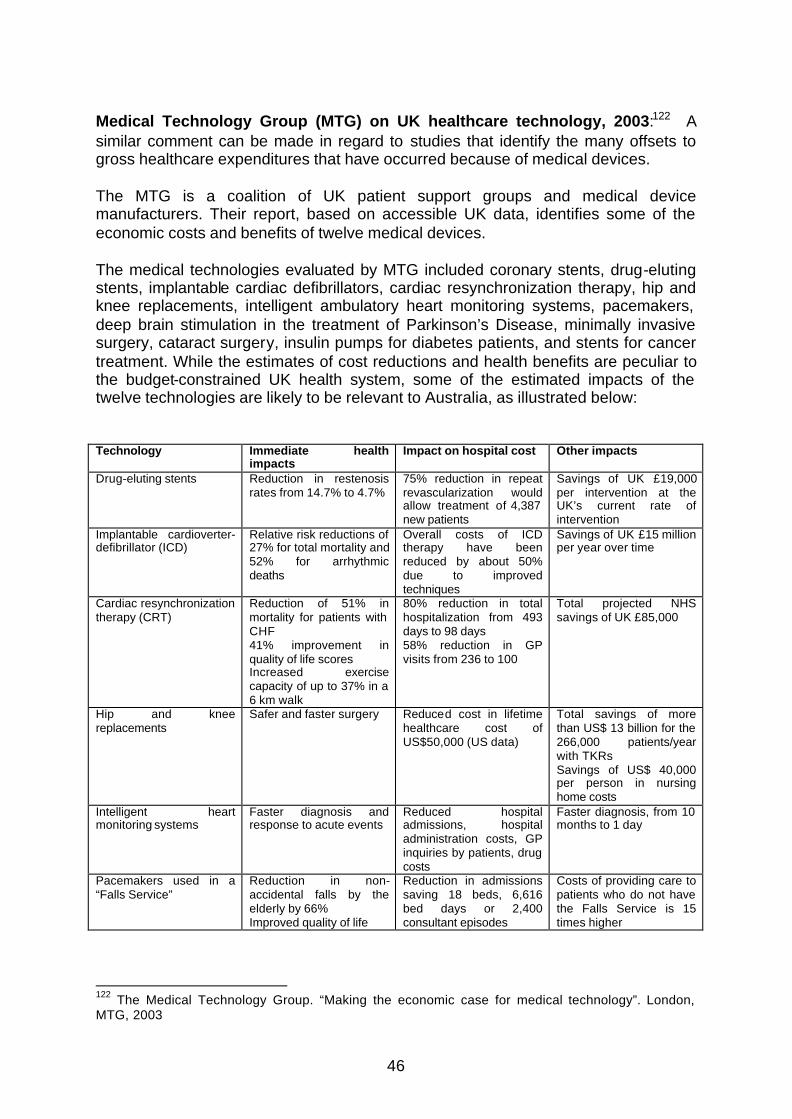
46
Medical Technology Group (MTG) on UK healthcare technology, 2003:122 A similar comment can be made in regard to studies that identify the many offsets to gross healthcare expenditures that have occurred because of medical devices. The MTG is a coalition of UK patient support groups and medical device manufacturers. Their report, based on accessible UK data, identifies some of the economic costs and benefits of twelve medical devices. The medical technologies evaluated by MTG included coronary stents, drug-eluting stents, implantable cardiac defibrillators, cardiac resynchronization therapy, hip and knee replacements, intelligent ambulatory heart monitoring systems, pacemakers, deep brain stimulation in the treatment of Parkinson’s Disease, minimally invasive surgery, cataract surgery, insulin pumps for diabetes patients, and stents for cancer treatment. While the estimates of cost reductions and health benefits are peculiar to the budget-constrained UK health system, some of the estimated impacts of the twelve technologies are likely to be relevant to Australia, as illustrated below: Technology Immediate health
impacts Impact on hospital cost Other impacts
Drug-eluting stents Reduction in restenosis rates from 14.7% to 4.7%
75% reduction in repeat revascularization would allow treatment of 4,387 new patients
Savings of UK £19,000 per intervention at the UK’s current rate of intervention
Implantable cardioverter-defibrillator (ICD)
Relative risk reductions of 27% for total mortality and 52% for arrhythmic deaths
Overall costs of ICD therapy have been reduced by about 50% due to improved techniques
Savings of UK £15 million per year over time
Cardiac resynchronization therapy (CRT)
Reduction of 51% in mortality for patients with CHF 41% improvement in quality of life scores Increased exercise capacity of up to 37% in a 6 km walk
80% reduction in total hospitalization from 493 days to 98 days 58% reduction in GP visits from 236 to 100
Total projected NHS savings of UK £85,000
Hip and knee replacements
Safer and faster surgery
Reduced cost in lifetime healthcare cost of US$50,000 (US data)
Total savings of more than US$ 13 billion for the 266,000 patients/year with TKRs Savings of US$ 40,000 per person in nursing home costs
Intelligent heart monitoring systems
Faster diagnosis and response to acute events
Reduced hospital admissions, hospital administration costs, GP inquiries by patients, drug costs
Faster diagnosis, from 10 months to 1 day
Pacemakers used in a “Falls Service”
Reduction in non-accidental falls by the elderly by 66% Improved quality of life
Reduction in admissions saving 18 beds, 6,616 bed days or 2,400 consultant episodes
Costs of providing care to patients who do not have the Falls Service is 15 times higher
122 The Medical Technology Group. “Making the economic case for medical technology”. London, MTG, 2003

47
Deep brain stimulation in treatment of Parkinson’s Disease123
Reduced rates and severity of disability Decreased patient dependence Reductions in PD symptoms
Reduction in the 78% of NHS costs associated with hospitalizations, and in the 20% for drugs for PD
Decrease in indirect costs of Parkinson’s Disease falling on carers of patients
Minimally invasive surgery
Safer, quicker treatments NHS savings from lower length of hospital stay
Faster return to work and savings in the hidden costs of productivity loss to employers
Cataract surgery Improved visual outcomes Fewer complications Reduction in incidence of glaucoma and infections
Reduction in NHS costs of inpatient care by use of outpatient procedures
Insulin pumps for diabetes patients
Improved quality of life Better control of blood sugars and acute epis odes Reduced mortality rates
Estimated cost per quality-adjusted life-year gained of £8,400 compared with multiple daily injections
Stents for cancer patients Improved pain control Less invasive treatment
Reduced length of hospital stay Reduced hospital costs are £500 with stents versus £2,500 without stents
TECH Global Research Network cross-national study of treatment of AMI:124 This study is one of many “bottom-up” studies of heart attack or acute myocardial infarction in recent years.125 This disorder lends itself to a bottoms-up micro-study because it is relatively well defined, and it has been the subject of numerous epidemiological comparative studies. The TECH study is a collaboration by an international network of research teams in 17 participating countries. It seeks to answer three questions that are relevant to the second Term of Reference of the Commission, viz.,
• How do national health policies affect technological change? • What is the role of technological change in explaining the growth of
healthcare expenditures worldwide? • What is the contribution of technological change to improvements in disease
outcomes? The data collected spans the period 1982-1997 for some countries, and at least the period 1990-1995 in most countries. What is interesting is the attempt of the collaborators to define national differences in economic and regulatory incentives that affect technological change. Using three types of incentive rankings in 1995 (strong, intermediate and weak), the incentives are classified as:
123 The cost-effectiveness of this procedure compared with best medical management has been estimated at US$49,000-see: KJ Tomaszewski and RG Holloway.” Deep brain stimulation in the treatment of Parkinson’s disease”. Neurology 2001; 57: 663-671. 124 V Atella. “ The relationship between health policies, medical technology trend, and outcomes: a perspective from the TECH Global Research Network. Powerpoint presentation circa 2001/02. 125 See the earlier quotations of the work of Cutler et al.
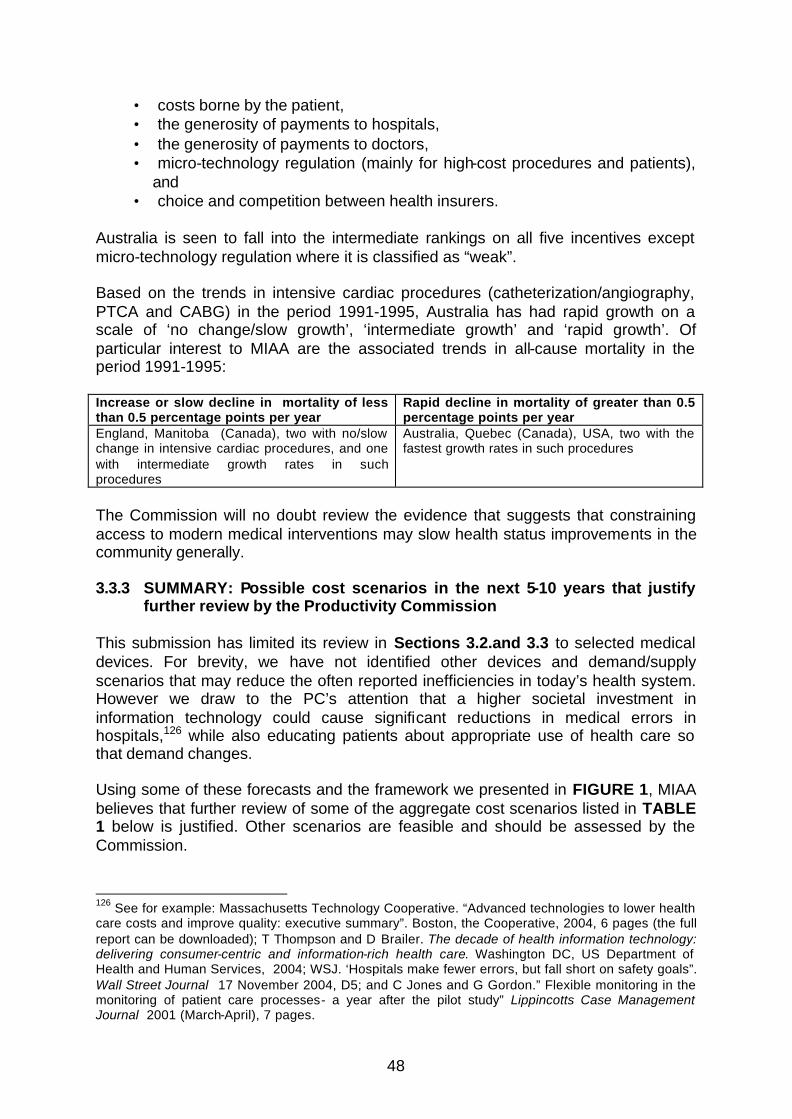
48
• costs borne by the patient, • the generosity of payments to hospitals, • the generosity of payments to doctors, • micro-technology regulation (mainly for high-cost procedures and patients),
and • choice and competition between health insurers.
Australia is seen to fall into the intermediate rankings on all five incentives except micro-technology regulation where it is classified as “weak”. Based on the trends in intensive cardiac procedures (catheterization/angiography, PTCA and CABG) in the period 1991-1995, Australia has had rapid growth on a scale of ‘no change/slow growth’, ‘intermediate growth’ and ‘rapid growth’. Of particular interest to MIAA are the associated trends in all-cause mortality in the period 1991-1995: Increase or slow decline in mortality of less than 0.5 percentage points per year
Rapid decline in mortality of greater than 0.5 percentage points per year
England, Manitoba (Canada), two with no/slow change in intensive cardiac procedures, and one with intermediate growth rates in such procedures
Australia, Quebec (Canada), USA, two with the fastest growth rates in such procedures
The Commission will no doubt review the evidence that suggests that constraining access to modern medical interventions may slow health status improvements in the community generally. 3.3.3 SUMMARY: Possible cost scenarios in the next 5-10 years that justify
further review by the Productivity Commission This submission has limited its review in Sections 3.2.and 3.3 to selected medical devices. For brevity, we have not identified other devices and demand/supply scenarios that may reduce the often reported inefficiencies in today’s health system. However we draw to the PC’s attention that a higher societal investment in information technology could cause significant reductions in medical errors in hospitals,126 while also educating patients about appropriate use of health care so that demand changes. Using some of these forecasts and the framework we presented in FIGURE 1, MIAA believes that further review of some of the aggregate cost scenarios listed in TABLE 1 below is justified. Other scenarios are feasible and should be assessed by the Commission.
126 See for example: Massachusetts Technology Cooperative. “Advanced technologies to lower health care costs and improve quality: executive summary”. Boston, the Cooperative, 2004, 6 pages (the full report can be downloaded); T Thompson and D Brailer. The decade of health information technology: delivering consumer-centric and information-rich health care. Washington DC, US Department of Health and Human Services, 2004; WSJ. ‘Hospitals make fewer errors, but fall short on safety goals”. Wall Street Journal 17 November 2004, D5; and C Jones and G Gordon.” Flexible monitoring in the monitoring of patient care processes- a year after the pilot study” Lippincotts Case Management Journal 2001 (March-April), 7 pages.

49
Given the predictions of some observers that the potential gross cost impacts of some technologies, such as drug-eluting stents and defibrillators, will place some health insurers at risk, these dismal predictions have little or no regard to the net costs to payers (i.e., gross costs less the cost reductions caused downstream by such technologies) or to the increases in functioning that may allow a normal life, reductions in welfare payments and mortality gains. MIAA believes strongly that the Commission’s report should assess the “future impacts” of technology on health benefits as well as on costs .
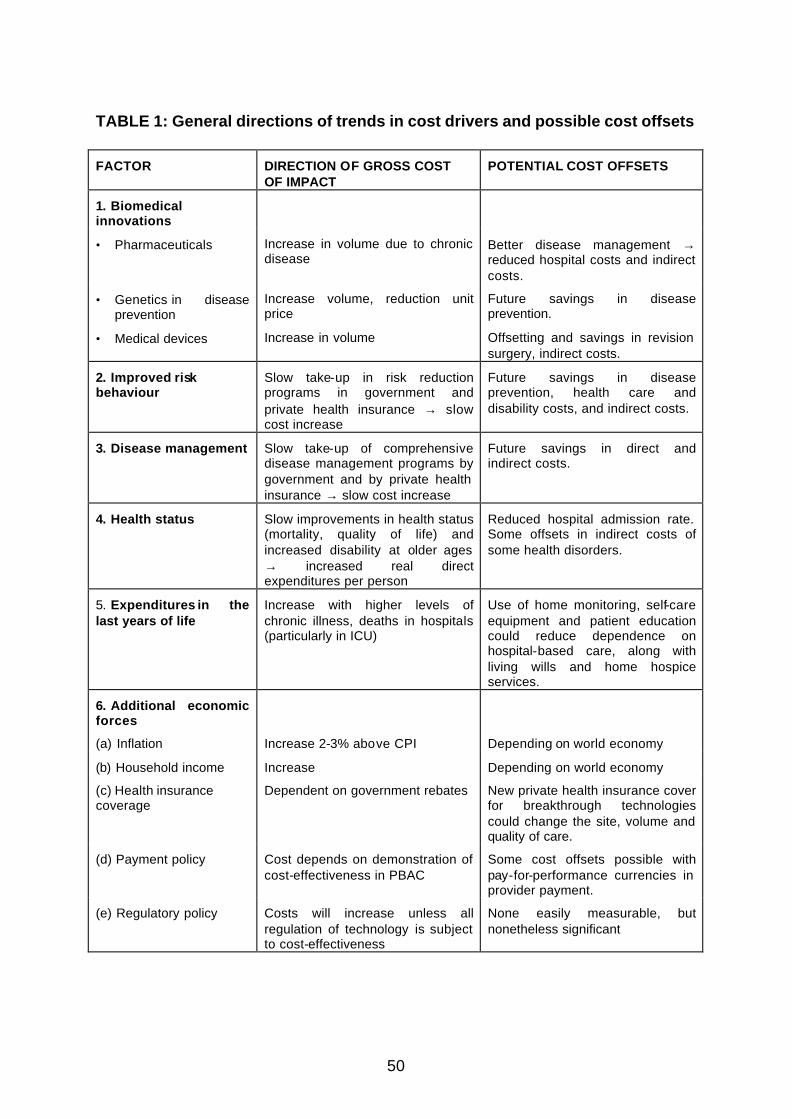
50
TABLE 1: General directions of trends in cost drivers and possible cost offsets FACTOR DIRECTION OF GROSS COST
OF IMPACT POTENTIAL COST OFFSETS
1. Biomedical innovations
• Pharmaceuticals Increase in volume due to chronic disease
Better disease management → reduced hospital costs and indirect costs.
• Genetics in disease prevention
Increase volume, reduction unit price
Future savings in disease prevention.
• Medical devices Increase in volume Offsetting and savings in revision surgery, indirect costs.
2. Improved risk behaviour
Slow take-up in risk reduction programs in government and private health insurance → slow cost increase
Future savings in disease prevention, health care and disability costs, and indirect costs.
3. Disease management Slow take-up of comprehensive disease management programs by government and by private health insurance → slow cost increase
Future savings in direct and indirect costs.
4. Health status Slow improvements in health status (mortality, quality of life) and increased disability at older ages → increased real direct expenditures per person
Reduced hospital admission rate. Some offsets in indirect costs of some health disorders.
5. Expenditures in the last years of life
Increase with higher levels of chronic illness, deaths in hospitals (particularly in ICU)
Use of home monitoring, self-care equipment and patient education could reduce dependence on hospital-based care, along with living wills and home hospice services.
6. Additional economic forces
(a) Inflation Increase 2-3% above CPI Depending on world economy
(b) Household income Increase Depending on world economy
(c) Health insurance coverage
Dependent on government rebates New private health insurance cover for breakthrough technologies could change the site, volume and quality of care.
(d) Payment policy Cost depends on demonstration of cost-effectiveness in PBAC
Some cost offsets possible with pay-for-performance currencies in provider payment.
(e) Regulatory policy Costs will increase unless all regulation of technology is subject to cost-effectiveness
None easily measurable, but nonetheless significant
51
3.4 TERM OF REFERENCE 4: IDENTIFY EXISTING MECHANISMS AND
PROCESSES FOR ENSURING COST-EFFECTIVENESS IN THE USE OF MEDICAL TECHNOLOGY, AND ANY GAPS IN THESE PROCESSES
Our submission first distinguishes drugs from medical devices (Section 3.4.1). Next, we summarise the mechanisms and processes that affect assessments of drugs and medical devices in Australia, and the overlapping roles of a number of organizations that delay patient access to new medical devices (Section 3.4.2 ) .Then we summarise developments in healthcare technology assessment internationally that would create significant problems if imported to Australia (Section 3.4.3). Finally, we comment on desirable methods for fast-tracking innovative technologies (Section 3.4.4) and alternative reimbursement solutions (Section 3.4.5), two issues that should be considered by the Commission. 3.4.1 Factors that distinguish prescribed drugs and medical devices and
diagnostics, and which should affect evaluation of cost-effectiveness ANNEX 9 summarises some of the essential differences between drugs and medical devices that should, in MIAA’s view, require careful consideration by the government before entertaining a proposal to apply the current PBS drug pricing processes to medical devices and diagnostics. The pricing of new medicines in the PBS process assumes that we can determine the health and economic outcomes of a new intervention compared with another intervention or a placebo. As noted in ANNEX 9, there are significant differences between pharmaceuticals and medical devices in this respect. Those differences have consequences in both pricing and in broader technology assessment. Firstly, implanted devices usually involve a significant surgical procedure, and the option of changing the device, once implanted, is not usually available. The notion of a generic substitute is not relevant for an implanted pacemaker or joint replacement, say. With drug therapy, the clinician can very easily change a drug, reduce its dosage or add another drug, and in some cases a generic drug may be acceptable for its safety, efficacy and cost. Furthermore, many medical devices come in different sizes and require suppliers to hold inventories (and often hospitals to hold a range of products on consignment), unlike drugs, which can be provided to a hospital in the one or two dose forms available twice a day by a wholesale distributor. Secondly, devices are often used in conjunction with other interventions such as surgery, diagnosis or monitoring. Is it possible to evaluate the specific effect of a device on health outcomes if it is an embodied technology such as a catheter, stent or joint prosthesis? For example, one recent study of ACE inhibitors used in patients with congestive heart failure (CHF)127 came to the conclusion that the drug did not reduce the rate of cardiovascular events in patients without left-ventricular systolic
127 The PEACE Trial Investigators.” Angiotensin-converting-enzyme inhibition in stable coronary artery disease”. New England Journal of Medicine 2004; 351: 2058-2068.

52
dysfunction, because revascularisation therapy prior to drug administration may have conferred cardio-protection. This case study is a reminder that the randomised clinical trial has major limitations when multiple medical technologies are used, and an accompanying editorial128 identified a concern that MIAA believes might not be fully appreciated by those advocating extensions of the PBS pricing processes to medical devices: “The results of the PEACE Trial underscore the importance of periodically reviewing previously proven strategies if concomitant therapy has changed over time.” Thirdly, if the device is a diagnostic test, is it possible to demonstrate the true outcomes of better diagnosis in terms of prevention, disease staging, interventional procedures and other applications if the diagnostic test is only one input in a clinical decision process that leads to improved health outcomes, quality of life or reassurance of the patient? In this situation, measuring the cost-effectiveness of a diagnostic test requires assumptions about the sensitivity and specificity of the test per se, the subsequent use of the information gleaned from the test results and the impact of other subsequent interventions. The impact of a drug per se is usually more directly observable. 3.4.2 Processes affecting the regulation of safety, efficacy and cost-
effectiveness of devices in Australia ANNEX 10 summarises the current regulatory processes used to assess the efficacy, safety and cost-effectiveness of medical devices in Australia. MIAA draws the attention of the Commission to the overlapping roles of five separate entities at Commonwealth and state government level, and the new Trans-Tasman Agency: • committees created in pursuit of the new pricing proposals under Schedule 5 of
the National Health Act • the Medical Services Advisory Committee (MSAC) and its advisory arm; • the advisory committees of the NH&MRC; • the processes implemented by the Royal College of Surgeons and the state
health ministers under ASERNIP -S; • the requirements proposed by the NSW Department of Health (see 3.4.2.4); and • any new regulatory requirements imposed by the proposed Trans-Tasman
Agency. Except for its closing remarks on the last-named development, MIAA does not focus here on the regulations for safety that involve the Therapeutic Goods Administration at the first regulatory hurdle. Australian patients have been protected from possible injury by the TGA regulation of safety in all drugs and devices. Any protracted TGA delay in approval of products does affect the revenue and costs of a manufacturer when TGA approval determines listing on Schedule 5 or consideration by MSAC.
128 B Pitt.” ACE Inhibitors for patients with vascular disease without left ventricular dysfunction-may they rest in PEACE”. New England Journal of Medicine 2004; 351: 2058-2068.

53
The cost of delays by TGA is not trivial in an area such as cardiac pacing where there are about 800 implants per year. With 50% of patients in private hospitals, a delay of nine months in the TGA and Schedule 5 decision processes means that access to a market of about $22 million per year comes at an added cost of millions of dollars in lost revenue and delays in effective patient outcomes.
3.4.2.1 National Health Act, Schedule 5: requirements for device pricing History: On 3 April 2003, the then Federal Minister for Health & Ageing, Senator Kay Patterson, announced the introduction of a new range of reforms to make private health insurance “more efficient, competitive and deliver better value for money for members”. The Minister announced that the “reform package will seek to rein in the costs of prostheses, which grew by 46% to $425 million in 2001-02.” Senator Patterson said such cost blowouts placed huge pressure on premiums. “Under the reforms, funds would be required to provide a full range of safe and cost-effective prostheses at no out-of-pocket cost to members”, and would “also be able to offer products providing cover for more expensive prostheses.”
On 14 July 2004 the current Minister for Health & Ageing announced the formation of a new ministerial advisory committee to oversee the implementation of reforms for prostheses. The committee, called the Prostheses & Devices Committee, was asked to advise the Minister on the listing of products and the corresponding benefit amounts to be reimbursed by private health insurance.
The Minister’s media release went on to advise that “…the new arrangements are designed to ensure that people with private health insurance have affordable access to quality prostheses. For every hospital procedure involving a prosthesis, there will be at least one prosthesis available at no cost to the fund member.” Proposed Schedule 5 amendments: The government proposed129 to amend the National Health Act to provide legislative cover to implement prostheses reforms. Features of the new prostheses arrangements, which will continue to be titled Schedule 5, are as follows:
• Costs incurred by Government to manage Schedule 5 will continue to be recovered from suppliers of medical devices. In the first year of operation, charges will be limited to twice suppliers’ current costs, i.e. approximately $1.8 million. After the first year of operation, suppliers will meet all costs.
• Devices will be reviewed by Clinical Advisory Groups and placed in clinical categories
• To be listed on Schedule 5, devices must be associated with a medical procedure which has been allocated a Medicare Benefits Schedule (MBS) item number. Devices without an MBS link will be referred to MSAC for evaluation
129 The latest version of the proposal is: House of Representatives. National Health Amendment (Prostheses) Bill 2004: explanatory memorandum. Canberra, 1 December 2004. The provisions of the Bill have been referred to the Selection of Bills Committee of the Senate, which is due to report by 10 February 2005.
54
• Benefits will be centrally negotiated under the guidance of the Department of Health and Ageing. A benchmark benefit process will be employed.
• In cases where an agreed benefit cannot be negotiated, devices will be listed indicating a gap payment will be required of patients
• Doctors and hospitals will become involved in a process of informed financial consent for Schedule 5 devices
• In February and August each year, a Ministerial determination will be made prescribing prostheses to be reimbursed and the benefit amount to be reimbursed by health funds. The determination will identify devices where a gap payment will be applicable
• The first reformed Schedule 5 is expected to take effect in mid-2005 • Although the Minister has committed to a review of reforms two years after
implementation, as yet the new scheme has no performance objectives or agreed data collection for the purpose of evaluation.
The new organizational structures have created a spate of new acronyms. At the top of the hierarchy is the Policy Advisory Group (PAG)130 which will address major policy issues, and the Prostheses and Devices Committee (PDC)131 which will “…make recommendations to the Minister in regards to listing and benefits levels of new and existing prostheses and devices that health insurance funds will need to fund for their Members with private health insurance. These recommendations will be based on advice from Clinical Advisory Groups (CAGs)… and advice from the Benefit Negotiation Group in regards to the establishment of appropriate benefits for the different effectiveness categories”. At the time of drafting this submission to the PC, CAGs have been created for cardiac stents, pacemakers and defibrillators, ophthalmic lens, hip prostheses and knee prostheses. The CAGs, with memberships drawn from the relevant College, the Australian Medical Association (AMA), Consumer Health Forum and MIAA, are expected to provide recommendations based, inter alia, on clinical effectiveness, relative differences in clinical effectiveness between prostheses and devices used for the same or similar purposes, and the impact on patient outcomes. The Benefits Negotiating Group (BNG), basically the price negotiating body that reconciles the claims of device manufacturers and health insurers, has appointed the first five benefit negotiators, aided by a facilitator who “… did not have the appearance of allegiance to any particular part of the health industry”.132 An illustration of the confusing interactions with other regulatory entities noted so far in this submission is evident in the PDC deliberations on implantable cardioverter defibrillators with cardiac resynchronisation therapy (CRT). Following its meeting on 130 The PAG membership will be “…senior representatives of each of the key stakeholders”. The PDC can refer issues to the PAG, which may, in turn, “…be able to resolve these issues or may need to refer some to the Minister for advice”.- see: PDC Bulletin following second meeting of the PDC on 1 October 2004. 131 The PDC membership is four independent clinicians (one of whom is the chairman nominated by the AMA, two private hospital representatives, one VA nominee, one consumer representative, and one non-aligned supplier representative. Three DOHA advisers work with the Committee (one medical officer, one technical and one legal). The committee can seek advice from other advisers on a needs basis. 132 Prostheses & Devices Committee Bulletin, “Second meeting of the Prostheses & Devices Committee – Friday, 1 October 2004 - Sydney

55
21 August 2004, the PDC sent a memo to MSAC asking for the device to be reviewed as matter of urgency. Although CRT devices are already listed on the Prostheses Schedule, CRT does not have an MBS number to cover the associated surgical procedure. MSAC could conceivably determine that CRT is cost-effective or not, or perhaps cost-effective in particular clinical circumstances. An adverse MSAC finding could lead to delisting of CRT devices from Schedule 5 and consequently their ineligibility for reimbursement if used in privately insured patients (but these effective products would continue to be available to patients in the public system). On 17 September 2004, MSAC responded indicating that it was expecting a “referral” on the device within the month, and that a review would be initiated “soon thereafter”.133 In December 2004, MSAC intimated to MIAA that a referral had been made, following advice from the Health Policy Advisory Committee on Technology (HealthPACT, which commissions horizon scanning and other assessments on new technologies, and provides policy and planning advice to the Australian Health Ministers Advisory Council and the government on the potential impact of the introduction of new technology into the healthcare system), and further that “…the assessment is expected to begin shortly and could be concluded at MSAC’s meeting in August 2005”. MIAA notes that:
• CRT should not be within the purview of any horizon scanning or technology assessment process as it is already available and in common clinical practice;
• the whole MSAC process is redolent with delays (one year minimum in this case) and referral overkill, retarding timely patient access to an effective technology;
• there are overlapping organizational responsibilities in assessment; and • there is no tacit recognition that elsewhere in the world regulatory authorities
have already considered the efficacy and cost-effectiveness of CRT. 134 Major MIAA concerns regarding Schedule 5 reforms: MIAA welcomes the opportunity presented by the Productivity Commission’s study to recognise medical devices as an asset in terms of better health outcomes and not merely a liability in terms of expenditure.135 133 Prostheses & Devices Committee Bulletin, “Second meeting of the Prostheses & Devices Committee – Friday, 1 October 2004 -Sydney”. 134 It is instructive to recall that in its assessment of the implantable cardioverter defibrillator (ICD) for arrhythmias, the 2000 report of the UK National Institute for Clinical Excellence (NICE) used evidence from the European equivalent of MIAA to make its judgment on the cost-effectiveness of the device- see NICE.” Guidance on the use of implantable cardioverter defibrillators for arrhythmias”. Technology Appraisal Guidance No. 11, September 2000, Paragraph 4.4. Overlapping responsibilities in the Australian assessment of medical devices do not encourage joint actions by makers of a similar class of device to pool clinical opinions and data that could hasten judgments on cost-effectiveness. 135 Although the Private Health Insurance Administration Council data on Schedule 5 records significant annual growth in prostheses expenditure, it has been too readily assumed that increased costs by suppliers are the major cause. MIAA does not possess aggregated data to analyse the drivers of increasing expenditure but notes an estimate by Mr David King, CEO of the Australian Health Services Alliance, presented to the Health Insurance Summit in Sydney on 9 June 2004. Of the 28% increase in prostheses expenditure from FY 2001 to 2002, 16% was due to volume increase (utilization), 8% due to new technology and 3% due to price increase (sic). If these statistics are accepted, prostheses reforms are addressing only a fraction of the “problem”.
56
MIAA is concerned at the range of intended and unintended consequences which could arise from the reforms:
• The potential for redundant reviews by overlapping bodies is high, as illustrated by the CRT example above.
• There may be a reduction in clinician choice, a fundamental aspect of good clinical practice.
• Clinicians will be more involved with patients’ financial circumstances and will be responsible for conducting informed financial consent.
• Due to the patient’s financial circumstances, the clinician may be obliged to select a sub-optimal prosthesis, with subsequent medical litigation possible.
• Low income and older Australians may be treated inequitably under the new arrangements.
• Clinicians may be obliged to use a prosthesis with which they are less familiar and possibly less proficient, with consequences for health outcomes as well as medical litigation.
• Reforms may reduce the flow of medical technology to Australia and impact the financing of R&D.
• The new arrangements are expected to cost at least double the current arrangements, which will eventually add to the overall cost of prostheses. Bureaucratic processes will inevitably delay the availability of new technology to private patients
• Private health insurance could become less attractive and the purpose of the government’s 30% private health insurance rebate diminished.
MIAA believes that the outcomes of this reform will add unnecessarily to the complexities faced by patients. This reform also overlaps with other parallel processes that slow the path of new devices to patients, as indicated below. One other cost-inducing feature of the reform proposals should be highlighted. Some devices that are used infrequently also have a high capital cost. For example, with limited state government funding for capital budgets for such equipment, a device such as a cardiac assist device (an external, pulsatile, mechanical circulatory support system used in cardiac failure when drugs or the intra-aortic balloon pump are not appropriate) is available only in NSW teaching hospitals involved in the Sydney Heart Rescue Service. Applications by the supplier to have the device listed on the Prostheses Schedule failed because the device does not fulfil the requirement of leaving hospital with the discharged patient. The device has a listing with the TGA, but under these new proposals, as it is a Class 3 device, each of the items within the device’s product range will require an ARTG number ,i.e., a new TGA submission, each submission attracting a fee of $4,380. These extra regulatory costs are for a device that delays death from a common disorder in Australia.
3.4.2.2 Health technology assessment: MSAC and the value of medical devices
MSAC has been in existence since 1998. It advises “…on the strength of evidence pertaining to new and emerging technologies and procedures”. This process of regulation of the medical devices industry is a major concern to the industry and is outlined in more detail in ANNEX 11.
57
Particular aspects of the MSAC process deserve scrutiny by the Commission: • Is the MSAC role clear in the evaluation of devices? • How does MSAC set its priorities for assessment? • Why are MSAC processing times lengthening? • How do the MSAC processes overlap with other technology assessment
processes and affect pricing approvals for devices? MSAC role: The Medicare Benefits Schedule is for medical services, i.e., the procedure, not the device. It is unclear if a new device or technology used in a currently reimbursed procedure is eligible for MSAC review, or indeed whether such review is mandatory. MSAC priority setting: In recent years it has become clearer to MIAA members that there are overlapping memberships in at least two of the advisory arms of government affecting the evaluation of devices, viz., MSAC and NHMRC. The unresolved future of one diagnostic test illustrates the inter-agency dilemma. A sponsor submitted two applications to MSAC, one for a new Human Papilloma virus test for women with cytological prediction of low grade abnormality (MSAC reference 12b, application May 2001), and the other for the same test for cervical screening (MSAC reference 12d, application October 2002). The supporting committee formed by MSAC to review the submission included many members also on an NHMRC Guideline Review Committee appointed in 2001 and expected to conclude in 2003. Included in its terms of reference was a requirement to assess the utility of HPV triage in low grade cytology. • There was an overlap between the ostensibly shorter timeframes of MSAC and
the longer timeframes of the NHMRC Committee. • Published evidence discounted by MSAC in its review was used subsequently by
the NHMRC Committee to reach a different position than the applicant’s submission.
• While MSAC gave the applicant an opportunity to respond to the MSAC Supporting Committee draft report, the applicant was verbally given two weeks to respond.
• The NHMRC guidelines for cervical screening were challenged by the Royal Australian College of Pathologists and a women’s coalition. The guidelines are now in abeyance while the scientific issues are clarified.
• One consequence of these inter-committee deliberations and overlaps is that HPV screening tests are not currently covered. There were no avenues for appeal.
• An independent Oxford University scientist foreshadowed that the rates of cervical disease in Australian women would rise.
This case study and other ongoing inter-agency delays that affect reimbursement of innovative technologies cause MIAA to ask: how does MSAC agree on its priorities, workloads and advisory committees? Are the priorities set by the predispositions of
58
the advisers to MSAC, by the committee members themselves, or by the perceptions of the Departments of Health and Finance? MIAA believes that the MSAC Application & Assessment Guidelines (February 2004) are in need of revision. • It would be he lpful if particular attention were given to describing the actual steps
in the assessment cycle – for instance, there is confusion about whether the evaluator’s draft Assessment Report is sent to the applicant for comment at the same time as the Advisory Panel receive it for review and endorsement, or whether the Advisory Panel endorse the Report prior to its release to the applicant – whose comments then simply get forwarded to MSAC along with the Report (or do the comments go back to the Advisory Panel for consideration?).
• It would also help if an outline of how the Secretariat allocates and prioritises the work of the three teams of contracted evaluators was included in the Guidelines.
• Clarity about time limits for production of draft Assessment Reports would also greatly assist industry applicants (who usually need to develop business plans).
MSAC processing times: The majority of MSAC applications submitted appear to have been for procedures (both diagnostic and surgical) that involve products whose development costs range up into the millions of dollars. These products may be implantable prostheses or medical devices, consumables (disposable products), or capital equipment. Over recent years it has been very rare for an application for a new procedure to be submitted that does not involve a technology of some kind. It is important that applications to MSAC are recognised as having far wider implications than just the determination of a new listing on the Medicare Benefits Schedule and payment for the relevant medical practitioner. Without an MBS item number, a procedure will not be placed within a “theatre band” (a funding arrangement between private hospitals and insurance funds, covering consumables, disposables, and capital equipment) by the National Procedure Banding Committee.. Without an MBS item number, a prosthesis cannot be listed on Schedule 5, although the same device could be available to doctors and patients in the public sector. Just as importantly, the interrelationship between procedure and product, and the part played by industry in supplying devices, needs greater recognition. Although it is understandable that the original designers of Medicare could not have foreseen the extent of this relationship, it is timely that MSAC processes become more sensitive to these issues. For example, TGA approval is mandatory before applications can be accepted by MSAC but the regula tory assessment process is slow. MSAC should be capable of employing some risk-management practices, with applications accepted and the evaluation process commenced ahead of ARTG inclusion in circumstances where devices may have already been approved in other reputable jurisdictions. NH&MRC overlaps with MSAC in assessments of efficacy: It is understood that over the past year the NH&MRC Clinical Trials Centre (CTC) has been carrying out a review of the ‘levels of evidence’ required for MSAC applications for diagnostic

59
procedures. It is also understood that the success rate of MSAC applications for diagnostic procedures is about 50%. In 1995 the NH&MRC published the following guidelines for a rating scale of quality of evidence when the focus was on pharmaceuticals. I Evidence obtained from a systematic review of all relevant randomised
controlled trials. II Evidence obtained from at least one properly-designed randomised controlled
trial. III-1 Evidence obtained from well-designed pseudo-randomised controlled trials
(alternate allocation or some other method). III-2 Evidence obtained from comparative studies with concurrent controls and
allocation not randomised (cohort studies), case-control analytic studies, or interrupted time series with a control group.
III-3 Evidence obtained from comparative studies with historical control, two or more single-arm studies, or interrupted time series without a parallel control group.
IV Evidence obtained from case series, either post-test or pre-test and post-test. There are a number of problems in applying these guidelines to surgical and diagnostic procedures136. Evidence of the clinical efficacy and safety of a medical procedure at the randomised, double-blinded, head-to-head Phase III clinical trial level is rare, and in many cases impractical. Some of the problems associated with obtaining evidence are:
• The timing of the collection of any evidence is critical. The ‘learning curve’ as surgeons develop experience with a new procedure or technology impacts upon outcomes; and in the earlier stages of R&D products often undergo design modifications based on surgeons’ feedback. Therefore, clinical data collected too early in the life-cycle of a technology, when it is still undergoing refinement or utilisation rate is low and clinicians are still gaining experience with it, is likely to be worthless.
• The MSAC system is unique. The majority of products associated with medical procedures come from either the USA or Europe, and neither of these large markets have the evidence requirements of the Australian system, therefore suppliers do not have the required information and data readily to hand.
• Often the experience and success of a new medical procedure is published on a major clinic’s web site based on the clinic’s experience. However this ‘grey literature’ is usually discounted as evidence.
• It is often difficult to find someone willing to pay for the cost of collecting the evidence. If a product is involved, the company that markets the product will be limited by the potential profit from the product. Unlike the majority of pharmaceuticals, the market for new technologies is usually limited by the
136 The limits of evidence-based medicine are reviewed in : M Hlatky, GD Sanders and DK Owens.” Evidence-based medicine and policy: the case of the implantable cardioverter defibrillator”. Health Affairs 2005; 24 91): 42-52; MS Stanton.” Implantable cardioverter defibrillators: an excellent case study”. op cit, 52-54; EP Steinberg and BR Luce.’ Evidence-based? Caveat emptor”. op cit, 80-93; and K Claxton, JT Cohen and PJ Neumann.” When is evidence sufficient? op cit, 93-101.

60
number of procedures performed. This severely limits potential profit and thus funding for clinical studies.
• There are substantial real costs associated with performing a medical procedure. These costs are incurred by the hospital (theatre and bed-days), the surgeon and the supplier of any associated product. If all these costs were borne by the patient, that would be an effective barrier to the performance of a new procedure and any collection of evidence.
It is important that the evidence requirements for a new procedure are calibrated to the characteristics of the procedure. For example:
• the potential for the new procedure to do harm; • the reversibility of the new procedure; • the availability of an existing alternative; • the safety and efficacy of the existing alternative; • the size of the potential patient population; • the seriousness of the condition being treated; and • the cost of the procedure.
This concept of calibrating the evidence to the nature of the procedure has some similarities to the report / review by the CTC. However, as yet, industry has not been invited to comment on this report / review. The existing evidence requirements are proving to be an effective block to the introduction of new technology in Australia. Ironically, new products from the emerging Australian biotechnology industry can be available in major overseas markets, including USA and Europe, but may not be available for marketing in this country either due to a failed MSAC application or to companies not seeing the return on the costs of obtaining evidence suitable for MSAC. Even more ironic is that the R&D costs of these Australian products are often subsidised by state governments.
3.4.2.3 Health technology assessment: ASERNIP-S, NHSU and processes affecting surgical devices
The Australian Safety and Efficacy Register of New Interventional Procedures-Surgical (ASERNIP-S) was established by the Royal Australasian College of Surgeons (RACS) in 1998, and is funded by the Commonwealth Department of Health and Ageing. Its role is to collect and assess evidence-based information on the safety and efficacy of new surgical techniques and technologies. It does not have an official role in the negotiation of benefits for prostheses with health insurers, but its reports are likely to be used as a reference point by state health departments. Any external agency, such as a Division of RACS, specialist societies, hospitals, and the Consumer Health Forum, even individuals, can nominate an interventional procedure for review. ASERNIP-S then organizes a review group, comprising a surgical director, a researcher, a protocol surgeon , an advisory surgeon, a surgeon from another specialty, and other invitees, which oversees production of a draft

61
review. This report goes through several more steps before the RACS Council approves it for dissemination. ASERNIP-S aims to undertake a re-appraisal 1-2 years after the initial review. The outcome of an ASERNIP-S review is that a procedure and related technology is classified on the basis of three criteria:
• the strength of evidence (poor, average, good); • safety (safe compared with a comparator procedure,137 safety cannot be
determined, or unsafe compared with a comparator procedure); and • efficacy (higher than comparator, indeterminate, or less efficacious than the
comparator) This system may lead to a recommendation for an audit of the procedure, or for a controlled clinical trial. The ASERNIP -S process seems to be independent of other developments and solely concerned with the safety and efficacy of a procedure, medical devices per se are not reviewed. Nevertheless, the process has been recommended as an option by the NSW Department of Health in its guidelines to public hospitals on the introduction of interventions involving new technology (see below). Another health technology assessment unit has more recently been inaugurated. The National Horizon Scanning Unit (NHSU) is operated by the Health Technology Assessment Unit at the University of Adelaide, and is jointly funded by the Department of Health and Ageing (DOHA) and the Australian Health Ministers Advisory Council. NHSU’s activities are conducted under the auspices of HealthPACT, which is comprised of representatives from DOHA, State and Territory Governments, MSAC, ASERNIP-S, and the New Zealand Ministry of Health. The NHSU undertakes so-called ‘horizon scanning’ on new and emerging health technologies including devices, diagnostic tests and procedures, and other non-surgical interventions - the work also performed by ASERNIP -S.
3.4.2.4 NSW Health model policy for new interventional procedures in clinical practice:138
A key section from the Frequently Asked Questions annex of this policy is reproduced below:
137 The comparator may be the current “gold standard” procedure, an alternative procedure, a non-surgical procedure, or no treatment (i.e., natural history). 138 NSW HEALTH. “Model policy for the safe introduction of new interventional procedures into clinical practice: a model policy for area health services and other public health organizations”. Sydney, October 2003, 23 pages

62
This process, instigated by one state government, will require a manufacturer to use the MSAC or ASERNIPS processes for even minor changes in a surgical procedure due to advent of a new technology. The accompanying bureaucratic process of form-filling and approval at different levels, coupled with the requirement for a progress report by the Area Health Service to the New Interventions Assessment Committee, is, to say the least, pre-emptive of other uses of the time of clinicians, and is obviously dependent on the speed of MSAC and ASERNIP -S review processes. The proposed inter-linking of already slow processes is not an incentive for innovations in clinical practice, and MIAA members are fearful of the consequences of increasingly time-consuming applications of layered approvals. It is of concern to MIAA that the objectives of these many government-sponsored health technology assessment groups overlap, and that their responsibilities are unclear. It is also curious that the UK and other European countries with larger healthcare sectors have only one major health technology assessment body139, whereas Australia has four (five, if the Pharmaceutical Benefits Advisory Committee is included).
139 Apart from the EuroScan collaborative network that exchanges information on emerging technologies, the nations with healthcare technology assessment processes include Denmark, France, Netherlands, Norway, Spain, Sweden and Switzerland.

63
3.4.2.5 Proposed Trans-Tasman Agency (TTA) The new Agency, due to launch in 2005, will replace the TGA. It will regulate medicines, medical devices, blood and blood products in Australia and New Zealand. According to the New Zealand Institute of Economic Research, its operating costs could be about $70 million per year, and these costs will be funded by annual product licence charges and notification fees.140 One goal of its creation is to streamline regulatory activities and speed up the introduction of innovative products. . MIAA generally supports the formation of the TTA, because in concept, it is one regulatory agency with one set of rules and one point of access to two markets, and it strengthens the export objectives of industry. That said, there are considerable reservations within MIAA companies141 about the proposed method of cost recovery and governance and these concerns are shared by other industry groups.
• It is disconcerting to find an unsympathetic approach from the TGA and the government in meeting industry requests that a more practical regulatory framework be created. The TGA has made clear that it will deliver a Trans-Tasman model that replicates the TGA processes today. In this process, third-party resources are refused, world best practice developments in regulation are ignored, Australian manufacturers and suppliers are disadvantaged, exporters are impeded and Australian citizens face delayed access to new technologies.
• The proponents of the proposed agency seem to ignore some of the basic premises and the conclusions of the Productivity Commission’s draft research report suggesting that the formation of Joint Consumer Protection Agencies “…would not be worthwhile given the small benefits such changes would deliver and the large costs of implementation”. 142 The absence of a publicly accessible business case or cost-benefit analysis of the TTA is unacceptable in 2005, particularly when terms of reference were made available in August 2002.143
• The process encourages Australian companies to move offshore and import products into Australia and, in some cases, not to market products in Australia or to export only.
• There is a reasonable fear in our industry that the TTA will try to do more but, with limited resources, the outcome will be public health and safety problems. The palpable weaknesses in TGA processes today will be
140 K Woods.” Bid for therapeutic harmony”. Medical Observer 26 November 2004, 27. 141 The detailed critique is given in: MIAA. “Development of a Trans-Tasman Joint Regulatory Agency: considerations for support of a viable, affordable medical devices and diagnostics industry”. Sydney, MIAA Industry Position Paper, December 2004, 21 pages. 142 See particularly Draft Findings 5.1 and 5.2 and the conclusion in: Productivity Commission.“ Australian New Zealand Competition & Consumer Protection Regimes: Draft Research Report” . Canberra, Productivity Commission, October 2004. 143 See: http://www.jtaproject.com/Downloads/Key%20Documents/Cost%20Benefit.pdf.This announcement indicated that the NZ Institute of Economic Research had been asked to undertake the study. In October 2000, a regulatory impact assessment dealt with the options from the NZ point of view- see: http://www.jtaproject.com/Downloads/Key%20Documents/NZNIA.pdf )

64
exacerbated as government moves to regulate in-vitro diagnostics, cellular tissues and biologics.
• The Mutual Recognition Agreement (MRA) activities seem to be advanced within the government regulatory process but not shared with the industry. MRAs do not address the workload issues, and even when they do have some value (e.g., improving access to foreign markets by Australian manufacturers), they involve lengthy ’confidence-building’ periods measured in years. The recent experience in building an MRA with Europe for medical devices under the previous devices regulations hit numerous roadblocks and there have been no more than three examples since 1999.
The answer, recognised by regulators such as the US Food and Drug Administration, is to provide access to high quality third-party expertise, not to argue for the maintenance of the status quo. The TGA monopoly is at odds with the government’s policies on deregulation. It increases costs with no tangible benefits to consumers, and the Productivity Commission has already highlighted this issue in its draft research report on consumer protection regimes.
3.4.2.6 Summary of the above regulatory processes The MIAA concludes that if there are any shortfalls in the current or imminent processes of assessment of medical devices they reside in the overlapping responsibilities of many government bodies, the delays that are caused in access of patients to innovative devices, and the regulatory costs imposed on device manufacturers without any assessment of the benefits to the community of such regulatory processes. The Commission could usefully reflect on such overlaps and their consequences. 3.4.3 International developments in regulatory and pricing processes that
would cause significant problems if introduced in Australia MIAA members have some concern about the imposition of any new processes of assessment of medical devices that could extend product review times and delay access to breakthrough technologies. Some reforms have already increased the number of regulatory hurdles that must be surmounted in evaluations of safety, efficacy, pricing and utilisation of pharmaceuticals, and they have been extended in the EU nations by the creation of large and influential agencies such as NICE in the UK. In Japan, the government has cut device prices unilaterally, while Germany has introduced case-mix funding of hospitals that embeds today’s cost of devices within a fixed hospital case payment system. Other reforms could increase product review times as they attempt to harmonise technical requirements in new Trans-Tasman regulatory processes, extend discussions between industry and regulatory authorities, restructure the role and organisation of regulatory authorities, introduce new fees and target review times, and add levels of complexity to approval times by requiring economic appraisals, price-volume agreements, therapeutic reference pricing and other layers of pricing complexity.

65
Some countries attempt to tie the price of a device to the price of that device in other countries. However this is a particularly inappropriate mechanism for the reimbursement or funding of medical technologies for a range of reasons. Apart from the markets in different countries having different economic features (due to the underlying national economy, inflation, cost of labour, etc.), so that products of all types vary in price, in many countries the purchase of healthcare is substantially dominated by government and therefore medical product prices are skewed. Product prices vary between countries for a number of reasons, including:
• Differences in regulatory structures and costs; • Variations in healthcare purchasing practices and the availability of
competing products; • Differences in retail practices, distribution costs, etc.; • Variations in clinical practice; • Variation in currency exchange rates.
The price of medical technology should reflect, at least in part, the investment in R&D and the local cost of doing business, including regulatory and distribution costs, the provision of training and other value-adds (see section 3.4.4 below and ANNEX 13). Otherwise, bearing in mind that Australia is less than 2% of the world market for medical technologies, there is the potential risk of manufacturers declining to launch innovative products here, and the community being denied access to beneficial therapies. Worldwide, as an alternative to negotiating reimbursement levels with providers of healthcare, there is a trend towards the use of evidence-based criteria to decide whether a new intervention will be reimbursed by governments and private health insurers.144 The evidence-based process has two components: reaching agreement that there is adequate evidence to decide that an intervention is effective and then agreeing on the magnitude of the benefit conferred by the intervention. These two components place significant weight on evidence gleaned from appropriately designed clinical trials and reduce prior dependence on narrow expert opinion or ‘common practice’.145 The implementation of such reforms is not without its costs, however. For both patients and payers, MIAA agrees that these are valid actions by the payers. But if requirements for demonstrations of effectiveness are then turned into requirements to pass a threshold ratio of ’cost-effectiveness‘, the world literature “…has not led to a consensus about how such thresholds should be determined and used”. 146 While the Australian PBAC guidelines for economic appraisals of drugs convey an impression that they reflect consensus, the fact remains that no other nation has implemented the same guidelines, particularly their discounting of the indirect cost savings achieved with many drugs (and devices, we would add). 144 See for example: AM Garber.” Cost-effectiveness and evidence evaluation as criteria for coverage policy”. Health Affairs Web Exclusives January-June 2004, W4-284 to W4-296 145 ibid, W4-286 146 Ibid, W4-288
66
If we eschew a threshold approach and adopt ‘league tables’, ranking drugs, surgical techniques, diagnostic tests and non-clinical health interventions (e.g., advice on a hotline to help smokers desist) by their cost per quality-adjusted life-year gained, we ignore the fact that the data for these league tables have been drawn from different studies, in different health settings, at different times, at different stages of diffusion of a technology, and using different methodologies147. As Garber notes,”…rigid application of a specific cut-off cost-effectiveness ratio is rarely possible- if only because effectiveness varies from one person to another- nor would it guarantee socially acceptable outcomes…A cost-effectiveness criterion will be harder to pass when the intervention is very expensive”.148 He goes on to note that cost-effectiveness “…has long been the preferred method to explicitly address value in medical care, yet it is not a common feature of formal coverage decision making by private U.S. health plans”. This unwillingness to use cost-effectiveness can be traced back to earlier deliberations by US health economists who produced a consensus report to the US Congress that fully recognised the limits of the methodologies for economic appraisal then (and now) available.149 As a result, the Medicare Coverage Advisory Committee processes do not make cost-effectiveness the gold standard for a coverage decision,150 and the US Blue Cross Blue Shield Association has created a different process of healthcare technology assessment that measures and balances five attributes of the technology:151
• whether the technology has final regulatory approval from the FDA (the TGA equivalent);
• whether available scientific evidence permits conclusions about the impact of the technology on health outcomes (including evidence from peer-reviewed journals, evidence that measurement or alterations in conditions affect health outcomes, and opinions by national medical associations and consensus panels that are backed by the quality of the supporting evidence and rationale- i.e., similar to ASERNIP -S in Australia);
• whether there is an improvement in net health outcome after taking into account side-effects and possible harms to patients;
• whether the technology is as beneficial as any established alternatives; and • whether the improvements observed in investigational settings can be
attained under usual conditions of medical practice (i.e., are there any doubts about achieving the results of clinical trials in the real world, where there can be non-adherence of doctors to clinical practice guidelines, non-conforming
147 When such league tables were used inappropriately and inaccurately in the US state of Oregon to set a cutoff threshold cost per QALY above which the intervention for Medicaid enrollees (i.e., the indigent) was not reimbursed, the political noise generated killed the initiative and caused a rightful pall on league table rankings that has not diminished. 148 ibid, W4-289 149 Garber (ibid, W4-291) lists only four such difficulties that lead to uncertainty in any findings of a cost-effectiveness study: “ sample variability of outcomes observed in clinical trials; uncertainty about health events occurring after the end of a trial; uncertainty about nearly every component of costs; and uncertainty about the structure of models used in the analysis”. 150 Health Care Financing Administration. ”Procedures for making coverage decisions”. Federal Register 1999; 64( 80): 22619-22625 151 BCBSA. TEC criteria (downloaded 25 October 2004 from: http://www.bcbs.com/tec/teccriteria.html)

67
patients with multiple pathologies and risk factors who were excluded in the clinical trials, and varying skill levels in the providers of hospital and follow-up care?).
MIAA believes that because many medical devices have high up-front costs, and many are embedded in surgical techniques where it is impossible to separate the skill of the surgeon and staff from the unique contribution of the device per se, these five criteria have more relevance to Australia than the imposition of PBS-style cost-effectiveness criteria, to which drugs are more suited because they are discrete therapeutic entities. MIAA believes that to implement healthcare technology assessment processes which mirror the extensive activities of bodies such as NICE in Europe is inappropriate. Australia should draw its evidence from as many credible international sources as possible, not create another resource-intensive apparatus which further delays patient access to useful technology. MIAA hopes that the Commission will give due consideration to other alternatives that:
• recognise that medical devices are fast-changing products that are not like drugs, and that assessments of such devices too early in the product innovation cycle are inappropriate and invalid (ANNEX 12);152
• recognise that some medical devices are used in very small numbers of vulnerable patients (such as devices used in end-stage heart disease), and that clinical trials are not a cost-effective strategy;153
• assemble evidence from all credible sources; • apply a range of criteria similar to the US Blue Cross and Blue Shield
Association guidelines summarised above, not just economic appraisals; • leave value-based decisions to the clinicians treating individual patients with
unique characteristics; • overcome the shortfalls and redundancies noted in Section 3.4.2 above; • provide safeguards and appeals processes in an improved system of
healthcare technology assessment that is transparent and non-redundant; and
• identify how any savings that might be achieved with more elaborate regulation and economic analysis (through MSAC or Schedule 5 reform) will improve health outcomes and ensure access to breakthrough technologies for the broader community.
We next turn to some of the considerations that MIAA believes should influence a future system of reimbursement of medical devices and diagnostics.
152 Other considerations are summarized in: Eucomed. ”Health technology assessment for medical devices in Europe-what has to be considered: position paper”. Paper approved by Eucomed Board on 7 July 2001 (ANNEX 12). 153 RCTs may be unnecessary, inappropriate, impossible or inadequate-see: D Black.”Why we need observational studies to evaluate the effectiveness of health care”. British Medical Journal 1996; 312: 7040

68
3.4.4 MIAA opinion on desirable alternative methods and processes of fast- tracking innovative medical technology
MIAA has reviewed four methods of healthcare technology assessment that might justify discussion in the Commission’s report, and detailed review in appropriate forums of payers, suppliers and consumers:
• methods that, with preliminary data showing the efficacy and safety of new technologies or innovations that change the site, volume, quality and outcomes of care, allow fast-track approval and early payment for such breakthrough technologies (we call this the breakthrough technology method);
• methods that systematically commence payments for new and expensive treatments and diagnostic tests conditional on agreements to pay for evaluative studies of the impact of the new interventions on patient outcomes (this is the newly proposed method of the US Medicare administration);
• methods that recognise the known limits of randomised clinical trials and which involve extensive post-marketing surveillance and use of claims databases to evaluate effectiveness and safety in large populations (we call this extended post-marketing surveillance database evaluation); and
• methods that recognise the device industry’s hidden value-add component noted earlier.
Breakthrough technologies: In 2004, the US Medicare administration announced its intent to pay for cost-effective medical devices, drugs and diagnostics.154 The US government did not adopt the UK NICE process in its proposals to determine cost-effectiveness. Instead, Medicare will pay for new and expensive treatments and diagnostics when the patients are enrolled in clinical trials. Officials hope that this move will encourage large numbers of Medicare patients to enter such studies. As a result, the first randomised trials to evaluate the use of PET scans for patients with suspected Alzheimer’s disease are likely to begin late this year. On 28 September 2004, Medicare indicated its intent to pay for implantable defibrillators in hundreds of thousands of CHF patients, provided the patients are enrolled in a national registry. Similar registries are proposed for carotid artery stents and for obesity treatments. The use of registries is not new in Australia where, as we have noted above, surgeons and proceduralists have taken a lead in creating registries for cardiovascular and orthopaedic surgery. Payment on entry to clinical trials : One issue not yet resolved with this US approach is who will pay for the clinical trials and the registries. The US government believes that manufacturers, foundations and professional groups should pay for this research. 154 See for example: G Kolata. ”Medicare covers treatments with a catch”. New York Times 5 November 2004 (downloaded 6 November 2004 from: http://www.nytimes.com/2004/11/05/health/05medicare.html )

69
The US Medicare proposals outlined above offer some insight on how registries might evolve. Based on the precedent of federal government funding for ASERNIP-S to create selected registries, MIAA believes that the government and health insurers should fund the creation of registries according to specific criteria and only for technologies that have the potential to generate large expenditures with uncertain health benefits for patients. A registry is not an appropriate response for all technologies. Registries and other post-marketing surveillance data on use of devices: Better post-marketing surveillance may prove to be a cost-effective alternative to mandating clinical trials for all new interventions in the belief that RCTs must be the gold standard. The poor external validity of the RCT should be assessed against the natural experiments that are possible with large databases on private health insurance (PHI) claims and Medicare benefit payment data. The restrictions of current privacy provisions on the linking of appropriate PHI claims and MBS/PBS benefits datasets should be reviewed by the Commission. Recognising the value-add component in medical devices: MIAA members provide value-adding services that are not measured in the current mechanisms and processes for assessing cost-effectiveness, yet most of those hidden value-adding components enhance the cost-effective use of technology. These components include all patient education, follow-up advice, reimbursement terms and other hidden costs met by MIAA members and not recognized in price negotiations, including the provision of instrument loan sets and consignment stock. The current methods of pricing for medical devices do not recognise a number of components that are value-adding to Australian society. First, it is not uncommon for MIAA members to invest 15% of sales revenue in support of therapy/product training, skills development, and general education of surgical and diagnostic staff. One large company provided the following data on business costs that are unique to the prostheses market.

70
Market Education Subscriptions 0.32% Training 0.30% Patient Education 0.16% Fellowships 0.31% Society Sponsorship 0.51% Meetings & Conventions 2.27% Subtotal 3.85% Market R&D Research Funding 0.10% Computer Assisted instruments 0.75% Product Registration 0.12% Clinical Trials 0.38% Consultancy – Product Development 0.50% Subtotal 1.86% Product Support Clinical Nurse 1.04% End Product Support 3.56% Instruments – loan sets 5.03% Subtotal 9.63% TOTAL 15.35%
This total excludes consignment stock held by the end-user customer base; one orthopaedics supplier estimates this cost to be 22% of its annual prostheses sales revenue. Also, within the 3.9% of sales revenue allocated to education in the table above, surgical registrar training programs and annual conferences run by the major specialties are significant. One company invests nearly 2% of annual sales in local R&D by surgeons and registrars, and the financial subsidy explicit in the exprensive, fully-maintained loan kits (instrument sets) provided to hospitals is the largest value-adding component. In the joint replacement market where 10% of procedures are revision joint replacements, the company must retain a large inventory of complex and extensive surgical instruments, reflecting a wide range of differences in patient age, procedural complexity and time since the initial replacement. Finally, the company provides about 100 oncology prostheses whose prices are subsidised from its other prostheses markets because the current pricing methods for Schedule 5 devices are based on historical precedent. Second, the current prostheses pricing system under Schedule 5 of the National Health Act focuses only on unit price (and points to increasing volumes as a problem) instead of the health and functional outcomes achieved, ignores the value-adding component, and is neither efficient nor equitable. ANNEX 13 summarises some of the value-adding components offered by device manufacturers that are not recognised in any of the reimbursement processes listed in Section 3.4.2. These value-adding components must be incorporated into a fairer method of pricing, particularly for breakthrough medical devices.

71
3.4.5 MIAA opinion on other reimbursement solutions, including central registries, budget holding, patient co-payments, proportional payments and expanded health insurance
A number of vehicles have been mooted by different academic groups as possible replacements to the current methods of reimbursement of specific technologies.155 We believe many of them will be difficult to implement, will add to the regulatory load, and create access barriers for consumers.
• MIAA has already indicated its support for registries that are funded by the payers.
• Budget-holding is a crude macro-tool for cost containment. It is a companion to processes that make rationing of access more explicit. It is not yet apparent that Australian citizens support rationing as the preferred tool, and the daily news on the impact of rigid budgeting of public hospitals is likely to deter even the most supportive of state health ministers. Budget-holding is a policy that threatens innovation in European health systems that depend on tax-based financing, and it is not friendly to high-cost medical devices even if they have acceptable health outcomes.
• Patient co-payments are a crude tool. Ability to pay has never been accepted as equitable in Australian health care and the current government has taken commendable steps to reduce the burden of co-payments for hospitals and related medical gaps by offering the 30% rebate for private health insurance. A co-payment for a PBS drug may be acceptable in the interests of ensuring more appropriate use of prescribed drugs, but a co-payment for an ICD costing $50,000 is probably not feasible.
• Proportional payments already exist in the form of co-insurance. Any proportional payment system that adds administrative complexity is to be avoided, including payments tied to income (basically means-testing), or proof of efficacy (basically tiered benefits for prostheses based on level and adequacy of evidence), or the cost of the device.
• Noting the administrative delays and committees that affect access to devices under the Schedule 5 reforms noted in Section 3.4.2, MIAA reserves its position on expansion of private health insurance except for one comment: MIAA believes that the value case for the PHI rebate depends heavily on access to innovations in hospitals and related medical practice.
3.4.6 SUMMARY MIAA accepts without question the need to regulate the safety of medical devices, drugs and other interventions. In international assessments of the other dimensions of a medical technology, MIAA can see an enthusiasm to incorporate processes that link efficacy and costs.
155 See for example: L Brown, A Walker, A-M Waters et al. “Funding of high cost biotechnology and other innovative targeted therapies under the Pharmaceutical Benefits Scheme”. Canberra, NATSEM Position Paper, 27 February 2002, 96 pages.

72
Measures such as cost-effectiveness analysis assume that all technologies can be subject to the same techniques of economic appraisal. MIAA has serious reservations about that assumption and notes that not all nations have followed the same path that created large agencies such as NICE in the UK. MIAA proposes a number of options that measure the value of breakthrough medical devices - those that change the site, volume, cost and quality of care. These options do not sit easily with the overlapping agencies that are now emerging in the regulation of efficacy and pricing of medical devices and MIAA has documented many of the incongruities that some of these agencies create for device manufacturers and patients.
73
3.5 TERM OF REFERENCE 5: EXAMINE THE IMPACT OF CHANGES IN
MEDICAL TECHNOLOGY ON THE DISTRIBUTION OF COSTS AND FINANCIAL INCENTIVES ACROSS DIFFERENT PARTS OF THE HEALTH SYSTEM, INCLUDING WHETHER ADVANCES IN ONE TECHNOLOGY AREA RESULT IN REDUCED COSTS IN OTHERS
This term of reference asks the PC to examine the impact of technological change on the different uses of resources in the health sector (which we assume here to include hospitals, long-term care, medical services, drugs and surgery), identifying economic incentives and costs that have been affected by the interaction of many technologies. Of all the terms of reference, this is the most difficult to circumscribe and justify by empirical estimates of cost shifts that may have occurred, so MIAA limits its considerations to a few broad observations. 3.5.1 Impacts of specific medical devices on the demand for other services,
and the relative costs of diagnosis, therapy and rehabilitation MIAA members have compiled a number of reports demonstrating the cost-effectiveness and cost-utility of their products. Other regulatory agencies and independent research centres in the USA, Canada and UK have published economic appraisals that demonstrate how specific devices have reduced direct costs elsewhere in the health system and also reduced the indirect costs of illness borne by patients and their families. We assume that the Commission will access those studies as it reaches its conclusions on the relative impacts of innovations with drugs, medical devices, diagnostics and processes of care that link all of them in our healthcare system. The data contained in ANNEXES 3-8 indicate that many of the new devices or diagnostics have demonstrated their cost-effectiveness. We use two examples to illustrate the impact of two very visible medical devices. Drug-eluting stents: The new drug-eluting stents (DES) have already caused some US hospitals to close their coronary bypass surgery units. The effectiveness of DES has also reduced the use of one predecessor technology, vascular brachytherapy, which was useful when more than 20% of arteries treated with old stents re-stenosed.156 It has also caused a 40% reduction in the use of balloon angioplasty in some hospitals. The drug-eluting stent illustrates the detrimental effect of silo-driven public sector budgeting on the diffusion of specific medical technologies. In Australia, surgeons in public and private hospitals use DES at different rates. One set of perceptions is that public hospital patients receive the new stents in about 30% of cases, whereas
156 D Rosenberg. “Novoste aims to broaden product line”. Wall Street Journal 19 May 2004 (downloaded on 20 May 2004 from: http://online.wsj.com/article_print/0,,SB1084911162271414811,00.html )

74
private hospital patients receive them in 70% of cases. If this is the case, is there an excessive utilisation of DES in private hospitals? There are at least three possible responses. First, budget constraints in public hospitals could cause lower usage rates. Second, while no cardiologist could ever determine in advance which particular patients would benefit more from DES, perhaps cardiologists in private hospitals consider the much reduced restenosis rates in the clinical trials of DES good evidence of its cost-effectiveness compared with other devices. The detailed case study of stents in heart disease in ANNEX 4 indicates the level and consistency of published evidence of efficacy157 and cost-effectiveness158 that might have caused them to hold such views. Third, private hospitals may enhance their competitive position in cardiovascular surgery if, as indicated by the US trend above, DES reduces the need for balloon angioplasty, brachytherapy and CABG in competing hospitals. Defibrillators: Some of the same budget cost problems that prevent access to the DES are emerging as evidence accumulates from trials of the new types of implantable cardioverter-defibrillators (ICDs) used to correct heart rhythms. This device senses irregularities in heart rhythm and then applies electric shocks to restore normal rhythm. In January 2005, the Sudden Cardiac Death in Heart Failure Trial (SCD-HeFT) reported that, in patients with NYHA class I or III CHF and left ventricular ejection fraction of 35% or less, usual drug therapy (amiodarone) had no favourable effect on survival, whereas single-lead, shock-only ICD therapy reduced overall mortality by 23%159. In 2002, an early cost-effectiveness study compared ICDs against anti-arrhythmic drugs in the treatment of survivors of serious ventricular tachyarrhythmias.160 The base cost per life-year saved was about US$67,000, with previous cost-effectiveness studies of ICDs in different patient groups reporting ratios of US$17,000- 138,000
157 See for example: DL Fischman et al., “A randomized comparison of coronary -stent placement and balloon angioplasty in the treatment of coronary artery disease”. New England Journal of Medicine 1994; 331: 496-501; PW Serruys et al., “Randomised comparison of implantation of heparin-coated stents with balloon angioplasty in slected patients with coronary artery disease”. Lancet 1998; 352: 673-681; BL Hiatt et al.,” Drug-eluting stents for the prevention of restenosis: in quest for the Holy Grail”. Catheterization and Cardiovascular Interventions 2002; 55: 409-417; JW Moses, N Kipshidze and MB Leon.” Am J Cardiovasc Drugs 2002; 2 (3): 163-172; 158 See for example: D Greenberg and DJ Cohen.” Examining the economic impact of restenosis: implications for cost-effectiveness of an antiproliferative stent”. Z Cardiol 2002;91 Suppl 3: III/137-III/143; DJ Cohen et al., “ Cost-effectiveness of sirolimus-eluting stents for treatment of complex coronary stenoses”. Circulation 2004; 110: 508-514; and RA Hill et al., “Drug eluting stents:an early systematic review to inform policy”. European Heart Journal 2004; 25: 902-919. 159 GH Bardy et al., “Amiodarone or an implantable cardioverter-defibrillator for congestive heart failure”. New England Journal of Medicine 2005; 352 (3): 225-237. This trial was responsible for the US government’s decision on 19 January 2005 to expand ICD coverage under Medicare program, costing about US$3 billion per year, the most expensive decision ever made in Medicare’s history – see: R Weiss.”Medicare to cover cardiac device”. Washington Post 20 January 2005, A01. 160 G Larsen et al.,” Cost-effectiveness of the implantable cardioverter-defibrillator versus antiarrhythmic drugs in survivors of serious ventricular tachyarrhythmias”. Circulation 2002: 105: 2049-2059.

75
per life-year saved. 161 At the American Heart Association meeting in New Orleans in November 2004, further economic evidence was presented from a randomized, placebo-controlled, three-arm trial of ICDs against standard drug therapy and placebo. It also showed that ICDs were cost-effective, with each year of extra life gained costing US$ 33,192.162 Thus we have a life-saving therapy that is also a defensible use of society’s resources according to the usually accepted benchmark measures of cost per life -year saved. This new cost-effectiveness study suggests that ICD therapy, costing less than 1% of the US federal government agency annual budget, also offers value for money in Australia, where fears have been raised by a few health insurers that the cost of ICDs will consume a disproportionately larger share of prostheses budgets in the next few years. Missing from such silo costing is any recognition of the hidden costs that fall on device manufacturers and remain uncompensated, as discussed earlier in this submission. ANNEX 13 summarises some of these hidden costs for ICDs and pacemakers. 3.5.2 Identifying the dysfunctional effects of different methods of
reimbursement and payment on access to devices that can change care patterns and health system costs
We draw to the attention of the Commission the impact of regulatory and reimbursement processes on the relative costs of different parts of the health sector.
• The regulatory systems determine the relative speed with which drugs and devices come to market, and thus their relative impacts on treatment costs and shifts in the site of care. MIAA encourages the Commission to review differences in approval times for similar drugs and devices in different health systems and to comment on how any differences may be affecting change in the health sector.
• The reimbursement systems in place affect where the devices are being used, as we noted in our comments on current shifts in hospital specialist care. It would be useful to have a Commission viewpoint on how the reimbursement systems identified in Section 3.4.2 might be influencing both the patterns of care and access of patients to innovations that improve the efficiency of resource use by shifting the site, volume and costs of care.
• User charges affect access to hospital care, drugs and devices. It would be useful to have a Commission viewpoint on how co-payments affect access,
161 See for example: BJ O’Brien et al., “Cost-effectiveness of the Implantable Cardioverter-Defibrillator: results from the Canadian Implantable Defibrillator Study (CIDS)”. Circulation 2001: 103: 1416-1421; GD Sanders et al., “Potential cost-effectiveness of prophylactic use of the Implantable Cardioverter Defibrillator or Amiodarone after myocardial infarction”. Annals of Internal Medicine 2001; 135: 870-883; MS Stanton and GK Bell.” Economic outcomes of Implantable Cardioverter-Defibrillators” Circulation 2000; 101: 1067-1074. 162 The findings were reported by Dr. Daniel Mark, Director of Outcomes Research at the Duke University Clinical Research Institute in North Carolina. The study was co-sponsored by the National Institutes of Health and by Wyeth - see G Ryerson-Cruz.” Defibrillators are cost-effective, study says”. Bloomberg News 11 November 2004.
76
and how they may constrain take-up of breakthrough drugs and devices that could change the relative use of all sites of health care and self-care.
• Studies of the quality of health care now measure quality by the extent of under-use, over-use and inappropriate use of health care. The so-called ‘quality chasm’ in US health care identified by independent experts has highlighted deficiencies in preventive care (child immunizations, influenza vaccines, and pap smears), surgery (inappropriate hysterectomies and interventional cardiovascular surgery), other acute care (antibiotic misuse and gaps in prenatal care), chronic illness management (beta-blocker under-use for CHF patients, and inadequate diabetic eye and foot exams), and general hospital care (inadequate care of CHF, preventable deaths and preventable adverse drug events). If the Commission is to reach an informed judgement on what technology has achieved, it would need to identify whether we obtain value for money from technology when under-use may be as significant as over-use or inappropriate use. Comparisons of use rates of different benchmark technologies and measures of error rates in hospitals could inform the public about the real challenges in ensuring appropriate access to breakthrough technologies.
• Finally, the impact of technology in different parts of the health sector is not independent of shortages in nurses, radiotherapists, some medical specialists and budgets. MIAA hopes that the Commission will clarify the effects of such constraints on the application of new technologies and their impact on different parts of the health sector, for instance many new devices reduce the system’s current over-dependence on scarce nurses.163
3.5.3 SUMMARY The relative impact of specific technologies is difficult to measure when restraints of regulatory approval delays, government budgets, health fund reimbursement, payment strategies, and shortages of key health personnel influence the site, volume, price and quality of care. MIAA hopes that the Commission will consider and comment on all these factors, and also on the extent to which under-use of technology in other nations may have impeded improvements in health care supply and cost.
163 E Swain. “Nursing shortages and device design; a hidden connection”. MDDI October 2004

77
3.6 TERM OF REFERENCE 6: INVESTIGATE THE NET IMPACT OF
ADVANCES IN OVERALL AND INDIVIDUAL HEALTH TECHNOLOGIES ON ECONOMIC, SOCIAL AND HEALTH OUTCOMES (INCLUDING EXPLORING WHICH DEMOGRAPHIC GROUPS ARE BENEFITING FROM ADVANCES IN HEALTH TECHNOLOGY), AND THE OVERALL COST-EFFECTIVENESS OF HEALTHCARE DELIVERY
MIAA comments on this Term of Reference are restricted to points that have been made elsewhere in this submission. 3.6.1 Net impact of access to medical technology, particularly those devices
identified in this submission The devices identified in this submission affect the care of all age groups, and it is impossible in our view to specify who has benefited the most over the last few decades of rapid technological diffusion. Available health data do not allow such estimates to be made with any precision. That said, we draw two conclusions from the data presented in this submission. First, specific technologies have been shown to cause 1-2% reductions in the quality-adjusted costs of some health disorders (Section 3.2). Second, the projected impacts of current and future technology noted in Section 3.3 will fall on all age groups and on many more disorders, and many of the impacts will occur within the next 20 years. 3.6.2 Limitations of cost-effectiveness analysis in assessing net impacts For reasons detailed in Sections 3.4 and 3.5 of this submission, MIAA has strong doubts that we can compare the relative worth or net impacts of specific technologies using the calculus of cost-effectiveness and league table rankings. We hope that the Commission will comment on the dangers of so doing. 3.6.3 MIAA comment on data gaps and methodologies affecting the
measurement of the full economic impact of medical technologies In Sections 3.1 and 3.2 of this submission, we commented on gaps in Australian data that force reliance on US datasets to give us guidance on the major cost drivers of healthcare and the future burden of ageing, chronic illness and disability. We hope that the Commission will comment on data deficiencies that impede or forestall policy research on the current and projected impact of the different drivers of expenditure identified in FIGURE 1 of this submission. Medical technology certainly has costs, but also benefits that often go unmeasured.
78
3.6.4 SUMMARY: MIAA’s views of the impact of government policies and consumer expectations, and the Productivity Commission’s pivotal role
MIAA understands that government policies are shaped by the expectations of patients and the general public. We are hopeful that the Commission will comment on available survey data showing the willingness of citizens in most nations to pay more for health care, particularly new data from EU nations showing that the general public realizes that tax-based healthcare places demonstrable limits on access.164 The release on 24 November 2004 of the Commission’s draft report on the economic impact of ageing will no doubt focus public debate on the choices that Australia faces in paying for the care of an ageing population. Section 3.2 of our submission suggests that ageing alone is not the major driver of healthcare expenditures, which means that we need to focus on some of the other cost drivers and on the potential influence of breakthrough technologies on rising healthcare costs. It is clear that if we are to develop better forecasts of the impact of medical technology (including technologies not covered in this submission), Australia needs more sophisticated technology-scanning and innovation strategies that will ensure access to innovative devices in future. Other nations have embraced such tools.165 MIAA believes that the Commission’s report from this study will be influential and will shape the debate on the role of medical technology in Australian society. MIAA is willing to contribute to the debate and hopes that this submission will assist the Commission to signal the core issues.
164 See for example: Source: Stockholm Network. Impatient for change: European attitudes to health care reform. London, The Stockholm Network, 2004, 204 pages (at page 17). The telephone survey of 1,000 persons in each of eight nations (Britain, Czech Republic, France, Germany, Italy, Netherlands, Spain and Sweden) took place in the period 26 January -22 February 2004. 165 See for example; A Lohnberg et al. “Studying innovation strategies for future medical technologies: conceptual framework and methodologies for the FORMAKIN project: Work Package 3.” Centre for the Studies of Science, Technology and Society, Twente University, The Netherlands, April 1999 (see: http://www.anglia.ac.uk/hae/satsu/tser.htm )

79
ANNEXURES
80
ANNEX 1: OVERVIEW OF THE MEDICAL DEVICES AND DIAGNOSTICS INDUSTRY
MIAA represents the interests of manufacturers, importers and distributors of medical devices and diagnostic reagents in Australia. Between them, MIAA members distribute over 85% of the non-pharmaceutical products used in the diagnosis, prevention or treatment of injuries or disease. Products range from familiar items such as syringes and wound dressings through to high-technology implanted devices, hospital capital equipment, sophisticated diagnostic products, self-care items and laboratory consumables. The following “industry profile” has been developed from survey data and information provided by members: • More than 10,000 people are directly employed by the industry in Australia • It is estimated there are more than half a million different medical devices &
diagnostic products • Domestic sales amounted to $2.9 billion in 2003 • Export sales were $600+ million over the same period • There are over 1100 sponsors who include medical devices on the Australian
Register of Therapeutic Goods • Of these sponsors, 120 are members of MIAA and represent more than 85%
of the dollar turnover in the industry • 15% of the MIAA membership has a company turnover of more than $50
million • Member companies invest heavily in ancillary services including training
doctors and other medical personnel, attendance during surgical procedures, patient education, servicing equipment and supply of supplementary equipment to support implant surgery
• In 2003-04 MIAA conducted 50 professional development training programs
for 1000 people employed in our highly specialised industry

81
3M Australia Abacus Diagnostics International Abbott Australasia Abbott Diagnostics Division Advanced Medical Optics Advanced Surgical Technologies AGEN Biomedical Alaris Medical Systems Alcon Laboratories (Australia) Allergan Australia AMBRI AMS American Medical Systems Analytica ANS (Australia) Ansell International Asquith Diagnostics AstraZeneca AtCor Medical Atrium Australia – Pacific Rim Australian Laboratory Services Australian Medical & Scientific B Braun Australia Banksia Scientific Company Bayer Australia Bard Australia Bausch & Lomb (Australia) Baxter Healthcare Beckman Coulter Australia Becton Dickinson bioMérieux Australia bioMD Biomet Australia Bio-Rad Laboratories Biotronik Australia Blackaby Diagnostics Boots Healthcare Australia Boston Scientific Corporation Cardinal Health Australia Cardio Research Cellestis CIBA Vision Cochlear Coloplast Comvita Health ConvaTec Cook Australia CooperVision Hydron Corin (Australia) Craftmatic CYTYC (Australia) Dade Behring Diagnostics DePuy Australia Device Technologies Australia dj Orthopaedics Draeger Medical Australia Edwards Life Sciences Endocorp Enlightened Therapies
MIAA MEMBERS Femcare Australia Fresenius Medical Care Australia Gambro GE Medical Systems Gelworks Genzyme Australasia Guidant Australia Helena Laboratories (Australia) Immuno Diagnostics Impedimed Incision Medical Integrated Sciences Pty Limited JDC-BIO Johnson & Johnson Medical Johnson & Johnson Pacific KCI Medical Australia Kimberly-Clark Australia Pty Limited Life Therapeutics Link Orthopaedics Australia Linvatec Australia LMT Surgical LR Instruments Mathys Orthopaedics MDS Diagnostics Medchem Surgical Mede Group Medical Specialties Australia Medigard Medipac Scientific Medtronic Australasia Mentor Medical Systems Australia Merck Microgenics Diagnostics Molnlycke Health Care Mondeal Medical Systems N Stenning & Co Neich Medical Occupational & Medical Innovations Ortho-Clinical Diagnostics Otto Bock Healthcare Pan Bio Point of Care Diagnostics Portland Orthopaedics Proteome Systems Roche Diagnostics Australia Rockeby BioMed Sirtex Medical Smith & Nephew Smith & Nephew Surgical Spectra-Medics Spectrum Ophthalmics St. Jude Medical Australia Stryker Australia Surgical House
Synthes Australia Terumo Corporation Tornier Tuta Healthcare Tyco Healthcare Australia Ulco Medical Unitract Unomedical Ventana Medical Systems Ventracor Visiomed Group Vital Diagnostics W. L. Gore and Associates Welch Allyn Australia Zimmer Australia ASSOCIATE & AFFLIATE MEMBERS Acrapack API-TEK Commercial Eyes Covance Exel (Australia) Logistics George Walck & Associates Hahn Healthcare Recruitment HAMADAA (Affiliate) Healthcare Placement Solutions Health Technology Analysts HIBCC Medical Intelligence Pharmaceutical Professionals Regulatory Concepts Remark Management Robert Forbes & Associates Spectrum Technologies Steritech Sue Akeroyd & Associates

82
ANNEX 2: TERMS OF REFERENCE FOR THIS PRODUCTIVITY COMMISSION STUDY: THE IMPACT OF ADVANCES IN MEDICAL TECHNOLOGY ON HEALTHCARE EXPENDITURE IN AUSTRALIA
The Productivity Commission is requested to undertake a research study detailing and explaining the impact of advances in medical technology on public and private healthcare expenditure, and the associated costs and benefits for the Australian community. Technology is defined here in broad terms, encompassing physical equipment, instruments and pharmaceuticals, clinical procedures, knowledge and support systems within which health care is provided. In undertaking the study the Commission is to: (1) Identify the key drivers of medical technology demand. (2) Identify the net impact of advances in medical technology on healthcare
expenditure over the past ten years. (3) As far as practicable, identify the likely impact of advances in medical technology
on healthcare expenditure over the next five to ten years, and identify the areas of significant potential growth.
(4) Identify existing mechanisms and processes for ensuring cost-effectiveness in the use of medical technology, and any gaps in these processes.
(5) Examine the impact of changes in medical technology on the distribution of costs and financial incentives across different parts of the health system, including whether advances in one technology area result in reduced costs in others.
(6) Investigate the net impact of advances in overall and individual health technologies on:
• economic, social and health outcomes, including exploring which demographic
• groups are benefiting from advances in health technology; and • the overall cost effectiveness of healthcare delivery.
The Commission is to have regard to:
• recent substantive studies undertaken elsewhere; • international experience in ensuring cost effectiveness of health care; • the established economic, social, health and environmental objectives of the
Government; and • community expectations of appropriate healthcare provision.
83
ANNEX 3: NEW DIAGNOSTIC TOOLS FOR PNEUMONIA
Disease burden Atypical pneumonia caused by either L. pneumophilia, M. pneumoniae or C. pneumoniae
• #1 reason for a visit to the doctor and receipt of prescription in the US and Australia.
• Estimated 9 million cases pneumonia worldwide • 20% require hospitalisation, and up to 15% of those hospitalized die • There are no rapid and reliable diagnostic methods • Hospital stays can be 3 - 7 days in length hence the associated financial
burden • 50% of aetiology remains unknown
Based on US figures, pneumonia is the third most frequent reason for hospitalisations (births are first and heart disease is second). Although the majority of pneumonias respond well to treatment, the infection can still be a very serious problem. Together with influenza, pneumonia is the sixth leading cause of death in the USA and is the leading cause of death from infection. Established treatments Treatment is commonly empirical, causing resistances (e.g. 25% penicillin resistant S. pneumoniae)
• Antimicrobial therapy: Treat with a beta-lactamase plus macrolide or quinolone and observe for 48 hours to 7 days.
• Other: order chest x-ray, sputum culture, Gram stain and 2 sets of blood cultures.
Severity varies widely depending on individual factors, including the following –
• Hospitalised patients: mortality rates are higher for those who develop pneumonia whilst already hospitalised,
• Older adults: lower survival rates in the elderly, particularly those with other medical problems.
• Very young children: early infant and about 20% stillborn deaths are due to pneumonia. Small children who develop pneumonia may also run the risk of developing lung problems in adulthood,
• Pregnant women • Impaired Immune Systems: particularly serious, notably AIDS patients • Serious medical conditions: very dangerous with those who have diabetes,
cirrhosis, sickle cell anaemia, multiple myeloma and those who have had their spleen removed.

84
Unmet clinical need Amplified testing offers improved clinical value through:
• Increased sensitivity for Mycoplasma pneumoniae diagnosis because IgM alone is not as sensitive as paired sera (1) and IgM or paired sera is not as sensitive as PCR methods (sens. 5.6%, 8.5%, 11.3%) (2). The use of internal amplification controls is indispensable and the use of throat swabs is a very good method for diagnosis of M. pneumoniae (2)
• Increased Sensitivity and Standardization for Legionella pneumophilia with nucleic acid amplification (NAA) resulting in four additional positives from multiplex PCR (3) whereas there is considerable interlaboratory variation of traditional culture technique (4). The difference of a test in “research” setting vs. clinical lab affects the sensitivity and specificity of the test and thus standardized NAA assays will be a “major advance” in Legionella diagnosis (4). NAA along with urinary antigen is likely to be best initial testing strategy with relevant time to results (4).
Clinical benefits of new technology Nucleic Acid Amplification tests for the detection of the pathogens causing atypical pneumonia tests provides additional diagnostic information to enable doctors to make the decision to either continue or modify therapy. Using these tests may provide reductions in cost (pharmacy, length of stay), reductions in the rates of antibiotic resistances and improved patient outcomes. BD ProbeTec™ ET Atypical Pneumonia Molecular Assays The BD ProbeTec 166 ET System has redefined the use of amplified probes in molecular biology. This system utilises BD proprietary isothermal amplification technology and Strand Displacement Amplification (SDA) combined with an energy transfer (ET) detection method. BD ProbeTec™ ET Legionella pneumophilia DNA Amplified Assay is based on real-time nucleic acid amplification technology (SDA). The Legionella assay is designed for the detection of L. pneumophilia (serogroups 1-14) and performs amplification and real-time detection in a one-hour assay format. Cost implications The BD ProbeTec ET System offers real-time amplification with simultaneous detection. Its compact design allows testing in a single room, so an additional costly laboratory is not required. Staff easily learn the workflow procedure and the innovative closed reagent system saves on cost. The BD ProbeTec ET System is designed to enhance productivity through increased instrument throughput, optimal workflow and decreased time to result. To
166 Trademark Becton Dickinson Pty Ltd
85
improve result integrity through SDA sensitivity, pre-dispensed dried reagents an amplification control to identify inhibitory specimens have been incorporated.
• With a one hour assay, the BD ProbeTec ET system can process six runs per shift, from 1 to 94 specimens per run and achieve up to 564 patient results per shift. The system has only one moving part which ensures the utmost in reliability for amplified probe systems.
• High throughput will support an ever-expanding menu of clinically relevant assays.
• Barcode support and LIS connectivity save time and eliminate errors. • Predispensed dry reagents are ready to go. No mixing or dispensing. No
chance of contaminating the liquid master mix. Patented dried reagent technology offers long shelf life.
• Colour-coded assay design negates the possibility of running the wrong test on the wrong specimen.
• In accordance with recommendations by worldwide clinical laboratory organizations, the BD ProbeTec ET System offers an amplification control to monitor each specimen for the presence of an inhibitor.
References 1. Analysis of Complement Fixation and Commercial Enzyme Immunoassays for
Detection of Antibodies to Mycoplasma pneumoniae in Human Serum, Thacker, W., Clinical and Diagnostic Laboratory Immunology September 2000 (n=64 adult)
2. Comparison and Evaluation of Real-Time PCR, Real-Time Nucleic Acid Sequence-Based Amplification, Conventional PCR, and Serology for Diagnosis of Mycoplasma pneumoniae, Templeton, K., JCM, Sept. 2003 (n=106 adult)
3. Development and Clinical Evaluation of an Internally Controlled, Single Tube Multiplex Real-Time PCR Assay for Detection of Legionella pneumophilia and Other Legionella Species, Templeton, K., JCM, Sept. 2003 (n=84)
4. Diagnosis of Legionella Infection, Murdoch, D., Clinical Infectious Diseases, Dec. 20
5. Analytical Sensitivity, Reproducibility of Results, and Clinical Performance of Five PCR Assays for detecting Chlamydia pneumoniae DNA in Peripheral Blood Mononuclear Cells, Mahoney, J., JCM July 2000 (n=148 adult)

86
ANNEX 4: CORONARY HEART DISEASE AND STENTS
1. INTRODUCTION The primary feature of coronary heart disease (CHD) is myocardial ischaemia or insufficient blood supply to the heart itself. However, the common underlying problem in the various forms of CHD is atherosclerosis, a complex process that affects the coronary arteries, the vessels supplying blood to the heart. In atherosclerosis, plaques build -up on the inside surface of the artery. When CHD is advanced, plaques can narrow the channel through which the blood flows and cause myocardial ischaemia. This narrowing is called stenosis. Stenoses can be single or multiple and can affect one or more of the heart’s three main arteries (Mathur 2002). Atherosclerosis of the coronary arteries presents in a variety of ways, including stable or unstable angina, acute myocardial infarction (MI) or sudden death. 1.1 Natural history of coronary heart disease Although the precise process of atherosclerosis is not fully understood, a variety of factors are associated with increased risk of developing CHD. Patients with one or more of these risk factors are likely to develop angina or have heart attacks and need lifelong management of their disease. Risk factors & clinical management Although CHD is the most common form of heart disease in Australia, a large part of the death, disability and illness caused by CHD is preventable. The main behavioural risk factors for CHD are a high-fat and excess-energy diet, physical inactivity and cigarette smoking. Diabetes is a high risk factor for CHD, and also shares several of the CHD risk factors (Mathur 2002). Most Australians have at least one of the major identifiable risk factors for CHD outlined above and 40% have at least two (Mathur 2002). In individuals for whom preventive measures are unable to halt disease progression to clinical signs and symptoms, clinical management of CHD becomes necessary. The management of patients with CHD aims to reduce mortality and morbidity and improve quality of life; the aims are to relieve pain and other symptoms, reduce complications and identify and treat patients at high risk of further events. Emergency treatment is critical for those suffering acute events such as heart attack. For those with more stable symptoms, options for treatment include drug therapy and a range of coronary revascularisation procedures, such as percutaneous coronary interventions (PCI) and coronary artery bypass grafts (CABG), to ensure adequate blood flow to the heart. 1.2 Incidence and prevalence of coronary heart disease in Australia CHD incidence is difficult to measure as disease onset is not always clear-cut, many cases are treated in the community and in Australia there is no system of compulsory notification. For these reasons it is considered practicable only to

87
measure the incidence of major acute coronary events (events that result in either an acute admission to hospital or death) and these represent only a proportion of the total CHD cases in Australia. In 1999-2000 an incidence rate of 605 major acute coronary events per 100,000 population aged 40-90 years was reported (Mathur 2002). The incidence rates for these major CHD events have fallen about 3% per year or a total of 20% between 1993-1994 and 1999-2000. Mortality from CHD also fell over the same period by 30%. These declines occurred across all age groups for persons aged 40-90 years (Mathur 2002). In the 1995 National Health Survey, 2.8% of respondents reported they had heart disease, which would translate into 506,461 Australians (Mathur 2002). Between 1989-1990 and 1995, there was no significant change in the prevalence of self-reported CHD in Australia, although the estimated number of cases increased from 450,175 to 506,461. This increase in CHD of 12% was faster than the population growth over the same period (7%). In 1995, more men than women reported they had CHD, with men being 1.6 times more likely to have heart disease than women. The prevalence of CHD increases rapidly with age, from less than 0.5% in those aged less than 44 years to 17% for those aged 75 years or older. 1.3 Recent trends in risk factors and clinical management of coronary heart disease The reduction in the incidence of major acute coronary events in Australia is likely to be due to a combination of:
• Reduced overall levels of CHD risk factors; and • Improved medical care for those at higher risk of heart attacks.
Specifically, the considerable progress made in CHD is likely to be related to:
• Lower risk factors levels, especially large declines in tobacco smoking and blood pressure levels since the 1980s;
• Large increases in the prescription of lipid lowering and blood pressure lowering drugs during the 1990s;
• Increased revascularisation using PCI with stenting during the 1990s, leading to reduced rates of CABG overall, reduced CABG for PCI failure in the short term (Davies & Senes 2002) and reduced restenosis and need for reintervention in the longer term; and
• Rapid increases in revascularisation procedures such as PCI and CABG for the treatment of acute MI during acute hospital admissions in the 1990s (Mathur 2002, Davies & Senes 2002).
However, over a similar period there has also been:
• Rapid increases in the prevalence of overweight people, obesity and diabetes; and
• No change in the prevalence of high blood cholesterol levels despite the increased use of lipid lowering drugs (Mathur 2002).

88
Therefore, despite the gains already made, significant challenges remain in the prevention and clinical management of the growing number of Australians with CHD. Future gains can be expected from the continued combination of prevention and innovations in medical care. 2. DISEASE BURDEN CHD is the most common cause of sudden death in Australia and it contributes significantly to morbidity and reduced quality of life. However, the burden of CHD does not fall equitably and there are groups within the Australian population, such as older persons and indigenous Australians, for whom the CHD burden is higher. A comprehensive assessment of the amount of ill health and disability or burden of disease in Australia in 1996 was undertaken by the AIHW (Mathers & Penn1999). The resulting report estimated that CHD was:
• The leading cause of overall burden of disease for both men and women, accounting for 12.4% of the total;
• The leading cause of mortality burden for both men and women; and • The tenth most common cause of disability burden for men and the twelfth
most common cause for women (Mathers & Penn1999). In the future, there will also be a growing number of elderly Australians among whom CHD is highly prevalent. Even now, as CHD predominantly affects middle-aged and older Australians, the majority of hospital admissions for heart attacks and cardiac procedures occur among people aged 60 years and over; 70% of acute MI hospital admissions, 73% of CABG procedures and 61% of PCI procedures. These proportions are substantial, especially as those aged 60 years and over account for only 16% of the total population. Almost all CHD deaths (92%) occur among the population aged 60 years and over, with the population aged 80 years and over accounting for over 50% of those deaths (NHPA 1999). 3. UNMET CLINICAL NEED The impact of CHD on individuals and the community is experienced through all phases of disease management. However in general, most of the impact of CHD is felt from the onset of signs and symptoms leading to a diagnosis of either angina or heart attack (acute MI). 3.1 Individual impact For individuals diagnosed with angina, drugs can be given to reduce the episodes of chest pain and to relieve it when it occurs (Mathur 2002). For angina refractory to drug therapy, or where drug therapy is not tolerated, the burden of disease is considerable for individual patients, their families and the community. Episodes of angina reduce the functional capacity of the individual, decrease quality of life (QOL) and may result in repeated hospital admissions for acute medical treatment (Greenberg & Cohen 2002).

89
When they occur, heart attacks need cardiopulmonary resuscitation (if there is cardiac arrest), rapid transit to hospital, drugs to inhibit and dissolve the blood clot and external ‘countershock’ if the heart’s rhythm is critically disturbed. Other drugs are usually given to reduce the immediate and long-term damage to the heart (Mathur 2002). Persistent damage to the heart after a heart attack can lead to:
• Supraventricular and ventricular tachyarrhythmias and other conduction disturbances which contribute significantly to morbidity and mortality; and
• Heart failure, which may result in sudden death and has a poor long-term prognosis.
For patients who have persistent blockage of the coronary arteries, either in the case of angina or after a heart attack, there are several procedures to revascularise the heart by removing or by-passing the blockages. The revascularisation procedures are PCI and CABG. PCI is a minimally invasive procedure and CABG is invasive surgery and requires opening the patient’s chest and using blood vessel grafts to bypass blockages in the coronary arteries. However, as well as the discomfort and inconvenience of these procedures, both PCI and CABG are accompanied by a variety of peri- and post-procedural risks. The major peri-procedural risks include acute MI (1.2% for PCI), death (0.8% for PCI, 2.6% for CABG) and bailout or repeat revascularisation (Davies & Senes 2002, AIHW 2002). In Australia, one in five (19.5%) PCIs were repeat procedures in 1999 and 1.0% of PCI procedures required bailout CABG in the same hospital admission (Davies & Senes 2002). From registry data it is known that 90% of repeats in 1999 were to the same lesion and, of these, 16.9% were on an unstented lesion, 71.6% were on a stented lesion and the remaining 11.5% were not specified. For CABG procedures carried out in Australia in 1998, 6% were repeats (Mathur 2002). For the individual, other adverse events associated with PCI and CABG include vascular complications, haemorrhage as a consequence of anticoagulant therapy and cerebrovascular accidents (stroke). 3.2 Community impact As previously outlined, CHD represents a considerable ill health and disability burden to Australian society. This is associated with high economic costs. These economic costs are either indirect, such as lost production due to morbidity and premature death, or direct costs to both the public and private health sectors. In the most recently available Australian health system cost data, cardiovascular disease ranked as the most expensive disease group ($3.9 billion in 1993-1994) and CHD accounted for 23% or $894 million (Mathers & Penm 1999). The majority of heath system costs for CHD are incurred by hospital in-patients (64% in 1993-1994). Medical care accounted for a further 10% and pharmaceuticals 12% of the costs of CHD in 1993-1994.

90
4. ESTABLISHED TREATMENTS: PERCUTANEOUS CORONARY INTERVENTIONS
PCI with angioplasty alone (PTCA) involves inserting a catheter with a balloon into the point where a coronary artery has been stenosed, then inflating the angioplasty balloon to reduce the obstruction. However, PTCA causes vessel injury, which initiates a healing response and leads to narrowing of the lumen of the vessel wall and hence to a high incidence (30% to 50%) of restenosis (Moses et al 2002). A high rate of restenosis results in recurrent angina and leads to a cycle of repetitive revascularisation. Studies of post-angioplasty restenosis have demonstrated both vessel remodelling and elastic recoil as principal causes of restenosis, and indicated neointimal hyperplasia (when smooth muscle cells are stimulated to proliferate by inflammatory mediators) as one of several pathological processes that contribute to it (Moses et al 2002). Restenosis after PCI is important as it is correlated clinically with recurrent angina and major adverse events in the CHD population (Weintraub et al 1993), and especially so in a diabetic subgroup (Stein et al 1995). Restenosis results in patients suffering major adverse events as well as the need for frequent repeat revascularisations. 4.1 Improved outcomes with PCI and adjunctive stenting Recent years have seen improved PCI outcomes with the introduction of bare-metal stents (BMS) (Mathur 2002). BMS provide a tubular bare metal framework in the vessel lumen which mechanically reduces the effects of elastic recoil and vessel remodelling. Therefore, BMS result in reduced acute closure and less restenosis than angioplasty alone (Davies & Senes 2002). Initially, the use of BMS was limited to bailout situations after failed PCI with angioplasty alone, however trials clearly demonstrated the superiority of BMS to PTCA with respect to restenosis in de novo coronary lesions, reducing the restenosis rate from 30-50% to about 20-30% and the target lesion revascularisation (TLR) rate to 15-20% (Fischman et al 1994, Serruys et al 1998). In terms of cost-effectiveness, PCI with BMS has been clearly demonstrated to reduce follow-up medical costs compared to angioplasty alone (Greenberg & Cohen 2002). Therefore, despite the increased cost of stents to the health system, a major contributor to the considerable progress already made in the management of CHD in Australia has been the increased use of BMS with PCI. This trend has resulted in reduced bailout CABG for PCI failure in the short term (Davies & Senes 2002), and reduced restenosis and the need for repetitive reintervention for CHD patients in the longer term, including reducing rates of invasive and costly CABG procedures. However, although BMS reduce the effects of elastic recoil and vessel remodelling, they do not decrease neointimal hyperplasia, especially within the stent. This is known as in-stent restenosis (ISR) and remains the greatest proportion of restenosis occurring after BMS implantation. Further, as outlined below, in subgroups of CHD patients (those with diabetes mellitus, longer lesions and/or in small diameter coronary vessels) the restenosis rate remains disproportionately high (Kastrati et al 1997). Thus, while BMS reduce the overall proportion of CHD patients experiencing
91
restenosis, there are still many patients locked into the cycle of costly repetitive revascularisation procedures. 4.2 Treatments for restenosis after PCI with BMS Treatments for ISR include PTCA, intravascular brachytherapy (IVB), rotational atherectomy, laser angioplasty, and repeat BMS stenting. Depending on the clinical circumstances, these treatments can be used alone or in combination. Regardless of treatment strategy, the re-restenosis rate for patients with ISR is unacceptably high (20% to 80%, depending on vessel and patient bias) (Moses et al 2002), and generally associated with increasingly complex, resource intensive and costly remedial treatments (Greenberg & Cohen 2002). The only successful treatment for ISR to date is IVB (Hiatt et al 2002). Although there is limited evidence of efficacy in de novo lesions, PCI with IVB has been shown to significantly reduce major adverse events and has interim approval as a cost-effective treatment for ISR in Australia (MSAC IVB Report 2002). However, PCI with IVB has a relatively high revascularisation rate (11.9% TLR compared to 25.9% with PCI procedures alone), meaning that a considerable number of patients remain in the cycle of angina recurrence and repeat interventions. IVB is also expensive and there are safety concerns, eg, radiation exposure (MSAC IVB Report 2002). These features, combined with the fact that, unlike most other revascularisation procedures, IVB is unable to be repeated, represent significant limitations (Moses et al 2002, MSAC IVB Report 2002). In summary, these data clearly emphasise the need for more effective de novo therapy for the prevention of ISR (Hiatt 2002). 5. PCI AND DRUG-ELUTING STENTS Many of the processes leading to neointimal hyperplasia and ISR have the potential to be modulated by pharmaceutical agents. Johnson & Johnson and other major device companies began some years ago a program to identify drugs which could reduce ISR and also be delivered locally from a stent. Local delivery of drugs is attractive for several reasons:
• The drug is delivered where and when it is needed; • Controlled delivery of the drug can be achieved by the use of stent coatings; • The potential for systemic side effects of the drug is minimised; • There is no dependence on the patient to take anti-restenosis drugs; and • There is no change to the stenting procedure.
The sirolimus-eluting stent (Johnson & Johnson) was the first drug-eluting stent (DES) to reach the market, and was launched in Australia mid-2002. This DES is based on a successful bare metal stent platform which is coated with a biocompatible polymeric film from which the cytostatic agent sirolimus is released. Sirolimus is an antibiotic with powerful anti-proliferative and immunosuppressant properties, which prevents tissue hyperplasia following stent deployment, thereby maintaining the lumen patency of coronary arteries.

92
5.1 Cost-effectiveness of the Drug Eluting Stent The sirolimus-eluting stent is a cost-effective treatment according to trial-based economic analysis performed in the US. The clinical trial used for economic analysis was the SIRIUS trial, a pivotal 1,058 patient study evaluating the safety and efficacy of the sirolimus-eluting DES. The population studied comprised a broad range of patient profiles, including many difficult to treat patients with complex lesions. The economic analysis was conducted by Dr David Cohen, Harvard Clinical Research Institute, using actual hospital in-patient and out-patient cost data, collected between initial hospitalisation and one year post-stent implantation. Over the one year follow-up period, patients who received the sirolimus-eluting stent showed significant reductions in the need for reinterventions to treat restenosis. The analysis showed that for every 100 patients treated with the DES, there were 19 fewer revascularizations and 25 fewer hospital admissions than with the conventional bare metal stent. Within the US healthcare system, fewer hospital reinterventions translates into substantial post-treatment healthcare savings and enables payers to recoup costs associated with the use of the sirolimus-eluting stent. The Medical Services Advisory Committee (MSAC) is currently reviewing the safety, effectiveness and cost-effectiveness of all drug-eluting stents available in the Australian market. This review will take into account resource use and costs for the Australian healthcare system. However, as previously mentioned, timely review is particularly important to ensure patient access to this new technology in the public sector, where expenditure is constrained by limited budgets. 6. REGULATORY AND FUNDING ISSUES Drug-eluting stents are listed on the Australian Register of Therapeutic Goods as Class III devices. The current funding of DES is inequitable. In the private sector, DES are funded through the Prostheses Schedule, a list of implantable items that health insurance funds reimburse private patients for. However in the public sector, although DES are available, patient access to this new and effective technology has been restricted due to budgetary constraints. 7. CONCLUSIONS DES are the first drug-device technologies in Australia to address the three major components of post-angioplasty restenosis simultaneously, i.e. reducing vessel recoil, remodelling and neointimal hyperplasia, and thereby reducing the need for expensive revascularisation procedures. Since restenosis, and specifically the associated angina and need for repeat (often numerous) revascularization procedures, also has a significant impact on patients’ quality of life, DES are also cost-effective technologies.

93
8. REFERENCES
AIHW 2002. Australia’s Health 2002. Canberra: Australian Institute of Health and Welfare http://www.aihw.gov.au Curfman GD Sirolimus-eluting coronary stents N Eng J Med 2002; Vol 345, No 23: 1770-1771 Davies J & Senes S 2002 Coronary angioplasty in Australia 1999. AIHW Cat. No. CVD 19 (Cardiovascular Disease Series No. 19). Canberra AIHW and National Heath Foundation of Australia http://www.aihw.gov.au Fischman DL, Leon MB, Baim DS, et al A randomised comparison of coronary stent placement and balloon angioplasty in the treatment of coronary artery disease. N Eng J Med 1994;331:496-501 Greenberg D, Cohen DJ Examining the economic impact of restenosis: implications for the cost-effectiveness of an antiproliferative stent. Z Kardiol 91:2002;Supp3,III/137 – III/143 Hiatt BL, Ikeno F, Yeung AC, et al Drug-eluting stents for the prevention of restenosis: In quest for the Holy Grail. Cath & Cardio Inter 2002;55:409-417
Kastrati A, Schomig A, Elezei S, et al. Predictive factors of restenosis after coronary stent placement. JACC 1997;30(6):1428-1436 Mathers C & Penm R. Health systems costs of cardiovascular diseases and diabetes in Australia 1993-94. AIHW Cat. No. HWE 11. Canberra: Australian Institute of Health and Welfare. 1999. (Health and Welfare Expenditure Series No. 5). http://www.aihw.gov.au Mathur S 2002 Epidemic of coronary heart disease and its treatment in Australia. Cardiovascular Disease Series No. 20. AIHW Cat. No. CVD 21. Canberra: Australian Institute of Health and Welfare. http://www.aihw.gov.au
94
Moses JW. Kipshidze N. Leon MB. Perspectives of drug-eluting stents: The next revolution. American Journal of Cardiovascular Drugs. 2002;2(3):163-172).
MSAC 2002. Intravascular brachytherapy – Assessment Report. August 2002 – Medical Services Advisory Committee application 1041. http://www.msac.gov.au/
NHPA 1999. Cardiovascular Health. A report on heart, stroke and vascular disease. Canberra: National Health Priority Areas. AIHW Cat. No. PHE 9. http://www.iahw.gov.au Serruys PW, van Hout B, Bonnier H, et al Randomised comparison of implantation of heparin-coated stents with balloon angioplasty in selected patients with coronary artery disease (Benestent II). Lancet 1998;352:673-681 Stein B, Weintraub WS, Gebhart St, et al Influence of diabetes on early and late outcome after percutaneous transluminal coronary angioplasty. Circulation 1995;91:979-989 Weintraub WS, Ghazzal Z, Douglas JS, et al Long-term clinical follow-up in patients with angiographic restudy after successful angioplasty. Circulation 1993;87:831-40

95
ANNEX 5: TREATING INSULIN-DEPENDENT DIABETES MELLITUS BY CONTINUOUS INSULIN INFUSION
INSULIN-DEPENDENT DIABETES MELLITUS (IDDM) IDDM, also known as Type 1 diabetes or juvenile diabetes, is a disease that results from the body's failure to produce insulin - the hormone that "unlocks" the cells of the body, allowing glucose to enter and fuel them. This is most often the result of an autoimmune process in which the body's immune system attacks and destroys the insulin producing islet cells of the pancreas. Since glucose cannot enter the cells, it builds up in the blood and the body's cells literally starve to death. Unfortunately, diabetic symptoms do not appear until 80 to 90% of the islet cells have been destroyed. The onset therefore cannot be prevented and there is no cure. Insulin therapy must be used to replace or supplement the patient's diminished or absent capacity to generate insulin. Frequent blood glucose monitoring at least 4 times per day is necessary. IDDM manifests itself most frequently between 5 to 7 years old and at the time of puberty, though it can occur later in life. The serious and unfortunate complications of this disease include; - diabetic retinopathy, potentially resulting in blindness - diabetic nephropathy, potentially resulting in chronic renal failure - diabetic neuropathy, where damage to the peripheral nervous system can
potentially lead to amputation - cardiovascular disease potentially resulting in stroke and myocardial infarction About 50% of those who develop IDDM die of complications before reaching 50 years of age. IDDM accounts for 10% ( 70,000 sufferers reported in 2003) of known diabetes in Australia. The burden of diabetes in Australia is estimated to be as high as $1.4 billion. GLYCEMIC CONTROL AND DIABETIC COMPLICATIONS Since the first clinical use of insulin therapy in 1923 by MacLeod, Banting and Best, the focus of all physicians treating patients with Diabetes Mellitus has been to achieve "normal blood sugars". This “Holy Grail” has been based on and reinforced by studies showing that the onset and severity of complications experienced by diabetics can be attributed to the duration of the disease and the level of glycaemic control. One such study was the Brussels Study, reported in 1978, where the Belgian Pirart studied 4398 patients for up to 25 years, assessing both glycaemic control and the

96
appearance of diabetic complications. His striking observations showed that the frequency and severity of such complications as diabetic nephropathy, diabetic retinopathy and diabetic neuropathy were indeed related to the duration of the disease and to cumulative glycaemic control. The introduction in 1978 of quantitative methods for assessing both glycaemic control i.e. glycosolated haemoglobin (HbA1C) and endpoints of diabetic complications i.e. stereoscopic fundus photography, albumin excretion rates, electrophysiologic measures of nerve function and self monitoring of blood glucose prompted further studies to demonstrate these observations. One such study was the Wisconsin Study, an epidemiologic study, conducted in 1979/80 of 2990 patients for the incidence of diabetic retinopathy . This study showed a strong significant relationship between HbA1C and the incidence of retinopathy and progression to proliferative retinopathy as well as macular oedema and visual loss. It further showed a link between an elevated HbA1C and the appearance of gross proteinuria and microalbuminuria , the loss of both tactile and temperature sensitivity in hands and feet, mortality from ischaemic heart disease and lower extremity amputation. It became evident that intervention studies were needed to establish the best means of achieving and maintaining near normal glycemia with the aim of decreasing the frequency and severity of these complications. Though some studies (e.g., The Stockholm Intervention Study) demonstrated a more uniform beneficial effect of intensive therapy (i.e., injection of insulin three or more times daily) in patients with established complications, these studies were not convincing of the need of intensive therapy to prevent or ameliorate these complications . Thus the development in 1983 of the study hailed as "the most important clinical study ever conducted in the field of diabetes", the Diabetes Control and Complications Trial (DCCT). THE DIABETES CONTROL AND COMPLICATIONS TRIAL (DCCT) This randomized multicenter (29 sites) study in North America of 1441 subjects over 10 years (1983-1993) examined whether intensive treatment of insulin dependent diabetes mellitus with a goal of maintaining blood glucose levels close to normal range could decrease the frequency and severity of diabetic microvascular and neurological complications. Subjects were randomly assigned to one of 2 groups, either the intensive therapy group where they received their insulin by means of multiple, 3 or more, injections daily (MDI) or by continuous subcutaneous insulin infusion (CSII), or the conventional insulin therapy group which received 1 or 2 injections of insulin daily . The average HbA1C of all subjects pre study was 9.0%. During the study, the conventional therapy group achieved a median HbA1c of 9.1% with a mean blood

97
glucose of 12.8mmOl/L whilst the intensive therapy group achieved a vastly improved median HbA1C of 7.2% with a mean blood glucose of 8.6mmOl/L . The hope of the researchers was that intensive therapy would bring about a 35-40% reduction in the incidence of retinopathy, however, the results dramatically exceeded the expectations of researchers - - diabetic retinopathy was reduced by 70.3% - microalbuminuria was reduced by 60% - neuropathy was reduced by 64% - macrovascular events, both cardiac and peripheral vascular were not significantly
reduced, though when combined there was a 41% reduction in events - risk of elevated low-density lipoprotein cholesterol was reduced by 35% The results of the study showed unequivocally that intensive therapy effectively delays the onset and slows the progression of complications seen in patients with Insulin Dependent Diabetes Mellitus. Understandably, the recommendation of the researchers, and the worldwide accepted standard of treatment of IDDM since, was that patients with IDDM be treated with intensive therapy regimens with the goal of maintaining their glycaemic status as close to normal as safely possible. Due to some adverse events experienced by the intensive therapy group during the study, the researchers did caution however, that this treatment requires close monitoring, - - there was a 3 fold increase in severe hypoglycaemia i.e. episodes requiring
assistance of another person to recover - an accompanying 3 fold increased risk of coma or seizure - increased weight gain - no difference in the rate of diabetic ketoacidosis (DKA) The quest therefore, has become to provide intensive therapy safely and minimise the potential adverse elements of this treatment. EPIDEMIOLOGY OF DIABETES INTERVENTIONS AND COMPLICATIONS RESEARCH GROUP (EDIC) STUDY At the completion of the DCCT, the trial patients were given the opportunity to enter the Epidemiology of Diabetes Interventions and Complications Research Group (EDIC) study. The purpose of the study was to compare the long-term effects of the conventional therapy or intensive therapy provided during the DCCT on the development of more advanced retinal and renal complications of diabetes. 1375 patients from the DCCT were followed up for 4 years with annual HbA1C levels, retinal examinations and renal evaluations.
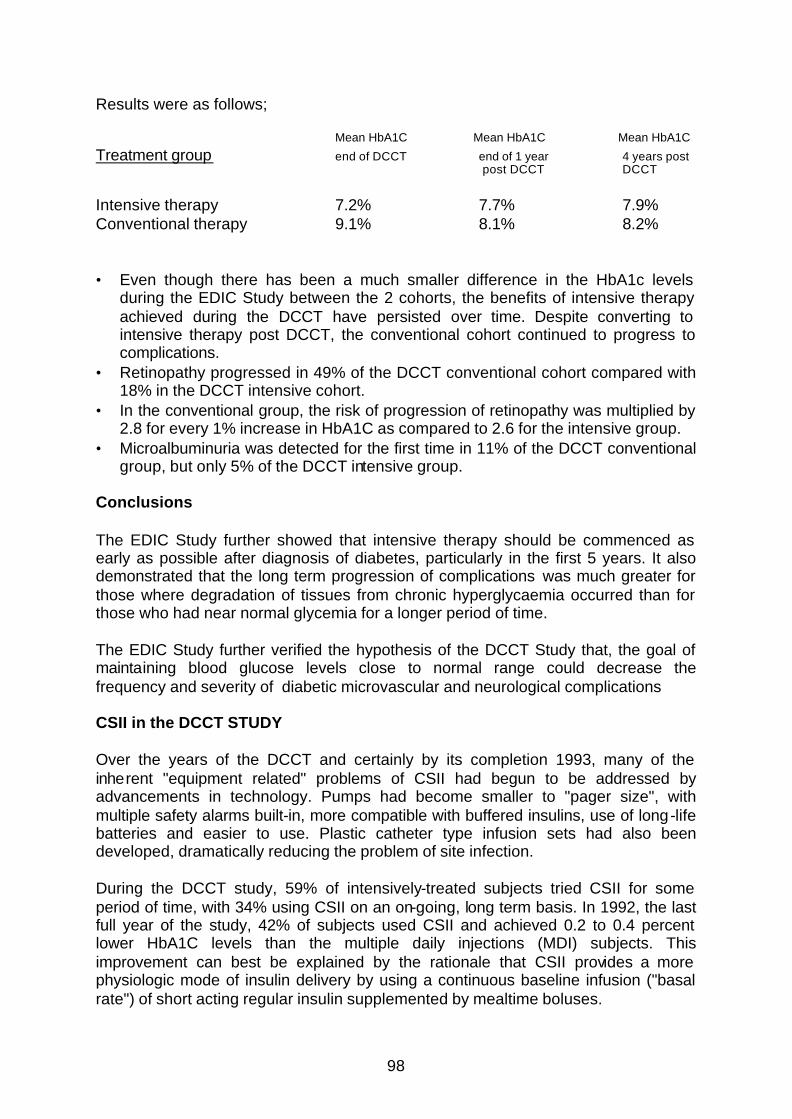
98
Results were as follows;
Mean HbA1C Mean HbA1C Mean HbA1C
Treatment group end of DCCT end of 1 year 4 years post post DCCT DCCT
Intensive therapy 7.2% 7.7% 7.9% Conventional therapy 9.1% 8.1% 8.2% • Even though there has been a much smaller difference in the HbA1c levels
during the EDIC Study between the 2 cohorts, the benefits of intensive therapy achieved during the DCCT have persisted over time. Despite converting to intensive therapy post DCCT, the conventional cohort continued to progress to complications.
• Retinopathy progressed in 49% of the DCCT conventional cohort compared with 18% in the DCCT intensive cohort.
• In the conventional group, the risk of progression of retinopathy was multiplied by 2.8 for every 1% increase in HbA1C as compared to 2.6 for the intensive group.
• Microalbuminuria was detected for the first time in 11% of the DCCT conventional group, but only 5% of the DCCT intensive group.
Conclusions The EDIC Study further showed that intensive therapy should be commenced as early as possible after diagnosis of diabetes, particularly in the first 5 years. It also demonstrated that the long term progression of complications was much greater for those where degradation of tissues from chronic hyperglycaemia occurred than for those who had near normal glycemia for a longer period of time. The EDIC Study further verified the hypothesis of the DCCT Study that, the goal of maintaining blood glucose levels close to normal range could decrease the frequency and severity of diabetic microvascular and neurological complications CSII in the DCCT STUDY Over the years of the DCCT and certainly by its completion 1993, many of the inherent "equipment related" problems of CSII had begun to be addressed by advancements in technology. Pumps had become smaller to "pager size", with multiple safety alarms built-in, more compatible with buffered insulins, use of long-life batteries and easier to use. Plastic catheter type infusion sets had also been developed, dramatically reducing the problem of site infection. During the DCCT study, 59% of intensively-treated subjects tried CSII for some period of time, with 34% using CSII on an on-going, long term basis. In 1992, the last full year of the study, 42% of subjects used CSII and achieved 0.2 to 0.4 percent lower HbA1C levels than the multiple daily injections (MDI) subjects. This improvement can best be explained by the rationale that CSII provides a more physiologic mode of insulin delivery by using a continuous baseline infusion ("basal rate") of short acting regular insulin supplemented by mealtime boluses.

99
EVOLUTION OF INSULIN PUMP THERAPY The idea of continuous insulin delivery first emerged in the early 1960's when Dr Arnold Kadish, Los Angeles fashioned a device that would permit such insulin delivery. This device however was the size of an army backpack making it impractical for everyday use. The consensus that insulin replacement should be more physiologic grew during the 70's, leading investigators to further pursue the means of achieving this by first employing continuous intravenous insulin delivery, and then by the more practical means of continuous subcutaneous insulin delivery. In 1978, Keen and Pickup from Guy's Hospital, London and in 1979 Tamborlane and Felig of Yale, first reported the successful use of portable pumps for CSII. These early studies demonstrated that CSII, when used with self-monitoring of blood glucose proved the feasibility of achieving near normal glycaemic control. The term for this type of therapy became known as "Intensive Insulin Therapy". Insulin pumps are used extensively around the world now with 200,000 pump users in the USA, 21% of Type 1 and 1,500 users, 2% of Type 1 in Australia with usage of insulin pumps, particularly in children, increasing daily. The reason for the increase in usage is the need to gain better control of blood glucose than is possible for most whilst using injection therapy. There are numerous studies now that show the overwhelming benefits and cost savings gained by better control of blood glucose. ADVANTAGES AND UTILITY OF CSII The insulin pump of today provides a wide range of basal and bolus delivery options with memory and alarms. The insulin is stored in the pump in a reservoir and the insulin is delivered to the patient by means of an infusion set implanted into the subcutaneous tissue of the abdomen. The insertion cannula is either a Teflon cannula or a stainless steel needle that has to be replaced by the patient at intervals of 3 to 5 days. The patient is able to disconnect from the pump temporarily for bathing or exercise. The major advantages of CSII when compared with multiple daily injections, are derived primarily from its pharmacokinetic effects which include;
- using only rapid-acting regular insulin, appears to provide a more
consistent, reproducible absorption pattern. Absorption variance from 10-52% occurs with each injected dose of intermediate -acting insulin compared to 2.8% with regular insulin over a 24 hour period. This variability accounts for 80% of the change in the amplitude of glucose excursions from day to day, Lauritzen et al 1983.
- using only one body region (abdomen) for insulin delivery avoids
interregional variation of insulin absorption. These differences have been
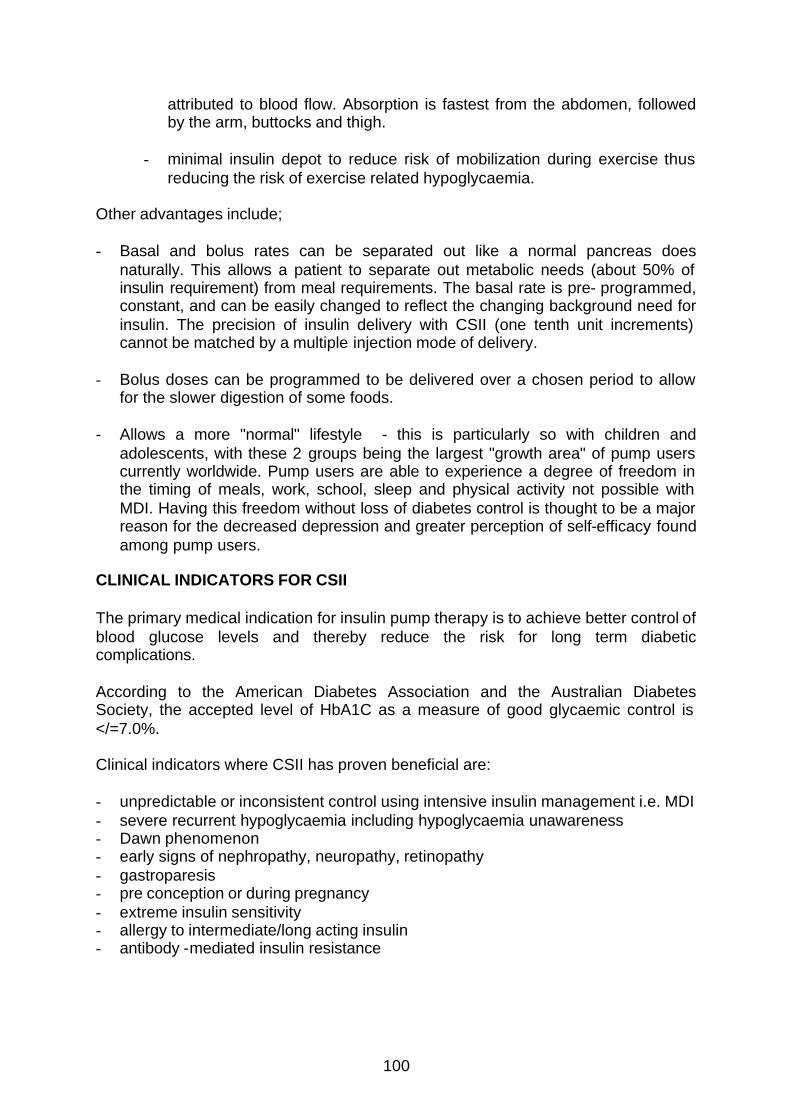
100
attributed to blood flow. Absorption is fastest from the abdomen, followed by the arm, buttocks and thigh.
- minimal insulin depot to reduce risk of mobilization during exercise thus
reducing the risk of exercise related hypoglycaemia. Other advantages include; - Basal and bolus rates can be separated out like a normal pancreas does
naturally. This allows a patient to separate out metabolic needs (about 50% of insulin requirement) from meal requirements. The basal rate is pre- programmed, constant, and can be easily changed to reflect the changing background need for insulin. The precision of insulin delivery with CSII (one tenth unit increments) cannot be matched by a multiple injection mode of delivery.
- Bolus doses can be programmed to be delivered over a chosen period to allow
for the slower digestion of some foods. - Allows a more "normal" lifestyle - this is particularly so with children and
adolescents, with these 2 groups being the largest "growth area" of pump users currently worldwide. Pump users are able to experience a degree of freedom in the timing of meals, work, school, sleep and physical activity not possible with MDI. Having this freedom without loss of diabetes control is thought to be a major reason for the decreased depression and greater perception of self-efficacy found among pump users.
CLINICAL INDICATORS FOR CSII The primary medical indication for insulin pump therapy is to achieve better control of blood glucose levels and thereby reduce the risk for long term diabetic complications. According to the American Diabetes Association and the Australian Diabetes Society, the accepted level of HbA1C as a measure of good glycaemic control is </=7.0%. Clinical indicators where CSII has proven beneficial are: - unpredictable or inconsistent control using intensive insulin management i.e. MDI - severe recurrent hypoglycaemia including hypoglycaemia unawareness - Dawn phenomenon - early signs of nephropathy, neuropathy, retinopathy - gastroparesis - pre conception or during pregnancy - extreme insulin sensitivity - allergy to intermediate/long acting insulin - antibody -mediated insulin resistance

101
IMPROVEMENT IN GLYCEMIC CONTROL Insulin pump therapy can improve glycaemic control in individuals with Type 1 diabetes who are unable to achieve acceptable control on multiple daily injection regimens. These people have often been given the labels of "hard to control", "labile" or "brittle". Every Endocrinologist has patients of this type, and so there are many studies that have shown the efficacy of CSII when compared with the usual multiple daily injection (MDI) regimens in treating this group of patients. These studies have shown a reduction in HbA1C of 0.5 to 2.0% is maintained for up to 5 years post CSII initiation. In Australia, as CSII is still in its infancy, being reintroduced in 1997 and its widespread usage adopted again in 1999, Australian studies on its efficacy are limited. Currently there are 1,500 patients currently on insulin pumps in Australia. In a pilot study of 11 patients conducted by Dr Caroline Clarke et al at Monash Medical Centre, Melbourne, August,1999, patients went from an HbA1C of 9.0% on commencement of CSII to an HbA1C of 8.1% after 6 months therapy - a reduction of 0.9% and was sustained at 8.2% after 9 months . They concluded that CSII is a feasible means of treatment and improves glycaemic control with a high degree of acceptance and compliance. A further study of 35 patients by Dr Tim Jones at the Princess Margaret Hospital for Children in Perth, (2000) has shown an improvement of 1.2% overall from a mean HbA1C of 8.6% on MDI to 7.4% on CSII. Again, based on DCCT figures this constitutes a reduction in the risk of diabetes complications in these patients by greater than half. Overseas studies however, where CSII has been used for the past 20 years, and where patient numbers are far greater, the proof of efficacy of this treatment is outstanding. There are currently approximately 300,000 patients on insulin pumps worldwide. Bell and Ovalle ,USA (2000), in a retrospective chart review over 7 years, compared the HbA1C of 58 patients over a three year period before CSII and 3 years after CSII therapy initiation (excluding the first year of CSII). Overall there was a drop of 0.7% from 8.4% whilst on MDI to 7.7% after CSII. During the 3 years on CSII, HbA1C levels gradually improved, whilst during the 3 years on MDI, HbA1C levels gradually worsened. Results; Patients HbA1C on MDI HbA1C on CSII P value All patients 8.4 7.7 .001 Had HbA1C <8 during MD I 7.2 6.9 .04
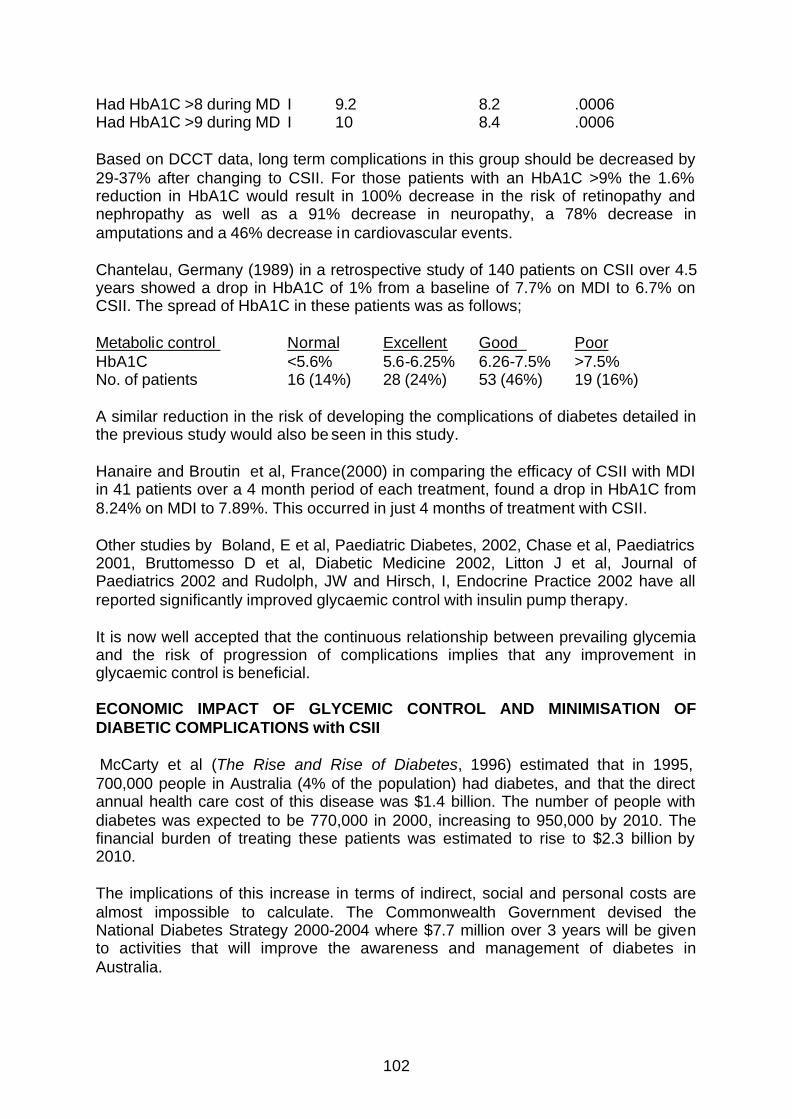
102
Had HbA1C >8 during MD I 9.2 8.2 .0006 Had HbA1C >9 during MD I 10 8.4 .0006 Based on DCCT data, long term complications in this group should be decreased by 29-37% after changing to CSII. For those patients with an HbA1C >9% the 1.6% reduction in HbA1C would result in 100% decrease in the risk of retinopathy and nephropathy as well as a 91% decrease in neuropathy, a 78% decrease in amputations and a 46% decrease in cardiovascular events. Chantelau, Germany (1989) in a retrospective study of 140 patients on CSII over 4.5 years showed a drop in HbA1C of 1% from a baseline of 7.7% on MDI to 6.7% on CSII. The spread of HbA1C in these patients was as follows; Metabolic control Normal Excellent Good Poor HbA1C <5.6% 5.6-6.25% 6.26-7.5% >7.5% No. of patients 16 (14%) 28 (24%) 53 (46%) 19 (16%) A similar reduction in the risk of developing the complications of diabetes detailed in the previous study would also be seen in this study. Hanaire and Broutin et al, France(2000) in comparing the efficacy of CSII with MDI in 41 patients over a 4 month period of each treatment, found a drop in HbA1C from 8.24% on MDI to 7.89%. This occurred in just 4 months of treatment with CSII. Other studies by Boland, E et al, Paediatric Diabetes, 2002, Chase et al, Paediatrics 2001, Bruttomesso D et al, Diabetic Medicine 2002, Litton J et al, Journal of Paediatrics 2002 and Rudolph, JW and Hirsch, I, Endocrine Practice 2002 have all reported significantly improved glycaemic control with insulin pump therapy. It is now well accepted that the continuous relationship between prevailing glycemia and the risk of progression of complications implies that any improvement in glycaemic control is beneficial. ECONOMIC IMPACT OF GLYCEMIC CONTROL AND MINIMISATION OF DIABETIC COMPLICATIONS with CSII McCarty et al (The Rise and Rise of Diabetes, 1996) estimated that in 1995, 700,000 people in Australia (4% of the population) had diabetes, and that the direct annual health care cost of this disease was $1.4 billion. The number of people with diabetes was expected to be 770,000 in 2000, increasing to 950,000 by 2010. The financial burden of treating these patients was estimated to rise to $2.3 billion by 2010. The implications of this increase in terms of indirect, social and personal costs are almost impossible to calculate. The Commonwealth Government devised the National Diabetes Strategy 2000-2004 where $7.7 million over 3 years will be given to activities that will improve the awareness and management of diabetes in Australia.

103
In NSW alone, in 1998/99 there were 3357 inpatient admissions for patients with Diabetes with complications ( DRG K60A and K60B), at a total cost of $10,776,528. There were 391 outpatient visits for complications of diabetes at a further cost of $256,169. Diabetes is the leading cause of blindness, accounts for 75% of non traumatic amputations, and is the cause of up to 50% of all patients who reach end stage renal failure, requiring either renal dialysis and/or renal transplantation. In NSW, the cost of renal dialysis (DRG L61Z) is $76,284 per patient per year, whilst a renal transplant (DRG Lo1A and B) is $30,000 per patient. Amputation (DRG F11 and B) costs approximately $17,000 without rehabilitation costs, whilst procedures for retinopathy (DRG C03Z) cost $3400 per admission. (NSW 1998/99 Hospital Cost Data Collection) Any improvement therefore in glycaemic control, minimising the risk or progression of these very expensive complications of diabetes is indeed a cost saving worth pursuing. Again, because of the limited number of CSII patients in Australia, data on the cost savings of this treatment and intensive therapy is not available, however, there have been some studies from the USA showing same. Gilmer, et al in 1997, using regression analysis estimated the relationship between glycaemic control and medical care charges for 3,017 adults with diabetes over a 4 year period. Charges for care included inpatient and outpatient services. He found that the cost of medical care was closely related to the HbA1C level. 3 year estimates of charges ranged from US$10,439 for patients without comorbid conditions to US$44,417 for those with heart disease and hypertension. Medical care charges increased significantly for every 1% increase above HbA1C of 7%. For a patient with an HbA1C of 6%, successive 1% increases in HbA1C resulted in cumulative increases in charges of 4,10,20 and 30%. The increase in charges accelerated as the HbA1C value increased. The study concluded that based on the economic data, clinicians should assign high importance to the pursuit of a low HbA1C and work aggressively to maintain an HbA1C of 7% or below and that any investment in clinical systems to improve diabetes care may benefit both payers and patients Selby et al, 1997, in a study comparing costs accrued in 1994 by 85,209 members of a health fund, reported an annual cost of 2.4 times more for patients with diabetes i.e. US$3,500 more than those of matched non diabetic subjects. He concluded that effective disease management programs that aim to prevent complications could potentially lead to cost savings in treating people with diabetes. Bruttomesso D, et al Diabetic Medicine, 2002 showed that outpatient consultations and hospital admissions significantly reduced with pump therapy, this shows a cost saving also.

104
The DCCT Research Group in 1996, reported the estimated lifetime benefits and costs of intensive diabetes management. By implementing intensive therapy with the reduced HbA1C, gains of 920,000 years of sight, 691,000 years free from end-stage renal disease, 678,000 years free from lower extremity amputation and 611,000 years of life at an additional cost of $4.0 billion over the lifetime of the population. Intensive therapy represents a good monetary value for the investment. In 2000, USA Government provided for Medicare to provide the CSII pump and consumables to those patients who required it, but were not insured. The criteria that patients must meet before being funded by USA Medicare for CSII are: - Patient must have Type 1 Diabetes as evidenced by Serum C-peptide level of
<0.5mcg/L. - Patient must have been on multiple daily injections (at least 3 per day) with
frequent self adjustment for a minimum of 6 months. - Patient performs a minimum of 4 self-monitoring blood glucose tests per day for 2
months prior to CSII and meets one of the following criteria; - Patients most recent HbA1C>7% - Patient has history of frequent hypoglycaemia - Patient has wide fluctuations in blood glucose before meal times - Patient experiences Dawn phenomenon with fasting blood glucose levels
exceeding 12mmOl. - Patient must have a history of severe glycaemic excursions
France also instituted a program in November 2000 where the Government will provide CSII to patients meeting the above criteria. The US and French policies of providing CSII for those patients who fulfil a strict criteria where intensive therapy of multiple daily injections has not given adequate glycaemic control, confirms the CSII as a treatment or therapy in these cases. The Australian Federal Government in the June 2004 Budget also recognized the benefits of insulin pump therapy by listing the insulin pump consumables on the National Diabetes Supply Service whereby patients can now purchase their consumables at a greatly subsidized cost. FUTURE INSULIN PUMPS The insulin pumps of the future are here now – we are moving into an era of “smart” pumps that have built in calculators that suggest a dose of insulin that the patient should have based on their current blood sugar, the food that they are eating and the target that you want the blood sugar to be within. The pump takes into account the insulin that is still active in the patient’s body at the time to prevent the patient taking insulin again and “overdosing”. Most pumps now have this ability. This type of

105
calculator assists the patient in selecting the correct dose to keep their blood sugar within the appropriate target range.
A study by Gross and King et al, 2003 showed that this type of calculator did assist the patient to stay within glycaemic range.
USING TECHNOLOGY TO “TREAT TO TARGET” It is well recognized that though there have been great improvements in the methods of testing blood glucose to try and keep the blood glucose in tight control, it is still very difficult to do this with conventional testing which involves pricking the finger up to 8 times per day. Boland E et al, Diabetes Care 2001 states that ”despite excellent HbA1c levels and target preprandial glucose levels, children often experience nocturnal hypoglycaemia and postprandial hyperglycaemia that are not evident with routine monitoring.” Chico A et al, Diabetes Care 2003 reported that “ increased frequency of finger sticks (over 8 per day) could lead to similar diagnostic results and therapeutic decisions as continuous data, but are difficult to implement in clinical practice”.
The continuous data Chico refers to is from the Medtronic MINIMED 167 Continuous Glucose Monitoring System (CGMS). This system (not yet included on the ARTG) involves a glucose sensor, which is inserted in the subcutaneous tissue, which continuously measures the interstitial glucose level and the monitor records a mean value every 5 minutes. The data is downloaded to a computer where graphs, tables and charts can be printed of the results. A study by Chico A, et al Diabetes Care, 2003 in a crossover study of 105 patients showed that using a CGMS dramatically improved control by reducing HbA1C from 9.4% to 7.2% in 3 months. Boland E, et al, Diabetes Care 2001 reported that using the results of the CGMS found that “almost 90% of the peak postprandial levels after every meal were 10mmol/L above target and almost 50% were 16mmol/L” and tha t “additionally the CGMS revealed frequent and prolonged asymptomatic hypoglycaemia (glucose 3.3mmol/L) in almost 70% of the children”. Weintrob et al, Paediatrics 2003 found that the CGMS could serve as an educational tool to decrease the rate and magnitude of hypoglycaemia. Tavris DR et al of the Epidemiology Branch of the FDA in Diabetes Technology & Therapeutics 2004 looked at the public health impact of the CGMS in an assessment of the literature. He reported that CGMS could reduce the frequency of hypoglycaemic episodes and that using CGMS for treatment adjustment results in 0.3% reduction of HbA1c vs. conventional self-monitoring blood glucose i.e. 1/6 of the reduction demonstrated in DCCT resulting in 1 additional year of sight, the absence of end-stage renal disease, the absence of lower extremity amputation, and extra years of life, all of which could potentially be cost saving..
167 Trademark Medtronic Australasia Pty Ltd
106
Endocrinologists are now looking to this technology for devices that will give them and the patient more information to allow them to “treat to target” – the target now being an HbA1c of 6.5% (AACE and EASD) to minimize the risks of the complications that result from poor control. The Medtronic Guardian 168 (not yet included on the ARTG) is one of the first of such products, which uses the same sensor as the CGMS that continuously monitors interstitial glucose and has alarms that alert the patient that their blood glucose is out of range reading. A study by Bode B et al, Diabetes Technology & Therapeutics reported that the use of the Guardian with alarms demonstrated a decrease in the duration of hypoglycaemic excursions by –27.8 minutes and a decrease of 9.6 minutes in the duration of hyperglycaemic excursions . The Medtronic Guardian RT has as well as alarms to alert the patient that their blood glucose is out of range, a real-time readout of the blood glucose. Professor Moshe Phillip presented at the ISPAD Meeting in Singapore, November 2004 early results of a randomized, controlled, multicenter clinical study, the Guard Control Study in Europe to assess whether the use of the real-time values of the Guardian RT can improve poor glycaemic control i.e. HbA1c of >8.1%. Preliminary results have shown that patients adjusted their diabetes management and that These will be the first of similar products that will appear on the market in the next few years. Such products will further the enhance the benefits gained in providing the patient with more information about their blood glucose to enable tighter glycaemic control. SENSOR AUGMENTED PUMPS AND THE ARTIFICIAL PANCREAS Glucose sensors that transmit glucose readings direct to insulin pumps by radio frequency and display the glucose reading and the trend on the screen are now in clinical trials. Dr Lynda Fisher, Los Angeles Children's Hospital reported at the ISPAD Meeting in Singapore, November 2004 that in a 10 patient trial where they wore the Medtronic sensor augmented pump that patients reduced their HbA1c from 8.1% to 7.8% after only 30 days. The real time readout provided patients and health team member’s glucose trends to facilitate treatment changes and thereby improve glycaemic control. Such devices will allow many patients to safely achieve glycaemic targets and prevent complications. Integrated implanted glucose sensors and implanted insulin pumps as well as implanted sensors with integrated external pumps are also in clinical trials and early results show that a true artificial pancreas where the sensor will “sense” the glucose and the pump will “deliver” the insulin will be possible and available on the market within 5 to 10 years.
168 Registered trademark Medtronic Australasia Pty Ltd

107
ANNEX 6: TOTAL KNEE ARTHROPLASTY: IMPACT ON HEALTHCARE COSTS AND PATIENT OUTCOMES
Disease burden There are a number of diseases states or conditions that require total joint replacement. Osteoarthritis: This is a degenerative joint diseased primarily caused by over use or damage to the knee joint. It accounts for 96.2% of all primary knee replacements. Meniscal cartilage provides a cushion between the two bony surfaces (articulating surfaces) of the femur (thigh bone) and the Tibia (Shin bone). When this cartilage degenerates due to the arthritic state or by overuse or damage, the femoral and tibial surfaces rub and are the primary source of pain.
If left untreated patients experience increased pain with limited mobility, which significantly impacts lifestyle. It is typically a disease of the aged.
Rheumatoid Arthritis: This is a chronic inflammation of the joint and is an autoimmune disease.
It typically affects other joints but manifests itself primarily in the weight bearing joints of the knee and hip. It is not age related, thought the symptoms progress with age.
Trauma and deformities: These conditions see the cartilage worn away due to excess forces caused by trauma or misalignment of the bones. While not specifically age related, age allows for the progression of the condition.
Established treatments The non-surgical treatments include Anti-inflammatory medication and injections into the joint capsule. The surgical treatments include
• Menisectomy: Removal of remaining damaged meniscus that may be causing pain
• Osteotomy: The realignment of the tibia or femur, which relieves pressure from arthritic side of the knee.
• Unicompartmental Arthroplasty: The replacement of the effect portion of the knee with implants made from metal and polyethylene
• Bicompartmental or total knee arthroplasty: The complete replacement of the articulation surfaces of both the femur and tibia This procedure accounts for the vast majority of surgical treatment and is one of the most successful of any surgical procedure.
108
Unmet clinical need There are two aspects of total knee arthroplasty that have undergone little change within the last 10-15 years. Implant design: Implant design: the basic design rationale of the total knee implant was to primarily relieve pain caused by the osteoarthritis and restore basic kinematic function. This was sufficient for an older less active demographic, but with increasing activity at the time of surgery and a subset of younger patients, there is a need for an implant that can cater for higher flexion activities and yet not reduce the life of the implant. Recent studies have shown that there are a number of activities that patients want to partake in but have difficulty in doing so. These activities are typically high flexion activities. Most modern knee implants only cater for activities where the flexion angle required does not exceed 120 degrees. This excludes a number of activities that are commonly performed by this patient demographic. It has been shown that patients who have a high range of motion (>110 degrees) before surgery tend to lose this range of motion after surgery. This may be due to either the conservative approach the surgeon takes with rehabilitation and directions to the patient with regard to lifestyle changes (i.e. kneeling or playing golf), or inherent deficiencies in the design of current implants that do not permit flexion angles of that magnitude. An implant design needs to be developed that can cater for and in some situation facilitate high flexion activities while not compromising the life of the implant
Surgical Technique: The instrumentation and size of incision has changed little within the last 15 years. The size of the incision required and subsequent trauma to the soft tissues of the knee requires a significant recovery period. In particular the degree of trauma to the quadriceps muscle group has a significant impact on the length of recovery.
The average hospital length of stay (LOS) of the older procedures is between 5 and 8 days. This has not reduced to the same extent seen with other major surgical procedures. This period is primarily needed to recover from the pain caused by the surgical procedure and not the original disease state. Clinical benefits of new devices The new devices enable a surgeon to perform a total knee replacement through an incision 80-120mm in length, whereas traditional surgical techniques require an incision length of 250-300mm. Currently in the US where such instrument systems are used routinely, average lengths of stay have fallen from 4 to 1.5 days169. This provides for significant savings to the hospital. In addition, functional outcomes that are deemed important by patients are improved.170 169 AJ Tria and TM Coon.” Minimal Incision Total Knee Arthroplasty: Early Experience”. Clinical Orthopaedics and Related Research 2003; 416: 172-188 170 JM Weiss, PC Noble, MA Conditt et al., “What functional activities are important to patients with knee replacements?” Clinical Orthopaedics and Related Research 2002; 404, 172–188.
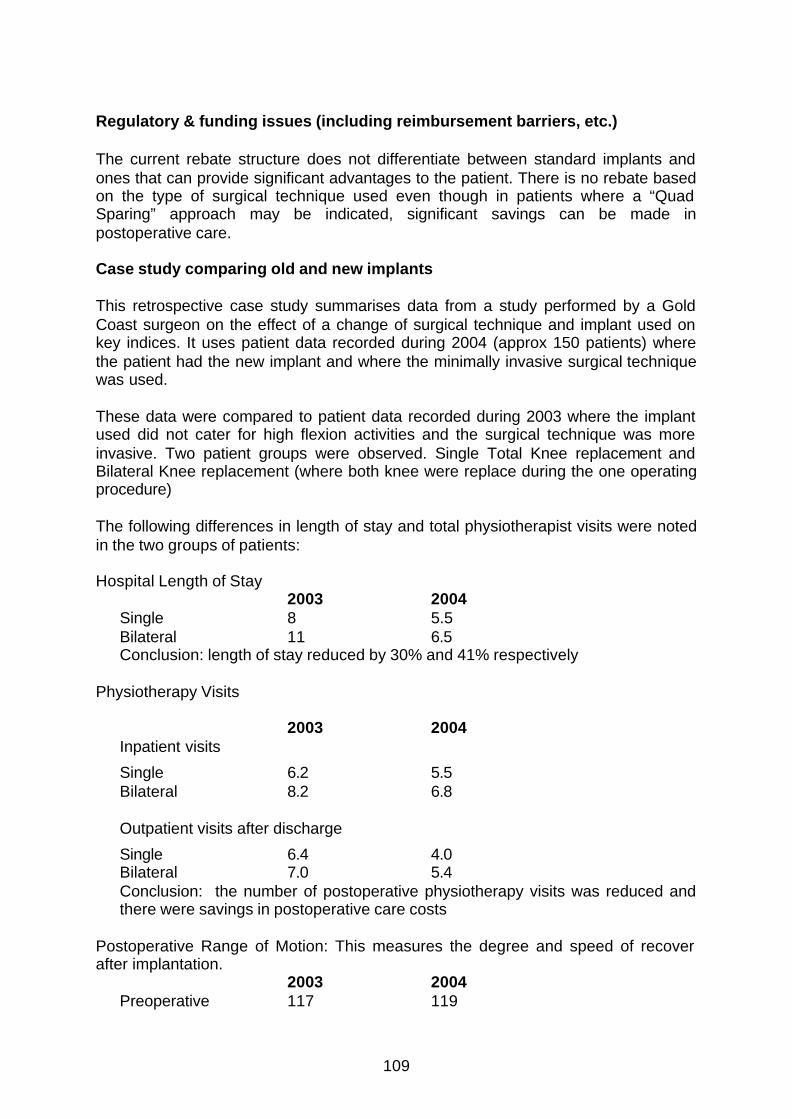
109
Regulatory & funding issues (including reimbursement barriers, etc.) The current rebate structure does not differentiate between standard implants and ones that can provide significant advantages to the patient. There is no rebate based on the type of surgical technique used even though in patients where a “Quad Sparing” approach may be indicated, significant savings can be made in postoperative care.
Case study comparing old and new implants This retrospective case study summarises data from a study performed by a Gold Coast surgeon on the effect of a change of surgical technique and implant used on key indices. It uses patient data recorded during 2004 (approx 150 patients) where the patient had the new implant and where the minimally invasive surgical technique was used. These data were compared to patient data recorded during 2003 where the implant used did not cater for high flexion activities and the surgical technique was more invasive. Two patient groups were observed. Single Total Knee replacement and Bilateral Knee replacement (where both knee were replace during the one operating procedure)
The following differences in length of stay and total physiotherapist visits were noted in the two groups of patients: Hospital Length of Stay
2003 2004 Single 8 5.5 Bilateral 11 6.5 Conclusion: length of stay reduced by 30% and 41% respectively
Physiotherapy Visits
2003 2004 Inpatient visits
Single 6.2 5.5 Bilateral 8.2 6.8 Outpatient visits after discharge
Single 6.4 4.0 Bilateral 7.0 5.4 Conclusion: the number of postoperative physiotherapy visits was reduced and there were savings in postoperative care costs
Postoperative Range of Motion: This measures the degree and speed of recover after implantation.
2003 2004 Preoperative 117 119

110
At 3 months 104 128.5 Conclusion: with the change in technique, patients are not only achieving their preoperative range of motion but also exceeding it by an average of 10 degrees. This is a significantly improvement on the previous technique Independent Mobility (number of days postop when able to walk without assistance) 2003 2004 Single 5.2 3.7 Bilateral 7.2 5.4 Conclusion: Patients regain independent motion much earlier with the new implant and technique.
Summary The new implant and surgical technique led to faster patient recover and return to active daily life, and it reduced hospital and rehabilitation costs.

111
ANNEX 7: COMPUTER-ASSISTED KNEE REPLACEMENT
Introduction Every year, 600,000 people worldwide, undergo total knee replacement (TKR) surgery. In Australia, the annual incidence of knee replacement was 140.8 per 100,000 population, this equates to 28,003 knee replacements in 2003. Of these, 3639 (9.3%) involved revisions to existing surgery (Australian Orthopaedic Association National Joint Replacement Registry Annual Report 2004). The total number of knee replacements in Australia outnumbered hip implants for the first time in 2003. Knee implant volumes grew by 7.3% compared to the previous year. A number of recent articles report that much of the western world is currently ageing, and as the outcomes of TKR improve, surgeons are more prepared to operate on younger patients; therefore the market for arthroplasty is increasing. Between 1983 and 1996, the number of TKRs performed in Finland grew at a rate of 20% annually (Rissanen et al 1996a). To maintain a record and assess the success of knee replacement surgery, several countries have recently followed the lead of Sweden and Norway, including England and Wales, Australia, New Zealand and Canada have recently established registries. These show that rates of surgery have increased rapidly over the last 10 years. The overall market for knee replacement is currently predicted to reach sales of US$925 million in 2009, an annual growth of 5.2% (Frost and Sullivan 2003). Clearly, the demand for TKR is rapidly increasing, however, the level of provision is not. TKR is a very expensive procedure, which requires considerable post-surgical care and, occasionally revision surgery. Furthermore, it requires a high degree of surgical expertise that takes many years to acquire. As the demand for TKR increases, it is essential that hospital managers are able to deliver the level of service necessary, and within a defined budget. This paper reviews the impact that computer assisted surgery (CAS) is having on knee replacement surgery, and discusses the benefits to surgeons, patients and hospital purchasers. TKR surgery Knee replacement surgery is usually required as a result of osteoarthritis, which may cause articular cartilage inside the knee joint to wear away, or mechanical abnormalities, such as fracture. In recent years the techniques and materials used have improved and the aims of TKR have changed, from reducing pain, disability and deformity to improving function and quality of life as well. Table 1 outlines the characteristics of successful TKR. Current TKR methodology TKR is a complex surgical procedure, with a risk of failure and subsequent need for revision. Considerable variation in human anatomy means that detailed anatomical information on the knee, usually provided by a pre-operative X-ray, is required. Severe deformities sometimes require a more detailed anatomical model, provided
112
by computed tomography (CT) scan. The surgeon then uses these to prepare an operational plan. During surgery, femoral, tibial and patella (optional) components are implanted into the knee. The surgeon makes an incision over the front of the knee and, using the plan, must accurately cut each of the bones, to ensure that once the components are fitted they are at the correct alignment and with the correct ligament balance, facilitating optimal functioning of the joint. It is generally accepted that accurate alignment of the femoral and tibial implant components in TKR surgery is an essential factor in the success of the procedure in terms of knee stability, post-operative pain and complications and the overall lifespan of the prosthesis. Alignment of the femoral and tibial cuts has traditionally been determined by using either an intramedullary rod inserted into the femur or an extramedullary guide, which is attached to the tibia and adjusted by eye. Following surgery, X-rays are usually taken for verification of the correct prosthesis placement. However, at this stage it is too late for any adjustments to be made. Problems associated with traditional TKR methods The results of TKR surgery are unpredictable and surgeon-dependent. In general, the more experienced the surgeon, the better the outcome. Studies suggest that TKR failures (due to loosening, instability, dislocation, fracture or infection) occur in 5-8% of cases. In addition, less serious complications lead to sub-optimal outcomes in 20-40% of cases (Delp et al 1998). Poor alignment Estimating the correct angle of the cuts required during surgery is difficult, even for experienced surgeons, and it has been estimated that radiographic planning has as much as 2° variability (Laskin 2003); translation of the plan in the actual surgery can result in even greater variations. Alignment influences stability, durability and patellar tracking. Poorly aligned implants lead to poor joint stability, reduced function, bone loss and increased pain. In addition, poor alignment often leads to early loosening of the prosthesis. Studies have shown that an inaccuracy as small as 2.5 mm in the femoral component could restrict motion by as much as 20° (Garg and Walker 1990). Coronal malalignment of ±3° has been shown to increase the incidence of prosthesis loosening from 3% to 24% after 8 years (Jeffrey et al 1991). Aglietti et al (1988) estimated that up to 40% of patients experience patellofemoral pain or limited extension after conventional TKR surgery. However, with recent advances in implant design and surgical technique, this figure may have improved. In a more recent publication, (Sparmann et al 2003) it was reported that conventional TKR surgery usually produces excellent results, however complications occur in 5% to 8% of cases because of instability, loosening, dislocation, infections or fracture. In 20% to 40% of patients there may be less serious complications such as anterior knee pain, or limited movement. Poor alignment may increase the length of recovery following TKR, leading to increased length of hospital stay, physiotherapy requirements, home support, follow-up visits (outpatient and GP) and in the worst cases, revision surgery (see below), all of which have cost implications.

113
Revision surgery In cases where the prosthesis has failed or patient outcomes are poor, revision surgery is an option. However, revision surgery is more complex than primary knee replacement, with poorer outcomes, higher complication rates and increased cost (Saleh et al 2001, Sierra et al 2003). Heck et al (1998) found that 2.2% of patients who had TKR surgery between 1985 and 1990 required revision surgery within 2 years of the initial implantation. This figure rises to 4-5% over 10 years (Ansari et al 1998, Robertsson et al 1997). In successful cases, a knee replacement generally lasts for at least 10-15 years. However, due to infection and malalignment, revision surgery is a major contributor to the overall cost of TKR. Although up to half of revisions may be required as a result of infection, one study of 212 TKR revisions found that malalignment or malposition was present in 11.8% (Sharkey et al 2002). The costs of TKR TKR is a costly procedure. In Australia, the annual industry survey provides information that allows calculation of the 2003 average implant cost (A$6,282) for an elective inpatient primary knee replacement. Bhatia and Obadare (2003) determined the total cost of follow-up assessments in 56 knee and 44 hip replacement patients. In an average follow-up of 845 days, the minimum overall cost of follow-up appointments in these 100 patients was UK£23,297, this included each patient attending an average of 3.0 outpatient visits and having 1.9 radiographs. In total, 22 patients had a problem with their joint, however, only 10 needed intervention. In the US, claims to MetLife in 1994 averaged US$28,340 for a TKR, although wide geographical variations were seen. Approximately one quarter of the costs were for physician fees (an average of US$7,150 per TKR) (Mushinski 1996). In Finland, a study of patients recruited between 1991 and 1992 estimated a mean TKR cost of US$11,500 (Rissanen et al 1997). The authors suggest that TKR is more cost-effective in younger patients (aged under 60 years), than in those who are older than 60 years. A summary of the major factors involved in TKR that contribute to the total cost is presented in Table 2. Rissanen et al (1996b, 1997) assessed the costs of hip and knee replacement surgery in Finland and found that costs relating to the length of hospital stay are the main cost driver, followed by the cost of prostheses, which account for 24% of the total. Length of hospital stay is variable, and influenced by a number of factors such as patient age (older patients remain in hospital longer) and complications such as infection, dislocation and thromboembolism. In addition, in general, the more replacements that are conducted at a hospital, the shorter the average hospital stay. Rissanen et al (1996b) found that in hospitals with low throughput (in the bottom third of the distribution, less than 120 THRs and TKRs per year) the length of stay was three days longer than in those with high throughput (in the top third of the distribution, more than 550 replacements per year). In addition, the length of stay appeared to be consistent within hospitals over time.
114
Rissanen et al (1997) also assessed healthcare costs before and after surgery, and found a significant reduction in the number of visits to physiotherapists and doctors following surgery (p<0.05). In addition, fewer patients required municipal home help or transport services in the two years after surgery, compared with the year before. Thus, cost savings occur in some areas following TKR. TKR is considered by to be a cost-effective procedure. The results of knee replacement are dramatic for those patients who have previously experienced disruption to work and family life due to their arthritic condition. Lavernia et al (1997) calculated the cost per quality of well year (equivalent to a quality-adjusted life year [QALY]) following knee arthroplasty surgery in 100 patients who underwent 127 primary knee replacements at the University of Miami. They calculated that an average single sided TKR cost US$10,701, while a bilateral TKR cost US$15,045. Despite the additional cost of bilateral TKR, the cost per QALY was similar in the two groups. At 1 year post-surgery, the cost per QALY was US$9,506 for unilateral and US$9,373 for bilateral patients, this had reduced to US$6,006 and US$5,482 at two years post-surgery, respectively. This is well below the threshold of US$30,000 per QALY considered acceptable by many health economists, and compares favourably with other procedures/treatments such as coronary artery bypass surgery (US$5,000 per QALY) and renal dialysis US($50,000 per QALY). How can CAS improve outcomes and costs of TKR? Recent advances in medical imaging, computer vision and robotics have resulted in the development of systems for CAS. CAS is established and accepted as effective and cost-effective in fields such as neurosurgery, but is still relatively new in orthopaedics. CAS is now being utilised in TKR, with the aim of maximising successful procedures by providing consistently accurate data that will help surgeons in their decision-making both before and during surgery. CAS uses navigated pointers and bone markers to produce an anatomical coordinate system for each bone. This allows the surgeon to build a custom real-time intra-operative map of an individual patient’s anatomy. This not only provides greater precision and accuracy, but also allows the surgeon to make intra-operative real-time decisions, not possible with traditional techniques. Thus important decisions concerning the position and alignment of prostheses and ligament balance can be made during the procedure, enhancing flexibility. With traditional techniques the operational plan could not be altered once surgery had commenced. CAS systems include both the hardware (surgical instruments and prostheses) and software (imaging) components required to undertake TKR. Both open and closed CAS systems are currently marketed and appear to have some benefits to the surgeon, patient and purchaser. Open systems can be used with any manufacturers instruments and joint replacement devices. Whereas closed systems offer greater ease of use and a more sequential approach to surgery as they are designed for use with one manufacturers specific implant and instrument set. With open platforms, one software purchase could, in theory, support multiple orthopaedic suppliers and therefore multiple surgeons. However, it is unlikely that the software will be compatible with all available hardware, limiting the scope for this approach.

115
The advantages of CAS and its impact on clinical outcomes A number of randomised studies have compared CAS with conventional TKR techniques. These show that CAS results in improved alignment/accuracy and greater reproducibility, compared with traditional TKR surgery (Perlick 2003, Jenny and Boeri 2001, Saragaglia et al 2001, Keifer et al 2001, Miehlke et al 2003, Jenny et al 2003). The precision of CAS increases the surgeon’s ability to execute the surgical plan, improving outcomes. For example, Miehlke et al (2003) showed that more patients who underwent CAS had variations from the mechanical axis <2°, than those who underwent traditional TKR surgery (88.6% and 72.2%, respectively). CAS provides the advantage of less blood loss in total knee surgery (Delp et al 1998, Chauhan et al 2004) and a reduction in the rate of post operative pulmonary embolism as the intermedullary canal is not violated. There are also reports of reduction in use of pain relief in CAS patients (Lionberger et al 2003) and an overall reduction in short-term morbidity (Chauhan et al 2004). Other benefits of CAS include that it has the potential to eliminate the need for pre- and post-operative CT-scans and X-rays and it provides improved surgical vision, which leads not only to more accurate, but also more rapid, component positioning. This should decrease both operating room and anaesthesia time (Martelli et al 2000). In addition, CAS is a straightforward and intuitive technique, which maximises surgical efficiency and allows access to a wider population of surgeons, whilst still maintaining improved consistency and reproducibility of results. This will also help to address the current under-provision of TKR surgery, which is closely related to the shortage of surgeons. Improved accuracy and alignment may also reduce the initial length of hospital stay required, as there is less surgical morbidity and improved functioning. As discussed above, length of hospital stay is the main cost driver in TKR. Patients are likely to have lower physiotherapy and home support care requirements, as recovery will be more rapid, and outcomes improved. This will also lead to lower levels of long-term follow-up, as improved function means that fewer patients will return to their GP or orthopaedic surgeon with complications such as pain and poor outcomes and thus reduce the level of pain medication required both immediately post-operative, and in the longer term. Ultimately it is anticipated that improvements in surgical accuracy will result in an increase in the life span of implants and thus fewer revisions will be required. These benefits will all result in improved quality of life and ensure that patients can return to work, or other activities, that were limited prior to surgery. The recent developments in the use of CAS in TKR also facilitate research into minimally invasive techniques that could ultimately result in routine keyhole procedures. These would further reduce the morbidity of surgery.
Conclusions Traditional TKR is complicated, resulting in sub-optimal outcomes for some patients. This results in high costs due to the length of the operation, the length of hospital stay, extensive follow-up requirements and the need for revision surgery. CAS improves the alignment of the prosthesis, resulting in improved outcomes, reduced length of surgery, shorter hospital stays and a reduced level of follow-up care, and

116
thus offsets some of the costs traditionally associated with TKR. In addition, more surgeons will be able to perform computer-assisted TKR, which should assist with the under provision of service in areas where current volumes and experience levels are low. “CAOS technologies have the potential to be used in different capacities: research tools, training tools, in routine clinical practice, as a commercial proposition, and as an enabler for less and minimally invasive surgical techniques. CAOS technologies will likely be important in all of these roles. However, the most powerful argument for their use may be that they enable surgeons to develop techniques that are more accurate, less and minimally invasive.” – Orthopaedics Today, Sept 2003 References Aglietti P, Buzzi R, Gaudenzi A. Patellofemoral functional results and complications with the posterior stabilized total condylar knee prosthesis. J Arthroplasty 1988; 3: 17-25.
Ansari S, Ackroyd CE, Newman JH. Kinematic posterior cruciate ligament-retaining total knee replacements. A 10-year survivorship study of 445 arthroplasties. Am J Knee Surg 1998; 11: 9 -14.
Australian Orthopaedic Association National Joint Replacement Registry. Annual Report 2004. www.aoa.org.au, 2004.
Bhatia M, Obadare Z. An audit of the out-patient follow-up of hip and knee replacements. Ann R Coll Surg Engl 2003; 85: 32-5.
BUPA. http://www.bupa.co.uk/inclusive_care, 2003.
Chauhan et al, Computer-assisted knee arthroplasty versus a conventional jig-based technique. JBJS (BR) April 2004
Delp SL, Stulberg SD, Davies B et al. Computer assisted knee replacement. Clin Orthop 1998; 354: 49-56. Department of Health. National Service Framework for Older People. http://www.doh.gov.uk/nsf/olderpeople/docs.htm, 2001.
Department of Health. NHS Reference Costs. http://www.doh.gov.uk/nhsexec/refcosts/refcosts2000.pdf, 2000
Frost and Sullivan. Analysis of the European market for primary and revision hip and knee replacements. 4.6.2003.
Garg A, Walker PS. Prediction of total knee motion using a three-dimensional computer-graphics model. J Biomech 1990; 23: 45-58.
Heck DA, Melfi CA, Mamlin LA et al. Revision rates after knee replacement in the United States. Med Care 1998; 36: 661-9.
Jeffery RS, Morris RW, Denham RA. Coronal alignment after total knee replacement. J Bone Joint Surg Br 1991; 73(5): 709-14.
117
Jenny J, Boeri C. Image-free computer assisted total knee prosthesis implantation: A radiological matched-pair comparison with surgeon-controlled instrumentation. Presented at the American Academy of Orthopedic Surgeons, San Francisco, USA, 2001.
Jenny JY, Miehlke R, Kohler S et al. Total knee prosthesis implantation with a non image based navigation system-a multicentre analysis. Presented at the American Academy of Orthopedic Surgeons, New Orleans, USA, 2003.
Juni P, Dieppe P, Donovan J et al. Population requirement for primary knee replacement surgery, a cross-sectional study. Rheumatology 2003; 42; 516-521.
Keifer H, Langemeyer D, Scherwitz U, Krause F. Computer aided knee arthroscopy versus conventional technique-first results. Presented at the First Annual Meeting on Computer Assisted Orthopedic Surgery, Davos, Switzerland, 2001.
Laskin RS. Instrumentation pitfalls: You just can't go on autopilot! J Arthroplasty 2003; 18(3 Suppl 1): 18-22.
Lavernia CJ, Guzman JF, Gachupin-Garcia A. Cost effectiveness and quality of life in knee arthroplasty. Clin Orthop 1997; 345: 134-9.
Lionberger et al. Nuances of Navigation: The Learning Curve in Total Knee Replacement. Poster at the American Association of Hip & Knee Surgeons Annual Meeting, Nov 2003 Martelli M, Marcacci M, Nofrini L et al. Computer- and robot-assisted total knee replacement: analysis of a new surgical procedure. Ann Biomed Eng 2000; 28: 1146-53.
Miehlke R, Kiefer S, Kohler S et al. Computer Aided Total Knee Arthroplasty Versus Manual Implantation Technique: A Multi-Center Study. Presented at the American Academy of Orthopedic Surgeons, New Orleans, LA, USA, 2003.
Moran CG, Horton TC. Total knee replacement: the joint of the decade. BMJ 2000; 320: 820.
Mushinski M. Average charges for a total knee replacement: United States, 1994. Stat Bull Metrop Insur Co. 1996; 77: 24-30.
Perlick L. Navigation in total knee arthroplasty: Results after navigated CT-based implantation compared with the conventional technique. Presented at the American Academy of Orthopedic Surgeons, New Orleans, USA, 2003.
Rissanen P, Aro S, Sintonen H, et al. Quality of life and functional ability in hip and knee replacements: a prospective study. Qual Life Res 1996a; 5: 56-64.
Rissanen P, Aro S, Paavolainen P. Hospital- and patient-related characteristics determining length of hospital stay for hip and knee replacements. Int J Technol Assess Health Care 1996b; 12: 325-35.
118
Rissanen P, Aro S, Sintonen H, et al. Costs and cost-effectiveness in hip and knee replacements. A prospective study. Int J Technol Assess Health Care 1997; 13: 575-88.
Robertsson O, Knutson K, Lewold S et al. Knee arthroplasty in rheumatoid arthritis. A report from the Swedish Knee Arthroplasty Register on 4,381 primary operations 1985-1995. Acta Orthop Scand 1997; 68: 545-53.
Saleh KJ, Macaulay A, Radosevich DM et al. The Knee Society Index of Severity for failed total knee arthroplasty: development and validation. Clin Orthop 2001; 392: 153-65.
Saragaglia D, Picard F, Chaussard C et al. Computer-assisted knee arthroplasty: comparison with a conventional procedure. Results of 50 cases in a prospective randomized study. Rev Chir Orthop Reparatrice Appar Mot 2001; 87: 18-28.
Sharkey PF, Hozack WJ, Rothman RH, et al. Why are total knee arthroplasties failing today? Clin Orthop 2002; 404: 7-13.
Sierra R, Pagnano MW, Trousdale RT. Reoperations after 3200 revision total knee replacements: Rate, etiology, and lessons learned. Presented at the American Academy of Orthopedic Surgeons, LA, USA, 2003.
Sparmann et al. Positioning of Total Knee Arthroplasty with and without Navigation Support; A prospective Randomised Study. JBJS August 2003 Statistics Sweden. Population Statistics. Available at http://www.scb.se/statistik/be0101/be0101tab2helar02eng.asp, 2001.
The Swedish Knee Arthroplasty Register. Annual Report. Available at http://www.ort.lu.se/knee/pdf/skar2002.pdf, 2002.
Table 1. Characteristics of successful TKR.
A low failure rate
Minimal post-operative complications
Rapid recovery
Improved functioning and quality of life of patients
Long implant lifespan and therefore little need for revisions
Where revisions are required, a low failure rate

119
Table 2. Items that contribute to the overall costs of TKR surgery.
Operative Post-operative DIRECT
Operating room time (including staffing costs)
Duration of hospital stay (improved recovery)
Prosthesis Physiotherapy
Anaesthesia time Revision surgery
X-rays / CT scans Pain and thromboembolism prophylaxis medication
X-rays / CT scans
Home support care
Other outpatient / GP / follow-up costs
INDIRECT
Waiting lists Loss of working life
Training of new surgeons Quality of life

120
ANNEX 8: HEARING DEFICIENCIES AND COCHLEAR IMPLANTS
INTRODUCTION Cochlear implants are a major medical breakthrough, assisting approximately two thousand Australians who receive little or no benefit from traditional hearing aids. Implants can offer recipients a greater opportunity to find work, participate in education and enjoy a better quality of life. By facilitating oral communication, cochlear implants can have a profound effect on recipients’ lives. Benefits include increased self-esteem, improved performance in daily activities, participation in social activities and employment retention status. Not only do recipients have the best chance possible to reach their potential in a hearing world, the benefits to society and national economics are significant. DISEASE BURDEN Hearing has been estimated to be to most prevalent disability in developed countries.1 There is a broad range of hearing deficits and a variety of hearing conditions. Some people are unable to hear a quiet voice from a short distance (mild to moderately hearing impaired), while others cannot hear the roar of a plane engine directly overhead (profoundly hearing impaired). In addition, some individuals experience a progressive loss of hearing over the years, some may present with a sudden onset of deafness and others are born deaf.
Estimates of hearing loss in Australia, collected over the last decade and a half, have a reported a prevalence rate ranging from 0.1% - 7%. This may be further detailed as those with bilateral severe to profound hearing loss :
• Prevalence of profound deafness in the better ear: 0.3% –0.4% • Severe loss in the better ear and profound loss in the poorer ear: 0.8%.2,3
Severe to profound hearing impairment significantly impacts the individual’s world. As a result of their unmanaged hearing loss, and the difficulty in hearing everyday sounds, hearing impaired people and their families experience significant disruption to their lives and in consequence a reduced quality of life. The overall loss in health utility from profound deafness in adults has been recorded as –0.46.4
ESTABLISHED TREATMENTS Damage to the ear-drum or small bones of the inner ear can lead to hearing loss, which may be restored with traditional hearing aids. Traditional hearing aids pick up sounds and make them louder, so that sufficient sound reaches the inner ear.
However, sometimes the outer and middle can be intact but the tiny hair cells that line the cochlea of the inner ear are damaged. Sound waves are properly received but cannot be converted into electrical impulses for the brain to interpret. This damage can be genetic, injury- or age-related, or caused by certain medicines used to treat life-threatening illnesses. It can affect anyone, regardless of age or background, and is unlikely to be addressed by traditional hearing aids.
121
In cases of severe to profound deafness of the inner ear, a cochlear implant may be a worthwhile option. A cochlear implant is an electronic device that bypasses the damaged part of the inner ear to stimulate the remaining auditory fibres directly.
UNMET CLINICAL NEED A cochlear implant is an electronic device which enables useful hearing and improved communication ability for adults and children with severe to profound sensorineural hearing loss. The implant consists of a surgically implanted device and an external speech processor, which picks up sounds via a microphone and converts it into coded signals that are sent to the implant. The implant directly stimulates the auditory nerve, bypassing the damaged parts of the inner ear or cochlea. This stimulation is interpreted by the brain as sound.
CLINICAL BENEFITS OF COCHLEAR IMPLANTATION Cochlear implants are provided to severely and profoundly deaf children on the hypothesis that short-term outcomes in auditory receptive skills will translate via a cascade of medium-term outcomes into greater social independence and quality of life.
Children: For children, cochlear implantation accompanied by aural rehabilitation provides the language skills on which literacy skills can be developed, leading to higher rates of mainstream placement in schools and lower dependence on special education support. Studies have shown that the implant has far-reaching social implications beyond the immediate aim of restoring auditory function. Trends towards increased educational independence offer evidence that a cochlear implant enhances access to mainstream education. This is particularly so for children implanted before the age of three.5 Traditionally, children with severe to profound hearing loss relied on manual signed communication and attended schools for the deaf or were placed full-time in a self-contained special education classroom. Research demonstrates that oral communication and reading skills are less likely to develop in these environments, thus limiting the potential for educational achievement.
A cochlear implant improves a child’s educational opportunities as they are more likely to be able to participate in mainstream education. Research suggests that children with profound hearing loss who use an implant for more than two years are placed in mainstream schools at least twice as often as non-implanted profoundly deaf children of the same age. Mainstream classroom settings offer standard verbal and academic training that forms the foundation for future academic development and vocation.
Adults: Although no cochlear implant can restore normal hearing, adult clinical trials of the Nucleus 24 implant show that 90% of adult recipients reported improved communication abilities without lip reading.6
Around a third of recipients achieved 80% or higher sentence recognition within the first three months after the speech processor is switched on (mean sentence recognition increased from 56 percent to 78 percent in three-month period).7
Almost all adult Nucleus 24 cochlear implant users demonstrated significant improvements in word and sentence recognition, both in quiet and in noise, within

122
three months, and approximately half of the recipients demonstrated 70% or better recognition of words and sentences over long-distance telephones.7
Cochlear implants enable post-lingually deafened individuals to continue their educational studies and pursue, or remain employed in, their choice of occupation. This improved access to education and employment for cochlear implant recipients will have flow through effects, improving recipient’s socioeconomic status and well-being. A significant number of cochlear implant recipients record increased job satisfaction and feelings of success as a result of their improved communication abilities.
In the work force this can lead to:
§ enhanced pay; § increased activities and duties; § enhanced training opportunities; and § effective employer-employee relationships. Enhanced Quality of Life The primary objective of cochlear implants is to facilitate oral communication, which can have a profound effect on recipients’ lives. These include increased self-esteem, improved performance in daily activities, participation in social activities and employment retention status. Many recipients use their home and mobile phones with confidence, enjoy listening to and playing music, and enjoy watching films and television. Recipients have the best possible chance to reach their potential in a hearing world and there are significant societal and productivity benefits as well. Cost Effectiveness There are few Australian studies that examine the overall cost effectiveness of cochlear implants in terms of reduced reliance on social services. However, clear, accurate and detailed data on the cost effectiveness of cochlear implants compared to other treatment is essential.
Independent studies show that, on average, an individual with severe to profound hearing loss is expected to cost society $US300,000 (equivalent to A$577,000) over their lifetime. This includes reduced work productivity and the use of special education resources and programs.8
Cochlear implantation benefits society as a whole as recipients are given the chance to achieve their potential and to contribute to the community. The benefits of the device extend beyond the medical and personal into reduced educational costs, enhanced employment opportunities, increased earnings, and reduced reliance on social services.
Cochlear implantation represents an effective use of health care dollars. An Australian study to examine the efficiency of cochlear implant technology under Australian conditions in profoundly deaf adults, partially deafened adults and children revealed that cochlear implantation, including MAPping, hearing rehabilitation, and, importantly, the provision of replacement speech processors - on average every 5 years - is acceptable value for money when compared with other health programs to which Australian resources are currently committed.9
In simple terms, the study revealed quality-of-life improvements due to functional consequences of hearing improvement, such as increased ease of carrying out usual

123
activities, mental and emotional well-being and improved relationships were greater than those due to amelioration of hearing disability. Costs per quality-adjusted-life-year (QALY – 15-year assessment) ranges from:
o $5,070 - $11,110 for children, o $11,790-$38,150 for profoundly deaf adults, and o $14,140-$41,000 for partially deaf adults.9
REGULATORY & FUNDING ISSUES
Initial Cochlear Implant System
Medicare covers 85% of the costs of the actual implant procedure and related hospitalisation for patients with private health insurance, with the remainder of the schedule fee and the cochlear implant, speech processor and listening and maintenance devices provided by private health insurance. The total cost for public patients is met out of the State and Territory hospital funding budgets (using funds allocated to the States and Territories by the Commonwealth through the Australian Health Care Agreements).
Out-patient procedures such as CT scans and clinical programming of the cochlear implant system are 75% funded by Medicare for private patients and again funded from recurrent funding for public patients.
Inconsistencies exist between States and Territories as to how much hospital funding is allocated for implant procedures and follow up care and how long people have to wait for an implant if they do not have private health insurance. For example, in Queensland and Western Australia there is no waiting list, however, in South Australia an adult can wait up to three years for an implant if they have no private funding.
Spare and Maintenance of Speech Processors
Children: As part of Australian Hearing’s Community Service Obligations (CSOs), Australian Hearing funds spare parts, including batteries, and maintenance of speech processors children under the age of 21. Until this year, these federal funds were insufficient to provide speech processor upgrades and replacements to the growing number of children with cochlear implants.
In May 2004, the Federal Government announced that it will spend $7.6 million over four years to improve children’s access to Cochlear Implant speech processors. This allocation (330 upgrades in first year, and 230 devices in subsequent years) is expected to clear the waiting list for speech processor upgrades for children, if those children with private health insurance are able to access their upgrades through their private health funds.
However, with the Review of the Prostheses Benefits Schedule 5, access to speech processor upgrades and replacements through private health insurance is at risk. The speech processor of the cochlear implant system does not meet the PHIMDEC criteria of a Non-Prostheses Medical Device and therefore is at risk of being removed from the Schedule. The result of this would be that there would be increased pressure placed on the Federal Budget allocation, making the sum, granted insufficient. As a consequence, Australian cochlear implant recipients would

124
be left using ‘old technology’ or even worse unable to continue using their cochlear implant system because they cannot afford to replace the external device.
Adults: Although Australian Hearing is funded to provide hearing devices to pensioners (as well as veterans and other limited adult categories), it does not provide upgrade speech processors for those pensioners who have cochlear implants. Given the high cost of replacement speech processors, many recipients who need a new speech processor may not be able to afford one, particularly if these devices do not continue to be covered by private health insurance.
To date, funding for second speech processors for veterans has been provided under the prostheses arrangements established by the Department of Veterans’ Affairs. However, in recent months, a number of Veteran recipients have had their application for an upgrade rejected.
For all other adult Australians, the only sources of funds for replacement a speech processor is private health insurance or personal savings.
Cochlear Limited is concerned that there is currently no specific Government funding arrangements for older cochlear implant recipients to upgrade their speech processors and that private health funds will discontinue funding replacement speech processors. Without access to this part of the technology, the positive return on the investment in a cochlear implant system has been lost.
REFERENCES:
1. Davis AC. Epidemiology of hearing disorders. In: Kerr AG (ed.) Scott Brown’s Otolaryngology. Boston: Butterworth – Heinman, 1997.
2. Mitchell P. The prevalence, risk factors and impacts of hearing impairment in
an older Australian Community: The Blue Mountains Hearing Study, Libby Harricks Memorial Oration, XXVI International Congress of Audiology, Melbourne Australia, 2002.
3. Wilson DH, Walsh PG, Sanchez L, Davis AC, Taylor AW, Tucker G, and
Meagher I. The epidemiology of hearing impairment in an Australian adult population. International Journal of Epidemiology, 28, 247 –252.
4. Cheng AK, Niparko MD. Cost-utiltiy of the cochlear implant in adults – A meta
analysis. 1999. Arch Otolaryngol head Neck Surg, vol 125, 1214 – 1218. 5. Francis HW, Koch ME, Wyatt JR, Niparko JK. Trends in educational
placement and cost-benefit considerations in children with cochlear implants. Arch Otolaryngol Head Neck Surg 1999;125: 499 – 505.
6. Clinical studies on 51 postlingually-deafened adults reported June 1999,
Cochlear Ltd
7. Clinical assessment on 67 postlingually-deafened adults using Nucleus 24, reported June 1999, Cochlear Ltd.

125
8. Mohr PE, Feldman JJ, Dunbar JL. The societal costs of severe to profound hearing loss in the United States. Int J Technol Assess Health Care, 2000, 16;4 1120 – 1135.
9. Carter R, Hailey D. Economic evaluation of the cochlear implant. Int J Technol
Assess Health Care. 1999 Summer;15 (3):520-30.

126
ANNEX 9: DIFFERENCES BETWEEN THE PHARMACEUTICAL AND MEDICAL DEVICES INDUSTRIES
1. MARKET FOR MEDICAL DEVICES AND DRUGS Medical devices save lives, relieve pain, prevent and cure disease and help people avoid disability. They enhance quality of life for both patients and their carers. In Australia and globally, annual spending on medical devices accounts for about 6% of total health care expenditure1, while more than 12% of Australian health care expenditure is spent on drugs through the Pharmaceutical Benefits Schedule (PBS)2 In 2001 there were about 24,000 medical devices entered on the Australian Register of Therapeutic Goods (ARTG)3. The Australian medical devices industry is currently valued at $2.9 billion4, employs in the order of 10,000 people and represents approximately 1% of the global market. Almost 90% (by dollar value) of medical devices used by Australians are imported, with 60% coming from the USA and most others from the EU. Table 1 summarises the major differences in the global medical device and pharmaceutical (drug) industries. The medical devices industry is highly segmented encompassing a broad range of companies. A geographic overlay is apparent so that, for example, many orthopaedic and cardiology devices come from the USA and EU. Table 1: Summary of differences between medical device and drug industries Parameter Medical devices Drugs History Relatively young, emergent
industry resulting from recent (since 1960’s) availability of technical advances.
Longer historical background, with increased activity since 1930’s.
Corporate entities
Diverse, made up of a large number of small and medium-sized companies and few large multinational corporations.
Primarily large multinational corporations, with few small or medium-sized companies.
Product range
Heterogeneous in design and therapeutic purpose, and companies often have ‘niche’ or product line focus.
More homogeneous, and companies often have therapeutic products for a range of diseases.
Profitability Short investment recovery period and high distribution or ‘delivered’ costs, including peripheral products, delivery systems, maintenance and training.
Long investment recovery period, high product development costs and lower distribution costs.

127
2. DIFFERENCES BETWEEN PROSTHESES AND DRUGS Differences between prostheses and drugs in the product development process and intended use are provided in Table 2. All these differences influence the differing regulatory requirements, and hence the clinical evidence required for marketing approval of prostheses and drugs in Australia (section 4). In particular the regulatory environment is influenced by the medical risk of different products and the innovation process, including both the source and type of innovation. Table 2: Differences between prostheses and drugs in product development Parameter Prostheses Drugs Technology base
Mechanical, electrical and materials engineering. Recently encompassing electronics (microchips) and incorporating drugs (hybrid or ‘borderline’ products).
Pharmacology and chemistry. Recently encompassing biotechnology, genetic engineering, and other new modes of action.
Therapeutic effect
Biologically inactive, effective by mechanical and/or electrical action.
Biologically active, effective when metabolised/absorbed into the body.
Medical use Embedded as part of a clinical procedure, often as single administration with a long useful life.
Direct clinical treatment, often as long-term use requiring repeated administration over months or years.
Medical risk Variable and often lower, as not metabolised by the human body and generally local mode of action.
Higher, as metabolised by the human body and generally systemic mode of action.
New products
Most new products are modified from existing products.
Most new products are unique.
Type of innovation
Shorter-term development, with innovation based on incremental adaptation or modification of existing or emergent science, technology and/or materials.
Long-term development, with innovation and improvement based on emergent science and/or technology.
Source of innovation
Deliberate design, often originating with clinicians, for specific functions based on clinical need, performance and safety. Further development often involves clinician partnerships with commercial enterprises.
Trial and disease selection primarily by commercial enterprises, on the basis of quality, efficacy and safety.
Life cycle Short product life cycle (2-4 years).
Long product life cycle (10-20 years).

128
The length, complexity and high clinical data requirement in drug development is a reflection of the process of disease selection for a unique molecular entity combined with the uniformly high medical risk in using drugs. Comparative clinical data in humans (either controlled by an inactive substance (placebo) or another drug) is a general requirement to assess drug performance and safety. The drug evaluation process has arisen from concerns built up over many years about the safety of ingested products which may have unacceptable adverse consequences. It is generally accepted that public outcry over the effects of sulphonamides in the 1930’s and birth defects caused by thalidomide in the 1960’s generated the impetus for an extensive drug appraisal process worldwide5. In contrast, the development of prostheses is shorter, simpler and more variable in clinical data required. For prostheses with low medical risk and with innovation based on incremental adaptation of well-established technology, clinical data in humans is generally not required to assess performance and safety. For prostheses based on new or ‘unproven’ technology and those that extend clinical use, a variable amount of human clinical investigational data is required. REFERENCES 1. EUCOMED Medical Technology Brief. www.eucomed.org. 2. Australia’s Health 2002. Australian Institute of Health and Welfare 2002. Canberra:page 399. 3. Bills Digest No. 149 2000-01. Therapeutic Goods Amendment (Medical Devices) Bill 2001:page 2. www.aph.gov.au/library/pubs/bd/2000-01/01BD149. 4. Extrapolated from the MIAA Market Barometer Online Survey Current to Quarter 1, 2003. 5. Salkeld G, Mitchell A, Hill S. In Economics and Australian Health Policy. 1998. Gavin Mooney, Richard Scotton (eds). Allen and Unwin, Sydney:page 126.
129
ANNEX 10: REGULATORY REQUIREMENTS FOR PROSTHESES AND DRUGS
1. THE AUSTRALIAN REGULATORY SYSTEM The Therapeutic Goods Act 1989 establishes a uniform national system of controls on the availability of therapeutic goods in Australia. Therapeutic goods are divided broadly into two classes – medicines and devices1. Until 20022, the same regime of registration or listing, and the same manufacturing standards applied to both medicines and devices. In general, therapeutic goods were:
• ‘Registered’ if assessed as having a higher level of risk requiring rigorous and detailed examination of quality, safety and efficacy by the Therapeutic Goods Administration (TGA); or
• ‘Listed’ if they were lower risk products. In 2002, the Therapeutic Goods Act 1989 was amended by the Therapeutic Goods Amendment (Medical Devices) Bill, 2002. The Bill introduced a new system for medical device regulation incorporating elements of the European Community (EC) regulatory requirements. It did not change the existing system for medicines. Under the new system, classification is based on the degree of risk posed by use of the device and uses five classifications: Classes I, IIa, IIb, III and AIMD (active implantable medical devices). In practical terms, the majority of measures contained in the Bill either represent no change to the existing regulatory system or a selective strengthening of that system3. The effect of the new classification is to categorise more devices in the high risk classes, resulting in greater coverage and scrutiny of the more invasive medical devices. A five year transition period is allowed for medical devices registered or listed in the ARTG prior to 4 October 2002 to be included in the ARTG under the new system. 2. CLINICAL EVIDENCE REQUIREMENTS FOR PROSTHESES 2.1 Australia In Guidelines for inclusion of medical devices in the ARTG from 2002, the TGA provided a broad comparison of clinical evidence requirements for the old and new regulatory systems. These Guidelines stated that:
• For registrable devices, the clinical data and corresponding evaluation (including clinical expert report) will still be valid to support an application for an inclusion in the ARTG under the new system, and would simply require updating with post-marketing data; and
• For listable devices (which generally had not been subject to formal evaluation by the TGA), full evidence of conformity with relevant essential principles of performance and safety would be required. The level and nature of clinical evidence should be appropriate for the use and classification of the device, and undertaken on a flexible ‘case-by-case’ basis4.

130
In providing guidance on clinical evidence requirements, the TGA concluded that, although the most desirable evidence is obtained from randomised, double-blind, controlled clinical trials, that conducting double-blind trials or using comparator groups is difficult, particularly for implantable devices5. The TGA concluded that it may not be feasible to conduct such trials and that alternative and lower levels of evidence from clinical studies showing greater potential for bias may be used to support a clinical evaluation. These studies may be carried out with no randomisation, as cohort studies or multiple time series with or without intervention6. In addition, depending on the use and history of the device, the data used for a clinical evaluation is not always limited to clinical trials. For devices based on well-established technology, well-reasoned argument based on risk analysis, pre-clinical data and post-marketing history may satisfy the need for clinical evidence7. In considering the clinical evidence actually available for evaluation of prostheses in Australia in 2003, most information comes from 2002 or earlier. In 2001-2002, the TGA processed 7,157 new and amended registrations and listings (Figure 1). Of these, approximately 2,200 were for listable devices, 2,200 for listable non-prescription medicines, 600 for registrable non-prescription medicines, 1000 for registrable prescription medicines and only about 100 for registrable devices. Hence, of devices intended for marketing in Australia, about 4% (100/2,300) routinely required clinical data. Due to the ‘case-by-case’ nature of device assessment, the proportion of clinical evidence for registrable devices which is comparative is unknown. Figure 1: TGA applications for new and altered registration and listing of therapeutic goods in 2001-20028
2.2 USA and Europe As outlined in section 2, most medical devices used by Australians are imported and the majority of prostheses come from the USA and EU. Therefore, the regulatory

131
requirements for individual classes of products in these countries will influence the amount and quality of clinical evidence available for many prostheses. In 1998 Australia signed a Mutual Recognition Agreement with the European Community and this led to the recent harmonisation of medical device regulation (section 1). Hence, the Australian device classification and associated regulatory requirements outlined in section 1 provide similar clinical trial data for the different classes of devices imported from the EU. Australia has also been a principal member of the Global Harmonisation Task Force pursuing a broader regulatory uniformity to include the USA. To date, harmonisation with the broader group has not been achieved to the same extent as with the EU. Therefore, the regulatory environment in the USA, and associated requirements for clinical data, has a significant influence on any clinical data available prostheses imported into Australia from the USA. The USA regulatory system for medical devices is administered by the Food and Drug Administration (FDA) and, like Australia and the EU, is based on a medical risk assessment and the intended use of the product. Medical devices are classified into one of three classes based on increasing medical risk (Class I, II and III). The two main regulatory categories are:
• Pre-market notification (510(K)) of substantial equivalence to an existing predicate device. 510(K) applications are generally subject to a cursory review to verify substantial equivalence to a legally marketed device, although some may require clinical data (usually clinical trials involving less than 100 patients) to demonstrate equivalence, proposed labelling; and
• Pre-market approval (PMA) is required for some Class III life-sustaining, life-supporting, implantable devices and devices not substantially equivalent to a legally marketed device even if it is in a low risk class (Class I or II).
In terms of assessing clinical trial data availability for use in Australia, it is important to note that few medical devices marketed in the USA have gone through the PMA process. In 2002, the FDA approved 41 original (first-time) PMAs compared with 4,376 510(K)s9. Thus, only about 1% of medical devices predictably go through a clinical trial process. This trend has not changed significantly for a decade,10 meaning that most prostheses imported from the USA for use by Australians are not generally accompanied by extensive clinical trial data. 3. CLINICAL EVIDENCE REQUIREMENTS FOR PBS-LISTED DRUGS All prescription or non-prescription medicines approved for government subsidy through the PBS are required to be registrable goods11. Applications for TGA registration of a new molecular entity require preparation of a four -part dossier: Part I Summary, Part II Chemical, pharmaceutical and biological documentation, Part III Preclinical pharmacotoxicology and Part IV Clinical documentation. The clinical evidence requirements in Part IV are uniformly high, generally with three phases of clinical trial data (Phases I, II and III) required:
132
• Phase I clinical trials involve the first administration of the medicine to humans, usually to small numbers of healthy volunteers. Phase I clinical trials determine the safety of the medicine, how it works and how well it is tolerated and help determine the appropriate doses for later studies.
• Phase II clinical trials are normally the first trials of the medicine in patients suffering from the disease or condition for which the medicine is intended. The principal aim of these clinical trials is to determine efficacy and safety. These clinical trials are undertaken in a small number of closely supervised patients and are conducted by researchers who are specialists in the particular disease or condition and its treatment.
• Phase III clinical trials are almost always comparative, involve greater numbers of patients and are undertaken for the purpose of determining whether the medicine confers clinical benefit in the disease(s) for which efficacy was demonstrated in Phase II trials. They also determine the nature and likelihood of any side effects. Phase III clinical trials are only undertaken if the Phase II clinical trials indicate the medicine has potential benefit that outweighs the hazards.
Therefore, in contrast to prostheses, drugs listing on the PBS generally have considerable clinical trial data, much of it from comparative trials. These comparative trials are often randomised, controlled trials. Therefore, the high level of clinical evidence required for TGA registration of drugs has resulted in availability of data for use in economic evaluations, including cost-effectiveness analysis, for submission to the PBAC. 4. CONCLUSIONS REGARDING REGULATORY REQUIREMENTS AND
CLINICAL EVIDENCE Figure 2 provides a graphical summary of the differences in the development pathways leading to regulatory approval for prostheses and drugs. Key differences include:
• The longer time required for drug development compared with prostheses; • The greater amount and homogeneity of clinical trial evidence required for
drugs compared with prostheses; and • The general availability of large scale comparative clinical trials for drugs.
These differences are, in general, the result of the differing relative medical risk of drugs and prostheses. Many prostheses have low medical risk and innovation based on incremental adaptation of well-established technology, therefore clinical data in humans is generally not required to assess performance and safety. As outlined in section 5, comparative clinical data is required to undertake comparative analysis of effectiveness and cost of health technologies, including prostheses.

133
Figure 2: Clinical development pathway leading to regulatory approval for medical devices and drugs12

134
REFERENCES 1. Bills Digest No. 149 2000-01. Therapeutic Goods Amendment (Medical Devices) Bill 2001:page 1. www.aph.gov.au/library/pubs/bd/2000-01/01BD149. 2. Therapeutic Goods Act 1989, as amended by the Therapeutic Goods Amendment (Medical Devices) Bill, 2002 and the Therapeutic Goods (Medical Devices) Regulations 2002. 3. Bills Digest No. 149 2000-01. Therapeutic Goods Amendment (Medical Devices) Bill 2001:page 16. www.aph.gov.au/library/pubs/bd/2000-01/01BD149. 4. Australian Medical Devices Guidelines. Clinical evidence requirements for inclusion of medical devices in the Australian Register of Therapeutic Goods. Guidance Document Number 4. TGA 2002. www.health.gov.au/tga. 5. Australian Medical Devices Guidelines. Clinical evidence requirements for inclusion of medical devices in the Australian Register of Therapeutic Goods. Guidance Document Number 4. TGA 2002:pages 5 and 9. www.health.gov.au/tga. 6. Australian Medical Devices Guidelines. Clinical evidence requirements for inclusion of medical devices in the Australian Register of Therapeutic Goods. Guidance Document Number 4. TGA 2002:pages 7. www.health.gov.au/tga. 7. Australian Medical Devices Guidelines. Clinical evidence requirements for inclusion of medical devices in the Australian Register of Therapeutic Goods. Guidance Document Number 4. TGA 2002:page 8. www.health.gov.au/tga. 8. Australian Medical Devices Guidelines. Clinical evidence requirements for inclusion of medical devices in the Australian Register of Therapeutic Goods. Guidance Document Number 4. TGA 2002:page 8. www.health.gov.au/tga. 9. Therapeutic Goods Administration Annual Report 2002:page 88. www.health.gov.au/tga. 10. FY 2002 ODE Annual Report: page 15. www.fda.gov/cdrh/annual/fy2002/ode. 11. FY 2002 ODE Annual Report: page 15. www.fda.gov/cdrh/annual/fy2002/ode. 12. Therapeutic Goods Act 1989. Australian Guidelines for the Registration of Drugs, Second edition July 1994, Appendix 2. 13. Adapted from Pharmaceutical Research and Manufacturers of America (PhRMA), based on data from the Study of Drug Development, Tufts University, 1995. www.phrma.org/publications/publications/profile02/2003.

135
ANNEX 11: MIAA SUBMISSION TO THE MEDICAL SERVICES ADVISORY COMMITTEE REVIEW 2004
INTRODUCTION 1. It is apparent that when the formalised process of application for new MBS Item Numbers was commenced in 1998, the PBS submission process exercised a degree of influence on the design. Over the first five years of the process of application to the MSAC, it has become evident that some of the important differences between medical procedures and pharmaceuticals are far more crucial than first realised in terms of their implications to the structure of the application process. 2. These differences and their implications include:
• The safety and efficacy of a pharmaceutical is determined by the TGA. In a submission to the PBAC these are only important in their impact on the effectiveness and cost-effectiveness of the pharmaceutical. Until reviewed by MSAC, a medical procedure may not have undergone any ‘check’ of safety and efficacy.
• A pharmaceutical has reached the end of its development phase before being submitted to the TGA let alone the PBAC. Additionally, as a general rule, the role of the medical practitioner is limited to one of prescribing. In contrast, a medical procedure is continually undergoing a process of evolution. Additionally, medical devices also undergo a process of improvement based on feed-back from the surgeons. This ongoing ‘evolution’ process has a critical effect on the timing of the collection of clinical evidence.
• As recent experience has shown, pharmaceuticals such as Enbrel have a potential annual Australian market of one hundred million dollars or more. A medical procedure and associated medical products have an annual Australian market often measured in amounts less than one million dollars. This difference has an important impact on the amount and thus cost of clinical evidence that can be afforded.
• The sponsor of a submission to the PBAC is clearly the marketer / manufacturer of the pharmaceutical. In the case of an MSAC application, although it was originally envisaged that the sponsors would be predominately members of the medical profession (those who use MBS Item Numbers), this has proved not to be the case. The trend is now for applications to be predominately sponsored by the device industry.
SPECIFIC AREAS OF CONCERN 3. Whilst acknowledging MSAC’s focus on safety, the existing MSAC Application process tens not to take account of the importance of commercial imperatives. This is reflected in a number of areas of concern including:
1. Terms of reference 2. Time taken to process an application; 3. The unrecognised and important role of industry; 4. Better communication and detailed feedback to sponsors; 5. Levels and consistency of evidence required; 6. Implications for other reimbursement sources; and
136
7. Interim Funding Terms of Reference 4. MSAC's TOR states that it advises “on the strength of evidence pertaining to new and emerging technologies and procedures...” However the MBS reflects only the medical service or procedure i.e. the technique not the device. Therefore it is unclear if a new device or technology that is used in a currently reimbursed procedure is eligible for MSAC review, or indeed whether it is mandatory. 5. It is also unclear regarding the approach to be taken where for whatever reason, devices have been in use for some years, without an MBS number, and are therefore not new or emerging technology. What is the retrospective action to be taken in such cases? Time taken to process an application 6. For a surgical procedure, the average time taken from lodgement of the actual application to listing on the MBS is approximately two years. In comparison, a pharmaceutical is listed on the PBS in nine months. There is an urgent need to streamline the process and for there to be a timetable similar to the PBS submissions so that there can be certainty that an application, if successful, will be listed on the MBS by a certain date. Additionally, this time period should not exceed twelve months. Although there is no fee for the lodgement of an MSAC application, the real cost is time. It would appear that a large amount of time is used up waiting for responses from medical authorities and attempting to organise meetings. Considering the importance of making these new cost-effective procedures available to patients as soon as possible, relevant medical authorities must be prevailed upon to respond with a degree of urgency. 7. It is proposed that the Medicare Benefits Branch operate a revised system in processing applications. This new processing system would commit all participants to a set timetable along the following lines. 8. Pre-lodgement meeting: Compulsory with guidelines of what should be supplied as part of this meeting. This meeting should be used to determine if the application is suitable, that is, passes Stage 1. Within seven days of this meeting notification to the sponsor from the Medicare Benefits Branch of the validity of the application. Return confirmation from the sponsor that an application will be made and lodged by a certain deadline, for example, within six weeks. Upon this confirmation, the Medicare Benefits Branch contacts the relevant medical authorities, MSAC members, etc. and arranges for the first meeting of the Advisory Panel to be held within a month of the receipt of the application. 9. The Review of the application should start no longer than a month after the first meeting of the Advisory Panel and be completed within three months. The work of the MBCC might be streamlined by having more detail regarding proposed fee and descriptor as part of the original application and review. Following is a sample timetable using this schedule.
Pre-lodgement Meeting 1st Feb’05 Notification to Sponsor 8th Feb’05 Application lodgement deadline 31st Mar’05 Deadline for first Advisory Panel meeting 30th Apr’05

137
Deadline for commencement of Review 31st May’05 Deadline for completion of Review 31st Aug’05 Response from sponsor 14th Sept’05 MSAC Meeting 30th Sept’05 Recommendation signed off by Minister 31st Oct’05 MBCC process completed 28th Feb’06 MBS Listing 1st May’06
10. It is strongly recommended that MSAC adopt time performance standards/guidelines for processing of applications. 11. At present, there is a large variation in the standard of applications accepted by MSAC. In the interest of speeding up the early steps of the process, and decreasing some of the work presently carried out by the external Evaluators, the required detail and standard of application should be raised. The unrecognised and important role of the medical devices industry 12. The majority of MSAC applications submitted appear to have been for procedures, both diagnostic and surgical, that involve products, with development costs ranging up into the millions of dollars, supplied by industry. These products can be implantable prostheses/medical devices, consumables/disposables, or capital equipment. It seems that over recent years it is very rare for an application for a new procedure to be submitted that does not involve a product. 13. It is important that applications to MSAC are recognised as having far wider implications than just the determination of a new listing on the Medicare Benefits Schedule (MBS) and payment for the relevant medical practitioner. Without an MBS Item number, a procedure will not be awarded a theatre band by the National Procedure Banding Committee, covering consumables, disposables, and capital equipment. Without an MBS Item Number, a prostheses or medical device cannot be listed on Schedule Five, although it is possible that the same device could be used in the public sector. 14. Just as importantly, the interrelationship between procedure and product and the part played by industry in supplying devices needs greater recognition. Although it is understandable that the original designers of Medicare could not have foreseen the extent of this relationship, it is timely that MSAC processes are more sensitive to these issues. For example, TGA approval is mandatory before applications can be accepted by MSAC but the assessing process is slow. This process should be capable of being risk-managed with applications accepted and the MSAC process commenced ahead of ARTG inclusion in circumstances where devices may have been approved in other recognised jurisdictions. 15. An increase in the role of Industry as part of the MSAC Application process has the potential to aide the process in a number of important ways. As evident by the sponsors of recent MSAC Applications, the creation of new MBS Item Numbers has far broader implications than just payment for surgeons. 16. It is proposed that serious consideration be given to appointment of a non-aligned industry representative to MSAC along the lines of the Ministerially appointed Prostheses & Devices Committee. The industry representative can present a whole of industry perspective on current issues and support MSAC processes especially communication. A single industry representative would be incapable of distorting

138
committee recommendations and it would be acknowledged that he/she does not have a clinical role to perform. Better Communication and Detailed Feedback to Sponsors 17. The MSAC Application & Assessment Guidelines (February 2004) are in need of revision. It would be helpful if particular attention is given to describing the actual steps in the assessment cycle – for instance, there is confusion about whether the evaluator’s draft Assessment Report is sent to the applicant for comment at the same time as the Advisory Panel receive it for review and endorsement, or whether the Advisory Panel endorse the Report prior to its release to the applicant – whose comments then simply get forwarded to MSAC along with the Report (or do the comments go back to the Advisory Panel for consideration?). 18. It would also help of an outline of how the Secretariat allocates and prioritises the work of the three teams of contracted evaluators was given in the Guidelines. 19. Clarity about time limits between which draft Assessment Reports will be produced would also greatly assist applicants (who usually need to develop appropriate business plans). 20. Pre-lodgement meetings could be used to much greater effect. By the end of this meeting it should be possible for the Medicare Benefits Branch to make a decision regarding the suitability of the application (Stage One completed). These meetings should require some up-front documentation to be supplied by the sponsor as well as a presentation by the sponsor. For this to work, the Pre-lodgement meeting would not be the first contact between the Medicare Benefits Branch and the sponsor. 21. A face-to-face meeting between the sponsor and the Advisory Panel is suggested which would give the sponsor the opportunity to fully explain the new procedure and the associated medical products. This would also give the Advisory Panel an opportunity to ask detailed questions of the sponsor. Unlike the PBAC System that handles approximately one hundred submissions per year, MSAC has a much smaller volume which should make face-to-face meetings more viable. 22. In the case of a failed application, it is crucial that detailed feedback is supplied to the sponsor as soon as possible. The published report is far too late and is often written in a style more suitable for the general public, decreasing its information value. In accordance with accepted procedural fairness, the applicant must also be advised of an impending adverse recommendation before it is finalised and submitted to the Minister. 23. The detailed report from the Advisory Panel should be supplied to the sponsor as soon as the Minister’s decision is known. Decisions should be fully consistent with previous reviews in similar therapeutic areas. For the sake of transparency, relevant sections of MSAC minutes should be made available to affected suppliers. 24. MIAA has appreciated the willing and informative participation by MBB staff in industry workshops and looks forward to continuing this means of effective communication. Levels and Consistency of Evidence 25. It is understood that over the past year the Clinical Trials Centre (CTC), NH&MRC has been carrying out a review of the levels of evidence required for MSAC Applications for diagnostic procedures. It is also understood that the ‘success rate’ of MSAC Applications for diagnostic procedures is about 50%.

139
26. In 1995 the NH&MRC published the following guidelines of a rating scale for quality of evidence. At the time, the focus was on pharmaceuticals. I Evidence obtained from a systematic review of all relevant randomised
controlled trials. II Evidence obtained from at least one properly-designed randomised controlled
trial. III-1 Evidence obtained from well-designed pseudo-randomised controlled trials
(alternate allocation or some other method). III-2 Evidence obtained from comparative studies with concurrent controls and
allocation not randomised (cohort studies), case-control analytic studies, or interrupted time series with a control group.
III-3 Evidence obtained from comparative studies with historical control, two or more single-arm studies, or interrupted time series without a parallel control group.
IV Evidence obtained from case series, either post-test or pre-test and post-test. 27. There are a number of problems in applying these guidelines to medical procedures. Evidence of the clinical efficacy and safety of a medical procedure at the randomised, double-blinded, head-to-head phase III clinical trial level is rare and in many cases impractical. Some of the problems associated with obtaining evidence are:
• The timing of the collection of the evidence – the surgeons need to be experienced and any associated product (implanted prostheses for example) has to have had modifications based on surgeons’ feedback.
• If is often difficult to find someone willing to pay for the cost of collecting the evidence. If a product is involved, the company that markets the product will be limited by the potential profit from the product. Unlike the majority of pharmaceuticals, new medical procedures are often limited in volume. This severely limits the potential profit and thus funding for any ‘clinical trial’.
• The MSAC Application system is unique. The majority of products associated with medical procedures come from either the USA or Europe, neither of which have the evidence requirements of the Australian system.
• Often the experience and success of a new medical procedure is published on a major clinic’s web site based on the clinic’s experience.
• There are substantial real costs associated with performing a medical procedure. These costs are incurred by the hospital (theatre and bed-days), the surgeon and the supplier of any associated product. The cost to the patient, if all these costs are borne by the patient, will be an effective barrier to the performance of the procedure.
28. It is important that the evidence requirements for a new procedure are calibrated to the characteristics of the procedure. For example:
• The potential for the new procedure to do harm; • The reversibility of the new procedure; • The availability of an existing alternative; • The safety and efficacy of the existing alternative; • The size of the potential patient population; • The ‘seriousness’ of the condition being treated; • The cost of the procedure.
140
29. This concept of calibrating the evidence to the nature of the procedure has some similarities to the report / review by the CTC. However, as yet, industry has not been invited to comment on this report / review. 30. The existing evidence requirements are proving to be an effective block to the introduction of new technology in Australia. Ironically, new products from the emerging AusBiotech industry can be available in major overseas markets, both USA and Europe, but may not be available on the Australian market either due to a failed MSAC Application or due to the companies not seeing the value of the costs of obtaining evidence suitable for the MSAC system. Even more ironic is that the research and development costs of these Australian products are often heavily subsidised by State Governments. 31. A paper produced for MIAA highlighting the differences between prosthetic medical devices and drugs, and covering the differences in the nature of clinical evidence is attached in ANNEXES 9-10. Impacts of the MSAC processes to other reimbursement processes 32. It should be acknowledged that MSAC reviews do not affect just the MBS medical services provided to the private sector. In fact, a recommendation from MSAC impacts public sector hospital funding via DRGs and the private sector through theatre banding. 33. MSAC's apparent position is that DRGs are not linked to funding for hospitals and the issues of DRGs and hospital funding are matters for the States. In fact DRGs are linked to MBS through the ICD-10-AM procedure codes which have been based on the MBS since 1985, as set out in the following:
'In late 1995 the Australian Health Ministers' Advisory Council (AHMAC) endorsed a proposal that all hospitals and day surgeries adopt the International Statistical Classification of Diseases and Related Health Problems, 10th Revision (ICD-10), and also a new procedure classification. This led to the development of the International Statistical Classification of Diseases and Health Related Problems, 10th Revision, Australian Modification (ICD-10-AM). Australia's National Centre for Classification in Health based the diagnosis section on the parent diagnosis section, and the procedure section on the Commonwealth Medicare Benefits Schedule (MBS).' Source: Australian Refined Diagnosis Related Groups, version 4.1, Definitions Manual, Volume 1.1998. Commonwealth of Australia. page 3’.
34. Hence, the creation of a new MBS code often flows through to DRG assignment processes so that episodes of hospital care may be categorised on resource consumption as well as clinical content. This in turn impacts the magnitude of case payments in Australia. Specifically, 'All States and Territories other than NSW now use the DRGs for the funding of public hospitals. NSW uses DRGs at the local level as a tool for management of services, the development of budgets and the evaluation of quality.' (Australian Refined Diagnostic Related Groups, version 4.1 Definitions Manual, Volume 1. 1998. Commonwealth of Australia. page 1) 35. This is also paralleled in the private hospital sector, where case payments (either through Theatre banding or DRGs) are linked to MBS codes. 36. In addition, MSAC references (as opposed to applications) for particular procedures requested by the States via AHMAC also impact public sector funding e.g. an MSAC recommendation that a technology is safe, effective but not cost-

141
effective is unlikely to result in incremental funding of hospitals by the State governments. 37. Impending reforms to Schedule Five of the National Health Act (prostheses and other implantable medical devices) will reinforce the listing of products on this schedule, and thus reimbursement, being dependent on the associated procedure having an MBS Item Number. This will effectively reduce the opportunity for surgeons to get experience using new prostheses. New procedures cannot have theatre bands awarded until they have an MBS Item Number. As a general rule, in all but Western Australia, there is a one to one relationship between MBS Item Numbers and theatre bands. That is, there can only be one theatre band associated with an individual MBS Item Number. This means that an existing theatre band cannot be sub-divided to cover a new way of performing an existing procedure. This can put pressure on hospital budgets since the superior safety and efficacy of a new procedure often has increased theatre costs as a trade-off. Interim Funding 38. Interim funding should be more widely permitted under circumstances where there is uncertainty on cost-effectiveness due to lack of data. This enables clinicians to become proficient at using the technology over time, resulting in an increased ability to measure the health outcomes. A more liberal approach to interim funding may also alleviate problems encountered by delays in the review process. CONCLUSION 39. MIAA has appreciated the opportunity to participate in the MSAC review and would be pleased to facilitate further consultation including convening of an industry focus group to explore these issues further.
Health Technology Assessment for Medical Devices in Europe – What has to be Considered
Position Paper
I. Executive Summary • The aim of this document is to position the medical device industry in Europe in the ongoing
debate on Health Technology Assessment (HTA). Above all, HTA should help improve the level of health care provided to patients. HTA that takes into account the criteria outlined in this paper will support patient access to the most appropriate medical technologies.
• With the currently increasing trend to applying HTA to medical devices and other technologies it
is important to recognise that the experience and expertise gained with pharmaceuticals, is not automatically applicable to medical devices.
• HTA can be meaningful to address issues such as deciding whether to reimburse new technologies
or procedures, comparisons of technologies already on the market, and also in case of new or improved outcomes or cost data.
• There is no general answer to the question of the “right time” to assess a medical technology. It is
important that a decision on this is based on sufficient knowledge of the product and its surrounding procedures, which is best achieved by close interaction with the users and the manufacturers of the technology in question.
• Appropriate evidence should be provided to demonstrate the clinical efficacy/effectiveness of a
medical technology. Depending on the nature of the device, clinical data from randomised controlled trials, non randomised studies such as cohort studies with for example historic controls, case-control studies or observational data from registries should be taken into account when assessing clinical effectiveness.
• Ideally, HTA should be done from a societal perspective, including all health effects and costs.
Where this is not acceptable/appropriate, a “health service perspective”, taking into account all costs and benefits within the national healthcare system, is considered the second best solution.
• Both health care professionals and experts from industry who understand the technology should be
involved in designing the way in which a particular technology is assessed • Manufacturers need to participate in the process and must know from the outset how decisions will
be made and which are the steps in the review process. The process should be clear and transparent.
• Industry should have access to a formal appeals process to challenge negative decisions. • Patients should not be denied access to a promising new technology, which might not have
undergone a full assessment yet, but which has nevertheless proven its safety and performance through the Conformity Assessment. In case of still limited evidence, interim funding of a new product could initially be limited to selected centres of excellence in order to satisfy the legitimate needs of patients to have access to the most promising innovative technology and to simultaneously provide further data for a subsequent assessment.
• While responsibilities for conducting HTA should remain at Member State level, the medical
devices industry is committed to actively support efforts to harmonise methodologies in HTA at an international level to allow efficient compilation of data and rapid release of the assessment outcomes.
BOARD APPROVED - 070601
2
II. INTRODUCTION The aim of this document is to position the medical device industry in Europe in the ongoing debate on Health Technology Assessment (HTA). Following an introduction to HTA and a summary of how HTA is currently practised in Europe, this paper will discuss the application of HTA to medical devices. Health Technology Assessment (HTA) is the collective name given to a number of activities applying systematic methods of scientific inquiry to the evaluation and use of new or existing healthcare technologies. The evaluation can focus on all impacts of a particular healthcare technology, including its clinical, ethical, social, legal and economic implications. This paper wants to distinguish between the methodology of gathering and analysing data within an HTA - the assessment - and the decisions on e.g. coverage, funding or reimbursement of a health technology, which can be termed the appraisal. Chapter III of this document addresses assessment issues, of particular relevance to the European medical devices industry, whereas chapter IV details the Industry Position on the appraisal processes. According to a Report to the European Commission1 on the 'Best Practice' in Healthcare, HTA in Europe is organised and implemented somewhat differently in every country with countries operating a national health service relying more on centralised HTA agencies, and those with a social health insurance systems tending to implement HTA at sickness funds or insurance level. The European Commission has an interest in improved co-ordination and communication between the national activities on HTA and has funded projects such as EUR-ASSESS, HTA in Europe, and, most recently, ECHTA that support these objectives. The overall objective of HTA is to provide robust and objective information for decision-making in healthcare at different levels. HTA methodologies have recently been increasingly used to assist governments to reach decisions on the coverage and/or the funding of particular healthcare technologies and on clinical guidance. Already more widely established in the field of pharmaceutical products, HTA is being increasingly applied to other healthcare technologies, including medical devices. However, given the diversity of the various healthcare technologies in question, no single approach will suit them all. It is important to recognise that the experience and expertise gained with pharmaceuticals, is not automatically applicable to medical devices. Three European Directives regulate together all medical devices in the EU2. The European Directive 93/42/EEC defines a medical device as
1 ‘Best Practice’ in Health Care: State of the Art and Perspectives of the EU in improving the Effectiveness and Efficiency of the European Health Care Systems, Final Report for DGV/F/1, March 1999 2 Council Directive 93/42/EEC of 14 June 1993 concerning medical devices, Council Directive 90/385/EEC of 20 June 1990 relating to active implantable medical devices and Council Directive 98/79/EEC of 27 October 1998 on in vitro diagnostic medical devices
BOARD APPROVED - 070601

3
“[…] any instrument, apparatus, appliance, material or other article, whether used alone or in combination, including the software necessary for its proper application intended by the manufacturer to be used for human beings for the purpose of:
• •
•
•
diagnosis, prevention, monitoring, treatment or alleviation of disease, diagnosis, monitoring, treatment, alleviation of or compensation for an injury or handicap, investigation, replacement or modification of the anatomy or of a physiological process, control of conception,
and which does not achieve its principal intended action in or on the human body by pharmacological, immunological or metabolic means, but which may be assisted in its function by such means.” All medical devices placed on the European market must bear the CE Marking as proof that they meet the Essential Requirements for safety and performance laid down in the relevant Directive. These requirements provide for high levels of safety and performance for devices in relation to the risks and benefits they represent for patients and users.3 Where the safety and performance of the device is safeguarded through the CE Marking, it is important to realise that in many cases the health impact of the device cannot be completely isolated from its surrounding procedure or user relationship. An assessment of the clinical outcomes of a device has to take this into consideration, unlike pharmaceutical products, where – generally speaking – the health impact is more easily attributable to the product. The objective of this Paper is to highlight these and other characteristics of medical devices that require an adaptation of the methodology used in the HTA and/or an appropriate consideration in the subsequent interpretation of the HTA results. The document is aimed to inform all those involved in preparing, conducting, and interpreting the assessment of medical technologies about some of the specific characteristics of medical devices and their impact on HTA. The Paper is based on the European industry’s commitment to an HTA which takes into consideration the specifics of medical technologies, which is appropriate and fair, and which is done under the full participation of industry. Under these circumstances HTA can be a useful tool to support rational decision-making in healthcare. III. METHODOLOGICAL CONSIDERATIONS Selection of Technology The assessment of safety and performance of medical devices is routinely and mandatorily done during the Conformity Assessment procedure required prior to affixing the CE Mark in order to place the device on the European market. In case the manufacturer claims to provide additional benefits with regard to clinical
3 CE Marking: Protection, Performance, and Safety first, EUCOMED 1995
BOARD APPROVED - 070601

4
effectiveness or cost compared to existing medical alternatives, an additional assessment of clinical and/or cost-effectiveness might be performed. This suggests that HTA can be meaningful to address issues such as deciding whether to reimburse new technologies or procedures, comparisons of technologies already on the market, and cases where new or improved outcomes or cost data are provided. An HTA of a product as part of a product class with well-known and unchanged clinical and cost-effectiveness results, is normally of no additional value. Timing of the Assessment Medical devices are often fast-changing technologies. Their development is characterised by a constant flow of incremental product improvements. Accordingly, the life cycle of a specific type or variation of a device is often as short as 18 – 24 months, which is considerably less than compared to that of pharmaceuticals. There is still ongoing debate on when to assess a product innovation4. Assessing an innovation early in its product life cycle could provide answers for political decision-makers and insurers on the issue of funding the new technology and allow early patient access. On the other hand there might be limitations to meaningful interpretations that can be made from HTA in the early phase of the product life cycle. The early assessment of a technology might ignore both the learning curve phenomenon, and the fact that the process of innovation in medical devices is one of continuous – often incremental – improvements in close interaction with the users of the technology. The learning curve phenomenon means that the effectiveness of a new device as part of a medical procedure depends to a large degree on the user’s experience with the device and procedure in question. Too-early-an assessment of a new device or procedure could give an unrepresentative impression of the long term value of that device and procedure: Technological improvements need to be considered throughout the entire product life cycle, as any assessment at a certain point within the product’s life cycle is likely to ignore improvements of the medical technology at a later stage. For some technologies, one might refrain from a one-off assessment, either early or late in the process, and prefer an iterative process of assessments during a product’s life cycle instead. These subsequent reviews of the assessment could then take into account technological improvements or a movement on the learning curve. There is no general answer to the question of the “right time” to assess a medical device. It is important that a decision on this is based on sufficient knowledge of the product and its surrounding procedures, which is best achieved by close interaction with the users and the manufacturers of the technology in question. 4 for detailed discussion see: Mowatt et al, When is the ‘right’ time to initiate an assessment of a health technology, Intl. J. of Technology Assessment in Health Care, 1998, 14:2
BOARD APPROVED - 070601

5
Research Question The same medical device can be used in different settings, the outcomes of which not only depend on the performance of the device itself, but also on a variety of additional factors, as e.g. user training and experience. In such a complex environment it is therefore crucial to define the research questions addressed through the HTA as clearly as possible. A close interaction between all stakeholders involved (which should include the manufacturers and the intended users of the technology in question), will help to avoid unnecessary confusion on the topic of the assessment and hence the information to be looked for. Patient Population Medical devices sometimes serve relatively small patient populations, a counterpart may be found in “orphan drugs”. This may be due to either epidemiological factors, or to the fact that the medical technology is the “last resort” for treatment. Some innovative medical technologies are specifically designed to treat rare diseases. In such cases the available eligible patient population may be too small to permit statistically sufficiently powered clinical trials. Study Design – Clinical Evidence The Medical Device Industry is convinced that appropriate evidence should be provided to demonstrate the clinical efficacy/effectiveness of a medical technology. The view is widely held that data from double-blind controlled randomised trials are generally preferable to those from other study designs. For many devices however a double-blind study, e.g. bypass surgery versus stents, is not feasible. The limitations of randomised controlled trials are pointed out by Black5: •
RCTs may be unnecessary, e.g. when the effect of the intervention is dramatic or the likelihood of unknown confounding factors so small that they can be ignored. In such cases of obvious superiority of the innovation, observational studies are adequate to demonstrate effectiveness.
• RCTs may be inappropriate: This might be the case when a technology addresses
a comparably small patient population or when some of the examined effects of a technology can only be observed during a long-term follow-up period. For example, the assessment of the performance of orthopaedic implants might require a long-term follow-up. This may not be possible within a trial setting and the assessment of surrogate endpoints should then be considered. In these cases modelling from intermediate outcomes or post-marketing observational data, e.g. from registries, will allow proper analysis and follow-up.
• RCTs may be impossible, e.g. due to ethical objections; this might be the case
when surgery is involved in applying a technology or when the conventional therapy, which would have to be used as comparator, is obsolete.
5 Black, Why we need observational studies to evaluate the effectiveness of health care, BMJ 1996, 312 (7040)
BOARD APPROVED - 070601
6
• RCTs may be inadequate, i.e. the generally low external validity of a RCT is
causing concern. This might be caused e.g. by the fact that the healthcare professionals and/or the patients who participate in the RCT are not typical representatives of the community. The first because they might be innovators active in centres of excellence, the latter because the exclusion criteria for RCTs could be so restrictive that the patients included represent only a small proportion of those being treated in normal practice.
The limitations to the applicability of RCTs is of particular relevance to many medical devices, due to the characteristics of the product and/or the surrounding procedure. Where the use of RCT-based data might be generally desirable, one has to acknowledge these limitations and to accept that in many cases clinical effectiveness of medical devices has to be proven through other than RCT-based evidence. Numerous devices have been found safe and effective without the use of RCTs. Observational studies, such as registries can provide appropriate evidence on effectiveness and are a recognised alternative to RCTs. Depending on the nature of the device clinical data from non randomised studies such as cohort studies with for example historic controls, case-control studies or observational data from registries must also be taken into account when assessing clinical effectiveness. The position of the medical device industry is well illustrated by the following summary by Prof. Black: “For too long a false conflict has been created between those who advocate randomised trials in all situations and those who believe observational data provide sufficient evidence. Neither position is helpful. There is no such thing as the perfect method; each method has its strengths and weaknesses. The two approaches should be seen as complementary […]. When trials cannot be conducted, well-designed observational methods offer an alternative to doing nothing. They also offer the opportunity to establish high external validity, something that is difficult to achieve in randomised trials.”6 Study Design – Economic Evidence For any economic evaluation which may form part of an HTA, it is important to define the criteria by which costs and benefits will be considered. Most of the existing guidelines on economic evaluation recommend the use of the “societal perspective” thus acknowledging competing uses for society’s resources. Under a societal perspective “the analyst considers everyone affected by the intervention, and all health effects and costs that flow from it are counted, regardless of who would experience them. Health effects include both benefits and harms, even when these occur in people who are not the intended recipients of the intervention. Resource cost include all resources used, whether or not money changes hands.”7 The medical devices industry believes that where an analysis from the societal perspective is not acceptable or appropriate, a “health service perspective” is the second-best solution which would at least consider all costs and benefits that occur 6 Black, Why we need observational studies to evaluate the effectiveness of health care, BMJ 1996, 312 (7040) 7 Russel et al for the Panel on Cost –Effectiveness in Health and Medicine, The Role of Cost-effectiveness Analysis in Health and Medicine, JAMA, 1996, Vol 276, No 14
BOARD APPROVED - 070601

7
within the national healthcare setting. A limited economic evaluation, considering only costs in certain subsections of the health systems (motivated by “silo-mentality”) would not yield fair and unbiased results. The appraisal should ideally take into consideration variations in country-specific unit costs and national resource use patterns. Modelling from international study data can yield valuable information.8 Technology assessment decisions should not neglect how a device improves the life of a patient. Decisions that are based solely on costs will ultimately fail patients who depend on access to lifesaving and life-enhancing innovative technologies. Data Collection Process The innovation process is a collaboration of medical and industry experts, hence their judgements and consensus should determine the data needed for assessment. International clinical trial data and actual market experience should be accepted as valid data; local trials should not be necessary if significant documented and validated experience, data or publications are available from other regions or countries. IV. POLICY CONSIDERATIONS Representation of Interested Parties Both industry and other interested parties, such as patients associations, are entitled to assess the benefits of a particular healthcare technology. While national institutions may have an obligation to evaluate the outcomes later, they do not have a monopoly on the assessment process. Health care professionals and those who provide and pay for healthcare technology have a right to information about the effectiveness of a particular health technology, but their demands should be commensurate with the risks, uncertainties and scale of use of the technology in question. Both health care professionals and experts from industry who understand the technology should be involved in designing the way in which a particular technology is assessed. Consideration should be given to the practical impediments (time, cost, patient impact) of performing these assessments. Government’s preferred role should be to make available to health care professionals, providers and payers the information that is gathered to assist them in making important medical treatment decisions. Manufacturers should participate as an equal partner in any discussions and meetings about the data submitted to clarify concerns and present additional arguments to support the funding or reimbursement of their product.
8 Greiner, W. et al, The transferability of international economic health economic results to national study questions, HEPAC, 2, 2000
BOARD APPROVED - 070601

8
There has to be a clear process by which patients can be involved in the decision-making process. Transparency of the Process Manufacturers need to participate in the process and must know from the outset which are the steps in the review process. The entire process should be clear and transparent. All requirements with regards to products and technology assessment must be published and communicated to the industry and all interested parties. Manufacturers need to be able to access appropriate information and conduct necessary research at reasonable cost and in reasonable time scales. The HTA process should be clearly disconnected from any vested interest and thus from the coverage decision, which remains a political decision. Decisions on coverage and payment, following an HTA, should be taken in less than 90 days given the relatively short product life cycle of many medical devices (i.e. less than two years), with reliance on systems that facilitate the exchange and transmission of clinical and economic information. Appeals process Industry should have access to a formal appeal process to challenge negative decisions. Such appeal process should include a fair hearing and consideration of any new evidence as much as to the ability to question the grounds for the previous decisions. All interested parties such as manufacturers or patients associations should be entitled to request a hearing to present their reasons for appealing the decision and to provide additional support if necessary by medical experts of their own choosing. Interim and/or Regional Funding Based on – still limited – evidence, interim funding of a new product, (perhaps initially limited to selected centres of excellence) would ensure that the legitimate need of patients to have access to the most promising innovative technology is satisfied . Simultaneously effectiveness data for a subsequent assessment could be collected. Although each government has the option of issuing national decisions to determine whether a certain medical device or technology should be made available and paid for throughout its health care system, it is important to allow a flexible approach of regional introduction and patient-focused decision making for early availability of new technologies.
BOARD APPROVED - 070601

9
V. CONCLUSION The European medical device industry can commit to an HTA which takes into consideration the specifics of medical technologies, which is appropriate and fair, and which is done under full participation of industry. Under these circumstances HTA can be a useful tool to support rational decision-making in healthcare. Evidence requirements need to be tailored to the medical treatment, technology or procedure under review. Review criteria (and evidence requirements) should take into consideration the practical impediments (time, cost, patient impact) to the development of this information. One could refer to this as the "least burdensome" concept, where the risks and benefits in device evaluation are balanced in order to avoid unnecessarily cumbersome and costly studies and ensure the timely availability of innovative technologies to patients. HTA is a useful and recognised instrument which yields valuable information to assist health care professionals, providers and payers in the decision making process. While responsibilities for conducting HTA should remain at Member State level, the medical devices industry is committed to actively support efforts to harmonise methodologies in HTA at an international level to allow for efficient compilation of data and rapid release of the assessment outcomes. It should be clear that the purpose of HTA is not to create another technical barrier to trade or simply to delay the entry of new technologies onto the market, but to ensure patient access to lifesaving and life-enhancing medical technologies. HTA should assist this process of making a rational choice among different therapeutic alternatives. The European medical devices industry underlines the necessity to adapt HTA to the particular requirements of the medical device industry. A mere transposition of the methodology and the structure of HTA as used e.g. within a pharmaceutical setting is not an appropriate way to assess the effectiveness of medical devices and technologies. Medical technologies that demonstrate medical and/or cost benefits when compared to other medical therapies (e.g. pharmaceutical therapies, surgical therapies or the absence of a therapy) should be rewarded appropriately. For instance, HTA may indicate the need to increase reimbursement or Diagnosis-Related Groups (DRG) levels due to significant product improvements or to install a new DRG for innovative therapies. Failure to reward innovative medical technologies will inhibit the further development of new life-enhancing and life-saving technologies, which patients need. Above all, HTA should help improve the level of health care provided to patients. HTA that takes into account the aforementioned criteria will support patient access to the most appropriate medical technologies There remains a need to harmonise the requirements for the information to submit and the procedures applied in HTA in Europe. Industry should not only be informed early about the data needed in the HTA process, but these data should also be considered sufficient and appropriate on an international scale. Only if data requirements, time-
BOARD APPROVED - 070601

10
lines, measures of transparency, and other procedural aspects within an HTA process are largely harmonised across Europe, will a timely and efficient assessment of fast developing medical technology be feasible. However, while it is valuable to achieve a harmonisation of the methodologies applied under HTA, responsibilities for conducting HTA should remain at Member States level. The existing differences between health care systems, e. g. in cost structures, require national autonomy in the initiation of HTA and in the decisions made on the basis of HTA. It is essential for an innovative and fast-moving medical devices industry in Europe that HTA processes allow for multiple access points for new medical technologies.
BOARD APPROVED - 070601
11
APPENDIX I: GLOSSARY OF TERMS9
Case-control study (synonyms: case referent study, retrospective study) A study that starts with identification of people with the disease or outcome of interest (cases) and a suitable control group without the disease or outcome. The relationship of an attribute (intervention, exposure or risk factor) to the outcome of interest is examined by comparing the frequency or level of the attribute in the cases and controls. For example, to determine whether thalidomide caused birth defects a group of children with birth defects (cases) could be compared to a group of children without birth defects (controls). The groups would then be compared with respect to the proportion exposed to thalidomide through their mothers taking the tablets. Case-control studies are sometimes described as being retrospective as they are always performed looking back in time. Cohort study (synonyms: follow-up, incidence, longitudinal, prospective study) An observational study in which a defined group of people (the cohort) is followed over time. The outcomes of people in subsets of this cohort are compared, to examine for example people who were exposed or not exposed (or exposed at different levels) to a particular intervention or other factor of interest. A cohort can be assembled in the present and followed into the future (this would be a prospective study or a "concurrent cohort study"), or the cohort could be identified from past records and followed from the time of those records to the present (this would be a retrospective study or a "historical cohort study"). Because random allocation is not used, matching or statistical adjustment at the analysis stage must be used to minimise the influence of factors other than the intervention or factor of interest. Control 1. In clinical trials comparing two or more interventions, a control is a person in the
comparison group that receives a placebo, no intervention, usual care or another form of care.
2. In case-control studies a control is a person in the comparison group without the disease or outcome of interest.
3. In statistics control means to adjust for or take into account extraneous influences or observations.
4. Control can also mean programs aimed at reducing or eliminating the disease when applied to communicable (infectious) diseases.
Controlled clinical trial Refers to a study that compares one or more intervention groups to one or more comparison (control) groups. Whilst not all controlled studies are randomised, all randomised trials are controlled.
9 Clarke M, Oxman AD, editors. Glossary. Cochrane Reviewers Handbook 4.1.1 [updated December 2000]. In: The Cochran Library, Issue 1, 2001. Oxford: Update Software. Updated quarterly.
BOARD APPROVED - 070601
12
Cost-effectiveness analysis An economic analysis that converts effects into health terms and describes the costs for some additional health gain (e.g. cost per additional stroke prevented). Double blind (synonym: double masked) Neither the participants in a trial nor the investigators (outcome assessors) are aware of which intervention the participants are given. The purpose of blinding the participants (recipients and providers of care) is to prevent performance bias. The purpose of blinding the investigators (outcome assessors, who might also be the care providers) is to protect against detection bias. See also blinding, single blind, triple blind, concealment of allocation. Economic analysis (synonym: economic evaluation) Comparison of the relationship between costs and outcomes of alternative health care interventions. See cost-benefit analysis, cost-effectiveness analysis and cost-utility analysis. Effectiveness The extent to which a specific intervention, when used under ordinary circumstances, does what it is intended to do. Clinical trials that assess effectiveness are sometimes called management trials. See also intention-to-treat. Efficacy The extent to which an intervention produces a beneficial result under ideal conditions. Clinical trials that assess efficacy are sometimes called explanatory trials and are restricted to participants who fully co-operate. Observational study (synonym: non-experimental study) A study in which nature is allowed to take its course. Changes or differences in one characteristic (e.g. whether or not people received the intervention of interest) are studied in relation to changes or differences in other(s) (e.g. whether or not they died), without action by the investigator. There is a greater risk of selection bias than in experimental studies (randomised controlled trials). Placebo An inactive substance or procedure administered to a patient, usually to compare its effects with those of a real drug or other intervention, but sometimes for the psychological benefit to the patient through a belief that s/he is receiving treatment. Placebos are used in clinical trials to blind people to their treatment allocation. Placebos should be indistinguishable from the active intervention to ensure adequate blinding.
BOARD APPROVED - 070601
13
Placebo effect A favourable response to an intervention, regardless of whether it is the real thing or a placebo, attributable to the expectation of an effect, i.e. the power of suggestion. The effects of many healthcare interventions are attributable to a combination of both placebo and "active" (non-placebo) effects. Prospective study In evaluations of the effects of healthcare interventions, a study in which people are divided into groups that are exposed or not exposed to the intervention(s) of interest before the outcomes have occurred. Randomised controlled trials are always prospective studies and case control studies never are. Concurrent cohort studies are prospective studies, whereas historical cohort studies are not (see cohort study), although in epidemiology a prospective study is sometimes used as a synonym for cohort study. See retrospective study. Randomisation (spelled randomization in US English) Method used to generate a random allocation sequence, such as using tables of random numbers or computer-generated random sequences. The method of randomisation should be distinguished from concealment of allocation because of the risk of selection bias despite the use of randomisation, if there is not adequate allocation concealment. For instance, a list of random numbers may be used to randomise participants, but if the list is open to the individuals responsible for recruiting and allocating participants, those individuals can influence the allocation process, either knowingly or unknowingly. Randomised controlled trial (RCT) (Synomym: randomised clinical trial) An experiment in which investigators randomly allocate eligible people into intervention groups to receive or not to receive one or more interventions that are being compared. The results are assessed by comparing outcomes in the treatment and control groups. NOTE: when using randomised controlled trial as a search term (publication type) in MEDLINE, the US spelling (randomized) must be used. Retrospective study A study in which the outcomes have occurred to the participants before the study commenced. Case control studies are always retrospective, cohort studies sometimes are, randomised controlled trials never are. See prospective study. Validity (synonym: internal validity) Validity is the degree to which a result (of a measurement or study) is likely to be true and free of bias (systematic errors). Validity has several other meanings, usually accompanied by a qualifying word or phrase; for example, in the context of measurement, expressions such as "construct validity", "content validity" and "criterion validity" are used. The expression "internal validity" is sometimes used to distinguish validity (the extent to which the observed effects are true for the people in
BOARD APPROVED - 070601

14
a study) from external validity or generalisability (the extent to which the effects observed in a study truly reflect what can be expected in a target population beyond the people included in the study). (See also methodological quality, random error.)
BOARD APPROVED - 070601
15
ANNEX II: ACKNOWLEDGEMENTS This document is based on an intensive debate within EUCOMED, informed by an HTA Experts Group, comprising experts from within and from outside the medical device industry. The responsibility for the Industry Position derived from that debate and stated above remains entirely with EUCOMED and should not be ascribed to any of the individuals involved. EUCOMED would like to thank the following experts for their valuable contributions to that debate: Frederic Fleurette, AFSSAPS, France - José Amate Blanco, Agencia de Evalución de Tecnologias Sanitarias, Spain - Martin Buxton, Brunel University, United Kingdom - Bernhard Gibis, National Association of Physicians and Sickness Funds, Germany - Claude LePen, CLP Santé, France - John Place, EDMA, Belgium - Rito Bergemann, IMOR GmbH, Germany - David McDaid, London School of Economics, United Kingdom - Frederic Daoud, Medalliance, France - Andrew Dillon, NICE, United Kingdom - Rod Taylor, NICE, United Kingdom - Matthias Perleth, University of Hannover, Germany - Alain Joseph, Baxter - Françoise Roca, 3M - Michael Kreuzer, ABHI, United Kingdom - Luigi Mazzei, Assobiomedica, Italy – Paolo Gazzaniga, Assobiomedica, Italy - Antoinette Wenk-Lang, Boston Scientific - Gabriela Soskuty, Johnson & Johnson - Graham Stokoe, Guidant - Peter de Jong, Johnson & Johnson c/o Cordis - Laurent Metz, Johnson & Johnson c/o Ethicon - Paolo Gianese, Johnson & Johnson c/o Ethicon - Paul Trueman, Johnson & Johnson Medical - Manual Liebana, Medtronic - Christine Muzel, Medtronic - Brigitte Casteels, Medtronic - Fred Halverson, Medtronic - Michel Lussier, Novoste - John Posnett, Smith & Nephew - Sukh Sanghera, Smith & Nephew - Sorrel Wolowacz, Smith & Nephew - Malcolm Carlisle, Smiths Group - Jacques Dumont, Snitem, France - Robert Weinberger, W.L. Gore & Associates. Louis Christian Clauss, Baxter – Markus Siebert, EUCOMED Many thanks also to the Advanced Medical Technology Association (AdvaMed), USA, for valuable contributions.
BOARD APPROVED - 070601

157
ANNEX 13: UNCOMPENSATED COSTS EMBEDDED IN THE PURCHASE PRICE OF A PACEMAKER OR IMPLANTABLE CARDIOVERTER-DEFIBRILLATOR (ICD)
Pacemaker: Implant: 30-60mins Post-op check: 30 mins Clinics: 15 min each, 2 times per year, 12 years longevity= 6 hours per patient Travelling time: 30 to 60 mins per implant and per clinic Waiting time: 30mins to 4 hours per implant, 30-60 mins per clinic Approx Total lifetime hours for a standard, uncomplicated pacemaker: 58 hours ICD: Implant: 60-90mins Post-op check: 45 mins Clinics: 1st year: 30min, 3 times per year 2-4th year: 15min, 2 times per year 5-6th year: 30min, 4 times per year Total clinic time per life of ICD: 6.5 hours Travelling time: 30 to 60 mins per implant and per clinic Waiting time: 30mins to 4 hours per implant, 30-60 mins per clinic Approx Total lifetime hours for a standard, uncomplicated ICD: 25.75 hours Other * Emergency after hours call outs to hospitals: 1 per qtr per rep for 3 hours each call out * Call out to reprogram before and after other surgery: 1 per week per rep for 4 hours each call out * Call outs to check correct operation before and after radiotherapy: 1 per month per rep for 4 hours each call out Additional Costs: * Toll roads: $100 to $400 per quarter per rep * Hospital parking: $60 to $350 per month per rep * Country trips: All reps cover a country region requiring regular travel, accommodation and meals. Sometimes, (e.g., Hobart. Townsville, Cairns, NSW South Coast, Wagga Wagga, Armidale) this involves flights with airfares of approx $450 each. * Opportunity Cost: Whilst reps are performing clinics and call outs, they are unable to perform their main task of promoting sales. To help overcome this, we have

158
employed Clinical staff to only do implants and clinics in the private market. In NSW, this represents 25% of CRMD staff. * Training: All sales and clinical staff require initial and on-going training in both the technical and the clinical aspects of not only current and future devices, but also on devices that have been implanted in the last 12 years as they are still being followed up.
159
ANNEX 14: GLOSSARY ACA Australian Consumers Association ACE inhibitors angiotensin converting enzyme inhibitors AIDS acquired immune deficiency syndrome AMI acute myocardial infarction ARTG Australian Register of Therapeutic Goods ASERNIP-S Australian Safety and Efficacy Register of New Interventional
Procedures – Surgical BMS care metal stents CABG coronary artery bypass graft CAG Clinical Advisory Group (Prostheses) CAKR computer-assisted knee replacement CAOS computer-assisted orthopaedic surgery CAS computer-assisted surgery CGMS continuous glucose monitoring system CHD coronary heart disease CHF congestive heart failure CRT cardiac resynchronization therapy CSSI continuous subcutaneous insulin infusion CT computed tomography CTC Clinical Trials Centre (of NH&MRC) DCCT Diabetes Control and Complications Trial DES drug-eluting stent DOHA Department of Health and Ageing EDIC Epidemiology of Diabetes Interventions and Complications
Research Group ET energy transfer GDP gross domestic product HbA1C glycosolated haemoglobin HealthPACT Health Policy Advisory Committee on Technology HTA health technology assessment ICDs implantable cardioverter-defibrillator ICU intensive care unit IDDM insulin-dependent diabetes mellitus IgM immunoglobulin M ISR in-stent restenosis IVB intravascular brachytherapy LOS length of (hospital) stay MBS Medical Benefits Schedule MDI multiple daily injection MI myocardial infarction MIAA Medical Industry Association of Australia MRA Mutual Recognition Agreement MSAC Medical Services Advisory Committee NAA nucleic acid amplification NH&MRC National Health & Medical Research Council NHSU National Horizon Scanning Unit NICE National Institute for Clinical Excellence (UK) NYHA New York Heart Association

160
OTC over the counter (non-prescription) PAG Policy Advisory Group (Prostheses) PBAC Pharmaceutical Benefits Advisory Committee PBS Pharmaceutical Benefits Scheme PCI percutaneous coronary interventions PCR polymerase chain reaction PDC Prostheses & Devices Committee PET positron emission tomography PHI private health insurance PTCA percutaneous coronary intervention with angioplasty alone QALY quality-adjusted life year R&D research & development RACS Royal Australasian College of Surgeons RCT Register of Clinical Trials SDA strand displacement amplification TGA Therapeutic Goods Administration TKR total knee replacement TTA Trans-Tasman Agency UKPDS United Kingdom Prospective Diabetes Study VLU venous leg ulcer