productive time in education a review of the effectiveness of
TRANSCRIPT

PRODUCTIVE TIME IN EDUCATION A review of the effectiveness of teaching time at school, homework and extended time outside school hours1 Jaap Scheerens (Ed.) With contributions from Jaap Scheerens, Maria Hendriks, Hans Luyten, Peter Sleegers and Cees Glas
1This study was financially supported by a grant from the PROO (Program Committee for Educational Research), which is part of the Dutch Foundation for Scientific Research (NWO).

ACKNOWLEDGEMENT This report benefitted from the input of Peter Sleegers, who, apart from his contribution to chapter 3, critically reviewed the other chapters, and gave many helpful suggestions. Carola Groeneweg took care of the technical editing of the report.

TABLE OF CONTENTS INTRODUCTION 1 Jaap Scheerens CHAPTER 1: STATE OF THE ART OF TIME EFFECTIVENESS 5 Jaap Scheerens, Maria Hendriks Annex to Chapter 1: Operational interpretations of “time” 23 CHAPTER 2: TIME IN INTERNATIONALLY COMPARATIVE STUDIES 25 Jaap Scheerens, Hans Luyten, Cees Glas25 CHAPTER 3: META-ANALYSES 47 Maria Hendriks, Hans Luyten, Jaap Scheerens, Peter Sleegers CHAPTER 4: RELEVANCE OF THE FINDINGS FOR EDUCATIONAL 71
POLICYAND FURTHER RESEARCH Jaap Scheerens SUMMARY IN DUTCH; NEDERLANDSE SAMENVATTING 85 Jaap Scheerens Annex to Chapter 3: Tbles of vote counting and meta-analyses 96


1
INTRODUCTION Jaap Scheerens The meaning of time as a factor in educational productivity Time for schooling and teaching is one of the most straightforward policy amenable variables to try and improve educational outcomes. The underlying notion, namely that good schooling and teaching depends on the “exposure” of students is similarly clear and plausible. Yet, when it comes to assessing the actual effects of time on educational outcomes, some intricacies should be dealt with. First of all time can be defined in a “gross” and “net” way. The officially mandatory school time and lesson time per subject, usually indicated as “allocated time” is to be seen as a gross measure. What relatively autonomous schools actually realize, in terms of subtracted time loss, as well as added extra time is a step in the direction of defining “net” time, in this case sometimes indicated as “exposed time”. Even closer to “net” time is the proportion of time that remains of a lesson after subtraction of the time the teacher requires to organize the classroom and to keep order. Stallings and Mohlman (1981) estimate this latter percentage (time for organization and keeping order) at 15% and Lam, based on an analysis of Dutch primary schools, at 7% (Lam, 1996). This measure can be indicated as “net teaching time”. Ultimately the effective learning time of students could be defined as the percentage of on task behavior of students during lessons; “time on task”. Secondly, the issue of educational time does not remain limited to optimizing regular “within school time”. Since decades, policies to expand the school year, school week or school day are applied in countries like the USA and Asian countries like Japan and Korea, and more recently such policies also happen in the Netherlands (Oberon, 2009). Homework and homework support can be placed as an in between category, on the one hand as closely linked to regular within school teaching, on the other hand as added, out of school time. A third issue is that the estimated positive impact of time on student outcomes, the more time the better performance, is not linear, and shows diminishing returns, which means that after a certain level the incremental benefits of even more time become smaller. Fourth and finally, when we expect that more time, or more effectively used time, enhances student performance, it is implied that the additional time is well used, in other words that more content is being covered and that instructional provisions are in place. In empirical studies that investigate the impact of time on student achievement, sufficient content coverage and quality of transmission, should ideally be controlled for, when treatments of varied time and exposure are compared. One might even say that quality and time, or “quantity and quality” of education, to use Walberg’s words (Walberg, 1986) provide a trade-off, in the sense that high quality education can, to some degree, compensate for long lesson hours. Finland’s impressive achievement on international assessments, such as TIMSS and PISA, is a case in point. Finland’s high scores in subjects like reading literacy, science and mathematics are realized on the basis of a relatively limited obligatory lesson hours in lower secondary education (about 680, as compared to about 1000 in the Netherlands). One might say that the quality of education in Finland stands at such a high level that one can do with fewer lesson hours. Even more contingencies and trade-offs appear when time is related to the capacity and motivation of students. As will be documented further in later chapters, students with different aptitudes and socio economic background react differently to programs of expanded or enhanced time. The first integrated model of effective teaching, the Carroll model, sheds more light on this kind of time related contingencies. To illustrate this and

2
because this model lies at the basis of further development in the field of instructional effectiveness it is being described in some more detail, below. The Carroll model The Carroll model consists of five classes of variables that are expected to explain variations in educational achievement. All classes of variables are related to the time required to achieve a particular learning task. The first three factors are directly expressed in terms of amounts of time the two remaining factors are expected to have direct consequences for the amount of time that a student actually needs to achieve a certain learning task. The five classes of variables are: aptitude; variables that determine the amount of time a student needs to learn a given task
under optimal conditions of instruction and student motivation; opportunity to learn; the amount of time allowed for learning; perseverance; the amount of time a student is willing to spend on learning the task or unit
of instruction (the actual learning time is the smallest of these three time variables). quality of instruction; when the quality of instruction is sub-optimal, the time needed for
learning is increased; ability to understand instruction, e.g. language comprehension, the learners' ability to
figure out independently what the learning task is and how to go about learning it (Carroll, 1963, 1989).
The model can be seen as a general, encompassing causal model of educational achievement. In a later attempt to formulate a comprehensive model of educational productivity (Walberg, 1984) the basic factors of the Carroll model remained intact, while an additional category of environmental variables was included. Numerous research studies and meta-analyses confirmed the validity of the Carroll model (see chapter 5). The Carroll model has also been the basis for Bloom's concept of mastery learning (Bloom, 1968) and is also related to "direct instruction", as described by Rosenshine (1983). Characteristics of mastery learning are:
1) Clearly defined educational objectives. 2) Small discrete units of study. 3) Demonstrated competence before progress to later hierarchically related units. 4) Remedial activities keyed to student deficiencies. 5) Criterion-referenced rather than norm-referenced tests (Block & Burns, 1970).
Direct instruction also emphasizes structuring the learning task, frequent monitoring and feedback and high levels of mastery (success rates of 90 to 100% for initial tasks) in order to boost the self-confidence of the students. The one factor in the original Carroll model that needed further elaboration was "quality of instruction". As Carroll pointed out himself in a 25-year retrospective of his model, the original formulation was not very specific about the characteristic of high-quality instruction "but it mentions that learners must be clearly told what they are to learn, that they must be put into adequate contact with learning materials, and that steps in learning must be carefully planned and ordered" (Carroll, 1989, p. 26). The cited characteristics are to be seen as a further operationalization of this particular factor, which is of course one of the key factors (next to providing optimal learning time) for a prescriptive use of the model. Incidentally it should be noted that Carroll's reference to students who must be put into adequate contact with learning materials, developed into a concept of "opportunity to learn" different from his own. In Carroll's original formulation, opportunity to

3
learn is identical to allocated learning time, while now opportunity to learn is mostly defined in terms of the correspondence between learning tasks and the desired outcomes. Synonyms for this more common interpretation of opportunity to learn are: "content covered" or "curriculum alignment" (Berliner, 1985, p. 128). In more formal mathematical elaborations the variable "prior learning" has an important place (Aldridge, 1983; Johnston & Aldridge, 1985). The factor allocated learning time has been further specified in later conceptual and empirical work. Karweit and Slavin (1982), for instance, divide allocated learning time (the clock time scheduled for a particular class) into procedural time (time spent on keeping order, for instance) and instructional time (subject matter related instruction) and time on task (the proportion of instructional time during which behavior appropriate to the task at hand took place). Ability to understand instruction can be seen as the basis for further elaboration in the direction of learning to learn, meta-cognition, etc. The comprehensiveness of the Carroll model is shown by this potential to unite two schools of instructional psychology, the behaviorist-inspired structured teaching approaches and the cognitive school (cf. Bruner, 1966; De Corte & Lowyck, 1983). The focus of this study Conform the contractor’s listing of objectives for a review study on educational time (NWO, 2011), this study seeks to clarify the concept of educational time, including extra time outside official lesson hours, provide information on effects of expanded and enhanced learning time, and describe the international position of the Netherlands on education time. The methods used are, literature review, meta-analysis and secondary analyses (based on PISA 2009 data). In the final chapter, specific attention will be paid to the issue of time in current educational debate in the Netherlands. References Aldridge, B.G. (1983). A mathematical model for mastery learning. Journal of Research in Science
Teaching, 20, 1-17. Berliner, D.C. (1985). Effective classroom teaching: the necessary but not sufficient condition for
developing exemplary schools. In: G.R. Austin & H. Garber (Eds.), Research on exemplary schools [pp. 127-154]. Orlando, FL: Academic Press.
Block, J.H., & Burns, R.B. (1970). Mastery Learning. Review of Research in Education, 4, 3-49. Bloom, B.S. (1968).Learning for Mastery. Washington, DC: ERIC. Bruner, J.S. (1966). Toward a Theory of Instruction. Cambridge, Mass: Belknap Press of Harvard
University. Carroll, J.B. (1963). A model of school learning. Teachers College Record, 64, 722-733. Carroll, J.B. (1989). The Carroll Model, a 25-year retrospective and prospective view. Educational
Researcher, 18, 26-31 De Corte, E. & Lowyck, J. (1983). Heroriëntatie in het onderzoek van het onderwijzen. [Research on
teaching reconsidered]. Tijdschrift voor Onderwijsresearch, 8(6), 242-261. Johnston, K.L., & Aldridge, B.G. (1985).Examining a mathematical model of mastery learning in a
classroom setting. Journal of Research in Science Teaching, 22(6), 543-554. Karweit, N., & Slavin, R.E. (1982). Time on task: issues of timing, sampling and definition. Journal of
Educational Psychology, 74, 844-851. Lam, J.F. (1996).Tijd en kwaliteit in het basisonderwijs (Time and quality in primary
education). Enschede: University of Twente (dissertation). NWO (2011). Programma voor Onderwijsonderzoek (PROO) – Review Studies. Call for
proposals 2011. Den Haag: Nederlandse organisatie voor Wetenschappelijk Onderzoek.

4
Oberon (2009). Een oriëntatie naar verlengde onderwijstijd. Inrichting en effecten. Utrecht: Oberon.
Rosenshine, B.V. (1983). Teaching functions in instructional programs. Elementary School Journal, 3, 335-351.
Stallings, J., & Mohlman, G. (1981). School policy, leadership style, teacher change and student behavior in eight schools. Final report to the National Institute of Education, Washington D.C.
Walberg, H. J. (1986). Synthesis of research on teaching. In M. C. Wittrock (Ed.), Handbook of research on teaching (Vol. 3, pp. 214-229). New York, NY: Macmillan.
5
CHAPTER 1: STATE OF THE ART OF TIME EFFECTIVENESS Jaap Scheerens, Maria Hendriks In this chapter comprehensive reviews and earlier meta-analyses will be summarized to arrive at an impression of the effectiveness of the various ways in which educational time can be intensified, enhanced and expanded. The chapter has three main sections, one on “within school time”, one on homework and one on expanded school time, beyond regular lesson hours. In these three sections key publications will be used to provide a concise description of the way the time variable is defined and applied in regular school activities or special programs. Next, reviews and meta-analyses will be used to establish the degree of impact of time related interventions on student achievement and other outcome indicators, including occasionally social and behavioral outcomes. Time for teaching and learning at school Conceptualization As stated in the introduction, the conceptualization of effective time at school was developed on the basis of John Carroll’s model (Carroll, 1963, 1989). As a matter of fact the basic type of variable used in subsequent effect studies on time, was the variable that Carroll called “opportunity to learn”, the allowed, or available time for learning. In more comprehensive models of teaching effectiveness like mastery learning and direct teaching, additional variables that related to content covered and quality of instruction were added. Subsequent studies between 1980 and 2000, were generally based on three distinct categories of time:
- allocated time - time on task - academic learning time (Anderson, 1980; Haertel, Walberg & Weinstein,1983;
Poway, 2002). Allocated time is the amount of time that is formally specified, further subdivisions are school time and classroom time Instructional time is equal to what was indicated under “exposure” in the introduction, a kind of “net” measure of “engaged” teaching time, leaving aside time for organizational arrangements and keeping order during lesson hours. Time on task is the amount of time that students are actively engaged in learning tasks during lesson hours. According to Poway (2002), time on task refers to portions of time when students are paying attention to learning tasks and attempting to learn. “Engaged time excludes the time students spend socializing, wandering about with no apparent purpose, daydreaming, or out of the classroom”. The following instructional conditions are associated with time on task: interactive activities with a teacher, carefully prepared activities and closely monitored seat work, focusing students’ thoughts on cognitive strategies and on motivational tasks, immediate feedback, focused questions, praise and reinforcement, listening and thinking, discussion, review, thinking out loud and drill and practice (Poway, 2002) Academic learning time refers to that portion of engaged time that students spend working at an appropriate level of difficulty for them and experiencing high levels of success. It excludes engaged time that is spent on tasks that are too easy or too difficult (Anderson, 1983; Bloom, 1976;Fisher, Berliner, Filby, Marliave, Cahen & Dishaw, 1980; Poway, 2002).
6
It is our impression that this literature has difficulty in presenting an unequivocal conceptualization of time on task. Additional elements are already creeping in as far as time on task is concerned, see for example Poways’ list of time on task instructional conditions that require certain qualities of teacher preparation and monitoring. The concept of academic learning time is totally confounded with specific didactic requirements (facets of teaching quality one might say; like the requirement that the task should be of an appropriate level of difficulty) and even circular in a context of educational productivity, as it builds in academic success. Given the truism that time is an empty vessel, the “pure effects” of engaged time at school could only be disentangled from other effectiveness enhancing conditions, by keeping these contexts constant or otherwise controlled, when assessing the impact of various quantities of time. This is what happens, for example, in what Wang indicates as “content exposure”, where time engaged with respect to a specified chunk of subject matter is investigated (Wang, 1998). In fact some authors describe exposure time as an intrinsic characteristic of opportunity to learn (e.g. Brophy & Good, 1984). The concept of academic learning time goes much further in messing together time and other aspects of teaching quality and tends toward a rudimentary multidimensional model of teaching effectiveness. A specific facet of engaged time is the pacing of instruction, distinguishing for example, spaced and massed2 practice. (see also Brophy and Good, 1984, on the tempo of spacing and waiting time). This variable is again more of an interactive concept that mixes time and content, and is therefore not suited to assess the effect of time per se. Meta analyses Fraser, Walberg, Welch and Hattie (1987) present results from meta- analyses based on “several thousands of studies”. “Time” is defined as “instructional time”, not specifying whether this is allocated time, engaged time, or time on task. The impression one gets is that all of these operationalizations have been combined. It should be noted that these meta-analyses contain many other school and classroom level correlates of educational achievement, time is just one of them. They report an average effect size of d = .36. Of this result they say that it is neither the chief determinant, nor a weak correlate of learning. “like the other essential factors, time appears to be a necessary ingredient, but insufficient by itself to produce learning” (p.160). They emphasize that the factors presented in Walberg’s model of educational productivity (Walberg, 1986) should be seen as operating jointly. The authors also state that increasing time is likely to show diminishing returns. In a second study by the same authors (Fraser et al, ibid) results of a synthesis of (134) meta-analyses are presented (involving 7827 studies and 22155 correlations). The effect sizes are now rendered as correlations; for engaged time and time on task they are .38 and .40, respectively. These effect sizes are about twice as large as those reported in the above. This might be explained by the possibility that the first meta-analyses used a more general definition of time, including allocated time, whereas the second meta-analysis of meta-analyses used the more restricted definitions of engaged time and time on task. Re-addressing the issue of diminishing returns of time, particularly when this not accompanied by adequate content coverage and instruction, the authors say that the task is rather to “arrange matters so that student learn more in the same time”.
2 Massed practice refers to working for extended time on specific subject matter, whereas spaced practice means more frequent engagement on smaller chunks of subject matter
7
Since these meta-analysis results are carried out for a lot of other malleable variables that are expected to correlate with student achievement, it is possible to assess the relative importance of time, as compared to other factors, like feedback and reinforcement, one to one tutoring, homework etc. The position of time in the first meta-analyses is about average, whereas the effects reported for engaged time and time on task in the synthesis of meta-analyses, is fairly high, quality of instruction, for example has an effect size of r = .47. It should be noted that these studies use broad generalizations, both with respect to the dependent variables (like mathematics, science and reading all thrown together) and with respect to the independent variables, it seems that allocated time, engaged time and time on task are all analyzed together. Next, there is no mention of studies being experimental or observational, and, in the latter case, whether outcomes were adjusted for prior achievement or other student background characteristics. Scheerens, Luyten, Steen and Luyten-de Thouars (2007) combined the results of a meta-analysis on studies before 1995 with studies that were carried out between 1995 and 2005. Several operational definitions of time at school were combined.
learning time • importance of effective learning • time • monitoring of absenteeism • time at school • time at classroom level • classroom management
In the Annex to this chapter a more detailed overview of operational variables, cited from this study, is presented. The number of studies used for the analyses was 30, including 111 effect sizes (associations between time and educational achievement. In their analyses moderator variables referring to study characteristics were included. The results were as follows: The estimated mean effect size of learning time was a correlation coefficient of 0.147 (significant at the 1% level). Indicating that the 95% prediction interval ranges between Zr =-0.0197 and Zr = 0.491 The analysis relating moderators to the effect size indicate that studies carried out in secondary schools show significantly lower effect sizes than studies in primary schools (a difference of -.185), while studies employing other than multi-level techniques yield significantly higher effect sizes than studies that had applied multi-level techniques( a difference of 0.21). Finally, there was also a difference between countries. Studies carried out in the Netherlands came up with significantly lower effect sizes than all other countries, excluding the USA (a difference of -0.145 ). On average, the effect size of Dutch studies was about 0.05. As compared to other effect sizes for school effectiveness enhancing variables in this study, time had about the highest effect. Kyriakides, Creemers, Antoniou and Demetriou (2010) conducted a meta-analyses that involved school and classroom level variables incorporated in the dynamic model of educational effectiveness (Creemers & Kyriakides, 2008). “Management of time”, is one of the school level factors that was incorporated. It is described as: “school policy on the management of teaching time”, and considers issues like whether lessons start on time and finish on time, and the (non)-occurrence of interruptions of normal lesson time, due to staff meeting, festivals and other school event. In their summary table they use the term “quantity
8
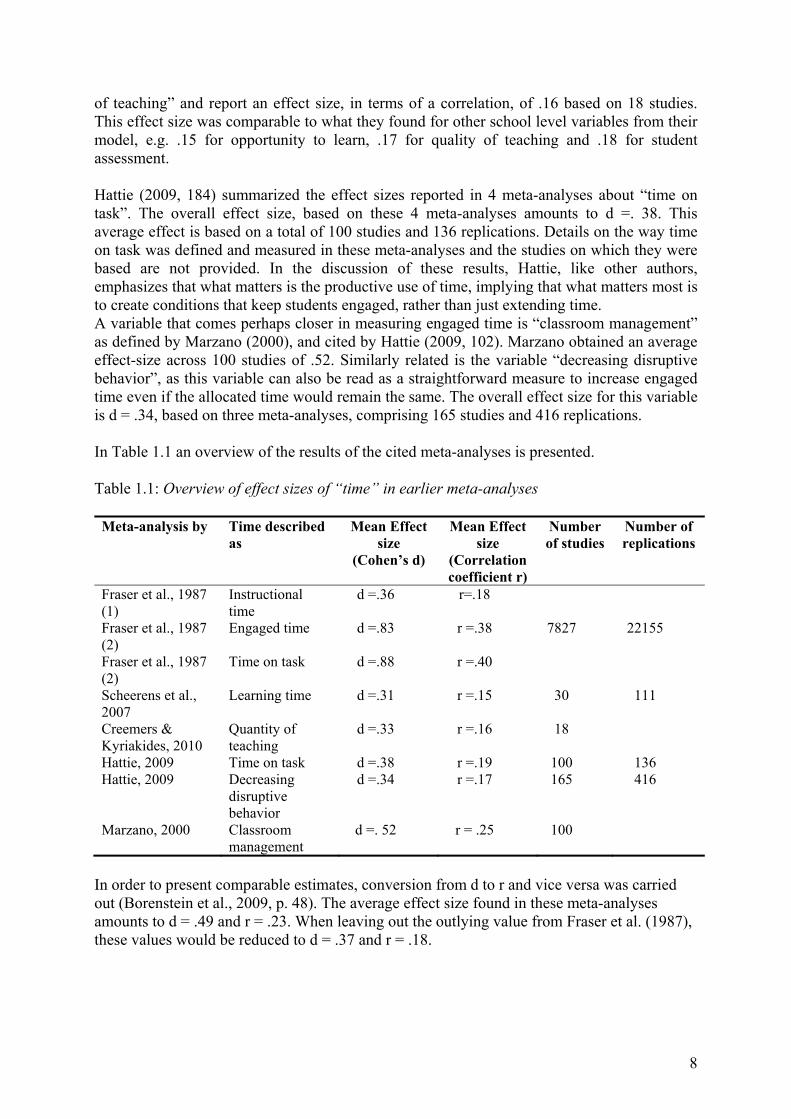
of teaching” and report an effect size, in terms of a correlation, of .16 based on 18 studies. This effect size was comparable to what they found for other school level variables from their model, e.g. .15 for opportunity to learn, .17 for quality of teaching and .18 for student assessment. Hattie (2009, 184) summarized the effect sizes reported in 4 meta-analyses about “time on task”. The overall effect size, based on these 4 meta-analyses amounts to d =. 38. This average effect is based on a total of 100 studies and 136 replications. Details on the way time on task was defined and measured in these meta-analyses and the studies on which they were based are not provided. In the discussion of these results, Hattie, like other authors, emphasizes that what matters is the productive use of time, implying that what matters most is to create conditions that keep students engaged, rather than just extending time. A variable that comes perhaps closer in measuring engaged time is “classroom management” as defined by Marzano (2000), and cited by Hattie (2009, 102). Marzano obtained an average effect-size across 100 studies of .52. Similarly related is the variable “decreasing disruptive behavior”, as this variable can also be read as a straightforward measure to increase engaged time even if the allocated time would remain the same. The overall effect size for this variable is d = .34, based on three meta-analyses, comprising 165 studies and 416 replications. In Table 1.1 an overview of the results of the cited meta-analyses is presented. Table 1.1: Overview of effect sizes of “time” in earlier meta-analyses Meta-analysis by Time described
as Mean Effect
size (Cohen’s d)
Mean Effect size
(Correlation coefficient r)
Number of studies
Number of replications
Fraser et al., 1987 (1)
Instructional time
d =.36 r=.18
Fraser et al., 1987 (2)
Engaged time d =.83 r =.38 7827 22155
Fraser et al., 1987 (2)
Time on task d =.88 r =.40
Scheerens et al., 2007
Learning time d =.31 r =.15 30 111
Creemers & Kyriakides, 2010
Quantity of teaching
d =.33 r =.16 18
Hattie, 2009 Time on task d =.38 r =.19 100 136Hattie, 2009 Decreasing
disruptive behavior
d =.34 r =.17 165 416
Marzano, 2000 Classroom management
d =. 52 r = .25 100
In order to present comparable estimates, conversion from d to r and vice versa was carried out (Borenstein et al., 2009, p. 48). The average effect size found in these meta-analyses amounts to d = .49 and r = .23. When leaving out the outlying value from Fraser et al. (1987), these values would be reduced to d = .37 and r = .18.

9
Conclusions Compared to the effects of other educational effectiveness enhancing conditions the mean effect size computed on the basis of the results shown in Table 1.1, is to be seen as a sizeable effect, although compared to general effect size standards (Cohen, 1969) still a small effect. According to Cohen, effect sizes rendered as correlations of .10, .30 and .50 are to be interpreted as small, medium and large, respectively. When d is used to express effect sizes these values are .2, .5 and .8. When interpreting these results, two limitations should be taken into consideration. Firstly it appears that in most of the analyses a broad range of different operational definitions of time was used in the studies on which the meta-analyses were based, see for example the range of options shown in the annex, based on Scheerens et al. (2007). In most publications the variability in operational definitions is not made explicit. Secondly, these meta-analyses are based on bi-modal associations, in this case between time and educational achievement, mostly reading and mathematics achievement. In case of correlation of time with other effectiveness enhancing factors, for instance, opportunity to learn, it is likely that the time effect will also include some influence from these other variables. The relatively high effect sizes would suggest support for the common sense consideration that when schools pay attention to effective use of time, and to foregoing time loss and disruptions, they would also be likely to make good use of time, in other words fill the available time with good quality teaching and instruction. To the degree that studies have succeeded in measuring engaged or productive learning time this latter condition is more or less part of the construct as defined. A final limitation of the meta-analytical results is that nuances with respect to subject matter area and different effects for different kinds of students are usually not included. On the basis of a review of the literature Poway (2002)states that the effect of time is stronger for highly structured subjects, like mathematics, science and reading, than for the more open subjects like art and social studies. There is also a strong suggestion in the literature that sufficient time is especially important for the weaker students. This notion is one of the core ideas of Mastery Learning. Homework Conceptualization Homework is defined as performing school curriculum tasks outside regular school classes (Cooper, 1994 cited in De Jong, Westerhof & Creemers, 2000, p. 132; Walberg & Paschal, 1995). The assumed benefits expected of homework are: more time, in a situation of curriculum overload, more content, opportunity to learn, more time to understand the subject matter, stimulation of meta-cognition, and improved study skills, fostering independent learning and endurance. Homework is not just to be seen as an individual effort from students. Support and facilitation are expected from school management, teachers and parents. At school level it is relevant whether or not the school has an explicit policy on homework. At the level of teachers, grading of homework and providing feedback are important conditions. And, finally, a supportive and activating role of parents is relevant as well. De Jong et al. (2000) distinguish three facets of homework: amount of homework, homework frequency and time spent on homework. Of these three variables amount of homework was the only one that had a positive significant effect on student achievement. In their study, amount of homework was defined as how many tasks from the math curriculum were finished during homework. So, one could say that the effect of extra time, by means of homework,

10
depended solely on the extra content that was covered. Other authors use terms describing facets of homework differently. Time spent on homework is often defined as the time spent on homework per week. Trautwein, Köller, Schmitz and Baumert (2003) define “amount of homework” as the combination of homework frequency (i.e., frequency of homework assigned by the teacher, a class-level variable) and homework length i.e., the time typically spent on homework per day, a typical student-level variable, which can nevertheless be aggregated at the class level). Schmitz and Skinner (1993) define homework effort as the way students rate their subject effort needed to do homework. From the study by De Jong et al. (2000), it appeared that in Dutch secondary education school homework policies hardly existed. The authors also noted that checking homework is not a routine practice in Dutch secondary schools. The average amount of time that students spent on homework, each time homework was assigned, was 30 minutes. The correlation between time spent on homework and achievement was negative in this study (r = -.15, while carrying out homework assignments during lesson hours correlated positively (r = .15). The negative correlation for homework time could be interpreted in the sense that high performing students spent less time on homework. Trautwein and Köller (2003, p. 133) say about the negative correlation between homework time and achievement that “Overall we assume that time actively spent on learning activities (including homework) fosters achievement, but there is no relationship, or perhaps even a negative relationship between time needed for homework and achievement” As was the case in interpreting the effect of extra or more efficient use of teaching time, effects of homework are not easily definable as a pure matter of time, but strongly conditioned by variables like content covered and quality of teacher support. Trautwein and Köller, (ibid, p. 121) discuss a study by Cool and Keith (1991). These authors found a positive correlation of time spent on homework and achievement of .30, but this effect totally disappeared: “After controlling for motivation, ability, quality of instruction, course work quantity, and some background variables, however, no meaningful effect remained (p. 121)”. Multilevel modeling allows for distinguishing homework time effects at aggregated (school, classroom) level and individual student level. A frequently occurring result is that at aggregate level a positive association is found, and a negative association at the individual student level (Trautwein et al., 2002; Gustavsson, 2010). This could be interpreted as the potentially positive effects of homework policies being off-set at individual level by reversed causation (low achieving students needing more time for homework). Several authors emphasize the relevance and opportunity homework assignments offer for stimulating self-regulated learning, including meta-cognitive strategies and influences of motivation and self-efficacy (Trautwein et al., 2002; Winne& Nesbit, 2010; Zimmerman & Kitsansas, 2005). These latter authors tested a path model in which prior achievement impacted on quality of homework and self-efficacy of students, while these variables in their turn were positively associated with Grade Point Average. As with time on task, spaced versus masses practice has also been studied with respect to homework. Bembenutty (2011) found that that frequent short episodes are better than fewer longer assignments. Meta-analyses Paschal, Weinstein and Walberg (1984) report on a meta-analysis based on (quasi-) experimental studies. Treatments were homework versus no homework, and graded versus non graded homework. They report that in 8 out of 9 comparisons the treatment group did significantly better. Based on 81 comparisons, they found a weighted average effect size of d = .36.

11
Cooper (1989) reports an overall effect size of .21, based on 20 studies. Effect sizes for elementary schools (grade 4-6, d = .15) were lower than for middle schools (grades 7-9, d = .31), while the strongest effects were found at the level of high schools (grades 10-12, d = .64). Effect sizes were weaker in mathematics as compared to language (d = .16). Coopers’ results were criticized for methodological shortcomings (cf. Trautwein et al., 2002). Only in four cases were the effect measures counterbalanced (adjusted for student background characteristics) or were gains reported. In these cases a negative d of - .08 was found, suggesting that the positive overall effect might be confounded by the effect of student background characteristics. A more recent study led by the same author (Cooper, Robinson & Patall, 2006) was largely based on the National Educational Longitudinal Study (NELS). In different sub sets of experimental and cross sectional studies, the effect of homework versus no homework was analyzed. The overall result was an effect size of d = .61. In addition 32 correlational studies were analyzed and they indicated an average effect of r = .24 when applying a fixed effects model and of r = .16 when applying a random effects model. In the 2006 report slightly stronger homework effects were found for mathematics as compared to reading. Scheerens et al. (2007) carried out a meta-analyses in which 21studies and 52 replications were analyzed, yielding a mean effect size of r = .07. By way of illustration the kind of operational measures (questionnaire items) that were used in the underlying studies are summarized in the table below.
homework • attention for assigning homework at school/agreements in school work plan• homework after last (arithmetic) lesson: yes/no • number of homework assignments per week • type of homework (arithmetic/language) (reading/composition writing) • amount of homework • amount of time needed for homework (per day) • extra homework for low-achieving pupils • successes and problems now and 5 years ago with respect to:
- prioritizing homework - a consistent homework policy
• whether homework assignments are graded or not.
When taking account of moderator variables (study characteristics) the effect sizes were substantially higher in the USA and the Netherlands, than in all other countries. No subject effect was found. Hattie (2009, 234) reports an average effect size for homework of d = .29, based on 5 meta-analyses, 161 studies and 295 effects (replications). He draws attention to the findings of Cooper that effects are higher for high school students than for middle school and elementary school students. In his comment he expresses a certain degree of skepticism with respect to the expectations that homework will stimulate higher order cognitive processes and meta-cognition. This is not likely to happen, particularly for low achieving students. According to Hattie, (ibid, p. 235) the effects of homework are highest, whatever the subject, when homework involves rote learning, practice, or rehearsal of the subject matter. In Table 1.2 an overview of the results of the cited meta-analyses is presented together with two additional references to meta-analyses, cited from Marzano and Pickering (2007) (Bloom, 1984; Graue, Weinstein & Walberg, 1983).

12
Table 1.2: An overview of results from meta-analyses on the effects of homework Meta-analysis by Homework
described as Mean Effect
size (Cohen’s d)
Mean Effect size
(Correlation coefficient r)
Number of
studies
Number of replications
Graue et al., 1983 Homework d= .49 r= .24 29
Bloom, 1984 Homework d= .30 r= .15
Paschal et al., 1984
Homework d= .36 r= .18 81
Cooper, 1989 Homework vs No Homework
d= .21 r= .10 20 20
Cooper et al., 2006
Homework vs No Homework
d=. 61 r= .29 18 18
Scheerens et al., 2007
Homework d= .14 r= .07 21 51
Hattie, 2009 Homework d= . 29 r= .14 161 295
Transforming the effect size found in Scheerens et al. (2007) to a d of .14, the average effect size across these meta- analyses amounts to d =. 34. Leaving out the outlying value of d = .61 from the Cooper et al. study (2006), this average reduces to d = .30, r = .15, equal to the average effect size reported by John Hattie based on 5 meta-analyses. An interesting research synthesis that did not present overall effect sizes, but just categorized effect sizes of homework as negative or positive, and small, medium and large, was carried out by the Canadian Council on Learning (2009). They examined the results of three kinds of studies on the achievement effects of homework: net impact studies, pedagogically enhanced homework studies and parental involvement studies. In the domain of the net impact studies 24 outcomes were positive, of which 18 showed outcomes that are described as large enough to have practical significance. Still 8 outcomes showed negative results. On further inspection these 8 negative outcomes all resided from studies by Trautwein, Ludtke, Schnyder and Niggli (2006) and Trautwein (2007), and resulted from multilevel analyses showing moderate positive effects of time spent on homework at school or classroom level, and negative effects at the individual student level. Pedagogically enhanced homework experiments and experiments that stimulated parental involvement with homework showed medium sized positive effects. Conclusion The results of meta-analyses on the effects of homework on achievement show small to medium positive effects. A limitation of these results is that they are usually a mixture of different specifications of homework, and are more to be read as a general overall effect. Individual studies, like the ones by De Jong et al. (2000), Trautwein (2007) and Trautwein et al. (2006), indicate that it matters a lot, which specific operational definition of homework is used. Time spent on homework has mixed effects. When multilevel modeling is applied effects shows up only at the aggregate (school or classroom) level while effects are negligible or negative at individual student level.
13
Amount of homework defined as the quantity of content covered during homework assignment had a clear effect in the study by De Jong et al. (2000). This operational concept is close to what Mooring (2004) calls homework completion, and for which she found a strong effect. Homework effort, is based on students’ ratings of the effort invested in homework. For this variable, Trautwein (2007) reports medium to strong effect sizes. Homework effort and amount of content covered in homework assignments appear to be more powerful associates of achievement than time spent on homework and frequency of homework assignments. After- School programs and extended learning time Conceptualization While homework was defined as students performing learning tasks outside regular school hours, programs that provide activities outside regular school hours include the involvement of adults, either volunteers, youth or social workers and educational professionals. After school programs have a long history in the United States and, where it is still growing in importance. Zief, Lauver and Maynard (2006) state that the amount of after-school programming in the USA has been growing tremendously during the last two decades. In the year 2000 two-thirds of school principals reported that their schools offered these programs. The estimated budget for these programs, including funding from the federal government, states, localities and private foundations were estimated to nearly $1 billion in 2004. According to Zief et al., a “care-taking” motive is predominantly behind this, namely doing something about the fact that growing numbers of children between the ages of 6 and 12 are frequently unsupervised after school, figures that have increased as more women entered the working force. After school programs may be dedicated to fun, community activities, sports and arts, and only a subset has enhanced educational performance as a key objective. After school programs may be carried out in the form of an extended school day, an extended school week, temporary programs outside school hours, or programs during the summer holiday, (summer learning). Miller (2003) mentions four prototypes of After-School Programs: school –age child care, youth development, extended learning and enrichment activities. The major goals of school-age child care are to provide supervision for children of working class families and to support child development. Youth development programs are aimed at promoting youth development and prevent risky behaviors. Extended learning is aimed at improving academic achievement and decrease gaps in academic achievement. Enrichment activities are to increase skills in particular areas (arts, sports) and stimulate interest in various topics and activities. The third prototype program, “extended learning”, is most in line with the overall focus in this report, namely the effect of more efficient use and expansion of structured teaching and learning activities on student outcomes. Among Miller’s four prototypes, extended learning is the only one that has teachers and paraprofessionals as staff, whereas the other prototype programs depend on child care staff, youth workers and “experts in a particular area”. Three major categories of intended outcomes of after-school programs are reducing negative behavior, increased attitudes and behaviors linked to school success and improved academic performance. The first two intended outcomes are mostly associated with child care, youth development and enrichment activities, the last outcome, improved academic performance, is more specifically associated with extended learning. After school programs may have a compensatory purpose, and be specifically designed to support disadvantaged learners, and/or an enrichment purpose, where extra content, like language arts, are offered. A final purpose of after school learning is fostering social and

14
independent learning skills. “Afterschool programs are uniquely poised to help young people to see themselves as learners in an informal hands-on learning environment. They can bring peers, parents and the community together. They can create the foundation for a positive peer culture that values learning skills and contributes to society” (ibid, 29) Current policy in the United States emphases the educational and didactic quality of after school extended learning programs (National Academy of Education, White Paper, 2009). The White Paper suggests that if “extra” just means extending time, the expectations of achievement gains are poor. They cite a study by Levin and Tsang (1987), who found that 10% extra time resulted in 2% more learning. At the same time they refer to a study by Berliner (1990), which supported the claim that if time is purposefully used to enhance achievement outcomes, more gain is actually achieved. Although the White Paper supports the position that programs should be more intensive and structured, they also note that examples of very intensive programs experienced problems of attrition, of staff and students. With respect to the White Paper’s hope that private funding could be a turnaround option, the experiences with Charter Schools do not seem to unilaterally make this promise true. Stein and Bess (2011), report that Charter Schools did not offer more extra learning time than regular schools. Fischer and Klieme (in press) report on experiences with an extended school day in Germany. This policy comes down to extending the traditional lesson hours that are limited to the morning, to afternoon school. The study suggests that the extended school day in Germany has broader pedagogical and social aims than enhanced student achievement in school subjects. Countering misbehavior is one of them. Adult supervision is provided by youth workers and educational professionals. The value of the extended school day for educational achievement depends on the linkage between the school curriculum and the way the extra time is being spent. Effects on school grades were only noted for those students who took active part in curriculum-related activities. Positive effects were noted with respect to countering misbehavior. The British program “Playing for Success”, is targeted at under achieving students (Appelhof, 2009). They are invited to take part in a 2 month intensive program, enforced by soccer players and other sport idols. The aim is to foster self-confidence and to allow for successful experiences. Preliminary evaluations (Sharp, Keys & Benefield, 2001) have shown positive effects on self-confidence. More recent results show diverging success, depending on the intensity of the approach (Sharp et al., 2007, cited by Appelhof, 2009). The objective of this limited international overview was just to show the broad range of program variation in the After-School programs. (In the final chapter of this report, the Dutch policy initiatives and experiences will be referred to). The results obtained obviously depend on the intended outcomes, that may range from extended cognitive school learning, special attention for independent learning, to fostering self-esteem and self-confidence and countering misbehavior. Programs may also have a more or less specifically targeted emphasis on improving the position of disadvantaged learners. Moreover, programs may have a more general care-taking and social and pedagogical monitoring function, as compared to an educational achievement orientation. Meta-analyses Cooper, Charlton, Valentine, Muhlenbruck and Borman(2000) carried out a meta-analysis of remedial and accelerated learning oriented summer school programs. The summer learning programs were classified as accelerated, remedial or other. The average effects size across all 54 programs, and 477 effect sizes based on math and reading achievement, was d =. 26. Cooper et al. (2000) say that this effect size should be considered “small” according to the
15
established norms (Cohen, 1969), but nevertheless comparable to the effect of all kinds of other school year long intervention programs. Borman and d’Agostino (1996), for example, found an overall effect size of .11 for such a general set of intervention programs (ibid., 99). An other reference point to compare effect sizes was Lipsey and Wilson’s (1993) compendium of meta-analyses based on studies in education, mental-health and organization psychology, arriving at an average effect-size across these domains of d= .50. The authors conclude that about 3/4th of the 180 meta-analyses carried out in education had larger effect sizes than theirs on summer learning. In their study students from middle class backgrounds benefitted somewhat more than students from disadvantaged homes, and effects for mathematics were somewhat larger than for reading. Conditions for successful summer learning programs are: early planning of activities, continuity of programs and staff across years, using summer schools in conjunction with professional development activities of staff, and integration of summer learning experiences with those during regular school hours. Scott-Little, Hamann and Jurs (2002, p.388) looked at a broader range of after school programs, than the summer learning programs that were focused in the analysis by Cooper, Nye, Charlton, Lindsay & Greathouse (1996): “After school services were defined as a program offered at the end of the school day where children are involved in planned activities supervised by adults (paid or volunteer)”. These authors studied 34 extended day- and after school programs comprising:
- language arts after school programs - study skill programs - academic programs in other curriculum areas - tutoring programs for reading - community based programs
They succeeded in using effect sizes from only 6 studies, which had used comparison groups. The mean effect sizes found were .16 for mathematics and .21 for reading. The success of programs was seen to depend on:
- structure and a predictable schedule - strong links to the school day curriculum - well-qualified and trained staff - opportunities for one-to-one tutoring
Lauer, Akiba, Wilkerson et al. (2004) published a synthesis of effect studies on extended school time and summer learning. The average (random) effect size for mathematics was .17 and for reading .13, based on 22 math studies and 27 reading studies. Moderator variables in the analyses were, among others, grade level. The programs for mathematics had the highest effect in high school, whereas the reading programs had the highest effect size in elementary school. Effect sizes were larger for programs that lasted more than 45 hours, however, a non-significant effect was found for a program that lasted over 210 hours. The largest results were found for programs that used one-to-one tutoring. They also found that effect sizes were higher for published as compared to non-published sources. Zief et al. (2006) concentrated on after-school programs that operated on a regular basis during the school year (thus excluding summer programs) and include some kind of educational support service. They used rigorous selection criteria (only experimental intervention studies), which left only 5 studies that were amenable to meta-analysis. However, 97 impacts (replications) were included in these 5 studies. They found small effect sizes of .028 on a reading test and .08 for, when outcomes were measured as school grades. No less
16
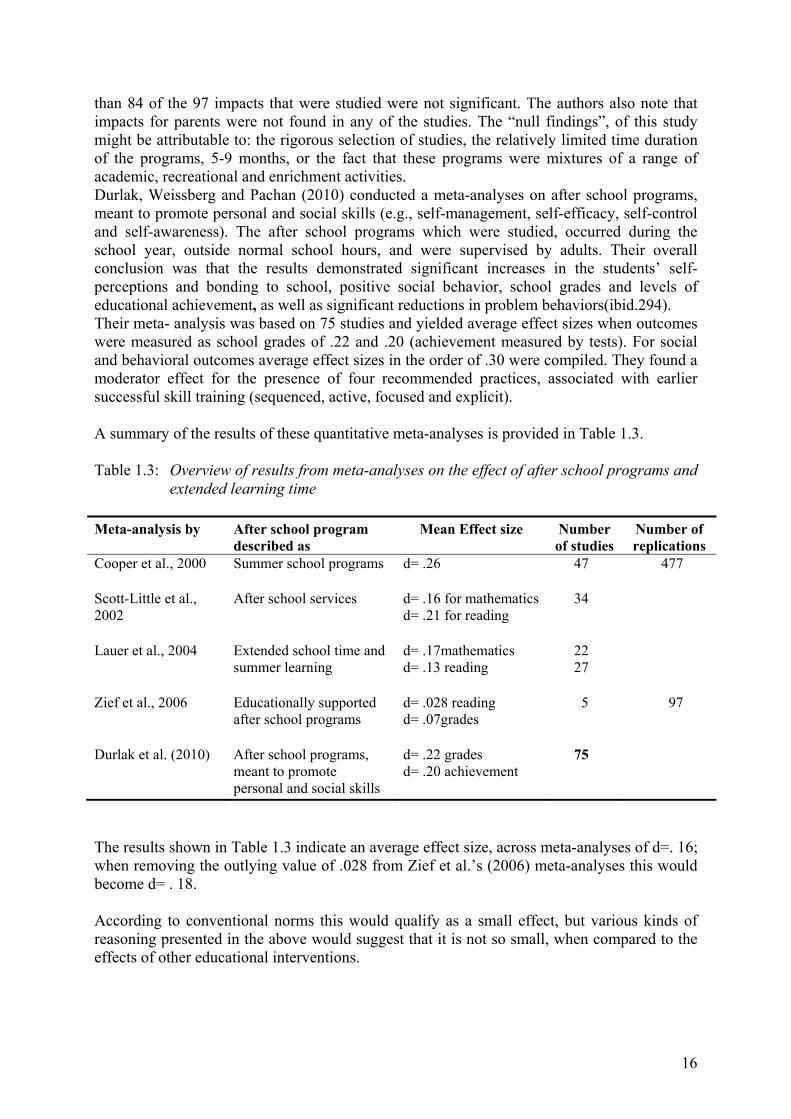
than 84 of the 97 impacts that were studied were not significant. The authors also note that impacts for parents were not found in any of the studies. The “null findings”, of this study might be attributable to: the rigorous selection of studies, the relatively limited time duration of the programs, 5-9 months, or the fact that these programs were mixtures of a range of academic, recreational and enrichment activities. Durlak, Weissberg and Pachan (2010) conducted a meta-analyses on after school programs, meant to promote personal and social skills (e.g., self-management, self-efficacy, self-control and self-awareness). The after school programs which were studied, occurred during the school year, outside normal school hours, and were supervised by adults. Their overall conclusion was that the results demonstrated significant increases in the students’ self-perceptions and bonding to school, positive social behavior, school grades and levels of educational achievement, as well as significant reductions in problem behaviors(ibid.294). Their meta- analysis was based on 75 studies and yielded average effect sizes when outcomes were measured as school grades of .22 and .20 (achievement measured by tests). For social and behavioral outcomes average effect sizes in the order of .30 were compiled. They found a moderator effect for the presence of four recommended practices, associated with earlier successful skill training (sequenced, active, focused and explicit). A summary of the results of these quantitative meta-analyses is provided in Table 1.3. Table 1.3: Overview of results from meta-analyses on the effect of after school programs and
extended learning time Meta-analysis by After school program
described as Mean Effect size Number
of studies Number of replications
Cooper et al., 2000
Summer school programs d= .26 47 477
Scott-Little et al., 2002
After school services d= .16 for mathematics d= .21 for reading
34
Lauer et al., 2004 Extended school time and summer learning
d= .17mathematicsd= .13 reading
22 27
Zief et al., 2006 Educationally supported after school programs
d= .028 readingd= .07grades
5 97
Durlak et al. (2010) After school programs, meant to promote personal and social skills
d= .22 gradesd= .20 achievement
75
The results shown in Table 1.3 indicate an average effect size, across meta-analyses of d=. 16; when removing the outlying value of .028 from Zief et al.’s (2006) meta-analyses this would become d= . 18. According to conventional norms this would qualify as a small effect, but various kinds of reasoning presented in the above would suggest that it is not so small, when compared to the effects of other educational interventions.
17
Discussion Valentine, Cooper, Patall, Tyson and Robinson (2010) present a critical analysis of 12 research syntheses of After School Programs, including most of the ones shown in Table 1.3. They observe great heterogeneity in the coding of what counted as an eligible program to be included in the meta-analyses. This means that the kind of after school programs and extended learning time is much diversified and combining syntheses is only possible at a high level of abstraction. Valentine et al. also observe a similar kind of heterogeneity in the application of methodological criteria for including studies, and the methods that were applied to synthesize information from the underlying studies. Last but not least they say that methodological limitations call for the utmost prudence in drawing causal conclusions. They conclude that in fact “we know very little” about the causal impact of after school programs. One of the major shortcomings is lack of insight in the mechanisms through which after school programs bring about the desired outcomes. More recent meta-analyses that include study characteristics as moderators are a step forward in this direction. An example is the approach followed by Durlak et al. (2010) who included the presence or absence of a preferred methodology for skill development as a moderator variable and concluded that the business of extended learning time could benefit from an evidence based approach. Features of effective after school programs that have been mentioned in this section are:
- alignment of the contents of the program with the regular school curriculum - professional educators and counselors delivering the program - a structured approach - sufficient duration of the program (over 45 hours, was mentioned in one of the
studies). The literature that was reviewed indicates that after school programs have different missions. The most important ones are:
- a care taking function that addresses the problem that young children are left unmonitored for a sizeable amount of time;
- an educational achievement oriented emphasis, which may have either a remedial or an enrichment emphasis, with the former particularly aimed at students from disadvantaged backgrounds;
- a broad approach where social emotional development, involvement with the local community and “life skills” are added to care taking and educational achievement.
As an illustration of a broad orientation in after school programs the “principles of effective out-of-school time programs and summer schools” mentioned by Terzian, Anderson Moore and Hamilton(2009, 27), are cited below.
- Form collaborative partnerships with key stakeholders - Involve families and communities - Utilize well-trained, experienced staff - Offer ongoing staff development - Plan programs deliberately - Make programs affordable and accessible - Promote positive relationships with caring adults - Provide positive role models - Reward good behavior

18
- Teach school cognitive skills, life skills, and character development - Make learning fun and hands on - Intervene more intensively with at-risk students - Evaluate programs continually to inform design and implementation
Conclusions Effective use of regular school time, homework and extra out-of-school time appears to have small to moderate positive effects on educational achievement in basic subjects, mathematics and reading. The average effect sizes for these three “arena’s” for optimizing learning time are .37, .29 and. 18, respectively. These coefficients should be interpreted with some caution, however. Meta-analyses that have investigated the effects of regular school time usually throw together a range of different “treatments”, varying from increments in “statutory”, official school or teaching hours, to more efficient use of teaching time, time on task, and “quality time”. Moreover, in order to be effective it is obvious that time should be “filled” with relevant educational exposure, particularly in terms of content covered but also in term of effective teaching processes. In empirical studies these variables are not always controlled for, so that it should be assumed that “time” effects pick up the effects of content covered and teaching quality. Studies on the effects of homework seem to underline this point. On the few occasions that pure time effects, in terms of frequency and duration of homework assignments could be separated from content covered, it was the latter facet, indicated as “amount” of homework, which appeared to be the most important (De Jong et al., 2000). Of the three major strategies to manipulate time in education the third one, out-of-school learning is the most heterogeneous one. This is particularly the case because after school programs often have broader pedagogical and care-taking objectives than just enhancing student achievement. The cited meta-analyses reflect this heterogeneity, and it is therefore understandable that the average effect size is more modest, as compared to the effects of time at school and homework, because not all of the available time is dedicated to academic objectives. A second reason to interpret the coefficients carefully has to do with methodological flaws in the original studies as well as the meta-analyses (Kane, 2004; Kohn, 2006;Trautwein et al., 2006;Canadian Council, 2009; Valentine et al., 2010;Redd, Boccanfuso, Walker, Princiotta, Knewstub & Moore,2012). Kane (2004) argues that a reasonable expectation for the effect size of After School Programs, is low as between d= .05 and .07. Kohn provides a “taxonomy of abuses” in studies that have attempted to assess the effect of homework and concludes, after a thorough review of the literature, that there is virtually no evidence that unequivocally supports the expectation that homework has beneficial effects on academic achievement or on attitudes that would be supportive of independent learning. Valentine et al. (2010) critically analyzed 12 meta-analyses on the effects of After School Programs, and lay bare great diversity in the methods applied in these meta-analyses, while concluding that the outcomes reported are divergent to an extent that they do not provide clear messages to policy makers on the potential effects of these programs. Similar cautions are expressed by Redd et al. (2012) when they conclude that After School programs can be effective. Still, also when compared to other educational effectiveness enhancing conditions, extra time should be seen as an important condition to “increase well targeted exposure to content” as a strong mediator of student achievement. Of the three variations of time use discussed in this chapter optimizing time at school and extended, out-of –school learning, are associated with equity oriented policies to enhance the position of disadvantaged learners. This applies to a lesser extent to homework, for which

19
disadvantaged learners might strongly depend on guided, structured and closely monitored homework. No studies on the cost effectiveness of these three time-oriented strategies were found. It would seem however, that the least effective strategy of the three, extended learning time and after school programs, is by far the most expensive one, and therefore also the least cost-effective strategy. References Anderson, L. (1980). Learning time and educational effectiveness. NASSP Curriculum Report,
10 (ED 210 780). Anderson, L. (1983). Policy Implications of Research on School Time. The School
Administrator, 40, 25-28. Appelhof, P. (2009). Een oriëntatie naar uitgebreide onderwijstijd. Utrecht: Oberon. Bembenutty, H. (2011). The last word: An interview with Harris Cooper—Research, policies,
tips, and current perspectives on homework. Journal of Advanced Academics, 22, 342-351. Berliner, D. (1990). What’s all the fuss about instructional time? In Berliner, D. (Ed.) The nature
of time in schools theoretical concepts, practitioner perceptions. New York: Teachers College Press.
Bloom, B. (1976).Human characteristics and school learning. New York: McGraw Hill. Bloom, B.S. (1984).The search for methods of group instruction as effective as one-to one
tutoring. Educational Leadership, 41(8), 4–18. Borman, G.D., & D'Agostino, J.V. (1996). Title I and student achievement: A meta-analysis
of federal evaluation results. Educational Evaluation and Policy Analysis, 18, 309-326 Brophy, J.J., & Good, T. (1984).Teacher behavior and student achievement. Lansing:
Michigan State University, Institute for Research on Teaching. Canadian Council on Learning (2009).A systematic review of literature examining the impact
of homework on academic achievement. Retrieved May 20, 2011, from: http://www.ccl-cca.ca/pdfs/SystematicReviews/SystematicReview_HomeworkApril27-2009.pdf
Carroll, J.B. (1963). A model of school learning. Teachers College Record, 64, 722-733. Carroll, J.B. (1989). The Carroll Model, a 25-year retrospective and prospective view.
Educational Researcher, 18, 26-31. Cohen, J. (1969). Statistical power analysis for the behavioral sciences. New York: Academic
Press. Cohen, D.K. (1988). Teaching practice ... Plus ça change ... In Ph. Jackson (ed.), Contributing to
Educational Change: Perspectives on Research and Practice. Berkeley, CA.: McCutchan. Cool, V.A., & Keith, T.Z. (1991). Testing a model of school learning: Direct and indirect
effects on academic achievement. Contemporary Educational Psychology, 16, 28-44. Cooper, H. (1989). Homework. White Plains, NY: Longman. Cooper, H. (1994). The battle over homework: An administrator’s guide to setting sound and
effective policies. Thousand Oaks, CA: Corwin Press. Cooper, H. Charlton, K., Valentine, J., Muhlenbruck, L., & Borman, G. (2000).Making the
most of summer school: A meta-analytical and narrative review. Monographs of the Society for Research and Child Development, 65(1), 1-127.
Cooper, H., Nye, B., Charlton, K., Lindsay, J., & Greathouse, S. (1996). The effects of summer vacation on achievement test scores: A narrative and meta-analytic view. Review of Educational Research, 66, 227-268.

20
Cooper, H., Robinson, J.C., & Patall, E.A. (2006). Does homework improve academic achievement? A synthesis of research, 1987-2003.Review of Educational Research, 76, 1-62.
Creemers, B.P.M., & Kyriakides, L. (2008).The Dynamics of Educational Effectiveness. London and New York: Routledge.
De Jong, R., Westerhof, K.J., & Creemers, B.P.M. (2000).Homework and student math achievement in junior high schools. Educational Research and Evaluation, 6(2), 130-157.
Durlak, J.A., Weissberg, R.P. & Pachan, M. (2010).A Meta-Analysis of After-School Programs That Seek to Promote Personal and Social Skills in Children and Adolescents. American Journal of Community Psychology, 45, 294-309.
Fischer & Klieme (in press) Fisher, C.W., Berliner, D.C., Filby, N.N., Marliave, R., Cahen, L.S., & Dishaw, M.M. (1981).
Teaching behaviors, academic learning time, and student achievement: an overview. The Journal of Classroom Interaction, 17(1).
Fraser, B.J., Walberg, H.J., Welch, W.W., & Hattie, J.A. (1987).Syntheses of educational productivity research. Special Issue of the International Journal of Educational Research, 11(2).
Graue, M.E., Weinstein, T., & Walberg, H.J. (1983). School-based home instruction and learning: A quantitative synthesis. Journal of Educational Research, 76, 351–360.
Gustavsson, J.E.(2010) Causal inference in educational effectiveness research: A comparison of three methods to investigate effects of homework on student achievement. Invited key-note address of the second meeting of EARLI SIG 18. Centre for Evaluation and Educational Effectiveness, University of Leuven, 25- 27 August, 2010
Haertel, G.D., Walberg, H., & Weinstein, T. (1983). Psychological models of educational performance: a theoretical analysis of constructs. Review of Educational Research, 53, 75-92.
Hattie, J. (2009). Visible Learning. Abingdon: Routledge. Kane, T.J. (2004)The impact of after-school programs: Interpreting the results of four recent
evaluations. Working paper. New York: WT Grant Foundation. Kohn, A. (2006). Abusing research: The study of homework and other examples. Phi Delta
Kappan, 88(1), 8-22. Kyriakides, L., Creemers, B., Antoniou, P., & Demetriou, D. (2010). A synthesis of studies
searching for school factors: implications for theory and research. British Educational Research Journal, 36(5), 807-830.
Lauer, P. A., Akiba, M., Wilkerson, S. B., Apthorp, H. S., Snow, D., & Martin-Glenn, M. (2004). The effectiveness of out-of-school-time strategies in assisting low-achieving students in reading and mathematics: a research synthesis. Retrieved May 20, 2011, from: http://www.mcrel.org/PDF/SchoolImprovementReform/5032RR_RSOSTeffectiveness.pdf
Levin, H., & Tsang, M.C. (1987). The economics of student time. Economics of Education Review, 6(4), 357-364.
Lipsey, M.W., & Wilson, D.B. (2001).Practical meta-analysis. Thousand Oaks, CA: Sage. Lipsey, M.W., & Wilson, D.B. (1993). The efficacy of psychological, educational, and
behavioral treatment: Confirmation from meta-analysis. American Psychologist, 48,1181`-1209.
Marzano, R.J. (2000). Transforming classroom grading. Alexandria, VA: Association for Supervision and Curriculum Development.

21
Marzano, R.J. & Pickering, D.J. (2007).The case for and against homework. Educational leadership, 64(6), 74-79.
Miller, B.M. (2003). Critical hours. After school programs and educational success. Retrieved May 20, 2011, from: http://www.nmefdn.org/uploads/Critical_Hours.pdf
Mooring, A.M. (2004). High School chemistry homework: What works? Unpublished manuscript. The College of William and Mary, Williamsburg VA.
National Academy of Education (2009) Time and learning. Education Policy White Paper. Washington D.C.
Paschal, R.A., Weinstein, T., & Walberg, H.J. (1984). The effects of homework on learning: A quantitative synthesis. Journal of Educational Research, 78, 97–104.
Poway Unified School district and Poway federation of teachers (2002).Review of the literature on time and learning.
Redd, Z., Boccanfuso, Ch., Walker, K., Princiotta, D., Knewstub, D. & Moore, K. (2012). Expanded time for learning both inside and outside the classroom; A review of the evidence base. Retrieved on September, 17, 2012 from http://www.childtrends.org/Files/Child_Trends-2012_08_16_RB_TimeForLearning.pdf
Scheerens, J., Luyten, H., Steen, R., & Luyten-de Thouars, Y. (2007). Review and meta-analyses of school and teaching effectiveness. Enschede: Department of Educational Organisation and Management, University of Twente.
Schmitz, B., & Skinner, E. (1993). Perceived control, effort, and academic performance: Interindividual, intraindividual, and time series analyses. Journal of Personality and Social Psychology, 64, 1010–1028.
Scott-Little, C., Hamann, M., & Jurs, S. (2002). Evaluations of after-school programs: A meta-evaluation of methodologies and narrative synthesis of findings. American Journal of Evaluation, 23(4), 387-419.
Sharp, C., Keys, W., & Benefield, P. (2001). Homework: A review of recent research. Retrieved May 13, 2008, from http://www.nfer.ac.uk/publications/pdfs/downloadable/homework.pdf
Sharp, C., Chamberlain, T., Morrison, J., Filmer-Shankey, C.(2007). Playing for Success. An evaluation of its long term effects. London: National Foundation for Educational Research.
Stein, M., and Bess, A.R. (2011). Choosing more school? Extended time policies and student achievement across seasons in Charter and traditional public schools. Nashville Tennessee: National Centre on School Choice.
Terzian, M., Anderson Moore, K., & Hamilton, K. (2009).Effective and promising summer learning programs and approaches for economically-disadvantaged children and youth. Retrieved 06/05/10 from http://www.wallacefoundation.org/KnowledgeCenter/KnowledgeTopics/CurrentAreasofFocus/Out-Of-School-Learning/Documents/Effective-and-Promising-Summer-Learning-Programs.pdf
Trautwein, U. (2007). The homework-achievement relation reconsidered: Differentiating homework time, homework frequency, and homework effort. Learning and Instruction, 17, 372–388.
Trautwein, U., & Köller, O. (2003). The relationship between homework and achievement: still much of a mystery. Educational Psychology Review, 15(2), 115-145.
Trautwein, U., Köller, O., Schmitz, B., & Baumert, J. (2002). Do homework assignments enhance achievement? A multilevel analysis of 7th grade mathematics. Contemporary Educational Psychology, 27, 26-50.
22
Trautwein, U., Ludtke, O., Schnyder, I., & Niggli, A. (2006). Predicting homework effort: Support for a domain-specific, multilevel homework model. Journal of Educational Psychology, 98(2), 438-456.
Valentine, J.C., Cooper, H., Patall, E.A., Tyson, B.& Robinson, J.C. (2010). A method for evaluating research syntheses: The quality, conclusions, and consensus of 12 syntheses of the effects of after-school programs. Research Synthesis Methods, 1, 20-38
Walberg, H.J., & Paschal, R.A. (1995).Homework. In L.W. Anderson (Eds.), International Encyclopedia of Teaching and Teacher Education (pp. 268-271). Oxford: Elsevier.
Wang, J. (1998). Opportunity to learn: The impacts and policy information. Educational Evaluation and Policy Analysis, 20(3), 137-156.
Winne, Ph.H. & Nesbit, J.C. (2010).The psychology of academic achievement. Annual Review of Psychology, 61, 653-678.
Zief, S.G., Lauver, S., & Maynard, R.A. (2006). The impacts of after-school programs on student outcomes: A systematic review for the Campbell Collaboration. Retrieved May 20, 2011, from http://www.campbellcollaboration.org/reviews_education/index.php
Zimmerman, B.J., & Kitsantas, A. (2005). Homework practices and academic achievement: The mediating role of self-efficacy and perceived responsibility beliefs. Contemporary Educational Psychology, 30, 397–417.

23
Annex to Chapter 1: Operational interpretations of “time”, from Scheerens et al. (2007)
Factor Components Sub-components and exemplary items 9. Effective
learning time 9.1 importance of
effective learning
• emphasis on- developing better policy and better procedures to
enlarge instruction time • impeding/progressing school effectiveness:
- good registration of presence and absenteeism - good class management - give high priority to homework
9.2 time Scale of 6 items measuring: starting lessons on time, prevention of disturbances, rules on student truancy (range 1-18)
9.3 monitoring of absenteeism
• % of pupils truanting• the way the school handles absenteeism and lateness • satisfaction with respect to pupils' presence now and 5
years ago
9.4 time at school • number of school days• number of teaching days/hours
- number of teaching days per school year - number of full teaching days per school week - number of semi teaching days per school week - total number of hours per school week - length of a school day
• % of cancelling of lessons • number of days with no lessons due to structural causes • % of total number of hours indicated on the table • measures to restrict cancelling of lessons as much as
possible • policy with respect to unexpected absenteeism of a
teacher • (in school work plan) agreements on substituting
teachers
9.5 time at classroom level
• number of lessons on timetable per school year • a lesson consists of how many minutes • amount of teaching hours for language/arithmetic • amount of minutes for arithmetic/physics per week • duration last arithmetic lesson in minutes • accuracy with respect to starting and finishing lessons in
time now and 5 years ago • number of lessons that are cancelled • satisfaction with respect to available amount of time for
working in the classroom

24
Factor Components Sub-components and exemplary items 9.6 classroom
management • attention for classroom management in the school work
plan - with respect to lesson preparation - rules and procedures for the lesson's course
• situation with respect to aiming at work in the classroom (now and 5 years ago)
• average % of teachers spending time on: - organization of the lesson - conversation (small talk) - interaction with respect to the work - supervision (pupil activities/behaviour) - feedback/acknowledgement
• average time during lesson spent on discussing homework, explaining new subject matter, maintaining order
• sources of loss of time during lessons: - pupils do not know where to find equipment - disturbances due to bad behaviour of pupils - frequent interruptions - loss of time due to lengthy transitions from one
activity to the next - unnecessary alterations in seating arrangements - frequent temporarily absence of pupils during lessons - waiting time for individual guidance - many (more than 3) teacher interventions to keep
order - lack of control on pupils' task related work

25
CHAPTER 2: TIME IN INTERNATIONALLY COMPARATIVE STUDIES Jaap Scheerens, Hans Luyten and Cees Glas Introduction In this chapter, amount of instruction time in the Netherlands, i.e. time at school, time spent in out of school programs, and homework/ individual study time, will be compared to other countries. In the first section this will be done in a more descriptive way, while in the second section, the association between the various indicators of instruction time and student performance, between and within countries, will be discussed. Total instruction time at primary and secondary school level in international perspective Intended instruction time across countries, based on 2010, system level data In OECD’s annual publication Education at a Glance, “Intended instruction time” is described as the “number of hours per year during which students receive instruction in the compulsory and non-compulsory part of the curriculum”. The figures for OECD countries, from the 2012 version of Education at a Glance are cited in Table 2.1 (these figures represent 2010 data). The data are collected at national level, by the OECD.

26
Table 2.1: Intended instruction time in OECD countries. Source OECD (2012, p. 435, table D.1.1).
Average number of hours per year of total intended instruction time Age 7-8 Age 9-11 Age 12-14 Age 15 (typical
programme)Australia 982 984 997 982Austria 735 811 959 1 050Belgium (Fl.) 835 835 960 960Belgium (Fr.) 930 930 1 020 mCanada 917 921 922 919Chile 1 083 1 083 1 083 1 197Czech Republic 588 706 862 794Denmark 701 813 900 930England 893 899 925 950Estonia 595 683 802 840Finland 608 683 829 913France 847 847 1 065 1 147Germany 641 793 887 933Greece 720 812 796 773Hungary 614 724 885 1 106Iceland 800 889 969 987Ireland 915 915 929 935Israel 914 990 981 1 101Italy 891 924 1 023 1 089Japan 735 800 877 mKorea 612 703 859 1 020Luxembourg 924 924 908 900Mexico 800 800 1 167 799Netherlands 940 940 1 000 1 000New Zealand m m m mNorway 701 773 836 858Poland 656 763 820 865Portugal 900 888 934 934Scotland a a a aSlovak Republic 709 794 851 936Slovenia 621 721 817 908Spain 875 875 1 050 1 050Sweden 741 741 741 741Switzerland m m m mTurkey 864 864 864 810United States m m m mOECD average 790 838 922 948EU21 average 767 819 907 941 Among OECD countries total instruction time for students aged 15, ranges from 794 hours in The Czech Republic to 1083 in Chili. The OECD average is 948 hours. The Netherlands is well above this average with 1000 hours.

27
Total instruction time across countries, compared between 2000 and 2008, based on system level data for 12-14 years old students Statutory instruction time is a variable that is malleable at system level. Analyzing changes over time provides an impression of the degree to which countries pull the time lever, for whatever policy reason. Table 2.2 shows change in statutory instruction time between 2000 and 2008, at the level of lower secondary education (12-14 year old students) Table 2.2: Total instruction time in 2000 and 2008, in OECD countries and change over
time. Source: Scheerens, Glas, Jehangir, Luyten & Steen(2012), data source: OECD EAG (2001 and 2009).
Total intended instruction time (hours) 12-14 year olds
Change OECD 2000 2008 2000-2008 Australia 1019 1011 -8 Austria 1148 958 -190 Belgium 1015 993 -23 Canada Chile 1080 Czech Republic 867 876 9 Denmark 890 900 10 Estonia 802 Finland 808 829 21 France 1042 1072 30 Germany 903 887 -16 Greece 1064 821 -243 Hungary 925 885 -40 Iceland 809 872 63 Ireland 891 907 16 Israel 1139 Italy 1020 1089 69 Japan 875 868 -7 Korea 867 867 0 Luxembourg 908 Mexico 1167 1167 0 Netherlands 1067 1000 -67 New Zealand 948 Norway 827 826 -1 Poland 644 Portugal 842 905 63 Slovak Republic Slovenia 791 Spain 845 1015 170 Sweden 741 741 0 Switzerland Turkey 796 United Kingdom 940 925 -15 United States
The table shows sizeable change in several countries, relatively high reduction of time in countries like Austria and Greece, and a sizeable increase of time in Spain. The Netherlands
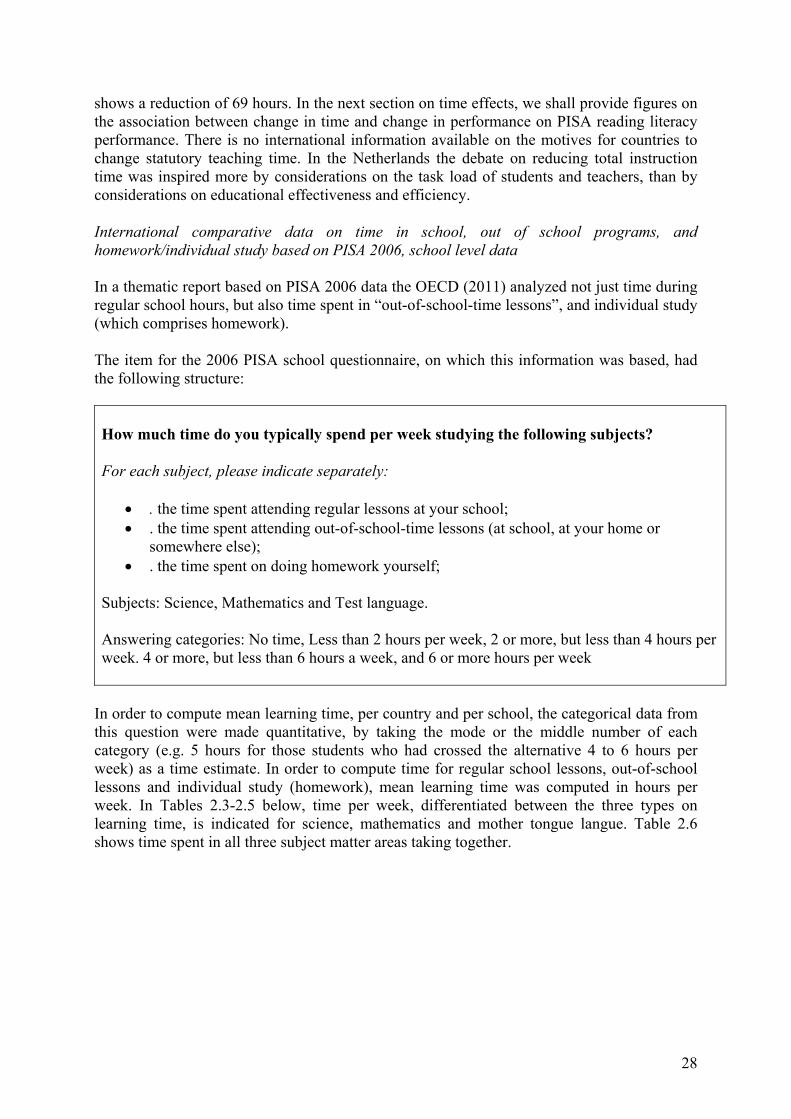
28
shows a reduction of 69 hours. In the next section on time effects, we shall provide figures on the association between change in time and change in performance on PISA reading literacy performance. There is no international information available on the motives for countries to change statutory teaching time. In the Netherlands the debate on reducing total instruction time was inspired more by considerations on the task load of students and teachers, than by considerations on educational effectiveness and efficiency. International comparative data on time in school, out of school programs, and homework/individual study based on PISA 2006, school level data In a thematic report based on PISA 2006 data the OECD (2011) analyzed not just time during regular school hours, but also time spent in “out-of-school-time lessons”, and individual study (which comprises homework). The item for the 2006 PISA school questionnaire, on which this information was based, had the following structure: How much time do you typically spend per week studying the following subjects? For each subject, please indicate separately:
. the time spent attending regular lessons at your school; . the time spent attending out-of-school-time lessons (at school, at your home or
somewhere else); . the time spent on doing homework yourself;
Subjects: Science, Mathematics and Test language. Answering categories: No time, Less than 2 hours per week, 2 or more, but less than 4 hours per week. 4 or more, but less than 6 hours a week, and 6 or more hours per week
In order to compute mean learning time, per country and per school, the categorical data from this question were made quantitative, by taking the mode or the middle number of each category (e.g. 5 hours for those students who had crossed the alternative 4 to 6 hours per week) as a time estimate. In order to compute time for regular school lessons, out-of-school lessons and individual study (homework), mean learning time was computed in hours per week. In Tables 2.3-2.5 below, time per week, differentiated between the three types on learning time, is indicated for science, mathematics and mother tongue langue. Table 2.6 shows time spent in all three subject matter areas taking together.
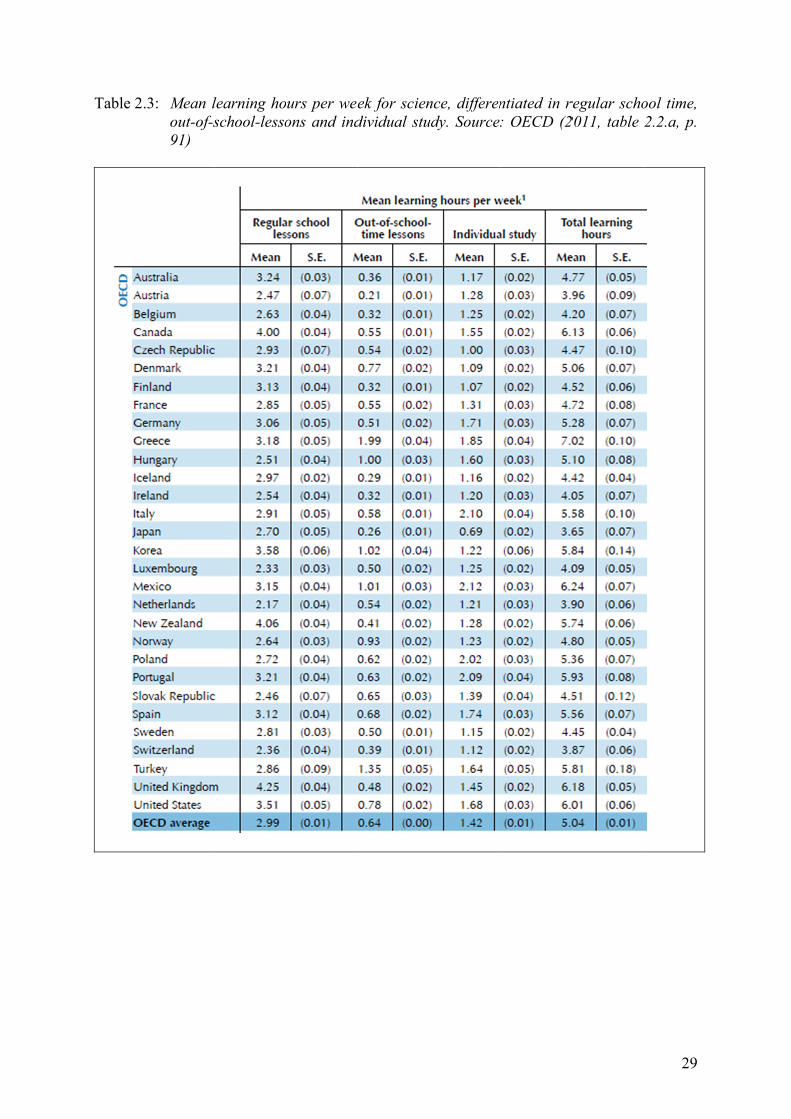
Table 2
.3: Mean lout-of-s91)
learning hoschool-lesso
urs per weeons and ind
ek for sciendividual stu
nce, differenudy. Source
ntiated in r: OECD (2
regular scho2011, table
29
ool time, 2.2.a, p.
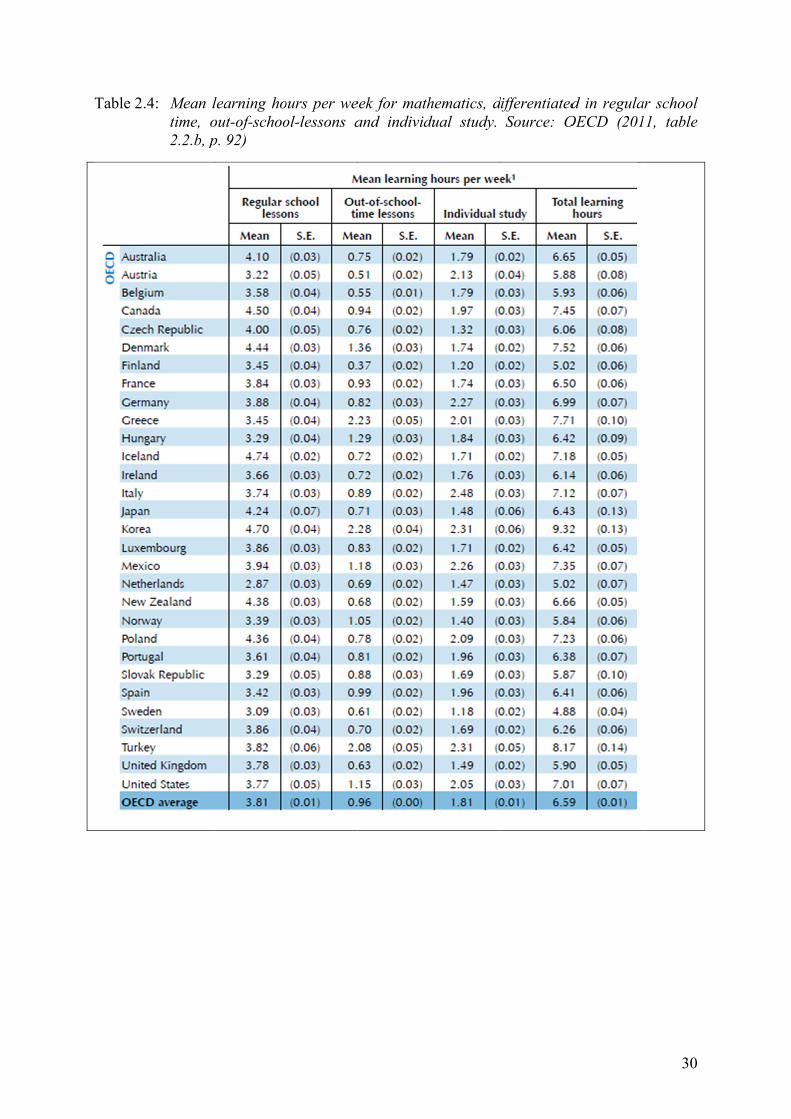
Table 2
.4: Mean ltime, o2.2.b, p
learning hoout-of-schoop. 92)
ours per weol-lessons a
eek for mathand individ
hematics, ddual study.
differentiatedSource: O
d in regulaOECD (201
30
ar school 11, table
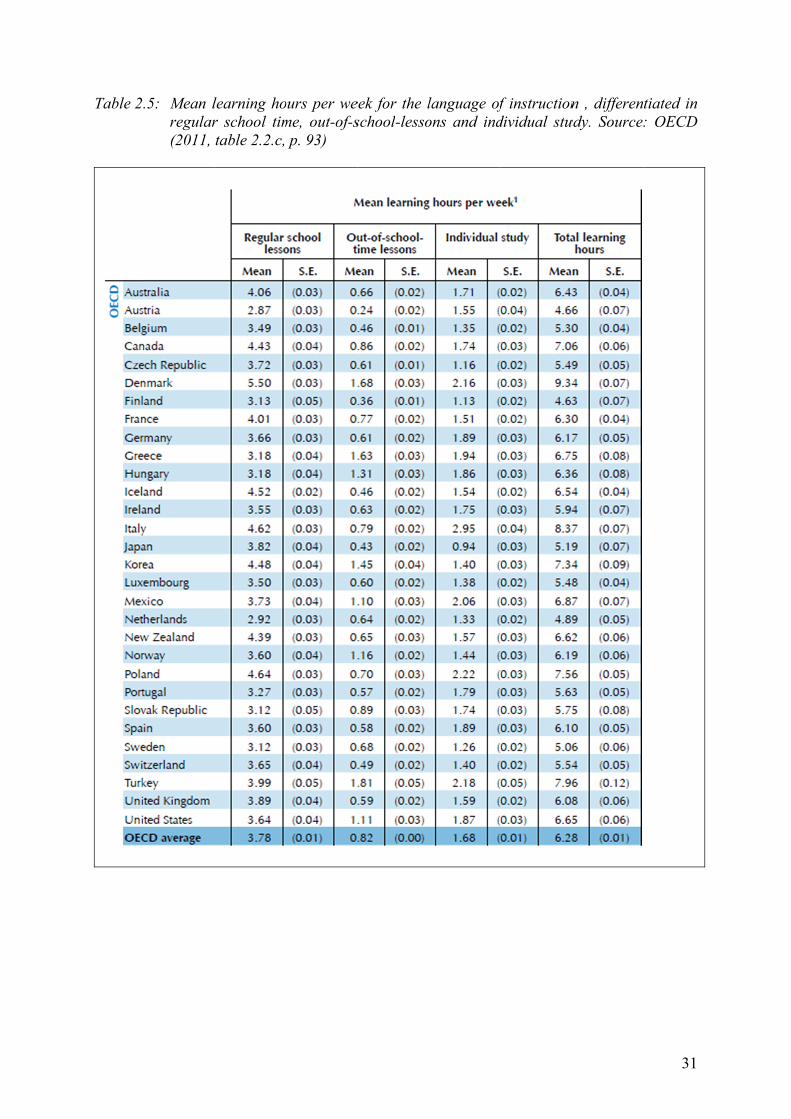
Table 2
.5: Mean lregular(2011,
learning hor school timtable 2.2.c,
ours per weme, out-of-s
p. 93)
eek for the lschool-lesso
language ofons and ind
f instructiondividual stu
n , differenudy. Source
31
tiated in : OECD

Table 2
When lohours, ahours pehours pthat speabout 9average4.89 ver
.6: Mean tinstrucindivid
ooking at thacross the ter week), mer week) th
ent the least9 hours on e in all subjersus 6.28. W
total learnition , diffe
dual study. S
he position three differe
mathematicshe Netherlant time on ththese subje
ects: sciencWhen lookin
ing hours perentiated iSource: OEC
of the Nethent types os, (about 5 hnds is in theese subjectsects (OECDe 3.90 versung at the su
per week foin regular CD ( 2011,
herlands wiof time, it ishours per we range of ls. Countries
D, 2011, 29us 5.04; ma
um total of
or science, school tim
table 2.2.d,
ith respect ts striking th
week) and lalowest scors at the high9). The Netathematics, weekly hou
mathematicme, out-of-s p. 94)
to the total hat for scieanguage of iring countrih end of thetherlands is5.02 versus
urs of instru
cs and langschool-lesso
number of ence (less thinstruction ies, that is ce distributios below thes 6.59 and luction in the
32
guage of ons and
learning han four (about 5
countries on spend e OECD language ese three
33
subject matter areas, the total for the Netherland is 13.82, while the OECD average is 17.90 hours. Given the fact that the Netherlands scores way above the OECD average on the whole of the school curriculum in the total of intended instruction hours per year (in 2020, 1000 hours as compared to an OECD average of 948), these comparisons would suggest that, at least at the level of 15 year old students, the Netherlands, as compared to other countries, spends less time on basic subjects, as compared to “other subjects”. The OECD study also provides a basis to compare the relative importance of the three types of learning time (regular lessons at school, out-of-school lessons, and individual study). Students in OECD countries are, on average, engaged in regular school lessons for 62% of their overall learning time, individual study for 26% of their time and out-of-school-time lessons for the remaining 12% of their time, see Table 2.6 in the above (ibid, 29). The Netherlands remains close to this average picture among OECD countries with percentages of 60, 28 and 12 for the respective categories. In summary it can be observed that the Netherlands is above average in total instruction hours per year, among OECD countries, despite of a sizeable reduction of total instruction time, which took place between 2000 and 2008 (minus 67 hours). Next, again in comparison to OECD countries, the Netherlands is below average in science, mathematics and language of instruction, at the level of 15 year old students. As far as the relative importance of regular school time, individual study time and out-of-school lessons is concerned, the Netherlands remains close to the OECD average distribution. Evidence of time effects on achievement in international studies, based on simple correlations Influence of time at school and homework on student performance, analyzed in international studies Baker et al. (2004) discuss early results of internationally comparative assessment studies in which time has been used as an independent variable. From their review it appears that, in these studies, “time” or “instruction time” is used as an overarching concept, which may refer to indicators of statutory, official instruction time, as well as to indicators that approach time on task. They cite a study by Fuller (1987), in which time is studied comparatively in developing countries. Most studies showed positive effects of small magnitude. Baker et al. (2004) point to the fact that these studies were carried out in developing countries, at a time when large variance in educational conditions existed among and within these countries. In their own study, Baker et al. analyzed data from three international comparative assessment studies: PISA, 2000, TIMSS, 1999 and the IEA CIVICS study (1999). Their conclusion about looking at the effect of time at between-country level is as follows: “As a number of studies have shown, we find that there is no significant relationship at the cross-national level between the achievement test scores and the amount of instructional time” (ibid 322). They note that the difference between students who receive 5 hours of math instruction per week and those who are in countries where there are just 2 hours of instruction compares to a score-difference of 491 to 485 on the TIMSS mathematics test. They then proceed to analyze the effects of total instruction time, and time in mathematics and science classes on achievement within countries. The results are shown in the summary Table 2.7, below.

34
Table: 2.7: Within country effects of total instruction time and time in math, science and Civics; *) Only one country had a negative correlation of time for science and science achievement. NS means not significant. Source: Baker et al. (2004).
Independent and dependent variables Average positive
correlations Average negative correlations
The Netherlands
Total time/math achievement .09 -.12 -.16
Total time/ science achievement .13 -.18 NS
Total time/civics achievement .26 -.10 -
Mathematics time/math achievement .14 -.14 -.28
Science time/science achievement .23 * .23
A striking outcome, not evident from the table is that for most comparisons there was about an even distribution of positive, negative and non-significant correlations. Science provided the great exception on this phenomenon, with the large majority of countries showing a positive association. The results for The Netherlands indicate sizeable negative correlation for mathematics and a positive correlation for science. The authors conclude that instructional time is a very simple resource “that probably does not warrant much policy attention”. They say that, when other variables, like opportunity to learn and instructional quality are controlled for, time would work out as a simple step-function, showing effects only if very low amounts of time would be compared to very high amounts of time. “There is little evidence of a constant marginal achievement pay-off for each unit of additional time, beyond a base amount” (ibid, 330). They go on to conclude that …“as a very simple resource, the impact of instructional time is so dependent on its relationship to curriculum and instructional quality as to make it trivial, compared to those more complex and primary resources of the school process.” As a matter of fact the authors imply that there are relatively little variations in time across countries, as countries range between 800 to 1000 hours per year at the lower secondary level. Their recommendation to policy-makers is quite straightforward: “Instructional time should not be considered as a major policy lever. Do not waste resources on marginal increases in instructional time”. Baker and LeTendre (2005) analyzed the effects of homework on mathematics achievement in a secondary analysis of the TIMSS 1999 data set. Their conclusion is stated as follows: “Not only did we fail to find any positive relationships, [but] the overall correlations between national average student achievement and national averages in the frequency, total amount, and percentage of teachers who used homework in grading are all negative! If these data can be extrapolated to other subjects – a research topic that warrants immediate study, in our opinion – then countries that try to improve their standing in the world rankings of student achievement by raising the amount of homework might actually be undermining their own success. ... More homework may actually undermine national achievement” (ibid, p. 128). Regular school time, out-of-school-time lessons and individual study analyzed on PISA 2006 data In the study by OECD (2011), titled: “Quality time for students”, from which descriptive results were shown in the first paragraph of this chapter, regular school time, out-of-school-time lessons and individual study were related to student performance in science, mathematics and reading, as measured in PISA 2006.
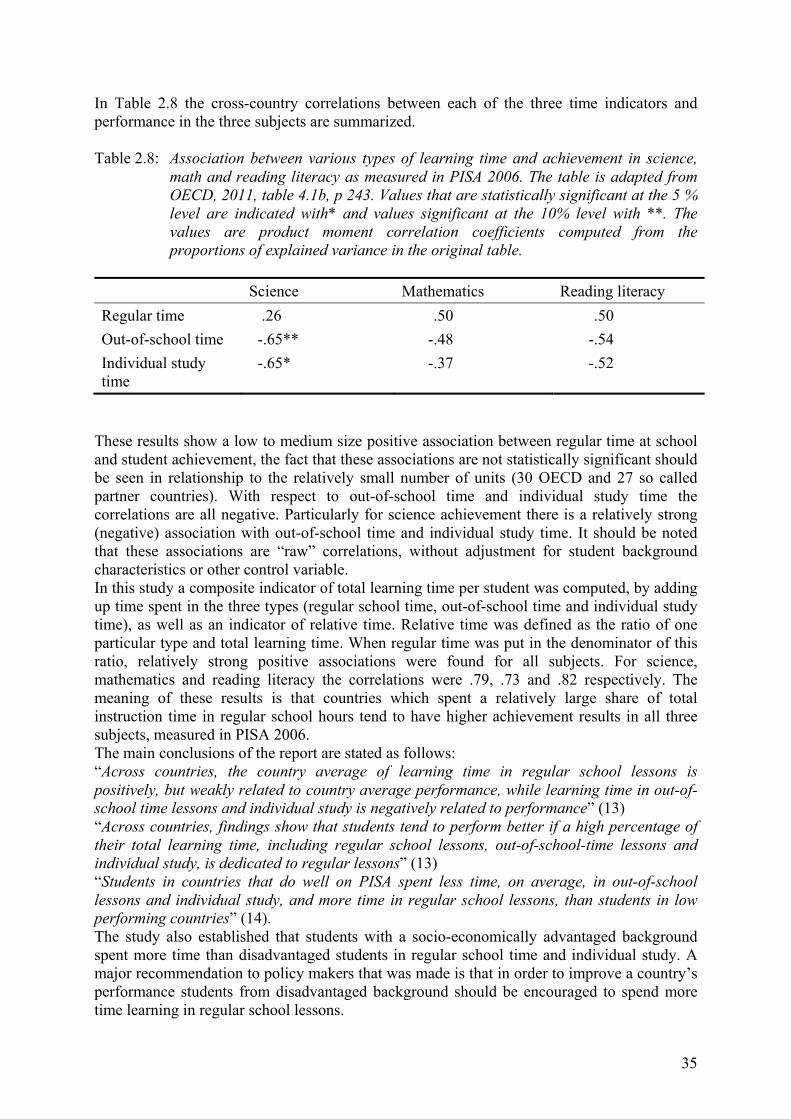
35
In Table 2.8 the cross-country correlations between each of the three time indicators and performance in the three subjects are summarized. Table 2.8: Association between various types of learning time and achievement in science,
math and reading literacy as measured in PISA 2006. The table is adapted from OECD, 2011, table 4.1b, p 243. Values that are statistically significant at the 5 % level are indicated with* and values significant at the 10% level with **. The values are product moment correlation coefficients computed from the proportions of explained variance in the original table.
Science Mathematics Reading literacy
Regular time .26 .50 .50
Out-of-school time -.65** -.48 -.54
Individual study time
-.65* -.37 -.52
These results show a low to medium size positive association between regular time at school and student achievement, the fact that these associations are not statistically significant should be seen in relationship to the relatively small number of units (30 OECD and 27 so called partner countries). With respect to out-of-school time and individual study time the correlations are all negative. Particularly for science achievement there is a relatively strong (negative) association with out-of-school time and individual study time. It should be noted that these associations are “raw” correlations, without adjustment for student background characteristics or other control variable. In this study a composite indicator of total learning time per student was computed, by adding up time spent in the three types (regular school time, out-of-school time and individual study time), as well as an indicator of relative time. Relative time was defined as the ratio of one particular type and total learning time. When regular time was put in the denominator of this ratio, relatively strong positive associations were found for all subjects. For science, mathematics and reading literacy the correlations were .79, .73 and .82 respectively. The meaning of these results is that countries which spent a relatively large share of total instruction time in regular school hours tend to have higher achievement results in all three subjects, measured in PISA 2006. The main conclusions of the report are stated as follows: “Across countries, the country average of learning time in regular school lessons is positively, but weakly related to country average performance, while learning time in out-of-school time lessons and individual study is negatively related to performance” (13) “Across countries, findings show that students tend to perform better if a high percentage of their total learning time, including regular school lessons, out-of-school-time lessons and individual study, is dedicated to regular lessons” (13) “Students in countries that do well on PISA spent less time, on average, in out-of-school lessons and individual study, and more time in regular school lessons, than students in low performing countries” (14). The study also established that students with a socio-economically advantaged background spent more time than disadvantaged students in regular school time and individual study. A major recommendation to policy makers that was made is that in order to improve a country’s performance students from disadvantaged background should be encouraged to spend more time learning in regular school lessons.

36
The message from this report seems to be that out-of-school time and individual study time do not compensate for regular school lessons. A strong limitation of this report is that just raw correlations at country level are computed, not adjusted for student background characteristics and variables reflecting opportunity to learn and quality of instruction. Indirectly the study admits that the positive association of time in regular school lessons is likely to depend on other school characteristics, when they compare country level results: “In short, compared with the countries with high relative learning time in regular school lessons, the countries with low relative learning time in these lessons turn out to have system characteristics that are related to low overall performance: lower level of school materials and human resources, less school autonomy and low proportions of standardized external examinations” (ibid, 63). The methodology used in this study does not allow conclusions on the degree to which these factors confound the time/achievement associations. The authors’ opinion is evident from the following quotation: “The evidence implies that it is the quality of learning time in regular school lessons, not the quantity of learning hours, that explains the difference in performance across countries” (ibid, 77) Change in total intended instruction time, measured at system level, and country average achievement in reading literacy, based on PISA 2009 data In a secondary analysis of the PISA 2000 and 2009 data sets, Scheerens et al. (2012) compared the association of total intended instruction time with country average reading performance in 2000 and 2009. In addition the change in country average total intended instruction time was related to the change in country average reading performance between 2000 and 2009. As mentioned in the first paragraph of this chapter “intended instruction time” was measured as the “number of hours per year during which students receive instruction in the compulsory and non-compulsory part of the curriculum”. The results are summarized in Tables 2.9a, b and c. Table 2.9a: Correlation of system level characteristics with national reading mean (PISA
2000) 2000 data
CorrelationNumber of
countries Significance (two-tailed)
Total intended instruction time 12-14 year olds (2000)
-.398 28 .036
Table 2.9b: Correlation of system level characteristics with national reading mean (PISA
2009) 2009 data
Correlation
Number of countries
Significance (two-tailed)
Total intended instruction time 12-14 year olds (2008)
-.211 28 .282

37
Table 2.9c: Correlations of changes in system level characteristics with changes in reading performance per country (2000-2009)
The results show negative correlations in the cross-sectional as well as the longitudinal analyses. The cross sectional negative correlations imply that higher intended instruction time is associated with lower average achievement, and vice versa, countries with lower intended instruction time tend to do better on PISA country average reading achievement than countries with higher intended instruction time. The negative association shown in table 9 c, means that countries that increased total intended instruction time did less well on PISA reading literacy than countries that decreased their total intended instruction time. The limitation of unadjusted raw correlations that was referred to in the previous section, applies to these results as well. The analysis based on change in country average scores, and the correlation between the change scores on time and achievement was meant to meet some of the challenges that the interpretation of cross sectional correlations provides (Gustavsson, 2010). The negative sign of the correlation based on changes in average instruction time and average achievement favours an interpretation in the sense of weak performing countries trying to improve by extending learning time. An alternative interpretation that cannot be checked with simple correlations would be that countries improving on other, more powerful, indicators of educational quality (like opportunity to learn and teaching quality) might have economized on total intended instruction time. The discrepancy between the results of the OECD study discussed in the previous section and the present study, in the sense that the former study found positive correlations and the latter negative correlations, might be attributed to the fact that the OECD study investigated teaching time per subject, associated with achievement in the corresponding subject, while the present study analyzed total instruction time at the level of 12- 14 year old students. Looking at instruction time per subject should be considered as a more precise indicator, than total intended instruction time as a general education resource. Time effects in an international study, based on multilevel structural equation modeling In previous sections many original authors and critical reviewers tentatively explained low, or negative associations of time indicators with achievement, by referring to other, allegedly more powerful effectiveness enhancing factors and variables. Throughout this research literature there is the more or less outspoken conclusion that time is just a very basic resource, a “vessel” that only pays off when filled with good quality teaching. The only way to gain more clarity on this expectation is to analyze what remains of time effects, when other relevant variables, both student background variables and process indicators of educational quality, are analyzed simultaneously. In the remaining section of this chapter a study by some of the authors of this report will be cited in somewhat more detail. Time was included in several multi-level scenarios of educational effectiveness, which were explored on the PISA 2009 data set (Scheerens et al.,
Change between 2000 and 2009
Correlation
Number of countries
Significance (two-tailed)
Total intended instruction time 12-14 year olds (2000-2008)
-.251 21 .272

38
2012). At system level time was measured as compulsory learning time for reading and writing at lower secondary level, as reported in Education at a Glance, 2010. At school level reading time was obtained from student reports on minutes per week in reading test language lessons. Time measured at system and student level was included in two of the four scenarios that were tested, the “implementation scenario” and the “accountability scenario”. The implementation scenario The basic idea behind this scenario is that important policy amenable variables in education have a meaning at system-level and school-level. The clearest case is autonomy, defined as discretionary influence of schools, as compared to higher administrative levels. One might expect that schools will act according to the national regulations, but as these may differ in being explicit and may not be monitored very strongly, actual patterns of autonomy as defined by the schools themselves may still differ. The influence of national regulation of school autonomy will clearly be constrained by the degree to which schools “implement” the national regulations to the letter. In the case of school autonomy one would expect a clear positive association between autonomy as defined at system-level and autonomy as measured at school-level. A similar kind of reasoning applies to national accountability requirements. At school-level schools may show behavior that is more or less strict in meeting these requirements. The school-level variable of interest according to the implementation scenario would be the degree to which schools use test and evaluation results to meet external accountability requirements. The degree to which parents are free to choose a school for their children, as determined by national laws and regulations, should reflect actual opportunities to do so at school-level. Still schools might choose to restrict free choice by setting specific admission criteria, or, on the contrary, take extra measures to facilitate parent choice. In the case of stratification of national school systems, associated school variables are seen as possible “boosters” of stratification. As national stratification of schools is “inescapable” for schools, implementation is not the real issue. It may be the case, however, that stratification is an aspect of national educational cultures that is expressed not only in the design of the educational system at macro level, but also in preferences for stratification measures at school-level, such as streaming and ability grouping. Learning time for reading, measured at school level is expected to be positively associated with total intended instruction time, measured at system level. The general hypothesis behind the implementation scenario is that system and school-level conditions create aligned, and mutually enforcing stimuli in schooling, and that the impact of system-level policies is dependent on implemented, or aligned conditions at school-level. Alternative hypotheses could either be “loose coupling”, when there is no discernible positive indirect effect of system-level conditions and associated school-level conditions or “compensation”, when school-level conditions compensate for a lack of system-level input; a case in point would be streaming in schools belonging to a comprehensive school system. The variables that were used in the analysis of the implementation scenario are listed in Table 2.10.

39
Table 2.10: Variables used for testing the implementation scenario School autonomy at system-level measured by means of:
- percentage of decision taken at school level for organization of instruction (1) - percentage of decision taken at school level for resources (1)
School autonomy at school-level based upon: - level of responsibility of school staff in issues relating to curriculum and assessment (1) - level of responsibility of school staff in allocating resources (1)
Accountability at system-level will measured as: - the existence of external standard based examinations (2) - the existence of national assessments (2)
Accountability at school-level: (3) - schools providing comparative assessment based information to parents - schools compare with other schools - schools post achievement data publicly - school have their progress tracked by administrative authorities
School choice at system-level: - whether students have the right to be enrolled in any traditional public school (2)
Choice at school-level: - the frequency of taking performance records into consideration for admitting students (4)
Stratification at system-level will be measured as: - age of first selection in secondary education (1) - number of school types (1)
Stratification at school-level: - ability grouping (4) - transferring students to another school on the basis of special learning needs (4) - transferring students to another school on the basis of low achievement (4)
Learning time at system level is measured as - Compulsory learning time reading and writing as reported in Education at a Glance (2010) (1)
Reading time at school level is measured through - Student reports on the weekly time spent in lessons on the test language(1)
Co-variables: ESCS (socio economic statues) at student and at school-level (1) Reading Achievement (5)
(1) Transformed to standard normal (2) Dichotomous 0 = no, 1 = yes (3) Index composed of the 4 listed dichotomous variables transformed to standard normal using
an item response theory (IRT) model (4) Discrete variable with three values: -1 = never, 0 = sometimes, 1 = always (5) For Reading Achievement, plausible values as published in the PISA 2009 data base were
used. The results of the multi-level SEM analysis of the implementation scenario, based on data from 15 countries, are rendered in the path diagram, shown in Figure 2.1. Details on the methodology are provided in the original report (Scheerens et al., 2012).
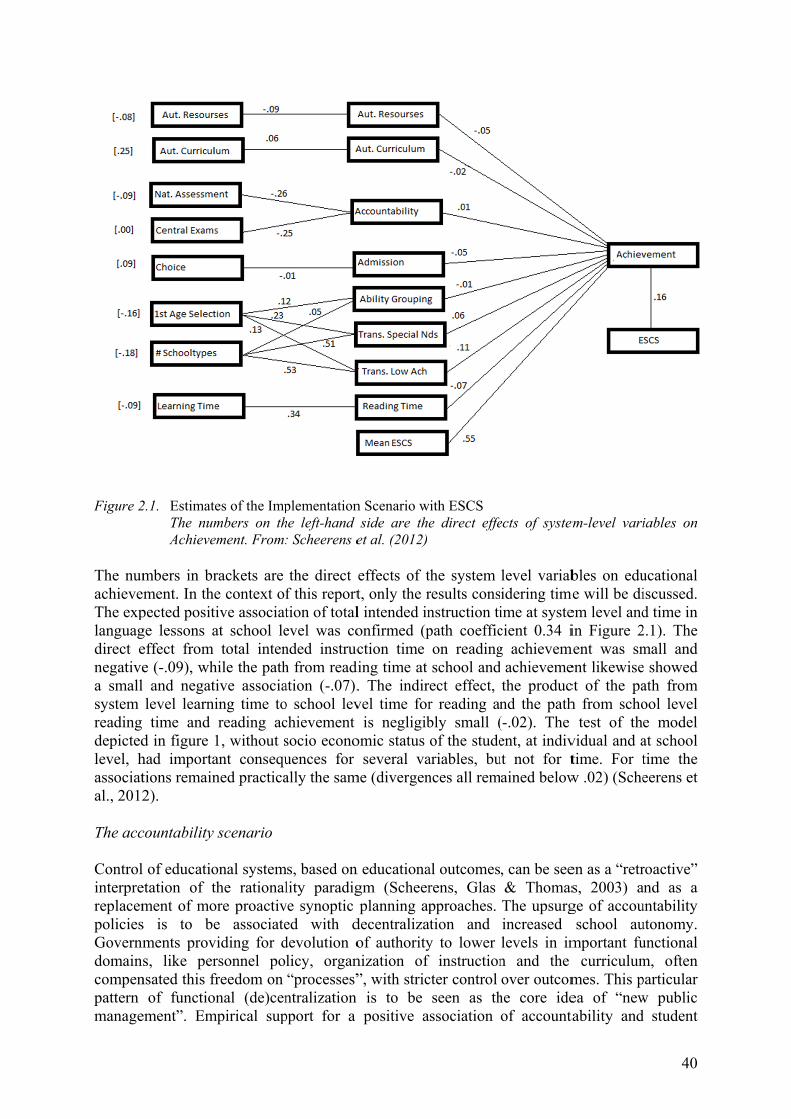
Figure 2
The numachieveThe explanguagdirect enegativea smallsystem reading depictedlevel, hassociatal., 2012 The acc ControlinterprereplacempoliciesGovernmdomainscompenpattern manage
2.1. EstimatThe numAchieve
mbers in brment. In the
pected positge lessons aeffect from e (-.09), wh and negatlevel learntime and
d in figure had importations remain2).
countability
of educatioetation of tment of mos is to bements provs, like per
nsated this fof functio
ement”. Em
es of the Impmbers on thement. From:
rackets are e context oftive associatat school le
total intenhile the pathtive associaing time toreading ac
1, without sant consequned practica
scenario
onal systemthe rationalore proactive associate
viding for drsonnel pofreedom on onal (de)cenmpirical sup
plementationhe left-hand : Scheerens e
the direct f this reporttion of totalevel was conded instruch from readiation (-.07).o school levchievement socio econouences for ally the sam
ms, based on lity paradig
ve synoptic ed with ddevolution olicy, organ“processes”ntralization pport for a
n Scenario wside are the
et al. (2012)
effects of tt, only the rl intended inonfirmed (pction time
ding time at . The indirvel time for
is negligibomic status
several vame (divergen
n educationagm (Scheerplanning ap
decentralizaof authoritynization of ”, with stric
is to be positive a
with ESCS e direct effe
the system results consnstruction tipath coefficon readingschool and
rect effect, r reading anbly small (of the stude
ariables, bunces all rem
al outcomesrens, Glas pproaches.
ation and y to lower f instructioncter control seen as th
association
ects of system
level variabidering timeime at systecient 0.34 ig achievem
achievemethe producnd the path(-.02). The ent, at indiv
ut not for tained below
, can be see& ThomasThe upsurgincreased levels in imn and the over outcom
he core ideof accounta
em-level vari
bles on edume will be diem level andin Figure 2
ment was sment likewisect of the pah from scho
test of thevidual and atime. For tw .02) (Sche
en as a “retrs, 2003) age of accouschool au
mportant fucurriculum
mes. This pea of “newtability and
40
iables on
ucational iscussed. d time in 2.1). The mall and e showed ath from ool level e model at school time the eerens et
roactive” and as a untability utonomy. unctional m, often particular w public d student

41
achievement outcomes is presented in the work by Bishop on central standards oriented examinations, (Bishop, 1997) and by Woessmann, Luedemann, Schuetz and West about interactions of accountability and facets of school autonomy (Woessmann et al., 2009). In Part IV of the Initial Report on PISA 2009, support for this kind of interaction was also found (OECD, 2010). When it comes to the question on how system-level accountability mechanisms affect student achievement through intermediary school processes, one could distinguish between a motivational and a cognitive, instrumental influence. External accountability and high stakes testing create a motivational set for schools, that makes them more aware of optimizing student achievement and that is based on extrinsic motivation. At the same time these policies provide strong cognitive cues and elaboration about what to teach and which priorities should be targeted. In the above description shared views on what is to be accomplished with students is one of the corner stones of internal accountability. A second cognitive mechanism that could be attached to internal accountability is formative use of tests and feedback to teachers and students. When instructional leadership and didactically oriented professional consultation among teachers are added to the picture strong linkage between major school-level levers of effective schooling is provided. In short, by stimulating achievement orientation, clear targeting of subject matter and teaching practice, formative evaluation and feedback, accountability may set in motion key levers of effective schooling. A constraint in all of this is that in many countries testing and formative use of feedback are still considered as suspicious “technocratic” means, that are often met with resistance. These resistances explain the often established under-utilization of internal evaluative data (e.g. Scheerens, 2004; Schildkamp, 2007). A final facet of an achievement oriented attitude in schools would be maximization of learning time in basic subjects. The variables that were used for testing the accountability scenario are listed in Table 2.11. Table 2.11: Variables used in the accountability scenario Accountability at system-level was seen as a latent variable, based on the following measured variables:
- the existence of external standard based examinations - the existence of national assessments - whether or not a country has a centralized curriculum
At school-level the following intermediary variables were used:
- Frequency of assessing students using different methods - Principal’s active involvement in school affairs - Degree to which teachers stimulate students’ reading engagement and reading skills - Student-related aspects of school climate - Degree to which teachers use structuring and scaffolding strategies in language lessons
Reading time at school was measured through student reports, on weekly time in test language lessons Co-variables: ESCS at student and at school-level and School size
The results of the multi-level SEM analysis of the accountability scenario, based on data from 32 countries, are rendered in the path diagram, shown in Figure 2.2. Details on the methodology are provided in the original report (Scheerens et al., 2012).

Figure 2
As was reading associatwere smlevel chwas anstudent and read ConclusDiscussthis repvariableschool vmediumcould boutcomenegligibresult csuggestivariable Closing Internatinstructi
2.2: EstimatThe numScheere
the case fotime at sch
tions betwemaller than haracteristicalyzed withlevel, no im
ding achiev
sions sing the oveport. In genes facilitatinvariables on
m sized posbe interprete, as far asbly small efconfirms thing that thees that are c
g discussion
tional compion time, at
es of the Accmber in braens et al. (20
or the outcohool on readen time andexpected.
s and systemhout includmportant de
vement was
erall outcomneral termsng school len achievemeitive associed as weaks the influeffect of reahe earlier e influence onceptually
n on instruc
parative stud school, and
countability ackets is the12)
omes based ding achieved other faceNext, the em level accding socio eviations wstill -.05 (S
mes of the es the resultevel conditioent appeareiation of inkly confirmence of timading time tcited criticof time on
y closer to th
ctional tim
dies, first ofd out of sch
Scenario wite direct effec
on the impement was nets of achievexpected p
countability economic
were noted, aScheerens et
exploration ts did not ons of schoed to be rathntended instming the imme on stude
that resultecal commen educationhe substanc
me seen from
f all, providhool.
th ESCS ct of Accoun
plementationegative anvement orieositive assowas altogetstatus (ESCand the asst al., 2012).
of these scesupport th
ooling, and, her weak fotruction tim
mplementatient achievemed from theents of orinal achievemce of educati
m an intern
de a notion o
ntability on
n scenario, nd very smaented strateociation betther absent.CS) at schociation be
enarios is be hypothesmoreover, t
or most varime and readion idea. Tment was c
ese multivariginal authment is stroional quality
national per
on how cou
Achievemen
the direct all (-.05). Megies at schotween these. When the
hool and inetween read
beyond the sis of systethe influenciables. The ding time aThe most imconcerned, riate analys
hors and reongly depenty.
rspective
untries differ
42
nt. From:
effect of Moreover,
ool level e school scenario
ndividual ding time
scope of em level ce of the small to
at school mportant was the
ses. This eviewers ndent on
r in total

43
Among OECD countries total instruction time for students aged 15, during regular school time, ranges from 794 hours in The Czech Republic to 1083 in Chili. The OECD average is 948 hours. The Netherlands is well above this average with 1000 hours. When looking at the position of the Netherlands with respect to the total number of learning hours in the three PISA subject matter areas, and totalized over regular time at school, out of school time lessons and homework, it is striking that for science (less than four hours per week), mathematics, (about 5 hours per week) and language of instruction (about 5 hours per week) we are in the range of lowest scoring countries, that is countries that spent the least time on these subjects. Countries at the high end of the distribution spend about 9 hours on these subjects (OECD, 2011, 29). The Netherlands is below the OECD average in all subjects: science 3.90 versus 5.04; mathematics, 5.02 versus 6.59 and language 4.89 versus 6.28. When looking at the sum total of weekly hours of instruction in these three subject matter areas, the total for the Netherland is 13.82, while the OECD average is 17.90 hours. Given the fact that the Netherlands scores way above the OECD average on the whole of the school curriculum in the total of intended instruction hours per year (in 2020, 1000 hours as compared to an OECD average of 948), these comparisons would suggest that, at least at the level of 15 year old students, the Netherlands, as compared to other countries, spends less time on basic subjects, as compared to “other subjects”. These figures are confirmed in the report on PISA 2009 (OECD, 2010). Data on the degree to which countries have changed total intended instruction time between 2000 and 2008, indicates that about as many countries diminished or expanded time. The Netherlands went down from 1067 to 2000 hours in this period. The following results were seen in international studies that correlated time indicators with achievement in mathematics, reading or science.
- Baker et al. (2004) report non-significant correlations at country level between regular teaching time in mathematics, science and reading in secondary analyses of TIMSS and PIRLS. Moreover, these authors found that, at country level, positive, negative and non-significant relationships were about equally divided across countries;
- Baker and LeTendre (2005) found negative correlations between amount of homework and achievement in mathematics (TIMSS, 1999) achievement;
- Scheerens et al. (2012) report negative correlations between total intended instruction time at national level and country average achievement in reading, in 2000 and 2009, based on PISA data; these authors also computed the correlation between change in intended instruction time and change in student reading achievement between 2000 and 2009; and found a non-significant negative correlation of .25
- OECD (2011) reports positive correlations, computed at between country level, between time spent in regular lessons in science, mathematics and test language and the respective student achievement results (.25., .50 and .50), respectively; all associations for time spent on out-of-school lessons and individual study were negative;
When the association of time and achievement was studied by means of multi-level structural equation modeling applied to the PISA 2009 data set, very small negative associations were found in a study by Scheerens et al. (2012). What do these results based on internationally comparative studies add to the research results that were summarized in Chapter 1? First of all, the descriptive information shows that countries tend to use time as a malleable variable, as some countries induce sizeable changes in total intended instruction time,
44
however, since increasing time occurred about as frequent as diminishing time, it is doubtful whether these changes are directly targeted at enhancing student achievement. Secondly, international studies frequently report negative correlations, particularly at the between country level. In some cases the negative correlation might be attributed to the operational definition of time that was used in the study. For example, in the study by Scheerens et al. (2012), nationally defined total intended instruction time as used, while in the study by OECD (2011) time per subject, measured at school level was studied. It is not improbably that the more distal “intended” instruction time will show weaker association with achievement in a particular subject than the more proximal time per subject indicator. Also, subject matter area could make a difference. When comparing results from PISA 2006 and PISA 2009, for the main subject matter area in these two waves of PISA, science and reading literacy, regular school time was positively correlated with the science results in 2006 and negatively with reading literacy in 2009 (OECD, 2007, 263, OECD, 2010, p. 51). Thirdly, considering again negative associations between regular time at school and student achievement, these results seem to be at odds with common sense, and also, to some extent, with the overriding pattern of results from meta-analyses, research studies and program evaluations reviewed in Chapter 1 (despite severe methodological criticisms concerning the way these results were established). Analyses on these international data sets are prone to even more basic methodological criticism than the earlier reviewed research studies. Most results are obtained by means of cross-sectional analysis. This means that, among others, it is hard to rule out “reversed causation”. In the case at hand this would mean that low achieving schools or educational systems, would try to improve by extending learning time. Negative associations might result even if expanded time might do some good, but not sufficient to counter more powerful conditions of low achievement. The approach to measure change over time, at system level and correlate with country level change of achievement, is seen as one of the possible remedies to rule out reversed causation, as is multilevel structural equation modeling. Both methods were applied in the study by Scheerens et al., and the result was that the associations remained negative. Fourth and finally, a striking outcome of the study by OECD (2011) was the consistent negative association of out-of school lessons as well as individual study (homework) and achievement. Other results from the same study make it plausible that countries with generally less favorable educational conditions made more use of out-of school lessons and individual study, than countries with better conditions. All in all it should be concluded that the results from international comparative studies concerning the association of time with educational achievement should be interpreted with a lot of caution. Negative associations of facets of time and student achievement at country level could mean that the causal direction is reversed, in the sense that more investment in time happens as a reaction to low performance rather than as a cause of higher performance. The finding that negative associations persisted in the secondary analyses of the PISA 2009 data-set, when change in time investment was related to change in performance between countries indicates that this phenomenon is not just an artifact of cross-sectional research design, but a matter of reactive policy (more time investment when achievement results are low) which compensates insufficiently for more important sources of low achievement, such as low SES composition.

45
Referenties Baker D.P., Fabrega, R., Galindo, C and Mishook, J. (2004) Instructional time and national
achievement: cross-national evidence. Prospects, XXXIV, 311- 334. Baker, D.P., & LeTendre, G.K. (2005). National Differences, Global Similarities. Stanford,
CA: Stanford University Press. Bishop, J. (1997). The effect of National Standards and Curriculum-Based Exams on
Achievement. The American Economic Review, 87(2), 260-264. Gustavsson, J.E.(2010) Causal inference in educational effectiveness research: A comparison
of three methods to investigate effects of homework on student achievement. Invited key-note address of the second meeting of EARLI SIG 18. Centre for Evaluation and Educational Effectiveness, University of Leuven, 25- 27 August, 2010
OECD (2001).Education at a Glance. OECD Indicators. Paris: OECD Publishing. OECD (2007).Education at a Glance. OECD Indicators. Paris: OECD Publishing. OECD (2009).Education at a Glance. OECD Indicators. Paris: OECD Publishing. OECD(2010).PISA 2009 Results Volume I, What Students Know and Can Do: Student
Performance in Reading, Mathematics and Science. Paris: OECD Publishing. OECD (2011).Quality Time for Students: Learning In and Out of School, OECD Publishing. Scheerens, J. (2004). The evaluation culture. Studies in Educational Evaluation, 30, 105-124. Schildkamp, K. (2007). The Utilisation of a Self-Evaluation Instrument for Primary
Education. Enschede: University of Twente. Scheerens, J., Glas, C., & Thomas, S. (2003). Educational Evaluation, Assessment and
Monitoring. Lisse: Swets & Zeitlinger. Scheerens, J., Glas, C.W., Jehangir, K., Luyten, H. & Steen, R. (2012). System Level
Correlates of Educational Performance. Thematic Report based on PISA 2009 data. Enschede: University of Twente, Department of Educational Organisation and Management.
Mullis, I.V.S., Martin, M.O., Gonzalez, E.J., Gregory, K.D., Garden, R.A., O'Connor, K.M., Chrostowski, S.J., & Smith, T.A.(2000).TIMSS 1999 International Mathematics Report. Findings from IEA's Repeat of the Third International Mathematics and Science Study at the Eighth Grade. Boston College, The International Study Center.
Woessmann, L., Luedemann, E., Schuetz, G. & West, M.R. (2009).School Accountability, Autonomy and Choice around the World. Cheltenham, UK/ Northampton, MA, USA: Edward Elgar.

46

47
CHAPTER 3: META-ANALYSES Maria Hendriks, Hans Luyten, Jaap Scheerens and Peter Sleegers Introduction In this chapter results of a research synthesis and quantitative meta-analyses on the effects of time on student performance in education are presented. The three categories of education time, which were used in the earlier chapters, namely time at school during regular lesson hours, homework and extended learning time, were addressed in separate reviews and meta-analyses. Moreover, specific facets of time at school and homework were distinguished, so that separate results for these sub-categories could be obtained. In the case of time during regular lesson hours, a distinction was made between allocated time, instruction time and time on task. In correspondence with definitions presented in earlier chapters, allocated time refers to official teaching hours. Instruction time refers to the part of the allocated time that is spent on instruction, where the difference between allocated and “net” instruction time may be caused by the time the teachers needs to get the class organized, disruptions etc. Time on task is defined on the basis of student behavior, as the time he or she manifests on-task behavior. Three types of measures of homework were distinguished, homework frequency, homework time and amount of homework. The first refers to the number of times students get homework assignments, the second to the time they spent on homework, while amount of homework refers to the amount of subject matter that the students covered during homework (see the introduction of these interpretations of homework in Chapter 1). In the actual analyses studies in which homework was measured at the individual student level were distinguished from studies in which school or classroom level definitions of homework were used. Extended learning time, as part of out of school programs, was described in Chapter 1, as a heterogeneous set of activities, varying in primary objectives (e.g. academic learning, social engagement and care taking) and form (extended school day, extended school year, summer learning, private tuition sessions). The studies that were selected for our review all contained cognitive outcome measures, implying that these programs at least targeted such outcomes, possibly next to other objectives. In the review and meta-analysis of extended learning time no attempt was made to analyze specific facets or sub-categories. This decision was also based on the relatively low number of studies and effect sizes. In our synthesis of research results we applied two methodological approaches. In the first place we used the so called “vote count” technique, which basically consists of counting the number of positive and negative statistically significant and non-significant associations. This technique could be seen as a rather primitive form of meta-analysis,3 which has many limitations, as will be documented in more detail when presenting the analyses. The main reason to still use the vote count method was that a sizeable number of relevant studies did not provide sufficient detailed information to permit calculation of an effect size. In order to not throw away the information from these studies we used the less demanding vote-count procedure. In the second place we carried out quantitative meta-analyses, in which effect estimates were combined statistically. As research studies may contain several outcome measures to which time is associated, decisions have to be made with respect to the grouping of the outcome variables. On this issue we decided to distinguish outcome variables and their 3 Following Cooper et al., 2009, “vote counting” is still seen as meta-analysis, since it involves statistically describing study outcomes.

48
association with time, when these belonged to different sub samples of the study. So the sample was used as the unit of analysis in the meta-analyses. In case more effect size estimates of the time - achievement relationship were calculated for one single sample of students, these effect sizes were averaged prior to the meta-analysis so that each sample yielded only one effect size estimate. For the case of studies addressing the effect of extended learning time, the number of samples to which quantitative meta-analyses could be applied was altogether too small, so that, for this variable a vote-count was the only option. The techniques of vote counting and meta-analysis were used to synthesize the results of studies published between 1985 and 2011. The present meta-analyses are a reanalysis and extension of earlier meta-analyses published by Scheerens and Bosker (1997), Scheerens, Seidel and others (2005) and Scheerens, Luyten, Steen and Luyten-de Thouars (2007). The earlier meta-analyses focused more broadly on effectiveness enhancing variables at school and instructional level, including two of the variables addressed in this report: learning time at school and homework. Extended learning time, the third variable of interest in this study was not included in the previous meta-analyses. The previous meta-analyses used studies published between 1985 and 2005. The data available from the earlier meta-analyses were reanalyzed, together with the analyses of the more recent studies. Search strategy and selection criteria For studies published in the period 2005-2011 a computer assisted search was conducted in November 2011. The following online databases were used: Web of science (www.isiknowledge.com); Scopus (www.scopus.com); and ERIC and Psycinfo (provided through Ebscohost). The databases were primarily explored using the same key terms as used in the meta-analyses by Scheerens et al. (2007) that focused on effectiveness enhancing variables at school and instructional level, including learning time at school and homework:
("school effectiveness" or “education* effectiveness" or "teach* effectiveness" or effectiv* teaching" or “effective instruction" or "instruction* effectiveness" or "mastery learning" or "constructivist teaching” or “mathematics instruction" or "reading instruction" or "science instruction" or "mathematics teaching" or "reading teaching" or "science teaching")
In addition the following terms were used in the search: ("value added" or attainment or achievement or "learn* result*" or “learn* outcome*" or "learn* gain" or "student* progress")
To restrict the number of publications, key terms with regard to the time variables of interest for this meta-analysis (learning time at school, homework and extended learning time) were combined with the search terms used in the meta-analysis by Scheerens et al. (2007). For this third group of keywords the following terms were used:
(“school* time”, instruction* time, “class* time, “learn* time”, “teach* time”, homework, "opportunity to learn", "time on task", "out school", "after school", "extended school day", “extended school year”, “lengthened school day”, “lengthened school year”, “vacation program”, “summer school”, “weekend school”, “homework study”, tutoring, ”supplementary education”, ”supplementary schools ”)
A total of 13047 publications was found. After removing the duplicate publications 10626 unique publications were left.

49
The next step then was to examine the title and abstract of each publication to determine whether the study met the following in- and exclusion criteria: The study had to include an independent variable measuring learning time at school or
time spent on homework or extended learning time at student, class or school level. The study had to include a measure of cognitive student achievement in mathematics,
language, science or other school subjects as the dependent variable. Examples include scores on standardized tests, achievement gain scores and grades in subject areas.
The study had to focus on primary or secondary education (for students aged 6-18). Studies that focused on preschool, kindergarten or on postsecondary education were excluded.
The study had to be conducted in regular education. Studies containing specific samples of students in regular schools (such as students with learning, physical, emotional, or behavioral disabilities) or studies conducted in schools for special education were excluded from the meta-analysis.
The study had to be published or reported between 2005 and 2011. Studies published as online first publication in 2011 were also included.
The study had to be written in English, German or Dutch. The study had to have estimated in some way the relationship between a measure of
learning time at school, homework time or extended learning time and student achievement. For the quantitative meta-analyses, the study had to provide one or more effect sizes or had to include sufficient quantitative information to permit the calculation of an effect size.
If the abstract of the publication did not include sufficient information to decide that the publication met the in- or exclusion criteria, the full text of the publication was reviewed by one of the researchers. In total 382 publications passed to the second round for full-text review. In addition, to identify additional published studies, recent reviews and books on learning time at school, homework and out-of-school learning time were examined, as well as the literature review sections from the obtained articles, chapters, research reports, conference papers and dissertations. The review of full text publications resulted in 47 publications covering the period 2005-2011 to be fully coded in the coding phase. Coding procedure Lipsey and Wilson (2001) define two levels at which the data of the study should be coded: the study level and the level of an effect size estimate. The authors define a study as “a set of data collected under a single research plan from a designated sample of respondents” (Lipsey & Wilson, p. 76). A study may contain different samples, when the same research is conducted on different samples of participants (e.g. when students are sampled in different grades, cohorts of students or students in different stages of schooling -primary or secondary-) or when students are sampled in different countries. An estimate is an effect size, calculated for a quantitative relationship between an independent and dependent variable. As a study may include, for example, different measurements of the independent variable (such as allocated learning time and time on task in the case of learning time at school), as well as different achievement measures to measure the dependent variable ( such as different subtests covering different domains of subject matter), assessments of pupils at several points in time, and different analysis methods (e.g. Pearson correlation and regression), a study may yield many effect sizes, each estimate different from the others with regard to some of its details.

50
The studies selected between 2005 and 2010 were coded by the researchers applying the same coding procedure as used by Scheerens et al. (2007). The coding form included five different sections: report and study identification, characteristics of the independent (time) variable(s) measured, sample characteristics, study characteristics and time effects (effect sizes). The report and study identification section recorded the author(s), the title and the year of the publication. The section with characteristics of the time variable(s) measured coded the conceptualization of the time variable(s) used in the study (i.e. learning time at school, homework time at pupil level, homework time at class/school level and extended learning time) as well as the subcategories or types of the time variables distinguished (allocated time, instruction time and time on task for learning time at school and homework frequency, homework time and amount of homework for homework at individual level and homework at class/school level respectively). The operational definitions of the time variables used in the studies were recorded too. The sample characteristics section recorded the study setting and participants . For study setting the country or countries selected to take part in the research were corded. With regard to participants, the stage of schooling (primary or secondary level) the sample referred to was coded as well as the grade or age level(s) of the students the sample focused on. The number of schools, classes and students included in the sample were recorded as well. The study characteristics section coded the research design chosen, the type of instruments employed to measure the time variable(s), the statistical techniques conducted and the model specification. For the type of research design we coded whether the study applied a quasi experimental - or experimental research design and whether or not a correlational survey design was used. With regard to the type of instruments used we coded whether a survey instrument or log was used and who the respondents were (students, teachers, principals and/or students), and whether data were collected by means of classroom observation or video-analysis or (quasi) experimental manipulation. The studies were further categorized according to the statistical techniques conducted to investigate the association between time and achievement. The following main categories were employed: ANOVA, Pearson correlation analysis, regression analysis, path analysis/LISREL/SEM and multi-level analysis. We also coded whether the study accounted for covariates at the student level, i.e. if the study controlled for prior achievement, ability and/or student social background. For learning time at school we coded whether, in addition to the time variable used, (other) process variables at class or school level were included in the study as well. Finally, the time effects section recorded the effects sizes, either taken directly from the selected publications or calculated (see section calculation of effects sizes below). The effect sizes were coded as reflecting the types of outcome variables used (i.e. achievement test score, value-added output indicator, gain score, attainment measure, grade) as well the academic subject(s) addressed in the achievement measure. Four groups of subjects were distinguished in the coding: language, mathematics, science and other subjects. Vote counting procedure As stated in the introduction, a vote counting procedure was applied to permit inclusion of those studies that reported on the significance and direction of the association between a measure of learning time or homework time and student achievement, but did not provide sufficient information to permit the calculation of an effect size estimate. Vote counting comes down to counting the number of positive significant, negative significant and non-significant associations between an independent variable and a specific dependent variable of interest from a given set of studies at a specified significance level, in
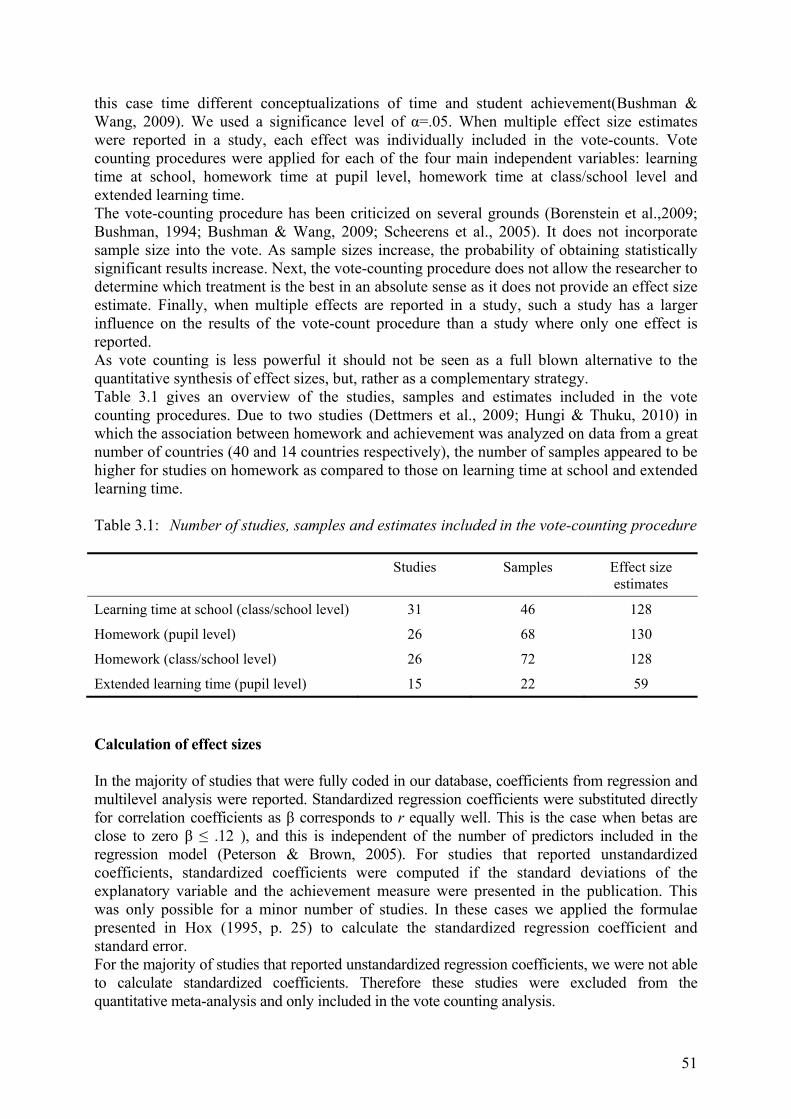
51
this case time different conceptualizations of time and student achievement(Bushman & Wang, 2009). We used a significance level of α=.05. When multiple effect size estimates were reported in a study, each effect was individually included in the vote-counts. Vote counting procedures were applied for each of the four main independent variables: learning time at school, homework time at pupil level, homework time at class/school level and extended learning time. The vote-counting procedure has been criticized on several grounds (Borenstein et al.,2009; Bushman, 1994; Bushman & Wang, 2009; Scheerens et al., 2005). It does not incorporate sample size into the vote. As sample sizes increase, the probability of obtaining statistically significant results increase. Next, the vote-counting procedure does not allow the researcher to determine which treatment is the best in an absolute sense as it does not provide an effect size estimate. Finally, when multiple effects are reported in a study, such a study has a larger influence on the results of the vote-count procedure than a study where only one effect is reported. As vote counting is less powerful it should not be seen as a full blown alternative to the quantitative synthesis of effect sizes, but, rather as a complementary strategy. Table 3.1 gives an overview of the studies, samples and estimates included in the vote counting procedures. Due to two studies (Dettmers et al., 2009; Hungi & Thuku, 2010) in which the association between homework and achievement was analyzed on data from a great number of countries (40 and 14 countries respectively), the number of samples appeared to be higher for studies on homework as compared to those on learning time at school and extended learning time. Table 3.1: Number of studies, samples and estimates included in the vote-counting procedure
Studies Samples Effect size estimates
Learning time at school (class/school level) 31 46 128
Homework (pupil level) 26 68 130
Homework (class/school level) 26 72 128
Extended learning time (pupil level) 15 22 59
Calculation of effect sizes In the majority of studies that were fully coded in our database, coefficients from regression and multilevel analysis were reported. Standardized regression coefficients were substituted directly for correlation coefficients as β corresponds to r equally well. This is the case when betas are close to zero β ≤ .12 ), and this is independent of the number of predictors included in the regression model (Peterson & Brown, 2005). For studies that reported unstandardized coefficients, standardized coefficients were computed if the standard deviations of the explanatory variable and the achievement measure were presented in the publication. This was only possible for a minor number of studies. In these cases we applied the formulae presented in Hox (1995, p. 25) to calculate the standardized regression coefficient and standard error. For the majority of studies that reported unstandardized regression coefficients, we were not able to calculate standardized coefficients. Therefore these studies were excluded from the quantitative meta-analysis and only included in the vote counting analysis.

52
In a number of studies, such as the one by Hungi and Postlethwaite (2009) e.g., effect sizes were reported for significant effects only, and not for non-significant ones. In these studies non-significant effect sizes were either reported as ‘not significant’, leaving the corresponding cell in a table blank or the effect sizes were not included in tables because they did not give a significant contribution to the published model. If the number of not-reported non-significant effect sizes appeared to be small in a sample (i.e. two or less) we decided to impute the value zero for the not-reported non-significant effect size(s). If the number of not-reported non-significant effect sizes was three or more in a sample, we did not take these samples into account in our quantitative meta-analysis (Lipsey & Wilson, 2001). In some studies multiple techniques for data-analysis were applied, e.g. bivariate Pearson correlations and regression or multilevel analysis. For these studies the coefficients of the most appropriate method (regression or multilevel) were included in the meta-analysis. For studies in which bivariate or partial correlation were the only statistical techniques used or for studies for which we were not able to calculate standardized regression coefficients, the estimated Pearson correlation coefficients were included in the meta-analysis. For studies that applied regression or multilevel modeling and in which different (intermediate and final) models were presented, the coefficient(s) from the most fully identified model without interaction effects were used for the meta-analysis. The unit of analysis for this meta-analysis was the independent sample. Some studies however reported multiple effect size estimates for different analyses examining the association between a measure of time or homework and achievement in the same sample. For example, when a study used two different measurements of the homework variable (e.g., time spent on homework and frequency of homework) and also assessed the impact of each homework variable on two outcome measures (e.g. Dutch an English language achievement), then this study yields four effect sizes. As these effect sizes cannot to be assumed statistically independent (see Bennett, 2011, Cooper et al., 2009, Lipsey & Wilson, 2001), these multiple effect sizes should be reduced to a single effect size per sample. This can be done in two ways: firstly by aggregating the multiple effect sizes to produce a single effect size estimate by means of averaging or, secondly, by selecting one of the effect sizes for inclusion in the meta-analysis, e.g. by taking the most commonly used operationalization, the most reliable operationalization or by random selection (Lipsey & Wilson, 2001). In our meta-analysis multiple effect sizes were averaged to yield a single mean effect size at sample level. Average effect sizes were computed when: multiple measures or operationalizations of the same explanatory variable are included in
the same analysis (e.g. homework measured both by a teacher questionnaire and a student questionnaire or homework time and homework frequency);
multiple measures of the dependent variable are used to assess student achievement (e.g. when both a reading and writing test are used to measure language achievement or when achievement tests are used in different subjects, e.g. language and math);
achievement is measured at different times in the same sample: e.g. at the end of year1, year 2, year 3 and year 4 as was the case in the longitudinal study by Kyriakides & Creemers (2008).
Effect sizes were not averaged in the following cases:
Analyses are performed per country in case more countries are included in a study (e.g. Japan and the United States).
Different school levels are included (e.g. both primary and secondary level).

53
Different age levels from the same school level are included in the analysis (e.g. both grade 4 and 6 in primary school
Table 3.2 provides an overview of the number of studies, samples and effect sizes included in the quantitative meta-analysis. The number of estimates refers to the number of effects reported in the sample before averaging these to one effect size per sample. Due to the low number of effect size estimates for language and math separately we were not able to perform the meta-analyses also for these achievement domains separately. The low number of samples (N = 6)4 available on extended learning time for the meta-analysis did not permit a meta-analysis on this variable, so for extended learning time we had to stick to the vote count procedure only. Table 3.2: Number of studies, samples and estimates included in the meta-analysis (1985-
2011)
Studies Samples Effect size estimates
Total Language Math Science Other subjects
Learning time at school 12 16 31 10 18 3 0
Homework at pupil level 17 19 30 11 15 0 4
Homework at class/school level
10 12 19 5 10 3 1
In order to compare the different effects size measures used in the studies, we transformed the effects size measures into Fisher’s Z using formulae presented by Lipsey and Wilson (2001). Fisher’s Z was thus used as the effect size estimate for our quantitative meta-analysis to calculate the average effect size of time in education Weighing of effect sizes To calculate average effect sizes weighted and unweighted procedures can be used. In the unweighted procedure, each effect size is given an equal weight in calculating the average effect size. In the weighted procedure the weights used can be based on a fixed effects model or random effects model. In a fixed model it is assumed that the true effect size is the same in all samples included in the meta-analysis and that the random influence on the effect sizes stems from sampling error alone. In the random effects model, because of real sample-level differences (such as variations in study designs settings, measurements of the independent variable, model specifications etc.), the true effect size is expected to be similar but not identical across samples. In the random effects model the variance associated with each effect size is based on sample level sampling error (the within sample variance like the fixed effects model) and a value representing other sources of variability assumed to be randomly distributed (the between-sample variance) (Borenstein et al., 2009; Lipsey & Wilson, 2001). Under a fixed effects approach each study is weighted by the inverse of its within sample variance. In the random effects model each study is weighted by both the inverse of its within sample variance and the estimate of the between-samples variance (Borenstein et al., 2009). With
4 For extended learning time the number of samples included in the vote counting procedure is 22. The number of samples that might have been included for quantitative meta-analysis is 6.

54
the exception of the case in which the between-samples variance is zero, the variance, standard error and confidence interval for the average effect size will be wider under the random effects model. In our meta-analysis a random effects model is considered most appropriate for interpretation because of large differences in settings, designs, measurements instruments and statistical techniques used in the studies. Data Analysis Overall approach Multilevel meta-analyses were conducted based on the approach outlined by Hox (2002). The units of analysis are samples of students. The analyses were conducted using the MLwiN statistical software package. A random-effects model was fitted. This approach assumes real variation between samples, whereas the fixed effect model only assumes error variance. A drawback of the random components model is that the results obtained may be less robust than outcomes obtained when applying the fixed effects model. This is especially true in the case of a relatively small number of units (samples in the present case). The fixed effects model is a much simpler method that yields robust results, but the assumptions on which the fixed effect model is based clearly do not apply in the present case. For illustrative purposes outcomes based on the fixed effect model are also reported. In this way it is possible to indicate to what extent findings based on both models yield different findings. In the two-level analyses conducted, the upper level relates to the variance between samples and the lower level relates to the variance within each sample. The inverse error variance (i.e. the squared standard error) was used for weighing at the lowest level. The variance at this level was constrained to 1. When fitting these models the variance at the upper level expresses the amount of variation in outcomes between samples. In the first step of the analysis a zero-model was fitted. The results show the average effect across samples for learning time or homework (either as an individual level variable or a variable measured at the class or school level). The results also show to what extent the outcomes vary significantly across samples. If this was the case, it was investigated whether the variance across samples correlates with characteristics of the sample (e.g. number of students, primary or secondary education) or the characteristics of the study (e.g. design, multilevel analyses or otherwise, controlling for cognitive aptitudes or prior achievement). It was also investigated whether the effect of learning time and homework differed between separate conceptualizations, including allocated time, instructional time, time on task; for homework: time, amount, frequency (see the section on moderators below). Finally, analyses were conducted based on the fixed effects model. Although the assumptions underlying this model do not apply in the present case, an important advantage of this approach in comparison to the random effects model is the robustness of its estimates. By applying both approaches we are able to compare the findings of the most appropriate but less robust model to those of a less appropriate but more robust model. If the finding from both approaches produce similar results, this will increase the credibility of the findings. Moderators Moderator analyses were conducted to examine the degree to which the relationship between learning time or homework on the one hand and student achievement on the other, could be attributed to specific sample or study characteristics. Due to the low number of samples included in the meta-analysis, these moderator variables were included as covariates in the multilevel regression analysis separately (Hox, 2002).

55
Definition of the time variables For learning time at school we first investigated whether the operational definition of the time variable used in the study, being categorized either as allocated learning time, instructional time or time-on-task, had a different impact on achievement. Based on previous reviews and meta-analyses we expected that the impact of instructional or engaged time or time-on-task on achievement will be stronger than the effect of allocated time on achievement (See Chapter 1). Following De Jong, Westerhof & Creemers (2000) homework variables used in the different studies were categorized in three groups: amount of homework, homework frequency and time spent on homework. The meaning of these variables at student level might not be the same as the meaning at the classroom or school level (Trautwein & Köller, 2003; Trautwein et al.,2009). Aggregated at class or school level, a positive homework effect is found when e.g. students in classes or schools that spend more time on homework have higher achievement than students in classes or schools that do not spend that much time. At individual student level the effect of homework time on achievement is positive when students spending more time on homework have better achievement gains than their peers who do not spend that much time. Homework time at class or school level is often seen as a proxy of the homework assigned, while homework time at individual level is associated with cognitive abilities and/or motivational aspects (such as e.g. prior knowledge or study habits). Therefore in this review and meta-analysis samples in which homework at individual level were analyzed were distinguished from samples in which homework was analyzed at the classroom or school level (De Jong et al., 2000; Dettmers et al., 2009: Trautwein et al., 2002; Trautwein & Köller, 2003; Trautwein et al.,2009). As multi-level analysis enables estimating homework effects both at individual student level and at school/class level, our analyses provide the opportunity to compare outcomes for both cases. In earlier studies that used multilevel analyses positive associations were found at school/class level, but negative associations at individual level (Gustavsson, 2010, Trautwein et al., 2002; Trautwein & Köller, 2003). At both levels the strength of the association diminishes as control variables are used in the analysis. It appears to be difficult to “separate” homework effects from ability and motivational factors at individual student level, and, at class level, to isolate homework from associated factors of good quality teaching. One implication might be that due to not controlling for relevant co-variables at individual level negative association at individual level, as found by the authors cited above, may be a spurious one. Sample and study characteristics used as moderators The following types of moderator variables were used in our analyses: sample characteristics as geographical region, and the level of schooling (primary, secondary schools), and study characteristics that refer to methodological and statistical aspects, e.g. study design, model specification, whether or not covariates at the student level are taken into account and whether or not multilevel analysis was employed. In addition, following an approach presented by Hox (2002), we used the total sample size of the studies as a moderator variable to check on publication bias. Each type of moderator will be explained briefly below. We examined the effects of the geographical region in which the studies were conducted as there might be differences in learning time and homework practices across countries that impact on the size of the time-achievement association. In a previous meta-analysis by Scheerens et al. (2007) studies that investigated the impact of learning time on achievement in the Netherlands produced a significant lower effect compared to studies carried out in other countries, while for homework the effect sizes found in the United States and in the

56
Netherlands were substantially higher compared to those in other countries. In this meta-analysis a distinction is made between European countries, North American countries and other countries. In addition, we also investigated whether the time and achievement correlation was moderated by the level of schooling. Cooper (1989) reported that effect sizes for the association between homework and achievement were lower for studies conducted in elementary schools than for studies carried out in middle schools. The strongest effect sizes were found in studies that were conducted in high school. Cooper et al. (2006) found a significant positive relationship between homework and achievement at secondary level, while the effect for primary schools depended on the effect model used in the analysis (fixed versus random effects model). Therefore it might be expected that higher effects of the homework-achievement relationship are found in secondary than in primary education (see also Trautwein et al., 2009). The other moderator variables refer to the model specification, i.e. whether or not studies have accounted for covariates at the student level (SES and cognitive aptitude/prior achievement) and to the statistical technique employed in the primary studies to perform the data analyses (whether or not multilevel analysis was conducted). It seems plausible that the use of more advanced techniques of analysis (such as multilevel modeling) and controlling for confounding variables produces more accurate effect estimates. Publication bias is a threat to the validity of meta-analyses, as studies that find significant effects might have more chance to get published (Lipsey & Wilson, 2001; Sutton in Cooper et al., 2009). Hox (2002) suggests to include sample size as a moderator variable to check for publication bias. The rationale behind this recommendation is that reports of large-scale studies are likely to be published, even if they fail to show significant results. Small-scale studies may only draw attention if they come up with significant findings. Non-significant findings from small-scale studies run the highest risk of ending up in a file drawer. A negative relation between sample size and effect size must therefore be considered a strong indication of publication bias, as this indicates that relatively large effects were found in small samples. Results Learning time at school Only 12 of 31 studies into the effect of time at school on student achievement appeared to be amenable to quantitative synthesis of their effect sizes. As indicated in Tables 3.1 and 3.2, the total of 31 studies contained 46 samples and 128 effect estimates. From the 12 studies that could be analyzed quantitatively, effect sizes could be computed for 16 samples, which were based on a total of 31 effect sizes. For detailed information with respect to the concept of time that was analyzed and the methodology used in these studies, we refer to the Appendix (Tables A1 and A2 ). The results of the vote count analyses provide a rough overall picture on the question to what extent time has the expected positive association with student achievement. Table 3.3 shows the total number of negative, non-significant and significant positive associations.

57
Table 3.3: Results of vote counting for learning time at school on academic achievement (See also see Table A4 in the Annex).
Learning time at school Negative Not significant Positive Total
Total 8 67 53 128
The findings of the vote counting show a mixed picture: both positive and negative associations between time and achievement were found. Furthermore, less than half of the number of estimates appears to be positive and significant. The fact that only 8 estimates showed negative effects might be seen as weak evidence for at least the predominant direction of the effect. In Table 3.4 the result of the vote counting for allocated time, instruction time and time on task are shown. Table 3.4: Results of vote counts examining the number and percentage of negative, non-
significant and positive effects of allocated time, net instruction time and time on task on academic achievement
Negative effects
Non-significant
effects
Positive effects
Negative effects
Non-significant
effects
Positive effects
Conceptualization N N N % % %
Allocated time 4 25 25 7 46 46
Net instruction time 3 26 12 7 63 29
Time on task 0 15 14 0 52 48
Total 8 67 53 6 52 41
In contrast to our expectations, net instruction time appeared to have less positive effects on student achievement than allocated time (29% versus 46%). In addition, the results show that time on task has the largest percentage of positive effects on student achievement. This finding is more in the line with our expectations. Analyses of vote counts applied to studies that addressed the effect of learning time at school on achievement in different subject matter areas does not show any differences of importance (see Table A7 in the Annex). Analyses of study characteristics that might have influenced the estimates, described as moderators, did not show any off-setting of the general division of positive and negative effects. The only exceptions were a sizably higher percentage of positive effects for studies that had included only time and no other process variables at school and class level, in the model specification (68%), and a low percentage of positive effects when ability was used as a covariate (21%), see Table A7 in the Annex. Table 3.5 shows the results from the quantitative meta-analyses with regard to learning time5.
5 As mentioned earlier, the unit of analysis in the quantitative meta-analysis was the independent sample. As we averaged multiple effect size estimates reported for the sample, for each sample only one effect size estimate of the relationship between time and achievement was used in the analyses.

58
The average effect, for learning time at school (composite) on student achievement across all 16 samples is modest (.0464), but significant for α < .05 (one-tailed; t-value = 2.522/df = 15). It was hypothesized a priori that the effect of learning time and homework on student achievement are positive. Therefore one-tailed significance levels are reported for these effects. Furthermore the results indicated that the variance across samples of learning time at school (random effect) is statistically non-significant (p = .200). Given the lack of significant variation across samples, no additional analyses were conducted to investigate whether differences in findings correlate with certain study characteristics. Table 3.5: Parameter estimates (and standard errors) of conceptualization of learning time
at school predicting effect size (results from multilevel meta-analysis)
ka (0) (1)
Learning time at school (composite) (Intercept) 16 .0464 (.0184)b
Conceptualization of learning time at school (RC = allocated time)
7 .0168(.0096)
Instructional time 5 .0320(.0117)b
Time on task 4 .0933(.0712)
Variance component at between samples level .0042 .0029
P value .200 .099
Variance component at within sample level 1.00 1.00
Note: For each categorical variable one category was chosen as the reference category (RC) a Number of estimates included in the analysis b Significant effect (α < .05 or α < .01 in a one-tailed test; see text for details) The results of the analysis aimed to detect differences in effects between three distinct conceptualizations of learning time show that the intercept does not deviate significantly from zero (α > .05, one-tailed; t-value = 1.750/df = 15). This relates to the effect of allocated time. The table further shows that the effect for time on task does not deviate significantly from the intercept, i.e. from the effect of allocated time (α > .05, one-tailed; t-value = 1.310/df = 15). Only the effect of instructional time reaches statistical significance (α < .01, one-tailed; t-value = 2.735/df = 15). Although the amount of variance across samples has decreased (.0029 vs. 0042) the p value has improved but is still quite modest (p = .099). It should be noted that these results are based on relatively few units of analysis, so that statistical significance depends highly on the variability between the estimates. The effect of allocated time (.0168; not significant: α > .05) on student achievement was found to be smaller than the impact of instruction time (the effect of instruction time is .0320 higher). In addition, time on task seems to have the strongest effect on student achievement, compared with allocated and instruction time. The average effect size for time on task across 4 samples is .110 (.0168 + .093); note that the difference is not significant). These findings correspond with earlier research, as far as the relative magnitudes of the three conceptualizations of learning time are concerned.
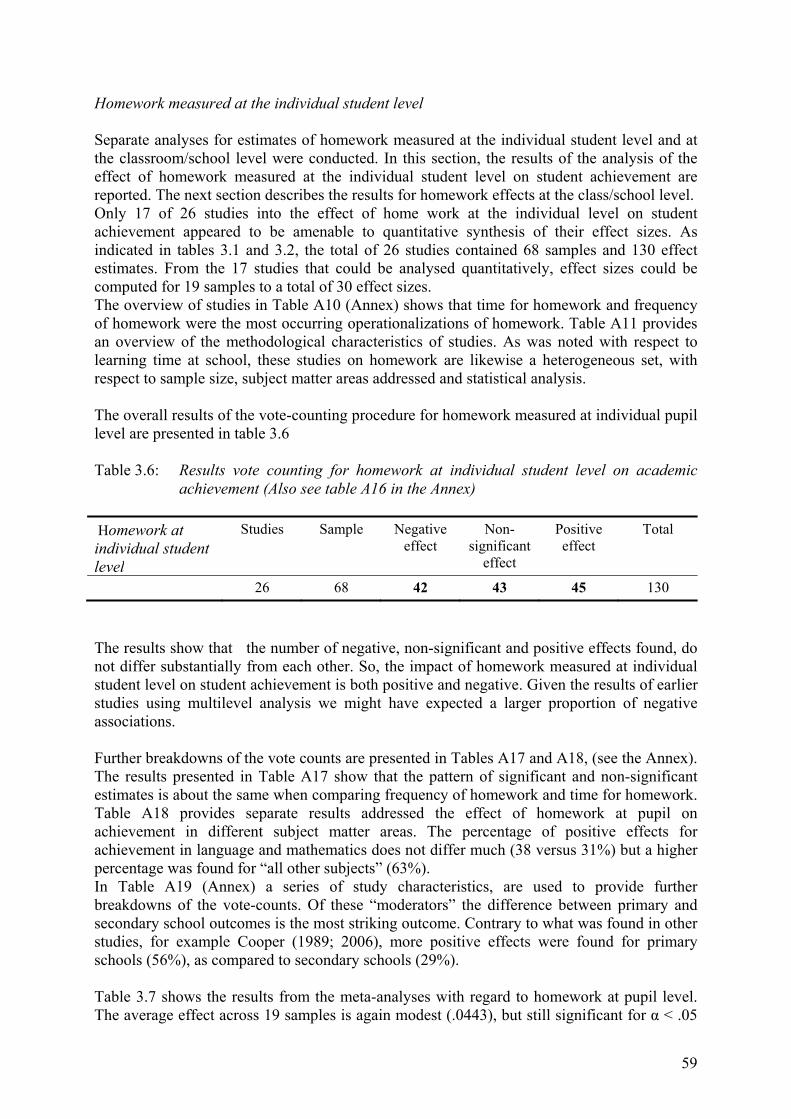
59
Homework measured at the individual student level Separate analyses for estimates of homework measured at the individual student level and at the classroom/school level were conducted. In this section, the results of the analysis of the effect of homework measured at the individual student level on student achievement are reported. The next section describes the results for homework effects at the class/school level. Only 17 of 26 studies into the effect of home work at the individual level on student achievement appeared to be amenable to quantitative synthesis of their effect sizes. As indicated in tables 3.1 and 3.2, the total of 26 studies contained 68 samples and 130 effect estimates. From the 17 studies that could be analysed quantitatively, effect sizes could be computed for 19 samples to a total of 30 effect sizes. The overview of studies in Table A10 (Annex) shows that time for homework and frequency of homework were the most occurring operationalizations of homework. Table A11 provides an overview of the methodological characteristics of studies. As was noted with respect to learning time at school, these studies on homework are likewise a heterogeneous set, with respect to sample size, subject matter areas addressed and statistical analysis. The overall results of the vote-counting procedure for homework measured at individual pupil level are presented in table 3.6 Table 3.6: Results vote counting for homework at individual student level on academic
achievement (Also see table A16 in the Annex)
Homework at individual student level
Studies Sample Negative effect
Non-significant
effect
Positive effect
Total
26 68 42 43 45 130
The results show that the number of negative, non-significant and positive effects found, do not differ substantially from each other. So, the impact of homework measured at individual student level on student achievement is both positive and negative. Given the results of earlier studies using multilevel analysis we might have expected a larger proportion of negative associations. Further breakdowns of the vote counts are presented in Tables A17 and A18, (see the Annex). The results presented in Table A17 show that the pattern of significant and non-significant estimates is about the same when comparing frequency of homework and time for homework. Table A18 provides separate results addressed the effect of homework at pupil on achievement in different subject matter areas. The percentage of positive effects for achievement in language and mathematics does not differ much (38 versus 31%) but a higher percentage was found for “all other subjects” (63%). In Table A19 (Annex) a series of study characteristics, are used to provide further breakdowns of the vote-counts. Of these “moderators” the difference between primary and secondary school outcomes is the most striking outcome. Contrary to what was found in other studies, for example Cooper (1989; 2006), more positive effects were found for primary schools (56%), as compared to secondary schools (29%). Table 3.7 shows the results from the meta-analyses with regard to homework at pupil level. The average effect across 19 samples is again modest (.0443), but still significant for α < .05

60
(one-tailed; t-value = 2.041/df = 18). In this case the variance across samples of the effect is statistically significant (p < .001). Given the significant amount of variance across samples, additional analyses were conducted to investigate whether differences in the findings correlate with certain sample or study characteristics. Table A 25 in the Annex reports the findings from these analyses. It appeared that in Asian samples a stronger effect of homework (at the pupil level) was detected. The table also shows the results of an analysis that focused on differences in effects between the three conceptualizations of homework (time spent on homework, amount of homework and frequency of homework). This analysis produced no significant findings except for the amount of variance across samples. This implies that although across all three conceptualizations the effect of homework at the pupil level is statistically significant, for none of the three distinct conceptualizations a separately significant effect could be detected. Neither was a significant effect found for the for the variable “number of students (times 10,000; centered around the grand mean), which was used to check for selection bias (Table A25 in the Annex). Table 3.7: Parameter estimates (and standard errors) of conceptualization of homework at
pupil level predicting effect size (results from multilevel meta-analysis)
ka (0) (1) Homework (composite) (Intercept) 19 .0443 (.0217)b Conceptualizations of homework (RC = time spent on homework)
14 .0408 (.0277)
Amount of homework
2 .0503 (.0376)
Frequency of homework
3 -.0160 (.0384)
Variance component at between samples level .0080 .0088P value < .001 < .001Variance component at within sample level 1.00 1.00
Note: For each categorical variable one category was chosen as the reference category (RC) a Number of estimates included in the analysis b Significant effect (for α < .05, one-tailed) Homework measured at the school/class level Only 10 of 26 studies into the effect of home work at the class/school level on student achievement appeared to be amenable to quantitative synthesis of their effect sizes. As indicated in Tables 3.1 and 3.2, the total of 26 studies contained 72 samples and 128 effect estimates. From the 10 studies that could be analyzed quantitatively, effect sizes could be computed for 12 samples to a total of 17 effect sizes. Details of the studies are shown in Tables A12 and A13 in the Annex. Again, as for homework measured at the individual student level, time, frequency and amount of homework are the most important operationalizations. Amount of homework is better represented in the studies at school/classroom level, than was the case for the studies on at individual pupil level. Table A13 provides an overview of the methodological characteristics of studies. As was noted with respect to learning time at school, and homework measured at the individual pupil level, these studies on homework measured at school/class level are likewise a

61
heterogeneous set, with respect to sample size, subject matter areas addressed and statistical analysis. The overall results of the vote-counting procedure for homework measured at school/class level are presented in Table 3.8. Table 3.8: Results of vote-counts examining the number of negative, non-significant and
positive effects of homework at class/school level on academic achievement. (See table A20 in the Annex)
Homework at class/school level
Number of studies included
Number of samples included
Negative effect
Non-significant effect
Positive effect
Total effects
26 72 1 66 61 128
These overall results show hardly any negative effects of homework at the class/school level on student achievement. Furthermore, the results show that almost the same number of non-significant and significant positive effects were found. Further breakdowns of the vote counts are presented in Tables A21 and A22, in the Annex. The results presented in Table A21 show a roughly similar percentage of positive effects for amount of homework and time for homework (53 versus 55). The percentage of positive effects for frequency of homework is somewhat lower (37%). The results in table A22 indicate higher percentages of significant effects for math achievement (57) and achievement in all other subjects (73) than for language (15). In Table A23 (Annex) a series of study characteristics, are used to provide further breakdowns of the vote-counts. None of these characteristics appears to amount to much divergence from the average number of positive effects. Interestingly for homework measured at school/class level a higher percentage of significant positive estimates was found for secondary schools (56) than for primary schools (32). This is contrary to the findings for homework measured at individual student level, and more in consonance with the literature. Table 3.9 shows the results from the meta-analyses with regard to homework at class/school level. The average effect across 12 samples is somewhat larger (.0581) than the effect for homework at individual level, and significant for α < .001 (one-tailed; t-value = 4.063/df = 11). The variance across samples is again statistically significant (p < .001). Given the significant amount of variance across samples, additional analyses were conducted to investigate whether differences in the findings correlate with certain characteristics of the samples or the study. The results of these analyses showed that no significant moderator effects were found (see Table A28 in the Annex). Neither was a significant effect found for the for the variable “number of students (times 10,000; centered around the grand mean), which was used to check for selection bias (Table A28 in the Annex). Subsequent analyses focused on differences in effects between the three conceptualizations of homework. This analysis yields a non-significant intercept, which implies that the effect of time spent on homework does not deviate statistically from zero. The table further shows that the effect for amount of homework does not deviate significantly from the intercept, i.e. from the effect of time spent on homework (α > .05, one-tailed; t-value = 1.418/df = 11). Only the effect of frequency of homework reaches statistical significance (α < .01, one-tailed; t-value =2.779/df = 11).

62
Table 3.9: Parameter estimates (and standard errors) of conceptualization of homework at class/school level predicting effect size (results from multilevel meta-analysis)
ka (0) (1) Homework (composite) (Intercept) 12 .0581(.0143)b Conceptualization of homework (RC = time spent on homework)
3 .0093(.0140)
Amount of homework 2 .0648(.0457) Frequency of homework 7 .0578(.0208)b
Variance component at between samples level .0022 .0022P value < .001 < .001Variance component at within sample level 1.00 1.00
Note: For each categorical variable one category was chosen as the reference category (RC) a Number of estimates at sample level included in the analysis b Significant effect (see text for details) Extended learning time A total of 15 studies, 22 samples and 59 effect estimates could be used for a systematic review on extended learning time, using the vote counting approach. Study characteristics are shown in Tables A30 and A31 in the Annex. Table A30 shows a broad range of out-of- school learning activities, ranging from extra tuition, to extended schooldays, school weeks, and summer learning. Methodological characteristics, in terms of number of units, measures in different subject matter areas, and statistical procedures to measure effects are rather heterogeneous (Table A31). The overall results of the vote-counting procedure for extended learning time are presented in Table 3.10. Table 3.10: Results of vote counts examining the number of negative, non-significant and
positive effects of extended learning time on academic achievement. Also see table A 32 in the Annex
Study Sample Negative Not significant
Positive Total
15 22 5 22 32 59
The results show that slightly more than half of the effect estimates are positive and that the number of negative effects is small. When studies are categorized according to subject matter area of the dependent variable, no big differences are seen. The percentage of positive effects is 60 for mathematics, 50 for language and 47 for all other subjects (see Table A33 in the Annex). Results of moderator analyses examining the number and percentage of negative, non-significant and positive effects of extended learning time on academic achievement do not

63
show important differences between study characteristics like national context of the study and primary or secondary education (see Table A34 in the Annex). As mentioned earlier, due to the small number of samples available for quantitative meta-analysis, we did not conduct quantitative meta- analysis for extended learning time. Comparison of fixed and random effects for time and homework As mentioned above, we also conducted analyses based on the fixed effects model. Although the assumptions underlying this model do not apply in the present case, an important advantage of the fixed effect model in comparison to the random effects model is the robustness of its estimates. By applying both approaches we are able to compare the findings of the most appropriate but less robust model to those of a less appropriate but more robust model. If the finding from both approaches produce similar results, this will increase the credibility of the findings. Tables 3.11 and 3.12 show the results of the comparison between the two approaches. The findings indicate that the effects of learning time and homework are positive as expected, but quite small. If a 95% confidence interval is drawn up for the estimates obtained with the random effects model, the findings based on the fixed effects model fall within these intervals. The fact that both approaches produce similar results increases the credibility of our findings. Table 3.11: Comparison of fixed-effects model and random-effects model (estimate and
standard error)
Estimate Standard Error
Fixed effects Random effects Fixed effects Random effects
Learning time (n =16) .0292*** .0464* .0026 .0184
Homework individual (n=19) .0683*** .0443* .0006 .0217
Homework class level (n=12) .0536** .0581*** .0025 .0143 * significant at .05 (one-tailed) ** significant at .01 (one-tailed) *** significant at .001 (one-tailed) Table 3.12: Comparison of fixed-effects model and random-effects model (95% confidence
interval)
95% confidence interval (Fixed effects)
95% confidence interval (Random effects)
Lower bound Upper bound Lower bound Upper bound
Learning time (n =16) .0242 .0342 .0104 ,0825
Homework individual (n=19) .0670 .0696 .0018 .0868
Homework class level (n=12) .0487 .0585 .0301 .0861

64
Discussion When we want to compare our results with the overall picture that arises from the review of earlier meta-analyses on time and homework, described in Chapter 1, we might do this in a rather rough way by pooling our separate results for homework measured at individual and school/class level, and using an average effect size of .05. The estimates for the other meta-analyses are obtained from Tables 1.1. and 1.2, and involve a rough conversion from d to r, by treating the former as twice as large as the latter. This results in the overview of average findings in Table 3.13, which shows our results to be about one third of the earlier reported average effect sizes. Table 3.13: Comparison of average effect sizes (in terms of correlations) between earlier
and our current meta-analyses
Other meta-analyses Meta-analyses presented in this study
Learning time .18 .05
Homework .15 .05
It is not easy to find an explanation for these differences, and the very small effect sizes that we found. One tentative direction of explanation might be that the scientific quality of the selected studies published in the period 2005-2011 is higher than the quality of the selected studies published between 1985-2005 Methodological analysts like Kohn (2006) - referring to homework effects - confirm that, when high methodological standards are applied, effect sizes become very small indeed. A second line of reasoning is supported by findings of strong reduction in effect sizes when indicators on content covered and instructional quality are “controlled for” e.g. Trautwein (2007). Results from a study by Van Ewijk and Sleegers, (2010) support this notion. These authors compared educational effectiveness studies in which only one focal independent variable was used (in their case the socio economic status of the students, SES) to studies where a range of variables was included next to the focal variable. The effect size for SES appeared to be significantly smaller in the second case, namely when a range of other independent variables was included. Some evidence from our own results points in the same direction. In the vote count analyses on time at school we found a sizably higher percentage of positive effects for studies that had included only time and no other process variables at school and class level in the model specification. When considering the sub set of studies that was used for the quantitative meta-analyses, however, there appeared to be only 4 studies that had included just time and no other independent variables. Moreover, inspection of the results presented in Table A9 in the annex shows that the effect estimates for these four studies were exceptionally low in three cases and around the average (.05) shown in Table 3.5 for the fourth study. So, the small number of studies together with the results found are not supportive of our interpretation With respect to extended learning time, we had insufficient information to carry out quantitative meta-analyses. The vote-count results show a mixed picture, with about as many positive as negative and non-significant effects taken together. For extended learning time, earlier meta-analyses indicated an average effect size of r = .09, which, according to scientific convention is a small effect.

65
References Bennett, R.E. (2011). Formative assessment: a critical review. Assessment in Education:
Principles, Policy & Practice, 18(1), 5-25. Borenstein, M., Hedges, L.V., Higgins, J.P.T., & Rothstein, H.R. (2009). Introduction to
meta-analysis. Chichester, UK: Wiley. Bushman, B.J. (1994). Vote-Counting procedures in meta-analysis. In Cooper, H. & Hedges,
L.V. (Eds.), The handbook of research synthesis. New York: Russell Sage Foundation. Bushman, B.J. & Wang, M.C. (2009). Vote-Counting procedures in meta-analysis. In Cooper,
H., Hedges, L.V., & Valentine, J.C. (Eds.), The handbook of research synthesis and meta-analysis (2nd ed.). New York: Russell Sage Foundation.
Cooper, H. (1989). Homework. White Plains, NY: Longman. Cooper, H., Robinson, J.C., & Patall, E.A. (2006). Does homework improve academic
achievement? A synthesis of research, 1987-2003. Review of Educational Research, 76, 1-62.
Cooper, H., Hedges, L. V., & Valentine, J. C. (Eds.)(2009). The handbook of research synthesis and meta-analysis (2nd ed.). New York: Russell Sage Foundation.
De Jong, R., Westerhof, K.J., & Creemers, B.P.M. (2000). Homework and student math achievement in junior high schools. Educational Research and Evaluation, 6(2), 130-157.
Dettmers, S., Trautwein, U., & Lüdtke, O. (2009a). The relationship between homework time and achievement is not universal: Evidence from multilevel analyses in 40 countries. School Effectiveness and School Improvement, 20, 375-405.
Ewijk, R.van & Sleegers, P. (2010). Peer Ethnicity and Achievement: a Meta-analysis Into the Compositional Effect. School Effectiveness and School Improvement, 21(3), 237-265.
Hox, J.J. (1995). Applied multilevel analysis (2nd edition). Amsterdam: TT-publikaties. Hox, J.J. (n.d.) Meta-analysis: Models, estimation and testing. Presentation Utrecht
University. Hox, J. (2002). Multilevel analysis techniques and applications. Mahwah, NJ: Lawrence Erlbaum Associates. Hungi, N., & Postlethwaite, N. T. (2009). The Key Factors Affecting Grade 5 Achievement in
Laos: Emerging Policy Issues. Educational Research for Policy and Practice, 8(3), 211-230.
Hungi, N., & Thuku, F. W. (2010). Variations in Reading Achievement across 14 Southern African School Systems: Which Factors Matter? International Review of Education, 56(1), 63-101.
Kohn, A. (2006). Abusing research: The study of homework and other examples. Phi Delta Kappan, 88(1), 8-22.
Kyriakides, L., & Creemers, B. P. M. (2008). A longitudinal study on the stability over time of school and teacher effects on student outcomes. Oxford Review of Education, 34(5), 521-545.
Lipsey, M.W., & Wilson, D.B. (2001). Practical meta-analysis. Thousand Oaks, CA: Sage. Peterson, R. A., & Brown, S. P. (2005). On the use of beta coefficients in meta-analysis. Journal
of Applied Psychology, 90, 175-181. Scheerens, J., & Bosker, R.J. (1997). The Foundations of Educational Effectiveness. Oxford:
Elsevier Science Ltd. Scheerens, J., Seidel, T., Witziers, B., Hendriks, M., & Doornekamp G. (2005). Positioning
and validating the supervision framework. Enschede: University of Twente, Department of Educational Organization and Management.
66
Scheerens, J., Luyten, H., Steen, R., & Luyten-de Thouars, Y. (2007). Review and meta-analyses of school and teaching effectiveness. Enschede: Department of Educational Organisation and Management, University of Twente.
Taylor, B.M., Pearson, P.D., Peterson, D.S., & Rodriguez, M.C. (2003). Reading growth in high-poverty classrooms: The influence of teacher practices that encourage cognitive engagement in literacy learning. The Elementary School Journal, 104, 3-28.
Trautwein, U. (2007). The homework-achievement relation reconsidered: Differentiating homework time, homework frequency, and homework effort. Learning and Instruction, 17, 372–388.
Trautwein, U. & Koller, O. (2003). The relationship between homework and achievement - Still much of a mystery. Educational Psychology Review, 15(2), 115-145. Trautwein, U., Koller, O., Schmitz, B., & Baumert, J. (2002). Do homework assignments enhance achievement? A multilevel analysis in 7th-grade mathematics. Contemporary Educational Psychology, 27(1), 26-50.
Trautwein, U., Ludtke, O., Schnyder, I., & Niggli, A. (2006). Predicting homework effort: Support for a domain-specific, multilevel homework model. Journal of Educational Psychology, 98(2), 438-456.
Trautwein, U., Schnyder, I., Niggli, A., Neumann, M., & Ludtke, O. (2009). Chameleon effects in homework research: The homework-achievement association depends on the measures used and the level of analysis chosen. Contemporary Educational Psychology, 34(1), 77-88.
Studies used for vote count and meta-analysis References marked with an asterisk indicate studies included in the quantitative meta-analysis. Aslam, M., & Kingdon, G. (2011). What can teachers do to raise pupil achievement?
Economics of Education Review, 30(3), 559-574. Borman, G.D., Benson, J., & Overman, L.T. (2005). Families, schools, and summer learning.
Elementary School Journal, 106(2), 131-150. Bosker, R.J., Kremers, E.J.J., & Lugthart, E. (1990). School and instruction effects on
mathematics achievement. School Effectiveness and School Improvement, 1(4), 233-248. Burkam, D.T., Lee, V.E,. & Smerdon, B.A. (1997). Gender and science learning early in high
school: Subject matter and laboratory experiences. American Educational Research Journal, 34(2), 297-331.
Cameron, C.E., Connor, C.M., Morrison, F.J., & Jewkes, A.M. (2008). Effects of classroom organization on letter-word reading in first grade. Journal of School Psychology, 46(2), 173-192.
*Chen, S. Y., & Lu, L. (2009). After-school time use in Taiwan: effects on educational achievement and well-being. Adolescence, 44(176), 891-909.
Chubb, J.E., & Moe, T.M. (1990). Politics, Markets & America’s Schools. Washington D.C.: The Brookings Institution.
D'Agostino, J.V. (2000). Instructional and school effects on students' longitudinal reading and mathematics achievements. School Effectiveness and School Improvement, 11(2), 197-235.
Dettmers, S., Trautwein, U., & Ludtke, O. (2009). The relationship between homework time and achievement is not universal: Evidence from multilevel analyses in 40 countries. School Effectiveness and School Improvement, 20(4), 375-405.
*Dettmers, S., Trautwein, U., Ludtke, O., Kunter, M., & Baumert, J. (2010). Homework Works if Homework Quality Is High: Using Multilevel Modeling to Predict the

67
Development of Achievement in Mathematics. Journal of Educational Psychology, 102(2), 467-482.
Driessen, G., & Sleegers, P. (2000). Consistency of teaching approach and student achievement: An empirical test. School Effectiveness and School Improvement, 11(1), 57-79.
*Engin-Demir, C. (2009). Factors Influencing the Academic Achievement of the Turkish Urban Poor. International Journal of Educational Development, 29(1), 17-29
* Eren, O., & Henderson, D.J. (2008). The impact of homework on student achievement. Econometrics Journal, 11(2), 326-348.
Eren, O., & Millimet, D.L. (2007). Time to learn? The organizational structure of schools and student achievement. Empirical Economics, 32(2-3), 301-332.
Fehrmann, P.G., Keith, T.Z., & Reimers, T.M (1987) Home influence on school learning: direct and indirect effects of parental involvement on high school grades. Journal of educational research, 80(6), 330-337.
*Flowers, T.A., & Flowers, L.A. (2008). Factors affecting urban African American high school students' Achievement in reading. Urban Education, 43(2), 154-171.
*Fuchs, Th. & Woessman, L. (2007). What accounts for international differences in student performance? A re-examination using PISA data. Empirical economics, 32, 433-464.
Harn, B.A., Linan-Thompson, S., & Roberts, G. (2008). Intensifying instruction: Does additional instructional time make a difference for the most at-risk first graders? Journal of Learning Disabilities, 41(2), 115-125.
Hofman, R.H., Hofman, W.H.A., & Guldemond, H. (1999). Social and cognitive outcomes: A comparison of contexts of learning. School Effectiveness and School Improvement, 10(3), 352-366.
Hong, G., & Raudenbush, S.W. (2008). Causal inference for time-varying instructional treatments. Journal of Educational and Behavioral Statistics, 33(3), 333-362.
*House, J.D. (2005). Classroom Instruction and Science Achievement in Japan, Hong Kong, and Chinese Taipei: Results from the TIMSS 1999 Assessment. International Journal of Instructional Media, 32(3), 295.
*Hungi, N. (2008). Examining Differences in Mathematics and Reading Achievement among Grade 5 Pupils in Vietnam. Studies in Educational Evaluation, 34(3), 155-164.
*Hungi, N., & Postlethwaite, N.T. (2009). The Key Factors Affecting Grade 5 Achievement in Laos: Emerging Policy Issues. Educational Research for Policy and Practice, 8(3), 211-230.
Hungi, N., & Thuku, F.W. (2010). Variations in Reading Achievement across 14 Southern African School Systems: Which Factors Matter? International Review of Education, 56(1), 63-101
Iturre, R.A.C. (2005). The Relationship between School Composition, School Process and Mathematics Achievement in Secondary Education in Argentina. International Review of Education, 51(2-3), 173-200.
Jenner, E., & Jenner, L.W. (2007). Results from a first-year evaluation of academic impacts of an after-school program for at-risk students. Journal of Education for Students Placed at Risk, 12(2), 213-237.
Jong, R. de, Westerhof, K.J., & Kruiter, J.H. (2004). Empirical evidence of a comprehensive model of school effectiveness: A multilevel study in mathematics in the 1st year of junior general education in the Netherlands. School Effectiveness and School Improvement, 15(1), 3-31.
Kalender, I., & Berberoglu, G. (2009). An Assessment of Factors Related to Science Achievement of Turkish Students. International Journal of Science Education, 31(10), 1379-1394.

68
*Kitsantas, A., Cheema, J., & Ware, H. W. (2011). Mathematics Achievement: The Role of Homework and Self-Efficacy Beliefs. Journal of Advanced Academics, 22(2), 310-339.
*Kotte, D., Lietz, P., & Lopez, M. M. (2005). Factors Influencing Reading Achievement in Germany and Spain: Evidence from PISA 2000. International Education Journal, 6(1), 113-124.
*Kupermintz, H., Ennis, M. ., Hamilton, L.S., Talbert, J.E.,& Snow, R.E. (1995). Enhancing the validity and usefulness of large-scale educational assessments.1. Nels-88 mathematics achievement. American Educational Research Journal, 32(3), 525-554.
Kyriakides, L., Campbell, R. J., & Gagatsis, A. (2000). The significance of the classroom effect in primary schools: An application of Creemers' comprehensive model of educational effectiveness. School Effectiveness And School Improvement, 11(4), 501-529.
*Kyriakides, L., & Creemers, B. P. M. (2008). A longitudinal study on the stability over time of school and teacher effects on student outcomes. Oxford Review of Education, 34(5), 521-545.
Lavy, V. (2010). Do Differences in School's Instruction Time Explain International Achievement Gaps in Math, Science, and Reading? Evidence from Developed and Developing Countries. NBERWorking Paper No. 16227: National Bureau of Economic Research.
*Leseman, P.P.M., Sijsling, F.F., & Vries, E.M. de (1992). Zorgbreedte en instructiekenmeken: aanknopingspunten voor de preventie van functioneel analfabetisme in het LBO. Pedagogische Studiën, 69(5), 371-387.
Li, Y., Alfeld, C., Kennedy, R. P., & Putallaz, M. (2009). Effects of summer academic programs in middle school on high school test scores, course-taking, and college major. Journal of Advanced Academics, 20(3), 404-436.
Lin, Y-H., Chang, C-T. & Lin, H-F. (2007). Multilevel Analysis of PISA 2003 with Influence on Achievement from Education Index of Countries and Time Studying of Students. Paper presented at 6th WSEAS International Conference on Education and Educational Technology, Italy, November 21-23, 2007.
Liu, Y., Wu, A. D., & Zumbo, B. D. (2006). The Relation between Outside of School Factors and Mathematics Achievement: A Cross-Country Study among the U.S. and Five Top-Performing Asian Countries. Journal of Educational Research and Policy Studies, 6(1), 1-35.
Lockheed, M.E., & Komenan, A. (1989). Teaching quality and student achievement in Africa: the case of Nigeria and Swaziland. Teaching & Teacher Education, 5(2), 93-115.
Lockheed, M.E., & Longford, N. (1999). School effects on mathematics gain in Thailand. In S.W. Raudenbush & J.D. Willms (Eds.), Schools, classrooms and pupils: international studies from a multi-level perspective. San Diego, CA: Academic Press.
*Lubbers, M. J., Van der Werf, M. P. C., Kuyper, H., & Hendriks, A. A. J. (2010). Does homework behavior mediate the relation between personality and academic performance? Learning and Individual Differences, 20(3), 203-208.
Lubienski, S. T., Lubienski, C., & Crane, C. C. (2008). Achievement differences and school school climate, teacher certification, and instruction." American Journal of Education 115(1), 97-138.
Luyten, H., & Jong, R. de (1998). Parallel classes: Differences and similarities. Teacher effects and school effects in secondary schools. School Effectiveness and School Improvement, 9(4), 437-473.
Ma, X., & Crocker, R. (2007). Provincial effects on reading achievement. Alberta Journal of Educational Research, 53(1), 87-109.
69
Matsudaira, J.D. (2008). Mandatory summer school and student achievement. Journal of Econometrics, 142(2), 829-850.
McDonald Connor, C., Son, S-H., Hindman, A.H. & Morrison, F.J. (2005). Teacher qualifications, classroom practices, family characteristics, and preschool experience: Complex effects on first graders’ vocabulary and early reading outcomes. Journal of School Psychology, 43, 343–375.
Meijnen, G.W., Lagerweij, N.W., & Jong, P.F. (2003). Instruction characteristics and cognitive achievement of young children in elementary schools. School Effectiveness and School Improvement, 14(2), 159-187.
*Muijs, D., & Reynolds, D. (2000). School effectiveness and teacher effectiveness in mathematics: Some preliminary findings from the evaluation of the mathematics enhancement programme (primary). School Effectiveness and School Improvement, 11(3), 273-303.
Natriello, G., & McDill, E.L. (1986). Performance standards, student effort on homework and academic achievement. Sociology of Education, 59(1), 18-30.
*Pugh, G., & Telhaj, S. (2003, 17-20 September). Attainment effects of school enmeshment with external communities: Community policy, church/religious influence, and TIMSS-R mathematics scores in Flemish secondary schools. Paper presented at the European Conference on Educational Research, Hamburg.
Reezigt, G.J. (1993). Effecten van differentiatie op de basisschool. Groningen: RION. Reezigt, G.J., Guldemond, H. & Creemers, B.P.M. (1999). Empirical validity for a
comprehensive model on educational effectiveness. School effectiveness and school improvement, 10(2), 193-216.
*Rossmiller, R.A. (1986). School resources, home environment, and student achievement gains in grades 3-5. Paper presented at AERA, San Francisco, April 16-20, 1986. Madison: Wisconsin Center for Education Research.
Sabah, S. & Hammouri, H. (2010). Does Subject Matter Matter? Estimating the Impact of Instructional Practices and Resources on Student Achievement in Science and Mathematics: Findings from TIMSS 2007. Evaluation & Research in Education, 23(4), 287-299.
Schacter, J. & Jo, B. (2005). Learning when school is not in session: A reading summer day-camp intervention to improve the achievement of exiting First-Grade students who are economically disadvantaged. Journal of Research in Reading, 28(2), 158-169.
Smyth, E. (2008). The more, the better? Intensity of involvement in private tuition and examination performance. Educational Research and Evaluation, 14(5), 465-476.
*Taylor, B.M., Pearson, P.D., Peterson, D.S., & Rodriguez, M.C. (2003). Reading growth in high-poverty classrooms: The influence of teacher practices that encourage cognitive engagement in literacy learning. Elementary School Journal, 104(1), 3-28.
*Teodorović, J. (2011). Classroom and School Factors Related to Student Achievement: What Works for Students? School Effectiveness and School Improvement, 22(2), 215-236.
*Teodorović, J. (2012): Student background factors influencing student achievement in Serbia. Educational Studies, 38(1), 89-110.
Trautwein, U. (2007). The homework-achievement relation reconsidered: Differentiating homework time, homework frequency, and homework effort. Learning and Instruction, 17, 372–388.
*Trautwein, U., Koller, O., Schmitz, B., & Baumert, J. (2002). Do homework assignments enhance achievement? A multilevel analysis in 7th-grade mathematics. Contemporary Educational Psychology, 27(1), 26-50.

70
*Trautwein, U., Ludtke, O., Schnyder, I., & Niggli, A. (2006). Predicting homework effort: Support for a domain-specific, multilevel homework model. Journal of Educational Psychology, 98(2), 438-456.
*Trautwein, U., Schnyder, I., Niggli, A., Neumann, M., & Ludtke, O. (2009). Chameleon effects in homework research: The homework-achievement association depends on the measures used and the level of analysis chosen. Contemporary Educational Psychology, 34(1), 77-88.
Unal, H., Ozkan, E. M., Milton, S., Price, K., & Curva, F. (2010). The effect of private tutoring on performance in mathematics in Turkey: A comparison across occupational types. In H. Uzunboylu (Ed.), Innovation and Creativity in Education, Procedia –Social and Behavioral Sciences, 2(2), 5512-5517.
*Uguroglu, M., & Walberg, H.J. (1986). Predicting achievement and motivation. Journal of Research and Development in Education, 19(3), 1-12.
*Wagner, P., Schober, B., & Spiel, C. (2008). Time students spend working at home for school. Learning and Instruction, 18(4), 309-320.
Werf, M.P.C. van der (1994). School and instruction characteristics and pupils’ arithmetic achievements at the end of primary education. Tijdschrift voor Onderwijsresearch, 18(2), 26-38.
Werf, G. van der, Creemers, B. & Guldemond, H. (2001). Improving Parental Involvement in Primary Education in Indonesia: Implementation, Effects and Costs. School effectiveness and school improvement, 12(4), 447-466.
Werf, M.P.C van der & Weide, M.G. (1993). Effectieve voorrangskenmerken in de school en klas. Pedagogische Studiën, 70, 108-221.
*Won, S. J., & Han, S. (2010). Out-of-school activities and achievement among middle school students in the U.S. and South Korea. Journal of Advanced Academics, 21(4), 628-661.
Yu, G., & Thomas, S. M. (2008). Exploring School Effects across Southern and Eastern African School Systems and in Tanzania. Assessment in Education: Principles, Policy & Practice, 15(3), 283-305.
Zhu, Y. & Leung, F.K.S. (2012). Homework and mathematics achievement in Hong Kong: Evidence from the TIMSS 2003. International Journal of Science and Mathematics Education, 10(4), 907-925.

71
CHAPTER 4: RELEVANCE OF THE FINDINGS FOR EDUCATIONAL POLICY AND FUTURE RESEARCH
Jaap Scheerens In this concluding chapter the results will be summarized and discussed with respect to their policy relevance. For this last topic current educational policy in the Netherlands will be used as an exemplary case. Suggestions for future research will be offered in the final section. Recapitulation of the main results of this study The issue of productive time in education was addressed by studying effects of time on educational performance for three different applications: time during regular school hours, homework and extended learning time in out-of school programs. In the first chapter the results of a literature review were discussed, with a focus on earlier review studies and meta-analyses. From this synthesis of the review literature it was concluded that effective use of regular school time, homework and extra out-of-school time appears to have small to moderate positive effects on educational achievement in basic subjects, mathematics and reading. Based on simple averaging of the relevant meta-analyses the mean effect sizes (expressed as coefficient d) for these three “arena’s” for optimizing learning time are .37, .29 and. 18, respectively. It was noted that caution needs to be applied when interpreting these findings. Meta-analyses that have investigated the effects of regular school time usually throw together a range of different “treatments”, varying from increments in “statutory”, official school or teaching hours, to more efficient use of teaching time, time on task, and “quality time”. Moreover, in order to be effective it is obvious that time should be “filled” with relevant educational exposure, particularly in terms of content covered but also in term of effective teaching processes. In empirical studies these variables are not always controlled for, so that it may be assumed that “time” effects pick up some the effects of content covered and teaching quality. Studies on the effects of homework seem to underline this point. On the few occasions that pure time effects, in terms of frequency and duration of homework assignments, could be separated from content covered, it was the latter facet, indicated as “amount” of homework, which appeared to be the most important (De Jong et al., 2000). Of the three major strategies to manipulate time in education the third one, out-of-school learning is the most heterogeneous one. This is particularly the case because after school programs often have broader pedagogical and care-taking objectives than just enhancing student achievement. The cited meta-analyses reflect this heterogeneity, and it is therefore understandable that the average effect size is even more modest, as compared to the effects of time at school and homework., because in after school programs the available time will not be totally dedicated to enhancing cognitive achievement. A second reason to interpret the coefficients carefully has to do with methodological flaws in the original studies as well as the meta-analyses (Kane, 2004; Kohn, 2006; Trautwein et al., 2006; Canadian Council, 2009; Valentine et al., 2010; Redd et al., 2012). Kane (2004) argues that a reasonable expectation for the effect size of After School Programs, is low as between d= .05 and .07. Kohn provides a “taxonomy of abuses” in studies that have attempted to assess the effect of homework and concludes, after a thorough review of the literature, that there is virtually no evidence that unequivocally supports the expectation that homework has beneficial effects on academic achievement or on attitudes that would be supportive of

72
independent learning. Valentine et al. critically analyzed 12 meta-analyses on the effects of After School Programs, and lay bare great diversity in the methods applied in these meta-analyses, while concluding that the outcomes reported are divergent to an extent that they do not provide clear messages to policy makers on the potential effects of these programs. Similar cautions are expressed by Redd et al, when they conclude that After School programs can be effective. Still, also when compared to other educational effectiveness enhancing conditions, extra time should be seen as a lever to “increase well targeted exposure to content” and as such as part of a conglomerate of effectiveness enhancing variables. Of the three variations of time use discussed in the first chapter optimizing time at school and extended, out-of –school learning, are often associated with equity oriented policies to enhance the position of disadvantaged learners. This applies to a lesser extent to homework, for which disadvantaged learners might strongly depend on guided, structured and closely monitored homework. A final conclusion was that hardly any studies on the cost effectiveness of these three time-oriented strategies were found6. It would seem however, that the least effective strategy of the three, extended learning time and after school programs, is by far the most expensive one, and therefore also the least cost-effective strategy. In the second chapter results from international comparative studies that had looked into issues of time in education, were described and analyzed. Part of this material is relevant in describing between country difference in their investment in regular time at school, individual study and homework and extended learning time in out-of-school programs. The second major relevance of the material from international studies concerns results that looked into the association between time and student performance. Because of the focus of this report on time effectiveness we typically looked at information from internationally comparative assessment programs, such as TIMSS and PISA. Descriptive results from these studies provide a notion on how countries differ in total instruction time, at school, and out of school. Among OECD countries total instruction time for students aged 15, during regular school time, ranges from 794 hours in The Czech Republic to 1083 in Chili. The OECD average is 948 hours. The Netherlands is well above this average with 1000 hours. Results on the relative amount of time that is spent in regular lessons, out-of-school time lessons and individual study, e.g. homework are also available. When looking at the position of the Netherlands with respect to the total number of learning hours in the three PISA subject matter areas, it is striking that for science (less than four hours per week), mathematics, (about 5 hours per week) and language of instruction (about 5 hours per week) we are in the range of lowest scoring countries, that is countries that spent the least time on these subjects. Countries at the high end of the distribution spend about 9 hours on these subjects (OECD, 2011, 29). The Netherlands is below the OECD average in all subjects: science 3.90 versus 5.04; mathematics, 5.02 versus 6.59 and language 4.89 versus 6.28. When looking at the sum total of weekly hours of instruction in these three subject matter areas, the total for the Netherland is 13.82, while the OECD average is 17.90 hours. Given the fact that the Netherlands scores way above the OECD average on the whole of the school curriculum in the total of intended instruction hours per year (in 2020, 1000 hours as compared to an OECD average of 948), these comparisons would suggest that, at least at the level of 15 year old students, the Netherlands, as compared to other countries, spends less time on basic 6 A “partial” exception is the study of the CPB (2011), in which the monetary benefits of expanded learning time for disadvantaged students are calculated.

73
subjects, as compared to “other subjects”. These figures are confirmed in the report on PISA 2009, (OECD, 2010). Data on the degree to which countries have changed total intended instruction time between 2000 and 2008, indicates that about as many countries diminished or expanded time. The Netherlands went down from 1067 to 1000 hours in this period. The following results were seen in international studies that correlated time indicators with achievement in mathematics, reading or science.
- Baker et al., 2004, report non-significant correlations at country level between regular teaching time in mathematics, science and reading in secondary analyses of TIMSS and PIRLS. Moreover, these authors found that, at country level, positive, negative and non-significant relationships were about equally divided across countries;
- Baker and LeTendre (2005) found negative correlations between amount of homework and achievement in mathematics (TIMSS, 1999) achievement;
- Scheerens et al. (2012) report negative correlations between total intended instruction time at national level and country average achievement in reading, in 2000 and 2009, based on PISA data; these authors also computed the correlation between change in intended instruction time and change in student reading achievement between 2000 and 2009; and found a non-significant negative correlation of .25
- OECD (2011) reports positive correlations, computed at between country level, between time spent in regular lessons in science, mathematics and test language and the respective student achievement results (.25., .50 and .50), respectively; all associations for time spent on out-of-school lessons and individual study were negative.
When the association of time and achievement was studied by means of multi-level structural equation modeling applied to the PISA 2009 data set, very small negative associations were found in a study by Scheerens et al. (2012). What do these results based on internationally comparative studies add to the research results, based on the educational research literature, which were summarized in Chapter 1? First of all, the descriptive information shows that countries tend to use time as a malleable variable, as some countries induced sizeable changes in total intended instruction time, however, since increasing time occurred about as frequent as diminishing time, it is doubtful whether these changes are directly targeted at enhancing student achievement. Secondly, international studies frequently report negative correlations, particularly at the between country level. In some cases the negative correlation might be attributed to the operational definition of time that was used in the study. For example, in the study by Scheerens et al. (2012), nationally defined total intended instruction time was used while in the study by OECD (2011), time per subject, measured at school level was studied. It is not improbably that the more distal “intended” instruction time will show weaker association with achievement in a particular subject than the more proximal time per subject indicator. Also, subject matter area could make a difference. When comparing results from PISA 2006 and PISA 2009, for the main subject matter area in these two waves of PISA, science and reading literacy, regular school time was positively correlated with the science results in 2006 and negatively with reading literacy in 2009 (OECD, 2007, 263; OECD, 2010, p. 51). Thirdly, considering again negative associations between regular time at school and student achievement, these results seem to be at odds with common sense, and also, to some extent, with the overriding pattern of results from meta-analyses, research studies and program evaluations reviewed in Chapter 1 (despite severe methodological criticisms concerning the

74
way these results were established). Analyses on these international data sets are prone to even more basic methodological criticism than the earlier reviewed research studies. Most results were obtained by means of cross-sectional analysis. This means that, among others, it is hard to rule out “reversed causation”. In the case at hand this would mean that low achieving schools or educational systems, would try to improve by extending learning time. Negative associations might result even if expanded time might do some good, but not sufficient to counter more powerful conditions of low achievement. The approach to measure change over time, at system level and correlate with country level change of achievement, is seen as one of the possible remedies to rule out reversed causation, as is multilevel structural equation modeling. Both methods were applied in the study by Scheerens et al., and the result was that the associations remained negative. Fourth and finally, a striking outcome of the study by OECD (2011) was the consistent negative association of out-of school lessons as well as individual study (homework) and achievement. Other results from the same study make it plausible that countries with generally less favorable educational conditions made more use of out-of school lessons and individual study, than countries with better conditions. All in all it should be concluded that the results from international comparative studies concerning the association of time with educational achievement should be interpreted with a lot of caution. Negative associations of facets of time and student achievement at country level could mean that the causal direction is reversed, in the sense that more investment in time happens as a reaction to low performance rather than as a cause of higher performance. The finding that negative associations persisted in the secondary analyses of the PISA 2009 data-set, when change in time investment was related to change in performance between countries indicates that this phenomenon is not just an artifact of cross-sectional research design, but a matter of reactive policy (more time investment when achievement results are low) which compensates insufficiently for more important sources of low achievement, such as low SES composition. In the third chapter the results of a new meta-analysis on effects of time during regular school hours, homework and extended learning time was carried out. As a matter of fact separate meta-analyses were carried out for each of these strategies. For all three variables so called vote-counting of significant and non-significant results was carried out. After a careful process of selection the following numbers of studies and effect estimates7 remained; separate analyses were carried out for homework measured at individual and at class/school level (see Table 4.1): Table 4.1: Number of studies and estimates used in the vote count analysis Number of studies Number of estimatesTime 31 128 Homework student level 26 130 Homework class/school level 26 128 Extended learning time 15 59 The results of the vote-counting analyses are summarized in Table 4.2
7 Most studies contained information on the basis of which more than one effect size could be calculated, for example time associated with language and mathematics performance. In the text and tables these are indicated as “estimates”.
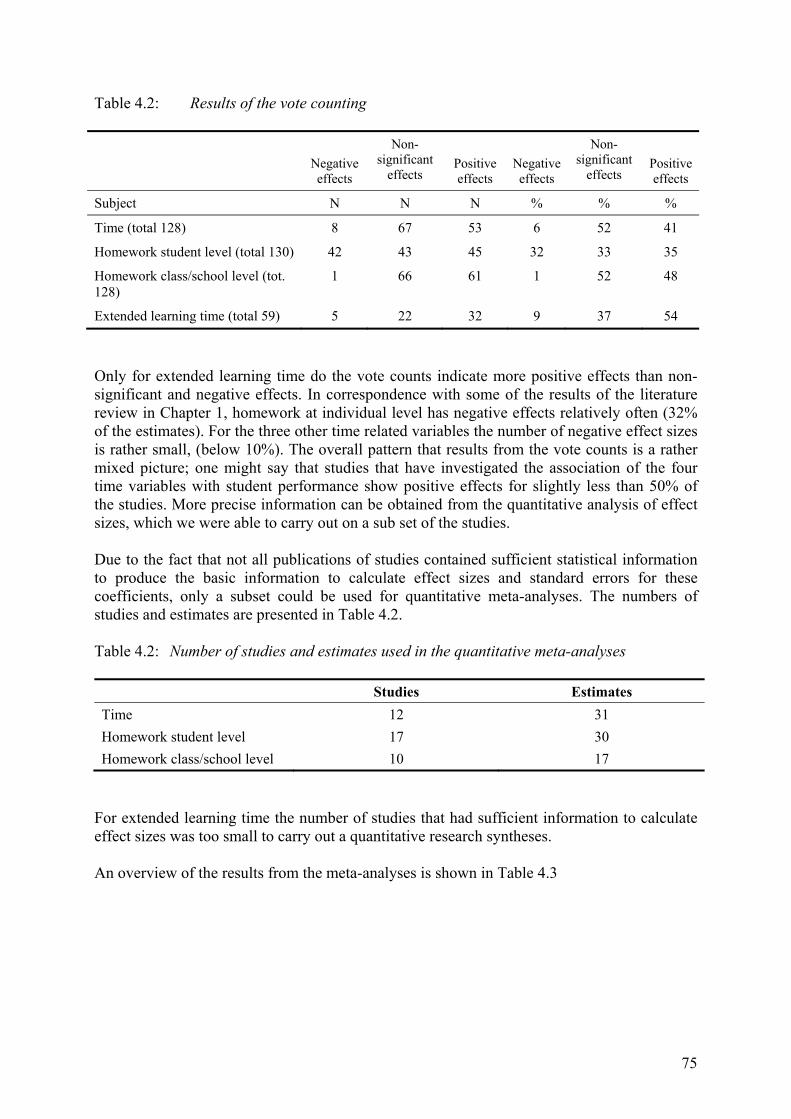
75
Table 4.2: Results of the vote counting
Negative effects
Non-significant
effects
Positive effects
Negative effects
Non-significant
effects
Positive effects
Subject N N N % % %
Time (total 128) 8 67 53 6 52 41
Homework student level (total 130) 42 43 45 32 33 35
Homework class/school level (tot. 128)
1 66 61 1 52 48
Extended learning time (total 59) 5 22 32 9 37 54
Only for extended learning time do the vote counts indicate more positive effects than non-significant and negative effects. In correspondence with some of the results of the literature review in Chapter 1, homework at individual level has negative effects relatively often (32% of the estimates). For the three other time related variables the number of negative effect sizes is rather small, (below 10%). The overall pattern that results from the vote counts is a rather mixed picture; one might say that studies that have investigated the association of the four time variables with student performance show positive effects for slightly less than 50% of the studies. More precise information can be obtained from the quantitative analysis of effect sizes, which we were able to carry out on a sub set of the studies. Due to the fact that not all publications of studies contained sufficient statistical information to produce the basic information to calculate effect sizes and standard errors for these coefficients, only a subset could be used for quantitative meta-analyses. The numbers of studies and estimates are presented in Table 4.2. Table 4.2: Number of studies and estimates used in the quantitative meta-analyses Studies Estimates
Time 12 31
Homework student level 17 30
Homework class/school level 10 17
For extended learning time the number of studies that had sufficient information to calculate effect sizes was too small to carry out a quantitative research syntheses. An overview of the results from the meta-analyses is shown in Table 4.3

76
Table 4.3: Results of the quantitative meta-analyses; effect sizes are Fisher z coefficients Time category Effect SizeOverall effect .0464 (.0184)b
Allocated time .0168(.0096)
Instruction time .0488 (.0168. + .0320) (.0117)b Time on task .1101 (.0168 + .0933) (.0712) Homework student levelcategory Effect SizeOverall effect .0443 (.0217)b
Time .0408 (.0277)
Amount .0911 (.0408 +.0503)(.0376)
Frequency .0248 (.0408 -.0160) (.0384)
Homework at class/school level category Effect SizeOverall effect 0581(.0143)b
Time .0093 (.0140)
Amount .0741 (.0093 + .0648) (.0457) Frequency .0671 (.0093 +.0578) (.0208)b
b Significant effect (α < .05 or α < .01 in a one-tailed test) Of the 12 effect sizes only 5 are significant. All three overall effects reach statistical significance. The magnitude of the effects is small, not to say very small. The fact that some of the sub categories, most notably amount of homework, remain non-significant has to do with the small number of estimates for these sub-categories. When we want to compare our results with the overall picture that arises from the review of earlier meta-analyses on time and homework, described in Chapter 1, we might do this in a rather rough way by pooling our separate results for homework measured at individual and school/class level, and using an average effect size for the two of .05. The estimates for the other meta-analyses are obtained from Tables 1.1. and 1.2, and involve a rough conversion from d to r, by treating the former as twice as large as the latter. This results in the overview of average findings in Table 4.4. Table 4.4: Comparison of average effect sizes (in terms of correlations) between earlier
and our current meta-analyses Other meta-analyses Meta-analyses presented in this
study
Learning time .18 .05
Homework .15 .05
It is not easy to find an explanation for these differences, and the very small effect sizes that we found. One tentative direction of explanation might be that the updated selection of studies are of higher research technical quality than earlier studies. Methodological analysts like Kohn (2006) - referring to homework effects - confirm that, when high methodological
77
standards are applied, effect sizes become very small indeed. A second line of reasoning is supported by findings of strong reduction in effect sizes when indicators on content covered and instructional quality are “controlled for” e.g. Trautwein (2007). Results from a study by Van Ewijk and Sleegers, (2010) support this notion. These authors compared educational effectiveness studies in which only one focal independent variable was used (in their case the socio economic status of the students, SES) to studies where a range of variables was included next to the focal variable. The effect size for SES appeared to be significantly smaller in the second case, namely when a range of other independent variables was included. Some evidence from our own results points in the same direction. In the vote count analyses on time at school we found a sizably higher percentage of positive effects for studies that had included only time and no other process variables at school and class level in the model specification. When considering the sub set of studies that was used for the quantitative meta-analyses, however, there appeared to be only 4 studies that had included just time and no other independent variables. This is too little information to follow up our conjecture of higher effect sizes for these studies by means of quantitative analyses. Moreover, inspection of the results presented in table A9 in the annex shows that the effect estimates for these four studies were exceptionally low in three cases and around the average (.05) shown in table 4.4 for the fourth study; which is not supportive of our interpretation. With respect to extended learning time, we had insufficient information to carry out quantitative meta-analyses. The vote-count results show a mixed picture, with about as many positive as negative and non-significant effects taken together. For extended learning time, earlier meta-analyses indicated an average effect size of r = .09, which, according to scientific convention is a small effect. Relevance for educational policy; the case of quality oriented policy in the Netherlands Educational policy with respect to time, will be discussed, by referring to three issues:
- the report on educational time to the Minister of Education by an expert committee (2008);
- legal possibilities for schools with a high proportion of disadvantaged students to extend time at school;
- developments with respect to the concept of “broad schools”, in which students spend additional time at school, on a daily basis.
Report on Education Time in Secondary Schools The committee Cornielje stated three main conclusions:
1) Schools are responsible to offer a challenging educational program, and answer to parents about the quality of time at school.
2) In secondary education the national norm for instructional time is put at 1000 hours (used to be 1067 hours).
3) A more balanced annual calendar is proposed, where the summer holidays are diminished from 7 to 6 weeks.
The strong message from the committee is that time is an empty vessel and that it is just a condition to offer high quality education. The report sketches the way schools are horizontally accountable to parents, and vertically to the Inspectorate, which monitors schools in abiding to the 1000 hours norm. The committee considered international data on statutory instruction time and concluded that the Dutch norm is above average. At the same time they concluded

78
that international comparative results do not indicate a relationship between statutory instruction time and student achievement. The motivation to reduce the norm to 1000 hours was therefore based on administrative and financial considerations, not so much substantive educational ones. The results on time effects in this report are in line with the considerations of the committee, in the sense that the notion that the effectiveness of extra time depends on targeted exposure to content and the quality of teaching processes. Results from international assessment studies discussed in this report, support that statutory instruction time does not come out as a consistently positive correlate of educational achievement. Time as a priority area in the Quality Agendas for primary and secondary education, and in the Inspection frameworks In the Dutch situation, educational quality as perceived by the Ministry of Education can be inferred from recent policy documents that have appeared under the heading “Quality Agendas”. Quality Agendas have appeared for primary, secondary general and secondary vocational education, resp. Ministry of Education (2007, 2007a and 2007b).
The Quality Agenda for Primary Education is strongly focused on the improvement of student achievement in (Dutch) language and arithmetic. Although Dutch students tend to do rather well on international comparative assessments, they are still expected to improve. Establishing performance standards in the domains of language and arithmetic is the first objective of the Quality Agenda. The percentage of students that perform below their potential, which is estimated at about 10%, should be reduced by 40%, while the percentage of schools that are judged as “weak” by the inspectorate should be reduced by 50%. Average achievement is expected to go up and the proportion of students scoring in the top segment of the distribution on international assessment tests should increase. Finally, by 2011 80% of the schools should have an appropriate and well-functioning quality review system in place.
The following measures are proposed and financially supported: - effective use of official school time - stimulating an achievement-oriented school culture - use of pupil monitoring systems - application of evidence based programmes to improve education, particularly in
schools with a disadvantaged student population - creation of “rich” learning environments - stimulation of parent participation - dissemination of good teaching practices - freedom and autonomy of school in carrying through their improvement efforts - professional development of teachers and school networking - higher standards for knowledge of arithmetic in Teacher Training Colleges
The quality agenda for secondary education contains ten basic premises, six policy priorities and three types of conditions. The six policy priorities are:
- arithmetic and language, higher achievement on international tests as main goal and better use of tests as one of the means;
- excellence at all levels, better attainment indicators in the sense of reduced early school leaving and innovation and career guidance of students as some of the means;
- citizenship, as a school subject, to be stimulated by societal stages; - professional space for teachers, emphasis on teacher ownership and a new focus on
content and the primary teaching task of teachers;

79
- good and reliable examinations; - an improvement-oriented culture, among other things stimulated by good school
leadership, with concrete targets referring to a lowered proportion of weak schools (as established by the inspectorate) and more widespread use of sound internal quality care systems (75% of schools in 2012).
As conditions for realizing these policy priorities, the Quality Agenda mentions the human scale of schools, the school as a professional organization, appropriate use of official school time and a considerably larger budget. The existing high levels of autonomy in Dutch secondary education, as far as schools and teachers are concerned, are considered as optimal for realizing the quality agenda (page 9).
The supervision frameworks used by the Inspectorate of Education include time as a main facet of educational quality. The indicators that are used in the secondary school framework are as follows:
Quality aspect 4: The students receive sufficient time to master the subject matter 4.1 The intended teaching time corresponds to the legal norms. 4.2 The structural (i.e., planned) amount of lessons “not given” is minimal. 4.3 The incidental amount of lessons “not given” is limited. 4.4 Non-permitted absence of students is limited. 4.5 The teachers use the intended teaching time in an efficient way. 4.6 The school varies the amount of time for teaching and learning relative to the
educational needs of the students. It is obvious from these policy documents that time and the monitoring of effective teaching time is taken seriously in Dutch education. The Quality Agendas were also followed up by legislation, which allows schools with a large proportion of disadvantaged students to expand teaching time (CFI, 2009). Schools which cooperate with other schools and a school advisory service are funded to start experiments aimed at prolonging teaching time, through extended school days, school weeks or summer schools. External evaluation of these experiments are in the process of being conducted (Oberon, 2009; Driessen et al., 2010) but results are not available as yet.
Expanded learning time, specifically dedicated to disadvantaged learners, would benefit from a structured and focused approach, in line with evidence obtained in educational effectiveness research. According to the predominant approach in the Netherlands, school improvement has to occur, following a bottom up approach. It is questionable whether state of the art research based knowledge is sufficiently used in the programs developed by schools. Moreover, policy implementation occurs in small networks of schools, without any coordination between them. This is considered as an approach with dubious effectiveness, high costs and (consequently) low efficiency.
On one issue the international comparative evidence shows results that speak to the policy aim to improve results in arithmetic/mathematics, language and science. Despite the fact that the Netherlands has above average total instruction time, the time spent on these basic subjects is below average. In principle it might therefore be considered to increase instruction time in these basic subjects at the costs of “other” subjects. The results in this report would

80
support the expectation of a small positive effect of such measures. A recent study by Diris (2012), shows that increase in allocated learning time for language, as a results of a language stimulation program in Dutch primary education, has a small positive effect (1 week instruction time is associated with 0.02 standard deviation gain in language achievement). Interestingly even somewhat higher “spill over” effects were found for verbal IQ and achievement in mathematics and environmental studies. These research findings and the findings presented in this study introduce some new elements to the ongoing debate in the Netherlands about investment in basic subjects, as compared to other subjects and ongoing demands of society that schools do something about issues like health education, social behavior and technology training. In summary these are: in comparison with other countries there appears to be room for more time allocated to language, arithmetic/mathematics and science (without expanding the total instruction time). Small positive effects on performance are to be expected for these subjects, but perhaps also as “spill over” effects on other subjects. Broad schools Broad schools combine education and care taking of children outside school hours, for special care and development activities, as well as cultural and sports activities. (Web-site Ministry of Education). The founding and programming of broad schools depends to a large degree on Municipalities, schools and local social and welfare organizations. Broad schools are particularly created in primary education, but there are broad secondary schools as well. Schools and municipalities decide on the programs and activities offered. In broad secondary schools homework support may be one of the activities. Currently about 20% of primary schools are broad schools (Driessen et al., 2010). Oberon (2009) and Driessen et al. (2010) provide examples of local initiatives of extended school time in the Netherlands, often associated with broad schools, and often specifically targeted to disadvantaged students. The recently approved arrangements of “Fitting education”, Dutch “Passend onderwijs” facilitate and financially support the possibilities of schools to extend learning time for disadvantaged students and students with specific handicaps. It appears that the experiences with After School Programs and extended learning time in the USA, documented in Chapter 1, are quite relevant to these fairly recent developments in the Netherlands. The small scale of local developments does not simplify the already difficult task of assessing the effects of these programs. As applies to many of the US examples the mission of broad schools is not limited to enhancing student achievement. Seen from the more specific objectives of stimulating achievement in the basic subjects, formulated in the Quality Agendas of the Ministry of Education no overall positive expectations of effectiveness are warranted. There is no trace of evidence based programming of these extended learning time arrangements, as such policies are difficult to reconcile with the philosophy of local bottom up development. Again the cost effectiveness of these developments seems to form a totally blind spot in educational policy making in the Netherlands; despite the high costs, which may be partly due to a higher turnover of building facilities. Scientific relevance, suggestions for further research
Trying to make sense of the research evidence on the effects of time on educational performance as we have done in this study, at times looks more like creating confusion rather than finding clear answers. Differences in effect sizes found across individual research studies and meta-analyses are huge. And what should we make of occasional negative associations? A simple solution would be to follow the law of large numbers, throw everything together,

81
and assume that the average would be about right. When we follow this approach, earlier studies indicate a small, but, “educationally significant” positive effect of learning time at school and homework on educational performance. Judgments on “educational significance” can be made, for example, on the basis of a comparison with the size of the effect of one year of schooling in a certain subject matter area (Scheerens et al., 2007). So far so good, but then we are confronted with the results of our own meta-analyses, which show very small effects. Strictly following the law of large numbers, our meta-analyses are just a drop in the pond, and given the relatively low number of studies that we could analyze should not offset the overall conclusion of a small, but educationally significant, positive effect. Still these findings create some cognitive dissonance. The straightforward scientific solution to settle the issue would be to replicate some of the other meta-analyses, preferably those that found much larger effects. Such replications could provide indications on possible explanations like different selection criteria for studies, issues of publication bias, and differences in the methods of meta-analyses. For some reason or other nobody ever seems to have time (and money) to carry out such replications. Another scientific solution would be to have methodological review and critique carried out at a much larger scale. The sparse critical reviews of this kind that we have cited (e.g. the studies by Kane, Kohn and Allison) appear to go in the direction of confirming very low to negligible effects of time and homework, like we found in our meta-analyses. Some puzzling issues that we were confronted with would be in need of further analyses and perhaps also further empirical research:
- the frequent negative effects of time on student performance when data at the national system level are used (and why other studies, like OECD (2011) come up with relatively large positive associations);
- how to explain the frequent negative associations of homework when these effects depend on student level measures of time and frequency of homework
- the subject matter dependency of time effects in international studies (e.g. positive associations in PISA 2003 and 2006, and negative associations in PISA 2009)
- the unsettled issue of the effect of time, when other relevant effectiveness enhancing conditions of schooling and teaching are analyzed simultaneously.
An alternative to the application of the law of large numbers would be to concentrate on methodologically flawless studies, or at least studies that approach this ideal. Perhaps three good quality studies say more than the average of one thousands weak studies. In the studies that we reviewed two Dutch studies, the ones by De Jong et al. (2000) and the one by Diris (2012) would definitely qualify as good studies. Still there is likely to be some debate on what qualifies as a good study. After having carried out a quasi-experimental study, with sophisticated control for confounding variables, Diris (ibid) recommends future use of true experimental studies. Yet, in the case of a variable like time it is very hard to define it as a “pure” treatment, since adding time will only be effective if time is spent on covering the right content and good quality teaching. The way the content of time in education is taken care of in research studies on the effect of time is a key issue. Since it may be hard to standardize content in experiments on time, a causal modeling approach where the content and teaching variables are actually measured and analyzed simultaneously with time might be superior to a true experiment. Last but not least, results like the ones presented in this study provide food for thought on the research field of educational effectiveness. My personal impression, based on recent studies and empirical research is that currently predominant assumptions on “what works” are being

82
confirmed as far as the identification of variables that matter is concerned, but that effect sizes are much smaller than reported in popular publications (like: Hattie, 2009, McKinsey, 2010, OECD, 2010a); Scheerens, (2012). Discovering the truth in this is certainly a matter of further empirical research, but theoretical reflection is needed as well (Scheerens, 2013). References
Baker, D.P., & Le Tendre, G.K. (2005). National Differences, Global Similarities. Stanford, CA: Stanford University Press.
Canadian Council on Learning (2009).A systematic review of literature examining the impact of homework on academic achievement. Retrieved May 20, 2011, from: http://www.ccl-cca.ca/pdfs/SystematicReviews/SystematicReview_HomeworkApril27-2009.pdf
Ministerie van OCW (2007). Krachtig meesterschap. Kwaliteitsagenda voor het opleiden van leraren 2008-2011.Den Haag: Ministerie OCW.
Ministerie van OCW (2007). Tekenen voor Kwaliteit. Kwaliteitsagenda Voortgezet Onderwijs. Den Haag: Ministerie OCW.
Ministerie van OCW (2007). Scholen voor morgen. Kwaliteitsagenda PO. Den Haag: Ministerie OCW.
CPB (2011). Onderwijsbeleid in Nederland. De financiering van effecten. (Van Elk, R., Lanser, D., & Veldhuizen, R.) CPB Achtergronddocument. Den Haag: CPB.
De Jong, R., Westerhof, K.J., & Creemers, B.P.M. (2000). Homework and student math achievement in junior high schools. Educational Research and Evaluation, 6(2), 130-157.
Diris, R. (2012). The economics of the school curriculum. Dissertation. Maastricht: Universitaire Pers.
Driessen, G., Claassen, A. & Smit, F. (2010). Variatie in schooltijden. Een internationale literatuurstudie naar de effecten van verschillende invullingen van de schooldag, de schoolweek en het schooljaar. Nijmegen: ITS.
Hattie, J. (2009). Visible Learning. Abingdon: Routledge. Kane, T.J. (2004) The impact of after-school programs: Interpreting the results of four recent
evaluations. Working paper. New York: WT Grant Foundation Kohn, A. (2006). Abusing research: The study of homework and other examples. Phi Delta
Kappan, 88(1), 8-22. McKinsey (2010) How the World’s Most Improved School Systems Keep Getting Better.
London: McKinsey. Ministerie van OCW (2007). Krachtig meesterschap. Kwaliteitsagenda voor het opleiden van leraren
2008-2011. Den Haag: Ministerie OCW. Ministerie van OCW (2007a). Tekenen voor Kwaliteit. Kwaliteitsagenda Voortgezet Onderwijs. Den
Haag: Ministerie OCW. Ministerie van OCW (2007b). Scholen voor morgen. Kwaliteitsagenda PO. Den Haag: Ministerie
OCW.
Oberon (2009). Een oriëntatie naar verlengde onderwijstijd. Inrichting en effecten. Utrecht: Oberon.
OECD (2007). Education at a Glance. OECD Indicators. Paris: OECD Publishing. OECD (2010). PISA 2009 Results Volume I, What Students Know and Can Do: Student
Performance in Reading, Mathematics and Science. Paris: OECD Publishing. OECD (2010a). The high costs of low performance. Paris: OECD Publishing.

83
OECD (2011). Quality Time for Students: Learning In and Out of School. Paris: OECD Publishing.
Redd, Z., Boccanfuso, Ch., Walker, K., Princiotta, D., Knewstub, D. & Moore, K. (2012). Expanded time for learning both inside and outside the classroom; A review of the evidence base. Retrieved on September, 17, 2012 from http://www.childtrends.org/Files/Child_Trends-2012_08_16_RB_TimeForLearning.pdf
Scheerens, J. (2012) The ripples and waves of educational effectiveness research. School Leadership & Management. http://dx.doi.org/10.1080/13632434.2012.724674
Scheerens, J., Glas, C.W., Jehangir, K., Luyten, H. & Steen, R. (2012). System Level Correlates of Educational Performance. Thematic Report based on PISA 2009 data. Enschede: University of Twente, Department of Educational Organisation and Management.
Scheerens, J. (2013) Theories on educational effectiveness and ineffectiveness. Submitted manuscript, based on key note address at the EARLI SIG conference on Educational Effectiveness, Zuerich, 29 -31 August, 2012.
Trautwein, U., Ludtke, O., Schnyder, I., & Niggli, A. (2006). Predicting homework effort: Support for a domain-specific, multilevel homework model. Journal of Educational Psychology, 98(2), 438-456.
Valentine, J.C., Cooper, H., Patall, E.A., Tyson, B.& Robinson, J.C. (2010). A method for evaluating research syntheses: The quality, conclusions, and consensus of 12 syntheses of the effects of after-school programs. Research Synthesis Methods, 1, 20-38.

84

85
SUMMARY IN DUTCH; NEDERLANDSE SAMENVATTING Jaap Scheerens PRODUKTIEVE ONDERWIJSTIJD Achtergrond en opzet van het onderzoek Onderwijstijd is in principe een van de eenvoudigste door beleid te manipuleren variabelen. Iedereen begrijpt waar het om gaat. De meest voor de hand liggende reden om iets te veranderen aan de onderwijstijd, is om daarmee de kwaliteit van het onderwijs te borgen of zelfs te verbeteren. De gedachte dat goed onderwijs onder meer afhangt van voldoende tijd van “blootstelling” van leerlingen aan onderwijs is eveneens helder en waarschijnlijk. Toch moeten er direct enkele kanttekeningen geplaatst worden, wanneer de aandacht gericht wordt op de effecten van onderwijstijd op leerresultaten. In de eerste plaats kan onderwijstijd bruto en netto gedefinieerd worden. De officiële verplichte onderwijstijd per schoolvak in een bepaald land is een bruto indicatie. Wat autonome scholen en leerkrachten daarvan overlaten of er aan toevoegen is een indicator die al dichter komt bij de daadwerkelijke “exposure” die leerlingen krijgen. De uiteindelijke netto onderwijstijd kan worden uitgedrukt als het percentage dat van een lesuur overblijft na aftrek van de tijd die de leerkracht nodig heeft om de klas te organiseren en om orde te houden. Zo schatten Stallings en Mohlman (1981), dit laatste percentage (de tijd besteed aan organisatie en klassenmanagement dus) op 15% en Lam, op basis van onderzoek in het Nederlandse basisonderwijs op 7%. Tenslotte kan men dan als tussenschakel tussen netto onderwijstijd en leerprestaties de effectieve leertijd van leerlingen bepalen, namelijk als het percentage taakgericht gedrag van leerlingen tijdens de les (time on task). Vanaf 2006 is in Nederland sprake van een verscherpte handhaving van de minimum urennorm door de Inspectie van het Onderwijs. Sindsdien is in 2011 de niet geprogrammeerde en niet gerealiseerde onderwijstijd in het voortgezet onderwijs en het middelbaar beroepsonderwijs teruggebracht van ongeveer 20% tot 10% (Inspectie van het Onderwijs, 2011). In de tweede plaats is er, naast discussies over optimalisering van de reguliere onderwijstijd, het thema van de extra leertijd, binnen of buiten de school. De daadwerkelijke onderwijstijd neemt toe wanneer men er buitenschools onderwijs en huiswerkbegeleiding aan toevoegt; dit verschijnsel neemt in sommige, vooral Aziatische landen, hoge proporties aan, maar ook in de Verenigde Staten en Engeland zijn er al vele jaren projecten gericht op ‘expanded learning time’ (Oberon, 2009; Driessen, Claassen & Smit, 2010). Ook in Nederland is het verschijnsel van de verlengde onderwijstijd zeer actueel en kent diverse vormen zoals studiebegeleiding, bijspijkerkampen, huiswerkklassen, schakelklassen, leerkansenprofielschool, weekendschool, zomerschool, twee jaar in een, en de verlengde schooldag (vergelijk bijv. Onderwijsraad, 2010; Oberon, 2009). Uiteraard is de verwachting dat buitenschools onderwijs en ook huiswerk de effectieve leertijd zullen verhogen. Een derde thema dat de eenvoudige verwachting dat meer officiële leertijd de leertijd de leerprestaties verhoogt nuanceert is de aanname dat onderwijstijd een verminderde meeropbrengst heeft, zodat het zeker geen simpele kwestie is van hoe meer hoe beter. Last but not least biedt verhoging van de onderwijstijd op zichzelf geen garantie voor betere leerresultaten; daar is meer kans op wanneer de onderwijstijd gevuld wordt met kwalitatief goed onderwijs. Deze gedachte staat ook centraal in het rapport van de in 2008 ingestelde Commissie Onderwijstijd. De aanbevelingen van deze Commissie hebben geleid tot

86
wijzigingsvoorstellen in de Wet op het voortgezet onderwijs en de wet Medezeggenschap scholen (Ministerie van Onderwijs, Cultuur en Wetenschap, 2011). In de nieuwe wet wordt de hoeveelheid tijd als slechts één van de dimensies van onderwijskwaliteit gezien en wordt onderwijstijd gedefinieerd als “het hele brede scala van leerlingenactiviteiten onder de pedagogisch-didactische verantwoordelijkheid van daartoe bekwaam (onderwijs)personeel, die deel uitmaken van het door de school geplande en voor de leerlingen verplichte onderwijsprogramma” (Ministerie van Onderwijs, Cultuur en Wetenschap, 2011, p.4). In de causale keten onderwijstijd- effectieve leertijd- leerprestaties fungeren condities van kwalitatief goed onderwijs, zoals een goede keuze, opbouw en structurering van de leerstof, als booster. Ook zou men kunnen zeggen dat er trade-offs zijn tussen kwaliteit en benodigde onderwijstijd. De prestatie die Finland al jaren laat zien in het behalen van hoge scores op internationale assessments, krijgt misschien nog meer reliëf, wanneer in aanmerking genomen wordt dat Finland in het voortgezet onderwijs een tamelijk gering verplicht aantal jaarlijkse lesuren heeft (in de orde van 680, waar men in Nederland op 1000 zit). Men zou kunnen zeggen dat de kwaliteit van het onderwijs in Finland zo hoog is, dat men met minder tijd toekan. Terloops kan worden opgemerkt dat hier ook de kosteneffectiviteit of productiviteit van het onderwijs in het geding zou kunnen zijn, ook al worden leraren doorgaans niet per uur betaald. Nog meer voorwaardelijkheid of trade-offs komen aan het licht wanneer effectieve leertijd in verband wordt gebracht met de capaciteit en motivatie van leerlingen. Het eerste integrale model van effectief onderwijs, het Carroll model, ziet effectieve leertijd als een functie van onderwijstijd (opportunity), aptitude (gedefinieerd als de tijd die een leerling nodig heeft om een taak uit te voeren), motivatie van de leerlingen, capaciteit van de leerlingen om de instructie te begrijpen, en kwaliteit van het onderwijs (Carroll, 1963, 1989). Het Carroll model ligt aan de basis van bekende instructie modellen, als Mastery Learning en Direct Instruction, en vormde tevens de kern van meerniveau modellen van onderwijseffectiviteit, zoals ontwikkeld door Scheerens (1992), Creemers (1994) en Stringfield en Slavin (1992). In het oorspronkelijke model was de variabele “kwaliteit ” het minst uitgewerkt. Invullingen die hier later aan zijn gegeven lagen op het terrein van goede leerstofkeuze (opportunity to learn in de betekenis van een goede passing van onderwezen en getoetste of geëxamineerde inhouden), duidelijke uitleg en een gestructureerde aanpak (vgl. Walberg, 1984; Rosenshine, 1983; Bloom, 1968). Voor deze overzichtstudie, die als accent kiest om leertijd in verband met onderwijsuitkomsten te behandelen, waren de volgende vragen leidend: a) Hoe verhoudt de formele, wettelijk voorgeschreven onderwijstijd in Nederland zich tot
die in andere landen en zijn er op dit niveau uitspraken te doen over de relatie tussen formele onderwijstijd en leerprestaties? Hoe ligt dit voor wat betreft verlengde onderwijstijd?
b) Wat is de gemiddelde effectgrootte van (eventueel verschillende invullingen van) onderwijstijd blijkend uit meta-analyses en hoe verhoudt deze zich tot de effecten van andere door beleid of schoolmanagement te beïnvloeden onderwijscondities, zoals “opportunity to learn”, een gestructureerde onderwijsaanpak, school- en klassengrootte?
c) In hoeverre is sprake van interactie bij het effect van onderwijstijd gemeten op verschillend aggregatie niveau met achtergrondvariabelen op school- en leerlingniveau en hoe wordt het effect van onderwijstijd versterkt of verzwakt door andere variabelen (zoals “opportunity to learn” die de kwaliteit van het onderwijs mede bepalen?

87
Werkwijze en fasering Om deze drie hoofdvraagstellingen te beantwoorden zijn drie werkwijzen toegepast. Ad a) Literatuurstudie en analyse van onderwijsstatistiek en internationale bestanden. De literatuurstudie is meer gericht worden op het samenvatten van review studies, die zowel betrekking hebben op de “reguliere” als de verlengde onderwijstijd. Een van de opbrengsten van de literatuurstudie is een nadere systematisering van het concept onderwijstijd, zoals hierboven besproken, met aandacht voor bruto/netto tijd, regulier en extra, evenals verschillende oorzaken voor tijdsverlies, zoals absentie en lesuitval. Een inventarisatie op basis van uitkomsten op internationaal vergelijkende assessment onderzoeken, zoals TIMSS, PIRLS en PISA, biedt benchmarks om de Nederlandse positie beter te kunnen interpreteren. Voor een deel bieden deze bestanden ook inzicht in het verschijnsel verlengde leertijd. Ad b) Updaten van (eigen) meta-analyses. Het bijeenbrengen van resultaten van meta-analyses, waarin het effect van (facetten van) onderwijstijd op leerprestaties is nagegaan. Enkele van deze meta-analyses zijn door de aanvrager zelf uitgevoerd, Scheerens en Bosker (1997), Scheerens en anderen (2007). De eigen meta-analyse zijn ge-update met onderzoek dat in de periode tussen 2005 en 2011 is uitgevoerd. Ad c) Secundaire analyses op het bestand van PISA 2009. Onderzoek naar complexere causale modellen, waarin onderwijstijd op nationaal en schoolniveau, gemodereerd door achtergrondvariabelen en in interactie met andere effectiviteitbevorderende condities op systeem en schoolniveau, in verband wordt gebracht met leerresultaten. Dergelijke modellen zijn geëxploreerd op basis van secundaire analyses van het PISA 2009 onderzoek. Analyses hebben betrekking op de resultaten voor lezen, wiskunde en natuurkunde. Literatuuronderzoek vond zowel plaats bij onderdeel a als bij onderdeel b. Om nieuw onderzoek te detecteren voor de meta-analyse werd een systematische literatuur search uitgevoerd. Resultaten Eerst worden de resultaten van het literatuuronderzoek naar eerdere reviews en meta-analyses en naar gegevens uit internationaal vergelijkende onderzoeken kort samengevat, vervolgens de resultaten van de nieuwe meta-analyse, verdeeld over de effecten van leertijd op school, effecten van huiswerk en effecten van buitenschoolse leertijd. Eerdere meta-analyses Resultaten van meta-analyses worden meestal weergegeven door middel van coëfficiënten, die ofwel het gestandaardiseerde verschil tussen twee gemiddelden weergeven, de d- coëfficiënt, dan wel te interpreteren zijn als correlatiecoëfficiënten (de productmoment correlatie r , of de Fisher Z coëfficiënt). De coëfficiënt d is ruwweg tweemaal zo groot als r. Wanneer we uitgaan van correlaties worden correlaties van .10 als klein opgevat, correlaties van .50 als middelgroot en correlaties van .80 en meer als groot (Cohen, 1969). Er bestaat discussie over de vraag of in sociaal wetenschappelijk onderzoek en in onderwijskundig onderzoek wellicht andere standaarden zouden kunnen gelden. Zo wordt de grootte van effecten van onderwijskundig onderzoek wel afgezet tegen de effectgrootte van een jaar onderwijs, auteurs schatten dit effect, afhankelijk van leerinhoud en onderwijsniveau in overeenstemming met een correlatie van .20 tot .30. Op die manier kan een correlatie van .10 als een gemiddeld effect worden opgevat (Scheerens et al., 2007). Uit het overzicht van eerdere meta-analyses over leertijd tijdens de reguliere schooltijd, huiswerk en extra, buitenschoolse leertijd, konden gemiddelde effectgroottes worden

88
opgetekend gelijk aan correlaties van resp. r = .18 (tijd op school), r = .15 (huiswerk) en r = .09 (buitenschoolse programma’s). Wanneer deze effectgroottes worden vergeleken met de grootte van effecten van andere variabelen die in onderwijseffectiviteit onderzoek zijn opgenomen zijn dit gemiddelde effectgroottes. Het literatuuronderzoek leverde verder materiaal op om de conceptuele invulling van leertijd op school, huiswerk en buitenschoolse programma’s nader te preciseren. Deze precisering vormde tevens de basis voor onderverdelingen in de nieuwe meta-analyses die zijn uitgevoerd en waarvan de resultaten verderop worden samengevat. Wat leertijd op school betreft werd gekozen voor een driedeling: officiële (allocated) tijd, instructie tijd (dat wil zeggen het deel van een les dat daadwerkelijk aan instructie wordt besteed) en taakgerichte leertijd (time on task) , de tijd dat leerlingen taakgericht actief zijn tijdens de les. Bij de bestudering van het onderzoek naar de effecten van huiswerk werd opgemerkt dat drie operationaliseringen van huiswerk het belangrijkst zijn: de hoeveelheid huiswerk, in de zin van te verwerken leerinhoud, de tijd die aan huiswerk besteed wordt en de frequentie waarmee huiswerk gegeven wordt. Tevens werd geconstateerd dat huiswerk soms als een beschrijving van een aanbod of school of klas niveau wordt gedefinieerd, maar ook als een opgave (zelf rapportage) van individuele leerlingen. Omdat dit conceptueel verschillende zaken zijn, werden in de eigen meta-analyses, afzonderlijke analyses gedaan voor huiswerk gemeten op leerling niveau enerzijds en op school/klas niveau anderzijds. De buitenschoolse programma’s die extra leertijd bieden, bleken zeer heterogeen van aard te zijn. De functies van deze programma’s blijven niet beperkt tot het bereiken van cognitieve leerdoelen, maar hebben vaak ook te maken met ruimere sociale en vormingsdoelen, en met een institutionele “bewaar” functie. Overigens zijn in de onderzoeken die geanalyseerd zijn in hoofdstuk 3 van het rapport alleen programma’s meegenomen die in ieder geval ook cognitieve opbrengsten hadden opgenomen. Gegevens uit internationaal vergelijkend onderzoek Als het gaat om officiële onderwijstijd zit Nederland in het voortgezet onderwijs met 1000 uur ruim boven het OECD gemiddelde van 948 uur. Echter wanneer gekeken wordt naar de totale leertijd die besteed wordt aan de vakken lezen, wiskunde en natuuronderwijs blijft Nederland beneden het OECD gemiddelde (Nederland 13, 8 uur per week, tegenover een OECD gemiddelde van 17, 90 uur per week). De achterstand geldt ook voor elk van de drie vakken afzonderlijk: natuuronderwijs 3.90 versus 5.04; wiskunde, 5.02 versus 6.59 en taal 4.89 versus 6.28. Wanneer gekeken wordt naar landen die hun officiële onderwijstijd tussen 2000 en 2009 verhoogd dan wel verminderd hebben, dan zijn er ongeveer evenveel landen die het een dan wel het ander hebben gedaan, terwijl de leertijd tevens constant is gebleven voor een groot aantal landen. Op landniveau wordt er meestal geen duidelijk verband gevonden tussen officiële leertijd en leerprestaties. In veel onderzoek (maar er zijn uitzonderingen) wordt zelfs een negatief verband gevonden, hoog hoger de leertijd, des te lager de prestaties. Ook tussen de verandering in officiële leertijd en verandering in leerprestaties (vakgebied leesvaardigheid) werd in een onderzoek een negatief verband gevonden. Sommige resultaten van internationaal onderzoek wekken de indruk dat het effect van leertijd afhankelijk is van het schoolvak, een positief effect voor wiskunde en natuuronderwijs, en een negatief effect voor leesvaardigheid (vergelijk resultaten van PISA 2003, PISA 2006 en PISA 2009). Wat huiswerk en extra tijd buiten de officiële schooluren betreft laat internationaal onderzoek vaak negatieve effecten zien. In het thematische rapport Quality Time (OECD, 2011), wordt zelfs opgemerkt dat landen die hoog scoren op individueel werken van leerlingen en huiswerk en op buitenschools leren, meestal lagere prestaties hebben. Dit wordt tegelijkertijd

89
toegeschreven aan andere gunstige of minder gunstige condities voor hoge leerprestaties. Het rapport suggereert dat landen die hoog scoren op huiswerk en buitenschools leren (en dus vaak lagere prestaties hebben) minder goed voor de dag komen op andere bevorderlijke condities, waarbij onder meer autonomie, goed opgeleide leerkrachten en goed gebruik van evaluatie en feedback als gunstige condities worden genoemd. (Terloops zij hierbij opgemerkt dat de evidentie voor een positief effect van autonomie goeddeels ontbreekt, Luyten et al., 2005; Scheerens en Maslowski, 2008). Meta-analyses Voor dit onderzoek werden nieuwe “eigen” meta-analyses uitgevoerd in de vorm van een up-dating van eerder door de onderzoeksgroep uitgevoerde meta-analyses (Scheerens en Bosker, 1997; Scheerens et al., 2007). Het nieuwe materiaal had betrekking op onderzoek uitgevoerd tussen 2005 en 2010. De aantallen onderzoeken en berekende effectgroottes zijn samengevat in de onderstaande tabel N1. Tabel N1: Aantallen onderzoeken en effectgroottes
Number of studies Number of estimates
Time 31 128
Homework student level 26 130
Homework class/school level 26 128
Extended learning time 15 59
Slechts een deel van het materiaal bevatte voldoende statistische informatie om gebruikt te kunnen worden voor kwantitatieve meta-analyses. Tabel N2: Overzicht van onderzoeken en effectgroottes gebuikt in de kwantitatieve meta-
analyses
Studies Estimates
Time 12 31
Homework student level 17 30
Homework class/school level 10 17
De volledige informatiebasis werd wel gebruikt voor een inventarisatie van aantallen positieve en negatieve effectgroottes die statistisch significant waren. Dit staat bekend als een “vote count” analyse, en is te beschouwen als een rudimentaire, kwalitatieve vorm van meta-analyse. Voor een beschrijving van methodisch technische aspecten van de gebruikte methoden, zij verwezen naar het originele rapport. De resultaten van de “vote counts” zijn samengevat in tabel N3.
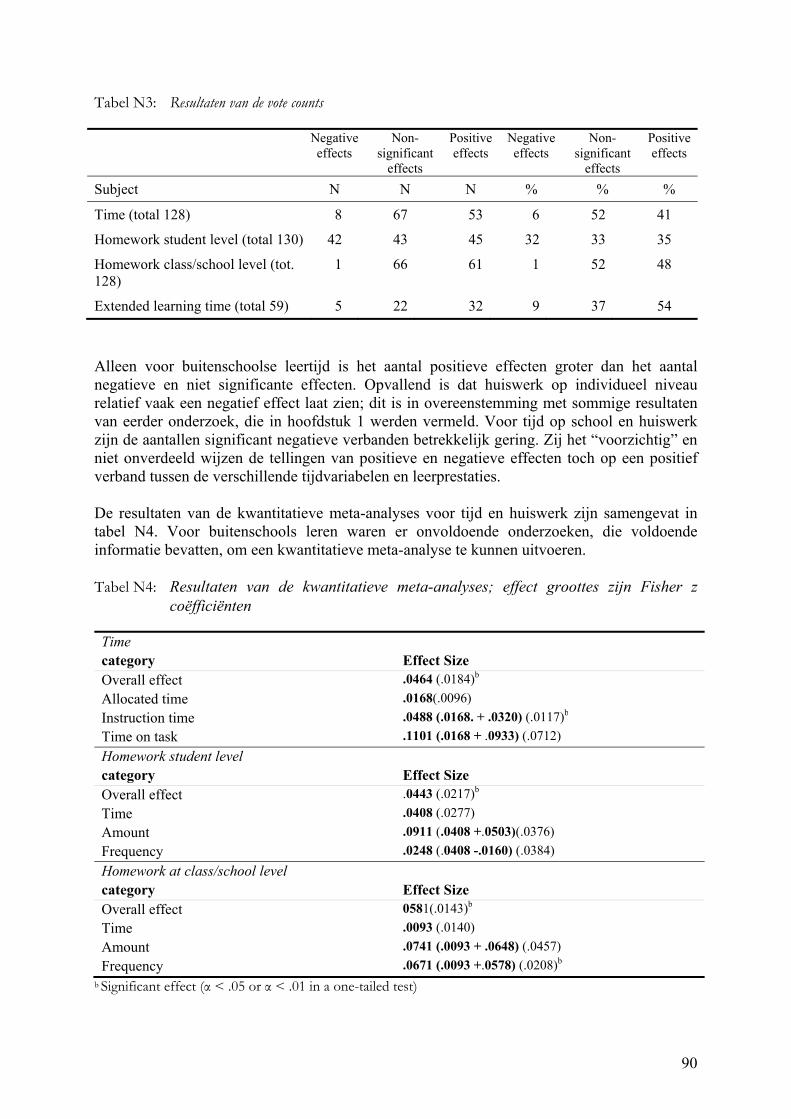
90
Tabel N3: Resultaten van de vote counts Negative
effects Non-
significant effects
Positive effects
Negative effects
Non-significant
effects
Positive effects
Subject N N N % % %
Time (total 128) 8 67 53 6 52 41
Homework student level (total 130) 42 43 45 32 33 35
Homework class/school level (tot. 128)
1 66 61 1 52 48
Extended learning time (total 59) 5 22 32 9 37 54
Alleen voor buitenschoolse leertijd is het aantal positieve effecten groter dan het aantal negatieve en niet significante effecten. Opvallend is dat huiswerk op individueel niveau relatief vaak een negatief effect laat zien; dit is in overeenstemming met sommige resultaten van eerder onderzoek, die in hoofdstuk 1 werden vermeld. Voor tijd op school en huiswerk zijn de aantallen significant negatieve verbanden betrekkelijk gering. Zij het “voorzichtig” en niet onverdeeld wijzen de tellingen van positieve en negatieve effecten toch op een positief verband tussen de verschillende tijdvariabelen en leerprestaties. De resultaten van de kwantitatieve meta-analyses voor tijd en huiswerk zijn samengevat in tabel N4. Voor buitenschools leren waren er onvoldoende onderzoeken, die voldoende informatie bevatten, om een kwantitatieve meta-analyse te kunnen uitvoeren. Tabel N4: Resultaten van de kwantitatieve meta-analyses; effect groottes zijn Fisher z
coëfficiënten Time category Effect SizeOverall effect .0464 (.0184)b
Allocated time .0168(.0096)
Instruction time .0488 (.0168. + .0320) (.0117)b Time on task .1101 (.0168 + .0933) (.0712) Homework student levelcategory Effect SizeOverall effect .0443 (.0217)b
Time .0408 (.0277)
Amount .0911 (.0408 +.0503)(.0376)
Frequency .0248 (.0408 -.0160) (.0384)
Homework at class/school level category Effect SizeOverall effect 0581(.0143)b
Time .0093 (.0140)
Amount .0741 (.0093 + .0648) (.0457) Frequency .0671 (.0093 +.0578) (.0208)b
b Significant effect (α < .05 or α < .01 in a one-tailed test)

91
Van de 12 effectgroottes blijken er slechts 5 significant. Alle drie de “overall” effecten van tijd, huiswerk op individueel niveau en huiswerk op klas/school niveau zijn overigens wel significant. Het feit dat de meeste subcategorieën, zoals bijvoorbeeld hoeveelheid huiswerk geen significant effect laten zien kan niet losgezien worden van de bijzonder kleine aantallen. Wanneer we deze resultaten vergelijken met het overall beeld dat verkregen wordt op basis van het overzicht van resultaten van eerder meta-analyses, zoals behandeld in Hoofdstuk 1 van het rapport, dan kan dit gedaan worden op basis van een wat ruwe samenvoeging van resultaten van huiswerk op individueel en klas/schoolniveau, en hiervoor een gemiddeld effect van .05 te berekenen. De coëfficiënten gebaseerd op de eerder meta-analyses berusten soms op een ruwe omzetting door r als de helft van gevonden d- coëfficiënten op te vatten. Dit resulteert dan in het overzicht dat in tabel N5 staat. Tabel N5: Vergelijking van de effectgroottes van eerdere en de hier gepresenteerde meta-
analyses Other meta-analyses Meta-analyses presented in this
studyLearning time .18 .05Homework .15 .05
Het is niet zo gemakkelijk om een verklaring te geven voor de aanzienlijke verschillen in effect groottes. Een mogelijke verklaring is dat de methodisch technische kwaliteit van de meer recente onderzoeken beter is dan van de oudere onderzoeken. Methodologische analyses, zoals die van Kohn (2006), laten zien dat naarmate er strengere methodologische eisen worden gesteld, resultaten klein tot zeer klein worden. Een andere verklaring zou kunnen zijn dat in het overgrote deel van de onderzoeken die gebruikt zijn, tevens andere condities van effectief onderwijs, zoals opportunity to learn en gestructureerd onderwijs waren opgenomen. Analisten (bijvoorbeeld Trautwein et al., 2006) hebben erop gewezen dat tijd effecten sterk afnemen wanneer voor dit soort variabelen “gcontroleerd” wordt. De aantallen effectgroottes waarover beschikt kon worden zijn te gering om deze veronderstelling nader kwantitatief te toetsen. Discussie Tot slot wordt stilgestaan bij de maatschappelijke betekenis van het onderzoek en op overblijvende vragen voor nader onderzoek. Relevantie voor het huidige op kwaliteitsverbetering gerichte onderwijsbeleid in Nederland Voor het basis-, voortgezet en beroepsonderwijs zijn door de verschillende directies van OC&W kwaliteitsagenda’s gepubliceerd (OC&W, 2007, 2007a en 2007b). De kwaliteits-agenda voor het basisonderwijs is sterk gericht op het verbeteren van de leerprestaties in taal en rekenen. Hoewel Nederlandse leerlingen het best goed doen in internationale assessment onderzoeken, wordt verdere verbetering nodig geacht, zeker als het gaat om de proportie studenten dat in het top segment van de verdeling van de internationale toetsen scoort. Een eerste stap om de gewenste verbetering tot stand te brengen bestaat uit het formuleren van leerstandaarden voor taal en rekenen. De groep leerlingen die beneden hun kunnen presteert, en die op 10% van de totale leerlingenpopulatie wordt geschat, zou met 40% naar beneden moeten. Ook het gemiddelde prestatie niveau moet omhoog. Het aantal scholen dat door de inspectie als “zwak” wordt gekwalificeerd moet met 50% gereduceerd worden. Tenslotte
92
wordt gesteld dat in 2011 80% van de scholen een goed functionerend systeem van kwaliteitszorg zou moeten hebben. Voor het voorgezet onderwijs worden overeenkomstige prioriteiten aangegeven. De volgende maatregelen om een en ander tot stand te brengen worden gepropageerd en financieel ondersteund:
- een effectief gebruik van de officiële schooltijd; - het stimuleren van een opbrengstgerichte schoolcultuur; - het gebruik van leerlingvolgsystemen; - de toepassing van schoolverbeteringsprogramma’s die wetenschappelijk onderbouwd
zijn (evidence based), speciaal in scholen met veel achterstandsleerlingen; - het creëren van rijke leeromgevingen (ICT toepassingen); - het stimuleren van ouderbetrokkenheid; - disseminatie van goede praktijken op het terrein van lesgeven; - vrijheid en autonomie voor de scholen bij het tot stand brengen van hun pogingen tot
verbetering; - professionele ontwikkeling van de leerkrachten en het organiseren van
schoolnetwerken; - hogere eisen (c.q. standaarden) bij het rekenonderwijs op de Pedagogische Academies.
Een rode draad door de drie kwaliteitsagenda’s is de aandacht voor verbetering van de prestaties in de basisvakken, taal en rekenen. Nieuwe onderwijsopbrengsten, die worden nagestreefd, zijn burgerschap in het voortgezet onderwijs en beroepsgerichte competenties in het beroepsonderwijs. Numeriek rendement en het voorkomen van voortijdig schoolverlaten hebben ook hun plaats in de kwaliteitsagenda’s. De proces factoren die de verbeterde opbrengsten teweeg zouden moeten brengen liggen vooral op het terrein van professionalisering van leerkrachten en de schoolorganisatie. De Onderwijsinspectie heeft een belangrijke rol bij het vaststellen van de kwaliteit van scholen. In de kwaliteitsagenda’s worden ook meer specifieke categorieën van “hefbomen” voor kwaliteitsverbetering genoemd: toetsen, monitoring van leerprestaties, examens, kwaliteitszorg, de opleiding van leerkrachten, continue professionele ontwikkeling, “evidence based” innovatie, en een betere aansluiting tussen de diverse schooltypen. Het monitoren van onderwijstijd, is een van de centrale kwaliteitsaspecten in de toezichtkaders van de Inspectie. Relevant is in deze ook het rapport van de Commissie Cornielje (OCW,2008) over onderwijstijd. De boodschap in het eindrapport van deze commissie benadrukt het punt dat tijd alleen maar een randvoorwaarde is om goed onderwijs geven. Het rapport schetst verder de context van horizontaal en verticaal toezicht dat het hanteren van de nieuwe 1000 uren norm zou moeten controleren. De motivatie om het aantal uren officiële instructietijd terug te brengen tot 1000 uur gebeurde onder meer door te verwijzen naar internationaal vergelijkende gegevens, waarbij overigens terecht werd opgemerkt dat er geen eenduidige relatie is tussen landelijk vastgestelde officiële leertijd en prestaties. Het lijkt er daarom op dat de reductie in leertijd eerder om financieel en administratieve motieven is gebaseerd dan op overwegingen om de kwaliteit van het onderwijs te verbeteren. Uit deze beleidsdocumenten blijkt duidelijk dat tijd en het toezien op effectieve leertijd serieus worden genomen. Daarbij komt de specifieke wetgeving die het scholen met een hoog percentage achterstandsleerlingen mogelijk maakt om de leertijd uit te breiden (CFI, 2009). Scholen die met andere scholen en een schoolbegeleidingsdienst samenwerken krijgen speciale subsidie om de leertijd te verhogen, op basis van hetzij verlengde schooldagen, schoolweken, of zomerscholen. Momenteel lopen er externe evaluaties van deze

93
ontwikkelingsprojecten (Oberon, 2009, Driessen en anderen, 2010), maar de resultaten ervan zijn nog niet bekend.
Op basis van de gegevens die in dit rapport bijeen zijn gebracht, kan geconcludeerd worden dat het essentieel is dat extra leertijd, zeker ook als het gaat om achterstandsleerlingen, gepaard gaat met een opbrengstgerichte en gestructureerde aanpak. Of dit ook daadwerkelijk gebeurt is onzeker, gezien de voorkeur in Nederland voor ontwikkeling “van onderop”. Het is onzeker of op deze wijze op optimale manier gebruik wordt gemaakt van verkregen kennis over onderwijseffectiviteit. Doordat de ontwikkeling plaatsvindt in betrekkelijk kleine netwerken van scholen, die los van elkaar opereren, is het ook lastig om uitwisseling en disseminatie van “goede praktijken” tot stand te brengen. In dit opzicht is er een zekere spanning tussen het gezamenlijk bepleiten van evidence based ontwikkeling en autonomie in de kwaliteitsagenda’s. De inefficiency van het Nederlandse onderwijsinnovatiebeleid, de hoge kosten en nimmer getoetste doelmatigheid van de onderwijsverzorgingsstructuur zijn thema’s die een kritische analyse verdienen. Een overeenkomstige redenering is van toepassing op de ontwikkeling van brede scholen. Wanneer we de resultaten van evaluaties van vooral Amerikaanse projecten met verlengde schooltijd in aanmerking nemen, dan blijkt dat de doelmatigheid hiervan twijfelachtig is. Vooral wanneer er ook nieuwe gebouwen bekostigd moeten worden lijkt het nuttig om de kosten effectiviteit van deze programma’s aan onderzoek te onderwerpen. De internationaal vergelijkende gegevens die in dit rapport zijn aangehaald maken duidelijk dat, ondanks de nog steeds hoge totale instructietijd in het voortgezet onderwijs, Nederland achterblijft op het totaal aan uren dat beschikbaar is voor de vakken natuuronderwijs, wiskunde en taal/lezen. Gezien de beleidsaccenten op juist deze vakken in de kwaliteitsagenda’s, en de ambitie om internationaal tot de top 5 in de landenrangorde te gaan behoren, verdient het aanbeveling eventuele uitbreiding van de tijd voor deze vakken, ten koste van andere vakken, in aanmerking te nemen. De resultaten van dit onderzoek geven aanleiding om van een uitbreiding bescheiden positieve effecten te mogen verwachten. Een recent onderzoek van Diris, 2012, waarin een positief effect werd aangetoond van uitbreiding van de leertijd voor taal/lezen in de jaren negentig, wijst in dezelfde richting. Verder onderzoek Een opmerkelijke uitkomst van de meta-analyses is, dat de gemiddelde effectgroottes veel kleiner zijn dan het overall beeld dat resulteert wanneer men de gemiddelde uitkomsten van eerdere meta-analyses ermee vergelijkt (.15 versus .05). Hier een wetenschappelijk onderbouwde interpretatie aan geven vraagt om replicatie onderzoek van eerdere meta-analyses. Mogelijke verklaringen zijn een scherpere selectie van in aanmerking komende onderzoeken, en het gegeven dat mogelijkerwijs in de meer recente onderzoeken vaker “gecontroleerd” is voor andere onderwijs effectiviteitbevorderende kenmerken, zoals gerichte leerstofkeuze, goede klasse management en activerende, gestructureerd onderwijs. Verder heeft het onderzoek een aantal niet helemaal opgehelderde problemen aan het licht gebracht:
- vaak voorkomende negatieve relaties tussen tijd en leerprestaties, bij analyses op landniveau in internationaal vergelijkend onderzoek, hoewel sommige onderzoeken juist weer wel positieve effecten vermelden (OECD, 2011);
- wat de verklaring is voor de vaak gevonden negatieve relaties tussen hoeveelheid huiswerk en leerprestaties, wanneer huiswerk op leerling niveau gemeten wordt;

94
- de vraag in hoeverre de effecten van tijd verschillen per leervak (zo werden in PISA 2003 voor wiskunde en in PISA 2006 voor natuuronderwijs een positief verband gevonden, maar voor PISA 2009 een negatief verband voor lezen);
- de vraag hoe tijdseffecten nu precies samenvallen dan wel interacteren met andere beïnvloedbare factoren die positief samenhangen met leerprestaties.
Zeker ook wat dit laatste punt betreft is er behoefte aan onderzoek dat de mogelijkheid biedt om complexere samenhangen te onderzoeken, waaronder reactieve invloeden van prestatieniveaus op onderwijscondities, zoals onderwijstijd.
Referenties Bloom, B.S. (1968).Learning for Mastery. Washington, DC: ERIC. Carroll, J.B. (1963). A model of school learning. Teachers College Record, 64, 722-733. Carroll, J.B. (1989). The Carroll Model, a 25-year retrospective and prospective view.
Educational Researcher, 18, 26-31 Ministerie van OCW (2007). Krachtig meesterschap. Kwaliteitsagenda voor het opleiden van leraren
2008-2011.Den Haag: Ministerie OCW. Ministerie van OCW (2007). Tekenen voor Kwaliteit. Kwaliteitsagenda Voortgezet Onderwijs. Den
Haag: Ministerie OCW. Ministerie van OCW (2007). Scholen voor morgen. Kwaliteitsagenda PO. Den Haag: Ministerie
OCW.
Cohen, J. (1969). Statistical power analysis for the behavioral sciences (2nd Edition) Hillsdal, NJ: Lawrence Erlbaum Associates
Ministerie van OCW (2008) Rapport Commissie Onderwijstijd. Den Haag: OCW Creemers, B.P.M. (1994). The Effective Classroom. London: Cassell. Driessen, G., Claassen, A. & Smit, F. (2010). Variatie in schooltijden. Een internationale
literatuurstudie naar de effecten van verschillende invullingen van de schooldag, de schoolweek en het schooljaar. Nijmegen: ITS.
Inspectie van het Onderwijs (2011). Onderwijsverslag. Utrecht: Inspectie van het Onderwijs. Kohn, A. (2006). Abusing research: The study of homework and other examples. Phi Delta
Kappan, 88(1), 8-22. Luyten, J.W., Scheerens, J., Visscher, A.J., Maslowski, R, Witziers, B., & Steen R. (2005).
School factors related to quality and equity. Results from PISA 2000.Parijs: OECD. Ministerie van OCW (2007). Krachtig meesterschap. Kwaliteitsagenda voor het opleiden van
leraren 2008-2011. Den Haag: Ministerie OCW. Ministerie van OCW (2007). Tekenen voor Kwaliteit. Kwaliteitsagenda Voortgezet
Onderwijs. Den Haag: Ministerie OCW. Ministerie van OCW (2007). Scholen voor morgen. Kwaliteitsagenda PO. Den Haag:
Ministerie OCW. Oberon (2009). Een oriëntatie naar verlengde onderwijstijd. Inrichting en effecten. Utrecht:
Oberon. OECD (2011).Quality Time for Students: Learning In and Out of School, OECD Publishing. Onderwijsraad (2010). Uitgebreid onderwijs. Den Haag: Onderwijsraad. Rosenshine, B.V. (1983). Teaching functions in instructional programs. Elementary School
Journal, 3, 335-351. Scheerens, J. (1992). Effective Schooling, Research, Theory and Practice. London: Cassell.
95
Scheerens, J., & Bosker, R.J. (1997).The Foundations of Educational Effectiveness. Oxford: Elsevier Science Ltd.
Scheerens, J., Luyten, H., Steen, R., & Luyten-de Thouars, Y. (2007).Review and meta-analyses of school and teaching effectiveness. Enschede: Department of Educational Organisation and Management, University of Twente.
Scheerens, J. & Maslowski, R. (2008). Autonomie des établissements scolaires: des moyens à la recherche d'un objectif? Revue Française de Pédagogie, 164, 27-36.
Stallings, J., & Mohlman, G. (1981).School policy, leadership style, teacher change and student behavior in eight schools. Final report to the National Institute of Education, Washington D.C.
Stringfield, S.C., & Slavin, R.E. (1992).A hierarchical longitudinal model for elementary school effects. In B.P.M. Creemers & G.J. Reezigt (Eds.), Evaluation of Educational Effectiveness [pp. 35-39]. Groningen: ICO.
Trautwein, U., Ludtke, O., Schnyder, I., & Niggli, A. (2006). Predicting homework effort: Support for a domain-specific, multilevel homework model. Journal of Educational Psychology, 98(2), 438-456.
Walberg, H.J. (1984). Improving the productivity of American schools. Educational Leadership, 41, 19-27.

96
ANNEX to Chapter 3
Table of contents
Learning time at school
Table A1: Overview of studies of learning time at school on student achievement
Table A2: Methodological information available from studies of learning time at school on student achievement
Table A3: Meta-analysis coefficients learning time at school
Table A4: Results of vote counts examining the number of negative, non-significant and positive effects of learning time at school on academic achievement for each sample
Table A5: Results of vote counts examining the number and percentage of negative, non-significant and positive effects of allocated time, net instruction time and time on task on academic achievement
Table A6: Results of vote counts examining the number and percentage of negative, non-significant and positive effects of learning time at school on academic achievement in all subjects, language, mathematics and subjects other than math or language
Table A7: Results of moderator analyses examining the number and percentage of negative, non-significant and positive effects of learning time at school on academic achievement
TableA8: Parameter estimates (and standard errors) of conceptualization of learning time at school predicting effect size (results from multilevel meta-analysis)
Table A 9: Other class and school level variables included in studies on the effects of learning time on academic achievement
Homework
Table A10: Overview of studies of homework (pupil level) on student achievement
Table A11: Methodological information available from studies of homework (pupil level) on student achievement
Table A12: Overview of studies of homework (at class/school level) on student achievement
Table A13: Methodological information available from studies of homework (at class/school level) on student achievement
Table A14: Meta-analysis coefficients Homework at pupil level
Table A15: Meta-analysis coefficients Homework at class/school level
Table A16: Results of vote counts examining the number of negative, non-significant and positive effects of homework at pupil level on academic achievement for each sample
Table A17: Results of vote counts examining the number and percentage of negative, non-significant and positive effects of amount of homework, frequency of homework and time spent on homework at pupil level on academic achievement
Table A18: Results of vote counts examining the number and percentage of negative, non-significant and positive effects of homework at pupil level on academic achievement in all subjects, language, mathematics and subjects other than math or language

97
Table A19: Results of moderator analyses examining the number and percentage of negative, non-significant and positive effects of homework at pupil level on academic achievement (based on vote counts)
Table A20: Results of vote counts examining the number of negative, non-significant and positive effects of homework at class/school level on academic achievement for each sample
Table A21: Results of vote counts examining the number and percentage of negative, non-significant and positive effects of amount of homework, frequency of homework and time spent on homework at class/school level on academic achievement
Table A22: Results of vote counts examining the number and percentage of negative, non-significant and positive effects of homework at class/school level on academic achievement in all subjects, language, mathematics and subjects other than math or language
Table A23: Results of moderator analyses examining the number and percentage of negative, non-significant and positive effects of homework at class/school level on academic achievement (based on vote counts)
Table A24: Parameter estimates (and standard errors) of conceptualization of homework at pupil level predicting effect size (results from multilevel meta-analysis)
Table A25: Parameter estimates (and standard errors) of study characteristics predicting effect size of homework at pupil level on achievement (results from multilevel meta-analysis)
Table A26: Descriptive statistics number of students; Number of samples is 19; homework at pupil level
Table A27: Parameter estimates (and standard errors) of conceptualization of homework at class/ school level predicting effect size (results from multilevel meta-analysis)
Table A28: Parameter estimates (and standard errors) of ) of study characteristics predicting effect size of homework at class/school level on achievement (results from multilevel meta-analysis)
Table A29: Descriptive statistics number of students; Number of samples is 12. Homework defined at school/class level
Extended Learning Time
Table A30: Overview of studies of extended learning time on student achievement ( pupil level)
Table A31: Methodological information available from studies of extended learning time on student achievement (pupil level)
Table A32: Results of vote counts examining the number of negative, non-significant and positive effects of extended learning time on academic achievement for each sample
Table A33: Results of vote counts examining the number and percentage of negative, non-significant and positive effects of extended learning time on academic achievement in all subjects, language, mathematics and subjects other than math or language
Table A34: Results of moderator analyses examining the number and percentage of negative, non-significant and positive effects of extended learning time on academic achievement
Overall Analysis
Table A35: Comparison of fixed-effects model and random-effects model (estimate and standard error)
Table A36: Comparison of fixed-effects model and random-effects model (95% confidence interval)

98
Table A1: Overview of studies of learning time at school on student achievement
Learning time at school
Sample Country School type1
Learning time measure Operationalisation Concept Outcome measure
Aslam (2011)
Pakistan S Length of the school week
Minutes per week school time is spent in studying (excluding breaks etc.) divided by 1000
Allocated time Language achievement standardized test
Math achievement standardized test
Bosker et al. (1990) Netherlands S Effective instruction time
Ratio instruction time /total time
Allocated time Math achievement test
Cameron et al. (2008)
USA P Total amount of language arts instruction
Number of minutes spent Instructional time Word reading growth score (Reading Recognition Subtest of the Peabody Individual Tests of Achievement-Revised (PIAT-R)
D’Agostino (2000) Cohort 1
Cohort 3
USA P Days of school Number of school days: one item asking how many days school will be in session (teachers and students both present) in this academic school year
Allocated time CBTS Reading test initial score and learning rate
Driessen & Sleegers (2000)
Netherlands S Language and math time
How many hours and minutes are devoted to a) language (writing, speaking and listening skills; spelling, grammar, language study) and b) math
Allocated time Language achievement test
Math achievement test
Eren & Henderson (2008)*
USA S Weekly hours of math class
Allocated time 10th grade Math scores (NELS: 88)
Eren & Millimet (2007)
USA S Length of the school year: 180 +days
Allocated time 10th grade public school student pooling test scores across four subjects: reading, social science, math and science
Fuchs & Woesmann (2007)*
31 countries S Instruction time (Math, Science, Reading)
In 1,000 minutes per year Allocated time PISA international test score (PISA 2000) Math, Science , Reading
Harn et al. (2008) USA P Intensity of instruction Texas: 30 minutes of Allocated time Scores on 7 separate reading tests
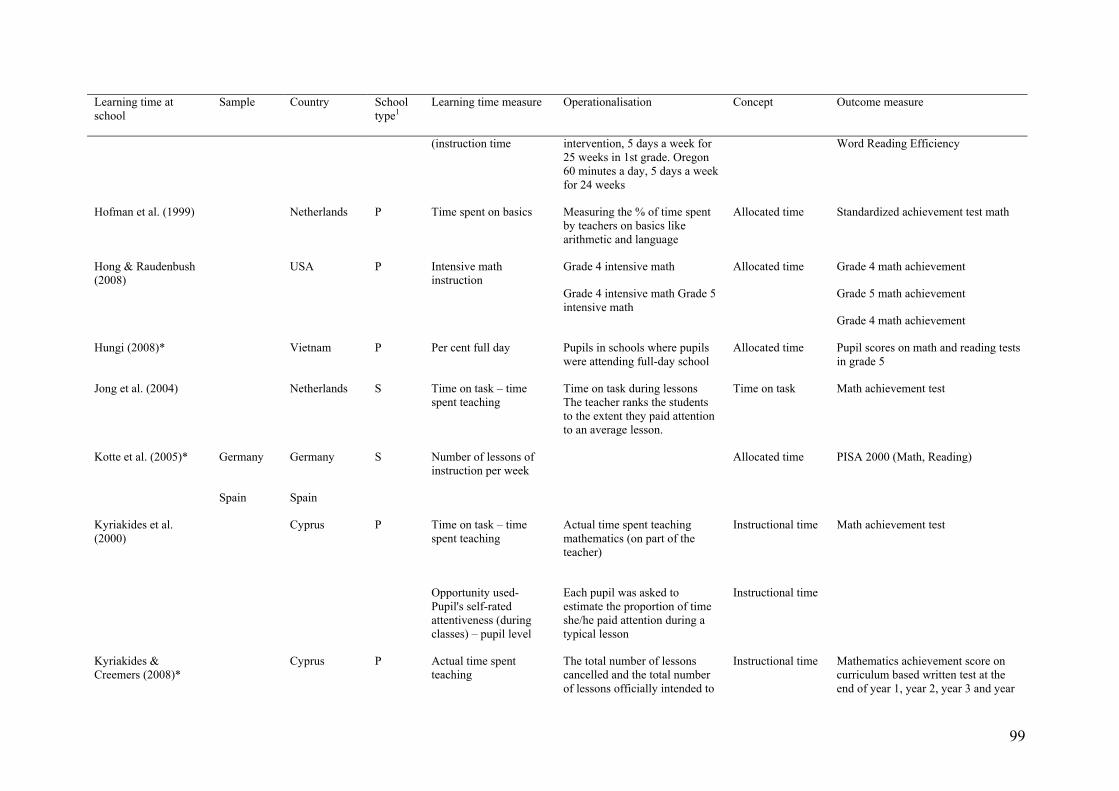
99
Learning time at school
Sample Country School type1
Learning time measure Operationalisation Concept Outcome measure
(instruction time intervention, 5 days a week for 25 weeks in 1st grade. Oregon 60 minutes a day, 5 days a week for 24 weeks
Word Reading Efficiency
Hofman et al. (1999)
Netherlands P Time spent on basics Measuring the % of time spent by teachers on basics like arithmetic and language
Allocated time Standardized achievement test math
Hong & Raudenbush (2008)
USA P Intensive math instruction
Grade 4 intensive math
Grade 4 intensive math Grade 5 intensive math
Allocated time Grade 4 math achievement
Grade 5 math achievement
Grade 4 math achievement
Hungi (2008)* Vietnam P Per cent full day Pupils in schools where pupils were attending full-day school
Allocated time Pupil scores on math and reading tests in grade 5
Jong et al. (2004)
Netherlands S Time on task – time spent teaching
Time on task during lessons The teacher ranks the students to the extent they paid attention to an average lesson.
Time on task Math achievement test
Kotte et al. (2005)* Germany Germany S Number of lessons of instruction per week
Allocated time PISA 2000 (Math, Reading)
Spain Spain
Kyriakides et al. (2000)
Cyprus P Time on task – time spent teaching
Actual time spent teaching mathematics (on part of the teacher)
Instructional time Math achievement test
Opportunity used- Pupil's self-rated attentiveness (during classes) – pupil level
Each pupil was asked to estimate the proportion of time she/he paid attention during a typical lesson
Instructional time
Kyriakides & Creemers (2008)*
Cyprus P Actual time spent teaching
The total number of lessons cancelled and the total number of lessons officially intended to
Instructional time Mathematics achievement score on curriculum based written test at the end of year 1, year 2, year 3 and year

100
Learning time at school
Sample Country School type1
Learning time measure Operationalisation Concept Outcome measure
be spent on mathematics, but used for other purposes, were subtracted from the total number of lessons allocated to mathematics in the whole year
4
Lavy (2010) Study 1
22 countries S Instruction hours per week
Instruction time in each subject measured in hours per week (Reading) (computed school average, using mid value of each range
Allocated time Math achievement (PISA 2006)
Study 2 grade 5
Israel P Instruction hours Classroom instruction time in each subject (teacher questionnaire) (computed mean per grade)
Allocated time Grade 5 (English, Math, Science test)
Study 2 grade 8
S Grade 8 (English, Math, Science test)
Liu et al. (2006) 6 countries S Teaching time How many minutes per week the teachers teach math to the TIMSS class
Allocated time TIMSS 2003 grade 8 math test
Lockheed & Komenan (1989)*
Nigeria Nigeria S Length of year Days in the school year Allocated time Grade 8 Math Achievement : 40 items SIMS “core” test
Swaziland Swaziland S
Lockheed & Longford (1991)
Taiwan P Length of year Days in the school year Allocated time Math Achievement test (SIMS)
Lubienski et al. (2008)
Grade 4 USA P Time on Math Tachers were asked how much time they spent on math instruction weekly
Allocated time 2003 Main NAEP mathematics achievement grade 4
Grade 8 S Time on Math 2003 Main NAEP mathematics achievement grade 8
Mc Donald Connor et USA P Time spent on academic Sum of 4 individual scales: Time spent on instructin of
Instructional time First grade student’s vocabulary and reading (word recognition, and

101
Learning time at school
Sample Country School type1
Learning time measure Operationalisation Concept Outcome measure
al. (2005)* activities literacy/language/foreign language, mathematics, science and social studies
phonological decoding skills (From Woodcock–Johnson Tests of Achievement-R)
Meijnen et al. (2003)
Netherlands P Time spent per week general
Measured by teachers logbook according to time spent (per week) on the acquisition of basic skills in general
Growth in reading comprehension, Growth in math, Growth in word decoding
Time spent word decoding
Time spent reading comprehension
Time spent math
Combination of the logbook information and the information about instruction time from the questionnaire
Muijs & Reynolds (2000)*
Year 1
Year 3
Year 5
UK P Time on task percentage Observations during lessons: the number of pupils on/off task every 5 minutes
Time on task July 1998 NFER numeracy tests
Pugh & Teljah (2003)*
Belgium S Minutes teaching math Measuring teachers' minutes per week teaching math to the class
Instructional time Mathematics achievement (TIMSS-R 1998-1999)
Reezigt et al. (1999) Cohort 1988-1990
Cohort 1990-1992
Cohort 1988-1992
Netherlands P Time for learning % of lesson time spent on instruction/seatwork (range 00-99)
Instructional time Evaluation of the Dutch Educational Priority Policy (Language achievement, Math achievement)
Taylor et al. (2003)* USA P Time on task Observation: At the end of each five minute period, the observer recorded the proportion of all students in the classroom who appeared to be engaged in the
Time on task Standardized reading comprehension test

102
Learning time at school
Sample Country School type1
Learning time measure Operationalisation Concept Outcome measure
assigned task
Teodorovic (2011)* Serbia P Whole-class instruction Teacher-reported % of class time spent on frontal lecturing and % of class time spent on whole-class discussion, added and converted to 10% increments
Instructional time Achievement tests mathematics and Serbian language
Uroglu & Walberg (1986)*
USA P Time Instructional time Science, math and reading achievement (Comprehensive Test of Basic Skills)
Werf (1994) Netherlands P Scheduled time for arithmetic
Allocated time Math achievement
Werf et al. (2001)
Indonesia P Time spent on subject Standardized tests Bahasia Indonesia, Math and Science grade 6 (Primary Education Quality Improvement Project)
Notes: *= Included in meta-analysis, 1 P = primary, S = secondary school

103
Table A2: Methodological information available from studies of learning time at school on student achievement
Learning time at school
Sample Achievement measure
Nr of schools íncluded
Nr of classes
included
Nr of students included
Statistical technique used
Value added
Effects reported in publication
SE reported
p value reported
Aslam (2011) Language Math
50 100 1353 Regression (unstandardized)
yes b = 0.567 b = -0.472
no s at 0.10 s at 0.05
Bosker et al. (1990)
Math 25 44 707 Multilevel (unstandardized)
yes b = 1.75 0.75 s at 0.05
Cameron et al. (2008)
Language 44 108 Multilevel (unstandardized)
yes b = -0.010 no n.s
D’Agostino (2000) Cohort 1 Language Math
134 2996 Multilevel (unstandardized)
yes b = 0.590 b = 0.380 nit nit
no s at 0.01 s at 0.01
n.s. n.s.
Cohort 3
Language Math
124 3203 b = -0.530 b = 0.400 b = nit b = nit
s at 0.01 s at 0.01
n.s. n.s.
Driessen & Sleegers (2000)
Language Math
477
492
7410
Multilevel (unstandardized)
yes b = 0.0 b = 2.0
0.6 1.2
n.s. n.s.
Eren & Henderson (2008)*
Math 6913 Regression (unstandardized)2
yes b = -0.034
0.109 n.s.
Eren & Millimet (2007)
Pooling of 4 subjects
794 10288 Regression (unstandardized)
b=-0.088 0.148 n.s.
Fuchs & Woessmann (2007)*
Language Math Science
6626 6611 6613
173618 96507 96416
Regression (unstandardized)2
yes b = -0.499 b = 0.83 b = 0.034
0.178 0.225 0.211
0.01 0.01 0.01
Harn et al. (2008)
Reading skills 54 Regression (unstandardized)
yes b = 3.98 b = 6.87 b = 1.42 b = 9.06 b = 6.10 b = 10.65 b = 13.23
no s at 0.05 s at 0.05
n.s s at 0.05 s at 0.05 s at 0.05 s at 0.05
Hofman et al. (1999) Math 103 2023 Multilevel yes n.r.3 no n.s. Hong & Raudenbush (2008)
Math 67 147 4216 Multilevel (unstandardized)
yes b = 6.26 b = 3.75 b = 9.65
3.00 2.78 3.70
s at 0.05 n.s
s at 0.05 Hungi (2008)* Reading
Math 3620 72376 Multilevel (HLM)
(standardized) yes ß = 0.30
ß = 0.30 no s at 0.05
s at 0.05 Jong et al. (2004)
Math 28 56 1400 Multilevel (unstandardized)
yes b = 1.350
0.25 s at 0.05

104
Learning time at school
Sample Achievement measure
Nr of schools íncluded
Nr of classes
included
Nr of students included
Statistical technique used
Value added
Effects reported in publication
SE reported
p value reported
Kotte et al. (2005)* Germany Reading 219 5073 Multilevel (standardized)
yes n.r.3 no n.s.
Spain 185 6214 n.r.3 n.s. Kyriakides et al. (2000)
Math 30 56 1051 Multilevel (unstandardized)
yes n.s. no n.s.
Math n.s. no n.s. Kyriakides & Creemers (2008)*
Math 28 61 1662 1614 1592 1579
Multilevel (unstandardized)2
yes b = 0.09 b = 0.06 b = 0.05 b = 0.05
0.03 0.03 0.02 0.02
s at 0.05 s at 0.05 s at 0.05 s at 0.05
Lavy (2010) Study 1
173083 Regression (unstandardized)
yes b = 24.15 1.1 s at 0.05
Study 2 grade 5
Language Math Science
939 110544 Regression (unstandardized)
yes b = 0.085 b = 0.037 b = 0.043
0.02 0.016 0.018
s at 0.05 s at 0.05 s at 0.05
Study 2 grade 8
Language Math Science
457 104729 Regression (unstandardized)
yes b =-0.001 b = 0.03 b = -0.01
0.024 0.026 0.022
n.s. n.s. n.s.
Liu et al. (2006) Korea Japan Taiwan USA Singapore Hong Kong
Math 150 146 151 297 165 135
256 146 150 330 322 126
5309 4856 5379 8192 6018 4972
Multilevel (unstandardized)
b = 0.1 b = -0.1 b = 0.3 b = 1.3 b = 3.4 b = 1.3
no n.s. n.s. n.s.
s at 0.001 s at 0.001 s at 0.01
Lockheed & Komenan (1989)*
Nigeria Swaziland
Math 41 23
700 587
Regression (unstandardized)2
no b = 0.100 b = -0.24
t = 1.87 t = -0.25
n.s. n.s.
Lockheed & Longford (1991)
Math 60 2076 Regression (unstandardized
yes b = -0.010 0.029 n.s.
Lubienski et al. (2008)
Grade 4 Grade 8
Math 5768 4870
157161 119364
Multilevel (unstandardized)
yes b = 0.100 b = 0.800
no n.s. s at 0.05
Mc Donald Connor et al. (2005)*
Language 735 Structural Equation Modelling (total standardized effects)
yes *ß =0.071 *ß =0.091 *ß =0.019
no s at 0.05 s at 0.01
n.s.
Pearson correlation
r= -0.032 r= -0.001 r= 0.012
n.s. n.s. n.s.
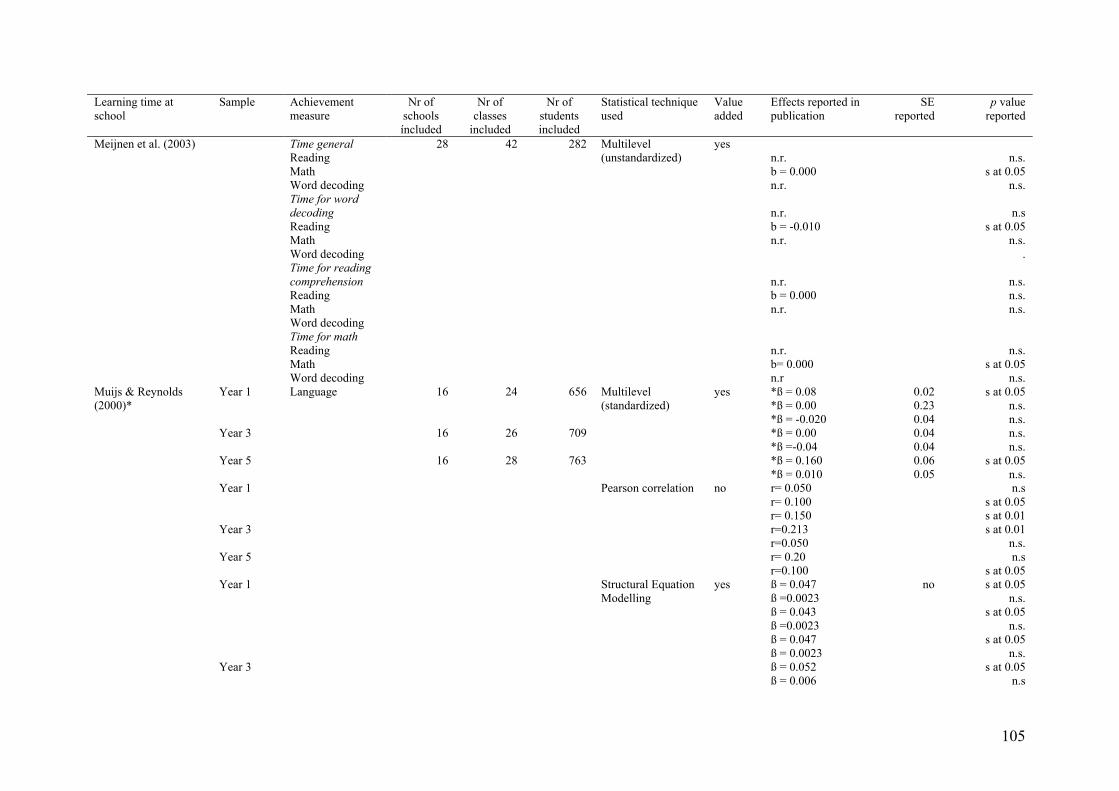
105
Learning time at school
Sample Achievement measure
Nr of schools íncluded
Nr of classes
included
Nr of students included
Statistical technique used
Value added
Effects reported in publication
SE reported
p value reported
Meijnen et al. (2003)
Time general Reading Math Word decoding
28 42 282 Multilevel (unstandardized)
yes n.r. b = 0.000 n.r.
n.s.
s at 0.05 n.s.
Time for word decoding Reading Math Word decoding
n.r. b = -0.010 n.r.
n.s
s at 0.05 n.s.
. Time for reading
comprehension Reading Math Word decoding
n.r. b = 0.000 n.r.
n.s. n.s. n.s.
Time for math Reading Math Word decoding
n.r. b= 0.000 n.r
n.s.
s at 0.05 n.s.
Muijs & Reynolds (2000)*
Year 1 Language 16 24 656 Multilevel (standardized)
yes *ß = 0.08 *ß = 0.00 *ß = -0.020
0.02 0.23 0.04
s at 0.05 n.s. n.s.
Year 3 16 26 709 *ß = 0.00 *ß =-0.04
0.04 0.04
n.s. n.s.
Year 5 16 28 763 *ß = 0.160 *ß = 0.010
0.06 0.05
s at 0.05 n.s.
Year 1 Pearson correlation no r= 0.050 r= 0.100 r= 0.150
n.s s at 0.05 s at 0.01
Year 3 r=0.213 r=0.050
s at 0.01 n.s.
Year 5 r= 0.20 r=0.100
n.s s at 0.05
Year 1
Structural Equation Modelling
yes ß = 0.047 ß =0.0023 ß = 0.043 ß =0.0023 ß = 0.047 ß = 0.0023
no s at 0.05 n.s.
s at 0.05 n.s.
s at 0.05 n.s.
Year 3
ß = 0.052 ß = 0.006
s at 0.05 n.s

106
Learning time at school
Sample Achievement measure
Nr of schools íncluded
Nr of classes
included
Nr of students included
Statistical technique used
Value added
Effects reported in publication
SE reported
p value reported
ß = 0.052 ß = 0.006
s at 0.05 n.s
Year 5
ß = 0.022 ß = 0.006 ß = 0.022 ß = 0.006
s at 0.05 n.s.
s at 0.05 n.s
Pugh & Teljah (2003)*
Math 135 5259 Clustering-robust linear regression
yes t = 3.610 s at 0.00
Reezigt et al. (1999) Cohort 1988-1990
Language Math
129 258 3762 Multilevel (unstandardized)
yes b = -0.100 n.s.
no s at 0.05 n.s.
Cohort 1990-1992
Language Math
129 258 3466 n.s. n.s.
n.s. n.s.
Cohort 1988-1992
Language Math
127 1531 b = -0.100 n.s.
s at 0.05 n.s.
Taylor et al. (2003)* Reading comprehension
9 88 792 Multilevel (standardized)
yes ß = 0.27 no 0.05
Teodorovic (2011)* Language Math
119 253 4875 Multilevel (standardized)
ß = 0.047 ß = 0.077
0.022 0.022
s at 0.05 s at 0.05
Uroglu & Walberg (1986)*
Reading Math Science
240 240 517
Regression (standardized)
yes *ß = 0.093 *ß = -0.037 *ß = 0.072
no n.s. n.s. n.s.
Reading Math Science
Pearson correlation r = 0.131 r = 0.070 r = 0.050
s at 0.05 n.s. n.s.
Werf (1993)
Math 183 2953 Multilevel (unstandardized)
yes n.r. n.s.
Werf et al. (2001)
Language Math Science
81 1854 Multilevel (unstandardized)
yes b = 0.010 b = -0.010 b = 0.000
0.005 0.005 0.005
s at 0.05 s at 0.05
n.s. * = included in meta-analysis Notes: 1 n.s. = not significant at p = 0.05, 2 standardized with sx and sy ß = bsx/sy,
3n.r. = not reported
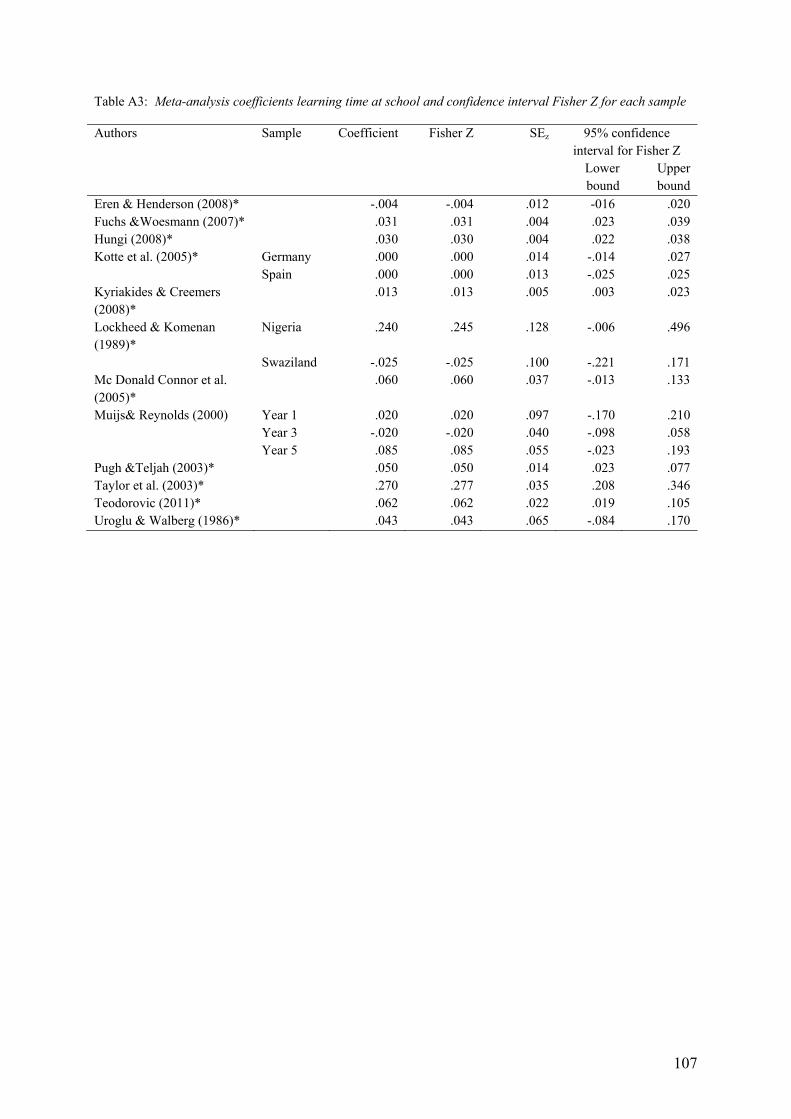
107
Table A3: Meta-analysis coefficients learning time at school and confidence interval Fisher Z for each sample
Authors Sample Coefficient Fisher Z SEz 95% confidence interval for Fisher Z
Lower bound
Upper bound
Eren & Henderson (2008)* -.004 -.004 .012 -016 .020 Fuchs &Woesmann (2007)* .031 .031 .004 .023 .039 Hungi (2008)* .030 .030 .004 .022 .038 Kotte et al. (2005)* Germany .000 .000 .014 -.014 .027 Spain .000 .000 .013 -.025 .025 Kyriakides & Creemers (2008)*
.013 .013 .005 .003 .023
Lockheed & Komenan (1989)*
Nigeria .240 .245 .128 -.006 .496
Swaziland -.025 -.025 .100 -.221 .171 Mc Donald Connor et al. (2005)*
.060 .060 .037 -.013 .133
Muijs& Reynolds (2000) Year 1 .020 .020 .097 -.170 .210 Year 3 -.020 -.020 .040 -.098 .058 Year 5 .085 .085 .055 -.023 .193 Pugh &Teljah (2003)* .050 .050 .014 .023 .077 Taylor et al. (2003)* .270 .277 .035 .208 .346 Teodorovic (2011)* .062 .062 .022 .019 .105 Uroglu & Walberg (1986)* .043 .043 .065 -.084 .170

108
Table A4: Results of vote counts examining the number of negative, non-significant and positive effects of learning time at school on academic achievement for each sample
Study Sample Negative Not significant
Positive Total
Aslam (2011) 1 1 0 2 Bosker et al. (1990) 0 0 1 1 Cameron et al. (2008) 0 1 0 1 D’Agostino (2000) Cohort 1 1 2 1 4 Cohort 3 1 2 1 4 Driessen & Sleegers (2000) 0 2 0 2 Eren & Henderson (2008)* 0 1 0 1 Eren & Millimet (2007) 0 1 0 1 Fuchs & Woesmann (2007)* 1 0 2 3 Harn et al. (2008) 0 1 6 7 Hofman et al. (1999) 0 1 0 1 Hong & Raudenbush (2008) 0 1 2 3 Hungi (2008)* 0 0 2 2 Jong et al. (2004) 0 1 1 2 Kotte et al. (2005)* 2 countries 0 2 0 2 Kyriakides et al. (2000) 0 2 0 2 Kyriakides & Creemers (2008)* 0 0 4 4 Lavy (2010) Study 1 0 0 3 3 Study 2 grade 5 0 0 3 3 Study 2 grade 8 0 3 0 3 Liu et al. (2006) 6 countries 0 3 3 6 Lockheed & Komenan (1989)* 2 countries 0 2 0 2 Lockheed & Longford (1991) 0 1 0 1 Lubienski et al. (2008) Grade 4 0 1 0 1 Grade 8 0 0 1 1 Mc Donald Connor et al. (2005)*
0 4 2 6
Meijnen et al. (2003) 1 9 2 12 Muijs & Reynolds (2000)* Year 1 0 6 6 12 Year 3 0 5 3 8 Year 5 0 4 4 8 Pugh & Teljah (2003)* 0 0 1 1 Reezigt et al. (1999) Cohort 1988-1990 1 1 0 2 Cohort 1990-1992 0 2 0 2 Cohort 1988-1992 1 1 0 2 Taylor et al. (2003)* 0 0 1 1 Teodorovic (2011)* 0 0 2 2 Uroglu & Walberg (1986)* 0 5 1 6 Werf (2001) 1 1 1 3 Werf (1994) 0 1 0 1 Total 8 67 53 128

109
Table A5: Results of vote counts examining the number and percentage of negative, non-significant and positive effects of allocated time, net instruction time and time on task on academic achievement
Negative effects
Non-significant effects
Positive effects
Negative effects
Non-significant effects
Positive effects
Conceptualisation N N N % % % Allocated time 4 25 25 7 46 46 Net instruction time 3 26 12 7 63 29 Time on task 0 15 14 0 52 48 Total 8 67 53 6 52 41
Table A6: Results of vote counts examining the number and percentage of negative, non-significant and positive effects of learning time at school on academic achievement in all subjects, language, mathematics and subjects other than math or language
Negative effects
Non-significant effects
Positive effects
Negative effects
Non-significant effects
Positive effects
Subject N N N % % % All subjects 8 67 53 6 52 41 Subject Math 3 41 33 4 53 43 Subject Language 5 20 15 12 50 38 Subject other than Math or Language 0 3 2 0 60 40

110
Table A7: Results of moderator analyses examining the number and percentage of negative, non-significant and positive effects of learning time at school on academic achievement
Negative effects
Non-significant effects
Positive effects
Negative effects
Non-significant effects
Positive effects
Moderator N N N % % %
Level of schooling Primary school 6 51 41 6 52 42 Secondary school 2 6 12 7 53 40 Country
USA 2 19 16 5 51 43 UK 0 15 13 0 54 46 Netherlands 3 18 4 12 72 16 Country other than USA, UK and Netherlands
2
15
15
6
47
47
Covariates included
Included covariate for student’s prior achievement
4 32 27 6 51 43
Included covariate for ability 4 23 7 12 68 21 Included covariate for SES 8 48 34 9 53 38 Model specification: school and class level variables included in study
Time 1 7 17 4 28 68 Time and Opportunity to Learn 0 0 0 0 0 0 Time and other school/class variables
7
54
31
8
59
34
Time, Opportunity to Learn and other school/class variables
0
6
4
0
60
40
Statistical technique used
Technique multilevel 6 39 24 9 57 35 Technique not multilevel 2 27 24 4 51 45 Total 8 67 53 6 52 41
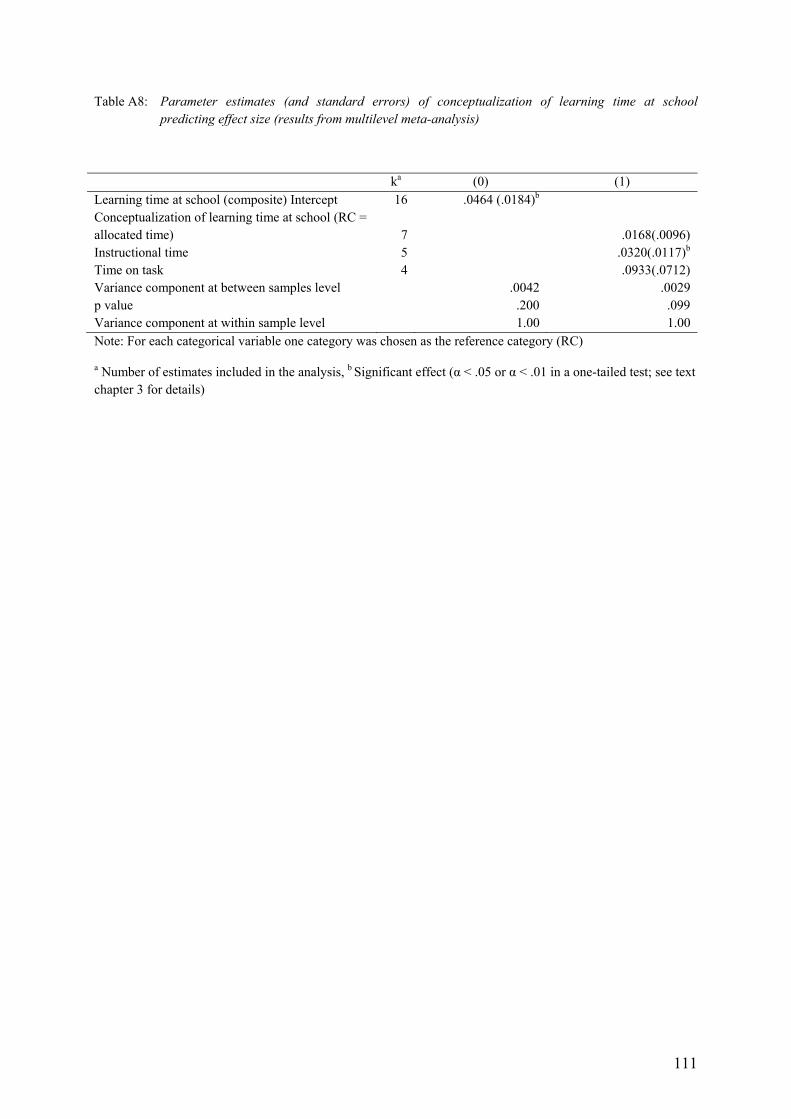
111
Table A8: Parameter estimates (and standard errors) of conceptualization of learning time at school predicting effect size (results from multilevel meta-analysis)
ka (0) (1) Learning time at school (composite) Intercept 16 .0464 (.0184)b Conceptualization of learning time at school (RC = allocated time)
7
.0168(.0096)
Instructional time 5 .0320(.0117)b Time on task 4 .0933(.0712) Variance component at between samples level .0042 .0029 p value .200 .099 Variance component at within sample level 1.00 1.00 Note: For each categorical variable one category was chosen as the reference category (RC)
a Number of estimates included in the analysis, b Significant effect (α < .05 or α < .01 in a one-tailed test; see text chapter 3 for details)

112
Table A9: Other class and school level variables included in studies on the effects of learning time on academic achievement
Learning time at school OTL included1
Definition OTL Classroom level variables included School level variables included Fisher Z
Aslam (2011) No Minutes per week spent in quizzing students, Teacher plans lessons in advance, Teacher explains in class questions, Teachers ask a lot of questions wen teaching
Bosker et al. (1990) Yes Rating by the teacher of the items in the achievement test that are covered by the curriculum
Opportunity to learn, Pressure to achieve, Class climate, Use of evaluative tests, Effective instruction
School size, Comprehensive or categorical, Standardization of rules
Cameron (2008) No
D'Agostino (2000) Yes Mathematics and reading instruction minutes per week
School organizational themes: Stability and orderliness, Social support and shared mission, Decision-making, development and planning
Basic skill instruction, Advanced skill instruction,Between-class grouping, In-class grouping, Opportunity to learn, Homework
Driessen & Sleegers (2000)
No Consistency of teaching approach (overall) and: Homework, Progress registration, Instructional intensity, Attention reading strategy, Test frequency, Checking grade, Checking seriousness, Checking understanding, Checking new assignments’, Checking error analysis, Own capacities, Expectations for students, Emphasis on basic skills,
Eren& Henderson 2008)*
No Homework, Class size -.004
Eren & Millimet (2007) No Class size
Fuchs & Woessmann (2007)*
No .031
Harn et al. (2008) No -
Hofman et al. (1999) No OTL/time: time spent on basics, homework, efficient planning instruction process, diagnostic practice teachers for
Social climate classroom, Instructional climate classroom: quality of instruction and OTL/time, Social context of learning
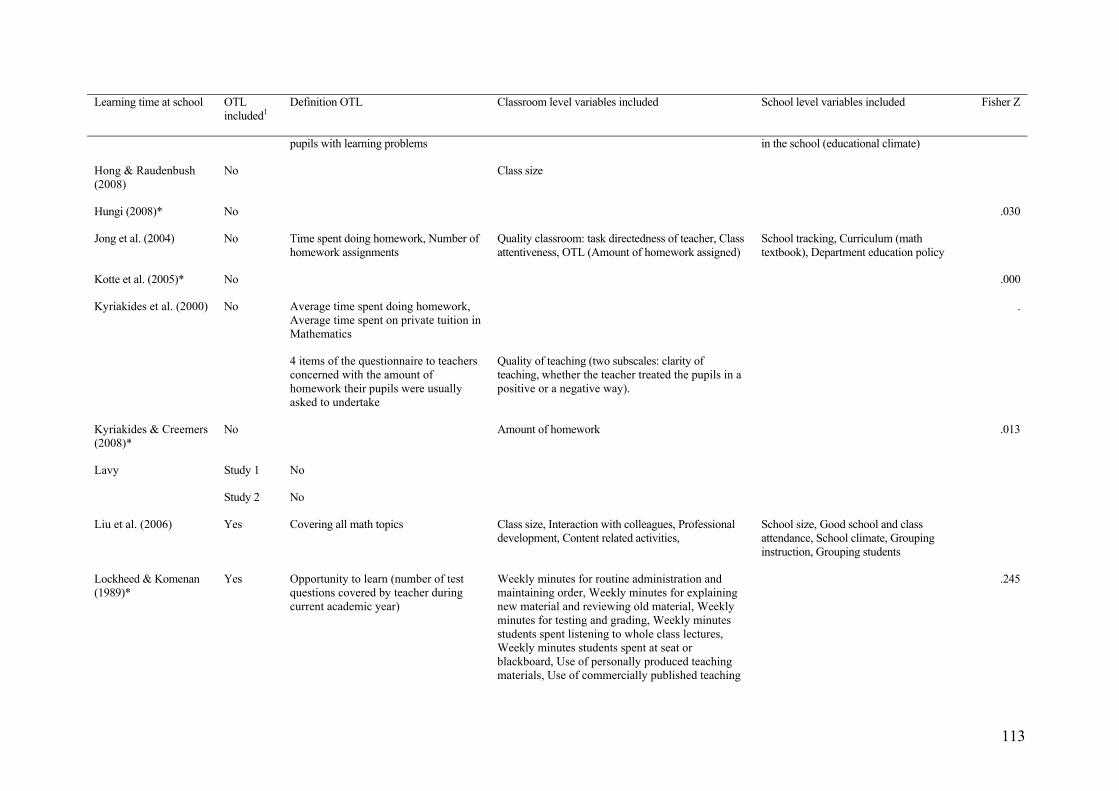
113
Learning time at school OTL included1
Definition OTL Classroom level variables included School level variables included Fisher Z
pupils with learning problems in the school (educational climate)
Hong & Raudenbush (2008)
No Class size
Hungi (2008)* No .030
Jong et al. (2004) No Time spent doing homework, Number of homework assignments
Quality classroom: task directedness of teacher, Class attentiveness, OTL (Amount of homework assigned)
School tracking, Curriculum (math textbook), Department education policy
Kotte et al. (2005)* No .000
Kyriakides et al. (2000) No Average time spent doing homework, Average time spent on private tuition in Mathematics
.
4 items of the questionnaire to teachers concerned with the amount of homework their pupils were usually asked to undertake
Quality of teaching (two subscales: clarity of teaching, whether the teacher treated the pupils in a positive or a negative way).
Kyriakides & Creemers (2008)*
No Amount of homework .013
Lavy Study 1 No
Study 2 No
Liu et al. (2006) Yes Covering all math topics Class size, Interaction with colleagues, Professional development, Content related activities,
School size, Good school and class attendance, School climate, Grouping instruction, Grouping students
Lockheed & Komenan (1989)*
Yes Opportunity to learn (number of test questions covered by teacher during current academic year)
Weekly minutes for routine administration and maintaining order, Weekly minutes for explaining new material and reviewing old material, Weekly minutes for testing and grading, Weekly minutes students spent listening to whole class lectures, Weekly minutes students spent at seat or blackboard, Use of personally produced teaching materials, Use of commercially published teaching
.245

114
Learning time at school OTL included1
Definition OTL Classroom level variables included School level variables included Fisher Z
material
Lockheed & Longford (1991)
No Ability grouping
Class size
Enriched curriculum
Textbooks
Feedback
Time on Administration, Maintaining order, Seat work
Visual materials
Workbooks
School size
Lubienski et al. (2008)
No -
McDonald Connor et al. (2005)*
No .060
Meijnen et al. (2003) No Instruction time: basic cognitive skills (composite score for math, reading, language, and other cognitive-oriented goals), word decoding, reading comprehension, and math
Remedial teaching, Methods used, Evaluation and Monitoring Students’ Performance, Grouping pattern
Muijs & Reynolds (2000)*
No Classroom management, Behaviour management, Direct teaching, Individual practice, Interactive teaching, Constructivist methods, Mathematical language, Varied teaching, Classroom climate, % whole class interactive, % seatwork, % small group work, % whole class lecture, % tranistions
-.020
.020
.085

115
Learning time at school OTL included1
Definition OTL Classroom level variables included School level variables included Fisher Z
Pugh. &Telhaj (2003)* No Class size, Teacher's time spent on scrutiny of exams/tests, Periods scheduled for teacher to counsel students, Teacher's emphasis on understanding concepts in maths, Students with different academic abilities limit teaching in maths class, Disruptive students limit teaching in maths class
.050
Reezigt et al. (1999) Yes 1 item: % of basic subject matter taught
in a school year
Quality of instruction (Curriculum, Grouping procedures), Teacher behavior (Homework, Clear goal setting, Evaluation, Feedback, Corrective instruction, Time for learning), OTL
Rules classroom instruction, Evaluation policy, Professionalization policy, Rules time use, Orderly atmosphere
Taylor et al. (2003)* No Higher level questioning, Time-on-task .277
Teodorovic (2011)* Geen OTL Student assessment and feedback(Reliance on less direct assessment methods to assign a grade, Reliance on student social behaviour to assign a grade, Teachers’ feedback, Frequency of grading homework), Student and teacher social and academic interaction, Classroom climate
.062
Uguroglu& Walberg (1986)*
No Home environment, Motivation, Media, Peer group, Social environment, Quality of instruction, Pre motivation subscales
.043
Werf, Creemers & Guldemond (2001)
No Homework, Presentation of content, Pupils working, Other activities, Quality of instruction, Innovative teaching, Frequency of testing, Use of test results, Pupils’ attention, Questioning, Comprehensive questions, Monitoring work, Grouping of pupils
Management/evaluation (..), Books and learning materials (..), Parental involvement (..)
Werf (1994) Yes % of content covered Curriculum, Grouping of pupils, Quality of teaching, OTL
School organization, School policy
Notes: *Study included in meta-analysis, 1 OTL: Opportunity to learn included in study

116
Table A10: Overview of studies of homework (pupil level) on student achievement
Homework (pupil level)
Sample Country School type1
Homework measure Operationalisation Concept Outcome measure
Burkam et al. (1995) USA S Time on homework Homework time Physical science achievement, Life science achievement
Chen & Lu (2009)* Taiwan S Daily homework hours in 11th grade
Homework time Composite score of four curriculum-free ability subtests: an analytical ability subtest, a mathematical ability subtest, alanguage ability subtest, and a science ability subtest
Dettmers et al. (2009) 40 countries
Time spent on math homework in a week
Homework time PISA 2003 Mathematics achievement test
6 countries Time spent on math homework in a week
Homework time PISA 2003 Mathematics achievement test
Dettmers et al. (2010)*
Germany S Time spent on mathematics homework in a week
Homework time Test covering the standard content stipulated in the federal states’ of Germany curricula for Grade 10 mathematics
Engin-Demer (2009)* Turkey S Level of homework completion
How often do you do your homework? 3 = often, 2 = sometimes, 1 = seldom and never
Homework frequency
Grade: A weighted composite of the math, Turkish and science achievement scores of related semester
Flowers & Flowers (2009)*
USA S Hours spent doing homework
A categorical variable based on students’ self-reported assessment of the amount of time they spent doing their homework
Homework time Reading test score from Educational Longitudinal Study (2002)
Fuchs & Woesmann (2007)
31 countries S Homework subject >1 and < 3 hours per week, Homework subject > 3 hours per week (math, science, reading)
Homework time PISA 2000 math international test score, PISA 2000 science international test score. PISA 2000 reading international test score
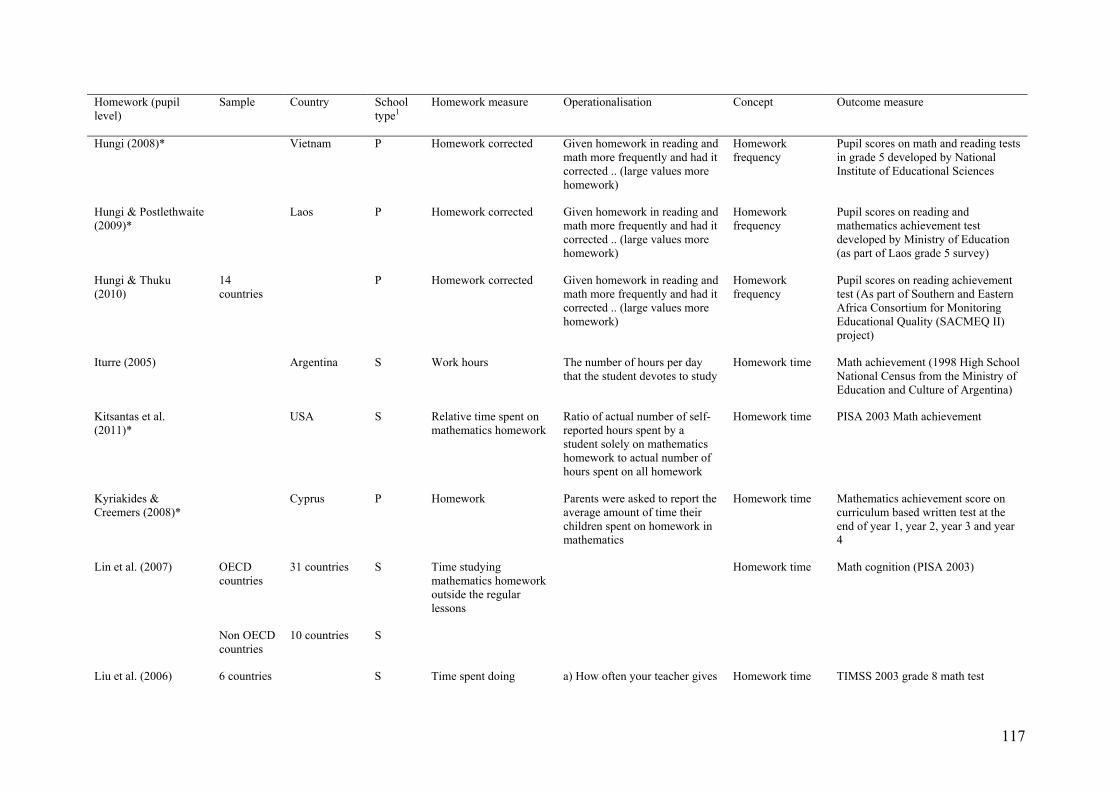
117
Homework (pupil level)
Sample Country School type1
Homework measure Operationalisation Concept Outcome measure
Hungi (2008)* Vietnam P Homework corrected Given homework in reading and math more frequently and had it corrected .. (large values more homework)
Homework frequency
Pupil scores on math and reading tests in grade 5 developed by National Institute of Educational Sciences
Hungi & Postlethwaite (2009)*
Laos P Homework corrected Given homework in reading and math more frequently and had it corrected .. (large values more homework)
Homework frequency
Pupil scores on reading and mathematics achievement test developed by Ministry of Education (as part of Laos grade 5 survey)
Hungi & Thuku (2010)
14 countries
P Homework corrected Given homework in reading and math more frequently and had it corrected .. (large values more homework)
Homework frequency
Pupil scores on reading achievement test (As part of Southern and Eastern Africa Consortium for Monitoring Educational Quality (SACMEQ II) project)
Iturre (2005)
Argentina S Work hours The number of hours per day that the student devotes to study
Homework time Math achievement (1998 High School National Census from the Ministry of Education and Culture of Argentina)
Kitsantas et al. (2011)*
USA S Relative time spent on mathematics homework
Ratio of actual number of self-reported hours spent by a student solely on mathematics homework to actual number of hours spent on all homework
Homework time PISA 2003 Math achievement
Kyriakides & Creemers (2008)*
Cyprus P Homework Parents were asked to report the average amount of time their children spent on homework in mathematics
Homework time Mathematics achievement score on curriculum based written test at the end of year 1, year 2, year 3 and year 4
Lin et al. (2007) OECD countries
31 countries S Time studying mathematics homework outside the regular lessons
Homework time Math cognition (PISA 2003)
Non OECD countries
10 countries S
Liu et al. (2006) 6 countries S Time spent doing a) How often your teacher gives Homework time TIMSS 2003 grade 8 math test
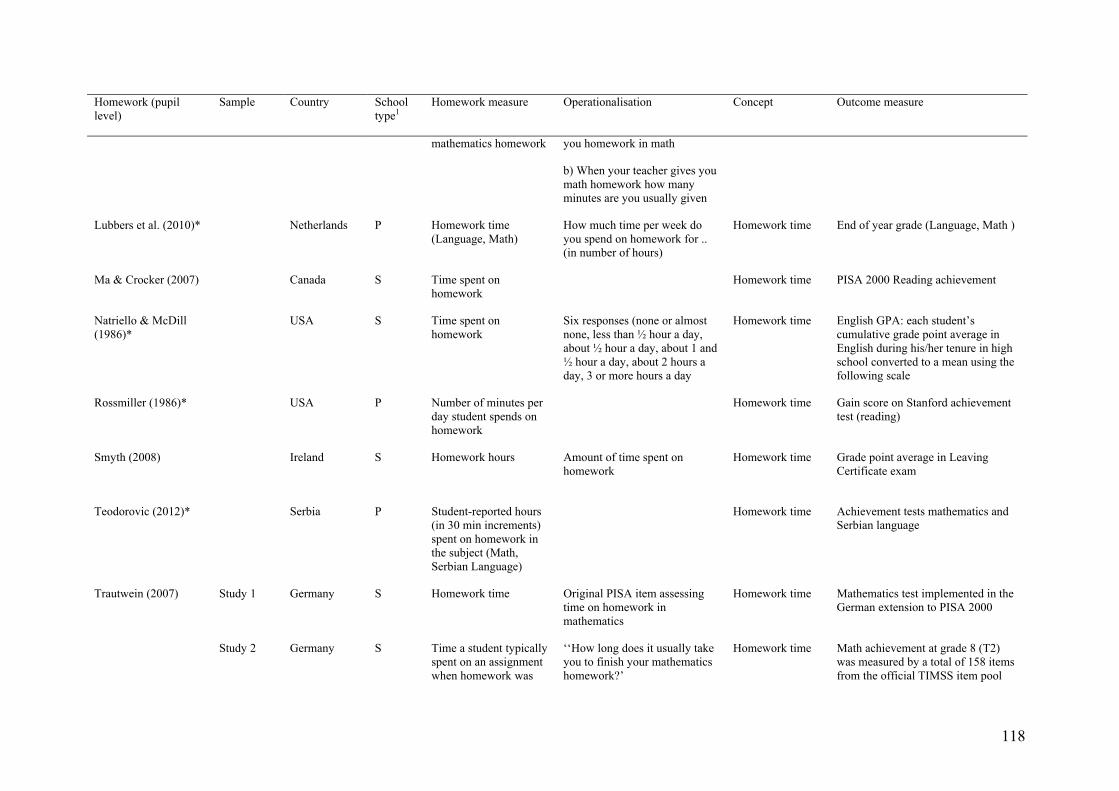
118
Homework (pupil level)
Sample Country School type1
Homework measure Operationalisation Concept Outcome measure
mathematics homework you homework in math
b) When your teacher gives you math homework how many minutes are you usually given
Lubbers et al. (2010)* Netherlands P Homework time (Language, Math)
How much time per week do you spend on homework for .. (in number of hours)
Homework time End of year grade (Language, Math )
Ma & Crocker (2007) Canada S Time spent on homework
Homework time PISA 2000 Reading achievement
Natriello & McDill (1986)*
USA S Time spent on homework
Six responses (none or almost none, less than ½ hour a day, about ½ hour a day, about 1 and ½ hour a day, about 2 hours a day, 3 or more hours a day
Homework time English GPA: each student’s cumulative grade point average in English during his/her tenure in high school converted to a mean using the following scale
Rossmiller (1986)* USA P Number of minutes per day student spends on homework
Homework time Gain score on Stanford achievement test (reading)
Smyth (2008)
Ireland S Homework hours Amount of time spent on homework
Homework time Grade point average in Leaving Certificate exam
Teodorovic (2012)* Serbia P Student-reported hours (in 30 min increments) spent on homework in the subject (Math, Serbian Language)
Homework time Achievement tests mathematics and Serbian language
Trautwein (2007) Study 1 Germany
S Homework time Original PISA item assessing time on homework in mathematics
Homework time Mathematics test implemented in the German extension to PISA 2000
Study 2
Germany
S Time a student typically spent on an assignment when homework was
‘‘How long does it usually take you to finish your mathematics homework?’
Homework time Math achievement at grade 8 (T2) was measured by a total of 158 items from the official TIMSS item pool
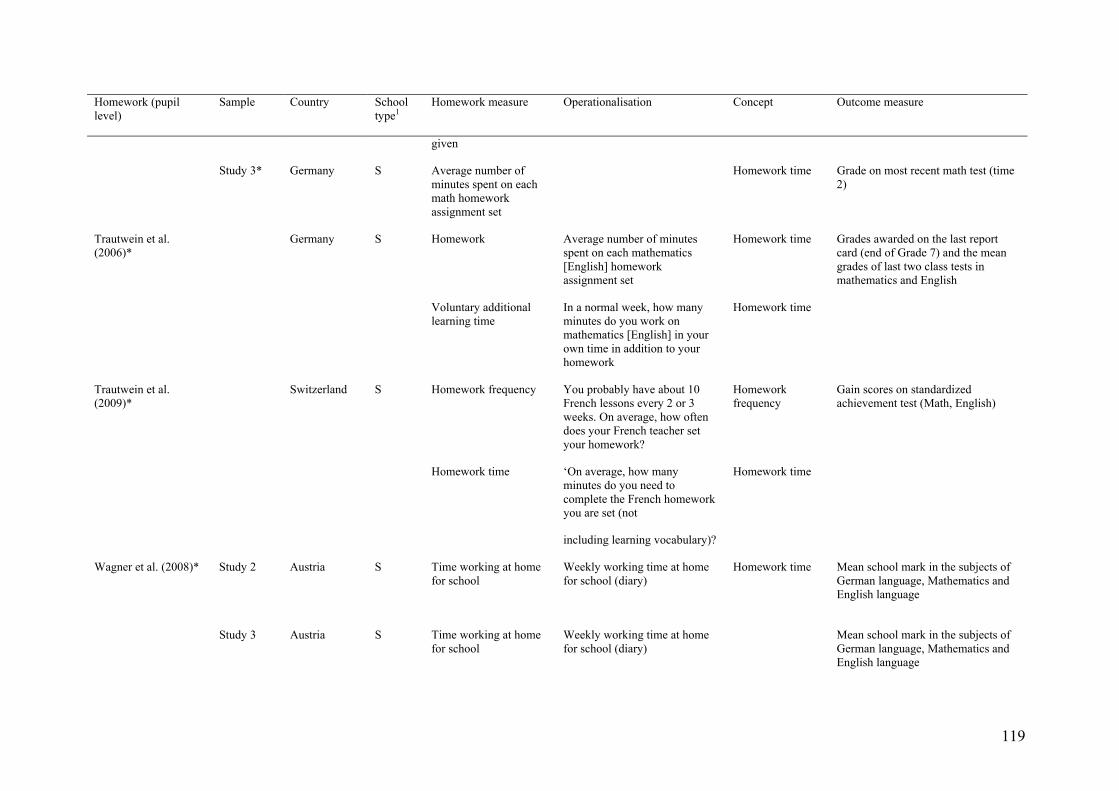
119
Homework (pupil level)
Sample Country School type1
Homework measure Operationalisation Concept Outcome measure
given
Study 3* Germany S Average number of minutes spent on each math homework assignment set
Homework time Grade on most recent math test (time 2)
Trautwein et al. (2006)*
Germany S Homework
Average number of minutes spent on each mathematics [English] homework assignment set
Homework time Grades awarded on the last report card (end of Grade 7) and the mean grades of last two class tests in mathematics and English
Voluntary additional learning time
In a normal week, how many minutes do you work on mathematics [English] in your own time in addition to your homework
Homework time
Trautwein et al. (2009)*
Switzerland S Homework frequency You probably have about 10 French lessons every 2 or 3 weeks. On average, how often does your French teacher set your homework?
Homework frequency
Gain scores on standardized achievement test (Math, English)
Homework time ‘On average, how many minutes do you need to complete the French homework you are set (not
including learning vocabulary)?
Homework time
Wagner et al. (2008)* Study 2 Austria S Time working at home for school
Weekly working time at home for school (diary)
Homework time Mean school mark in the subjects of German language, Mathematics and English language
Study 3 Austria S Time working at home for school
Weekly working time at home for school (diary)
Mean school mark in the subjects of German language, Mathematics and English language

120
Homework (pupil level)
Sample Country School type1
Homework measure Operationalisation Concept Outcome measure
Won & Han (2010)* Korea S Doing homework Amount of time Mean of five mathematics test scores provided in TIMSS data
USA
Notes: * study is included in meta-analysis, 1 P = primary, S = secondary school
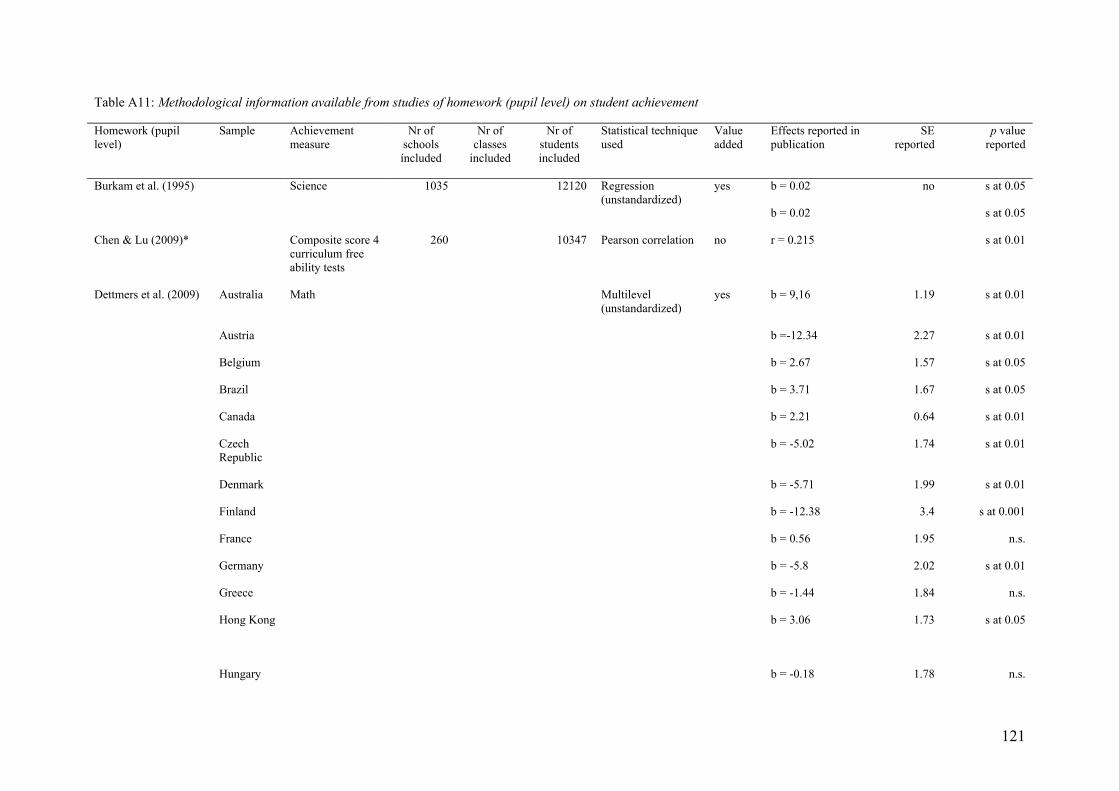
121
Table A11: Methodological information available from studies of homework (pupil level) on student achievement
Homework (pupil level)
Sample Achievement measure
Nr of schools íncluded
Nr of classes
included
Nr of students included
Statistical technique used
Value added
Effects reported in publication
SE reported
p value reported
Burkam et al. (1995)
Science
1035 12120 Regression (unstandardized)
yes b = 0.02
b = 0.02
no s at 0.05
s at 0.05
Chen & Lu (2009)* Composite score 4 curriculum free ability tests
260 10347 Pearson correlation no r = 0.215 s at 0.01
Dettmers et al. (2009) Australia Math Multilevel (unstandardized)
yes b = 9,16 1.19 s at 0.01
Austria b =-12.34 2.27 s at 0.01
Belgium b = 2.67 1.57 s at 0.05
Brazil b = 3.71 1.67 s at 0.05
Canada b = 2.21 0.64 s at 0.01
Czech Republic
b = -5.02 1.74 s at 0.01
Denmark b = -5.71 1.99 s at 0.01
Finland b = -12.38 3.4 s at 0.001
France b = 0.56 1.95 n.s.
Germany b = -5.8 2.02 s at 0.01
Greece b = -1.44 1.84 n.s.
Hong Kong
b = 3.06 1.73 s at 0.05
Hungary b = -0.18 1.78 n.s.

122
Homework (pupil level)
Sample Achievement measure
Nr of schools íncluded
Nr of classes
included
Nr of students included
Statistical technique used
Value added
Effects reported in publication
SE reported
p value reported
Iceland b = -1.5 2.79 n.s.
Ireland b = 0.82 2.55 n.s.
Italy b = -1.93 0.91 s at 0.05
Japan b = 2.36 1.12 s at 0.05
Korea b = 5.81 1.46 s at 0.001
Latvia b = -0.72 2 n.s.
Liechten-stein
b = -6.31 9.89 n.s.
Luxem-bourg
b = =6.67 3.1 s at 0.05
Macao b = 4.81 3.38 n.s.
Mexico b = 6.67 0.55 s at 0.01
Nether-lands
b = -4.73 2.12 s at 0.05
New Zealand
b = 2.21 2.15 n.s.
Norway b = -1.24 3.08 n.s.
Poland b = 6.08 1.57 s at 0.01
Portugal b = 1.09 2.88 n.s.
Russia b = -0.39 1.25 n.s.
Slovak Republic
b = -4.40 1.26 s at 0.001

123
Homework (pupil level)
Sample Achievement measure
Nr of schools íncluded
Nr of classes
included
Nr of students included
Statistical technique used
Value added
Effects reported in publication
SE reported
p value reported
Spain b = 6.1 1.33 s at 0.001
Sweden b = -16.89 2.2 s at 0.001
Switzer-land
b = -14.09 1.45 s at 0.001
Thailand b = 7.24 1.07 s at 0.001
Tunesia b = 2.6 1.64 n.s.
Turkey b = -1.14 2.15 n.s.
United Kingdom
b = -1.45 1.35 n.s.
USA b = 3.29 1.46 s at 0.05
Uruguay b =-0.31 1.15 n.s.
Yugoslavia b = 0.8 1.65 n.s.
Austria Math 100 1682 Multilevel (unstandardized)
yes b = -5.87 4.46 n.s.
Belgium 146 3347 b =-3.62 2.95 n.s.
Germany 154 6294 b =-0.04 1.75 n.s.
Japan 144 4161 b = 3.59 2.98 n.s.
Korea 138 4555 b = -3.82 1.59 s at 0.01
USA 251 2651 b = -0.02 0.03 n.s.
Dettmers et al. (2010)*
Math 155 3483 Multilevel (standardized)
yes ß = -0.02 0.017 n.s.
Engin-Demer (2009)* Grade: weighted composite of
23 719 Regression yes ß = 0.06 no n.s.
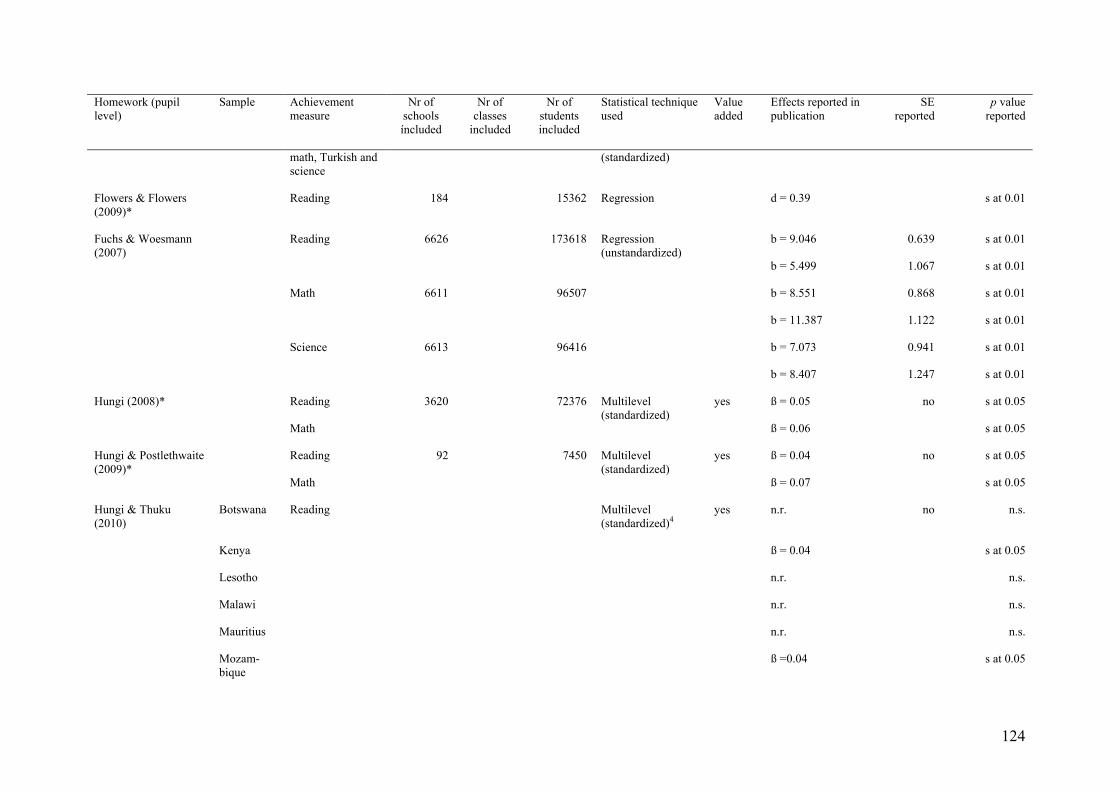
124
Homework (pupil level)
Sample Achievement measure
Nr of schools íncluded
Nr of classes
included
Nr of students included
Statistical technique used
Value added
Effects reported in publication
SE reported
p value reported
math, Turkish and science
(standardized)
Flowers & Flowers (2009)*
Reading 184 15362 Regression d = 0.39 s at 0.01
Fuchs & Woesmann (2007)
Reading
Math
Science
6626
6611
6613
173618
96507
96416
Regression (unstandardized)
b = 9.046
b = 5.499
b = 8.551
b = 11.387
b = 7.073
b = 8.407
0.639
1.067
0.868
1.122
0.941
1.247
s at 0.01
s at 0.01
s at 0.01
s at 0.01
s at 0.01
s at 0.01
Hungi (2008)* Reading
Math
3620 72376 Multilevel (standardized)
yes ß = 0.05
ß = 0.06
no s at 0.05
s at 0.05
Hungi & Postlethwaite (2009)*
Reading
Math
92 7450 Multilevel (standardized)
yes ß = 0.04
ß = 0.07
no s at 0.05
s at 0.05
Hungi & Thuku (2010)
Botswana Reading Multilevel (standardized)4
yes n.r. no n.s.
Kenya ß = 0.04 s at 0.05
Lesotho n.r. n.s.
Malawi n.r. n.s.
Mauritius n.r. n.s.
Mozam-bique
ß =0.04 s at 0.05

125
Homework (pupil level)
Sample Achievement measure
Nr of schools íncluded
Nr of classes
included
Nr of students included
Statistical technique used
Value added
Effects reported in publication
SE reported
p value reported
Namibia n.r. n.s.
Seychelles n.r. n.s.
South Africa
n.r. n.s.
Swaziland n.r. n.s.
Tanzania ß =0.04 s at 0.05
Uganda n.r. n.s.
Zambia ß = 0.05 s at 0.05
Zanzibar ß =0.06 s at 0.05
Iturre (2005) Math 2708 134939 Multilevel b = -0.032 no s at 0,01
Kitsantas et al. (2011)*
Math 221 5200 Multilevel (standardized)
yes *ß = -0.08 no s at 0.001
Pearson correlation r = -0.17 s at 0.001
Kyriakides & Creemers (2008)*
Math 28 61 1662
1614
1592
1579
Multilevel (unstandardized)2
yes b = 0.02
b = 0.05
b = 0.07
b = 0.07
0.02
0.02
0.03
0.02
n.s.
s at 0.05
s at 0.05
s at 0.05
Lin et al. (2007) OECD countries
Math 270000 Multilevel (unstandardized)
no b = -0.086
0.042 n.s.
Non OECD countries
Math 270000 no b = -0.002
0.071 n.s.
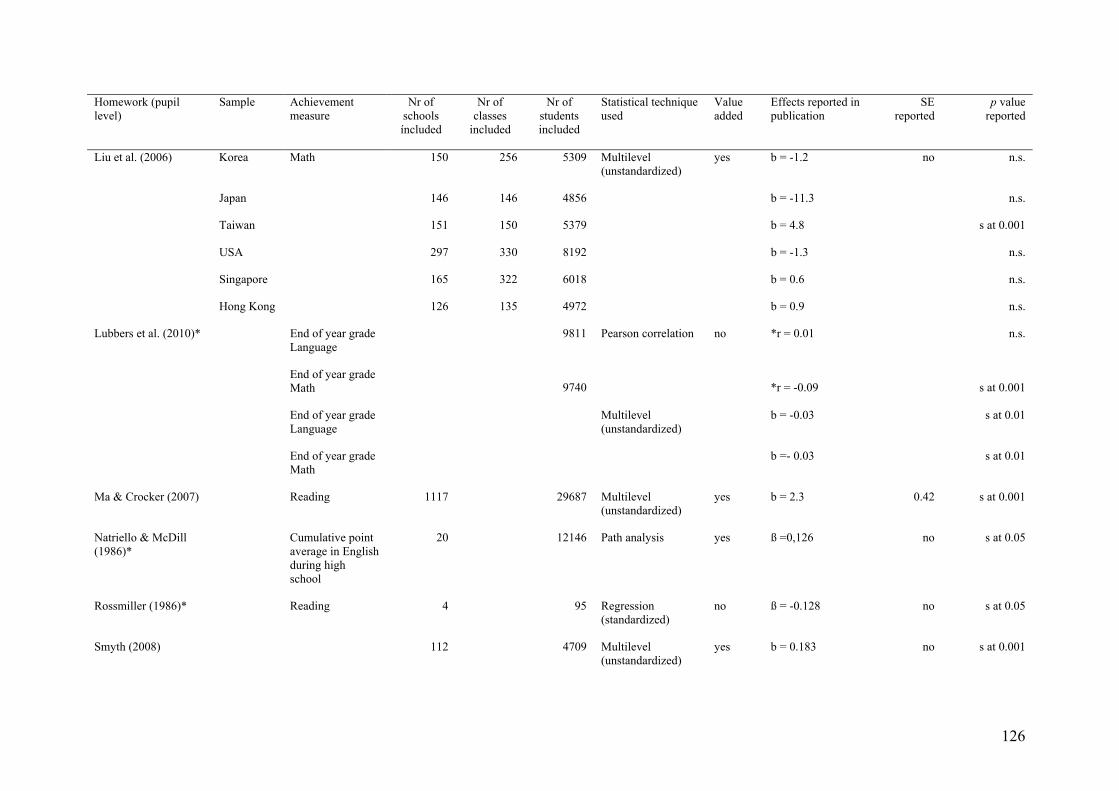
126
Homework (pupil level)
Sample Achievement measure
Nr of schools íncluded
Nr of classes
included
Nr of students included
Statistical technique used
Value added
Effects reported in publication
SE reported
p value reported
Liu et al. (2006) Korea Math 150 256 5309 Multilevel (unstandardized)
yes b = -1.2 no n.s.
Japan 146 146 4856 b = -11.3 n.s.
Taiwan 151 150 5379 b = 4.8 s at 0.001
USA 297 330 8192 b = -1.3 n.s.
Singapore 165 322 6018 b = 0.6 n.s.
Hong Kong 126 135 4972 b = 0.9 n.s.
Lubbers et al. (2010)* End of year grade Language
End of year grade Math
9811
9740
Pearson correlation no *r = 0.01
*r = -0.09
n.s.
s at 0.001
End of year grade Language
Multilevel (unstandardized)
b = -0.03 s at 0.01
End of year grade Math
b =- 0.03 s at 0.01
Ma & Crocker (2007) Reading 1117 29687 Multilevel (unstandardized)
yes b = 2.3 0.42 s at 0.001
Natriello & McDill (1986)*
Cumulative point average in English during high school
20 12146 Path analysis yes ß =0,126 no s at 0.05
Rossmiller (1986)* Reading 4 95 Regression (standardized)
no ß = -0.128 no s at 0.05
Smyth (2008) 112 4709 Multilevel (unstandardized)
yes b = 0.183
no s at 0.001
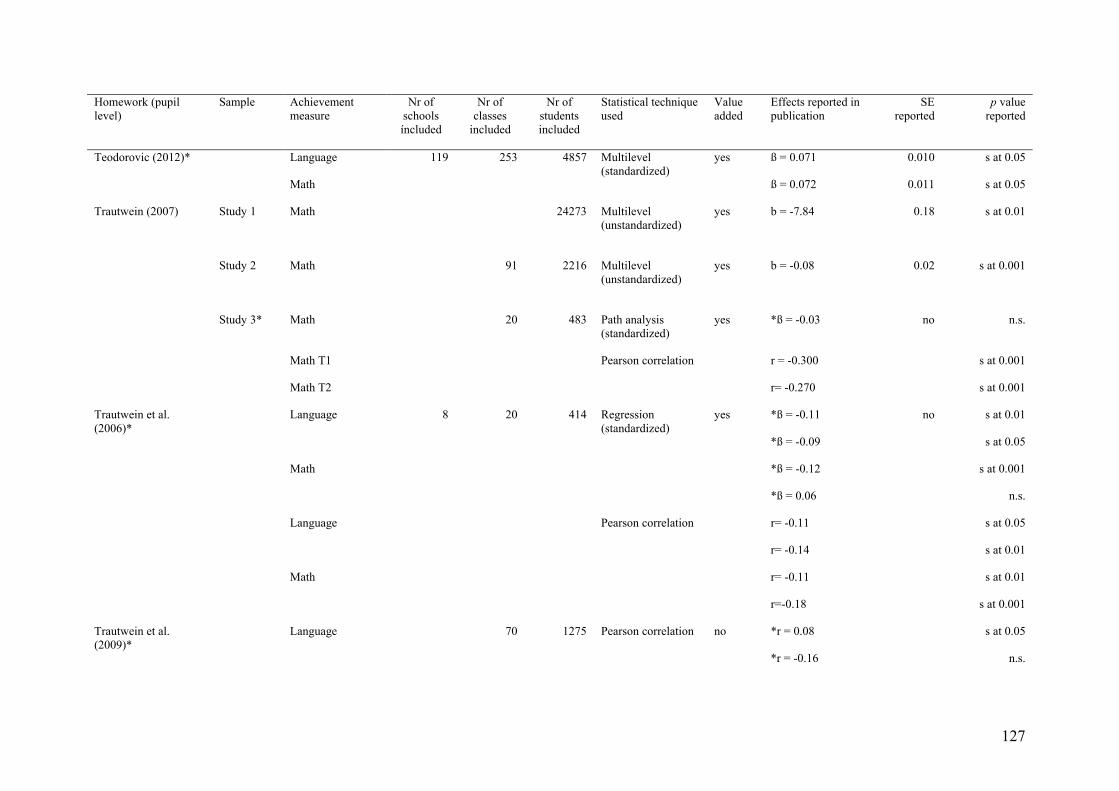
127
Homework (pupil level)
Sample Achievement measure
Nr of schools íncluded
Nr of classes
included
Nr of students included
Statistical technique used
Value added
Effects reported in publication
SE reported
p value reported
Teodorovic (2012)* Language
Math
119 253 4857 Multilevel (standardized)
yes ß = 0.071
ß = 0.072
0.010
0.011
s at 0.05
s at 0.05
Trautwein (2007) Study 1
Math 24273 Multilevel (unstandardized)
yes b = -7.84
0.18 s at 0.01
Study 2
Math 91 2216 Multilevel (unstandardized)
yes b = -0.08
0.02 s at 0.001
Study 3* Math 20 483 Path analysis (standardized)
yes *ß = -0.03 no n.s.
Math T1
Math T2
Pearson correlation r = -0.300
r= -0.270
s at 0.001
s at 0.001
Trautwein et al. (2006)*
Language
Math
8 20 414 Regression (standardized)
yes *ß = -0.11
*ß = -0.09
*ß = -0.12
*ß = 0.06
no s at 0.01
s at 0.05
s at 0.001
n.s.
Language
Pearson correlation r= -0.11
r= -0.14
s at 0.05
s at 0.01
Math r= -0.11
r=-0.18
s at 0.01
s at 0.001
Trautwein et al. (2009)*
Language 70 1275 Pearson correlation no *r = 0.08
*r = -0.16
s at 0.05
n.s.

128
Homework (pupil level)
Sample Achievement measure
Nr of schools íncluded
Nr of classes
included
Nr of students included
Statistical technique used
Value added
Effects reported in publication
SE reported
p value reported
Multilevel (unstandardized)
yes b = -0.07 0.02 s at 0.01
Wagner et al. (2008)* Study 2 Mean school mark in German language, Math and English language
246 Pearson correlation no r = 0.15
s at 0.05
Study 3 Mean school mark (see above)
342 Pearson correlation no r = 0.11 s at 0.05.
Won & Han (2010)* Korea Mean of five mathematics test scores provided in TIMSS data
4918 Regression (standardized)
yes ß = -0.13
no s at 0.001
USA 6772 ß = -0.02
s at 0.001
Notes: 1 n.s. = not significant at p = 0.05, 2 standardized with sx and sy ß = bsx/sy, 3 n.r. = not reported, 4 many coefficients not significant and not reported, therefore not
included in meta-analysis

129
Table A12: Overview of studies of homework (at class/school level) on student achievement
Homework (at class/school level)
Sample Country School type1
Homework measure Operationalisation Concept Outcome measure
Chubb & Moe (1990) USA S Amount of homework assigned
Mean minutes of homework assigned per subject daily
Homework time Total gain in student achievement
D’Agostino Cohort 1
Cohort 3
USA P Homework Homework measured by asking teachers about how much homework they assign in the nearest hour
Amount of homework
CBTS Reading test initial score and learning rate
Dettmers et al. (2009) 40 countries
S Time spent on math homework (school average homework time)
Average time spent on mathematics homework per week in a given school
Homework time PISA 2003 Mathematics achievement test
6 countries
Eren & Henderson (2008)
USA S Hours of homework assigned by the teacher
Homework time 10 th grade math test score
Fehrmann et al. (1987) USA S Time spent on homework a week
Homework time Grades so far in high school (standardized scale)
Hofman et al. (1999)
Netherlands P Homework Measuring the degree of homework setting by teacher
Amount of homework
Standardized achievement test math
House (2005)*
Japan Japan S How often does this happen in your science lesson: The teacher gives us homework
Homework frequency
Science achievement TIMSS 1999
Hong Kong Hong Kong
Taiwan Taiwan
Hungi (2008)* Vietnam P Average homework corrected
Pupils in school where more homework was given and corrected frequently .. (large values more homework)
Homework frequency
Pupil scores on math and reading tests in grade 5 developed by National Institute of Educational Sciences
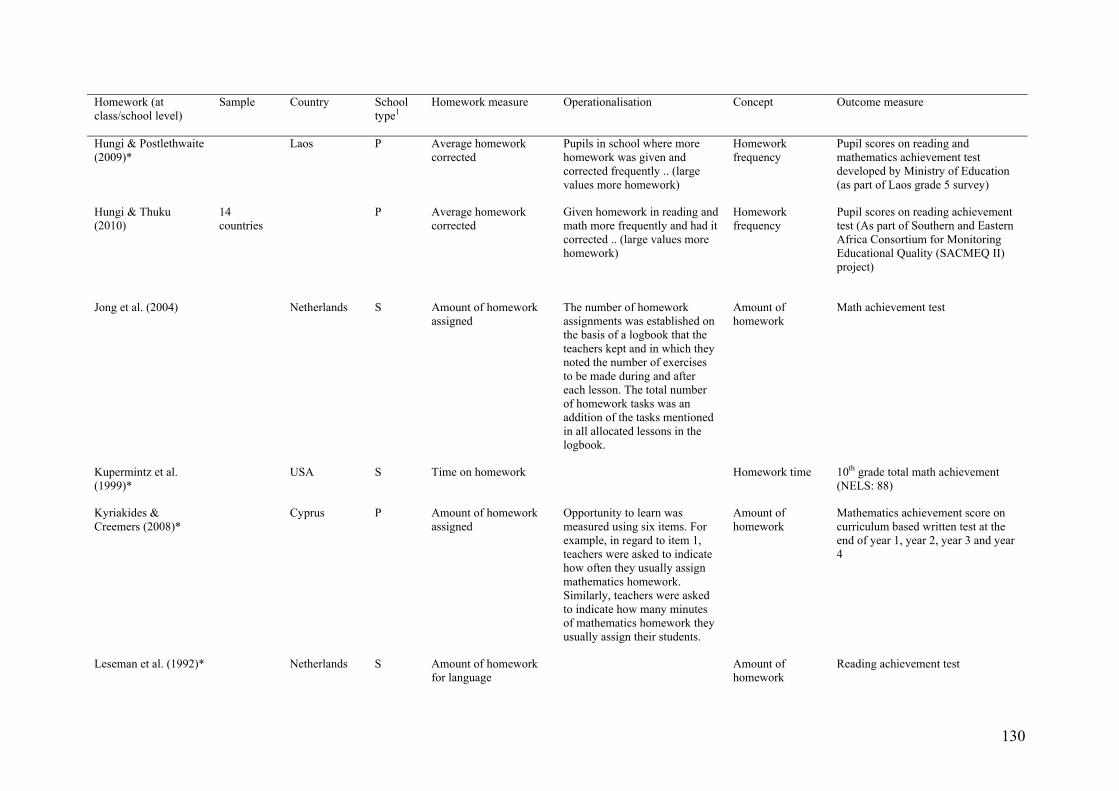
130
Homework (at class/school level)
Sample Country School type1
Homework measure Operationalisation Concept Outcome measure
Hungi & Postlethwaite (2009)*
Laos P Average homework corrected
Pupils in school where more homework was given and corrected frequently .. (large values more homework)
Homework frequency
Pupil scores on reading and mathematics achievement test developed by Ministry of Education (as part of Laos grade 5 survey)
Hungi & Thuku (2010)
14 countries
P Average homework corrected
Given homework in reading and math more frequently and had it corrected .. (large values more homework)
Homework frequency
Pupil scores on reading achievement test (As part of Southern and Eastern Africa Consortium for Monitoring Educational Quality (SACMEQ II) project)
Jong et al. (2004)
Netherlands
S Amount of homework assigned
The number of homework assignments was established on the basis of a logbook that the teachers kept and in which they noted the number of exercises to be made during and after each lesson. The total number of homework tasks was an addition of the tasks mentioned in all allocated lessons in the logbook.
Amount of homework
Math achievement test
Kupermintz et al. (1999)*
USA S Time on homework Homework time 10th grade total math achievement (NELS: 88)
Kyriakides & Creemers (2008)*
Cyprus P Amount of homework assigned
Opportunity to learn was measured using six items. For example, in regard to item 1, teachers were asked to indicate how often they usually assign mathematics homework. Similarly, teachers were asked to indicate how many minutes of mathematics homework they usually assign their students.
Amount of homework
Mathematics achievement score on curriculum based written test at the end of year 1, year 2, year 3 and year 4
Leseman et al. (1992)* Netherlands S Amount of homework for language
Amount of homework
Reading achievement test

131
Homework (at class/school level)
Sample Country School type1
Homework measure Operationalisation Concept Outcome measure
Liu et al. (2006) 6 countries
S Teachers’ emphasis on mathematics homework
Do you assign math homework to the TIMSS class How many minutes do you usually assign math homework
Homework time TIMSS 2003 grade 8 math test
Luyten & De Jong (1998)
Netherlands Number of homework assignments per week
Students were asked to indicate how many times a week their teacher gave homework assignments Teachers were asked how many assignments the students were supposed to make each time they set homework
Homework frequency
Mathematics achievement test
Reezigt (1993) Grade 6
Grade 8
Netherlands P Frequency of homework
Homework frequency
Language and Math achievement tests
Reezigt et al. (1999) Cohort 1988-1990
Cohort 1990-1992
Cohort 1988-1992
Netherlands P Homework Frequency of homework Homework frequency
Evaluation of the Dutch Educational Priority Policy (Language achievement, Math achievement)
Saba & Hamouri (2010)
Jordan S Math homework
Science Homework
TIMSS 2007 Math achievement
TIMSS 2007 Science achievement
Trautwein et al. (2002)*
Germany P Frequency of homework assignment
How often are you usually assigned math homework
Homework frequency
FIMS and SIMS mathematics achievement Test
Homework length The time a student typically spent on an assignment when homework was given:"How long does it usually take you to finish your math homework?
Homework time
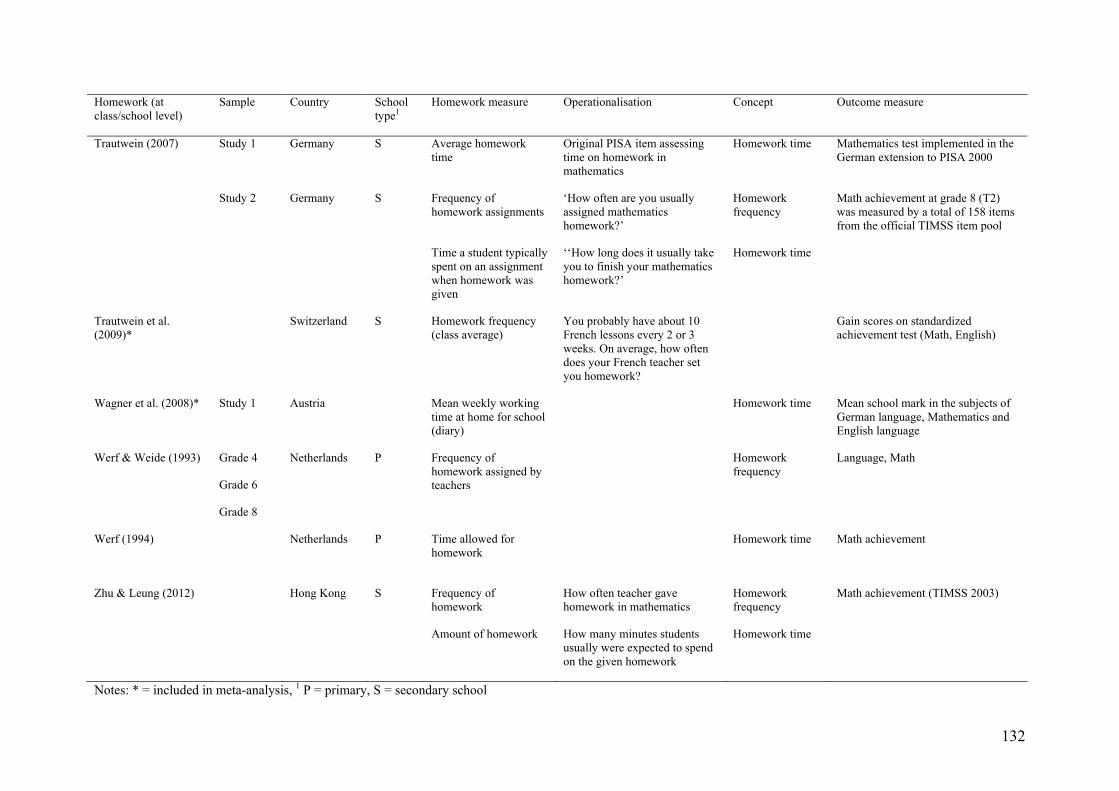
132
Homework (at class/school level)
Sample Country School type1
Homework measure Operationalisation Concept Outcome measure
Trautwein (2007) Study 1
Germany
S Average homework time
Original PISA item assessing time on homework in mathematics
Homework time Mathematics test implemented in the German extension to PISA 2000
Study 2
Germany
S Frequency of homework assignments
‘How often are you usually assigned mathematics homework?’
Homework frequency
Math achievement at grade 8 (T2) was measured by a total of 158 items from the official TIMSS item pool
Time a student typically spent on an assignment when homework was given
‘‘How long does it usually take you to finish your mathematics homework?’
Homework time
Trautwein et al. (2009)*
Switzerland S Homework frequency (class average)
You probably have about 10 French lessons every 2 or 3 weeks. On average, how often does your French teacher set you homework?
Gain scores on standardized achievement test (Math, English)
Wagner et al. (2008)* Study 1 Austria Mean weekly working time at home for school (diary)
Homework time Mean school mark in the subjects of German language, Mathematics and English language
Werf & Weide (1993) Grade 4
Grade 6
Grade 8
Netherlands P Frequency of homework assigned by teachers
Homework frequency
Language, Math
Werf (1994)
Netherlands P Time allowed for homework
Homework time Math achievement
Zhu & Leung (2012)
Hong Kong S Frequency of homework
Amount of homework
How often teacher gave homework in mathematics
How many minutes students usually were expected to spend on the given homework
Homework frequency
Homework time
Math achievement (TIMSS 2003)
Notes: * = included in meta-analysis, 1 P = primary, S = secondary school

133
Table A13: Methodological information available from studies of homework (at class/school level) on student achievement
Homework (at class/school level)
Sample Achievement measure
Nr of schools íncluded
Nr of classes
included
Nr of students included
Statistical technique used
Value added
Effects reported in publication
SE reported
p value reported
Chubb & Moe (1990)
Composite 200 Regression (unstandardized)
yes b =0.016 0.004 s at 0.005
D’Agostino Cohort 1
Language
Math
134 3308 Multilevel (unstandardized)
yes b =- 0.02
b = 0.15
nr
nr
no n.s.
s at 0.05
n.s.
n.s.
Cohort 3
Language
Math
124 3203 b = 0.07
b = 0.07
b = -0.1
b = 0.24
n.s.
n.s.
n.s.
s at 0.001
Dettmers et al. (2009) Australia Math Multilevel (unstandardized)
yes b =6.08 2.41 s at 0.01
Austria b = -2.46 5.71 n.s.
Belgium b =17.49 3.96 s at 0.001
Brazil b =-1.12 4.05 n.s.
Canada b =6.16 1.29 s at 0.001
Czech Republic
b =12.95 4.21 s at 0.001
Denmark b = 6.66 3.57 s at 0.05
Finland b =6.23 5.18 n.s.
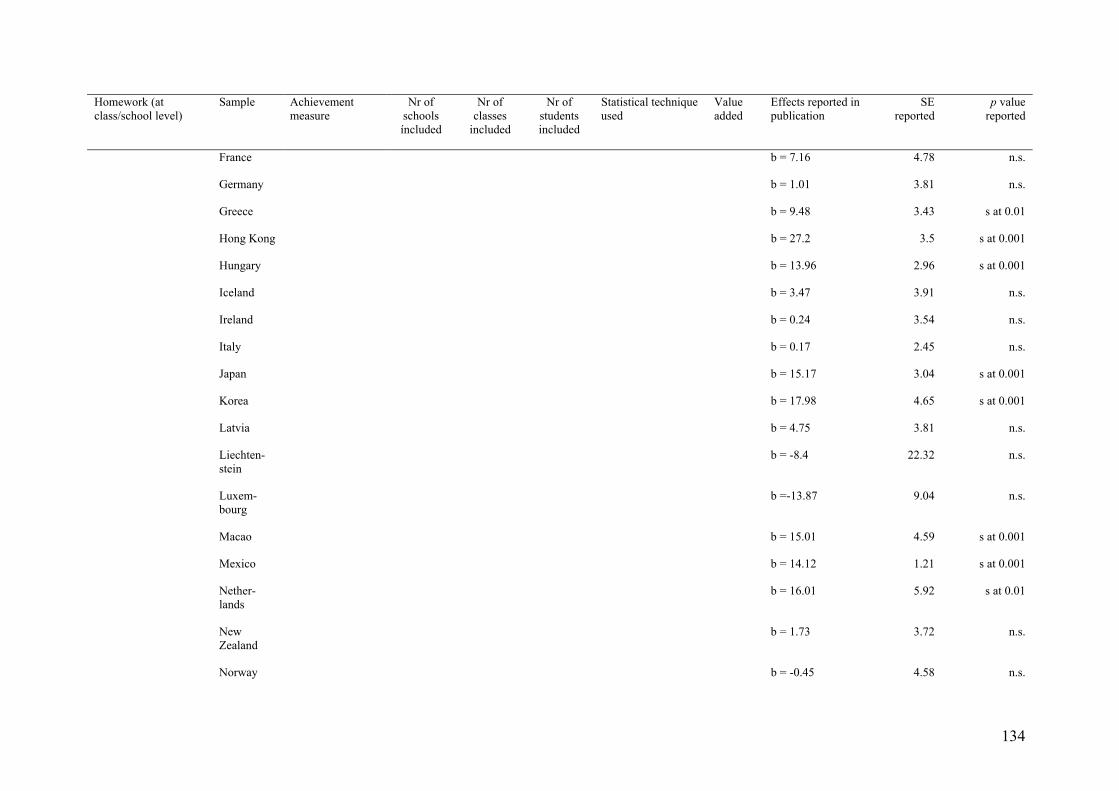
134
Homework (at class/school level)
Sample Achievement measure
Nr of schools íncluded
Nr of classes
included
Nr of students included
Statistical technique used
Value added
Effects reported in publication
SE reported
p value reported
France b = 7.16 4.78 n.s.
Germany b = 1.01 3.81 n.s.
Greece b = 9.48 3.43 s at 0.01
Hong Kong b = 27.2 3.5 s at 0.001
Hungary b = 13.96 2.96 s at 0.001
Iceland b = 3.47 3.91 n.s.
Ireland b = 0.24 3.54 n.s.
Italy b = 0.17 2.45 n.s.
Japan b = 15.17 3.04 s at 0.001
Korea b = 17.98 4.65 s at 0.001
Latvia b = 4.75 3.81 n.s.
Liechten-stein
b = -8.4 22.32 n.s.
Luxem-bourg
b =-13.87 9.04 n.s.
Macao b = 15.01 4.59 s at 0.001
Mexico b = 14.12 1.21 s at 0.001
Nether-lands
b = 16.01 5.92 s at 0.01
New Zealand
b = 1.73 3.72 n.s.
Norway b = -0.45 4.58 n.s.

135
Homework (at class/school level)
Sample Achievement measure
Nr of schools íncluded
Nr of classes
included
Nr of students included
Statistical technique used
Value added
Effects reported in publication
SE reported
p value reported
Poland b = -3.78 2.38 s at 0.05
Portugal b = 28.71 6 s at 0.001
Russia b = 8.33 2.49 s at 0.001
Slovak Republic
b = 0.8 2.53 n.s.
Spain b = 11.82 2.4 s at 0.001
Sweden b = -13.24 4.69 s at 0.01
Switzer-land
b = -2.44 3.49 n.s.
Thailand b = 6.57 2.47 s at 0.01
Tunesia b = 13.9 4.17 s at 0.001
Turkey b = 3.77 5.57 n.s.
United Kingdom
b = 4.45 2.62 s at 0.05
USA b = 0.89 2.65 n.s.
Uruguay b = 5.82 3.27 s at 0.05
Yugoslavia b = 11.96 3.63 s at 0.001
Austria Math 100 1682 Multilevel (unstandardized)
yes b = 5.47 6.34 n.s.
Belgium 146 3347 b = 7.11 4.04 s at 0.05
Germany 154 6294 b = 0.05 0.04 n.s.
Japan 144 4161 b = 16.03 2.98 s at 0.001
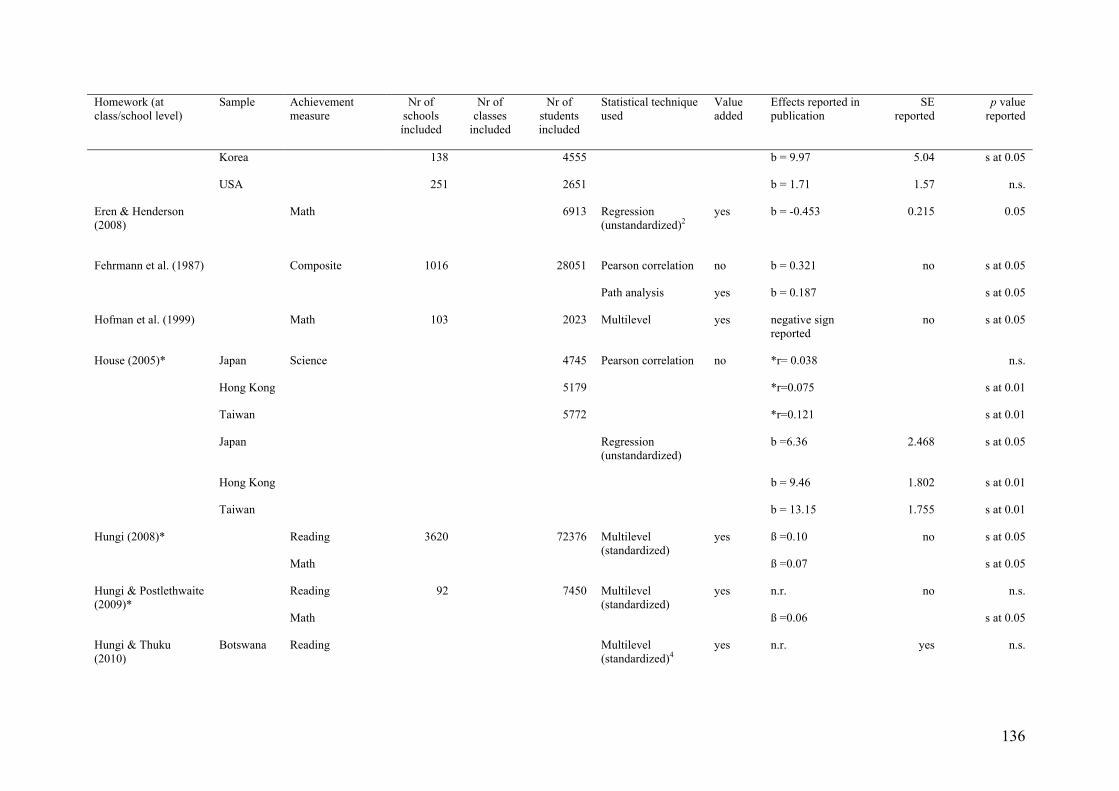
136
Homework (at class/school level)
Sample Achievement measure
Nr of schools íncluded
Nr of classes
included
Nr of students included
Statistical technique used
Value added
Effects reported in publication
SE reported
p value reported
Korea 138 4555 b = 9.97 5.04 s at 0.05
USA 251 2651 b = 1.71 1.57 n.s.
Eren & Henderson (2008)
Math 6913 Regression (unstandardized)2
yes b = -0.453
0.215 0.05
Fehrmann et al. (1987) Composite 1016 28051 Pearson correlation
Path analysis
no
yes
b = 0.321
b = 0.187
no s at 0.05
s at 0.05
Hofman et al. (1999) Math 103 2023 Multilevel yes negative sign reported
no s at 0.05
House (2005)* Japan Science 4745 Pearson correlation no *r= 0.038 n.s.
Hong Kong 5179 *r=0.075 s at 0.01
Taiwan 5772 *r=0.121 s at 0.01
Japan Regression (unstandardized)
b =6.36 2.468 s at 0.05
Hong Kong b = 9.46 1.802 s at 0.01
Taiwan b = 13.15 1.755 s at 0.01
Hungi (2008)* Reading
Math
3620 72376 Multilevel (standardized)
yes ß =0.10
ß =0.07
no s at 0.05
s at 0.05
Hungi & Postlethwaite (2009)*
Reading
Math
92 7450 Multilevel (standardized)
yes n.r.
ß =0.06
no n.s.
s at 0.05
Hungi & Thuku (2010)
Botswana Reading Multilevel (standardized)4
yes n.r. yes n.s.
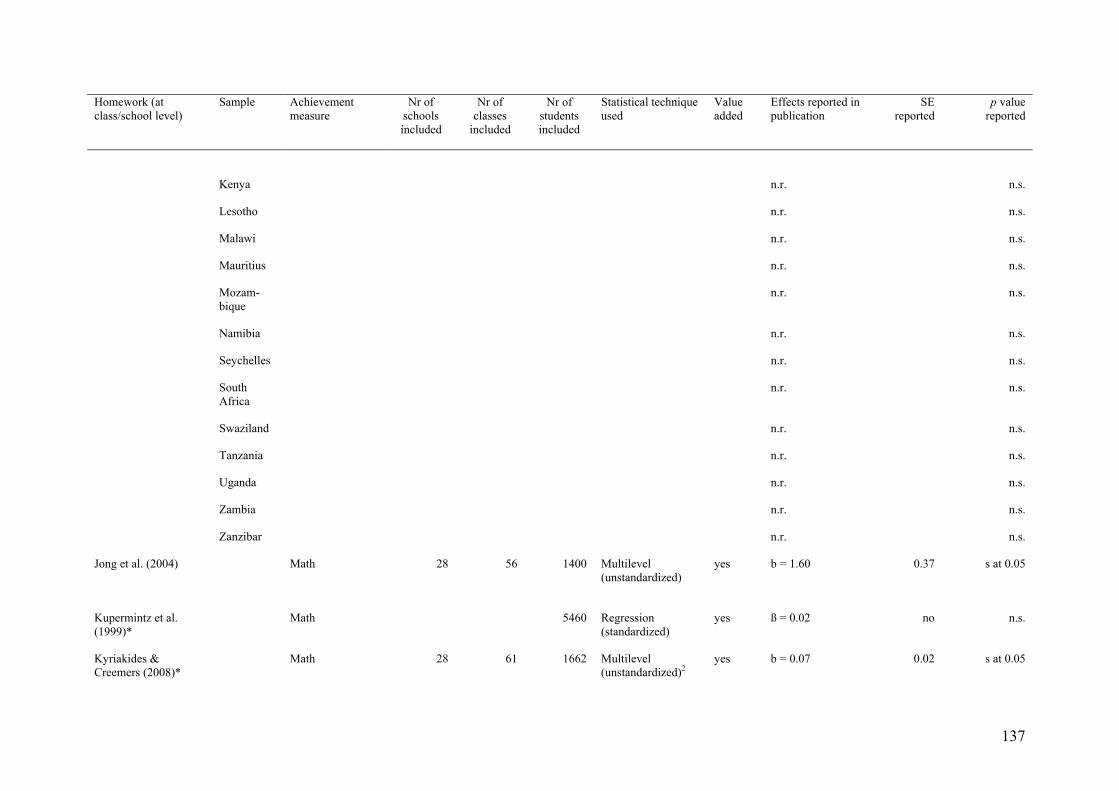
137
Homework (at class/school level)
Sample Achievement measure
Nr of schools íncluded
Nr of classes
included
Nr of students included
Statistical technique used
Value added
Effects reported in publication
SE reported
p value reported
Kenya n.r. n.s.
Lesotho n.r. n.s.
Malawi n.r. n.s.
Mauritius n.r. n.s.
Mozam-bique
n.r. n.s.
Namibia n.r. n.s.
Seychelles n.r. n.s.
South Africa
n.r. n.s.
Swaziland n.r. n.s.
Tanzania n.r. n.s.
Uganda n.r. n.s.
Zambia n.r. n.s.
Zanzibar n.r. n.s.
Jong et al. (2004)
Math 28 56 1400 Multilevel (unstandardized)
yes b = 1.60
0.37 s at 0.05
Kupermintz et al. (1999)*
Math 5460 Regression (standardized)
yes ß = 0.02 no n.s.
Kyriakides & Creemers (2008)*
Math 28 61 1662 Multilevel (unstandardized)2
yes b = 0.07 0.02 s at 0.05

138
Homework (at class/school level)
Sample Achievement measure
Nr of schools íncluded
Nr of classes
included
Nr of students included
Statistical technique used
Value added
Effects reported in publication
SE reported
p value reported
1614
1592
1579
b = 0.10
b = 0.09
b = 0.08
0.02
0.02
0.02
s at 0.05
s at 0.05
s at 0.05
Leseman et al. (1992)* Reading 30 135 2605 Multilevel (standardized)
yes ß = 0.140 no 0.05
Liu et al. (2006) Korea Math 150 256 5309 Multilevel (unstandardized)
yes b = -0.3 no n.s.
Japan 146 146 4856 b = 4.5 n.s.
Taiwan 151 150 5379 b = 4.1 n.s.
USA 297 330 8192 b = 27.5 s at 0.001
Singapore 165 322 6018 b = 19.1 s at 0.001
Hong Kong 126 135 4972 b =15.9 s at 0.05
Luyten & De Jong (1998)
Math 22 44 956 Multilevel (unstandardized)
yes b = 0.08 no s at 0.05
Reezigt (1993) Grade 6 Language
Math
218
205
Regression (standardized)
yes ß = -0.010
ß = 0.000
no n.s.
n.s.
Grade 8 Language
Math
218
205
ß = -0.050
ß = -0.030
n.s.
n.s.
Reezigt et al. (1999) Cohort 1988-1990
Language
Math
129 258 3762 Multilevel (unstandardized)
yes n.s.
b =0.8
no n.s.
s at 0.05

139
Homework (at class/school level)
Sample Achievement measure
Nr of schools íncluded
Nr of classes
included
Nr of students included
Statistical technique used
Value added
Effects reported in publication
SE reported
p value reported
Cohort 1990-1992
Language
Math
129 258 3466 n.s.
n.s.
n.s.
n.s.
Cohort 1988-1992
Language
Math
127 1531 b = 1.2
n.s.
s at 0.05
n.s.
Saba & Hamouri (2010)
Math
Science
200 200 4426 Multilevel (unstandardized)
yes b = -0.11
b = -0.1
0.3
0.3
n.s.
n.s.
Trautwein et al. (2002)*
Math 125 1976 Multilevel (standardized)
yes ß = 0.36
ß = -0.13
no 0.01
n.s.
Trautwein (2007) Study 1
Math Multilevel (unstandardized)
yes b = 1.76 0.58 s at 0.01
Study 2
Math 91 226 Multilevel (unstandardized)
yes b = 0.11
b = -0.02
0.05
0.12
s at 0.05
n.s.
Trautwein et al. (2009)*
Language 70 1275 Pearson correlation no *r = 0.19 (frequency)
n.s.
*r = -0.20 (time) n.s.
Multilevel (unstandardized)
b = 0.01 (frequency) 0.03 n.s.
b =0.00 (time) 0.01 n.s.
Wagner et al. (2008)* Language and math
12 19 236 Pearson correlation no r = 0.04 n.s.

140
Homework (at class/school level)
Sample Achievement measure
Nr of schools íncluded
Nr of classes
included
Nr of students included
Statistical technique used
Value added
Effects reported in publication
SE reported
p value reported
Werf & Weide (1993) Grade 4 Language
Math
696 Regression (standardized)
yes ß = 0.20
ß = 0.70
no n.s.
s at 0.05
Grade 6 Language
Math
696 ß = 0.30
ß = 0.60
n.s.
s at 0.05
Grade 8 Language
Math
696 ß = 0.50
ß = 0.70
s at 0.05
s at 0.05
Werf (1994)
Math 183 2953 Multilevel (unstandardized)
yes Positive sign s at 0.05
Zhu & Leung (2012)
Math 142 4812 Multilevel (unstandardized)
no b = 0.85
b = 2.39
n.s.
s at 0.001
* = included in meta-analysis
Notes: 1 n.s. = not significant at p = 0.05, 2 standardized with sx and sy ß = bsx/sy, 3n.r. = not reported, 4 many coefficients not reported, therefore not included in meta-analysis
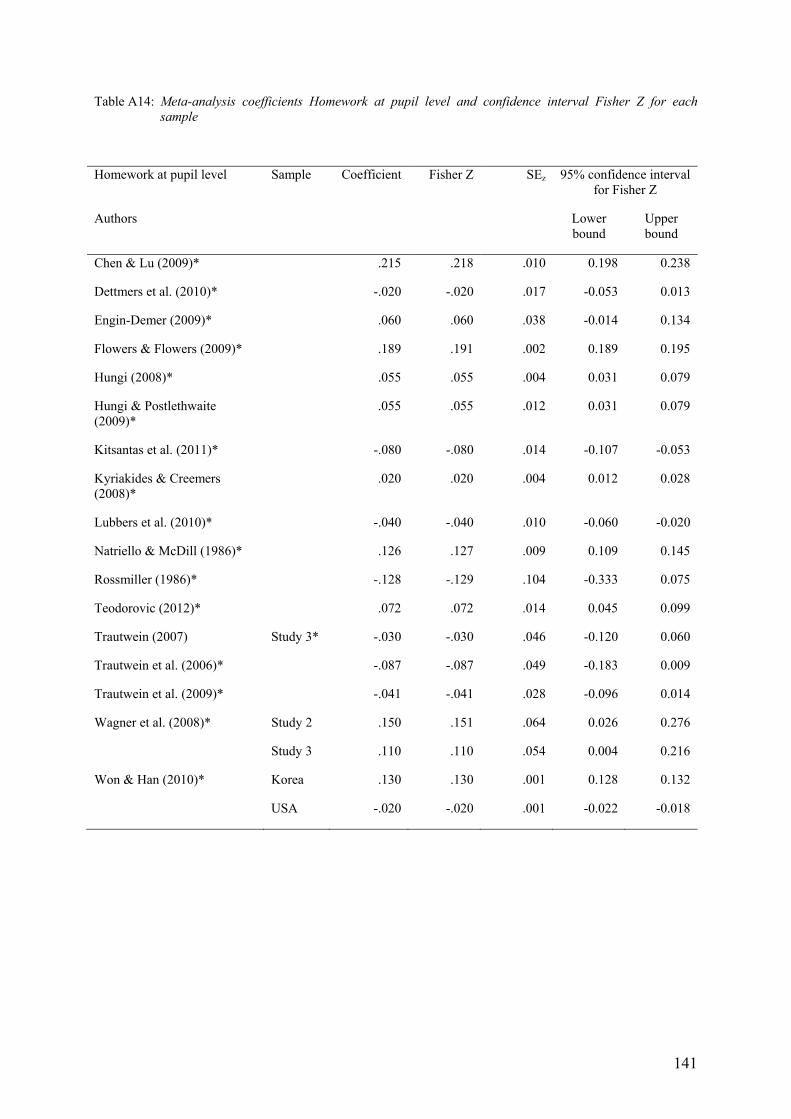
141
Table A14: Meta-analysis coefficients Homework at pupil level and confidence interval Fisher Z for each sample
Homework at pupil level Sample Coefficient Fisher Z SEz 95% confidence interval for Fisher Z
Authors Lower bound
Upper bound
Chen & Lu (2009)* .215 .218 .010 0.198 0.238
Dettmers et al. (2010)* -.020 -.020 .017 -0.053 0.013
Engin-Demer (2009)* .060 .060 .038 -0.014 0.134
Flowers & Flowers (2009)* .189 .191 .002 0.189 0.195
Hungi (2008)* .055 .055 .004 0.031 0.079
Hungi & Postlethwaite (2009)*
.055 .055 .012 0.031 0.079
Kitsantas et al. (2011)* -.080 -.080 .014 -0.107 -0.053
Kyriakides & Creemers (2008)*
.020 .020 .004 0.012 0.028
Lubbers et al. (2010)* -.040 -.040 .010 -0.060 -0.020
Natriello & McDill (1986)* .126 .127 .009 0.109 0.145
Rossmiller (1986)* -.128 -.129 .104 -0.333 0.075
Teodorovic (2012)* .072 .072 .014 0.045 0.099
Trautwein (2007) Study 3* -.030 -.030 .046 -0.120 0.060
Trautwein et al. (2006)* -.087 -.087 .049 -0.183 0.009
Trautwein et al. (2009)* -.041 -.041 .028 -0.096 0.014
Wagner et al. (2008)* Study 2 .150 .151 .064 0.026 0.276
Study 3 .110 .110 .054 0.004 0.216
Won & Han (2010)* Korea .130 .130 .001 0.128 0.132
USA -.020 -.020 .001 -0.022 -0.018
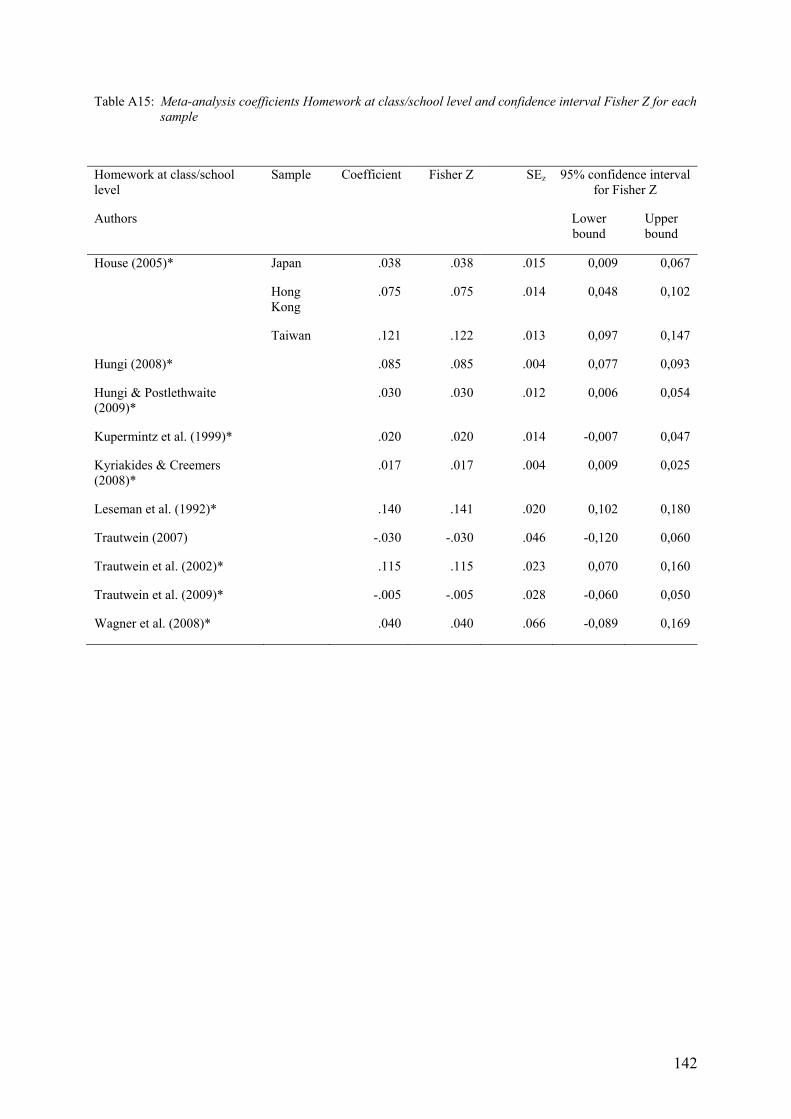
142
Table A15: Meta-analysis coefficients Homework at class/school level and confidence interval Fisher Z for each sample
Homework at class/school level
Sample Coefficient Fisher Z SEz 95% confidence interval for Fisher Z
Authors Lower bound
Upper bound
House (2005)* Japan .038 .038 .015 0,009 0,067
Hong Kong
.075 .075 .014 0,048 0,102
Taiwan .121 .122 .013 0,097 0,147
Hungi (2008)* .085 .085 .004 0,077 0,093
Hungi & Postlethwaite (2009)*
.030 .030 .012 0,006 0,054
Kupermintz et al. (1999)* .020 .020 .014 -0,007 0,047
Kyriakides & Creemers (2008)*
.017 .017 .004 0,009 0,025
Leseman et al. (1992)* .140 .141 .020 0,102 0,180
Trautwein (2007) -.030 -.030 .046 -0,120 0,060
Trautwein et al. (2002)* .115 .115 .023 0,070 0,160
Trautwein et al. (2009)* -.005 -.005 .028 -0,060 0,050
Wagner et al. (2008)* .040 .040 .066 -0,089 0,169

143
Table A16: Results from vote counts examining the number of negative, non-significant and positive effects of homework at pupil level on academic achievement for each sample
Study Sample Negative effect
Non-significant
effect
Positive effect
Total
Burkam et al. (1995) 0 2 0 2 Chen & Lu (2009)* 0 0 2 2 Dettmers et al. (2009) 40 countries 17 11 12 40 6 countries 1 5 0 6 Dettmers et al. (2010)* 3 1 0 4 Engin-Demer (2009)* 0 1 0 1 Flowers & Flowers (2009)* 0 0 1 1 Fuchs & Woesmann (2007) 0 0 6 6 Hungi (2008)* 0 0 2 2 Hungi & Postlethwaite (2009)* 0 0 2 2 Hungi & Thuku (2010) 14 countries 0 9 5 14 Iturre (2005) 1 0 0 1 Kitsantas et al. (2011)* 2 0 0 2 Kyriakides & Creemers (2008)* 0 1 3 4 Lin et al. (2007) OECD countries 0 1 0 1 Non OECD
countries
0 1 0 1
Liu et al. (2006) 6 countries 0 5 1 6 Lubbers et al. (2010)* 3 1 0 4 Ma & Crocker (2007) 0 0 1 1 Natriello & McDill (1986)* 0 0 2 0 Rossmiller (1986)* 0 1 0 1 Smyth (2008) 0 0 1 1 Teodorovic (2012)* 0 0 2 2 Trautwein (2007) Study 1 0 0 1 1 Study 2 1 0 0 1 Study 3* 2 1 0 3 Trautwein et al. (2006)* 10 2 0 12 Trautwein et al. (2009)* 1 1 1 3 Wagner et al. (2008)* Study 2 0 0 1 1 Study 3 0 0 1 1 Won & Han (2010)* 2 countries 1 0 1 2 Total 42 43 45 130

144
Table A17: Results of vote counts examining the number and percentage of negative, non-significant and positive effects of amount of homework, frequency of homework and time spent on homework at pupil level on academic achievement
Negative effects
Non-significant effects
Positive effects
Negative effects
Non-significant effects
Positive effects
Conceptualisation N N N % % % Amount of homework 0 0 0 0 0 0 Frequency of homework 0 10 9 0 53 47 Time spent on homework 42 33 36 38 30 32 Total 42 43 45 32 33 35
Table A18: Results of vote counts examining the number and percentage of negative, non-significant and positive effects of homework at pupil level on academic achievement in all subjects, language, mathematics and subjects other than math or language
Negative effects
Non-significant effects
Positive effects
Negative effects
Non-significant effects
Positive effects
Subject N N N % % % All subjects 42 43 45 32 33 35 Subject Math 33 28 27 37 32 31 Subject Language 9 12 13 27 35 38 Subject other than Math or Language 0 3 5 0 37 63

145
Table A19: Results of moderator analyses examining the number and percentage of negative, non-significant and positive effects of homework at pupil level on academic achievement (based on vote counts)
Negative effects
Non-significant
effects
Positive effects
Negative effects
Non-significant
effects
Positive effects
Moderator N N N % % % Level of schooling Primary school 0 11 14 0 44 56 Secondary school
42 32 31 40 31 29
Country USA 3 5 4 25 42 33 UK 1 0 0 100 0 0 Netherlands 0 4 1 0 80 20 Country other than USA, UK and Netherlands
34
34
35
33
33
34
Covariates included Included covariate for student’s prior achievement
5 6 7 28 33 39
Included covariate for ability 6 5 2 46 39 15 Included covariate for SES
23 35 39 24 36 40
Statistical technique used Technique multilevel 23 34 30 26 39 35 Technique not multilevel 19 9 15 44 21 35 Total 42 43 45 32 33 35
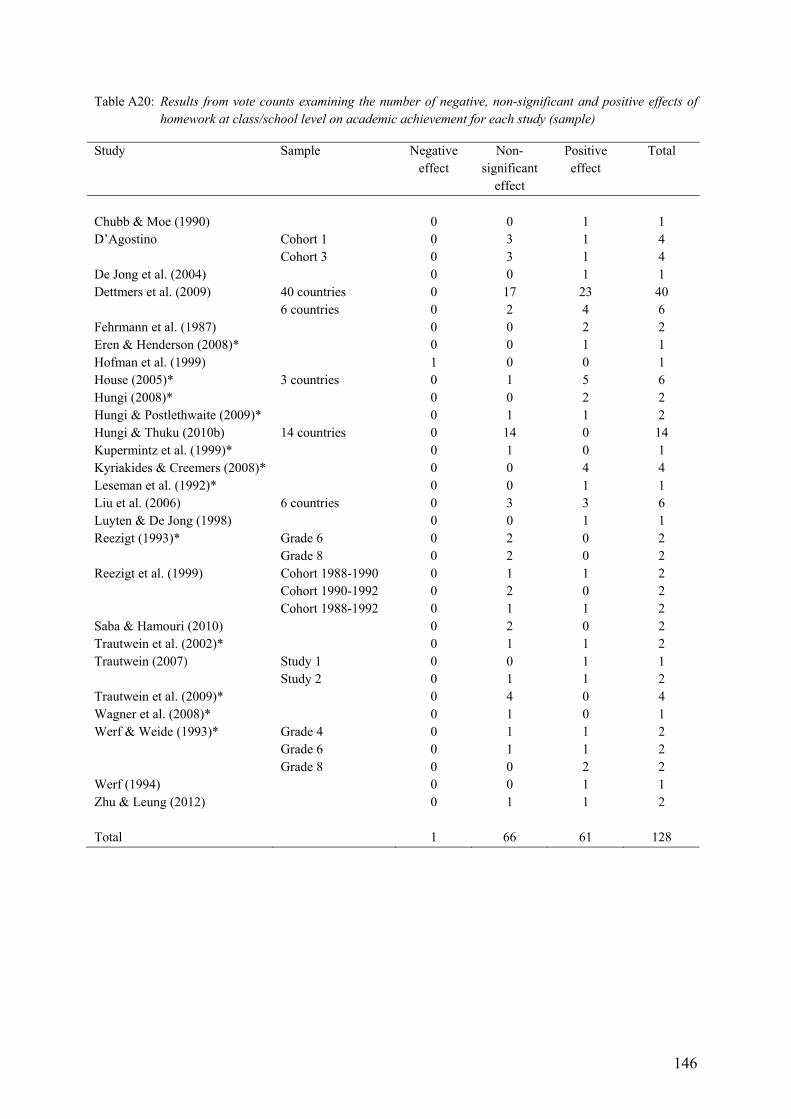
146
Table A20: Results from vote counts examining the number of negative, non-significant and positive effects of homework at class/school level on academic achievement for each study (sample)
Study Sample Negative effect
Non-significant
effect
Positive effect
Total
Chubb & Moe (1990) 0 0 1 1 D’Agostino Cohort 1 0 3 1 4 Cohort 3 0 3 1 4 De Jong et al. (2004) 0 0 1 1 Dettmers et al. (2009) 40 countries 0 17 23 40 6 countries 0 2 4 6 Fehrmann et al. (1987) 0 0 2 2 Eren & Henderson (2008)* 0 0 1 1 Hofman et al. (1999) 1 0 0 1 House (2005)* 3 countries 0 1 5 6 Hungi (2008)* 0 0 2 2 Hungi & Postlethwaite (2009)* 0 1 1 2 Hungi & Thuku (2010b) 14 countries 0 14 0 14 Kupermintz et al. (1999)* 0 1 0 1 Kyriakides & Creemers (2008)* 0 0 4 4 Leseman et al. (1992)* 0 0 1 1 Liu et al. (2006) 6 countries 0 3 3 6 Luyten & De Jong (1998) 0 0 1 1 Reezigt (1993)* Grade 6 0 2 0 2 Grade 8 0 2 0 2 Reezigt et al. (1999) Cohort 1988-1990 0 1 1 2 Cohort 1990-1992 0 2 0 2 Cohort 1988-1992 0 1 1 2 Saba & Hamouri (2010) 0 2 0 2 Trautwein et al. (2002)* 0 1 1 2 Trautwein (2007) Study 1 0 0 1 1 Study 2 0 1 1 2 Trautwein et al. (2009)* 0 4 0 4 Wagner et al. (2008)* 0 1 0 1 Werf & Weide (1993)* Grade 4 0 1 1 2 Grade 6 0 1 1 2 Grade 8 0 0 2 2 Werf (1994) 0 0 1 1 Zhu & Leung (2012) 0 1 1 2 Total 1 66 61 128
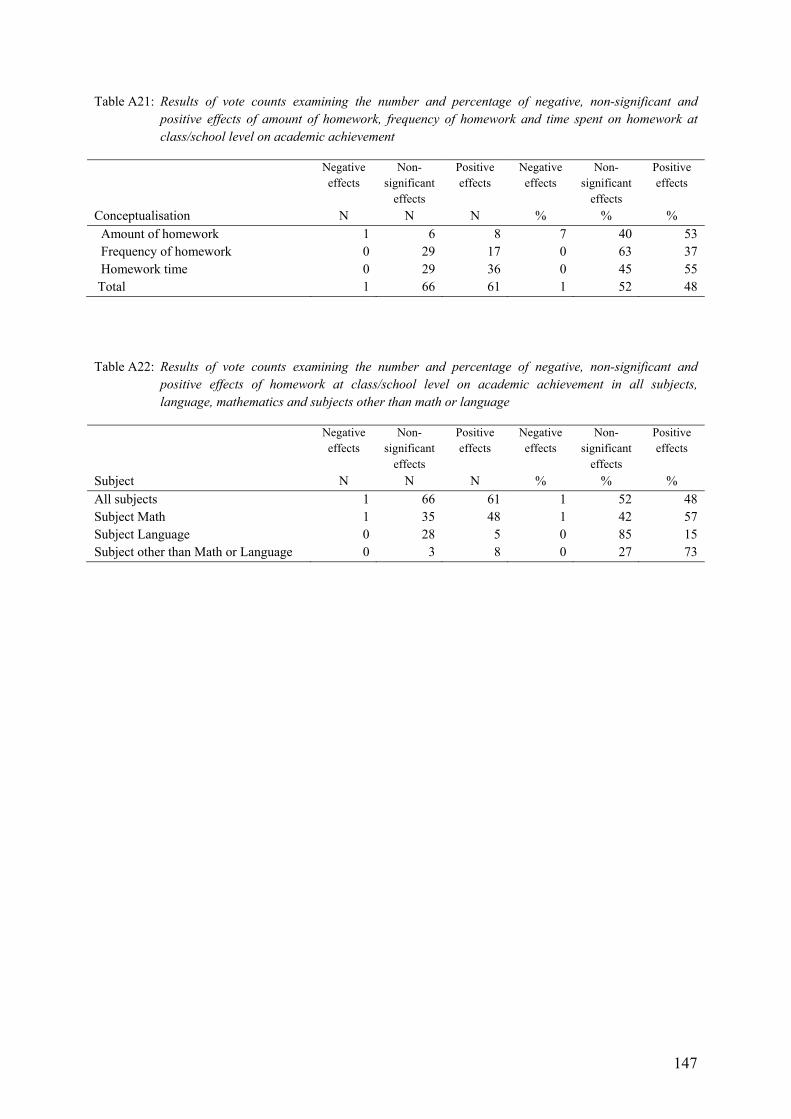
147
Table A21: Results of vote counts examining the number and percentage of negative, non-significant and positive effects of amount of homework, frequency of homework and time spent on homework at class/school level on academic achievement
Negative effects
Non-significant
effects
Positive effects
Negative effects
Non-significant
effects
Positive effects
Conceptualisation N N N % % % Amount of homework 1 6 8 7 40 53 Frequency of homework 0 29 17 0 63 37 Homework time 0 29 36 0 45 55 Total 1 66 61 1 52 48
Table A22: Results of vote counts examining the number and percentage of negative, non-significant and positive effects of homework at class/school level on academic achievement in all subjects, language, mathematics and subjects other than math or language
Negative effects
Non-significant
effects
Positive effects
Negative effects
Non-significant
effects
Positive effects
Subject N N N % % % All subjects 1 66 61 1 52 48 Subject Math 1 35 48 1 42 57 Subject Language 0 28 5 0 85 15 Subject other than Math or Language 0 3 8 0 27 73

148
Table A23: Results of moderator analyses examining the number and percentage of negative, non-significant and positive effects of homework at class/school level on academic achievement (based on vote counts)
Negative effects
Non-significant effects
Positive effects
Negative effects
Non-significant effects
Positive effects
Moderator N N N % % % Level of schooling Primary school 1 32 17 2 64 34 Secondary school
0 34 44 0 44 56
Country USA 0 9 7 0 57 43 UK 0 0 1 0 0 100 Netherlands 1 10 11 5 45 50 Country other than USA, UK and Netherlands
0
47
42
0
53
47
Covariates included Included covariate for student’s prior achievement
0 14 15 0 49 51
Included covariate for ability 1 8 8 6 47 47 Included covariate for SES
1 52 47 1 52 47
Statistical technique used Technique multilevel 1 55 48 1 53 46 Technique not multilevel 0 11 13 0 46 54 Total 1 66 61 1 52 48

149
Table A24: Parameter estimates (and standard errors) of conceptualization of homework at pupil level predicting effect size (results from multilevel meta-analysis)
ka (0) (1) Homework Composite (Intercept) 19 .0443 (.0217)b Conceptualizations of homework (RC = time spent on homework)
14 .0408 (.0277)
Amount of homework 2 .0503 (.0376) Frequency of homework 3 -.0160 (.0384) Variance component at between samples level .0080 .0088 P value < .001 < .001 Variance component at within sample level 1.00 1.00
Note: For each categorical variable one category was chosen as the reference category (RC)
a Number of estimates included in the analysis, b Significant effect (for α < .05, one-tailed) (see text chapter 3 for details)

150
Table A25: Parameter estimates (and standard errors) of study characteristics predicting effect size of homework at pupil level across samples on achievement (results from multilevel meta-analysis)
Predictor ka (1) (2) (3) (4) (5) (6) Intercept .0437
(.0209)
Number of students (times 10,000; centered around the grand mean)
.0091 (0078)
Level of schooling (RC = primary school)
5 .0324 (.0200)
Secondary school 14 .0158 (.0341)
Geographical region (RC = Europe)
10 .0153 (.0204)
North America (US) 5 .0232 (.0562)
Other (Asia) 4 .0992 (.0392)b
Statistical technique employed (RC = not multilevel)
14 .0472 (.0290)
Multilevel 5 -.0106 (.0323)
Model included adjustment for prior knowledge and/or cognitive ability (RC = no adjustment)
13 .0561 (.0276)
Adjustment for prior Knowledge and/or cognitive ability
6 -.0370 (.0394)
Model specification Adjustment for SES (RC = no adjustment)
8 .0275 (.0416)
Adjustment for SES 11 .0265 (.0474)
Variance component at between samples level
.0083 .0085 .0071 .0085 .0083 .0084
p value < .001 < .001 .007 .009 .008 .008 Variance component at within sample level
1.00 1.00 1.00 1.00 1.00 1.00
Note: For each categorical variable one category was chosen as the reference category (RC)
a Number of estimates included in the analysis, b Significant effect (α < .05;two-tailed test) (see text chapter 3 for details)
Table A26 shows descriptive statistics on the sizes of the samples included in the meta-analyses with regard to homework at pupil level. The other variables are all categorical. Information on their frequency distributions is included in Table A26

151
Table A26: Descriptive statistics number of students; Number of samples is 19; homework at pupil level
Mean
Standard deviation
Minimum Maximum
Weighted (by inverse of the standard error)
8,483 10,848 95 72,376
Unweighted 8,313 16,168

152
Table A27: Parameter estimates (and standard errors) of conceptualization of homework at class/school level predicting effect size (results from multilevel meta-analysis)
ka (0) (1) Homework (composite) (Intercept) 12 .0581(.0143)b Conceptualization of homework (RC = time spent on homework)
3 .0093(.0140)
Amount of homework
2 .0648(.0457)
Frequency of homework
7 .0578(.0208)b
Variance component at between samples level .0022 .0022 p value < .001 < .001 Variance component within sample level 1.00 1.00 Note: For each categorical variable one category was chosen as the reference category (RC)
a Number of estimates included in the analysis, b Significant effect (see text chapter 3 for details)

153
Table A28: Parameter estimates (and standard errors) of study and sample characteristics predicting effect size across samples of homework at class/school level on achievement (results from multilevel meta-analysis)
Predictor ka (1) (2) (3) (4) (5) (6) Intercept 12 .0577(.0141) Number of students (times 10,000; centered around the grand mean)
.0048(.0025)
Level of schooling (RC =primary school) 4 .0598(.0194) Secondary school 8 .0031(.0277) Geographical region (RC = Europe) 6 .0523(.0269) North America (US) 1 -0323(.0269) Other regions (Asia)
5 .0179(.0307)
Statistical technique employed (RC = not multilevel)
7 .0434(.0184)
Multilevel 5 .0313(.0280) Model included adjustment for prior knowledge and/or cognitive ability (RC = no adjustment)
8 .0694(.0163)
Adjustment for prior Knowledge and/or cognitive ability
4 -0345(.0286)
Model specification Adjustment for SES (RC = no adjustment)
7
.0480(.0213)
Adjustment for SES 5 .0177(.0287) Variance component at between samples level
.0024 .0025 .0025 .0023 .0021 .0025
p value < .001 < .001 < .001 < .001 < .001 < .001 Variance component at within sample level
1.00 1.00 1.00 1.00 1.00 1.00
Note: For each categorical variable one category was chosen as the reference category (RC)
a Number of estimates included in the analysis, b Significant effect (see text chapter 3 for details
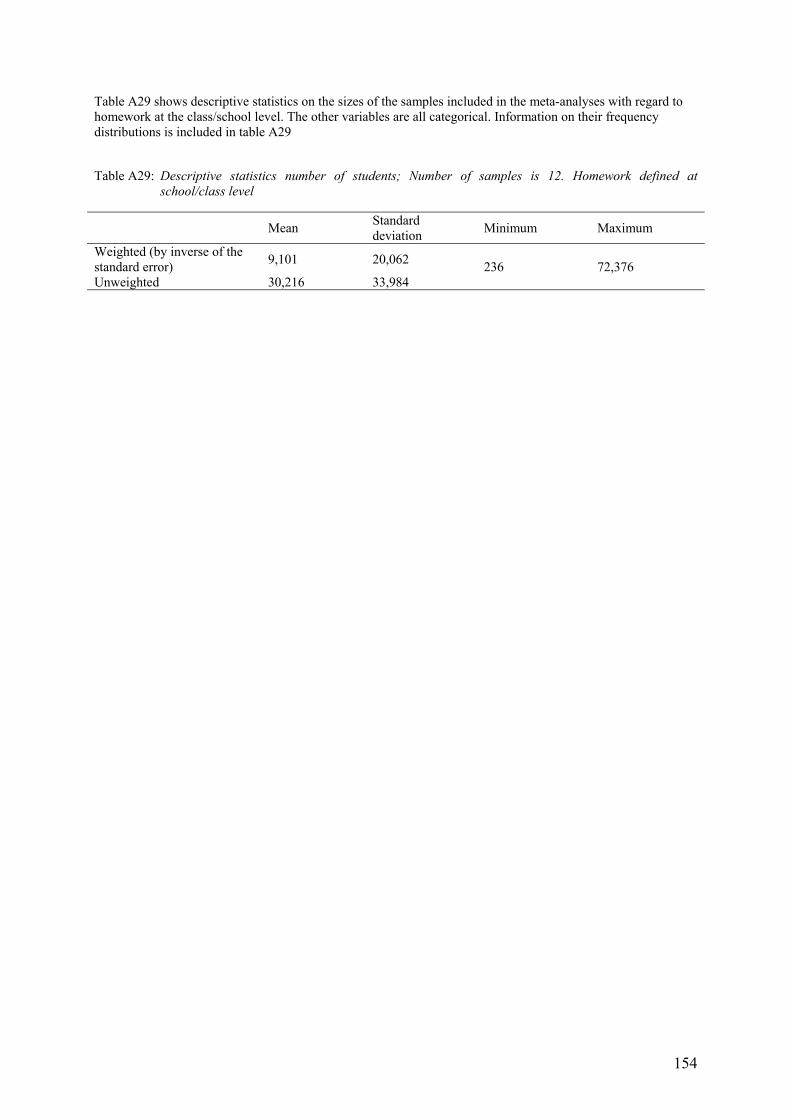
154
Table A29 shows descriptive statistics on the sizes of the samples included in the meta-analyses with regard to homework at the class/school level. The other variables are all categorical. Information on their frequency distributions is included in table A29
Table A29: Descriptive statistics number of students; Number of samples is 12. Homework defined at
school/class level
Mean
Standard deviation
Minimum Maximum
Weighted (by inverse of the standard error)
9,101 20,062 236 72,376
Unweighted 30,216 33,984

155
Table A30: Overview of studies of extended learning time on student achievement (pupil level)
Extended learning time Authors
Sample Country School type1
Extended learning time measure
Operationalisation Outcome measure
Aslam & Kingdom (2011)
Pakistan S Home tuition Number of hours of paid home tuition taken by child (divided by 1000)
Language achievement standardized test Math achievement standardized test
Borman et al. (2005)
USA P Summer learning Teacher Baltimore weeks
A continuous variable, ranging from 0 through 6, indicating the actual number of weeks that the child attended the program
Summer 2000 CTBS/4 Total Reading Gain Score
Summer learning Other program weeks
A continuous variable, ranging from 0 through 6, indicating the actual number of weeks that the child attended the other program
Chen & Lu (2009) Taiwan S Weekly hours spent academic enrichment programs provided by the school in the 11th grade
Composite score 4 curriculum free ability tests: analytical, math, language and science
Weekly private cram school hours in the 11th grade
Hungi (2008)
Vietnam P Extra tuition Number of hours per week Pupil scores on math and reading tests in grade 5 developed by National Institute of Educational Sciences
Hungi & Postlethwaite (2009)
Laos P Extra tuition Number of hours per week Pupil scores on reading and mathematics achievement test developed by Ministry of Education (as part of Laos grade 5 survey)
Jenner & Jenner (2007)
USA P Program attendance: Intensity of attendance in the 21st CCL after-school program
Participants were defined as students who took part in the after-school programme for 30 days or more Attends 30-59 days Attends 60-89 days Attends 90 days and up
ITBS test reading, language, math, science, social studies, and sources of information
Kalender & Berberoglu (2009)
Grade 6 Grade 7 Grade 8
Turkey P Out-of-school Activities
Items asking for the frequency of ‘Reading newspaper, magazine, books outside school’, ‘Studying and
Science achievement test developed by Ministry of National Education of Turkey as part of the Student Assessment
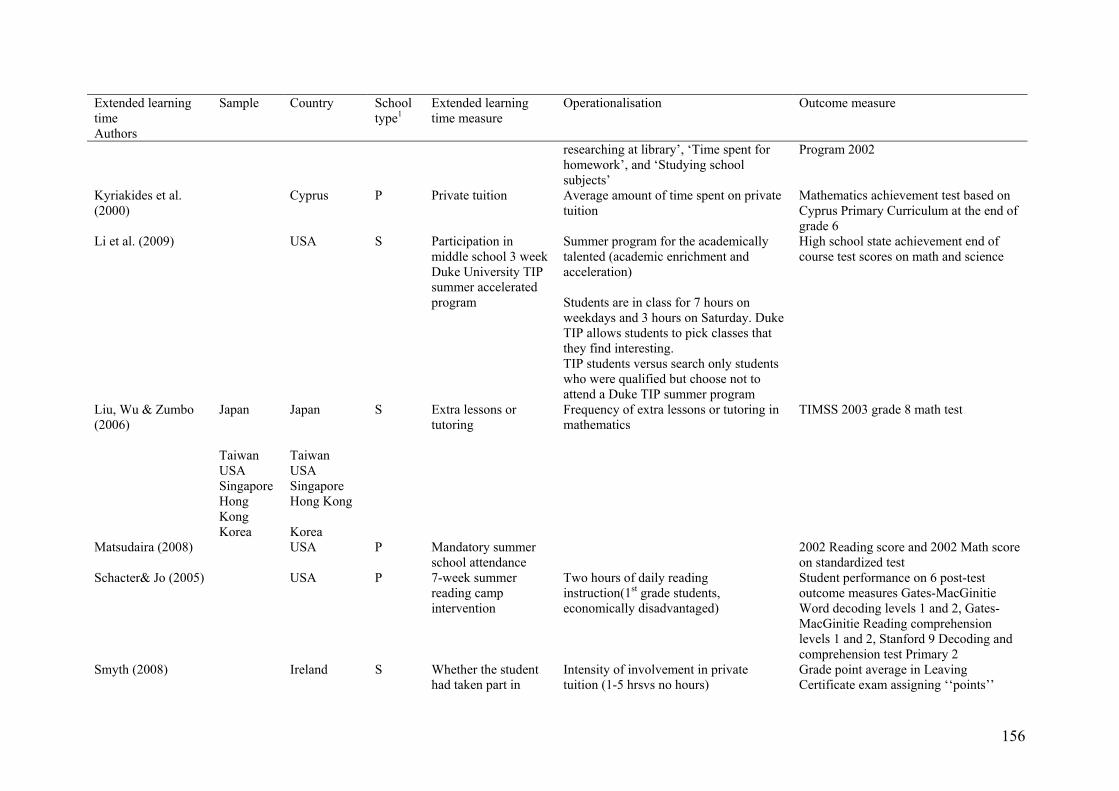
156
Extended learning time Authors
Sample Country School type1
Extended learning time measure
Operationalisation Outcome measure
researching at library’, ‘Time spent for homework’, and ‘Studying school subjects’
Program 2002
Kyriakides et al. (2000)
Cyprus P Private tuition Average amount of time spent on private tuition
Mathematics achievement test based on Cyprus Primary Curriculum at the end of grade 6
Li et al. (2009) USA S Participation in middle school 3 week Duke University TIP summer accelerated program
Summer program for the academically talented (academic enrichment and acceleration) Students are in class for 7 hours on weekdays and 3 hours on Saturday. Duke TIP allows students to pick classes that they find interesting. TIP students versus search only students who were qualified but choose not to attend a Duke TIP summer program
High school state achievement end of course test scores on math and science
Liu, Wu & Zumbo (2006)
Japan Japan S Extra lessons or tutoring
Frequency of extra lessons or tutoring in mathematics
TIMSS 2003 grade 8 math test
Taiwan Taiwan USA USA Singapore Singapore Hong
Kong Hong Kong
Korea Korea Matsudaira (2008) USA P Mandatory summer
school attendance 2002 Reading score and 2002 Math score
on standardized test Schacter& Jo (2005) USA P 7-week summer
reading camp intervention
Two hours of daily reading instruction(1st grade students, economically disadvantaged)
Student performance on 6 post-test outcome measures Gates-MacGinitie Word decoding levels 1 and 2, Gates-MacGinitie Reading comprehension levels 1 and 2, Stanford 9 Decoding and comprehension test Primary 2
Smyth (2008) Ireland S Whether the student had taken part in
Intensity of involvement in private tuition (1-5 hrsvs no hours)
Grade point average in Leaving Certificate exam assigning ‘‘points’’
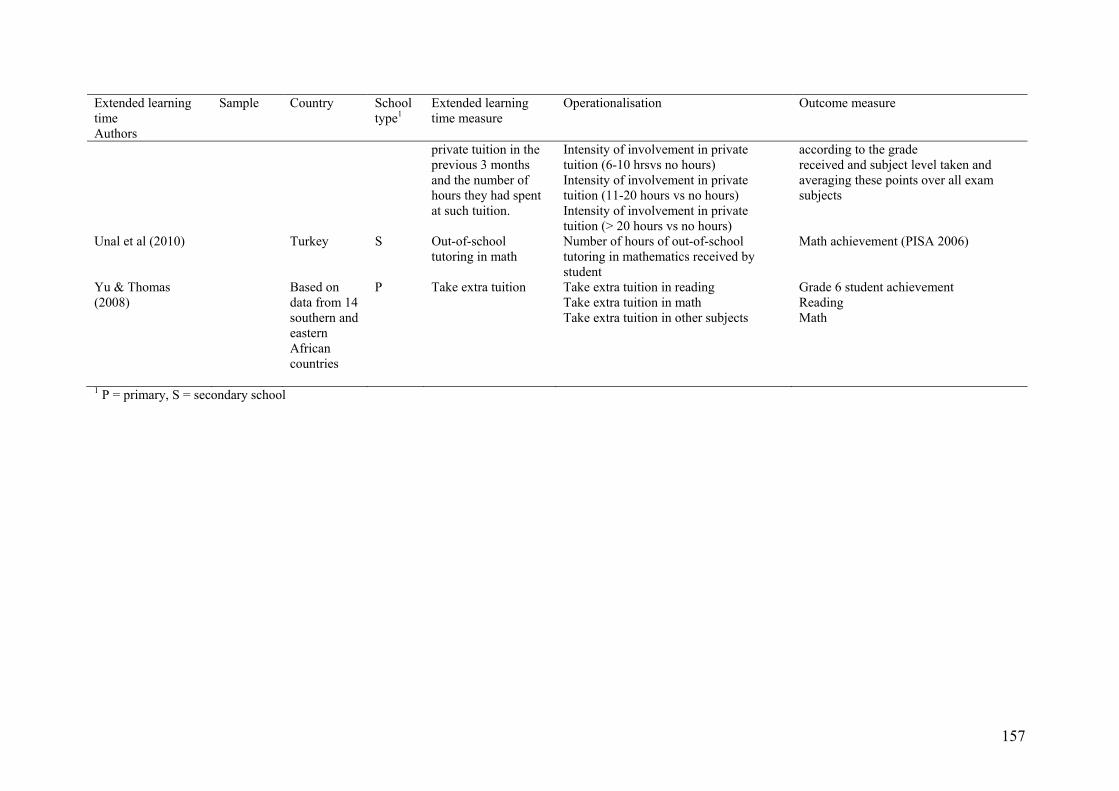
157
Extended learning time Authors
Sample Country School type1
Extended learning time measure
Operationalisation Outcome measure
private tuition in the previous 3 months and the number of hours they had spent at such tuition.
Intensity of involvement in private tuition (6-10 hrsvs no hours) Intensity of involvement in private tuition (11-20 hours vs no hours) Intensity of involvement in private tuition (> 20 hours vs no hours)
according to the grade received and subject level taken and averaging these points over all exam subjects
Unal et al (2010) Turkey S Out-of-school tutoring in math
Number of hours of out-of-school tutoring in mathematics received by student
Math achievement (PISA 2006)
Yu & Thomas (2008)
Based on data from 14 southern and eastern African countries
P Take extra tuition Take extra tuition in reading Take extra tuition in math Take extra tuition in other subjects
Grade 6 student achievement Reading Math
1 P = primary, S = secondary school
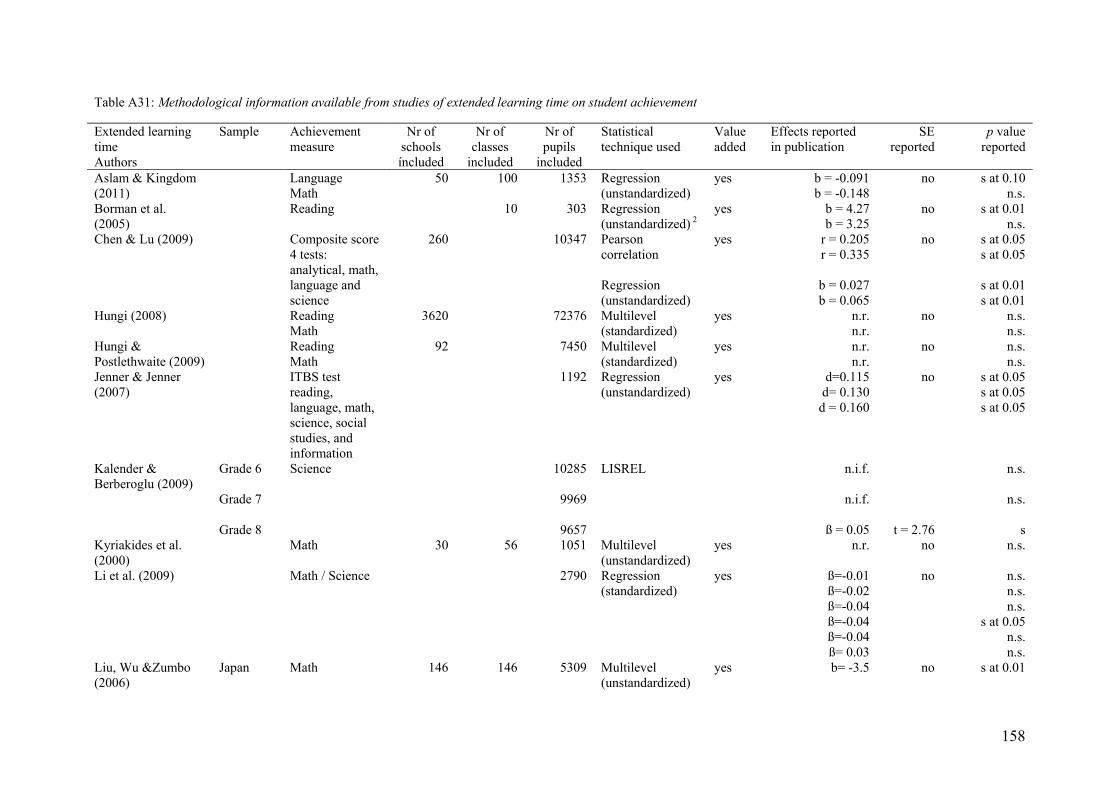
158
Table A31: Methodological information available from studies of extended learning time on student achievement
Extended learning time Authors
Sample Achievement measure
Nr of schools íncluded
Nr of classes
included
Nr of pupils
included
Statistical technique used
Value added
Effects reported in publication
SE reported
p value reported
Aslam & Kingdom (2011)
Language Math
50 100 1353 Regression (unstandardized)
yes b = -0.091 b = -0.148
no s at 0.10 n.s.
Borman et al. (2005)
Reading 10 303 Regression (unstandardized) 2
yes b = 4.27b = 3.25
no s at 0.01 n.s.
Chen & Lu (2009) Composite score 4 tests: analytical, math, language and science
260 10347 Pearson correlation Regression (unstandardized)
yes r = 0.205 r = 0.335
b = 0.027 b = 0.065
no s at 0.05 s at 0.05
s at 0.01 s at 0.01
Hungi (2008)
Reading Math
3620 72376 Multilevel (standardized)
yes n.r. n.r.
no n.s. n.s.
Hungi & Postlethwaite (2009)
Reading Math
92 7450 Multilevel (standardized)
yes n.r. n.r.
no n.s. n.s.
Jenner & Jenner (2007)
ITBS test reading, language, math, science, social studies, and information
1192 Regression (unstandardized)
yes d=0.115 d= 0.130
d = 0.160
no s at 0.05 s at 0.05 s at 0.05
Kalender & Berberoglu (2009)
Grade 6 Science 10285 LISREL n.i.f.
n.s.
Grade 7
9969 n.i.f.
n.s.
Grade 8 9657 ß = 0.05 t = 2.76 s Kyriakides et al. (2000)
Math 30 56 1051 Multilevel (unstandardized)
yes n.r. no n.s.
Li et al. (2009) Math / Science
2790 Regression (standardized)
yes ß=-0.01 ß=-0.02 ß=-0.04 ß=-0.04 ß=-0.04 ß= 0.03
no n.s. n.s. n.s.
s at 0.05 n.s. n.s.
Liu, Wu &Zumbo (2006)
Japan Math 146 146 5309 Multilevel (unstandardized)
yes b= -3.5 no s at 0.01

159
Extended learning time Authors
Sample Achievement measure
Nr of schools íncluded
Nr of classes
included
Nr of pupils
included
Statistical technique used
Value added
Effects reported in publication
SE reported
p value reported
Taiwan 151 150 5379 b= -5.7 s at 0.001 USA 297 330 8192 b= 14.9 s at 0.001 Singapore 165 322 6018 b= 3.5 s at 0.001 Hong
Kong 126 135 4972 b= 8.5 s at 0.001
Korea 150 256 5309 b= 3.2 s at 0.001 Matsudaira (2008) Reading
Math
132874 Regression discontinuity (unstandardized)2
yes b= 0.122 b= 0.121
0.028 0.023
s s
Schacter & Jo (2005)
Word decoding Reading comprehension
118 Regression (unstandardized)
yes b= 8.615 b= 10.000 b= 5.159
b= 10.464 b= -6.683 b= 15.359
0.906 0.789 0.893 2.312
15.765 4.903
s at 0.0001 s at 0.0001 s at 0.0001 s at 0.0001
n.s. s at 0.002
Smyth (2008) Grade point average in Leaving Certificate exam
112 4709 Multilevel (unstandardized)
yes b= -0.048 b= -0.133 b= -0.318 b= 0.184
no n.s. n.s. n.s. n.s.
Unal et al (2010) Math
1590 692
1465 575
Regression (standardized)
yes ß=0.166 ß=0.165 ß=0.211 ß=0.202
no s at 0.05 s at 0.05 s at 0.05 s at 0.05
Yu & Thomas (2008)
Reading Math
39466
39310
Multilevel (unstandardized)
yes n.r. b= 4.838 b= 7.217
n.r. b= 5.331 b= 7.268
no n.s. s at 0.05 s at 0.05
n.s. s at 0.05 s at 0.05
Notes: 1 n.s. = not significant at p = 0.05, 2 standardized with sx and syß = bsx/sy, 3n.r.= not reported

160
Table A32: Vote counts examining the number of negative, non-significant and positive effects of extended learning time on academic achievement for each sample
Study Sample Negative Not significant
Positive Total
Aslam & Kingdom (2011) 0 2 0 2 Borman et al. (2005) 0 1 1 2 Chen & Lu (2009) 0 0 4 4 Hungi (2008)
0 2 0 2
Hungi &Postlethwaite (2009)
0 2 0 2
Jenner & Jenner (2007) 0 0 3 3 Kalender & Berberoglu (2009) Grade 6 0 1 0 1 Grade 7
0 1 0 1
Grade 8
0 0 1 1
Kyriakides et al. (2000) 0 1 0 1 Li et al. (2009) 1 5 0 6 Liu, Wu & Zumbo (2006) Japan 2 0 0 2 Taiwan
0 0 2 2
USA
2 0 0 2
Singapore
0 0 2 2
Hong Kong
0 0 2 2
Korea
0 0 2 2
Matsudaira (2008) 0 0 2 2 Schacter & Jo (2005) 0 1 5 6 Smyth (2008) 0 4 0 4 Unal et al (2010) 0 0 4 4 Yu & Thomas (2008)
0 2 4 6
Total 5 22 32 59

161
Table A33: Results of vote counts examining the number and percentage of negative, non-significant and positive effects of extended learning time on academic achievement in all subjects, language, mathematics and subjects other than math or language
Negative effects
Non-significant
effects
Positive effects
Negative effects
Non-significant
effects
Positive effects
Subject N N N % % % All subjects 5 22 32 8 37 54 Subject Math 4 8 18 13 27 60 Subject Language 0 6 6 0 50 50 Subject other than Math or Language 1 8 8 6 47 47
Table A34: Results of moderator analyses examining the number and percentage of negative, non-significant and positive effects of extended learning time on academic achievement
Negative effects
Non-significant
effects
Positive effects
Negative effects
Non-significant
effects
Positive effects
Moderator N N N % % % Level of schooling Primary school 0 11 16 0 41 59 Secondary school
5 11 16 16 34 50
Country USA 1 7 13 5 33 62 UK 0 0 0 0 0 0 Netherlands 0 0 0 0 0 0 Country other than USA, UK and Netherlands
4 15 19 10 40 50
Covariates included Included covariate for student’s prior achievement
1 12 12 4 48 48
Included covariate for ability 0 0 0 0 0 0 Included covariate for SES
4 14 24 10 33 57
Statistical technique used Technique multilevel 4 11 12 15 41 44 Technique not multilevel 1 11 20 3 34 63 Total 5 22 32 8 37 54
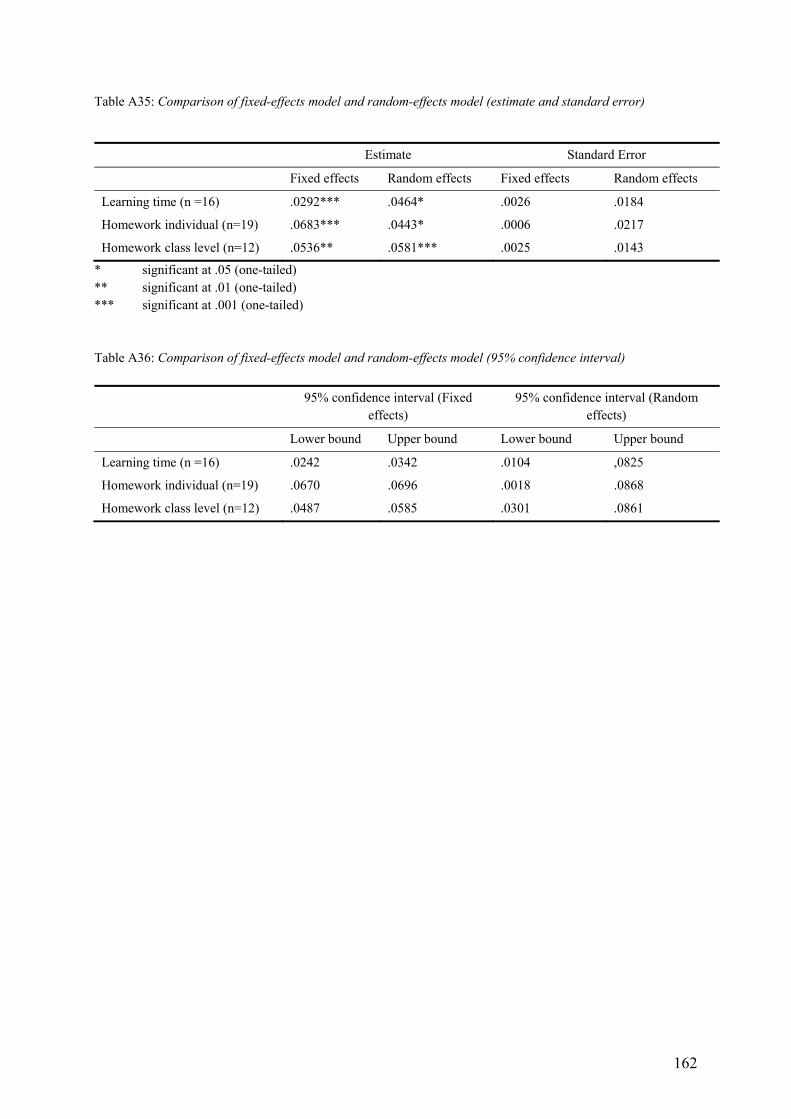
162
Table A35: Comparison of fixed-effects model and random-effects model (estimate and standard error)
Estimate Standard Error
Fixed effects Random effects Fixed effects Random effects
Learning time (n =16) .0292*** .0464* .0026 .0184
Homework individual (n=19) .0683*** .0443* .0006 .0217
Homework class level (n=12) .0536** .0581*** .0025 .0143
* significant at .05 (one-tailed) ** significant at .01 (one-tailed) *** significant at .001 (one-tailed) Table A36: Comparison of fixed-effects model and random-effects model (95% confidence interval)
95% confidence interval (Fixed effects)
95% confidence interval (Random effects)
Lower bound Upper bound Lower bound Upper bound
Learning time (n =16) .0242 .0342 .0104 ,0825
Homework individual (n=19) .0670 .0696 .0018 .0868
Homework class level (n=12) .0487 .0585 .0301 .0861