productive failure in the flipped mathematics …
TRANSCRIPT

Running head: PRODUCTIVE FAILURE IN THE FLIPPED MATHEMATICS CLASSROOM
PRODUCTIVE FAILURE IN THE FLIPPED MATHEMATICS CLASSROOM
By
JOHN KERRIGAN
A dissertation submitted to the
Graduate School of Education
Rutgers, The State University of New Jersey
in partial fulfillment of the requirements
for the degree of
Doctor of Education
Graduate Program in Design of Learning Environments
written under the direction of
________________________ Dr. Clark Chinn, Chair
________________________
Dr. Richard Novak
________________________
Dr. Keith Weber
New Brunswick, New Jersey
May 2018

PRODUCTIVE FAILURE IN THE FLIPPED MATHEMATICS CLASSROOM
ii
ABSTRACT OF THE DISSERTATION PRODUCTIVE FAILURE IN THE FLIPPED MATHEMATICS CLASSROOM
By John Kerrigan
Dissertation Director: Clark Chinn
ABSTRACT
The flipped classroom method of instruction involves a shift in how learning and
teaching take place. Students in a flipped classroom access video tutorials at home as their
primary means of instruction, while they work on rich problems requiring procedural and
conceptual knowledge in class. The flipped classroom approach has been gaining popularity in
higher education (Abeysekera & Dawson, 2015) and in mathematics (Muir & Geiger, 2015).
Although studies have addressed differences between flipped and traditional methods of
instruction, few have closely examined how to design activities in a flipped classroom that
develop students’ higher-order thinking skills (O’Flaherty & Phillips, 2015; Song & Kapur,
2017).
Kapur’s (2008) theory of productive failure states when students have an opportunity to
generate and explore solutions to a challenging task prior to being instructed on it, they are better
positioned to consolidate their knowledge during and after instruction. The purpose of this
mixed methods study was to determine whether repurposing the flipped classroom to include
productive failure results in students’ improved understanding of targeted mathematical content.
Through work samples and a survey, it was determined that there was no statistical significance between groups in terms of students’ performance on course assessments and video-watching behaviors. Correlations among various course assessments revealed a significant correlation between students’ work on one productive failure invention task and its corresponding conceptual knowledge posttest item.

PRODUCTIVE FAILURE IN THE FLIPPED MATHEMATICS CLASSROOM
iii
Through video footage of in-class problem solving and a focus-group interview, qualitative information about students’ knowledge development helped explain differences between the two learning environments. Students who had the productive failure experience described their peers as critical to their learning, whereas students who did not described their instructor as critical to their learning. A detailed look at individual groups in the productive failure condition revealed that students who generated more solutions and had routines for working in a small group on the invention tasks each week realized greater success, as evidenced by work samples and posttest items.
The results of this study will be used to guide the design of undergraduate mathematics
flipped classrooms so that online and in-person class activities promote deep conceptual
understanding.

PRODUCTIVE FAILURE IN THE FLIPPED MATHEMATICS CLASSROOM
iv
Keywords: flipped classroom, undergraduate mathematics, productive failure, educational technology, higher education, conceptual knowledge, procedural knowledge

PRODUCTIVE FAILURE IN THE FLIPPED MATHEMATICS CLASSROOM
v
Acknowledgements
When I first started Rutgers as an undergraduate in 2003, I just wanted to take courses to
become a math teacher and get to work with high school students as soon as possible. I never
imagined that my career at Rutgers was going to last beyond my time in the teacher education
program. I was fortunate to gain employment in the mathematics department in 2007, earning
my Ed.M. in mathematics education in 2008, and met some of my best friends along the way.
Coming back to Rutgers for a doctorate was always a dream of mine since I became a math
teacher. After years of debating on whether or not the time was right or if I could handle it, I am
so grateful I decided to come back when I did and complete my doctorate “at home.”
My sincerest thanks go out to a myriad of people who helped me along the way. I would
like to thank my chair, Dr. Clark Chinn, for his support and mentorship throughout the
dissertation process. You pushed me to think through every aspect of my project with a critical
eye for detail. I am so fortunate to have had you as my chair. I would like to thank my
committee members, Dr. Keith Weber and Dr. Richard Novak, for their support as well. Dr.
Weber, I was happy to reconnect with you at this stage of my education as I have taken so many
of your classes as a pre-service teacher and always respected your intelligence and approach to
mathematics education. Your wisdom has truly enriched my project, and I hope that we can
collaborate again in the future. Dr. Novak, thank you for taking time to meet with me and also
for giving me advice about online learning professional development and speaking opportunities.
I hope we can continue talking about online learning in the future.
This degree would not have been possible without the support of many faculty in the
GSE. Dr. Eli Silk, thank you for guiding me through the Design of Learning Environments
program. Your patience and positivity were helpful over the course of the program, particularly

PRODUCTIVE FAILURE IN THE FLIPPED MATHEMATICS CLASSROOM
vi
with ironing out the details of my proposal and pilot project. Dr. Angela O’Donnell, your class
was the first class I took as a doctoral student, and you made it very meaningful and enriching. I
always appreciated running into you and chatting with you on campus and through e-mail well
after your class was over. I will never forget your kindness.
To my colleagues and friends in the mathematics department who talked me into going
back for a doctorate, thank you! Dr. Alice Seneres, you are the math sister I never had; you were
always there for me and shared whatever you possibly could with me from your own research.
Dr. Michael Weingart, thank you for your never-ending support and for rearranging the master
schedule to allow me to teach classes while I took classes at the GSE. Without the time you
spent on the phone with me, meeting me in person after class late at night, and responding to all
of my e-mails, I would not be where I am today.
Finally, I would like to thank my immediate family (Margaret, John, and George) and
close friends for their support and understanding since I started the program. This process took a
lot of personal sacrifice, especially over weekends, summers, holiday breaks, and the well-timed
snow days that always seemed to follow a day or two after I had revisions to make to my
dissertation. I am glad you were all by my side the entire time. To Cheryl, Jason, Simone, and
Sara in particular: I could not have asked for a better dissertation group. I will miss our
discussions, adventures to local eateries, and camaraderie. Cheryl, thank you for always being a
phone call away over the past three years. We had the convenience of living and working nearby
one another, which helped us bounce ideas off one another and meet up to write together. Those
will be some of my fondest memories of my doctoral journey.
PRODUCTIVE FAILURE IN THE FLIPPED MATHEMATICS CLASSROOM
vii
Table of Contents
Abstract……………………………………………………………………………………………ii
Acknowledgements…………………………………………………………………………..……v
Table of Contents…………………………………………………………………………...……vii
List of Tables…………………………………………………………………………………….xii
List of Figures…………………………………………………………………………………...xiii
CHAPTER 1: INTRODUCTION…………………………………………………………………1
Statement of the Problem. ………………………………………………………...………1
Purpose of the Study…………………………………………….………………...………6
Embodied Conjecture………………………………………………………...……………7
Participation structure………………………………………….................……….9
Social surround……………………………………………………………………9
Invention tasks…………………………………………………………………...10
Video tutorials……………………………………………………………………11
In-class problems………………………………………………………………...11
Summary……..…………………………………………………………………..12
Research Questions………………………………………………………………………12
CHAPTER 2: LITERATURE REVIEW………………………………………………………...14
Introduction……..………………………………………………………………………..14
Hybrid Learning Environments……..…………………………………………………...14
Online and face-to-face components……..……………………………………...15
The Flipped Classroom Model……..……………………………………………………18
The evolution of flipped classroom……..………………….……………………18
Comparison of flipped and traditional classes…………………………………...21
Concerns about flipped classrooms……..………………………………….……23

PRODUCTIVE FAILURE IN THE FLIPPED MATHEMATICS CLASSROOM
viii
Procedural and Conceptual Knowledge………………………………………………….25
Definitions……..…………………………………………………………………26
The relationship between conceptual and procedural knowledge……………….27
Instructional focus………………………………………………………………..29
Delaying Instruction ……..………………………………………………………………31
Failure……..………………………………………………..……………………31
Preparing for learning……..……………………………………………………..32
Productive failure……..………………………………………………………….34
Conclusion……………………………………………………………………………….37
CHAPTER 3: METHODOLOGY……..………………………………………...………………38
Research Design……..…………………………………………………………………...38
Learning Environments……..……………………………………………………………39
Sample……..………………..……………………………………………………………41
Materials……..……………………..……………………………………………………43
Invention task for the PFFC group……..………...………………………………44
In-class problems……..……………………………………………………….…47
Procedural knowledge problems……..………………………..…………48
Conceptual knowledge problems……..……………………………….…49
Video sets……..…………………………………………………………….……51
Pretest and posttest ……...………………………………………………….……53
Pretest……..………………………………………………..……….……53
Posttest……..……………………………………………………….……54
Survey….……..…………………………………………………………….……55
Focus group interview ……...………………………..…………………….……56
Procedure……..……………………..……………...……………………………………57

PRODUCTIVE FAILURE IN THE FLIPPED MATHEMATICS CLASSROOM
ix
Pretest and posttest……...………………………………………….……58
In-class problems……………………...……...…………………….……58
Survey…………...………………………………………………….……58
Focus group interviews………...……………………………..…….……58
Video data...……...…………………………………………...…….……59
Data Analysis Plan ……..…………...……………...…………………………………....59
Pretest and posttest……...………………………………………….….…60
In-class problems……………………...……...…………………….……61
Survey…………...………………………………………………….……61
Focus group interview……..…...……………………………..…….……62
Video data..……...………………………………………………….……64
Limitations, reliability, and validity………………………………….…..64
CHAPTER 4: RESULTS……..……………………………………………………..…………...66
Coding……..…………………………………………………………………..................66
Scoring of in-class problems……..………………………………………………66
Scoring of pretests and posttests…………………………………………………69
Coding and scoring of invention tasks ………..…………………………………76
Coding the focus group interview……….……..………...………………………79
Coding the video data ……..………………………………………………….…82
Quantitative Results…………………………...……..………………………..…………83
Results of in-class problems……..……………………………………...…….…83
Results of pretests and posttests…………………………………………………84
Results of the invention tasks ………..………………………………………….85
Video-watching survey and analytics ……….……..………...………………….86
Correlational table..……..………………………………………………..….…...87

PRODUCTIVE FAILURE IN THE FLIPPED MATHEMATICS CLASSROOM
x
Conclusion……………………………………………………………….………89
Qualitative Results ………..…………………………………………………..…………90
Week #3 performance by group……….……..………...………………………...91
Week #3 video analysis ……..……………………………………….….92
Week #3 invention task analysis ……..……………………………….…95
Corresponding posttest question analysis………………………………..97
Outside of week #3…………….……..……………………………………….…98
Summary ……..……………………………………….………………………..102
Focus group interview results……..……………………………………….…...102
Question #1…………….……..………………………………………...103
Question #2…………….……..………………………………………...104
Question #3…………….……..………………………………………...106
Question #4…………….……..………………………………………...107
Question #5…………….……..………………………………………...107
Summary…………….……..……………………………………….…..108
Conclusion …………….……..……………………………………….………..109
CHAPTER 5: DISCUSSION…………….……..……………………………………….……...111
Purpose of the Study……..…….……………………………………………………….111
Discussion of Findings…………….……..…………………………………………..…112
Effects on procedural knowledge……………………………….……..………..112
Effects on conceptual knowledge ………..…………..…………………..…….113
Video-watching behaviors……...……….……..………...……………………..114
Mathematical inquiry process ……..…………………………………………...115
Video footage of in-class sessions ……..………………………………………116
Interpretation of Findings …………………...……..………………………..…………117

PRODUCTIVE FAILURE IN THE FLIPPED MATHEMATICS CLASSROOM
xi
Limitations and Directions for Future Research……..…………………………………120
Implications for Practice………………………………………………………………..123
REFERENCES….……………….………………………………………………….………….126
APPENDIX A: Invention Tasks ……………………….………………………………………138
APPENDIX B: In-Class Problems ……………………….…………………...…….…………139
APPENDIX C: Pretest………………………………….………………………………………155
APPENDIX D: Posttest………..……………………….………………………………………162
APPENDIX E: Survey ……………………….……………………………………...…………170
APPENDIX F: Focus Group Interview Protocol ………………………………………………171
APPENDIX G: Classroom Schedule and Question Protocol …………………………….……172
APPENDIX H: Field Notes…………………………………………………………………….174

PRODUCTIVE FAILURE IN THE FLIPPED MATHEMATICS CLASSROOM
xii
List of Tables
Table 1. Sequence of Activities in the DIFC and PFFC Learning Environments……………….40
Table 2. Sample Characteristics………………………………….…………….………………..42
Table 3. Alignment of Materials………………………………….…….………………………..43
Table 4. Content of Each Weekly In-Person Problem-Solving Session……………...…………..48
Table 5. Video Set Schedule and Content………………………………….………………...…..51
Table 6. Data Sources and Analysis………………………………….……………...……..……57
Table 7. Codes………………………………….………………………………………………..63
Table 8. Scoring Rubric for In-Class Problems………………………………….……..……..…68
Table 9. Pretest and Posttest Scoring Rubric………………………………….……….………..70
Table 10. Examples of Graded Responses to Posttest Question #4……………………………..75
Table 11. Scoring of Invention Tasks………………………………….…………………..……..76
Table 12. Focus Group Interview Coding Scheme………………………………….….………..81
Table 13. Descriptive Statistics for Weekly In-Class Problems…………………………..……..84
Table 14. Descriptive Statistics for the Pretest and the Posttest ………………………………..84
Table 15. Descriptive Statistics for Specific Posttest Items………………………………..….…85
Table 16. Descriptive Statistics for the Invention Tasks…………………………..…..…………85
Table 17. Results of Students’ Video Watching Activities (PFFC and DIFC) ………….........…86
Table 18. Video Analytics from Kaltura (PFFC and DIFC) ……………………………..…..…87
Table 19. Correlations of Scores on Assessments in the PFFC Group…………………...……..89
Table 20. Week #3 Performance in Two PFFC Groups………………………………..………..92
Table 21. Video Analysis of Group A’s Invention Task #3 Solution……………………………..94
Table 22. Video Analysis of Group B’s Invention Task #3 Solution……………………………..95
Table 23. Identification of Critical Features in Written Solutions to Invention Tasks…………..99
Table 24. Solution Proposals from Group Members……………………………...……………100

PRODUCTIVE FAILURE IN THE FLIPPED MATHEMATICS CLASSROOM
xiii
List of Figures
Figure 1. Embodied conjecture for PFFC learning environment………………………………....8
Figure 2. Posttest item on the Lone Divider Method……………………………………..……..71
Figure 3. Example of a coded and scored posttest item………………………………….….…..73
Figure 4. Posttest question #4 as it appeared to students………………………………………..74
Figure 5. Invention task #3 prompt given to students…………………………………….……..77
Figure 6. Example of an invention task score that received a score of “1.” ………………..…..79
Figure 7. Maryann’s solution to the invention task on fair division…………………...………..96
Figure 8. Maryann’s solution to dishonest bidding conceptual understanding question on the
posttest………………………………….………………………………………………………..98

PRODUCTIVE FAILURE IN THE FLIPPED MATHEMATICS CLASSROOM 1
CHAPTER 1: INTRODUCTION
Mathematics in the undergraduate setting has traditionally been taught in lecture format
with a heavy focus on procedures (Goldsmith & Mark, 1999). Instructional strategies that are
limited to procedures often prohibit students from using their own reasoning and intuition as they
learn mathematical concepts (Boaler, 2002; Bransford, Brown, & Cocking, 1999). Meaningful
mathematics instruction also involves a focus on enhancing students’ conceptual understanding
and problem solving skills as they engage in classroom activities (Song & Kapur, 2017).
Statement of the Problem
Balancing the instructional focus to include students’ active development of conceptual
knowledge has anecdotally been challenging for math instructors far and wide as they struggle to
cover large curricula within prescribed time frames (Muir & Geiger, 2015). As a result, many
instructors have started to blend their classes with face-to-face and online interaction in order to
offer students multiple opportunities for concept development and exploration (Bergmann &
Sams, 2012). Kapur and Song (2017) have also noted the difficulty involved with teaching
conceptually and recognized how changing the modality of the instruction is not the solution to
this problem, but rather a closer look at the instruction itself is needed to make improvements. In
response to advances in online course capabilities and the prevalence of online learning tools and
resources (Bergman & Sams, 2012), the Rutgers University Mathematics Department started
converting traditional lecture-based mathematics courses to hybrid courses in order to afford
students with opportunities to actively engage with course content while also developing a
stronger conceptual knowledge base (Prince, 2004). The design of learning activities within
these non-traditional learning environments has been of interest to instructors as they continue to
develop opportunities for students to actively construct their mathematical knowledge.

PRODUCTIVE FAILURE IN THE FLIPPED MATHEMATICS CLASSROOM 2
One such course that has shifted away from lecture-based instructional methods is the
“Topics in Mathematics for Liberal Arts” (Math 103) course, which serves as the context for this
study. Math 103 is a popular course for non-majors to take to fulfill their quantitative
requirement with classes often running at full capacity, which is approximately 35 students per
section. Since its creation in the 1990s, the course has only been taught traditionally with two
face-to-face lectures each week for 16 weeks. Beginning in the Spring 2015 semester, several
hybrid versions of the course have been offered in such a way that students attend one class
meeting a week and learn online asynchronously in lieu of the other weekly face-to-face
meeting. Instructional time in this hybrid course is repurposed so that the initial learning takes
place outside of class, while active problem solving and application take place inside of class.
The hybrid sections of Math 103 have been taught using the flipped classroom model.
Despite the fact that there is no uniform definition of flipped classroom (Song & Kapur, 2017),
conventional understanding of the flipped classroom method of instruction is that the sequence
of classwork and homework is inverted in order to allow students to complete homework during
class under a teacher’s guidance. The process of learning in a flipped classroom is supported by
technology as students first learn by working through asynchronous video tutorials and then have
the ability to access electronic resources as they solve problems during the in-person class
meeting and after class (Baepler, Walker, & Driessen, 2014). The advantage of inverting the
order of learning activities in a flipped classroom is that students are free to learn through the
videos at their own pace while also having the support of the instructor and peers in class to
actively construct knowledge. In fact, several studies have shown that students in flipped classes
benefit from working on problems with peer tutoring and instructor coaching (Bergmann &
Sams, 2012; Moraros, Islam, Yu, Banow, & Schindelka, 2015).

PRODUCTIVE FAILURE IN THE FLIPPED MATHEMATICS CLASSROOM 3
However, Song and Kapur (2017) noted that a flipped classroom could essentially be viewed as a form of direct instruction if learning activities are not properly designed, especially if a flipped classroom involves just a switch of where lecture and practice occur. As Math 103 continues to be offered in a hybrid flipped classroom format, instructors continue to question how to design an effective flipped classroom learning environment that focuses on improving students’ learning outcomes, rather than being a mere reorganization of the activities that take place in a lecture-based course. Since the Spring 2015 semester, several adjustments to the
course have been made toward that effort including a student-led review at the start of each in-
person class session and an increased effort by the instructors to use the reflective toss
questioning strategy to have students attempt to answer one another’s questions (Zhang,
Lundeberg, McConnell, Koehler, & Eberhardt, 2010). In addition, instructors have also
encouraged students to think aloud and make sense of their understanding as they worked
through examples in the video tutorials in an effort to build metacognitive thinking in the
classroom (Jonassen, 2006; Vamvakoussi & Vosniadou, 2004). Whereas these efforts might
have been helpful in the short-term to increase active learning opportunities for students, work
samples and conversations with students have revealed that they still struggle with problem
solving on class assignments and assessments. In particular, my own observations from
facilitating the in-class session have revealed that the main cause of their difficulties seems to lie
in initiating the problem-solving process.
Despite the availability of online resources and a room full of peers, students often
immediately seek my help in initiating the problem-solving process, particularly those that
require deeper conceptual knowledge to solve. My students have also experienced the same
difficulties on exam questions involving the use of conceptual knowledge. In trying to determine

PRODUCTIVE FAILURE IN THE FLIPPED MATHEMATICS CLASSROOM 4
why this may be the case, it seems that students have difficulty drawing on prior knowledge and
also consolidating what they’ve learned from video tutorials for future use during the in-person
class session. This has been especially apparent during my in-class problem-solving sessions
where students have to utilize their resources to solve different types of problems in small
groups. Research in the area of flipped classroom supports the notion that some students do
perceive a disconnect between in-class and out-of-class learning activities (Bowers & Zazkis,
2012). Reasons for the disconnect could include in-class activities that fail to address students’
misconceptions or out-of-class activities that rely on low-level factual recall (Andrews, Leonard,
Colgrove, & Kalinowski, 2011). Reflecting back on previous interventions I’ve tried in the
course, I only focused on one aspect of learning in the flipped classroom: either the online
portion or in-person portion of the class. A better intervention would position students to learn
both at home through instructional videos then in-class through the collaborative application of
content.
O’Flaherty and Phillips (2015) recognized the lack of conceptual frameworks available in
the flipped classroom literature to guide the development of flipped classroom learning activities.
They found that whereas instructors do recognize the value of using instructional approaches that
lend themselves to active learning, they seem to struggle with having students build conceptual
thinking through a planned sequence of learning activities (O’Flaherty & Phillips, 2015). In
mathematics specifically, building students’ ability to think conceptually involves having them
activate and differentiate prior knowledge when engaging in problem-solving (Kapur &
Bielaczyc, 2012). This requires mathematics teachers to create opportunities for students to
communicate their conceptual understanding, which is achieved through designing a safe and
supportive social surround where students feel comfortable generating solutions to various types
PRODUCTIVE FAILURE IN THE FLIPPED MATHEMATICS CLASSROOM 5
of problems (Kapur & Bielaczyc, 2012). These design provisions are most associated with in-
class activities; in a flipped classroom, the challenge comes with building opportunities for
students to learn concepts both inside and outside of class.
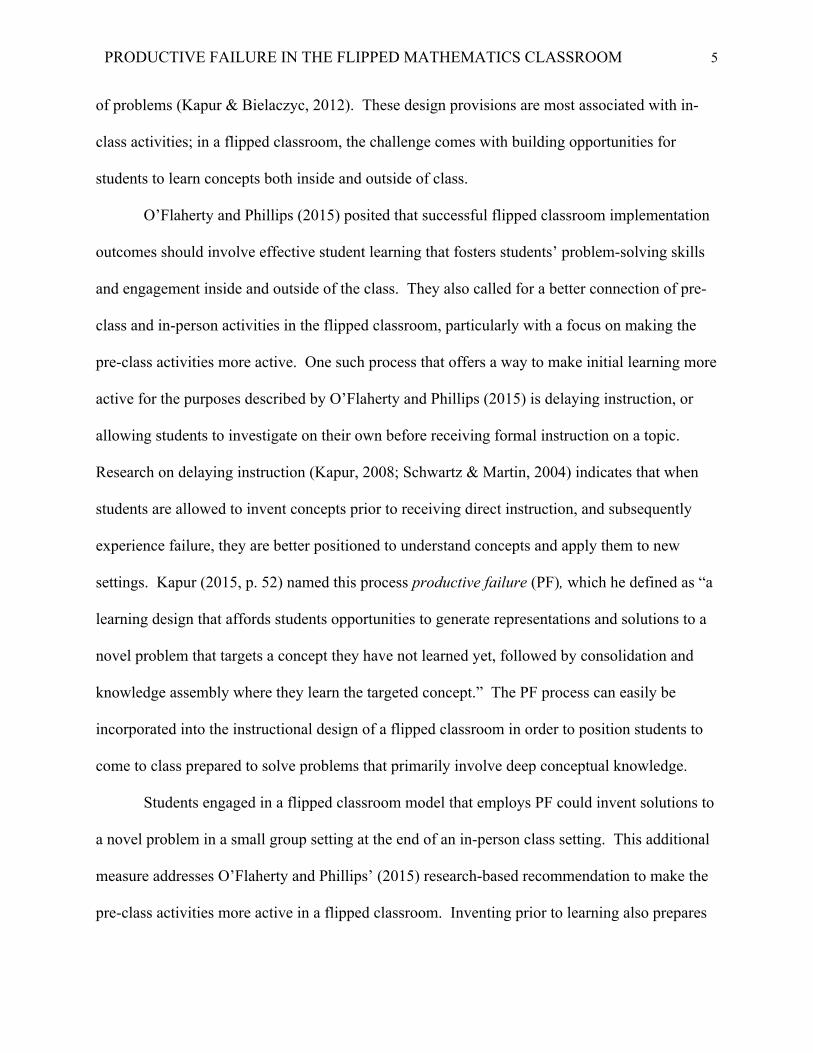
O’Flaherty and Phillips (2015) posited that successful flipped classroom implementation
outcomes should involve effective student learning that fosters students’ problem-solving skills
and engagement inside and outside of the class. They also called for a better connection of pre-
class and in-person activities in the flipped classroom, particularly with a focus on making the
pre-class activities more active. One such process that offers a way to make initial learning more
active for the purposes described by O’Flaherty and Phillips (2015) is delaying instruction, or
allowing students to investigate on their own before receiving formal instruction on a topic.
Research on delaying instruction (Kapur, 2008; Schwartz & Martin, 2004) indicates that when
students are allowed to invent concepts prior to receiving direct instruction, and subsequently
experience failure, they are better positioned to understand concepts and apply them to new
settings. Kapur (2015, p. 52) named this process productive failure (PF), which he defined as “a
learning design that affords students opportunities to generate representations and solutions to a
novel problem that targets a concept they have not learned yet, followed by consolidation and
knowledge assembly where they learn the targeted concept.” The PF process can easily be
incorporated into the instructional design of a flipped classroom in order to position students to
come to class prepared to solve problems that primarily involve deep conceptual knowledge.
Students engaged in a flipped classroom model that employs PF could invent solutions to
a novel problem in a small group setting at the end of an in-person class setting. This additional
measure addresses O’Flaherty and Phillips’ (2015) research-based recommendation to make the
pre-class activities more active in a flipped classroom. Inventing prior to learning also prepares

PRODUCTIVE FAILURE IN THE FLIPPED MATHEMATICS CLASSROOM 6
students to learn better from subsequent instruction (Kapur, 2014), a strategy that has been
absent from the traditional flipped classroom design. Granberg (2016) also found that the
process of correcting and reconstructing prior knowledge through a failure process ultimately
helps students develop new conceptual knowledge in math class. After the failure process,
students consolidate and assemble knowledge through video tutorials outside of the classroom.
As a result of the activation of prior knowledge and consolidation of new knowledge, students
enter the next in-person class prepared to work on activities that deepen their conceptual
understanding (Roehl, Reddy, & Shannon, 2013), making their in-class experience move beyond
the rote practice of procedures. As Bahr and DeGarcia (2008) found, students’ procedural
knowledge is inherently limited by their conceptual knowledge, thereby making the case stronger
for designing activities in the flipped classroom that require students to use their conceptual
knowledge. In fact, Kapur and Song (2017) found that employing a PF design within the flipped
classroom such as the one described allows students to gain a deeper conceptual understanding
of mathematics.
Purpose of the Study
The purpose of this quasi-experimental mixed-methods study was to determine if
restructuring the flipped classroom to include PF would result in students’ improved
understanding of targeted content (Song & Kapur, 2017). Song and Kapur (2017, p. 295)
referred to a blended learning environment that employs PF as a “productive failure-based
flipped classroom” (PFFC), which served as one of the conditions in the study. The second
condition was a direct instruction-based flipped classroom (DIFC). The DIFC learning
environment resembled a flipped classroom design in which students’ first interaction with new

PRODUCTIVE FAILURE IN THE FLIPPED MATHEMATICS CLASSROOM 7
content was when they learned through instructional videos. One section of Math 103 was
randomly assigned to each treatment condition during the Fall 2017 semester.
In this study, quantitative data from a video-watching survey and students’ work samples
were used to test the theory of PF, which predicts that a delay of instruction by means of an
invention task will positively influence learning and transfer across contexts (Kapur, 2008). Of
particular interest was the quality of students’ work on posttest items involving the use of
conceptual and procedural knowledge. In tracing how students performed on their posttests,
video-watching data, video footage of in-class problem-solving sessions, and focus group
interview responses were used to carefully examine the mediating processes that resulted in
learning mathematics. Video-watching data revealed how and when students accessed their
“instruction,” and whether or not students who experienced PF accessed videos more or less
often than students who did not. Additionally, qualitative focus group interview data illuminated
students’ experiences with PF tasks and their subsequent work quality. Video footage of the in-
class problem-solving sessions also provided further evidence for the efficacy of PF as a learning
intervention and was used to complement students’ work samples and responses to the focus
group interview questions.
Embodied Conjecture
As Sandoval (2014, p. 22) discussed, “design research typically aims to create novel
conditions for learning that theory suggests might be productive but are not common or well understood.” The PFFC learning environment is one such novel environment that has been shown to be productive for students (Song & Kapur, 2017), but also needs to be broken down into the mechanisms and structures that support learning. As the purpose of this study was to examine whether restructuring the flipped classroom resulted in students’ improved

PRODUCTIVE FAILURE IN THE FLIPPED MATHEMATICS CLASSROOM 8
understanding of targeted learning outcomes, a careful look at mediating processes (video watching and in-class problem-solving) and final outcomes (posttest results on procedural and conceptual understanding) is necessary to understand the design components of the intervention. Figure 1 shows the conjecture mapping for the PFFC learning environment.
Figure 1. Embodied conjecture for PFFC learning environment.
The high-level conjecture draws from diSessa, Hammer, Sherin, and Kolpakowski’s
work (1991), which suggests that students’ prior knowledge is a critical element in a pedagogical
design. Students in a DIFC may not have the opportunity to draw on prior knowledge outside of
watching the instructional videos, whereas students in the PFFC group have the additional
opportunity to do so through an invention task. Each of the critical design features in the PFFC

PRODUCTIVE FAILURE IN THE FLIPPED MATHEMATICS CLASSROOM 9
is described in detail below to provide insight into the learning sequence in a PFFC.
Participation structure. As the facilitator of both sections of the course, I enabled
collaboration in small groups so that students could evaluate, critique, and explain shared work,
thereby enriching shared solution spaces on both problems that required procedural and
conceptual knowledge to solve (Chi, Glaser, & Farr, 1988; diSessa et al., 1991; Kapur, 2015;
Scardamalia & Bereiter, 2003). Groups were pre-arranged during the first few weeks of the
semester so that students could be matched with peers who were productive in their problem-
solving. This determination was made based on my observations of group work during the first
few weeks of class. Having pre-arranged groups allowed me to leverage the social dynamics in
the classroom to ensure students were working with peers who would be efficient in helping one
another learn (Cohen, Lotan, Abram, Scarloss, & Schultz, 2002). This also involved group norm
setting for problem-solving and sharing of ideas, which I facilitated once the semester started
through the use of a suite of scaffolds. I also facilitated the group problem-solving process by
paraphrasing students’ explanations if they were in need of assistance and drew their attention to
critical features in their work as opportunities arose. For example, I had students try to re-
explain their understanding of main concepts from the videos and had them link the concepts to
the problems they were solving.
Social surround. Reflecting back on the need for this intervention, I have found that
many students ask for help on problems before they even attempt to try the problems themselves.
To help address this issue, my design embodiment included the provision of a mathematical
safe space (Kapur & Bielaczyc, 2012) where students were encouraged to take mathematical
risks. To foster the development of this safe space, I modeled strategies for working in groups
with the students during the first class session, with an emphasis on free sharing of ideas. I also

PRODUCTIVE FAILURE IN THE FLIPPED MATHEMATICS CLASSROOM 10
assisted students in judging the constraints and affordances of their representations and solutions
methods (RSMs), instead of merely classifying their work as “right” or “wrong.” Last, I also
provided affective support to individual students and groups of students by providing students
with epistemic strategies for thinking like mathematicians. These measures were taken to allow
students to actively engage in problem-solving with support from both myself and their peers.
Invention tasks. Schwartz and Martin (2004) found that student-centered activities
could effectively prepare students for future learning. Specifically, they found that having
students invent a concept prior to receiving formal instruction on the topic was superior to the
traditional “tell and practice” method of instruction (Schwartz & Martin, 2004). As a result, my
PFFC instructional design included invention tasks that prepared students for future learning
through video tutorials. One task was given each week for four weeks as students learned four
brand new concepts. Following Kapur and Bielaczyc’s (2012) recommendations for designing a
PF learning environment, each invention task was pitched at a level of difficulty that was meant
to challenge students but not frustrate them. Kapur and Bielaczyc (2012, p. 51) have referred to
this as “sweet spot calibration,” where problem complexity, affective draw, and students’ prior
mathematical resources are taken into account when designing the problem. Because Math 103
is a course on math applications in the liberal arts, all problems had an affective draw as they
were grounded in actual situations (fair division of goods, apportionment of states, etc.).
Students were also able to rely on their constructive resources to generate multiple RSMs to the
invention tasks (diSessa & Sherin, 2000), as all of the problems required the use of basic
mathematical operations like division, multiplication, ratios, to name a few. The invention tasks
served to better position students to activate and differentiate prior knowledge before receiving
direct instruction.

PRODUCTIVE FAILURE IN THE FLIPPED MATHEMATICS CLASSROOM 11
Video tutorials. Each week, students accessed a set of brief instructional videos on the
course’s learning management system. These videos served as the “direct instruction”
component of the flipped classroom and were designed in a way that allowed students to learn
one concept at a time in each video tutorial. Each set consisted of approximately 13-15 short
videos each week. Each video was narrated and annotated with worked examples and relevant
definitions and ended with a problem for students to try before they moved on to the next video.
Once the students moved on to the next video, they were brought to a fully guided and annotated
solution to the problem they just worked out independently. These end-of-video problems
served as opportunities for students to practice and understand the material they just learned, as
the primary purpose of the video tutorials was for students to consolidate their knowledge from
the PF experience (Song & Kapur, 2017). Students were encouraged to use productive video
watching habits, which included rewinding and pausing content, working on embedded practice
problems, thinking aloud, and taking notes as part of the instructional design. As a result of
watching the videos, students were able to consolidate their knowledge from the invention task
and the concepts presented in the videos.
In-class problems. Sandoval (2014) described how observable interactions between
participants and their artifacts can serve as a way to understand the mediating processes that
emerge from a design. After the mathematical safe space and group norms were established
in the class, students transitioned into structured collaborative groups of approximately three to
four students each where they solved problems related to the content of the invention task and
corresponding video set. These problems were adequately complex, engaging, and drew on
students’ mathematical resources, just as the invention task did. There were two types of
problems for each in-person class session: well-structured application problems which required

PRODUCTIVE FAILURE IN THE FLIPPED MATHEMATICS CLASSROOM 12
students to work out problems similar to the worked examples in the videos and involved more
procedural knowledge, and more complex problems that required students to think very
conceptually to invent cases and counterexamples to develop a solution. In this context, a
problem requiring conceptual knowledge would involve students trying to generate an example
or at least outline the conditions necessary for a mathematically fair division of an item to occur.
Staying true to Kapur and Bielaczyc’s (2012) recommendations, both problem types were open
to multiple RSMs. This means that the problems could have been approached with multiple
representation systems, such as ratios, trial and error, and algebra.
Summary. Each of the preceding sections has presented a description of how each of the
design features was expected to shape learning outcomes in the course. These effects were
measured through posttests that assessed conceptual and procedural mastery of targeted concepts
in the course. Some questions primarily assessed procedural knowledge of topics covered in the
unit, including execution of fair division, fair distribution, and apportionment methods. Another
group of questions assessed students’ conceptual knowledge of apportionment, flaws of
apportionment, and ways of gaming a fair division settlement to result in desired outcomes. The
key distinction between the question types on the posttest is that the conceptual knowledge
questions were unfamiliar to students and required them to draw on the invention tasks, videos,
and in-class problems to develop solutions.
Research Questions
The research questions involved a careful examination of two flipped classroom designs:
the DIFC, which involved students watching video clips for homework followed by solving more
challenging problems during class, and the PFFC, which involved invention prior to learning,
PF, followed by consolidation through video watching (Schwartz & Martin, 2004; Song &

PRODUCTIVE FAILURE IN THE FLIPPED MATHEMATICS CLASSROOM 13
Kapur, 2017). Each question aimed at addressing various parts of the embodied conjecture,
including the in-class inquiry process, video-watching behaviors, and conceptual and procedural
knowledge gains. The following research questions are focused on the contrast between the
PFFC and DIFC:
1) What is the effectiveness of flipped classroom pedagogical design interventions on the
development of students’ procedural knowledge, particularly on their written work
samples?
2) What is the effectiveness of flipped classroom pedagogical design interventions on the
development of students’ conceptual knowledge, particularly on their written work
samples?
3) How do video watching behaviors influence students’ learning performance in the DIFC
and PFFC learning environments?
4) How do students in both the DIFC and PFFC learning environments describe their in-
class mathematical inquiry process?
5) How do students’ problem solutions to in-class problems and their interactions as they
discuss these problems mediate conceptual and procedural learning as measured on the
posttest?
This study provided evidence on whether a productive-failure-based flipped classroom
differed from a traditional flipped classroom in promoting student learning. The quantitative and
qualitative data gathered in this study will be used improve the design of undergraduate flipped
classroom mathematics learning environments so that both the online and in-person class
activities promote deep conceptual understanding.

PRODUCTIVE FAILURE IN THE FLIPPED MATHEMATICS CLASSROOM 14
CHAPTER 2: LITERATURE REVIEW
Introduction
As the purpose of this study was to examine how restructuring the flipped classroom to
include productive failure could result in students’ improved understanding of targeted content, I
drew on four bodies of literature: hybrid learning environments, the flipped classroom model,
conceptual and procedural understanding in mathematics, and delaying instruction. Because this
study examined what learning looked like specifically in a hybrid mathematics course, the first
part of the literature review will focus on the components of hybrid learning environments. I
will use the term “hybrid” in place of “blended” where applicable, as many studies interchange
the two words. Second, I will draw on flipped classroom studies in order to provide a more
nuanced understanding of the merits and drawbacks of the type of pedagogy employed in the
research site. Third, the roles of conceptual and procedural knowledge in mathematics will be
discussed as they relate to one another and the research context. Finally, relevant research in the
area of delaying instruction will then be explored in a way that provides a theoretical framework
for the study. Taken as a whole, these bodies of literature will contribute to a better
understanding of what the learning environment and learning process should look like when
productive failure is added into the design of a hybrid flipped classroom learning environment.
Hybrid Learning Environments
A common course delivery type in the undergraduate setting is the hybrid classroom.
Hybrid courses involve “an integration of face-to-face and online learning experiences—not a
layering of one on top of the other” (Garrison & Kanuka, 2004, p. 99). This means that learning
activities in a hybrid course should move beyond just a mix of virtual and in-person lectures.
Instead, activities should be purposefully designed for both the online and in-person sessions so

PRODUCTIVE FAILURE IN THE FLIPPED MATHEMATICS CLASSROOM 15
that they stimulate students’ thinking. Hybrid course formats have gained attention for their
potential to change the landscape of learning. In 2010, the United States Department of
Education released a meta-analysis that focused on online learning in both the K-12 and higher
education arenas. One of the key findings that emerged from this analysis was that students by
and large saw stronger learning outcomes in instructional formats that blended online and face-
to-face instruction compared to students who received pure online or pure face-to-face
instruction (Means, Toyama, Murphy, Bakia, & Jones, 2009). In fact, the researchers found the
average effect size for blended learning to be .35 (p < .001) when compared to purely face-to-
face instruction. Despite the fact that curricular materials, aspects of pedagogy, and learning
time in both conditions were not all equalized, this finding suggests that blended learning is
advantageous for students for reasons beyond the media used in the course (Means et al., 2009).
The varied instructional delivery methods in a hybrid course format do have appeal for
both students and teachers for various reasons; however, the delivery method itself is less critical
than the actual design and management of a hybrid course (Bourdeau & Bates, 1996; Mortera-
Gutiérrez, 2006). The next section examines the design and integration of the online and face-to-
face components of a hybrid course along with the implications they have on students’ learning.
As previously suggested by Means et al. (2009), hybrid course design must involve a careful
look at the non-media components of a course, including the establishment of a learning
community and instructor-student interactions.
Online and face-to-face components. Several studies point to the importance of the
learning community in creating an effective hybrid learning environment (Chen & Chiou, 2014;
Collopy & Arnold, 2009; Helyer & Corkill, 2015; McGee & Reis, 2012). In a hybrid course
such as the one in the research site, designing opportunities for learners to work together during
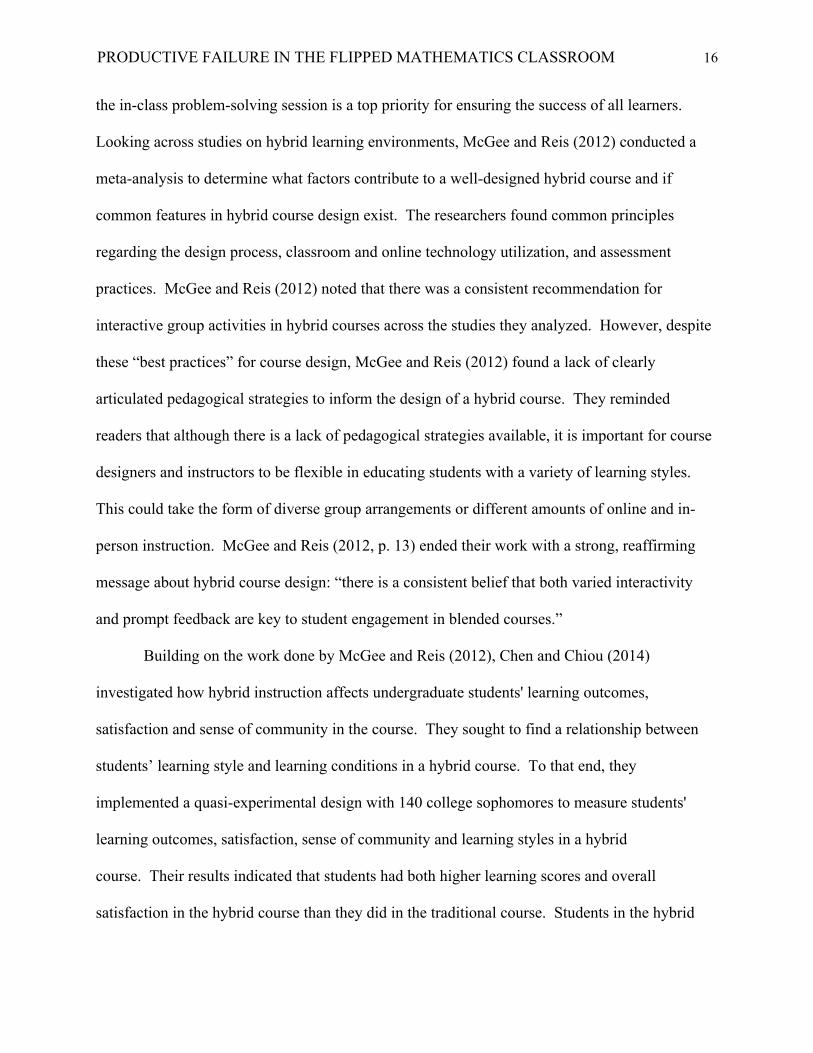
PRODUCTIVE FAILURE IN THE FLIPPED MATHEMATICS CLASSROOM 16
the in-class problem-solving session is a top priority for ensuring the success of all learners.
Looking across studies on hybrid learning environments, McGee and Reis (2012) conducted a
meta-analysis to determine what factors contribute to a well-designed hybrid course and if
common features in hybrid course design exist. The researchers found common principles
regarding the design process, classroom and online technology utilization, and assessment
practices. McGee and Reis (2012) noted that there was a consistent recommendation for
interactive group activities in hybrid courses across the studies they analyzed. However, despite
these “best practices” for course design, McGee and Reis (2012) found a lack of clearly
articulated pedagogical strategies to inform the design of a hybrid course. They reminded
readers that although there is a lack of pedagogical strategies available, it is important for course
designers and instructors to be flexible in educating students with a variety of learning styles.
This could take the form of diverse group arrangements or different amounts of online and in-
person instruction. McGee and Reis (2012, p. 13) ended their work with a strong, reaffirming
message about hybrid course design: “there is a consistent belief that both varied interactivity
and prompt feedback are key to student engagement in blended courses.”
Building on the work done by McGee and Reis (2012), Chen and Chiou (2014)
investigated how hybrid instruction affects undergraduate students' learning outcomes,
satisfaction and sense of community in the course. They sought to find a relationship between
students’ learning style and learning conditions in a hybrid course. To that end, they
implemented a quasi-experimental design with 140 college sophomores to measure students'
learning outcomes, satisfaction, sense of community and learning styles in a hybrid
course. Their results indicated that students had both higher learning scores and overall
satisfaction in the hybrid course than they did in the traditional course. Students in the hybrid

PRODUCTIVE FAILURE IN THE FLIPPED MATHEMATICS CLASSROOM 17
course also felt a greater sense of community than their counterparts did in a traditional
course. Analysis of learning style showed that learning style had a significant effect on learning
outcomes in the study group. The results of this study provide some additional evidence for the
importance of interactivity and a learning community in a hybrid course.
Similarly, Collopy and Arnold (2009) studied 80 undergraduate teacher education
candidates to better understand students’ comfort while working in both online and hybrid
learning environments. Their 19 question, Likert-type survey asked a variety of questions, with
an emphasis on interactions and working in teams. The researchers found a significantly higher
level of learning reported by students in the hybrid format versus in the purely online
format. Reasons for this included the fact that blending face-to-face and online learning
environments in a hybrid class allowed for a reciprocal structure for student learning. The face-
to-face learning environment supported group development, group member accountability, and
commitment, as well as effective processing of content with the instructor and class
members. The online learning environment enhanced the face-to-face learning environment by
giving students time to think, process the material, and discuss the content online outside of class
time. The online environment also increased individual accountability. One limitation of this
study is that the researchers taught the courses they collected data in, so there may be threats to
internal validity (Brown, 1992), which could put the findings in question.
The literature on the hybrid learning model suggests a careful balance of both in-class
and online activities in an effectively designed hybrid course, supported by a learning
community that fosters the students’ and instructor’s willingness to participate. Achieving this
balance requires instructors to move beyond the lecture and incorporate strategies that get
students actively involved in learning. Having students actively involved in learning necessitates

PRODUCTIVE FAILURE IN THE FLIPPED MATHEMATICS CLASSROOM 18
pedagogical techniques that lend themselves to the development of a learning community,
frequent interaction between the instructor and students, and a careful integration of activities
both in person and online (Chen & Chiou, 2014; Collopy & Arnold 2009; Helyer, & Corkill,
2015; McGee & Reis, 2012). The next section of the literature review describes a particular type
of hybrid pedagogy that embodies these characteristics and was also employed in the research
site.
The Flipped Classroom Model
Hybrid course formats in the college setting can vary greatly with lecture used in
different proportions both inside and outside of class. As a result, hybrid courses are usually
associated with some type of “digital habitat” that accompanies face-to-face learning, where
technology tools allow students and the instructor to work collaboratively on a topic of interest
(Wenger, White, & Smith, 2009). Undergraduate learners typically gravitate toward media-rich
hybrid learning environments as they view learning as a “plug-and-play” experience, one where
they can participate and experiment in learning activities with peer cooperation (Duderstadt,
2001). One example of a technology-driven pedagogy that has gained popularity because of its
balance of online and face-to-face learning is the flipped classroom.
The evolution of flipped classroom. Research on the flipped classroom took hold at the
beginning of the millennium (Lage, Platt, & Treglia, 2000). Within the last ten years, instructors
who have created flipped classrooms have been gravitating away from pre-class
readings and have been instead using pre-class streaming lectures (Day & Foley, 2006; Moravec,
Williams, Aguilar-Roca, & O'Dowd, 2010; Naccarato & Karakok, 2015). The flipped classroom
model has come a long way and continues to evolve as more educators embrace using it.
Lage et al. (2000) provided one of the earliest definitions of what a flipped classroom is.

PRODUCTIVE FAILURE IN THE FLIPPED MATHEMATICS CLASSROOM 19
Lage et al. (2000, p. 32) used the phrase “inverted classroom” to describe how “events that have
traditionally taken place inside the classroom now take place outside the classroom and vice
versa.” Lage et al. (2000) performed qualitative research on an inverted undergraduate
economics course to better understand the implications of inverting class activities. Their
findings indicated an inverted learning model bred inclusivity in the class, increased motivation
of both faculty and students, and left class members feeling more positive about learning. This
study also raised additional questions about the flipped classroom model, including the roles of
group work, motivation, questioning, and faculty preparation.
Day and Foley (2006) later answered some of these questions, as they were early
pioneers of utilizing streaming multimedia lessons in the flipped classroom. They employed a
quasi-experimental design to see if a flipped course taught at Georgia Institute of Technology
would be just as, or more, educationally effective and enjoyable than a traditional lecture-style
version of the same course. Day and Foley (2006) conducted their research over a 15-week
semester with a total of 46 students in two sections of the same course. The strength of this
study was that the same professor taught both sections of the course and blind grading was used
for the entire semester. After examining grades and self-reported attitudes, the researchers found
that students in the flipped classroom section earned significantly higher grades than students did
in the traditional lecture section. Students in the flipped classroom section also had increasingly
strong positive attitudes about the method of instruction.
Along the same line, Moravec et al. (2010, p. 473) determined that “there is mounting
evidence that a variety of pre-class activities that introduce new material can increase student
performance compared with traditional lectures.” Moravec et al. (2010) called their approach
“learn before lecture (LBL),” which is analogous to the flipped classroom approach. In this

PRODUCTIVE FAILURE IN THE FLIPPED MATHEMATICS CLASSROOM 20
approach, the researchers introduced new content to a large introductory biology lecture hall by
removing four to five slides from their 2007-2008 class lecture presentations and turned them
into streaming PowerPoint lectures in 2009. This was done for three out of 30 lectures. Class
time was then spent applying new knowledge learned from LBL materials. Learning was
evaluated by comparing student performance in 2009 versus 2007-2008 on LBL questions.
Overall findings indicated that students saw a 21% mean performance increase across the LBL
questions. Based on this information, the researchers determined that LBLs along with
interactive class exercises can be administered incrementally and result in modest learning gains
in large introductory biology classes. One weakness of the study is that the researchers
employed this strategy on only a few lectures and not the entire course. It would be interesting
to see if doing this for every lecture would produce the same results.
The flipped classroom model is still evolving as teachers and researchers work to design
courses that optimize students’ learning. In contexts similar to the research site, Naccarato and
Karakok (2015) explored trends in the implementation of the flipped classroom model in
undergraduate mathematics classes. They conducted a qualitative study to explore different
implementations of the flipped classroom model by interviewing 19 faculty members with
flipped classroom experience at 14 different higher education institutes. Results indicated that
instructors had similar motivations for using the flipped classroom: more student practice
through exercises and application problems, increased collaborative learning opportunities, and
more opportunities for higher-order thinking. These are some of the exact same reasons for
using flipped classroom approach at the research site; problems offered during the in-class
meeting offer students opportunities to work together to solve problems that require both

PRODUCTIVE FAILURE IN THE FLIPPED MATHEMATICS CLASSROOM 21
procedural and conceptual knowledge. The next section examines performance differences
between students in flipped and traditional classes as a result of their work in class.
Comparison of flipped and traditional classes. In tracing the evolution of the flipped
classroom, many studies seemed to focus on students’ performance differences in traditional
learning environments versus flipped classroom environments (Eichler & Peeples, 2016; Gross,
Pietri, Anderson, Moyano-Camihort, & Graham, 2015; Maciejewski, 2015; Stone, 2012;
Wasserman, Quint, Norris, & Carr, 2017). A strength of this line of inquiry is that there is a lot
of quantitative evidence to support increased exam performance when using a flipped classroom
approach over a traditional lecture-based approach.
Eichler and Peeples (2016) used flipped classroom modules in large general chemistry
lecture halls in an effort to increase active learning opportunities and student performance. By
flipping the large lecture halls (250+ students), the researchers were able to provide their
students with collaborative group inquiry-based activities instead of a lecture during class time.
Quantitative findings showed students in a flipped version of general chemistry had a higher
course-wide GPA (2.923) compared to students in the non-flipped version of the same course
(2.807). In addition to overall GPA, overall exam performance and scores on clicker formative
assessments were higher in the flipped chemistry course than in the non-flipped course. Stone
(2012) also observed similar positive results in his flipped college Genetic Diseases course,
where students performed almost 13 points higher on midterm examinations than their peers did
who were in traditional lecture versions of the same course.
Gross et al. (2015) spent years investigating how college students prepare to learn in a
flipped classroom and what the results of their preparation look like. They conducted an
experiment in which they took an undergraduate physical chemistry class and observed student

PRODUCTIVE FAILURE IN THE FLIPPED MATHEMATICS CLASSROOM 22
outcomes over the course of five years in both a flipped version and traditional version of the
same course. Gross et al. (2015) found that exam performance significantly improved by about
12% in the flipped course. Online homework completion and accuracy were also greater in the
flipped version of the course. Gross et al. (2015) largely attributed these results to the flipped
classroom method of instruction. Despite the substantial quantitative evidence over a long time
period, a limitation of the study that must be taken into account is the variability in college
students’ motivations and study habits when it comes to examinations. In addition, the quality of
the instruction in both treatment conditions must also be further examined, as the processes that
lead to posttest results are important parts of the learning environment design.
In terms of college-level mathematics courses, findings from a larger study of 690 first-
year calculus students (Maciejewski, 2015) also indicated that students in a flipped class
outperform students in an equivalent lecture-based class on posttest items. However, the same
study also revealed that students with little prior knowledge in calculus and good mathematics
skills thrived the most in the flipped setting. Wasserman et al. (2017) noticed similar findings in
their two-semester study of students’ learning in a flipped Calculus III course; students in the
flipped version of Calculus III showed similar performance on procedural problems and
moderate gains on conceptual problems compared to their counterparts in a traditionally taught
Calculus III section. Both studies pointed to the need to closely examine the learning processes
beyond the posttest to gain a more nuanced understanding of learning in the flipped classroom.
In particular, the reasons for why certain students do better in this type of environment and how
flipped classrooms support procedural and conceptual knowledge gains warrant further
exploration.

PRODUCTIVE FAILURE IN THE FLIPPED MATHEMATICS CLASSROOM 23
Concerns about flipped classrooms. The aforementioned studies described mostly
positive views and performance increases associated with the flipped classroom. Another series
of studies on flipped classroom suggests some students have difficulty with aspects of the model
or feel that some parts of the model are less satisfying than others (Frederickson, Reed, &
Clifford, 2005; Strayer, 2012; Tague & Czocher, 2016; Toto & Nguyen, 2009). Some of these
problems are the same problems students have been facing in the research site.
In a study on learner satisfaction in a flipped classroom, Strayer (2012) found that the
flipped classroom strategy might not be the best for introductory college courses. Strayer taught
both a flipped and a traditional lecture version of a statistics course and found that students in the
flipped course were not satisfied with the way they were prepared for the tasks they had to
complete. Despite the fact that students in the flipped classroom very much enjoyed the
collaboration within the learning community, their lack of prior knowledge on the topic made it
difficult for them to keep up with the intensive nature of the course. In addition, students’
performance likely depended on the details of the instruction in both settings. Planned learning
activities could have had slight variation between the flipped version and traditional version of
the same course.
Frederickson et al. (2005) found similar results in their experimental study of students’
learning in a flipped research methods and statistics course. Using cognitive and affective
domain data from 16 first-year college students, they found that students thought the online
learning component of the flipped course was less than satisfying. However, students rated the
in-class collaboration component of the course very highly. Despite the small number of
students in the sample, a key result that emerged from this study was the importance of building

PRODUCTIVE FAILURE IN THE FLIPPED MATHEMATICS CLASSROOM 24
a learning community both online and in person so that students could value collaboration and
social interaction in both settings.
Toto and Nguyen (2009) studied the relationship between learning style and the flipped
classroom approach in an undergraduate industrial engineering course. Their study involved 74
undergraduate juniors who completed three survey items: the Soloman and Felder’s Index of
Learning Styles Questionnaire, a quiz at the beginning of class, and a survey at the end of the
semester. Their results indicated that visual-verbal learners and sequential-global learners found
it difficult to sit through instructional videos and focus on the material. In addition, active
learners found the intensive in-class component to be beneficial to their understanding of
concepts, whereas reflective and sensing-intuitive students needed more clarification and review
before starting the in-class work. Taken all together, the results of this study indicate different
aspects of the flipped classroom approach appeal to different learners.
Building on all of these studies, Tague and Czocher (2016) explored the disconnect
between in-class and out-of-class activities in a flipped classroom that seemed to surface in the
earlier studies. Their hypothesis was that flipped classroom activities might orient themselves to
low-level recall by students and may fail to address students’ misconceptions. They described
the issue to be rooted in of a lack of curricular coherence, which they defined as the extent to
which mathematical content is organized logically, cognitively, and epistemologically sequenced
(Tague & Czocher, 2016), and a lack of instructional coherence, which they defined as the
connection of in-class material, out-of-class material, and targeted content. Using 80
undergraduate students in a Differential Equations course, Tague and Czocher examined
students’ perceptions of curricular and instructional coherence by designing their course to
reduce cognitive obstacles and curricular/instructional incoherence. Their results of

PRODUCTIVE FAILURE IN THE FLIPPED MATHEMATICS CLASSROOM 25
administering four small surveys to students during their course indicated that over 90% of
students found that in-class and out-of-class activities were directly connected. These students
were also able to articulate their reasons why they felt class activities were connected, citing
things such as useful “refresher” activities, and “review of concepts from past classes” (Tague &
Czocher, 2016). This study filled a void in the literature on flipped classroom on the disconnect
between in-class and out-of-class activities and how to purposefully design the two for coherent
learning.
The aforementioned studies on flipped classroom suggest that great learning gains are
possible in this type of learning environment, especially when it is designed to include
opportunities for learners to collaboratively work in small learning communities. However,
some studies revealed that this approach does not work for every student. Song and Kapur
(2017) cautioned us that the real question to consider is how to design the flipped classroom
learning environment so that all students have opportunities to engage in learning activities that
enhance their higher-order thinking skills. Given the complex nature of both the online and in-
person class sessions in a hybrid flipped classroom, it is important to consider how to design
activities that lead to students’ successful procedural and conceptual knowledge development.
The next section considers the roles of procedural and conceptual knowledge in mathematics and
their importance in designing learning activities for students. Findings from the literature on
conceptual and procedural understanding will be used to guide the development of hybrid flipped
classroom learning activities at the research site.
Procedural and Conceptual Knowledge
As Roehl et al. (2013) pointed out, millennials have a preference for learning in
environments that include an easy connection to information, multitasking, and group

PRODUCTIVE FAILURE IN THE FLIPPED MATHEMATICS CLASSROOM 26
collaboration. The previously described literature on hybrid and flipped classroom learning
environments support the use of learning activities to encourage active information access and
peer collaboration. However, instructors in a flipped classroom not only face the task of
motivating students to learn, but they also have to cover the curriculum in a way that promotes
learning (Muir & Geiger, 2015). In mathematics, this includes working with students to develop
the procedural and conceptual knowledge necessary to solve problems. As definitions of both
procedural and conceptual knowledge continue to evolve, researchers agree that both conceptual
and procedural knowledge are intricately related and important to develop in the mathematics
classroom (Ambrose, Clement, Philipp, & Chauvot, 2004; Bahr & DeGarcia, 2008; Baroody,
Fiel, & Johnson, 2007; Hiebert & Lefevre, 1986; Star, 2005).
Definitions. Conceptual knowledge has been defined in numerous ways. One of the
earliest definitions of conceptual knowledge offered by Hiebert and Lefevre (1986, pp. 3-4)
indicates that conceptual knowledge is “knowledge that is rich in relationships. It can be thought
of as a connected web of knowledge, a network in which the linking relationships are as
prominent as the discrete pieces of information.” More recent definitions of conceptual
knowledge break down the definition into more specific details, ranging from “an integrated and
functional grasp of mathematical ideas” (National Research Council, 2001, p. 118), to “the
quality of one’s knowledge of concepts” (Star, 2005, p. 407), to “knowledge about facts,
[generalizations], and principles” (Baroody, et al., 2007, p. 107). Support for all of these
definitions comes from research on conceptual change, which indicates that novices need their
conceptual knowledge integrated over the course of their learning, whereas experts’ conceptual
knowledge expands and becomes better organized over time (diSessa, Gillespie, & Esterly, 2004;
Schneider & Stern, 2009). Looking across definitions, several key features of conceptual

PRODUCTIVE FAILURE IN THE FLIPPED MATHEMATICS CLASSROOM 27
knowledge emerge, including relationships, knowledge of how to use mathematics, and a
repertoire of strategies. These commonalities seem to hint at a knowledge of procedures or
strategies for solving mathematical problems.
Procedural knowledge is commonly viewed among mathematics educators as a
knowledge of procedures or rote memorization. Indeed, researchers have defined procedural
knowledge as knowledge of the specific rules and procedures for solving mathematics problems
(Hiebert & Lefevre, 1986; Rittle-Johnson, Siegler, & Alibali, 2001; Star, 2005). Baroody et al.
(2007) expanded on this definition by adding in the mental actions, manipulations, strategies, and
algorithms needed to solve problems. Many educators often equate procedural knowledge with a
naïve or superficial understanding of a topic; however, procedural knowledge is important in
mathematics as it gives students a method for navigating a problem. In sum, procedural
knowledge involves knowing how to do something, whereas conceptual knowledge involves
understanding how the features of a problem allow one to understand why a certain procedure is
appropriate for a task (Booth, 2011).
The relationship between conceptual and procedural knowledge. Despite the fact
that conceptual knowledge and procedural knowledge are defined separately, both types of
knowledge are interrelated (Bahr & DeGarcia, 2008; Baroody et al., 2007; Rittle-Johnson et al.,
2001). Looking at definitions of procedural and conceptual knowledge, there appear to be
important similarities and differences between the two types of knowledge. Star (2005) and
Baroody et al. (2007) described the key difference between procedural and conceptual
knowledge to be the type of connection; conceptual knowledge is related to knowledge that has
rich connections, whereas procedural knowledge is related to knowledge that is not richly
connected. Additionally, Baroody et al. (2007, p. 23) noted that “depth of understanding entails

PRODUCTIVE FAILURE IN THE FLIPPED MATHEMATICS CLASSROOM 28
both the degree to which procedural and conceptual knowledge are interconnected and the extent
to which that knowledge is otherwise complete, well structured, abstract, and accurate.” These
findings suggest that although the two types of knowledge are different, there appears to be a
relationship between the depth of both procedural and conceptual understanding in mathematics.
In terms of similarities, both types of knowledge can be viewed along a continuum from
superficial to deep (Bahr & DeGarcia, 2008; Baroody et al., 2007; Star, 2005). Deep procedural
knowledge entails flexibility and critical judgment, in addition to efficiency and accuracy in
manipulating procedures (Bahr & DeGarcia, 2008; Baroody et al., 2007). Deep conceptual
knowledge involves being able to consistently apply mathematical logic, make generalizations,
and apply a variety of principles to solve problems. Superficial types of both knowledges
involve only being able to make local generalizations and/or heavily rely on procedures
(Baroody et al., 2007; Rittle-Johnson et al., 2001). These definitions seem to suggest a symbiotic
relationship between procedural and conceptual knowledge; students’ learning may be inhibited
by a deep procedural instructional focus that doesn’t afford opportunities for conceptual
knowledge development. As a result, mathematics instructors need to cultivate both types of
knowledge in their courses; course formats like flipped classrooms offer ways for instructors to
provide additional opportunities for students to think and learn procedurally and conceptually
both at home and in class.
Research on the development of conceptual and procedural knowledge in young children
also indicates that children’s procedural knowledge is inherently limited by their conceptual
knowledge (Bahr & DeGarcia, 2008). For example, whereas students demonstrate ease of
working with numbers, a lack of conceptual understanding limits what children can do with
those numbers (Bahr & DeGarcia, 2008). Rittle-Johnson et al. (2001) produced similar findings;

PRODUCTIVE FAILURE IN THE FLIPPED MATHEMATICS CLASSROOM 29
children’s initial conceptual knowledge gains later predicted procedural knowledge gains. In
addition, in a study of teacher beliefs about mathematics, Ambrose et al. (2004) found that
teachers whose perspectives about teaching mathematics by promoting understanding often
believed that mathematics is a web of interrelated concepts and procedures and that students who
learn concepts first are subsequently more likely to understand procedures. These results show
the importance of building a conceptual knowledge base in students so that they are positioned to
develop additional conceptual knowledge and procedural knowledge. This has implications for
the research site because the learning activities in the flipped classroom were aimed at promoting
procedural and conceptual understanding with an emphasis on cultivating conceptual
understanding during the in-person class meeting.
Instructional focus. In light of the previous discussion of procedural and conceptual
understanding, it is also important to examine the instructional practices that lead to both types of
understanding. A balance between focusing instruction on procedural and conceptual learning is
a key part of developing students’ mathematical fluency, especially before they get to college
(National Council of Teachers of Mathematics, 2000). Focusing on computational methods
without understanding could result in students forgetting or incorrectly remembering content; in
fact, students must have conceptual understanding in order to be fluent in mathematical
procedures. To take a closer look at instructional focuses, Rittle-Johnson and Alibali (1999)
investigated instructional strategies that were primarily conceptual in nature and strategies that
were primarily procedural in nature. Using 60 fourth and fifth-grade students and a
pretest/posttest design, Rittle-Johnson and Alibali (1999) found that conceptual instruction led to
increased conceptual understanding, invention of procedures, and transfer of procedures. They
also found that procedural instruction led to some increased conceptual understanding, but only

PRODUCTIVE FAILURE IN THE FLIPPED MATHEMATICS CLASSROOM 30
adoption and very limited transfer of the procedure they were instructed on. The key takeaway
from their study was that the relationship between procedural and conceptual knowledge is not
unidirectional, but the development of conceptual knowledge has a greater effect on procedural
knowledge than the reverse. The only known advantages of teaching procedurally seem to be
that instructors who teach students multiple procedures set their students up to better problem
solvers than students who have only been taught to use one single procedure (Alibali & Goldin-
Meadow, 1993; Siegler, 1995).
Flipping the classroom involves a shift in when and how direct instruction takes place in
a class. This has implications for how conceptual and procedural knowledge are developed both
with and without the instructor present. Whereas many flipped classroom studies have examined
students’ performance differences and qualitative aspects of learning in a flipped classroom,
there are few studies available on how to effectively design learning activities in a flipped
classroom that encourage higher-order conceptual thinking (Song & Kapur, 2017). In the
traditional classroom setting, delaying instruction has often been used with great success because
it allows students to mobilize their prior knowledge in order to become prepared for the future
learning of a topic (e.g. Kapur, 2008; Schwartz & Martin, 2004). In addition, the process of
failing while trying to generate new knowledge has been shown to be productive for learning
(Kapur, 2008; Kapur & Bielaczyc, 2012). These findings, coupled with the structure of a hybrid
flipped classroom, suggest that delaying instruction could be a way to improve the design of a
flipped classroom so that students can transition in and out of online and in-person learning
activities more prepared to learn. Studies on failure, invention, and productive failure are
discussed in the next section as a way to provide a theoretical framework for the intervention
used in this study.

PRODUCTIVE FAILURE IN THE FLIPPED MATHEMATICS CLASSROOM 31
Delaying Instruction
Each of the subsections below outlines the development of delaying instruction as a
learning intervention, leading up to a recent study on delaying instruction specifically in the
flipped classroom. By providing both the history and empirical support for delaying instruction,
its utility in developing students’ conceptual and procedural knowledge in the hybrid flipped
classroom can be better understood.
Failure. Research on experiencing failure dates back to work done as early as 1984
when Clifford first discovered the benefits of “constructive failure.” The key behind
constructive failure is that students turn failed attempts into problem-solving opportunities,
where they develop “strategy explanations” to explain their failure, rather than attributing their
failure to effort or ability. Clifford (1984) postulated that success is often associated with initial
failure and at times guaranteed by failure experiences. Schmidt and Bjork (1992) expanded on
this idea by demonstrating how “desirable difficulties” during the initial learning process can set
the stage for deeper learning experiences in the long term, despite short-term performance losses.
In fact, similar to Clifford (1984), Schmidt and Bjork (1992) went as far as to say conditions that
do not seem to support initial learning actually result in better long-term learning.
More recent empirical studies have bolstered the claims made by Clifford (1984) and
Schmidt and Bjork (1992) by supporting the role of failure in the learning process (Schwartz &
Bransford, 1998; VanLehn, Siler, Murray, Yamauchi, & Baggett, 2003). VanLehn et al. (2003)
explored the idea of “impasse-driven learning” with 42 college students who worked through
physics problems under the guidance of expert tutors. Through an analysis of over 125 hours of
dialogue between tutors and students to see which features of the dialogue were associated with
learning, VanLehn et al. (2003) found that successful learning of physics content was associated

PRODUCTIVE FAILURE IN THE FLIPPED MATHEMATICS CLASSROOM 32
with the instance of impasse during the problem-solving process. When students did not reach
an impasse, students often did not successfully learn the content, even with the assistance of an
expert tutor. The major takeaway from VanLehn et al.’s (2003) work is the power of the
impasse; delaying instruction and explanations until students reach a dead end is a viable strategy
for helping students experience deep learning. The next section takes a closer look at the ways
impasse and delaying instruction prepares students for future learning.
Preparing for learning. Building on the idea of delaying instruction with college
students, Schwartz and Bransford (1998) investigated the role of “preparation for future
learning” (PFL) with their undergraduate students. Schwartz and Bransford (1998) conducted an
experiment in which one group of college students had to create a summary of a chapter on
memory studies, whereas another group had to analyze data sets from the studies to create a
graph representing important patterns in the data. The students who created the graph did not see
the chapter on memory studies. On a follow-up true-false assessment, students who created a
summary did better than students who had to create a graph from the data sets. A more detailed
look at these results revealed that although these students performed better on the assessment,
they seemed to be better at retrieval of facts instead of learning for the purpose of transfer.
In the second part of the same study, students in both conditions were able to view a
lecture on the memory studies. When a posttest was given a week later, students were given a
task in which they had to predict the results of a new experiment. Students who were in the
graphing condition were able to produce twice as many correct possible results to the new
experiment. Schwartz and Bransford (1998) concluded that these students went into the lecture
more prepared to learn as evidenced by their ability to generate many correct solutions. To be
able to assign credit to the design features, Schwartz and Bransford (1998) also gave this test to

PRODUCTIVE FAILURE IN THE FLIPPED MATHEMATICS CLASSROOM 33
students who did the graphs but did not have the lecture; those students performed the worst on
the posttest. A major implication from this study is that whereas the graphing activity did not
have immediate payout on the true-false assessment, students were still able to develop new
forms of knowledge that helped them to prepare for the lecture and subsequently apply the
information they learned. Advocates of the direct instruction approach have criticized the use of
PFL as they feel there is a lack of control and manipulation of experimental variables, making it
difficult to assign credit to particular design features (Kirschner, Sweller, & Clark, 2006).
The efficacy of PFL was later affirmed by research by Schwartz and Martin
(2004). Schwartz and Martin (2004) conducted two studies on teaching statistics to students to
investigate whether invention activities helped students prepare to learn. Schwartz and Martin
(2004) described this approach as “inventing to prepare for learning” (IPL), which involves
giving students tasks related to a new topic where they must attempt to invent a canonical
solution to a problem. This activity precedes direct instruction and application of the content
covered in the IPL task. In their experiment, Schwartz and Martin (2004) used a 2x2 between-
subject experimental design where some students were assigned to an IPL group, whereas others
were assigned to a direct instruction (DI) group. Then, half of the students in each group
received a resource item on their posttest, which gave explicit steps for solving the mathematics
problem. Students in the IPL group were given data that they had to develop standardized test
scores for (invention phase). After the invention stage, students received a worked example on
how to standardize scores (instruction phase). Students in the control group were given direct
instruction on standardizing scores prior to working on a sample problem.
Schwartz and Martin (2004) found that students in the experimental group outperformed
the students in the control group on a transfer test, which involved applying the concept of

PRODUCTIVE FAILURE IN THE FLIPPED MATHEMATICS CLASSROOM 34
standardized scores to a new context. Despite the fact that students failed to come up with valid
solutions when engaging with the invention tasks, students ultimately did better on future
learning assessments. In addition, students with the embedded resource in their posttest were
more prepared to learn during the assessment. Schwartz and Martin (2004) were able to add
additional credibility to earlier studies on the efficacy of delayed instruction and failure (Clifford,
1984; Schmidt & Bjork, 1992; Schwartz & Bransford, 1998; VanLehn et al., 2003). In fact, the
idea of delaying instruction by means of students working through an IPL task, and subsequently
experiencing short-term failure, forms the basis for my research questions and design. This type
of intervention is called productive failure (PF) and has been used in mathematics classroom for
a number of years (Kapur, 2016). The next section describes the history of PF along with its
uses in the mathematics classroom.
Productive failure. There is a widely held view that learning experiences should be
appropriately scaffolded in order for learners to avoid failing (Kapur, 2008). Indeed, advocates
of learner-centered design argue that scaffolds should be provided to students in order for the
conceptual distance between novice and expert, or “gulf of expertise,” to be minimized
(Quintana, Shin, Norris, & Soloway, 2005). To challenge this viewpoint, Kapur (2008)
investigated whether there is some type of efficacy in the failure process. To do so, Kapur has
tested a PF model in numerous contexts (2008, 2010, 2011, 2012, 2014, 2015, 2016) to illustrate
how novice learners could attempt to generate solutions to highly ill-structured problems without
having prior instruction on the task’s content. Kapur has observed that when novices work on
ill-structured tasks, their inability to generate a canonical solution to a problem could ultimately
be productive in helping themselves achieve a deep understanding of the topic. Kapur’s large

PRODUCTIVE FAILURE IN THE FLIPPED MATHEMATICS CLASSROOM 35
body of work adds additional evidence to support the role of failure and delaying instruction in
the learning process.
One such study that highlights the power of failure and delaying instruction is Kapur’s
2010 study on PF in mathematical problem-solving. In this study, Kapur (2010) compared a PF
design with a “lecture and practice” (LP) design. A total of 75 7th grade math students from
Singapore participated in this study during a unit on speed. Students in the PF group were given
more complicated problems involving speed to work on in small groups. During this process,
the teacher did not provide any support or scaffolding until the end of the unit when a
consolidation lecture was given. Kapur (2010) employed process and outcome measures to
determine the efficacy of the PF experience, including a qualitative look at work samples and
group discourse, in addition to a quantitative look at work samples and students’ confidence
ratings. Unsurprisingly, students in the PF group reported low confidence while they initially
attempted to solve the problems (1.22 out of four points on a scale of zero to four
points). However, they produced an array of linked problem representations and problem-
solving methods as a result of their attempts to solve the problem. Even though they were
unsuccessful during the problem-solving process, students in the PF group managed to
outperform their peers in the control group on both well-structured and complex posttest
questions. In addition, students in the PF group were able to perform better on problems
involving a high-level concept that was not covered during class.
Kapur and Bielaczyc (2012) elaborated further on the PF instructional approach by noting
how PF experiences may seem counterproductive at first because learners are not being “told”
how to do a problem right away; however, PF supports long-term learning. Kapur and Bielaczyc
(2012) described the PF design as one that involves a problem-solving phase, followed by a
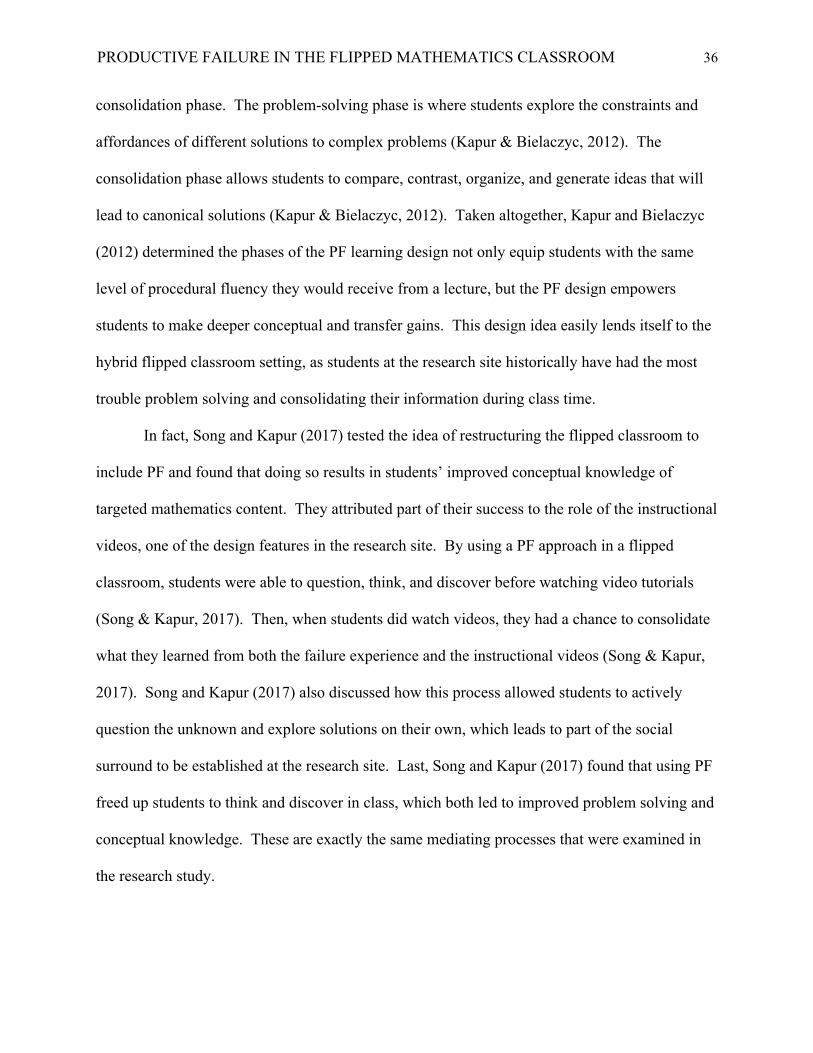
PRODUCTIVE FAILURE IN THE FLIPPED MATHEMATICS CLASSROOM 36
consolidation phase. The problem-solving phase is where students explore the constraints and
affordances of different solutions to complex problems (Kapur & Bielaczyc, 2012). The
consolidation phase allows students to compare, contrast, organize, and generate ideas that will
lead to canonical solutions (Kapur & Bielaczyc, 2012). Taken altogether, Kapur and Bielaczyc
(2012) determined the phases of the PF learning design not only equip students with the same
level of procedural fluency they would receive from a lecture, but the PF design empowers
students to make deeper conceptual and transfer gains. This design idea easily lends itself to the
hybrid flipped classroom setting, as students at the research site historically have had the most
trouble problem solving and consolidating their information during class time.
In fact, Song and Kapur (2017) tested the idea of restructuring the flipped classroom to
include PF and found that doing so results in students’ improved conceptual knowledge of
targeted mathematics content. They attributed part of their success to the role of the instructional
videos, one of the design features in the research site. By using a PF approach in a flipped
classroom, students were able to question, think, and discover before watching video tutorials
(Song & Kapur, 2017). Then, when students did watch videos, they had a chance to consolidate
what they learned from both the failure experience and the instructional videos (Song & Kapur,
2017). Song and Kapur (2017) also discussed how this process allowed students to actively
question the unknown and explore solutions on their own, which leads to part of the social
surround to be established at the research site. Last, Song and Kapur (2017) found that using PF
freed up students to think and discover in class, which both led to improved problem solving and
conceptual knowledge. These are exactly the same mediating processes that were examined in
the research study.

PRODUCTIVE FAILURE IN THE FLIPPED MATHEMATICS CLASSROOM 37
Conclusion
The literature on delaying instruction and failure suggest that the combination of using an
invention task, having students experience failure, and delaying instruction cannot only better
position students to learn, but also to help them make conceptual knowledge gains. The hybrid
flipped classroom design easily allows for students to try an invention task at the end of an in-
person class with a small learning community, experience failure before watching instructional
videos outside of class, watch the videos as “direct instruction,” then come to class having
watched the videos ready to work with classmates on a set of problems.

PRODUCTIVE FAILURE IN THE FLIPPED MATHEMATICS CLASSROOM 38
CHAPTER 3: METHODOLOGY
The following sections outline the research design, materials, data collection, and data
analysis measures for this study. The actual materials used are included as appendices at the end
of the document.
Research Design
A mixed methods quasi-experimental research design was used with two flipped hybrid
“Topics in Mathematics for Liberal Arts” (Math 103) classes to test the hypothesis that having
students experience PF in a flipped classroom would result in students’ improved procedural and
conceptual understanding. A quasi-experimental approach was a practical necessity for this
study because this study sought to determine if there was a cause-and-effect relationship between
the PF experience and learning outcomes in Math 103 (Creswell, 2014). Quasi-experimental
designs are also used when individuals are not randomly assigned, as was the case in this context
(Creswell, 2014). Students involved in this study deliberately chose to take a flipped section of
Math 103 instead of a traditional lecture-based section. In addition, a mixed-methods study was
chosen because the research questions involved gathering both quantitative and qualitative data
to better understand learning in each of the flipped classroom designs (Creswell, 2014).
One section of Math 103 (N=31) was the control group taught using the direct
instruction-based flipped classroom model (DIFC), whereas the other section (N=22) was taught
using the PF-based flipped classroom model (PFFC) during the sixth through ninth weeks of the
semester. It should be noted that normally sections of Math 103 run at almost 35 students each,
however, enrollment seemed to drop this semester and one section had a lower enrollment than
the other. The treatment groups were randomly assigned by using a random number generator.

PRODUCTIVE FAILURE IN THE FLIPPED MATHEMATICS CLASSROOM 39
The researcher was the instructor for both sections and had 10 years of experience teaching this
particular course, with four semesters teaching it in the hybrid flipped classroom format.
Learning Environments
Two different versions of the learning environment for Math 103 were used as the
contexts for this study. Math 103 is a very popular course at Rutgers University for non-
mathematics majors to take to fulfill a School of Arts and Sciences (SAS) quantitative
requirement. In fact, the course attracts students from a wide range of liberal arts and social
science disciplines including journalism, political science, education, and world language, to
name a few. Math 103 investigates a variety of areas in which mathematics is concretely
applied, including voting systems, the measurement of power in weighted voting systems,
apportionment, fair division, fair distribution, and exponential growth in nature and finance.
These topics were selected because (a) they are relevant for students who are majoring in areas
outside of the physical sciences, and (b) mathematical research into these areas is ongoing, which
allows students to engage in additional research and writing opportunities as they relate to their
areas of interest. The overarching learning goals for the course are (a) to formulate, evaluate,
and communicate conclusions and inferences from quantitative information, and (b) to apply
effective and efficient mathematical or other formal processes to reason and to solve problems.
Instructors design learning opportunities within Math 103 so that students find the content
engaging and accessible, even if students are convinced that mathematics is not their strongest
subject.
Both the DIFC and PFFC learning environments in Math 103 involved the combination
of having students learn from video tutorials, followed by active learning opportunities for
students to deepen their conceptual understanding under the facilitation of the instructor (Prince,

PRODUCTIVE FAILURE IN THE FLIPPED MATHEMATICS CLASSROOM 40
2004; Roehl et al., 2013). The main difference between the two environments was the purpose
of the video tutorials. In the PFFC model, students first worked on an invention task at the end
of each in-person class session that adopted the PF strategy (Kapur, 2008; Schwartz & Martin,
2004). This means that students worked on an engaging task they had not yet received formal
instruction on, but the task itself was sufficiently difficult that students would have trouble
finding a completely correct solution to it (Kapur & Bielaczyc, 2012). Then, students watched
video tutorials on the topic of the invention task in an effort to consolidate its concepts and
associated procedures (Song & Kapur, 2017). The process ended with students coming to class
to work on problems that required both procedural and conceptual knowledge in a small group
setting. In the DIFC model, students watched videos first in order to gain initial exposure to the
content. Then, they worked on the same problems in groups under the facilitation of peers and
the instructor. These students continued to work on problems until the end of class, whereas
their PFFC counterparts engaged in the next invention task for the last 15 minutes of class. This
cycle repeated for four weeks during the unit on apportionment, fair division, and fair
distribution, leading up to the summative assessment on these topics. Table 1 outlines the
sequence of events for one lesson in each learning environment.
Table 1 Sequence of Activities in the DIFC and PFFC Learning Environments Learning Environment
End of in-person class #1 (15 min)
Outside of class
preparation
Start of in-person class #2 (10 min)
Middle of in-person class #2 (55 min)
End of in-person class #2 (15 min)
DIFC Additional practice problem on current topic
Work through a set of 13-15 videos
Quiz on videos Solve five or six problems facilitated by teachers and peers
Additional practice problem on current topic
PFFC Invention task on new topic
Work through a set of 13-15 videos
Quiz on videos Solve five or six problems facilitated by teachers and peers
Invention task on new topic

PRODUCTIVE FAILURE IN THE FLIPPED MATHEMATICS CLASSROOM 41
Sample
The sample for this study was drawn from the undergraduate population of the Rutgers
University-New Brunswick campus. Rutgers-New Brunswick currently has an undergraduate
population of approximately 36,168 students, of which 53 took part in this study (Rutgers
University, 2017). The students were undergraduate liberal arts majors who deliberately opted to
take a flipped hybrid course upon registration. The student population of Rutgers University is
ethnically diverse, with approximately 7.6% of students being African American, 24.4% Asian,
0.2% Hawaiian, 12.3% Latino, 0.1% Native American, 11.4% International, 39.4% White, 2.9%
two or more ethnicities, and 1.8% unknown (Rutgers University, 2017).
Based on undergraduate enrollment figures from the 2016-2017 academic year,
approximately 14.5% of the 674 students in all sections of Math 103 were seniors, 23.2% were
juniors, 28.4% were sophomores, and 33.9% were freshmen. The students in each section did
not exactly follow this distribution; the PFFC group had more freshmen students, whereas the
DIFC group had a disproportionate number of seniors. In addition, two students in the DIFC
group had advanced mathematical training prior to this course, which is unusual since Math 103
does not count toward any math or computer science major. Both of these students took the
course as an elective out of general interest. Table 2 shows additional characteristics of the
sample broken down by group.

PRODUCTIVE FAILURE IN THE FLIPPED MATHEMATICS CLASSROOM 42
Table 2 Sample Characteristics
Experimental group (PFFC) Control group (DIFC)
Gender breakdown 36.4% male
63.6% female
32.3% male
67.7% female
Year breakdown 45.4% freshman (N=10)
27.3% sophomore (N=6)
9.1% junior (N=2)
18.2% senior (N=4)
22.6% freshman (N=7)
22.6% sophomore (N=7)
19.4% junior (N=6)
35.4% senior (N=11)
English as first language 90.9% 96.8%
GPA Range: 2.8 to 4.0
Mean: 3.4
Standard deviation: 0.4
Range: 1.1 to 3.9
Mean: 3.1
Standard deviation: 0.5
Math background Only one had calculus background, the rest Algebra 2 or Pre-Calc.
Five students with calculus background, one student took the entire math sequence at Rutgers, two took statistics
Common majors psychology, sociology, English, history
psychology, sociology, English, communication, computer science (N=1), and mathematics (N=1)

PRODUCTIVE FAILURE IN THE FLIPPED MATHEMATICS CLASSROOM 43
It was expected that students would have no instructional experience with the targeted
concepts for this study, because the topics are not traditionally taught in high schools. Based on
pretest findings, this was the case for all students.
Materials The materials used in this study have been developed to allow students to engage,
explore, explain, extend, and reflect on mathematics (Krajcik, Blumenfeld, Marx, & Soloway,
2000; Song & Kapur, 2017). The subsections below outline the use of invention tasks,
instructional videos, pretests and posttests, in-class problems, a survey, and a focus group
interview as they relate to the research context. Table 3 summarizes the alignment of materials
used in the research study.
Table 3
Alignment of Materials Week
# Topic Pretest/Posttest Invention
Task Topic Video Set In-Class
Problems
1 Mathematical apportionment
Problem on apportioning buses to routes, problem on flaws of apportionment (Quota Rule and Alabama Paradox)
Problem on apportioning legislative seats to a new country (Hamilton’s Method)
15 videos on apportionment methods including Hamilton’s and Jefferson’s methods, Quota Rule, and Alabama Paradox
Problems on apportioning nurses to hospital shifts using both methods from videos, Alabama Paradox and Quota Rule
2 Mathematical apportionment and introduction to fair division (for two players)
Problem on dividing a business between two people (Divider Chooser)
*Posttest only: problem on connecting quotas to apportionments
Problem on fairly dividing a retail space for a year between two people (Divider Chooser Method)
15 videos split between two topics: some on Huntington-Hill and Webster apportionments and some on Divider Chooser method
Problems on apportioning nurses to hospital shifts using methods in videos and problems on dividing retail space over a year

PRODUCTIVE FAILURE IN THE FLIPPED MATHEMATICS CLASSROOM 44
3 Fair division (for three or more players)
Problems on vacation timeshare (Lone Chooser) and sharing a store (Lone Divider)
*Posttest only: dishonest bidding while using Lone Divider
Problem on fairly dividing a piece of land among four people (Lone Divider Method)
14 videos on fair division including the Lone Chooser and Lone Divider methods
Problems on dividing land into subshares (Lone Divider) and retail space (Lone Chooser) over the course of the year.
4 Fair distribution
Problems on distributing toys (Method of Markers) settling an inheritance (Method of Sealed Bids)
Problem on fairly distributing jointly owned dorm items among three roommates (Method of Sealed Bids)
14 videos on fair distribution including the Method of Markers and Method of Sealed Bids
Problems on distributing jointly owned business partnership items, house settlement, distributing CDs and distributing fruit among people
Invention task for the PFFC group. First, the PFFC group worked through one
invention task during each week of the study. The invention tasks (see Appendix A) were engaging problems that students found sufficiently difficult to solve, but were able to at least draw on their prior knowledge to try and develop a solution (Schwartz & Martin, 2004). Having students complete these tasks was a key component of the PFFC instructional design and as a result served as the learning intervention in this study. In addition, the topics of the invention tasks addressed the topics covered in the videos and in-class problems, but used a slightly different context to avoid surface similarity. For example, the invention task used during the 4th week of the study involved distributing jointly owned items in a college dormitory among college roommates. This required the use of the Method of Sealed Bids, which was formally covered in the videos and in-class problems. The problems on the Method of Sealed Bids completed in class and on the pretest and posttest covered the same skill but instead used

PRODUCTIVE FAILURE IN THE FLIPPED MATHEMATICS CLASSROOM 45
inheritances and dissolving business partnerships as contexts. The criteria used to develop the set of invention tasks were drawn from earlier works on
PF (Kapur, 2016; Kapur & Bielaczyc, 2012). First, all tasks were developed so that they would
be challenging enough for the learner to want to engage with, but not too difficult that the learner
would want to give up on them. This was accomplished by designing tasks that required
elementary mathematics operations to solve, yet were challenging enough so that the solution
was not readily discoverable. All four tasks involved real-life scenarios where mathematics was
needed, including dividing shared dorm items fairly amongst departing roommates, dividing a
jointly-owned piece of land fairly, apportioning legislative seats to states in a newly formed
country, and dividing retail space for tenants so that they could maximize their revenue. The
relatable problem contexts were designed to engage students in solving the problems while also
activating their prior knowledge of division. In other words, all four problems were calibrated to
a “sweet-spot” (Kapur & Bielaczyc, 2012) where the complexity of the problem, mathematical
resources of students, and affective draw were all taken into account as the problems were
designed.
Second, all tasks allowed for multiple RSMs. Students had the ability to use algebra,
ratios, guess and check, and any other solution strategies they wanted. There was also not one
pathway to any particular solution; students could develop their solution using a variety of
approaches and some of the aforementioned representations. Third, the problems all activated
the learner’s prior knowledge, both formal and intuitive. Students were able to draw on prior
knowledge of multiplication, division, and ratios, while also trying to develop ways to settle
discrepancies that arose with trying to divide items fairly. Last, as the instructor, I built upon

PRODUCTIVE FAILURE IN THE FLIPPED MATHEMATICS CLASSROOM 46
students’ solutions by drawing their attention to key features of the solution. This was achieved
through video instruction as well as in-person instruction after students have completed the task.
For example, the very first invention task was about the concept of mathematical
apportionment. In this task, students were asked to apportion 250 legislative seats to six states
within a newly formed country. The problem is each state had a very large population, and all
states varied in their population size. Due to the size of the numbers, students could not guess or
find an answer right away, but could certainly draw on their prior knowledge of ratios and
proportionality to attempt to solve the problem. This helped some students make some progress,
however, the problem was designed so that students would face issues with decimals. Even if a
student was able to calculate the exact number of seats each state should be allocated if every
state could receive an exact fair share, he or she would be left with an unrealistic apportionment
that involves decimals. This is where the “failure” aspect came in as students were left trying to
figure out what to do with messy numbers. These measures were taken to ensure a PF
experience where students could attempt to solve the problem, but have difficulty arriving at the
correct answer.
The invention task on apportionment embodied all of the PF design elements as
suggested by Kapur and Bielaczyc (2012) and Kapur (2016). First, the problem’s affective draw
was getting students involved in giving out legislative seats to sates based on populations.
Second, students could enter this problem using a variety of ways, including proportions, ratios,
and estimating. The apportionment problem became challenging when students had to decide
what to do with the fractional parts of seats; this is precisely where the values used in the
problem were made larger so as to not overwhelm the students, but rather challenge them.
During this process, students had to draw on prior knowledge and mathematical resources to

PRODUCTIVE FAILURE IN THE FLIPPED MATHEMATICS CLASSROOM 47
push forward and not give up on the problem. Finally, as the instructor, I ensured the
instructional video that showed the solution to this task emphasized key features of the solution,
such as the concept of a standard divisor to use when apportioning seats and the logistics of
using Hamilton’s method to apportion seats. The process of identifying key features also
continued during the in-person class meeting as I circulated the room to provide feedback and
assistance to students.
In-class problems. When students arrived to the in-class problem-solving session, they
worked on a set of approximately five to six problems with guidance from both the instructor and
peers. Each problem typically had multiple sub-questions attached to it. There were two types
of sub-questions asked: those that primarily focused on procedural knowledge to solve, and those
that primarily focused on conceptual knowledge to solve. Table 4 shows the content of each
week’s problem-solving session along with its corresponding problem set (see Appendix B for
the full set of problems).
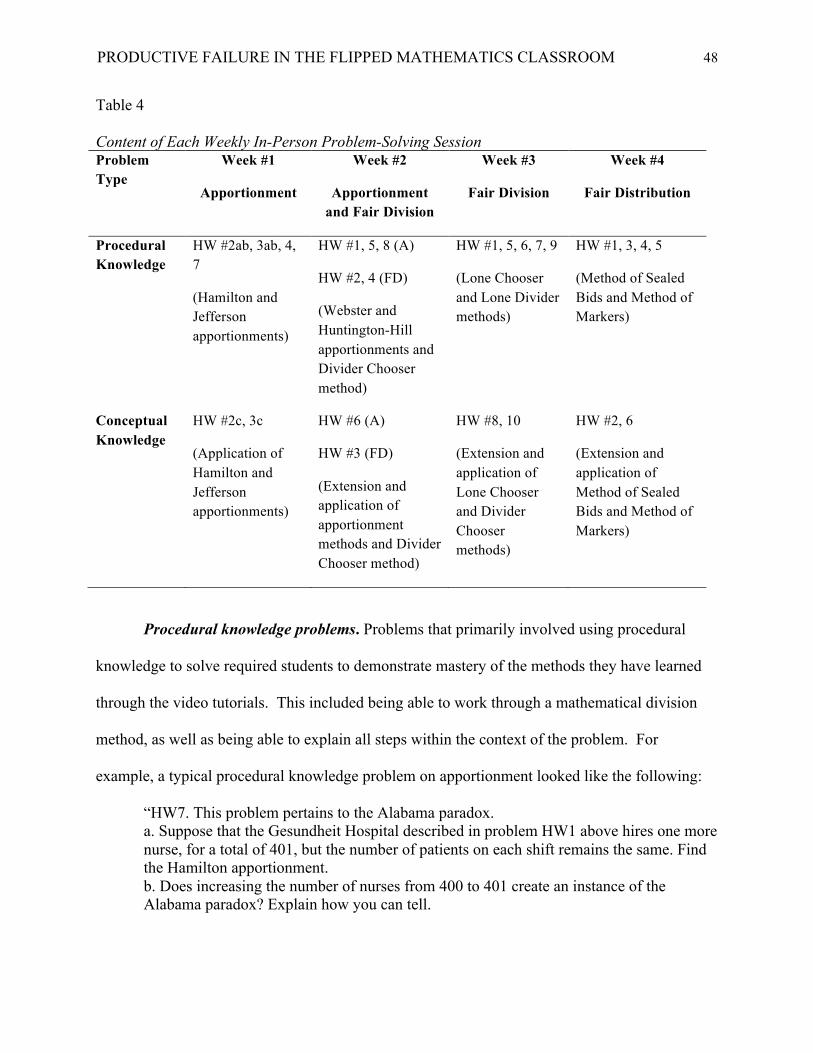
PRODUCTIVE FAILURE IN THE FLIPPED MATHEMATICS CLASSROOM 48
Table 4 Content of Each Weekly In-Person Problem-Solving Session Problem Type
Week #1
Apportionment
Week #2
Apportionment and Fair Division
Week #3
Fair Division
Week #4
Fair Distribution
Procedural Knowledge
HW #2ab, 3ab, 4, 7
(Hamilton and Jefferson apportionments)
HW #1, 5, 8 (A)
HW #2, 4 (FD)
(Webster and Huntington-Hill apportionments and Divider Chooser method)
HW #1, 5, 6, 7, 9
(Lone Chooser and Lone Divider methods)
HW #1, 3, 4, 5
(Method of Sealed Bids and Method of Markers)
Conceptual Knowledge
HW #2c, 3c
(Application of Hamilton and Jefferson apportionments)
HW #6 (A)
HW #3 (FD)
(Extension and application of apportionment methods and Divider Chooser method)
HW #8, 10
(Extension and application of Lone Chooser and Divider Chooser methods)
HW #2, 6
(Extension and application of Method of Sealed Bids and Method of Markers)
Procedural knowledge problems. Problems that primarily involved using procedural
knowledge to solve required students to demonstrate mastery of the methods they have learned
through the video tutorials. This included being able to work through a mathematical division
method, as well as being able to explain all steps within the context of the problem. For
example, a typical procedural knowledge problem on apportionment looked like the following:
“HW7. This problem pertains to the Alabama paradox. a. Suppose that the Gesundheit Hospital described in problem HW1 above hires one more nurse, for a total of 401, but the number of patients on each shift remains the same. Find the Hamilton apportionment. b. Does increasing the number of nurses from 400 to 401 create an instance of the Alabama paradox? Explain how you can tell.

PRODUCTIVE FAILURE IN THE FLIPPED MATHEMATICS CLASSROOM 49
c. Now suppose that the same hospital hires yet another nurse, for a total of 402, but the number of patients on each shift again remains the same. Find the Hamilton apportionment. d. Does increasing the number of nurses from 401 to 402 create an instance of the Alabama paradox? Explain how you can tell” (Weingart & Seneres, 2013).
As one of the learning goals for the course is for students to develop a working knowledge of
mathematics and being able to explain and write up their solutions, the problems we ask always
require students to analyze their results and explain them in terms of the original problem. In the
problem above, students were asked to practice the procedure of the Hamilton apportionment in
order to see if an Alabama Paradox has occurred. An Alabama Paradox occurs when adding an
additional seat to an apportionment (part c) results in a state losing a seat they originally had
(part b). Students were then asked to clearly identify whether or not an Alabama Paradox
occurred (parts b and d) using complete sentences, which achieves the course goal of justifying
and explaining solutions. The invention task associated with this topic had students assign seats
to states in logical and fair fashion; this problem had students take that procedure one step further
to realize a flaw of apportionment.
Over the course of the four weeks, students solved problems on apportionment, fair
division, and fair division in which they had to decide which procedures to use to solve each
problem (Booth, 2011). As such, a solid knowledge of procedures and features of problems that
lend themselves to certain procedures was needed to be successful on these problems.
Conceptual knowledge problems. Problems that required conceptual knowledge to solve
took students beyond rote application of a procedure learned through the video tutorials. For
example, in the set of problems on fair division, students leaned about two methods for dividing
discrete goods: the Method of Sealed Bids and the Method of Markers. The two conceptual
knowledge questions gave students the opportunity to think beyond application of each method
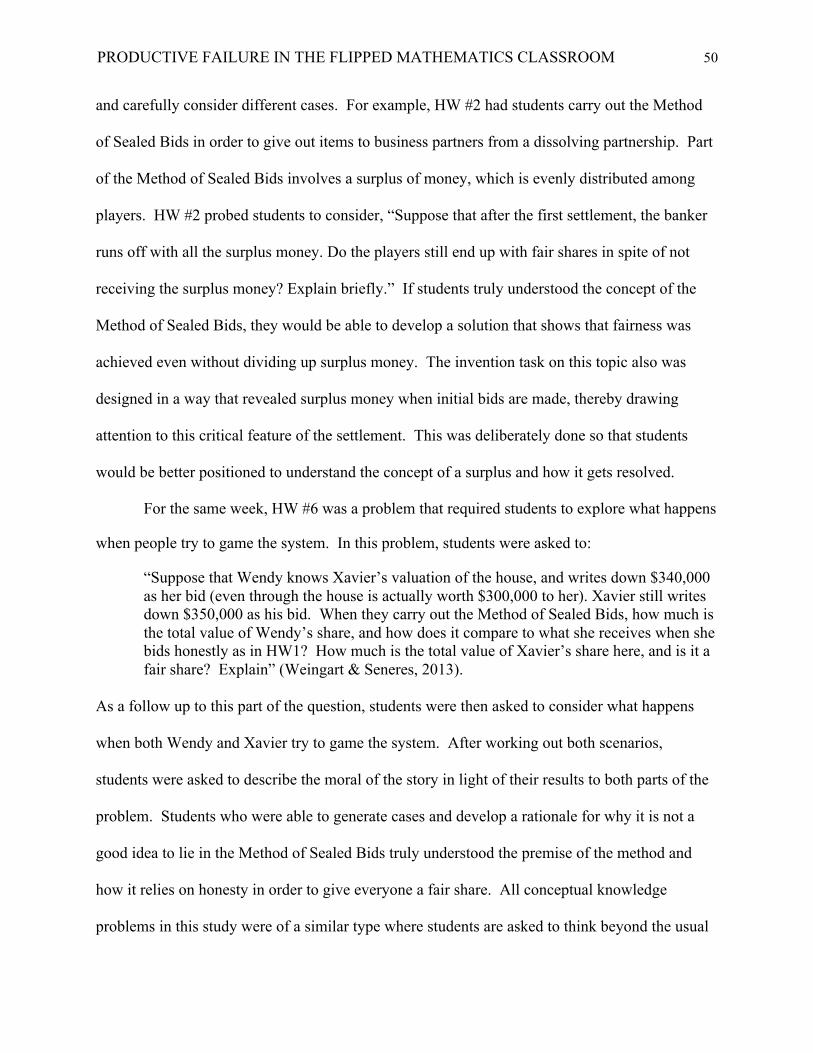
PRODUCTIVE FAILURE IN THE FLIPPED MATHEMATICS CLASSROOM 50
and carefully consider different cases. For example, HW #2 had students carry out the Method
of Sealed Bids in order to give out items to business partners from a dissolving partnership. Part
of the Method of Sealed Bids involves a surplus of money, which is evenly distributed among
players. HW #2 probed students to consider, “Suppose that after the first settlement, the banker
runs off with all the surplus money. Do the players still end up with fair shares in spite of not
receiving the surplus money? Explain briefly.” If students truly understood the concept of the
Method of Sealed Bids, they would be able to develop a solution that shows that fairness was
achieved even without dividing up surplus money. The invention task on this topic also was
designed in a way that revealed surplus money when initial bids are made, thereby drawing
attention to this critical feature of the settlement. This was deliberately done so that students
would be better positioned to understand the concept of a surplus and how it gets resolved.
For the same week, HW #6 was a problem that required students to explore what happens
when people try to game the system. In this problem, students were asked to:
“Suppose that Wendy knows Xavier’s valuation of the house, and writes down $340,000 as her bid (even through the house is actually worth $300,000 to her). Xavier still writes down $350,000 as his bid. When they carry out the Method of Sealed Bids, how much is the total value of Wendy’s share, and how does it compare to what she receives when she bids honestly as in HW1? How much is the total value of Xavier’s share here, and is it a fair share? Explain” (Weingart & Seneres, 2013).
As a follow up to this part of the question, students were then asked to consider what happens
when both Wendy and Xavier try to game the system. After working out both scenarios,
students were asked to describe the moral of the story in light of their results to both parts of the
problem. Students who were able to generate cases and develop a rationale for why it is not a
good idea to lie in the Method of Sealed Bids truly understood the premise of the method and
how it relies on honesty in order to give everyone a fair share. All conceptual knowledge
problems in this study were of a similar type where students are asked to think beyond the usual

PRODUCTIVE FAILURE IN THE FLIPPED MATHEMATICS CLASSROOM 51
execution of the problem and instead take a closer look at the mathematical processes behind a
method. As a researcher, having problems like these is important in my class as active discovery
and application of mathematical concepts contribute to students’ conceptual understanding of
targeted content and also bolsters students’ procedural understanding of the same content
(Baroody et al., 2007).
Video sets. Both groups worked through a weekly set of approximately 13-15 short
instructional videos on the topics of apportionment, fair division, and fair distribution. Table 5
outlines the topics and nature of each video set over the four weeks of the study.
Table 5
Video Set Schedule and Content Class
Sessions
Week #1 Week #2 Week #3 Week #4
Topic Hamilton and Jefferson apportionment methods
Webster and Huntington-Hill apportionment methods and Divider Chooser method
Fair Division: the Lone Chooser and Lone Divider methods
Fair Distribution: the Method of Markers and Method of Sealed Bids
Videos 15 videos ranging from three to 10 minutes each
15 videos ranging from three to 13 minutes each
14 videos ranging from three to eight minutes each
14 videos ranging from two to nine minutes each
These videos featured direct instruction and worked examples on the aforementioned
topics. The intent of the videos was to provide all students with the background and motivation
for using each method, followed by a detailed explication of how to use each method to achieve
mathematical fairness in a variety of settings. Students in both research designs watched the

PRODUCTIVE FAILURE IN THE FLIPPED MATHEMATICS CLASSROOM 52
same video set, with the exception of two additional videos for the PFFC group, which consisted
of two annotated solutions to two invention tasks. Each video set followed more or less the same
layout which included an introductory video, videos that illustrated specific examples of the
week’s topic, videos that illustrated a mathematical paradox or shortcoming of the methods used
in previous videos, and a summary video that concluded each set.
For example, the video set on the topic of fair distribution began with a video that
transitioned the students from fair division (the previous topic) to fair distribution by
highlighting a few key similarities and differences between the two topics. This video, along
with the following two videos, contrasted fair division of continuous goods with fair distribution
of discrete goods and had students understand why they could not use fair division to “divide”
items that cannot be shared like household objects. Mathematical vocabulary associated with
fair distribution was also clearly spelled out on the screen and annotated by the presenter in the
first three videos so that students could articulate solutions to solve problems on fair distribution.
Then, the main ideas were presented by way of worked examples. In the case of fair
distribution, four videos covered two cases of the Method of Sealed Bids (two players and more
than two players). The examples used to demonstrate the methods were always grounded in real-
life contexts; for these four videos, the two contexts used were dissolving a law partnership and
roommates moving out of a college dormitory. For every worked example, students had the
opportunity to try a similar problem on their own before moving on to the next video. Each
video in the set began with a solution the end-of-video problem from the video before it so that
students had the opportunity to self-diagnose and reflect on their work.
The second half of this video set consisted of a similar sequence of videos on the second
fair distribution method, the Method of Markers. Similar to the progression of videos on the

PRODUCTIVE FAILURE IN THE FLIPPED MATHEMATICS CLASSROOM 53
Method of Sealed Bids, the final seven videos began with an introductory video on what the
Method of Markers is, followed by four videos that detailed how the method is executed in
context (friends sharing a set of fruit). The usual end-of-video questions appeared in order for
students to try similar problems to ensure they understood the method. The set ended with two
videos: one that summarized the method, and one additional problem where students are asked to
work on a more difficult version of the method where they have to place the markers themselves
using mathematics. For students in the PFFC group only, the final video in two of the sets was a
detailed solution to the invention task for the week, which helped serve to consolidate the
knowledge students accessed through their PF experience on the invention task while
highlighting key features of the content (Kapur, 2008). For the other two sets of videos, the
solutions to the invention tasks were embedded in existing videos, as the invention tasks were
taken directly from existing course examples.
Pretest and posttest. The same pretest (see Appendix C) and posttest (see Appendix D)
were given to students in both treatment groups included problems similar to those addressed in
the invention tasks, instructional videos, and in-class problem-solving assignments. As
previously noted, the problems on both assessments had slightly different storylines as they did
on the invention tasks and in-class problems to avoid surface similarity. All problems on both
assessments addressed specific concepts listed in the specific learning objectives for Math 103.
The results of these tests were used to answer the research questions on gains in students’
procedural and conceptual understanding.
Pretest. The pretest was used as a measure of prior knowledge of targeted concepts in
the unit of study. As a result, all six questions gauged whether or not students already know how
to execute the methods described in the unit. These questions were largely procedural in nature;

PRODUCTIVE FAILURE IN THE FLIPPED MATHEMATICS CLASSROOM 54
for example, the following question had students demarcate items for people using the Method of
Markers:
6. Jason, Keith, and Clark have are dividing a set of 15 toys – 3 fidget spinners (F), 6 pogs (P), and 6 containers of gak (G) using the Method of Markers. • Jason loves fidget spinners but hates pogs and gak. • Keith loves fidget spinners and pogs equally well but hates gak. • Clark loves pogs and gak equally well but hates fidget spinners. The toys are lined up in an array as follows: G G G P P P F F F P P P G G G 6a. Place markers for each person above based on their value systems. 6b. Describe the allocation of toys to each player and describe what toys are left over. 6c. Suppose that the players agree that each one can pick an extra toy from the leftovers. Suppose Jason picks first, Clark picks second, and Keith picks third. Describe which leftover toys each one would pick.
In order to solve this problem, students needed to know the Method of Markers procedure and how to establish fair shares for each player. The pretest contained five additional questions that asked students to demonstrate knowledge of other methods discussed in the unit, including Hamilton’s Method, Webster’s Method, the Lone Chooser Method, Method of Sealed Bids, the Lone Divider Method, the Divider Chooser Method, and the Huntington-Hill method. The topics addressed on the pretest also addressed course-wide learning goals of being able to apply effective and efficient mathematical procedures to solve problems.
Posttest. The posttest was designed to test students’ understanding of the content
immediately after they learned the whole unit. The posttest was comparatively more difficult
than the pretest. It included six questions that primarily drew on procedural knowledge (similar
to those on the pretest) but also included two additional questions that primarily drew on
conceptual knowledge. Similar to those described by Kapur and Bielaczyc (2012), the two
conceptual understanding problems were more complex and unfamiliar to students. As a result,
students had to be more flexible with their solution methods to solve these problems (Kapur &
Bielaczyc, 2012). An example of such a problem on apportionment is as follows:

PRODUCTIVE FAILURE IN THE FLIPPED MATHEMATICS CLASSROOM 55
“8. Consider the problem of apportioning M seats between two states, A and B. Let qA and qB denote the standard quotas of A and B, respectively, and assume that these quotas have decimal parts that are not equal to 0.5. Explain why in this case 8a. Hamilton’s and Webster’s methods must give the same apportionment. 8b. the Alabama or population paradoxes cannot occur under Hamilton’s method. 8c. violations of the quota rule cannot occur under Webster’s method” (Tannenbaum, 2013).
What makes this problem conceptual is that students needed to generate their own values to
solve the problem and consider various cases. In the in-class problem-solving session and video
sets, complete tables were provided and students had to follow procedures to produce a result. In
this setting, scaffolds were removed and students had to use very limited information to draw
conclusions. They had to think conceptually across methods in order to develop examples and
counterexamples for all three parts of the problem. This inherently required a procedural
understanding of the various apportionment methods as well. Students who successfully solved
this problem truly demonstrated conceptual mastery of the concept of apportionment and the
flexibility to apply concepts to unfamiliar settings. In addition, the posttest addressed the course
learning goal of having students formulate, evaluate, and communicate conclusions from
quantitative information.
Survey. Students in both groups also completed a short, four-question survey on their
self-reported video watching behaviors (see Appendix E). Students were asked to
acknowledge whether they watched all of the instructional videos for the unit, how many
times they watched the videos, where they watched the videos, and the device they used to
access the videos. As a result, the survey measured frequency of video-watching and the
location in which it happened. Additional video-watching information was obtained from
Kaltura, the analytic platform on the course’s learning management system, which allowed for a
deeper analysis of students’ video-watching behaviors.

PRODUCTIVE FAILURE IN THE FLIPPED MATHEMATICS CLASSROOM 56
One purpose of the survey was to gain insight into students’ video watching behavior in
order to ensure students in both treatment groups completed the work required in a flipped
classroom. A secondary purpose was to examine video watching patterns between groups to see
if there was a difference in video watching frequency due to the instructional design. The results
of this survey were used to answer the third research question and also provided additional
quantitative information helped explain the first two research questions.
Focus group interview. Last, students had the opportunity to reflect on their
experiences learning in the flipped classroom format by taking part in a focus group interview.
The five questions in the focus group interview were designed in such a way to allow students to
reflect on their learning process in the flipped classroom while simultaneously offering
suggestions for course design improvement (see Appendix F). The questions included: (a) Can
you describe the learning activities in this past unit? (b) How do you find the learning activities?
Why? (c) What do you think is most important in your mathematics inquiry process? (d) What
aspects of the course design would you like to see strengthened? (e) Is there anything else you’d
like to tell me about the course design that might not have been addressed by any of the previous
questions? Of utmost importance to the study were the responses to questions (a) and (b), as
they gave students an opportunity to comment on the roles of the invention tasks, videos, and in-
person supports in their learning. These responses formed the basis for an analysis of what
learning looked like in each of the two learning environments.
Creswell (2014) listed several advantages of using focus group interviews to obtain
data: they are useful when participants cannot be directly observed, they allow participants to
provide historical information, and researchers can have complete control over the line of
questioning. Denzin and Lincoln (2011) also added that focus group interviews allow the

PRODUCTIVE FAILURE IN THE FLIPPED MATHEMATICS CLASSROOM 57
researcher to observe the interactions among participants. These spontaneous interactions have
the effect of decreasing the amount of interaction between the researcher and participants,
thereby giving more weight to the participants’ opinions and less weight to researcher influence
(Denzin & Linclon, 2011). The results of the focus group interview were used to answer the
fourth research question.
Procedure
Mixed method data collection strategies are used to validate one form of data with the
other form, transform the data for comparison, and address different types of questions (Creswell
& Plano Clark, 2007). This was an appropriate data collection strategy for this study as
qualitative findings from the focus group interview and video helped validate quantitative
findings from surveys and course assessments. Table 6 describes each data source and how it
was used in this study.
Table 6 Data Sources and Analysis Data source Data analysis Effectiveness of pedagogical design
intervention on the development of
(a) procedural knowledge
(b) conceptual knowledge
Survey Quantitative x x
Pretest Quantitative x
Posttest Quantitative x x
Focus group interview
Video data
In-class problems
Qualitative
Qualitative
Qualitative/Quantitative
x
x
x
x
x
x

PRODUCTIVE FAILURE IN THE FLIPPED MATHEMATICS CLASSROOM 58
After participants in the DIFC and PFFC groups signed consent forms to participate in
the study, the procedures below were used to guide the data collection process.
Pretest and posttest. Similar to the Song and Kapur (2017) study, this study employed a
pretest/posttest design. A 60-minute pretest was given to participants in both groups to test
students’ prior knowledge of apportionment, fair division, and fair distribution before they
started learning the topics. The pretest was administered during the first class session of the
semester. An 80-minute posttest was also given to participants in both groups upon conclusion
of the unit and tested the same topics as the pretest. Students were allowed to use a calculator for
both assessments.
In-class problems. Students in the DIFC had approximately 55 minutes during each in-
person class session to solve problem sets in groups. Students in the PFFC group had
approximately 40 minutes during each in-person class session to solve problem sets in groups.
These students spent the last 15 minutes of class time working on the invention task for the
week. Both groups were able to finish their in-class problems for homework and submit their
solutions online within two days.
Survey. All participants completed the anonymous video-watching survey after the
posttest. Participants were given five minutes complete the pencil-and-paper survey during class
time. In addition, quantitative video-watching data were obtained from the Kaltura program on
the learning management system after the four weeks of the study were over.
Focus group interviews. Focus group interviews for each group were administered in
the class meeting following the posttest for each group. In order to represent as many
participants as possible within each focus group, approximately three participants were randomly
chosen from each third of the class, as determined by grades in the learning management system

PRODUCTIVE FAILURE IN THE FLIPPED MATHEMATICS CLASSROOM 59
grade book after the posttest. These participants sat in a circular arrangement with the instructor
as part of the circle, creating a comfortable dynamic among participants. The interview protocol
template was read with emphasis on preserving the participants’ anonymity. As stated in the
interview protocol, participants referred to themselves by a number given to them at the start of
the interview. The focus group interviews were audio-recorded using two devices and were
subsequently sent for professional transcription. The focus group interviews took approximately
20 minutes each.
Video data. Collins, Joseph, and Bielaczyc (2004) recommended the use of video records to understand what is happening in an intervention in detail. Chi (1997) also noted the importance of collecting and analyzing data in messy contexts so that researchers can better understand complex activities in the context in which they occur. As a result, video observations of students’ in-class problem solving took place during the four weeks of study for two groups of students in each condition. One stronger group and one weaker group were chosen in each condition in order to capture the range of abilities in each group. Video footage of students working in their groups, exchanging ideas, accessing resources, and constructing solutions to problems was taken and subsequently analyzed to understand how students mobilized their procedural and conceptual knowledge to solve problems. Another purpose of the video was to have an additional source of data that could be used to help explain gains in conceptual knowledge for students based on their written work samples. Having video data available could be helpful in determining the precise nature of students’ conceptual and procedural knowledge gains and could also explain lack of gains or anything puzzling about students’ performance. Data Analysis Plan Because this was a mixed-methods study, both quantitative and qualitative methods were

PRODUCTIVE FAILURE IN THE FLIPPED MATHEMATICS CLASSROOM 60
used in the data analysis to address the effectiveness of the pedagogical design intervention on both procedural and conceptual understanding. Each data source analysis is described below along with how it was used to answer each research question.
Pretest and posttest. To understand the effectiveness of the PFFC design on procedural
and conceptual understanding, the results of the pretests and posttests were analyzed
quantitatively to determine if the design features in the embodied conjecture contributed to
students’ improved procedural and conceptual knowledge. The posttest was designed to measure
both procedural and conceptual knowledge gains made in both treatment conditions over the
course of the unit. The posttest served as the students’ chance to demonstrate the knowledge
they’ve accumulated over the course of working through the video sets, completing problems in
class, and studying in between.
As the embodied conjecture for the learning environment involves tracing the
development of procedural and conceptual knowledge in Math 103, the questions on the posttest
that specifically related to each type of knowledge were scored blindly using a rubric that
allowed for partial credit. For questions that largely required procedural knowledge to solve,
students earned points for each correct step they took in solving the problems. For questions that
largely require conceptual knowledge to solve, students earned points for work and ideas that led
to correct explanations. The data related to the two conceptual understanding questions on the
posttest were analyzed separately from the rest of the posttest questions that primarily addressed
procedural understanding. The posttest questions primarily drawing on procedural knowledge
accounted for 76 points out of 100 available points, while the two additional questions requiring
conceptual knowledge accounted for approximately 24 points out of 100 available points. To
ensure the rubric was applied fairly, both the researcher and an independent grader scored a few

PRODUCTIVE FAILURE IN THE FLIPPED MATHEMATICS CLASSROOM 61
work samples together to understand the grading scheme. Then, they continued to grade all
papers together and reached 100% consensus before assigning final scores.
The scores for each assessment were recorded in SPSS. A two-sample t-test was used on
each group’s performance data at the 5% significance level to determine whether students in the
PFFC group were able to outperform their DIFC peers on questions involving procedural
understanding. Similar to Song and Kapur (2017), the results of the two conceptual
understanding questions in the DIFC and PFFC groups were also tested by a t-test (at a 5% level
of significance) to determine if conceptual learning performance was statistically different
between the two groups. Additional correlational analysis on specific posttest items and other
course assessments was also performed. Taken together, the results of facilitating this
comparison between pretest and posttest scores were used to answer the first and second research
questions. Additional data sources, such as the video footage and video-watching survey
described below, were used to help explain quantitative findings in the posttest data.
In-class problems. The results of the in-class problem sets were also compiled and
analyzed by means of t-tests for each of the four weeks of the study. Descriptive statistics were
also calculated for the in-class problems for both groups for all four weeks of the study.
Correlational analysis was used to determine if there were any significant correlations between
in-class problems and other courses assessments. In addition, the results of the invention tasks
were also compiled and reported using descriptive statistics. This formed the basis for a more
detailed look at the in-class work of two groups of students in the PFFC group.
Survey. The results of the video-watching survey were compiled and presented in a table
with corresponding percentages for each group in the study. Then, the results were analyzed
using a one-way ANOVA test to determine whether students’ video watching behaviors

PRODUCTIVE FAILURE IN THE FLIPPED MATHEMATICS CLASSROOM 62
influenced their learning performance. In addition, t-tests were performed to see whether the
DIFC and PFFC groups had a significant difference in the number of times they’ve watched the
instructional videos, location of where they watched the videos, and what platform they used to
watch the videos. Additional detailed information from Kaltura analytics was also used to take a
closer look at students’ self reported video-watching behaviors and its results were compiled and
presented in a table. This information was used to answer the third research question on what
students’ self-reported video watching behaviors were.
Focus group interview. The focus group interview transcripts were professionally
transcribed and coded. Hypothesis coding was used to test the researcher-generated hypothesis
that students who experienced PF would view their learning experience differently compared to
students who had a direct video instruction experience. In hypothesis coding, codes are
developed from a theory or prediction about what will be found before the data is collected and
analyzed (Saldaña, 2009). Using the high-level conjecture from the study’s conjecture mapping,
I developed codes based on the PF design embodiment and mediating processes involved in the
learning intervention. For example, because part of the design embodiment involved having
students work in groups to solve problems related to the video tutorial content, I hypothesized
that students would collaborate and peer teach. Subsequently, I used the code “peer teach” when
students described educating a classmate in their groups. An example of a statement that was
coded with “peer teach” was when a student commented how the classroom design, specifically
work with peers, allowed him to “learn how to do things from one another.”
The coding system was refined in an ongoing matter as the transcripts were initially
coded then coded again after a second read. For example, the statement, “group chat or group
meet, we use so that if we have questions about homework or a test, we just go over them” was

PRODUCTIVE FAILURE IN THE FLIPPED MATHEMATICS CLASSROOM 63
initially coded as “peer teach,” but since this was a very specific type of virtual group
collaboration outside of class, I ended up building a new subcode, “mobile teaching,” to be more
specific about the type of teaching that actually took place. A total of 12 codes and three
subcodes were developed for the study. Examples of codes and their subcodes are shown in
Table 7; a full table will be provided in Chapter 4.
Table 7
Codes Code Definition Data Example
Understanding (U)
Subcodes:
Conceptual understanding
(CU)
Procedural understanding (PU)
U: any loose reference to comprehension
CU: students describe development of key ideas
PU: knowledge of steps or how to complete a problem
U: “it's like when you understand something in a video”
CU: “understand core concepts”
PU: “understanding how to do it and the process behind”
PU: “memorizing certain ways of figuring out a certain problem”
PU: “And it's easier to learn in the same order that you did on your own when you come to back to the classroom.”
Peer teaching (PT)
Subcode: mobile teaching (MT)
PT: students working in a small group or pairs to help one another understand content
MT: when students help one another understand through a mobile device
PT: “learn how to do things from one another”
MT: “group chat or group meet we use so that if we have questions about homework or a test, we just go over them”
While coding the transcript, I used search strategies for focus group interview
transcripts from Krueger and Casey (2002). First, they recommend scrutinizing words and

PRODUCTIVE FAILURE IN THE FLIPPED MATHEMATICS CLASSROOM 64
context as interview respondents will likely use a variety of words, and it is up to the researcher
to determine the degree of similarity between responses. In addition, Krueger and Casey (2002)
also discussed how context is important to consider as respondents are often triggered by a
stimulus or comment from another respondent. These are among the most important times to
look for important responses. As a result, I paid careful attention to those instances when
coding. The purpose of the interview analysis was to develop findings to answer the fourth
research question on students’ explanation of their mathematical inquiry process during class. In
addition, findings from the interview analysis were used help explain quantitative data findings
from the other research questions.
Video data. All video footage of in-class problem solving was transcribed. In this study,
video footage of the invention task solving processes for groups in the PFFC was the most useful
data to code as it provided an additional lens into the PFFC learning environment. Frequency
counts of solution proposals, whether correct or incorrect, were tracked to help answer the fifth
research question. This information was also used to help describe what successful group work
looked like in the PFFC learning environment.
Limitations, reliability, and validity. Due to my involvement as both the researcher
and the instructor of the course, threats to validity surfaced in this study. To ensure fair
treatment of both the control and experimental groups in this study, I created a detailed protocol
that listed the steps I took to ensure comparable learning environments in both conditions (see
Appendix G). The protocol included specific prompts for responding to students’ questions
depending on the level of help they needed. The questions were largely the same for each group,
but the PFFC group had additional questions that required students to reflect on their experiences
with the invention tasks. To ensure I was following the protocol, I kept field notes (see

PRODUCTIVE FAILURE IN THE FLIPPED MATHEMATICS CLASSROOM 65
Appendix H) for each class session as part of a reflective analysis of my teaching process (Cobb,
2000). Cobb’s work (2000) focused on how the ongoing analysis of classroom events and
retrospective analyses of data gathered must follow the initial instructional design process. To
that end, I made some adjustments to my instruction in light of my analyses. For example, after
the first week of the unit, I began starting both classes with a bulleted list of critical features of
each concept along with visual aids for students to better comprehend processes they were
learning in the videos and in class.
In terms of data reliability, I shifted gears as often as possible to be both immersed in the
research context and critical of the research process (Design-Based Research Collective, 2003).
I triangulated my data sources by combining work samples, survey results, focus group interview
responses, and video data to see if patterns emerged among the data sources. Since themes
became established based on bringing several sources of data together, this process can be said to
add validity to the study (Creswell, 2014. Finally, the focus group interview contained an
additional question that asked students whether or not they conversed with Math 103 students in
other sections; this was used to help understand whether or not students discussed their thoughts
about being in one group or another.

PRODUCTIVE FAILURE IN THE FLIPPED MATHEMATICS CLASSROOM 66
CHAPTER 4: RESULTS
The results are organized into three sections. The first section presents a detailed
description of the scoring and coding processes used to analyze students’ work samples, focus
group interview, and video recordings in the course. The second section lays out all quantitative
results, including descriptive statistics and the results of statistical tests. Finally, qualitative data
will be presented as it relates to work samples, the focus group interview, and videos of students’
in-class problem-solving. The qualitative data is meant to help explain the quantitative data and
will be used in conjunction with the quantitative data to develop the final conclusions.
Coding
I will begin by explaining the coding and scoring processes for all work samples in both
groups, followed by an explanation of how the solutions to the invention tasks were coded for
the PFFC group. I will also describe how the focus group interview was coded.
Scoring of in-class problems. Undergraduate graders were assigned to all sections of
Math 103 to score in-class problems. The mathematics department employs upperclassmen as
graders provided they have earned a final grade of “A” in the course they want to score for, have
their professor’s recommendation, and have an overall GPA above 3.5. In this study, I had the
same grader for both sections of the course. The grader was unaware of which group was which
in this study. To ensure that students were given the proper score for each assignment, I went
back and scored all of the assignments using the same rubric the grader was supplied with. In
the very few instances there was a discrepancy between the score the student assigned and the
score I assigned, I re-read the assignment and corresponding rubric one more time and chose the
most appropriate score based on the rubric and my superior understanding of the solutions to
these problems.

PRODUCTIVE FAILURE IN THE FLIPPED MATHEMATICS CLASSROOM 67
To ensure accuracy and consistency of scoring across all sections of Math 103, all
graders were supplied with the same detailed solutions to all in-class problems. These solutions
were fully explained and annotated so that the grader would always be fully aware of what to
look for in a solution. The standard procedure in Math 103 for scoring in-class problems is that
each is worth four points and is scored on accuracy. Students earn all four points when their
work is fully correct and completely and accurately justified using English sentences. Students
earn three points when their work is mostly correct and justified. Typically, a student earns three
points when he or she gets one part of a multi-step question wrong, or if his or her response to a
prompt left out an important detail. For example, a student could earn three out of four points if
he or she performed all procedures in a problem correctly, but was unable to fully explain or
apply his or her findings in the context of the problem. Or, if the problem had multiple parts and
a student answered most of the parts correctly, he or she would earn three out of four available
points. Students earn two points when their work is half correct. A score of two is given out
when students answer only half of a question, or if their reasoning and/or mathematics are on the
right track but not fully developed or correct. In rare instances, students earn one point if they
have a small part of the problem correct. Zero points are assigned for missing solutions or
responses that are completely incorrect. Graders are given the flexibility to give out half points
in cases where students make rounding mistakes, forget a small part of a solution, or if they
cannot decide between two integer scores. For example, consider the following in-class
problem:
Four siblings, Wendy, Xavier, Yolanda, and Zachary, inherit a house. Suppose that Wendy considers the house to be worth $400,000, Xavier considers it worth $450,000, Yolanda considers it worth $450,000, and Zachary considers it worth $380,000. Which of the following (if any) is a fair division, according to our definition of that term, and why or why not?

PRODUCTIVE FAILURE IN THE FLIPPED MATHEMATICS CLASSROOM 68
a. No one gets the house. Instead it is sold for $400,000 so each sibling receives $100,000 in cash.
b. Xavier gets the house. He pays each of his siblings $110,000 in cash.
The solution to the problem is as follows:
a. This is not a fair division, because both Xavier and Yolanda receive less than a minimum fair share. For each of these two siblings a minimum fair share is $450,000/4 = $112,500, but the proposed settlement gives each one only $100,000. Note that if even one sibling receives less than a minimum fair share, the entire division is unfair, according to the definition of “fair division” we are working with.
b. This is very close to being a fair division, but doesn’t quite give Yolanda a minimum fair share; it gives her $110,000, just short of the required $112,500 to be a minimum fair share. Note that this division does give more than a minimum fair share to Xavier (who gets a net value of $450,000 - $330,000 = $120,000, which is more than his minimum fair share amount of $112,500); to Wendy (who receives $110,000 although her minimum fair share amount was only $100,000); and to Zachary (who receives $110,000 although her minimum fair share amount was only $95,000).
Table 8 shows how points were assigned to solutions to this problem.
Table 8
Scoring Rubric for Homework Problems Score (out of 4) Solution
4 A score of 4 out of 4 would be assigned if the student provides correct responses to each prompt (each is not a fair division) and has a correct mathematical justification in each case.
3 A score of 3 out of 4 would be assigned if the student correctly responded to most of the problem but got one part wrong (either one justification or one determination of whether or not the share was fair).
2 A score of 2 out of 4 would be assigned if the student correctly responded to half of the problem but got two parts wrong. This could be all of part a, all of part b, or a component of each part.
1 A score of 1 out of 4 would be assigned if the student only answered one component of one part correctly (half of part a or half of part b). For example, the student could acknowledge the division is not fair in one part but have an incorrect justification to follow.
0 A score of 0 out of 4 would be assigned if the student handed in a blank solution or answered both questions incorrectly (yes/no and mathematical justification).

PRODUCTIVE FAILURE IN THE FLIPPED MATHEMATICS CLASSROOM 69
Scoring of pretests and posttests. I blindly scored the pretest and posttest items with
another experienced Math 103 professor until consensus was reached in the total number of
points awarded for each question to ensure a high degree of reliability. To begin this process, we
both reviewed the exams together before they were administered to ensure all questions were
clear and that the questions required procedural and conceptual knowledge as appropriate. Then,
we developed a scheme for scoring each problem that allowed for partial credit based on how far
a student got. The rubric also took into consideration what would happen if a student made a
mathematical error early on in a problem, but executed the rest of it correctly with his or her
wrong value. If a response did not quite fit the rubric, we put the papers off to the side and then
came back to them and jointly decided the most appropriate score to give. Since we graded all
papers together, we reached 100% agreement in assigning final scores to students. Table 9
shows how points were distributed on each pretest/posttest item, along with deductions made for
different types of errors on each problem. Note that the pretest included questions #1-6, whereas
the posttest included the same questions, in addition to questions #7 and #8.

PRODUCTIVE FAILURE IN THE FLIPPED MATHEMATICS CLASSROOM 70
Table 9
Pretest and Posttest Scoring Rubric Question Number, Topic, and Total Points Available
Point Breakdown
#1, Apportionment, 14 points
3 points for part A (1 point for identifying each state, seat, and population), 3 points for part B (1 point for the standard divisor, 2 points for the explanation), 4 points for part C (2 points for the apportionment, 2 for adjusting it), 4 points for part D (2 points for the Huntington-Hill cutoff, 2 points for correct rounding)
#2, Alabama Paradox of Apportionment, 12 points
4 points each for parts A, B, and C. In parts A and B, students earned 1 point for each correct apportionment. In part C, to receive all 4 points, students had to correctly identify and explain the Alabama Paradox. 1 point was deducted for each missing aspect (adding a seat, loss of a seat to a state that already had one).
#3, Lone Chooser, 13 points
2 points for each part A through E, and 3 points for part F, broken down into 1 point for each player’s earnings. If the cut in part A was incorrect but subsequent work was correct based on that result, students would only lose 4 points.
#4, Lone Divider, 12 points
6 points for part A, broken down into 3 points for a correct table and 1 point for each of three players’ bid list. 6 points for part B, broken down into 3 points for each of three players’ final shares.
#5, Method of Sealed Bids, 13 points
3 points for part A (1 point for identifying total and fair share for each of three players), 6 points for part b (2 points for each players’ items and cash in/out), and 4 points for part c (1 point for items, 3 points for final cash settlements for each player).
#6, Method of Markers, 12 points
6 points for part A (2 points for each of three players’ markers), 3 points for part B (1 point for each player’s final demarcation), 3 points for part C (1 points for each player’s leftover). If markers were incorrectly placed in A, but students executed the correct procedure, they only lost 4 points.
#7, Lone Divider with Standoff, 12 points
6 points for part A (1 point for fair share, 2 points for identifying bid lists, 3 points for final list/standoff) 6 points for part B (2 points for identifying correct two shares leftover, 2 points for identifying standoff/recombining, 1 point for showing the math leading to $220,000, 1 point for explaining how Greedy would end up with exactly $220,000 only if he was the divider and not the chooser).
#8, Apportionment Conceptualization, 12 points
4 points for each of parts A, B, and C. In part A, 2 points for identifying each of lower and upper quota rounding, and full credit for mentioning no modified divisors. In parts B and C, students can earn full credit for using mutual exclusivity of Alabama Paradox and Quota Rule violations, or partial credit for giving an example of a case (2 points for each part), or discussing modified divisors (3 points for each part)
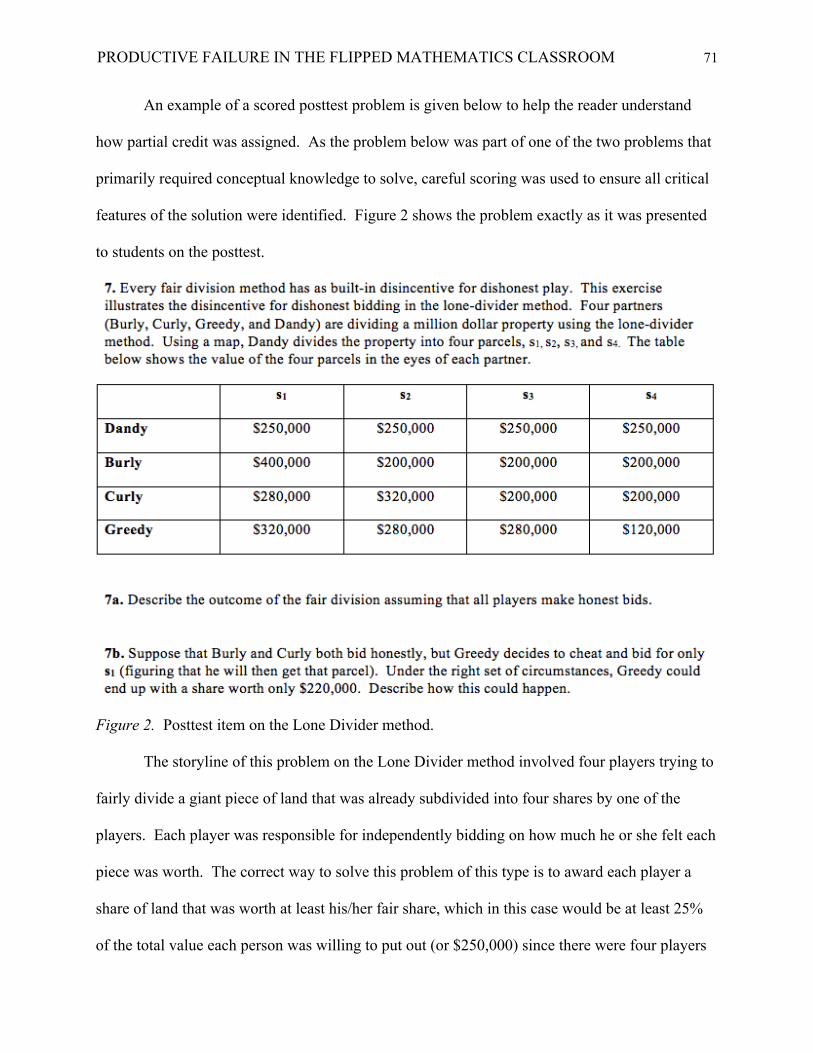
PRODUCTIVE FAILURE IN THE FLIPPED MATHEMATICS CLASSROOM 71
An example of a scored posttest problem is given below to help the reader understand
how partial credit was assigned. As the problem below was part of one of the two problems that
primarily required conceptual knowledge to solve, careful scoring was used to ensure all critical
features of the solution were identified. Figure 2 shows the problem exactly as it was presented
to students on the posttest.
Figure 2. Posttest item on the Lone Divider method.
The storyline of this problem on the Lone Divider method involved four players trying to
fairly divide a giant piece of land that was already subdivided into four shares by one of the
players. Each player was responsible for independently bidding on how much he or she felt each
piece was worth. The correct way to solve this problem of this type is to award each player a
share of land that was worth at least his/her fair share, which in this case would be at least 25%
of the total value each person was willing to put out (or $250,000) since there were four players

PRODUCTIVE FAILURE IN THE FLIPPED MATHEMATICS CLASSROOM 72
in total. In cases where two players both find only one share fair and it is the same piece, they
are forced to take the desired share and an unassigned share, recombine them, then propose a
new division of the recombined share. This process is called standoff. If all parties are honest,
the standoff process will result in fair shares for each person.
In this problem, part (b) required students to generate an exact sequence of events for a
standoff to occur so that Greedy would only end up with a share worth only $220,000, which is
an unfair share. Greedy deliberately chose to inflate his bid on share #1 in an attempt to game
the system and guarantee that he would earn that share. However, his plan backfired, since
Burly’s only possible fair share could be share #1 (valued at $400,000, the only piece he has
worth at least $250,000 to himself). To engineer the final outcome for Greedy to walk away
with $220,000, students had to think about how to settle the standoff between Greedy and Burly
both fighting for share #1. The only way to settle a standoff is to take a piece both players are
fighting over and recombine it with a piece they think is not fair, then have one person divide the
new piece and have the other person choose a new share. If share #1 was recombined with share
#4 to create a supershare, Greedy could walk away with at least $220,000. If Greedy had to
divide the supershare into two shares and have Burly choose one, Greedy would definitely play it
safe and cut each share into $220,000 shares. However, if Burly cuts the supershare, Greedy
would have the advantage of choosing one of Burly’s shares, which may be worth more than
$220,000 to him.
The work sample in Figure 3 earned five out of six available points on this test question
as the student identified the standoff, resolved it using the correct pieces and the correct method.
However, she did not earn the sixth point as she did not specify that Greedy had to be the divider
during the standoff resolution process in order to be guaranteed exactly $220,000. If Greedy was

PRODUCTIVE FAILURE IN THE FLIPPED MATHEMATICS CLASSROOM 73
the chooser, he may have earned chosen a new piece worth more than $220,000, which would be
incorrect.
Figure 3. Example of coded and scored posttest item.
As this only shows how one specific problem was graded in detail, it would also be informative
to see several scored solutions to the same problem to see how the rubric was applied to students.
Similar to the scored problem above, posttest question #4 also involved the Lone Divider method
but was more procedural in nature in that students had to calculate fair shares and determine a
fair division of land among four people. There was no standoff or dishonest bidding, making the
division process less arduous. This problem was worth a total of 12 points, with each part of the
problem worth six points. In part (a), students had to complete the table for three points and
provide each player’s list of fair shares for another three points. In part (b), were awarded two
points for each player’s final fair share and acknowledging there was not a standoff. Posttest
problem #4 as it appeared to students is shown in Figure 4.

PRODUCTIVE FAILURE IN THE FLIPPED MATHEMATICS CLASSROOM 74
Figure 4. Posttest question #4 as it appeared to students. Next, examples of students’ work are shown to illustrate the scoring process in Table 10. I
included a solution that earned all 12 out of 12 points, one that earned eight out 12 points, and
one that earned three out of 12 points. The purpose of the table is to show the range of partial
credit that was offered for answering parts of the problem correctly.

PRODUCTIVE FAILURE IN THE FLIPPED MATHEMATICS CLASSROOM 75
Table 10 Examples of Graded Responses to Posttest Question #4
Students’ Work Points Earned and Commentary
This student earned 12 out of 12 points for a completely correct solution.
This student earned eight out of 12 points. The student earned all six points for part (a) but only two points in part (b) for identifying only Alex’s fair share correctly.
This student earned three out of 12 points. The student earned three points in part (a) for correctly filling out the table. The student earned zero points in part (b) for showing no work and for incorrectly stating there should be a standoff.

PRODUCTIVE FAILURE IN THE FLIPPED MATHEMATICS CLASSROOM 76
Coding and scoring invention tasks. Upon conclusion of the data collection process, I
went back and scored each student’s invention task in the PFFC group. The score I assigned was
based on the number of critical features each student identified in each task. Each task’s critical
features were determined by breaking down each method and identifying the important
underlying mathematical processes and concepts that corresponded to a correct solution. Each
task was broken down into approximately five or six critical features. Table 11 shows the total
number of points available for each invention task and the critical features for each task in the
study.
Table 11
Scoring of Invention Tasks Invention Task Number and Topic Critical Features
#1 – Apportionment methods Proportional share of population Standard divisor Standard quota Rounding of quotas Surplus seats Final correct apportionment with integer values
#2 – Divider Chooser method Role of divider Mathematical fairness (1/N) Per month and per share totals Role of chooser Final correct fair division
#3 – Lone Divider method Individual fair shares Mathematical fairness (1/N) Order of receiving fair share Desired and unwanted piece lead to standoff Correct resolution of standoff
#4 – Method of Sealed Bids Mathematical fairness (1/N) Allocation of items Discrepancy between items and fair share Monetary trade-off Correct final allocation

PRODUCTIVE FAILURE IN THE FLIPPED MATHEMATICS CLASSROOM 77
To illustrate how the tasks were scored, I will use invention task #3 and its solution to
explain how credit was offered based on identification of critical features. This task is shown in
Figure 5.
Figure 5. Invention task #3 prompt given to students. A normative solution to this problem is as follows: First, a fair share has to be calculated for each player based on his or her bids. This is achieved by adding up each person’s bids and
dividing by the total number of people in the problem. For example, Andrea’s fair share would
be found by adding $150, $300, $200, and $350 together, then dividing by four to give $250. Or,
another way of looking at is since the plot of land is worth $1,000 in total and has to be split
among four people, each person should walk away with $250 worth of the land in order for it to
be fair. This is the first critical feature of the problem, as establishing a baseline fair share is
needed to make any allocations of pieces to people. The second critical feature is identifying
which pieces are fair to each player. In this case, any piece worth $250 or more would be
considered mathematically fair to each player. Thus, Andrea would find piece #2 and piece #4
fair, Beatrice would find piece #2 and piece #4 fair, Cleo would only find piece #2 fair, and
David would find all pieces fair.
Once fair shares have been established, the third critical feature of the solution involves
giving out pieces to players. With one player accepting any of the four pieces, two accepting

PRODUCTIVE FAILURE IN THE FLIPPED MATHEMATICS CLASSROOM 78
either of two pieces, and one player only accepting one piece, it is customary to give the player
who has the shortest list of fair share pieces first, as they are the most exclusive and cannot settle
for many alternatives. Thus, Cleo would be awarded piece #2. This takes piece #2 out of
Andrea’s and Beatrice’s list of fair shares, resulting in a standoff: both players only now could
receive piece #4 in order to walk away with a mathematical fair share. To resolve the standoff in
a way that is mathematically fair to both players (fourth critical feature), David would be given
either piece #1 or piece #3, and Andrea and Beatrice would be forced to recombine piece #4 with
one of the remaining pieces (piece #1 or piece #3). By recombining a piece they both want with
a piece they both do not want, it is possible for both players to walk away with a fair share. This
can be done if the divider-chooser method is employed (fifth critical feature). If the Divider-
Chooser method is not employed, there is a risk that a division could be made that would not be
fair to one of the players. Either Andrea or Beatrice would have to take this new recombined
piece, have one person make a new cut, then have the other person choose which piece she
wants.
For example, by recombining piece #4 (wanted piece) and piece #3 (unwanted piece), the
new piece would be worth a total of $550 to Andrea. If she is the person left to divide this piece
and have Beatrice choose one of the two pieces, Andrea would cut it in a way that guarantees her
at least half of the value of the recombined piece, which in this case would be $275 for her.
Because this value is over the baseline fair share of $250, she would walk away with a fair share.
A similar argument could be used if piece #1 (unwanted piece) was recombined with piece #4
(wanted piece) during the standoff process.
The work sample that follows was given a score of “1,” as it correctly established
individual fair shares but fell short of assigning correct shares to players and resolving the

PRODUCTIVE FAILURE IN THE FLIPPED MATHEMATICS CLASSROOM 79
standoff. Although an excellent attempt was made to organize the information in columns, the
final solution submission did not contain any evidence of progress toward a solution beyond just
calculating the fair share for each person.
Figure 6. Example of invention task that received a score of “1.”
Coding the focus group interview. Hypothesis coding was used to test the researcher-
generated hypothesis that students who experienced PF would view their learning experience
differently compared to students who did not have the same experience. In hypothesis coding,
codes are developed from a theory or prediction about what will be found before the data is
collected and analyzed (Saldaña, 2009). Using the high-level conjecture from the study’s
conjecture mapping, I developed codes based on the PF design embodiment and mediating
processes involved in the learning intervention. For example, because part of the design
embodiment involved having students work in groups to solve problems related to the video
tutorial content, I hypothesized that students would collaborate and peer teach. Subsequently, I
used the code “peer teach” when students described educating a classmate in their groups. An
example of a statement that was coded with “peer teach” was when a student commented how

PRODUCTIVE FAILURE IN THE FLIPPED MATHEMATICS CLASSROOM 80
the classroom design, specifically work with peers, allowed him to “learn how to do things from
one another.”
The coding system was refined in an ongoing matter as the transcripts were initially
coded then coded again after a second read. For example, the statement, “group chat or group
meet, we use so that if we have questions about homework or a test, we just go over them” was
initially coded as “peer teach,” but since this was a very specific type of virtual group
collaboration outside of class, I ended up building a new subcode, “mobile teaching,” to be more
specific about the type of teaching that actually took place. A total of 12 codes and three
subcodes were developed for the study and can be found in Table 12. In addition, counts of
references to seeking help from the instructor and other students were taken in both groups and
analyzed through a Chi-square test to test the hypothesis that students in the PFFC group found
their peers to be more important to their learning process than the instructor.

PRODUCTIVE FAILURE IN THE FLIPPED MATHEMATICS CLASSROOM 81
Table 12
Coding Scheme Code Definition Data Example
Understanding (U) Subcodes: Conceptual understanding (CU) Procedural understanding (PU)
U: any loose reference to comprehension CU: students describe development of key ideas PU: knowledge of steps or how to complete a problem
U: “it's like when you understand something in a video” CU: “understand core concepts” PU: “understanding how to do it and the process behind” PU: “memorizing certain ways of figuring out a certain problem” PU: “And it's easier to learn in the same order that you did on your own when you come to back to the classroom.”
Video (V)
V: Multimedia tutorial V: “the videos are really helpful” V: “structure of the video is probably the most important”
Peer teaching (PT) Subcode: mobile teaching (MT)
PT: students working in a small group or pairs to help one another understand content MT: when students help one another understand through a mobile device
PT: “learn how to do things from one another” MT: “group chat or group meet we use so that if we have questions about homework or a test, we just go over them”
Pacing (P) P: how students progressed through learning activities
P: “You can do it at your own speed, and that was enjoyable.”
Quiz (Q) Q: start-of-class question set given to students to gauge knowledge of the video set
Q: “that can be a little difficult when you have to take a quiz first” Q: “having a quiz at the beginning of class is also really helpful because it hold you accountable for all of the videos”
Direct instruction (DI)
D: teacher disseminates information
DI: “a summary at the beginning of class and you're allowed to ask questions” DI: “Also, when you come into class after you're done watching the videos, the professor goes over all of the main points.”
Application (A)
A: using information learned from videos and/or peers
A: “actually apply to something you might use in your life” A: “like actually applying them and using the examples”

PRODUCTIVE FAILURE IN THE FLIPPED MATHEMATICS CLASSROOM 82
A: “application of the math is most important because doing it physically allows you really understand what it means”
Time (T) T: any reference to time spent on class
T: “So maybe if the class is a little longer then we could have quiz, reviews, exam reviews, so we can know what we got wrong” T: “I think it would be more helpful if we had more time to work on the problems during class so that we could do it with our classmates, because that helps a lot”
Resources (R) R: instructional material made available to students (textbook, videos, review guides, etc.)
R: “I think the class, just the way it's set up on Sakai in class, it gives you a lot of resources.” R: “I think being more active maximizes how you can use your online tools.” R: “And I think that was really helpful because the book was ... the part that you printed out was really good because it could do reviews, and reviews aren't that long.”
Teacher-student questioning (TSQ)
TSQ: students seeking feedback from teacher
TSQ: “you're allowed to ask questions, it does offer that opportunity for students who are unsure about certain things” TSQ: “ask about questions when I had them just because of my personal preference with learning through a device rather than person to person.”
Group (G) G: students talk about working with one another
G: “Working in groups to do the homework problems” G: “We also did a lot of group work, which really helped all of us work together and learn”
Productive failure (PF)
PF: any mention made to invention task/failure experience
PF: “we have like a test at the end of every class, and then you go home and you do the videos” PF: “At the end doing the invention task helped with later when I went back to watch the videos. They would connect to ... This is why we learned that, and it made it easier,”
Coding the video data. Due to the fact that written solutions to problems only tell us so
much, a closer look at the discussions that went into solving invention tasks was needed to get a
complete picture of learning in the PFFC learning environment. Therefore, video footage of in-
class problem solving for students in the PFFC group was coded by recording the frequency of
solution proposals students made during the invention task. Drawing on research from Kapur

PRODUCTIVE FAILURE IN THE FLIPPED MATHEMATICS CLASSROOM 83
and Bielaczyc (2012), a critical part of the PF experience is when learners have the opportunity
to generate conceptions and understandings, even though they may not be initially correct.
Accordingly, I kept counts for each group as they suggested solution proposals, developed
counterarguments for a group member’s contribution, and advanced a group member’s response
by adding to it.
Quantitative Results
I will first present descriptive statistics and t-test results for scored work for both groups.
This will also include invention task results for students in the PFFC group only. Video
watching data will be then be presented, followed a brief analysis. Finally, a more detailed
quantitative analysis of PFFC students’ work in the class will be presented by means of a
correlation table. Taken all together, the quantitative data will serve as a basis for further
examination of qualitative data.
Results of in-class problems. Descriptive statistics were obtained for students’ in-class
problems for all four weeks of the study in order to understand how working on these
intermediate assessments may have impacted learning performance in each condition. The mean
scores on the weekly in-class problems did not differ significantly each week, as evidenced by a
series of t-tests: in week #1, t(45) = -.305, p = .762; week #2, t(45) = -.545, p = .588; week #3,
t(44) = .607, p = .547; week #4, t(46) = -.378, p = .707. Table 13 provides a complete summary
of all descriptive statistics for all in-class assignments in this study.

PRODUCTIVE FAILURE IN THE FLIPPED MATHEMATICS CLASSROOM 84
Table 13
Descriptive Statistics for Weekly In-Class Problems Group PFFC DIFC M SD M SD t-test Week #1 17.0 3.1 17.3 3.3 t = -.305 Week #2 22.5 5.8 23.3 4.3 t = -.545 Week #3 20.3 4.2 19.5 4.3 t = .607 Week #4 19.8 2.5 20.0 4.6 t = -.378 Results of pretests and posttests. After analyzing the results of students’ in-class
problems, I analyzed overall performance on the pretest and the posttest for each group to see if
there was a significant difference in performance. Similar to the in-class problems, the mean
scores on the pretest and posttest did not differ significantly. For the pretest, t(50) = .397, p =
.693, whereas for the posttest, t(50) = -.538, p = .593. Table 14 lists descriptive statistics for the
pretest and the posttest for both groups.
Table 14
Descriptive Statistics for the Pretest and the Posttest Group PFFC DIFC M SD M SD t-test Pretest 2.3 3.6 2.0 1.6 t = .397 Posttest 73.1 17.3 75.6 15.7 t = -.538
In order to better understand how the learning intervention affected the development of
students’ conceptual and procedural knowledge, I also analyzed the four posttest questions that
directly corresponded to each of the invention tasks. In addition, I broke the posttest down score
further into a total score for the six questions that mainly required procedural knowledge to solve
and a total score for the two questions that mainly required conceptual knowledge to solve.
Once again, no significant differences emerged when means were compared on individual
questions and on aggregated conceptual and procedural knowledge questions. Results of the t-
test for the procedural knowledge questions were t(50) = -.935, p = .354, whereas results for

PRODUCTIVE FAILURE IN THE FLIPPED MATHEMATICS CLASSROOM 85
conceptual knowledge questions indicated t(50) = -.888, p = .379. Moving to individual posttest
questions that corresponded to invention task problems for the PFFC group, the t-test for
question #1 revealed t(50) = -.351, p = .727. The results for questions #3, #5, and #7 were
respectively t(50) = -1.013, p = .315, t(50) = .183, p = 856 and t(50) = .775, p = .442. Table 15
details the complete set of descriptive statistics for the comparisons made between groups for
each of the specific question types.
Table 15
Descriptive Statistics for Specific Posttest Items Group PFFC DIFC M SD M SD t-test Posttest #1 12.3 2.1 12.5 1.9 t = -.351 Posttest #3 9.3 4.1 10.4 3.9 t = -1.103 Posttest #5 10.8 3.0 10.6 2.3 t = .183 Posttest #7 9.1 2.3 8.6 2.4 t = .775 Procedural only Conceptual only
67.0
6.1
14.1
4.1
70.5
5.1
12.7
4.2
t = -.935
t = .888
Results of the invention tasks. For the PFFC group only, I calculated descriptive
statistics so that I could better understand the average number of critical features students
identified on invention tasks during each week of the study. Over the course of the four weeks,
the tasks themselves became more difficult, as evidenced by the decreasing average number of
critical features identified by students. Table 16 shows a concise summary of these data.
Table 16
Descriptive Statistics for the Invention Tasks M SD Week #1 4.0 1.2 Week #2 3.1 1.6 Week #3 1.8 .6 Week #4 0.5 .7

PRODUCTIVE FAILURE IN THE FLIPPED MATHEMATICS CLASSROOM 86
Video-watching survey and analytics. The third research question sought to determine
whether or not students’ video-watching behaviors influenced their learning performance in each
of the learning environments. First, results from the video-watching survey for both groups are
shown below in Table 17.
Table 17
Results of Students’ Video Watching Activities (PFFC and DIFC) Have you
watched all of the videos in this
unit?
How many times have you watched the videos?
Where do you watch the videos?
On what device do you watch the videos?
Yes No 1 2 3 or more
Home Bus Other Computer Smart Phone
Tablet
PFFC group
77.3% 22.7% 68.2% 22.7% 9.1% 90% 0% 10% 100% 0% 0%
DIFC group
80% 20% 70% 26.7% 3.3% 86.7% 0% 13.3% 100% 0% 0%
The table above shows that 77.3% of students in the PFFC group and 80% of students in
the DIFC group watched all of the videos in the instructional unit; students in both groups by and
large reported watching most of the tutorials. In their study on PF in the flipped classroom, Song
and Kapur (2017) suggested further examination of how the device used to access videos in a
flipped classroom could impact learning; however, in this study, all students in both conditions
watched the video tutorials using a computer instead of a phone or tablet. In terms of video-
watching frequency, 31.8% of students in the PFFC group and 30% of students in the DIFC
group reported watching the video tutorials two or more times. The Chi-square test shows that
χ2=0.814 (df = 2), p > .05 for the distribution of video watching frequencies at a 5% level of
significance. The results indicate that the two groups do not have a significant difference in the
distribution of times in watching the video tutorials.
In order to gain a deeper understanding of video-watching behavior beyond the self-
reports for each group, I downloaded individual and group engagement analytics from Kaltura on

PRODUCTIVE FAILURE IN THE FLIPPED MATHEMATICS CLASSROOM 87
the Sakai learning management system. Table 18 lists summary averages for each group over
the course of the study.
Table 18
Video analytics from Kaltura (PFFC and DIFC) Percent of
unique videos
watched
Watched videos
Total view time
Average view time
Average drop-off
Loads to plays ratio
PFFC group
68.0
67.0
4:43:43
0:04:17
73%
0.93
DIFC group
77.2
70.6
4:40:02
0:04:07
72%
0.78
The data above are based on a total of 58 videos for the DIFC group and a total of 60
videos for the PFFC, which includes an additional two invention task solution videos for the
PFFC group. This information could help explain the slightly larger “total view time” and
“average view time” for the PFFC group since they had more videos to watch. In addition to the
basic count of numbers of videos watched, Kaltura also reported on more detailed aspects of
students’ video-watching experience, including average drop-off and loads to plays ratio. For
the purposes of this study, none of these additional features provided any useful information
about the learning intervention. Finally, in order to understand whether students’ self-reported
video-watching behaviors influenced their learning performance on the posttest, I conducted a
one-way ANOVA test. The results indicated that there was no significant effect of video-
watching times on students’ learning performance on the posttest (p > .05).
Correlational table. Due to the fact that no mean differences were statistically
significant on any of the course assignments and activities, I next turned to correlations to
examine the relationship between scores on various course assignments and activities. Of 78
correlations, 22 were statistically significant. Some of the significant correlations were not
PRODUCTIVE FAILURE IN THE FLIPPED MATHEMATICS CLASSROOM 88
surprising: all four of the posttest items positively and significantly correlated with the overall
posttest score. In addition, posttest problems themselves significantly correlated with one
another in a few instances. Keeping the embodied conjecture at the forefront of the analysis, I
was more interested in determining whether or not any relationships existed across the weeks of
the course, from the invention tasks, to in-class problems, to the posttest.
The most interesting observation was the correlation between the third invention task in
the course and performance on posttest question #7, which was one of the two conceptual
knowledge questions on the posttest. Despite the fact that invention task #3 did not significantly
correlate with the in-class problems for that week, it did significantly correlate with the posttest
item weeks later (r = .518, p = .023, N = 19). In all other weeks, the results of the classwork
problems, not the invention task, significantly correlated with performance on the corresponding
posttest question. For week #1 of the study, the classwork set and posttest question #1 had a
significant positive correlation (r = .560, p = .013, N = 19). For week #2 of the study, the
classwork set and posttest question #3 had a significant positive correlation (r = .476, p = .034, N
= 20). For week #4 of the study, the classwork set and posttest question #5 had a significant
positive correlation (r = .508, p = .026, N = 19). These findings make sense in light of the
posttest design. Questions #1, #3, and #5 were all similar to problems student solved in class,
but with different storylines and subquestions to avoid surface similarity. Table 19 shows all of
the correlations among course assessments for the PFFC group.

PRODUCTIVE FAILURE IN THE FLIPPED MATHEMATICS CLASSROOM 89
Table 19
Correlations of Scores on Assessments in the PFFC Group Inv.
#1 Inv. #2
Inv. #3
Inv. #4
CW #1
CW #2
CW #3
CW #4
Post #1
Post #3
Post #5
Post #7
Post Total
Inv. #1
_
Inv. #2
.385 _
Inv. #3
-.178 .139 _
Inv. #4
-.430 -.208 .385 _
CW #1
-.261 .269 -.008 -.007 _
CW #2
-.033 .286 .092 .194 .509* _
CW #3
-.251 .383 .204 -.048 .746** ,615** _
CW #4
.388 .147 .493* .330 .026 .226 .212 _
Post #1
-.331 .041 .579** -.008 .560* .443 .758** .349 _
Post #3
-.155 .192 .403 -.102 .644** .476* .639** .272 .749** _
Post #5
.166 .193 .354 .290 .271 .541* .121 .508* .371 .358 _
Post #7
-.261 -.104 .518* .444 .379 .440 .183 .329 .542** .306 .520* _
Post Total
-.139 .145 .376 .193 .534* .676** .433 .325 .697** .728** .775** .721** _
Notes: *p < .05 (2-taied), **p < .01 (2-tailed).
Conclusion. The first two research questions sought to determine the impact of the
learning environments on students’ conceptual and procedural knowledge. Despite the fact that
there was no significant difference in means for any of the course assessments between groups, a
closer look at the learning intervention in the PFFC group revealed an interesting significant
correlation between the week #3 invention task and its corresponding conceptual knowledge
posttest question. Further analysis of other correlations between course assessments revealed
significant correlations between classwork and corresponding posttest items in other weeks.
In addition, the third research question sought to understand how video watching
behaviors influence learning performance in the PFFC and DIFC learning environments. Based

PRODUCTIVE FAILURE IN THE FLIPPED MATHEMATICS CLASSROOM 90
on the results of self-reports and additional data obtained from Kaltura, there was no significant
effect of video-watching times on students’ learning performance on the posttest. Additionally,
there was no significant difference in video watching frequency or location between the two
groups. Additional qualitative information from the focus group interviews will provide more
insight into the video-watching behaviors of each group that the survey responses cannot
provide. Further qualitative analysis is also needed to better understand which design features
produced critical learning processes that led to the correlational results. The next section will
explore qualitative evidence that can help us better understand and expand on the previous
quantitative findings.
Qualitative Results
The primary purpose of this section is to expand on the quantitative findings in this study.
This section will be organized into three parts. First, I will continue the discussion of the
significant correlation found during week #3 between the invention task and posttest item by
examining work samples and video footage of groups working on the invention task. Second, I
will provide additional information about the invention task solving process over the other three
weeks of the study in order to develop characteristics of effective groups in a flipped classroom
PF learning environment. Finally, I will discuss the results of the coded focus group interviews
for both groups. The results of the focus group interview will provide details about each learning
environment that could not be observed through an invention task solution or posttest score.
These findings will help paint a complete picture of what learning looked like in each
environment and which features of the design embodiment were the most salient in producing
mathematics learning in the PFFC.

PRODUCTIVE FAILURE IN THE FLIPPED MATHEMATICS CLASSROOM 91
Week #3 performance by group. In trying to understand why there was a significant
positive correlation between the invention task #3 score and performance on its corresponding
conceptual knowledge posttest question, I went back to the embodied conjecture to trace what
aspects of the design might have led to this outcome. As research suggests, collaboration does
not immediately ensue once students are placed into groups (Barron, 2003). A lot of work went
into organizing groups and creating a social surround where students felt safe generating
mathematical ideas and working with one another. To that end, I took a closer look at the video
footage of in-person class sessions and focused on how two recorded groups, “Group A” and
“Group B,” worked on the invention task for the topic that week. It became clear that the
conversations looked different for the two groups, as one group seemed to generate more
solution proposals than the other. In addition, one of the groups seemed to develop a procedure
to solve the invention tasks over time, which ended up helping them on scored class assessments.
The subsequent paragraphs describe the analysis of group problem-solving processes for students
in Group A (“Ron,” “Melanie,” and “Maryann”) and in Group B (“Bill,” “Jaidan,” and
“Nicolette”) during week #3.
Prior to video analysis, I compiled data on how students in both groups performed on the
invention task, in-class problem set, and posttest question on week #3’s topics. At the outset, it
appeared that both groups identified around the same number of critical features on their
invention tasks. This was on the basis of their written work on the invention tasks. However,
after going back to the videos, Group A had an intense conversation that scratched the surface of
many critical features during week #3, but none of them were submitted on their final write-ups.
Students in Group A had higher scores on the in-class problems for that week than Group B did.

PRODUCTIVE FAILURE IN THE FLIPPED MATHEMATICS CLASSROOM 92
In addition, students in Group A earned more points on the conceptual knowledge question on
the posttest on week #3’s topic. Table 20 shows the results for both groups.
Table 20
Week #3 Performance in Two PFFC Groups Number of critical
features identified in written solution to
invention task
In-class problems score (out of 24)
Posttest problem #7 score (out of 12)
Group A Ron 2 24 12 Maryann 2 17 12 Alice 3 23 11 Group B Nicolette 2 22.5 8 Bill 2 22 9 Jaidan 1 7 6
Week #3 video analysis. This data begged the question, what did students in Group A do
differently from students in Group B during their invention task process in order to earn higher
scores on their in-class problems and conceptual knowledge posttest question? This is where I
turned to the video footage of the invention task solving process for each group. This was
important to me as a researcher because the design embodiment included the development of a
mathematical safe space, where students’ risk-taking and generating ideas and solutions was
valued. Due to the difficult nature of the invention tasks, successful groups would have needed
to generate many proposals to move toward a solution, even if it was an incorrect one (Kapur &
Bielaczyc, 2012). Based on analyzing the video footage of the invention task sessions, Group A
generated 14 proposals toward a solution in week #3, whereas Group B generated seven
proposals toward a solution. In the case of Group A, students frequently agreed and discussed
key ideas as they came up during the solution process.
PRODUCTIVE FAILURE IN THE FLIPPED MATHEMATICS CLASSROOM 93
What made Group A’s work on this invention task on the video recordings stand out was
not only the number of solution proposals they made but also the quality of their proposals.
After all group members had time to read the problem previously described in Figure 5, Maryann
initially gave an incorrect proposal to the group. After brief consideration, Alice dismissed her
proposal as being unfair to at least one member in the group of four in the invention task, which
was one of the critical features of the problem. Ultimately, after some back and forth
conversation, Alice described one of the critical features of the problem, the standoff, referring to
it as, “that’s where the problem is.” This occurred because two people in the invention task
scenario considered only one piece of land fair, so it would not be right to only give it to one
person and not the other. Additional mathematics was required to solve this problem that I did
not anticipate students would be cognizant of. Most students continued to suggest additional
incorrect solutions at this point; however, Alice identified that this was the “problem” with the
task and proposed division of current pieces of land as a way to resolve the standoff. At this
point, Ron also added to the conversation in a way that furthered Alice’s thoughts. This was
very significant progress toward a possible (incorrect) solution that drew extensively on prior
knowledge and contributions from all group members. A sample transcript of the most salient
aspects of conversation between group members is shown in Table 21.

PRODUCTIVE FAILURE IN THE FLIPPED MATHEMATICS CLASSROOM 94
Table 21
Video Analysis of Group B’s Invention Task #3 Solution Transcript Commentary
Maryann: “Give A #3, B #1, C #4, and give D #2…I don’t know how I did that, but that makes sense in my mind” Alice: “OK, so minimum fair share is $250, so Cleo can’t get #1, can’t get #3, or #4, has to get #2, that’s where the problem comes in.” Maryann: “Why not #4?” Alice: “That’s only $150” Alice: “Wait for Cleo, piece #4 is at $150” Maryann: “But wait if each person is supposed to get $250” Ron: “She’s saying, piece #4 for C is only worth $150, so it has to be greater than $250, that can’t be a fair piece for her.” Alice: “David is the only one who wants piece 1. So we can just give him piece 1.” Ron: “He’s also the only one who wants piece 3 too.” Alice: “Can we divide pieces?” Ron: “That’s what I was thinking, so let’s just give David piece 1” Alice: “David is the only one who wants piece #1, Can we do that? Give Cleo piece 2 because that’s the only one she wants. So then Andrea and Beatrice then divide up…” Ron: “Give Beatrice piece 4, give…” Alice: “Wait, we can give Andrea piece 3 and part of Cleo’s piece 2.” Ron: “We have to shift $50 away, but I don’t know how”
Solution proposal
Identified critical feature of fair share and fair shares for one player, alluded to critical feature of standoff Referenced critical feature of fair share Referenced fair share and fair pieces for Cleo Partial solution proposal Toward a possible correct solution Partial solution proposal Toward a possible correct solution Solution proposal (incorrect) Solution proposal (incorrect) Solution proposal (incorrect)
While Group B did not reach the same point, members did generate some ideas toward a
solution. During this entire process, one student (Jaidan) did not contribute to solving the
problem, but instead remained passive and wrote down what the other two group members were
saying. As evidenced by the transactions below, there were some solutions generated, but no
specific course of action was taken regarding the unfairness of proposed solutions. Members of

PRODUCTIVE FAILURE IN THE FLIPPED MATHEMATICS CLASSROOM 95
group B did not specifically point out the problem of the standoff and two people having the
same list of fair pieces as members of group A did. Group B’s members handed in an answer
they knew was incorrect but did not attempt to mathematically reconcile the incorrect answer.
As seen in Table 22, members of Group B referenced some critical features and attempted to
generate some solutions, but then suggested giving out pieces in an unfair manner to David.
Table 22
Video Analysis of Group B’s Invention Task #3 Solution Transcript Commentary
Nicolette: “So David can basically get $250, which means he can get anything, so we’ll do him last” Bill: “So yeah yeah, yeah….Which one needs what?” Nicolette: “So Andrea would want #4” Bill: “I think Cleo needs #2” Nicolette: “So if we gave A #4, C #2, there’s #1 and #3 left. But B would want #1? Bill: “If B gets #1 and D gets #3, is that what we do?” Nicolette: “Is that fair though? Don’t they at least have to get $250? That doesn’t work. They all can’t get $250” Nicolette: “If we give her C, she will get $450, and D will get only $200, I guess it doesn’t matter?” Bill: “It’s not about being fair, it is about being rational!”
Identified critical feature of fair share and pieces fair to one player
Partial solution proposal Partial solution proposal Partial solution proposal (incorrect) Referenced critical features of fair share and fair pieces per person Partial solution proposal (incorrect) and disregards fair share critical feature for D Incorrect, but interesting qualitative approach to solving the problem
Week #3 invention task analysis. To further understand why Group A was more
successful than Group B, consider the following example of conceptual knowledge development
from a member of Group A through the course of the learning process described in the embodied
conjecture. As previously discussed, the critical features of the solution to invention task #3
included establishing individual fair shares, determining a cutoff for mathematical fairness,

PRODUCTIVE FAILURE IN THE FLIPPED MATHEMATICS CLASSROOM 96
giving out the fair shares in an order that allows the neediest person to be addressed first,
recognizing the standoff that occurs when one piece is the only piece two people consider fair,
and resolving the standoff by recombining an unwanted piece with the piece both players want to
establish fairness. This invention task was one of the most difficult tasks for students to solve
since they struggled with how to resolve the standoff. Unlike Group B, Group A was able to talk
through the issue that further action needs to take place to resolve the problem. Below is
Maryann’s final submission to the invention task:
Figure 7. Maryann’s solution to the invention task on fair division.
Maryann organized the information from the problem into rows and columns and
appropriately added up the total amount each person was willing to pay for the shares. This
process of initially organizing information was consistent with how her group began the
invention task solving process each week. Maryann also calculated the fair share for each person
($250) and represented this visually using four pieces. As a result, Maryann only identified one
critical feature of the problem and did not make any written progress in giving out pieces to
people. Upon further examination of the video transcript of this class session, it appears that
group members did discuss the inaccuracy of this division and generated new possibilities for

PRODUCTIVE FAILURE IN THE FLIPPED MATHEMATICS CLASSROOM 97
how to resolve it, but Maryann did not write any of them down. This active generation of
possible solutions was also consistent with how Group A worked through their invention tasks
each week.
Corresponding posttest question analysis. On the posttest, students solved a
corresponding problem that involved a standoff, but they had to engineer an exact set of
circumstances in which a player could end up with an unfair share in the Lone Divider method
(see Appendix D). This problem primarily required conceptual knowledge to solve, as students
had to not only know the process of resolving a standoff, but they had to think critically about
how the critical features of the problem all connected with one another to produce the final
result. This is line with the definition of conceptual knowledge offered by Baroody et al. (2007),
which refers to knowledge that is rich in connections.
Prior to the posttest, students never solved a problem of this type on the Lone Divider
method where they had to develop a scenario using mathematics to justify their answer. Students
who provided correct solutions in the PFFC group demonstrated a complete understanding of
how the Divider-Chooser method works within the Lone Divider method, a crucial step needed
in defending a mathematically sound answer. In particular, these students acknowledged the fact
that the player in question could either be a divider or a chooser, and that depending on which
player is which, the final outcome would be at least $220,000 for each player. Maryann’s work
is shown reproduced in Figure 8 as an example of this:

PRODUCTIVE FAILURE IN THE FLIPPED MATHEMATICS CLASSROOM 98
Figure 8. Maryann’s solution to dishonest bidding conceptual understanding question on the
posttest.
Not only did Maryann correctly solve the problem, but she also correctly detailed all of
the critical features that could result in an unfair share. The role of the divider was a common
error for many, as Maryann correctly illustrated the fact that Greedy would get “at least”
$220,000, with the underlying understanding that it could be more if Greedy was the chooser.
This was a crucial distinction to make in this method as only the divider was guaranteed to get
exactly half of what the item in question is worth, whereas the chooser could earn more than that.
Maryann’s work on this question was comparable to that of other members of her group and was
among the highest quality in both the DIFC and PFFC groups.
Outside of week #3. Aside from this detailed analysis of week #3’s learning activities,
further evidence supports the identification of Group A as a “stronger group” and Group B as a
“weaker group” in this study. Over the course of the four weeks, Group A and Group B differed
in the number of critical features they identified each week. Group B started out strong by
identifying five critical features for the first week, but as weeks went on, members started
identifying fewer and fewer features. In comparison, Group A continued to identify

PRODUCTIVE FAILURE IN THE FLIPPED MATHEMATICS CLASSROOM 99
approximately two to three critical features each week, despite the fact the tasks themselves
gradually became more difficult, as evidenced by the class averages presented earlier. In
addition, the video transcripts revealed that Group A often came close to discussing critical
features, but sometimes did not include them in their invention task submissions. Table 23 lists
the number of critical features identified by members of each group over the course of the four
weeks period of the study.
Table 23
Identification of Critical Features in Written Solutions to Invention Tasks Task #1 Task #2 Task #3 Task #4
Group A Ron 2 2 2 2 Maryann 2 2 1 Absent Alice 2 4 3 2 Group B Nicolette 5 2 2 0 Bill 5 2 2 0 Jaidan 5 1 1 1 As in week #3, I went back to all of the video recordings of the invention task solving
process to see how many times members in each group gave a solution proposal during the
invention task process. I discovered that as time went on, members of Group A increasingly
offered solution proposals from week #1 through week #3, whereas members of Group B
decreased their contributions from week #2 through week #4. Group A seemed to develop a
pattern of organizing given information into tables and charts, then recalling ways they have
worked with data tables and charts before, followed by active generation of possible solutions.
This was particularly noticeable in weeks #3 and #4 when Group A provided twice as many
solution proposals as Group B. Table 24 lists the number of proposals for each week over the
course of the study.

PRODUCTIVE FAILURE IN THE FLIPPED MATHEMATICS CLASSROOM 100
Table 24
Solution Proposals from Group Members Task #1 Task #2 Task #3 Task #4
Group A 9 11 14 9 Group B 7 8 7 4
With the hypothesis of stronger groups generating more solution proposals and
identifying more critical features in mind, I took an even closer look at the invention task solving
process during week #4, the final week of the study. I chose this week as it was the point in time
where group members had spent the most time with one another and had likely developed norms
and working relationships, as per the embodied conjecture. The invention task for week #4 was
based on the premise of the Method of Sealed Bids. This involves people bidding on discrete
items that cannot be divided; they have to be given out in whole or not at all. The canonical
solution requires the highest bidder to earn each item, and then bidders who do not earn an item,
or earn items less than their “fair share,” have to receive a cash settlement from the people who
earned items that exceeded their fair share. Sometimes there are more items available than
people in the problem, which complicates the allocation of items to people and the cash
settlement. I chose this scenario for the invention task to see how students would handle giving
out items and making sure everyone walked away with something fair. This proved to be the
most difficult task as students became confused with establishing fair shares when there were
more items than people and how to handle people who did not earn an item.
For Group A, Ron and Alice continued in their usual fashion by immediately setting up a
table to organize the given information. This was a step they usually took to try and visualize a
solution path. They also recalled their knowledge of fair share to solve the invention task on fair
distribution, which was helpful and consistent with the mediating process of activating and

PRODUCTIVE FAILURE IN THE FLIPPED MATHEMATICS CLASSROOM 101
differentiating prior knowledge during the PF experience. One of their solution proposals
included the concept of the standoff from the week before, which was logical, but not
immediately helpful. Both Ron and Alice proposed ways to resolve the issue at hand, which was
when multiple people bid the highest for the same item. They also acknowledged a critical
feature that there were more items than people, which posed an issue with fair distribution. Once
again, thinking outside the box and toward a correct solution, they attempted to bring cash into
the problem, but their procedure for doing so was flawed. Despite the fact that their final
solution was incorrect, their solution and progress on video followed a routine that they
established over four weeks: organization of information, recall of prior knowledge, analysis of
the major issue at hand, and possible ways to address it (often with incorrect, but logical
attempts). These behaviors seemed to ultimately help them succeed on in-class problems and
posttest items.
In Group B, Nicolette took charge by telling her groupmates to make a chart. Nicolette
labeled the top row with fair shares per person, which was a step in the right direction, but her
conception of fair in this setting was not correct. Nicolette found the fair shares based on the
number of items, not the number of people. Nicolette recognized there were more items than
people and insisted that someone had to get two items, which was not necessarily true but
important to the overall solution. Bill and Jaidan attempted to link the problem to the bid list
problem in invention task #3, which was also logical but not helpful. Similar to their solutions
from the previous week, Bill and Nicolette employed a rational and humanistic approach to their
final solution proposal; they gave each person exactly one item and the final item was given out
to a person who the group members perceived deserved a little bit more. This approach,
unfortunately, overlooked mathematical fair shares, which was critical to the solution of the

PRODUCTIVE FAILURE IN THE FLIPPED MATHEMATICS CLASSROOM 102
problem. Looking across weeks, Group B never developed a set procedure for working through
invention tasks. Jaidan’s participation was spotty, whereas Nicolette usually led the
conversations.
Summary. Digging deeper beyond the significant correlation observed between the
invention task and the corresponding posttest item observed in week #3, it was determined that
more successful groups of students generated more solution proposals while working through
invention tasks. More importantly, these proposals contained critical features of the invention
tasks that group members had the opportunity to discuss with one in another in order to advance
the solution.
In addition, the stronger group developed a working procedure for working through
invention tasks by the fourth week of class. This included accessing prior knowledge, organizing
given information, then generating and critiquing solution proposals. The design embodiment’s
provision of a participation structure that allowed for students to critique, evaluate, and explain
work to one another, certainly enabled these rich transactions to happen. Students were also able
to make these solution proposals based on their prior knowledge and did so in a way that allowed
co-construction of knowledge in the group setting. Had the students worked on the invention
tasks themselves, they may not have been able to get as far with them, or have been able to
handle more difficult posttest items primarily requiring conceptual knowledge to solve.
Focus group interview results. The goal of the focus group was to have students reflect
on their experiences in each of the learning environments in order to better understand students’
mathematical inquiry process in each setting. Eight students from the PFFC group volunteered
to take part in the focus group interview, including Bill from Group B and Maryann and Alice
from Group A. These students represented a range of mathematical abilities in the course as well

PRODUCTIVE FAILURE IN THE FLIPPED MATHEMATICS CLASSROOM 103
as year in college, ranging from freshman to senior. Similarly, nine students from the DIFC
group volunteered to take part in the focus group interview, and also represented a range of
mathematical abilities and year in college. A total of six questions were asked, which included
one question on whether or not the students in each section consulted with one another over the
course of the semester. Students responded to that question with a unanimous “no” in both
groups. The results of the coded interviews for the remaining five interview questions are
summarized in the subsequent paragraphs.
Question 1. For the first interview question, students were asked very generally to
discuss the learning activities for the unit on apportionment and mathematical fairness. All three
students in the PFFC group who responded to this prompt referenced the PF experience and how
it helped them make connections in the course. One student gave the following overview of the
PF process, thinking of the invention task as a test: “For instance … we have like a test at the end
of every class, and then you go home and you do the videos. You come back and you usually
have ... you have your answer for the question that you didn't know before, and then you do
homework…” A second student identified the experience more clearly by stating, “At the end
doing the invention task helped with later when I went back to watch the videos. They would
connect to ... this is why we learned that, and it made it easier.” The third student likened the PF
process to trial and error, as evidenced by the following quote: “There's a lot of trial and error at
first to understand core concepts. And then, as you understood the formula of how to work
something out it is a lot easier.” All of these students realized the importance of the invention
tasks and how working through them helped them develop both a conceptual and procedural
understanding of mathematics in the flipped classroom.

PRODUCTIVE FAILURE IN THE FLIPPED MATHEMATICS CLASSROOM 104
In the DIFC group, the four students who responded to this question described their
learning activities in terms of topics covered, assessments, and group activities. The first student
gave a brief overview of the two topics of study, summing it up as a unit devoted to learning
“specific methods.” The second student cited the routine of videos outside of class, followed by
quizzes, then problem solving during the in-person class session. The third student discussed
how the class worked in small groups and how advantageous it was to ask a peer for help instead
of asking the instructor all of the time. Last, the fourth student built off the third student’s
response by adding in how her group collaborated outside of class using mobile devices: “We
have a good chat group and group meet we use so that if we have questions about homework or a
test, we just go over them while we're at home, too.” As evidenced by frequency counts,
students in the DIFC group mostly described their learning in terms of groupwork and in-class
assessments like quizzes and homework problems. This is in contrast to the students in the
PFFC group, who unanimously spoke about PF and the role of understanding in the flipped
classroom.
Question 2. Moving beyond a description of the learning activities, students were next
asked to describe how they found the learning activities. In response, students in the PFFC
group largely described their satisfaction with their learning activities in the flipped classroom.
Most of their descriptions involved pacing and working through video sets. Of the 12 responses
to this question, 10 referenced the aspect of time. The first student, Bill from Group B, brought
up how the layout of the flipped classroom allowed for flexibility in completing course
requirements. Whereas two students commented on liking the ability to re-watch portions of
videos, four students commented on how they skipped through parts of videos once they were
able to understand and consolidate the main concepts, including Maryann and Alice from Group

PRODUCTIVE FAILURE IN THE FLIPPED MATHEMATICS CLASSROOM 105
A. This information was also valuable as the quantitative survey and additional Kaltura video
analytics did not pick up instances of students skipping through segments of video. This could
be a result of the PF design, which allowed for students’ consolidation of content during the
video-watching process, in contrast to the video-watching process being initial exposure for
students in the DIFC group. The final two students brought the conversation back to PF and
expressed their satisfaction with the invention tasks. One of these students, Alice from Group A,
said, “I liked the invention tasks. I thought they were kind of fun, actually, like little games or
like puzzles to figure out. Those were just a fun way to learn how to do something because then
when you look at the actual answer, it's kind of like, Wow! That's how you do it." The second
student agreed and talked about how it was helpful to work on the invention tasks with a group
and bounce ideas off of one another to learn the content.
Students in the DIFC group also largely reported positive feelings toward the learning
activities. Once again, their focus was on the video tutorials. All eight students who responded
to this question based their responses on the videos. In contrast to the PFFC group, no students
in the DIFC group reported skipping through any portions of the video. Rather, three students
commented on how they liked being able to re-watch and rewind videos as needed, while another
three responded favorably to the availability of additional supplemental resources to learn the
content of the unit. Despite the fact that students had access to e-mail and weekly office hours
before each class session, three students talked about how they did not like videos because they
could not ask the instructor questions at the exact time they were watching the videos.
Interestingly, two students discussed the importance of having a teacher-led start-of-class review
and quiz as ways to help them understand and consolidate the material. One student even said
how the quiz “generally reinforces the information and I'm able to understand it for the major

PRODUCTIVE FAILURE IN THE FLIPPED MATHEMATICS CLASSROOM 106
exams.” This runs in contrast to the PFFC students’ responses, where some students cited the
initial video watching as being their consolidation process.
Question 3. For the third interview question, students were asked what they found to be
most important in their mathematical inquiry process. The six students’ responses in the PFFC
were split: three students discussed the importance of conceptual understanding, while three
students discussed the need to apply classroom content to real-life. An example response from a
student in the group was, “For me it's concepts. If you don't understand the concept of doing it
you really won't get it. So I think applying the concept and really trying to understand what
you're doing so you can be able to apply any kind of way, and doing it as a group together, it
helps each other understand our concept.” Another student discussed how “understanding the
underlying logic” helped him navigate problems in the course. The three students in the PFFC
group who described applicability as important to their inquiry made general comments about
how authentic contexts and immediate application made them better prepared to work through
problems. For example, Alice from Group A commented how, “When the problem is useful, it is
easier to get through it.”
In contrast, students’ responses in the DIFC group were more diverse and did not discuss
conceptual understanding. In fact, the five students who responded all valued something
different in their inquiry process. The first student spoke about the active application of content
and how “doing it physically allows you really understand what it means.” The next two
students spoke about the consistent wording of prompts across the course and applicability of
material, respectively. The final two students discussed successful preparation for class and the
design of each video tutorial. These responses were very diverse and difficult to generalize, but
on the whole, it seemed the DIFC group commented more about course design features as

PRODUCTIVE FAILURE IN THE FLIPPED MATHEMATICS CLASSROOM 107
important to their inquiry process, whereas students in the DIFC group commented more about
conceptual understanding and applicability of content.
Question 4. The fourth interview question had students reflect on which aspects of the
course design they would like to see strengthened. The theme of time came across many of the
students’ responses in both groups, but the suggestions for what to do with the added time were
different. Some minor suggestions from the PFFC group included moving due dates for class
assignments later and opening up video sets earlier, while some of the more common suggestions
including lengthening the in-person class session to allow for more time for classwork and
review of assessments. Of the seven students who responded to this prompt in the PFFC group,
four of them suggested lengthening the in-person class session to allow for more time to
complete classwork, review quizzes, and work in groups. Students in the DIFC group also
proposed having more opportunities to ask the professor questions as part of the course design
improvement. All four students who responded to this question specifically suggested more
direct instruction from the instructor. The first student suggested that this come in the form of
online forums where the professor could answer questions, whereas the other three students
suggested more quiz review, more exam review, and a start-of-class review that mimics the
progression of content from the video set.
Question 5. Finally, students in both groups were invited to share general feedback about
their experiences in the course in order to garner additional relevant information about the
learning environments. Responses from both groups were generally along the same line;
students responded favorably to the blend of online and in-person learning activities in the
flipped classroom and also appreciated the wealth of resources available to them to be
successful. Supporting statements from students in the PFFC group include one where a student

PRODUCTIVE FAILURE IN THE FLIPPED MATHEMATICS CLASSROOM 108
felt that the videos “pushed you to do the work,” and another from Maryann from Group A who
felt that the course offered “so many opportunities that you have as you can actually practice
your work.” Students in the DIFC talked more about how the videos were important to their
success, and how they preferred them over their textbook or used the textbook only as a
supplemental resource. One student said, “I think the videos are really important to this class
being a hybrid because if there weren't videos, I couldn't imagine myself just reading a textbook
and learning like that. That just would not work for me.”
Summary. The fourth research question was, “How do students in both the DIFC and
PFFC learning environments describe their in-class mathematical inquiry process?” Students’
responses to each of the interview questions help form a picture of what learning looks like in
each environment. Overall, both groups expressed their appreciation for the flipped method of
instruction and how their initial perceptions of blended learning and non-traditional instruction
were very different from what they actually experienced after taking the class for many weeks.
Both groups cited the importance of their group members, the instructor, and online resources as
key features of their success in the course. The most interesting finding from the analysis was
that students in the DIFC group cited their instructor more frequently as important their learning
process, whereas students in the PFFC group cited their peers more frequently as important to
their learning process. This is evidenced by additional quantitative analysis of counts through a
Chi-square test, where χ2 (1, N = 17) = 4.735, p < .05.
Additionally, students in the PFFC group seemed to reflect more on understanding
concepts over the course of the interview compared to their DIFC counterparts, who mainly
viewed their learning online and in class as procedural. Time for concept exploration in class
with group members prior to direct instruction was frequently described to be a critical part of

PRODUCTIVE FAILURE IN THE FLIPPED MATHEMATICS CLASSROOM 109
the learning process for students in the PFFC group, as evidenced by all students’ responses to
the second focus group question. In addition, when students in the PFFC described video
tutorials, some referenced how they did not feel the need to work all the way through them due
to their exposure to the content by means of the invention tasks. On the other hand, students in
the DIFC group more frequently described the videos as information they had to master and
apply, and would turn back to. None of the students in the DIFC group mentioned skipping or
fast forwarding of videos. This different explanation of the videos could be due to the role of the
videos within each condition, as they served as the initial “direct instruction phase” for the DIFC
group but served as the “consolidation phase” for the DIFC group.
Conclusion
Despite the fact that there was not a significant difference in posttest performance
between groups, the data analysis over the five questions reveals that students in the PFFC group
benefited from the additional time spent on concept exploration and accessing prior knowledge.
Students’ responses to the interview prompts made this the most obvious, as students in the
PFFC group more often referred to concepts and invention tasks as they discussed their learning
in the course, whereas students in the DIFC group usually referred to watching videos to learn
procedures as the most important. A more in-depth analysis of in-class video recordings and
work samples revealed that more effective groups were able to identify more critical features of
problems than their peers did and that over time more effective groups had more productive
solution generating habits while solving invention tasks. This ultimately led to stronger work on
posttest items involving conceptual knowledge. This study showed no significant difference in
video watching between groups, although students in the PFFC did seem to watch the videos less

PRODUCTIVE FAILURE IN THE FLIPPED MATHEMATICS CLASSROOM 110
frequently and more purposefully than their DIFC counterparts based on the advanced analytics
obtained from Kaltura.

PRODUCTIVE FAILURE IN THE FLIPPED MATHEMATICS CLASSROOM 111
CHAPTER 5: DISCUSSION
Purpose of the Study
The primary purpose of the current study was to redesign a flipped classroom to include
productive failure as a learning intervention. This study contributes to the field of research on
the design of flipped classrooms through proposing a method for helping students access their
prior knowledge inside the classroom before working through instructional videos outside of the
classroom (O’Flaherty & Phillips, 2015). In addition, this study extended the findings of
previous research in the field of productive failure that have shown the efficacy of delaying
instruction by allowing students to work on challenging tasks that require them to access prior
knowledge and invent solutions prior to hearing or reading normative explanations (Kapur, 2008;
Kapur & Bielaczyc, 2012). This has been accomplished by incorporating a productive failure
approach into the flipped classroom as a way to begin learning the next concept before leaving
each in-person class meeting. Prior to leaving class, but before watching their weekly video sets,
students were able to experience short-term failure that prepared them to work productively
through videos and in-class problems. This study also examined qualitative data related to the
productive failure experience in the flipped classroom, namely how students solved problems in
groups and how they described their inquiry process in the undergraduate mathematics
classroom.
This study also built on more recent work completed by Song and Kapur (2017) in the
area of productive failure in the flipped classroom. Using this study as a framework for my own,
I was able to test their theory and method in my context of higher education. In doing so, I
addressed a few limitations in their study in my own study. First, my study included instruction
beyond a two-week time period and considered students’ knowledge development over the

PRODUCTIVE FAILURE IN THE FLIPPED MATHEMATICS CLASSROOM 112
course of a whole four-week unit. Second, I turned to more detailed video analytics in addition
to self-reports to better understand students’ video-watching behaviors in both treatment
conditions. This included the average amount of time students spent watching each video, the
percent of unique videos watched, and their average drop-off while watching videos. Third, the
Song and Kapur (2017) study involved different instructors; in this study, the same instructor
taught both flipped classroom sections using the same procedures to allow for a more equitable
comparison between groups. Last, I also ended up relying more on qualitative data to develop
my findings as opposed to looking just at post-test scores as measures of students’ learning, as
they did in the Song and Kapur (2017) study. The results of my focus group interview and video
footage provided me with information about the learning environments that could not be
captured on a posttest. These modifications to the Kapur and Song (2017) study enabled me to
critically examine the productive failure flipped classroom design and understand both the in-
person and online components of the course in a more nuanced manner.
Discussion of Findings
In this section, I will summarize findings as they relate to each of the research questions.
Each research question is restated below along with a brief synopsis of the findings that answer
the question.
Effects on procedural knowledge. The first research question asked, “What is the
effectiveness of flipped classroom pedagogical design interventions on the development of
students’ procedural knowledge, particularly on their written work samples?” A comparison
between posttest scores for both treatment conditions demonstrated that there was not a
statistically significant difference in performance on procedural knowledge questions. Relatedly,
t-tests revealed no statistically significant difference on in-class problems. For the PFFC group

PRODUCTIVE FAILURE IN THE FLIPPED MATHEMATICS CLASSROOM 113
only, additional t-tests were run to see if there was a significant relationship between each
invention task and its corresponding procedural knowledge question on the posttest. Once again,
there were no statistically significant results. A possible reason for this finding is that all
students in both conditions had opportunities to acquire procedural knowledge before coming to
each in-person class session. Students in both groups watched the exact same video tutorials,
which outlined the procedures they needed to learn for solving problems in class.
Effects on conceptual knowledge. The second research question asked, “What is the
effectiveness of flipped classroom pedagogical design interventions on the development of
students’ conceptual knowledge, particularly on their written work samples?” A comparison
between posttest scores for both treatment conditions demonstrated that there was not a
statistically significant difference in performance on conceptual knowledge questions. Similarly,
t-tests revealed no statistically significant difference on in-class problems. For the PFFC group
only, additional t-tests were run to see if there was a significant relationship between each
invention task and its corresponding conceptual knowledge question on the posttest. Once again,
there was no statistically significant result.
However, additional correlation analysis revealed that there was a significant positive
correlation between invention task #3 and its corresponding conceptual knowledge posttest item.
In addition, students’ scores on in-class problems positively correlated to similar problems on the
posttest. Further qualitative analysis revealed that students in the PFFC group largely discussed
their learning experience in the flipped classroom in terms of concepts and understanding,
whereas students in the DIFC largely described their learning experience in terms of procedures
and applications.
PRODUCTIVE FAILURE IN THE FLIPPED MATHEMATICS CLASSROOM 114
Research in productive failure literature further demonstrates that students who attempt
numerous solution approaches, even if they are failed approaches, tend to learn more than
students who attempt fewer solution approaches (Kapur, 2012; Wiedmann, Leach, Rummel, &
Wiley, 2012). Despite the fact that posttest scores did not reveal this outcome, correlations
between assessments in the course showed a positive relationship between students’ invention
task solutions and their corresponding conceptual knowledge posttest question. This could
explain the interesting correlation observed between the invention task and its corresponding
conceptual knowledge posttest item.
Video-watching behaviors. The third research question asked, “How do video watching
behaviors influence students’ learning performance in the DIFC and PFFC learning
environments?” The results of students’ self-reported surveys and an additional video-watching
report from the learning management system indicate that there were no significant differences
in video watching frequency or behaviors between groups. Most students watched the videos at
least once; 77.3% of students in the PFFC group and 80% of students in the DIFC group reported
watching all of the videos in the unit. In addition, 31.8% of students in the PFFC group and 30%
of students in the DIFC group reported watching the video tutorials two or more times. During
the focus group interview, students in each group discussed their behaviors as they progressed
through the video tutorials. Students in the PFFC group referenced fast forwarding and skipping
portions of videos, whereas students in the DIFC group did not make these comments.
Additionally, all students in both groups reported using a computer to work through the videos
rather than any type of mobile device. Further analysis revealed that there was no significant
effect of video-watching times on students’ learning performance on the posttest.

PRODUCTIVE FAILURE IN THE FLIPPED MATHEMATICS CLASSROOM 115
This finding was unexpected, as it was hypothesized that students in the PFFC would
watch the instructional videos less frequently due to the time they spent on the invention tasks.
The purpose of the invention task was to give students time to access prior knowledge and start
developing concepts before the video consolidation phase of their learning (Song & Kapur,
2017). With the concept exploration opportunity that the DIFC did not have, it was surprising to
see that there was no significant difference between groups in terms of video watching. This
could also suggest a need to look further into the content of the videos so that both groups
receive the appropriate level of instruction based on their experiences prior to watching the
tutorials.
Mathematical inquiry process. The fourth research question asked, “How do students in
both the DIFC and PFFC learning environments describe their in-class mathematical inquiry
process?” Overall, students in both groups positively described the flipped classroom learning
environment and provided valuable feedback on the model. Both groups discussed how
important it was to work with other group members, the instructor, and online resources both
online and in class to learn the content. The most interesting finding from the analysis was that
students in the DIFC group cited their instructor more frequently as important their learning
process, whereas students in the PFFC group cited their peers more frequently as important to
their learning process.
A possible explanation for this finding is the fact that the PFFC students had more time to
work with their peers due to the collaborative nature of the invention tasks. The design
embodiment for both groups allowed for collaboration on in-class problems, but students in the
PFFC group had the additional invention task problem to collaborate on in a small group setting.
All students went into the invention tasks without having had any instructions on the topics, so it

PRODUCTIVE FAILURE IN THE FLIPPED MATHEMATICS CLASSROOM 116
could have been the case that students felt more comfortable exchanging ideas on problems they
all were not expected to already know how to solve.
Another interesting finding from the focus group interviews was that students in the
PFFC group more frequently summarized their experiences as learning concepts, whereas
students in the DIFC group more frequently summarized their learning as mastering steps and
procedures. This was most salient in their discussions of how they approached watching the
instructional videos; students in the PFFC group made it a point to discuss how they fast-
forwarded and skipped parts of videos, whereas students in the DIFC group discussed how they
watched the videos to learn steps and procedures.
A possible explanation for this finding could be the order of learning activities that
students engaged in while in the PFFC group. Students in the PFFC group had the opportunity to
mobilize prior knowledge in class and then used the videos to consolidate their understanding
from the invention task (Song & Kapur, 2017). Students in the DIFC group did not have this
opportunity; rather, the instructional videos were their first exposure to the new content. When
reflecting on their inquiry processes, students in the PFFC might have recalled concept
development more easily since they had the additional opportunity to develop knowledge of
concepts of fair division, apportionment, and fair distribution.
Video footage of in-class sessions. The fifth research question asked, “How do students’
problem solutions to in-class problems and their interactions as they discuss these problems
mediate conceptual and procedural learning as measured on the posttest?” Despite the lack of
statistical significance on in-class and posttest items between the two groups, a closer look at the
mediating processes in the design embodiment through the video footage of in-class sessions
revealed that the productive failure experience did lead to identification of critical features of the

PRODUCTIVE FAILURE IN THE FLIPPED MATHEMATICS CLASSROOM 117
problems before students were instructed on them. This was particularly salient in groups who
generated many solution proposals for each invention task and who also developed a set
approach for solving the invention tasks over the four weeks of the study. By tracing the
evolution of Group A and Group B over the four weeks of the course, it became clear that a
group like Group A had a set strategy of pattern of organizing given information into tables and
charts, then recalling ways they have worked with data tables and charts before, followed by
active generation of possible solutions.
These processes of immediately organizing information, retrieving prior knowledge, and
verbally generating solutions in real time helped members of Group A solve the problems they
were faced with throughout the study. This is consistent with Kapur and Bielaczyc’s (2012)
theory of designing for productive failure, as they posited how a true productive failure
experience involves having students access their prior mathematical resources. Kapur and
Bielaczyc (2012) also identified collaboration as important in facilitating attention to and
elaboration of critical features. In this study, because students had the ability to collaborate on
the invention tasks in groups, they were able to generate ideas and critical features in front of
their peers. In Group A, students responded to these ideas and critical features with additional
questions, clarification, and agreements/disagreements that advanced their invention task
solution process (Kapur & Bielaczyc, 2012).
Interpretation of Findings
This quasi-experimental mixed methods study reported on the impact of two learning
environments, the PFFC and DIFC, on students’ procedural and conceptual knowledge in a
flipped undergraduate mathematics course. Findings indicated that although both designs could
improve students’ procedural knowledge, no statistically significant results were obtained

PRODUCTIVE FAILURE IN THE FLIPPED MATHEMATICS CLASSROOM 118
between the DIFC group in terms of procedural and conceptual knowledge. Students in both
groups also responded very favorably to the flipped classroom approach on their learning. This
was amplified in the PFFC group, where students commented on how their experiences in the
course actively working with the content and with one another.
Even though the productive failure setting was not superior in this particular experiment,
some aspects of group work during productive failure were more productive for future learning
than others. First, having students work on invention tasks in groups resulted in the generation
of many ideas that may not have come about if students had to work on the tasks by themselves.
In addition, having a safe and supportive social surround developed from the beginning of the
course allowed for students to feel comfortable with both the instructor and other peers (Kapur &
Bielaczyc, 2012). This was fostered by having well-established groups for weeks prior to the
beginning of the study. By the time students worked on invention tasks with one another, they
were already used to engaging in mathematical inquiry with one another and felt comfortable
discussing mathematics with one another.
Kapur (2011) also unpacked the role of the teachers in the productive failure learning
environment and noted how teachers should not immediately provide help during the productive
failure process. The design of the productive failure learning environment for this study
included a carefully developed set of questions and protocols that ensured this would not happen
(see Appendix G). By allowing students to struggle with developing a canonical solution to each
invention task, they were forced to try harder and develop a solution by working with one
another (Kapur, 2011). These are some of the features of productive failure that were effective
in this study and can be engineered into new and future productive failure designs.

PRODUCTIVE FAILURE IN THE FLIPPED MATHEMATICS CLASSROOM 119
To better understand the lack of a significant difference in course assessments between
groups, I revisited the mediating processes in the embodied conjecture. If the design worked as
it should, the high-level conjecture predicted that the intervention would result in students’
improved conceptual and procedural understanding of targeted content, through the operation of
the hypothesized mediating processes. Because this was not the case for students in the PFFC,
this could suggest some of the mediating processes may not have occurred as planned, or that the
mediating processes did produce the expected outcomes. Video footage of group problem-
solving processes did reveal students activating and differentiating prior knowledge as planned.
More successful groups did show significant evidence of giving reasons, making conjectures,
and constructing solutions to invention tasks. Less successful groups were not as forthcoming
with their solutions. In very few cases, video footage revealed that students had a shared
understanding of how to solve invention tasks, but the actual written submissions did not reflect
the productive conversations on videotape. These findings suggest that sometimes various
groups did not fully engage in the mediating process of actively making conjectures and
supporting them in their written work, which may have prevented them from achieving the
desired outcomes in the embodied conjecture.
Last, it was hypothesized that students would engage in productive video-watching
habits, including pausing, rewinding, practicing problems, etc. It is certainly a possibility that
students did not feel they needed to pause, rewind, or engage with the videos beyond watching
them. In fact, students in the PFFC group admitted to fast forwarding and skipping portions of
videos in the focus group interview. The process of working through a video was modeled for
all students, and the content of the video encouraged students to work on a problem to assess
their understanding. Since video watching was an important consolidation phase for PFFC

PRODUCTIVE FAILURE IN THE FLIPPED MATHEMATICS CLASSROOM 120
students, perhaps additional measures need to be taken to ensure students have a productive
video-watching experience. This could include embedded questions students have to answer
throughout the videos before they proceed to each new topic or example.
Limitations and Directions for Future Research
The results of this study cannot be generalized due to sample representativeness and the
number of classes per condition. Only two classes were used in this study, one control group and
one experimental group. Future studies could include an examination of more sections of Math
103 taught with a productive failure learning intervention. In addition, the composition of each
class was very different, as described in the sample section. The control group had two students
with advanced mathematical training, whereas the experimental group had many first-year, first-
semester students with less experience as university students.
Also, individual pretest data, posttest data, and video watching data were aggregated at
the group level to address the efficacy of each group as a whole; however, aggregated data
cannot necessarily predict individual student’s learning (Cress, 2008; Song & Kapur, 2017). I
turned to individual students’ work sample data as appropriate to illustrate cases of knowledge
development to compensate for this. In addition, because the researcher taught both sections of
the class, there is the threat of researcher bias. However, every effort was made to ensure
consistent treatment of groups, such as scripted responses to questions in both groups and field
notes (see Appendices F and G).
This study raises additional questions and avenues for exploration in the areas of flipped
classroom and productive failure. Future research in flipped classroom design could involve a
more careful examination of the “individual space” and “group space” aspects of a flipped
classroom and how the amount of time spent in each could impact learning (Hamdan, McKnight,

PRODUCTIVE FAILURE IN THE FLIPPED MATHEMATICS CLASSROOM 121
McKnight, & Arfstrom, 2013). This sentiment was echoed in some students’ focus group
responses in both groups, as they suggested more class time could have afforded additional
opportunities for concept exploration and group problem-solving. Students in the PFFC group
transitioned from a group space at the end of a class session, to an individual space at home, then
back to a group space during the next class session. Students in the DIFC group only went from
the individual space at home to the group space in the classroom. The design and evaluation of
these spaces could form the basis for future study on the flipped classroom learning environment,
particularly what the ideal balance of learning spaces is in a hybrid course to facilitate deep
learning, and what the learning advantages are in each type of space.
Another avenue to explore in future work is the type of video content available to
students in each treatment condition. Numerous PFFC students in the focus group interview in
claimed to have skipped or fast-forwarded through some of the video content. Due to the fact
that students in the PFFC group had time in class to mobilize prior knowledge and generate
solutions to problems, questions remain about whether their video experience should look
different from that of students in the DIFC group. For example, should these students have less
introductory information or review in their videos? Should the videos include additional
problem-solving and solution generation opportunities for DIFC students? Will future
innovations in technology result in personalized learning opportunities for all students? These
questions, coupled with the fact that the optimal length for instructional videos should be around
six minutes for students’ maximum engagement (Guo, Kim, & Rubin, 2006), suggest that
instructors who teach flipped classrooms need to make important pedagogical decisions about
what should and should not be included in their video lessons.

PRODUCTIVE FAILURE IN THE FLIPPED MATHEMATICS CLASSROOM 122
Considering the diverse sample in this study, additional research is also warranted in the
area of how students embrace their learning in a flipped classroom. Generational differences
may exist in how students watch videos, approach their classwork, and work with one another in
both the in-class and out-of-class learning environments. In this study, the DIFC group had
many more third- and fourth-year students, whereas the PFFC group had many more first- and
second-year students. This might have had an impact on the results of the course assessments
and group work because the third- and fourth-year students may have had a different approach to
working through videos and completing tasks outside of class. The first-and second-year
students have also had more extensive experiences with blended learning, as many K-12 schools
have provided students with their own personal laptops for the past three or four years. A more
nuanced investigation of students’ work habits inside and outside of class may provide insight on
which generation of student would be more successful in a digital learning environment like a
flipped classroom.
While analyzing the video and qualitative data, the more time I spent analyzing Group
A’s work over the four weeks of the study, the more I became intrigued by how their group
evolved over their time spent solving invention tasks. They naturally started to follow this route
of assembling information, accessing prior knowledge, and generating many solution proposals.
Additional research on effective group problem-solving processes, particularly when the
problems are designed to generate failure, would be an interesting avenue to explore. Of
particular interest in this area is norm setting; would groups’ problem-solving processes be
positively impacted by additional time spent on norm setting and establishing roles within
groups? It is possible that supplementing the course with additional training for students on how
to work in groups could enhance the productive failure experience.

PRODUCTIVE FAILURE IN THE FLIPPED MATHEMATICS CLASSROOM 123
Last, designing the productive failure experience for non-algebra students deserves some
more attention. Many of the seminal studies on productive failure have taken place in secondary
schools on topics from the beginning algebra curriculum (Kapur, 2008; Kapur, 2009; Kapur,
2011; Song & Kapur, 211). These topics, such as standard deviation, polynomial operations, and
average speed, are rudimentary enough that any student can approach the topics, yet challenging
enough that without prior instruction on the topics, students would have to think critically to
solve problems on the topics. This study took place in an undergraduate liberal arts mathematics
classroom where the topics were not in the standard algebra curriculum. Based on students’
scores on invention tasks and posttest items in this study, some invention tasks proved more
challenging than others, and developing test items that challenged students but did not
overwhelm them, was also challenging. Kapur and Bielaczyc (2012) spelled out their design
recommendations for productive failure in great detail, which were employed in the design of
this study. It would be interesting to see if the design recommendations would change for
different mathematics courses and different levels of students.
Implications for Practice
The results of this study suggest that a flipped classroom consists of much more than
videos and group work. Instructors often naively view a flipped classroom as an inversion of
lecturing and applied practice, with lectures replaced by video tutorials. Instructors need to
carefully consider ways to design tasks that allow students to learn and build conceptual
understanding both inside and outside of in-person class sessions. Whether an instructor plans
on using productive failure during class or not, students need to understand the purpose of the
videos before they go off watching them. Designing an in-class learning environment that allows

PRODUCTIVE FAILURE IN THE FLIPPED MATHEMATICS CLASSROOM 124
for students to freely generate solutions, learn from their mistakes, and seek assistance from
peers and the instructor as needed are also crucial elements in designing a flipped classroom.
The design of in-person learning activities in a flipped classroom is also an essential part
of creating the flipped classroom learning environment. Song and Kapur (2017) found that the
role of the in-class problems changes depending on whether or not students have had
opportunities to access and mobilize prior knowledge before coming to class. In particular,
students in a flipped classroom who experience productive failure have the opportunity to
assemble their knowledge prior to solving in-class problems, and thus have a different level of
preparation coming into solving the problems. Similar to Song and Kapur (2017), this was not
the case for students in the DIFC in this study, where students were expected to apply what they
learned from the videos to the in-class problems without any additional recall of prior
knowledge. This difference in how the problems were approached suggests the need for
instructors to provide students in any type of flipped classroom with opportunities to activate
their prior knowledge before entering into in-class activities. Doing so also allows for the
instructor to provide assistance to each student at his or her zone of proximal development
(Bruner, 1986), which is imperative for learning.
As a teacher, running a design-based research study made me reflect on my entire
teaching practice and examine every aspect of the course from the bottom up. Designing and
teaching a flipped classroom can be viewed as testing teaching and learning theories in a messy,
complex environment with the goal of producing instructional strategies that can withstand the
challenges of ongoing practice (Shavelson, Phillips, Towne, & Feuer 2003). This study made me
analyze every question, every video, every consideration necessary for creating a problem-
solving environment conducive to students’ active participation, and how I would respond to

PRODUCTIVE FAILURE IN THE FLIPPED MATHEMATICS CLASSROOM 125
students in both groups. Prior to starting the study, I created a list of questions and responses
that I used in my classes to ensure equity and meaningful feedback. In addition, based on
students’ feedback, I made in-the-moment design changes in the course, such as a pre-typed
bulleted list of key ideas to begin each flipped class with. This also helped to ensure that both
groups were receiving the same review and coverage of important mathematical content.
Overall, these practices have taught me that it is possible to use research, theory, and experiences
to improve the effectiveness of a learning environment design (Joseph, 2004).
Last, the video data I obtained from this study taught me about productive processes and
strategies for having students work in groups. Group A in my PFFC group developed a very
successful working relationship over the four weeks of my study, as evidenced by their written
work samples and their ability to generate solutions to very difficult tasks. They were able to
successfully think out loud and help one another verify whether or not a solution proposal was
correct. They also made a deliberate effort to try and connect what they were working on back
to what they learned in previous mathematics classes. As I move forward designing learning
environments that include group collaboration of any kind, I will encourage students to use these
strategies starting at the beginning of the course.

PRODUCTIVE FAILURE IN THE FLIPPED MATHEMATICS CLASSROOM 126
References
Alibali, M.W., & Goldin-Meadow, S. (1993). Gesture-speech mismatch and mechanisms of
learning: What the hands reveal about a child’s state of mind. Cognitive Psychology,
25(4), 468-523.
Ambrose, R., Clement, L., Philipp, R., & Chauvot, J. (2004). Assessing prospective elementary
school teachers' beliefs about mathematics and mathematics learning: Rationale and
development of a constructed-response-format beliefs survey. School Science and
Mathematics, 104(2), 56-69. https://doi.org/10.1111/j.1949-8594.2004.tb17983.x
Andrews, T. M., Leonard, M. J., Colgrove, C. A., & Kalinowski, S. T. (2011). Active learning
not associated with student learning in a random sample of college biology courses. Cell Biology Education – Life Sciences Edition, 10, 394–405.
https://doi.org/10.1187/cbe.11-07-0061
Baepler, P., Walker, J. D., & Driessen, M. (2014). It's not about seat time: Blending, flipping,
and efficiency in active learning classrooms. Computers & Education, 78, 227-236.
https://doi.org/10.1016/j.compedu.2014.06.006
Bahr, D. L., & DeGarcia, L. A. (2008). Elementary mathematics is anything but elementary:
Content and methods from a developmental perspective. London: Cengage Learning.
Baroody, A. J., Feil, Y., & Johnson, A. R. (2007). An alternative reconceptualization of
procedural and conceptual knowledge. Journal for Research in Mathematics Education,
38, 115-131.
Barron, B. (2003). When smart groups fail. The Journal of the Learning Sciences, 12(3), 307-
359. Bergmann, J. & Sams, A. (2012). Flip your classroom: Reach every student in every class every
day. Washington, D.C.: International Society for Technology in Education.

PRODUCTIVE FAILURE IN THE FLIPPED MATHEMATICS CLASSROOM 127
Boaler, J. (2002). Experiencing school mathematics: Traditional and reform approaches to
teaching and their impact on student learning. Mahwah, NJ: Lawrence Erlbaum.
Booth, J. L. (2011). Why can't students get the concept of math? Perspectives on Language
and Literacy, 37(2), 31.
Bourdeau, J., & Bates, A. (1996). Instructional design for distance learning. Journal of Science
Education and Technology, 5(4), 267-283.
Bowers, J., & Zazkis, D. (2012). Do students flip over the flipped classroom model for learning
college calculus? Proceedings of the 34th Annual Meeting of the North American Chapter of the International Group for the Psychology of Mathematics Education. Kalamazoo, MI: Western Michigan University.
Bransford, J. D., Brown, A. L., & Cocking, R. R. (Eds.) (1999). How people learn: Brain, mind,
experience, and school. Washington, DC: National Academy Press.
Brown, A. L. (1992). Design experiments: Theoretical and methodological challenges in creating
complex interventions in classroom settings. Journal of the Learning Sciences, 2(2), 141–
178. http://doi.org/10.1207/s15327809jls0202_2
Bruner, E. M. (1986). Experience and its expressions. The Anthropology of Experience, 3, 32.
Chen, B. H., & Chiou, H. H. (2014). Learning style, sense of community and learning
effectiveness in hybrid learning environment. Interactive Learning Environments, 22(4),
485-496. https://doi.org/10.1080/10494820.2012.680971
Chi, M. T. (1997). Quantifying qualitative analyses of verbal data: A practical guide. The
Journal of the Learning Sciences, 6(3), 271-315. https://doi.org/10.1207/s15327809jls0603_1

PRODUCTIVE FAILURE IN THE FLIPPED MATHEMATICS CLASSROOM 128
Chi, M. T. H., Glaser, R., & Farr, M. J. (1988). The nature of expertise. Hillsdale, NJ: Erlbaum.
Clifford, M. M. (1984). Thoughts on a theory of constructive failure. Educational Psychologist,
19(2), 108–120. https://doi.org/10.1080/00461528409529286
Cobb, P. (2000). Conducting teaching experiments in collaboration with teachers. In A. E. Kelly
& R. A. Lesh (Eds.), Handbook of research design in mathematics and science education
(pp. 307-333). Mahwah, NJ: Lawrence Erlbaum Associates.
Cohen, E. G., Lotan, R. A., Abram, P. L., Scarloss, B. A., & Schultz, S. E. (2002). Can groups
learn? Teachers College Record, 104(6), 1045-1068.
https://doi.org/10.1111/1467-9620.00196
Collins, A., Joseph, D., & Bielaczyc, K. (2004). Design research: Theoretical and
methodological issues. The Journal of the Learning Sciences, 13(1), 15-42.
https://doi.org/10.1207/s15327809jls1301_2
Collopy, R., & Arnold, J. M. (2009). To blend or not to blend: Online and blended learning
environments in undergraduate teacher education. Issues in Teacher Education, 18(2),
85-101.
Cress, U. (2008). The need for considering multilevel analysis in CSCL research—an appeal for
the use of more advanced statistical methods. International Journal of Computer-
Supported Collaborative Learning, 3(1), 69-84.
https://doi.org/10.1007/s11412-007-9032-2
Creswell, J. W. (2014). Research design: Qualitative, quantitative and mixed methods
approaches (4th ed.). London: Sage Publications Ltd.
Creswell, J. W., & Plano Clark, V. L. (2007). Designing and conducting mixed methods
research. Thousand Oaks, CA: Sage.

PRODUCTIVE FAILURE IN THE FLIPPED MATHEMATICS CLASSROOM 129
Day, J. A., & Foley, J. D. (2006). Evaluating a web lecture intervention in a human-computer
interaction course. IEEE Transactions on Education, 49(4), 420-431.
https://doi.org/10.1109/te.2006.879792
Denzin, N. K., & Lincoln, Y. S. (2011). The SAGE handbook of qualitative research. Thousand
Oaks, CA: Sage.
Design-Based Research Collective. (2003). Design-based research: An emerging paradigm for
educational inquiry. Educational Researcher, 32(1), 5–8.
http://doi.org/10.3102/0013189X032001005
diSessa, A.A., Gillespie, N. M., & Esterly, J. B. (2004). Coherence versus fragmentation in the
development of the concept of force. Cognitive Science, 28(6), 843-900.
https://doi.org/10.1016/j.cogsci.2004.05.003
diSessa, A. A., Hammer, D., Sherin, B., & Kolpakowski, T. (1991). Inventing graphing: Meta-
representational expertise in children. Journal of Mathematical Behavior, 10(2), 117–
160.
diSessa, A. A., & Sherin, B. L. (2000). Meta-representation: An introduction. Journal of
Mathematical Behavior, 19, 385–398.
Duderstadt, J. J. (2001). The future of the university in the digital age. Proceedings of the
American Philosophical Society, 145(1), 54-72.
Eichler, J. F., & Peeples, J. (2016). Flipped classroom modules for large enrollment general
chemistry courses: a low barrier approach to increase active learning and improve student grades. Chemistry Education Research and Practice, 17(1), 197-208. https://doi.org/10.1039/c5rp00159e

PRODUCTIVE FAILURE IN THE FLIPPED MATHEMATICS CLASSROOM 130
Frederickson, N., Reed, P., & Clifford, V. (2005). Evaluating web-supported learning versus
lecture-based teaching: Quantitative and qualitative perspectives. Higher Education,
50(4), 645-664. https://doi.org/10.1007/s10734-004-6370-0
Garrison, D. R., & Kanuka, H. (2004). Blended learning: Uncovering its transformative potential
in higher education. The Internet and Higher Education, 7(2), 95-105.
https://doi.org/10.1016/j.iheduc.2004.02.001
Goldsmith, L. T., & Mark, J. (1999). What is a standards-based mathematics curriculum?
Educational Leadership, 57(3), 40-44.
Granberg, C. (2016). Discovering and addressing errors during mathematics problem-solving—
A productive struggle? The Journal of Mathematical Behavior, 42, 33-48.
https://doi.org/10.1016/j.jmathb.2016.02.002
Gross, D., Pietri, E. S., Anderson, G., Moyano-Camihort, K., & Graham, M. J. (2015). Increased
preclass preparation underlies student outcome improvement in the flipped classroom.
CBE-Life Sciences Education, 14(4), 1-8. https://doi.org/10.1187/cbe.15-02-0040
Guo, P. J., Kim, J., & Rubin, R. (2014). How video production affects student engagement: An
empirical study of mooc videos. In Proceedings of the first ACM conference on Learning
@ Scale Conference (pp. 41-50). ACM. https://doi.org/10.1145/2556325.2566239
Hamdan, N., McKnight, P., McKnight, K., & Arfstrom, K. M. (2013). A review of flipped
learning. Flipped Learning Network. Retrieved from https://flippedlearning.org/wp-
content/uploads/2016/07/LitReview_FlippedLearning.pdf
Helyer, R., & Corkill, H. (2015). Flipping the academy: Is learning from outside the
classroom turning the university inside out? Asia-Pacific Journal of Cooperative
Education, 16(2), 121-135.

PRODUCTIVE FAILURE IN THE FLIPPED MATHEMATICS CLASSROOM 131
Hiebert, J., & Lefevre, P. (1986). Conceptual and procedural knowledge in mathematics: An
introductory analysis. In J. Hiebert (Ed.), Conceptual and procedural knowledge: The
case of mathematics (pp. 1-27). Hillsdale, NJ: Lawrence Erlbaum Associates.
Jonassen, D. H. (2006). On the role of concepts in learning and instructional design. Educational Technology Research and Development, 54(2), 177-196.
Joseph, D. (2004). The practice of design-based research: Uncovering the interplay between
design, research, and the real-world context. Educational Psychologist, 39(4), 235-242.
https://doi.org/10.1207/s15326985ep3904_5
Kapur, M. (2008). Productive failure. Cognition and Instruction, 26(3), 379-424.
https://doi.org/10.1080/07370000802212669
Kapur, M. (2010). Productive failure in mathematical problem solving. Instructional Science,
38(6), 523-550. https://doi.org/10.1007/s11251-009-9093-x
Kapur, M. (2011). A further study of productive failure in mathematical problem solving:
Unpacking the design components. Instructional Science, 39(4), 561-579.
Kapur, M. (2012). Productive failure in learning the concept of variance. Instructional Science,
40(4), 651-672. https://doi.org/10.1007/s11251-012-9209-6
Kapur, M. (2014). Productive failure in learning math. Cognitive Science, 38(5), 1008-1022.
https://doi.org/10.1111/cogs.12107
Kapur, M. (2015). Learning from productive failure. Learning: Research and Practice, 1(1), 51-
65. https://doi.org/10.1080/23735082.2015.1002195
Kapur, M. (2016). Examining productive failure, productive success, unproductive failure, and
unproductive success in learning. Educational Psychologist, 51(2), 289-299.
https://doi.org/10.1080/00461520.2016.1155457

PRODUCTIVE FAILURE IN THE FLIPPED MATHEMATICS CLASSROOM 132
Kapur, M., & Bielaczyc, K. (2012). Designing for productive failure. Journal of the Learning
Sciences, 21(1), 45-83. https://doi.org/10.1080/10508406.2011.591717
Kirschner, P. A., Sweller, J., & Clark, R. E. (2006). Why minimal guidance during instruction
does not work: An analysis of the failure of constructivist, discovery, problem-based,
experiential, and inquiry-based teaching. Educational Psychologist, 41(2), 75-86.
https://doi.org/10.1207/s15326985ep4102_1
Krajcik, J., Blumenfeld, P., Marx, R., & Soloway, E. (2000). Instructional, curricular, and
technological supports for inquiry in science classrooms. In J. Minstrell & E. H. Van Zee
(Eds.), Inquiring into inquiry learning and teaching in science (pp. 283-315).
Washington, DC: American Association for the Advancement of Science.
Krueger, R. A., & Casey, M. A. (2002). Designing and conducting focus group
interviews. Social Analysis, Selected Tools and Techniques, 4(23), 4-24.
Lage, M. J., Platt, G. J., & Treglia, M. (2000). Inverting the classroom: A gateway to creating an
inclusive learning environment. The Journal of Economic Education, 31(1), 30-43.
Maciejewski, W. (2016). Flipping the calculus classroom: an evaluative study. Teaching
Mathematics and its Applications: An International Journal of the IMA, 35(4), 187-
201. https://doi.org/10.1093/teamat/hrx007
McGee, P., & Reis, A. (2012). Blended course design: A synthesis of best practices. Journal of
Asynchronous Learning Networks, 16(4), 7-22.
Means, B., Toyama, Y., Murphy, R., Bakia, M., & Jones, K. (2009). Evaluation of evidence-
based practices in online learning: A meta-analysis and review of online learning
studies. Washington, DC: U.S. Department of Education.

PRODUCTIVE FAILURE IN THE FLIPPED MATHEMATICS CLASSROOM 133
Moraros, J., Islam, A., Yu, S., Banow, R., & Schindelka, B. (2015). Flipping for success:
evaluating the effectiveness of a novel teaching approach in a graduate level setting.
BMC Medical Education, 15(1), 27-38. https://doi.org/10.1186/s12909-015-0317-2
Moravec, M., Williams, A., Aguilar-Roca, N., & O'Dowd, D. K. (2010). Learn before lecture: a
strategy that improves learning outcomes in a large introductory biology class. CBE-Life
Sciences Education, 9(4), 473-481. https://doi.org/10.1187/cbe.10-04-0063
Mortera-Gutiérrez, F. (2006). Faculty best practices using blended learning in e-learning and
face-to-face instruction. International Journal on ELearning, 5(3), 313.
Muir, T., & Geiger, V. (2015). The affordances of using a flipped classroom approach in the
teaching of mathematics: A case study of a grade 10 mathematics class. Mathematics
Education Research Journal, 28(1), 149-171.
https://doi.org/10.1007/s13394-015-0165-8
Naccarato, E., & Karakok, G. (2015). Expectations and implementations of the flipped classroom
model in undergraduate mathematics courses. International Journal of Mathematical
Education in Science and Technology, 46(7), 968-978.
https://doi.org/10.1080/0020739x.2015.1071440
National Council of Teachers of Mathematics (2000). Principles and standards for school
mathematics. Reston, VA: NCTM.
National Research Council. (2001). Adding it up: Helping children learn mathematics.
Washington, DC: National Academy Press.
O’Flaherty, J., & Phillips, C. (2015). The use of flipped classrooms in higher education:
A scoping review. The Internet and Higher Education, 25, 85-95.
https://doi.org/10.1016/j.iheduc.2015.02.002
Prince, M. (2004). Does active learning work? A review of the research. Journal of Engineering
Education, 93(3), 223-231. https://doi.org/10.1002/j.2168-9830.2004.tb00809.x

PRODUCTIVE FAILURE IN THE FLIPPED MATHEMATICS CLASSROOM 134
Quinata, C., Shin, N., Norris, C., & Soloway, E. (2005). Learner-centered design: reflections on
the past and directions for the future. In R. Sawyer (Ed.), The Cambridge handbook of
the learning sciences (pp. 119-134). Cambridge University Press.
Rittle-Johnson, B., & Alibali, M. W. (1999). Conceptual and procedural knowledge of
mathematics: Does one lead to the other? Journal of Educational Psychology, 91(1), 175.
https://doi.org/10.1037//0022-0663.91.1.175
Rittle-Johnson, B., Siegler, R. S., & Alibali, M. W. (2001). Developing conceptual
understanding and procedural skill in mathematics: An iterative process. Journal of
Educational Psychology, 93(2), 346. https://doi.org/10.1037//0022-0663.93.2.346
Roehl, A., Reddy, S. L., & Shannon, G. J. (2013). The flipped classroom: An opportunity to
engage millennial students through active learning strategies. Journal of Family &
Consumer Sciences, 105(2), 44-49. https://doi.org/10.14307/jfcs105.2.12
Rutgers University (2017). Facts and figures. Retrieved from
http://newbrunswick.rutgers.edu/about/facts-figures
Saldaña, J. (2009). The coding manual for qualitative researchers. Thousand Oaks, CA: Sage
Publications.
Sandoval, W. A. (2014). Conjecture mapping: An approach to systematic educational design
research. Journal of the Learning Sciences, 23(1), 18–36.
http://doi.org/10.1080/10508406.2013.778204

PRODUCTIVE FAILURE IN THE FLIPPED MATHEMATICS CLASSROOM 135
Scardamalia, M., & Bereiter, C. (2003). Knowledge building. In J. W. Guthrie (Ed.),
Encyclopedia of education. New York, NY: Macmillan Reference.
Schmidt, R. A., & Bjork, R. A. (1992). New conceptualizations of practice: Common principles
in three paradigms suggest new concepts for training. Psychological Science, 3(4), 207-
217. https://doi.org/10.1111/j.1467-9280.1992.tb00029.x
Schneider, M., & Stern, E. (2009). The inverse relation of addition and subtraction: A knowledge
integration perspective. Mathematical Thinking and Learning, 11(1-2), 92-101.
https://doi.org/10.1080/10986060802584012
Schwartz, D. L., & Bransford, J. D. (1998). A time for telling. Cognition and Instruction, 16(4),
475-522. https://doi.org/10.1207/s1532690xci1604_4
Schwartz, D. L., & Martin, T. (2004). Inventing to prepare for future learning: The hidden
efficiency of encouraging original student production in statistics instruction. Cognition
and Instruction, 22(2), 129-184. https://doi.org/10.1207/s1532690xci2202_1
Shavelson, R. J., D. C. Phillips, L. T., Towne, L., & Feuer, M. J. (2003). On the science of
education design studies. Educational Researcher, 32(1), 25–
28. https://doi.org/10.3102/0013189x032001025
Siegler, R. S. (1995). How does change occur: A microgenetic study of number
conservation. Cognitive psychology, 28(3), 225-273.
Song, Y., & Kapur, M. (2017). How to flip the classroom–“Productive failure or traditional
flipped classroom” pedagogical design? Journal of Educational Technology &
Society, 20(1), 292-305.
Star, J. R. (2005). Reconceptualizing procedural knowledge. Journal for Research in
Mathematics Education, 36(5), 404-411.

PRODUCTIVE FAILURE IN THE FLIPPED MATHEMATICS CLASSROOM 136
Stone, B. B. (2012). Proceedings from 28th Annual Conference on Distance Teaching &
Learning: Flip your classroom to increase active learning and student engagement.
Madison, WI: Board of Regents
Strayer, J. F. (2012). How learning in an inverted classroom influences cooperation, innovation
and task orientation. Learning Environments Research, 15(2), 171-193.
Tague, J., & Czocher, J. (2016). A theoretical approach to ensuring instructional and
curricular coherence in the flipped classroom model of a differential equations
course. International Journal of Research in Undergraduate Mathematics
Education, 2(2), 223-245. https://doi.org/10.1007/s40753-016-0028-z
Tannenbaum, P. (2013). Excursions in modern mathematics. Upper Saddle River, NJ: Pearson.
Toto, R., & Nguyen, H. (2009). Flipping the work design in an industrial engineering course.
Paper presented at the 39th ASEE/IEEE Frontiers in Education Conference, San Antonio,
TX. https://doi.org/10.1109/fie.2009.5350529
Vamvakoussi, X., & Vosniadou, S. (2004). Understanding the structure of the set of rational
numbers: A conceptual change approach. Learning and Instruction, 14(5), 453-467.
https://doi.org/10.1016/j.learninstruc.2004.06.013
VanLehn, K., Siler, S., Murray, C., Yamauchi, T., & Baggett, W. B. (2003). Why do only some
events cause learning during human tutoring? Cognition and Instruction, 21(3), 209-249.
https://doi.org/10.1207/s1532690xci2103_01
Wasserman, N. H., Quint, C., Norris, S. A., & Carr, T. (2017). Exploring flipped classroom
instruction in calculus III. International Journal of Science and Mathematics
Education, 15(3), 545-568. https://doi.org/10.1007/s10763-015-9704-8
Weingart, M., & Seneres, A. (2013). Topics in mathematics for liberal arts, part I.
New Brunswick, NJ: Open Source Textbook.

PRODUCTIVE FAILURE IN THE FLIPPED MATHEMATICS CLASSROOM 137
Wenger, E., White, N., & Smith, J. D. (2009). Digital habitats: Stewarding technology for
communities. Portland, OR: CPSquare.
Wiedmann, M., Leach, R. C., Rummel, N., &Wiley, J. (2012). Does group composition affect
learning by invention? Instructional Science, 40, 711–730.
https://doi.org/10.1007/s11251-012-9204-y
Zhang, M., Lundeberg, M., McConnell, T. J., Koehler, M. J., & Eberhardt, J. (2010). Using questioning to facilitate discussion of science teaching problems in teacher professional development. Interdisciplinary Journal of Problem-Based Learning, 4(1), 57–82. http://doi.org/10.7771/1541-5015.1097

PRODUCTIVE FAILURE IN THE FLIPPED MATHEMATICS CLASSROOM 138
Appendix A
Invention Tasks
Invention Task #1 (adapted from Tannenbaum, 2013)
A new country has recently been founded. The country is split into six states, call them A, B, C, D, E, and F. The population of state A is 1,646,000 people, the population of state B is 6,936,000 people, the population of state C is 154,000 people, the population of state D is 2,091,000 people, the population of state E is 685,000 people, and the population of state F is 988,000 people. There are 250 seats available on a legislative body to govern the new country. How many seats should be assigned to each state so that each state would receive a fair representation? Show your work and justify why you think your method is correct.
Invention Task #2
Ann and Bob share the rights to use a certain store location in the mall, but they have separate businesses, and only one can use the space at a time. They agree that each year, one should get the space from January 1 until a certain date, and the other should get the space from that date through the end of December.
Ann estimates that she can make $10,000 per month from January through July, and $14,000 per month from August through December. Bob estimates that he can make $6,000 per month from January through June, and $12,000 per month from July through December.
Describe a way in which Ann and Bob could each receive a fair share of the year, if it is left up to Ann to make the first move.
Invention Task #3
Suppose Andrea, Beatrice, Cleo and David are dividing a plot of land worth $1,000. The land comes in four sections, call them piece 1, piece 2, piece 3, and piece 4. Andrea values piece 1 at $150, piece 2 at $300, piece 3 at $200, and piece 4 at $350. Beatrice values piece 1 at $200, piece 2 at $350, piece 3 at $100, and piece 4 at $350. Cleo values piece 1 at $200, piece 2 at $450, piece 3 at $200, and piece 4 at $150. David values piece 1 at $250, piece 2 at $250, piece 3 at $250, and piece 4 at $250. Describe a way for the players to fairly divide the land.
Invention Task #4
Ashley, Bill, and Cliff have been roommates through college and now are getting ready to graduate and go separate ways. They have jointly owned a table, dresser, chair, and couch among the 3 of them. Ashley values the table at $150, the dresser at $150, the chair at $175, and the couch at $275. Bill values the table at $250, the dresser at $200, the chair at $150, and the couch at $300. Cliff values the table at $175, the dresser at $125, the chair at $125, and the couch at $250. Describe a way for all three people to walk away with a “fair share.” Justify your answer using dollar amounts and explanations.

PRODUCTIVE FAILURE IN THE FLIPPED MATHEMATICS CLASSROOM 139
Appendix B
In-Class Problems I. Apportionment

PRODUCTIVE FAILURE IN THE FLIPPED MATHEMATICS CLASSROOM 140

PRODUCTIVE FAILURE IN THE FLIPPED MATHEMATICS CLASSROOM 141

PRODUCTIVE FAILURE IN THE FLIPPED MATHEMATICS CLASSROOM 142

PRODUCTIVE FAILURE IN THE FLIPPED MATHEMATICS CLASSROOM 143
II. Fair Division

PRODUCTIVE FAILURE IN THE FLIPPED MATHEMATICS CLASSROOM 144

PRODUCTIVE FAILURE IN THE FLIPPED MATHEMATICS CLASSROOM 145

PRODUCTIVE FAILURE IN THE FLIPPED MATHEMATICS CLASSROOM 146

PRODUCTIVE FAILURE IN THE FLIPPED MATHEMATICS CLASSROOM 147

PRODUCTIVE FAILURE IN THE FLIPPED MATHEMATICS CLASSROOM 148

PRODUCTIVE FAILURE IN THE FLIPPED MATHEMATICS CLASSROOM 149
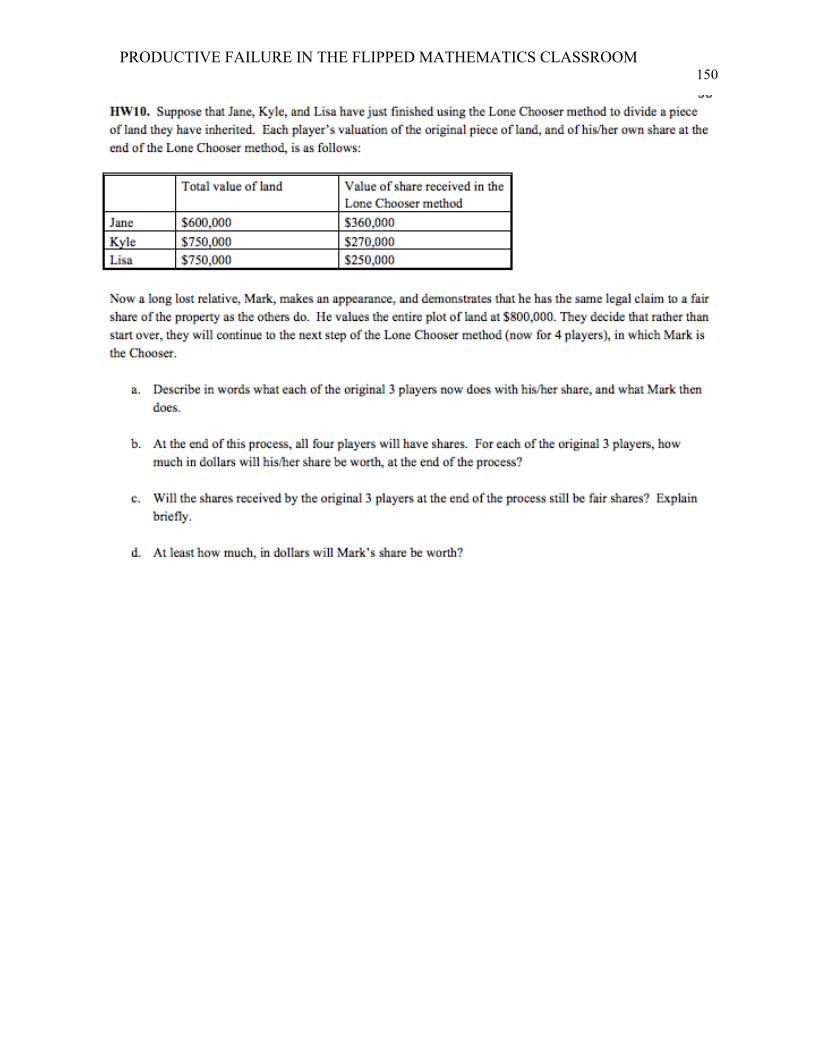
PRODUCTIVE FAILURE IN THE FLIPPED MATHEMATICS CLASSROOM 150

PRODUCTIVE FAILURE IN THE FLIPPED MATHEMATICS CLASSROOM 151
III. Fair Distribution

PRODUCTIVE FAILURE IN THE FLIPPED MATHEMATICS CLASSROOM 152

PRODUCTIVE FAILURE IN THE FLIPPED MATHEMATICS CLASSROOM 153

PRODUCTIVE FAILURE IN THE FLIPPED MATHEMATICS CLASSROOM 154

PRODUCTIVE FAILURE IN THE FLIPPED MATHEMATICS CLASSROOM 155
Appendix C
Pretest 1. A large university has four bus routes, called W, X, Y, and Z. The university has 100 buses, and must apportion these among the routes in proportion to the daily number of passengers on each route. The total number of bus passengers each day is 50,000. 1a. Which are the seats, which are the states, and what plays the role of population in this apportionment problem? seats:_________________states:___________________population: _____________________ 1b. Find the standard divisor for this apportionment problem, and explain the meaning of the standard divisor in this context. 1c. Suppose we try to use 480 as a modified divisor in Jefferson's method. Find all the modified quotas:
bus route Passengers per day modified quota Jefferson apportionment of
seats W 20,800 X 13,400 Y 9,100 Z 6,700 Total Does this modified divisor work for Jefferson's method, and if so, what is the apportionment of buses to routes (indicate the apportionment in the table)? If not, should the modified divisor we try next be greater than 480 or less than 480? Explain.

PRODUCTIVE FAILURE IN THE FLIPPED MATHEMATICS CLASSROOM 156
1d. If we were using the Huntington-Hill method to apportion the buses, and we tried using the modified divisor 511, how many buses would be given to route X based on this modified divisor?
[You don’t have to work out the full apportionment, just the number of buses which would be apportioned to route X based on the modified divisor 511.]
bus route
Passengers per day
Modified quota Huntington-Hill rounding cutoff
Huntington-Hill apportionment
X 13,400
Show enough work to demonstrate that you understand how to apply the method.
2. Consider a small country with a population of 16,500 people and three states, D, E, and F.
State Population Hamilton
Apportionment
D 814
E 7,403
F 8,283
Total 16,500
There are 150 seats in the legislature that must be apportioned among the three states by their population.
2a. Use Hamilton’s method to apportion the 150 seats to the three states. Use as many of the blank columns as you need to show your work.

PRODUCTIVE FAILURE IN THE FLIPPED MATHEMATICS CLASSROOM 157
2b. Suppose an additional seat is added to the legislature. Use Hamilton’s method to apportion the 151 total seats to the three states.
State Population Hamilton
Apportionment
D 814
E 7,403
F 8,283
Total 16,500
2c. What flaws, if any, do the results of 2a and 2b indicate about Hamilton’s method of apportionment? Please explain your reasoning.
3. Jenna, Kendra, and Leanne use the Lone Chooser method to divide the use of a vacation timeshare over the course of a year. Leanne is the divider, Kendra is the first chooser, and Jenna is the lone chooser. Each has a different preference of when the timeshare is useful for vacationing. Their individual preferences are as follows:
Jan Feb Mar Apr May Jun Jul Aug Sep Oct Nov Dec Total Jenna 1 1 1 1 1 1 1 1 1 1 1 1 12 Kendra 1 1 1 1 1 1 0 0 0 0 0 0 6 Leanne 1 1 1 1 1 1 2 2 2 2 2 2 18 Division: 3a. Where does Leanne make her first division? 3b. Describe Kendra’s share (i.e. which months does she receive) and Leanne’s share (which months does she receive) at the end of the division stage.
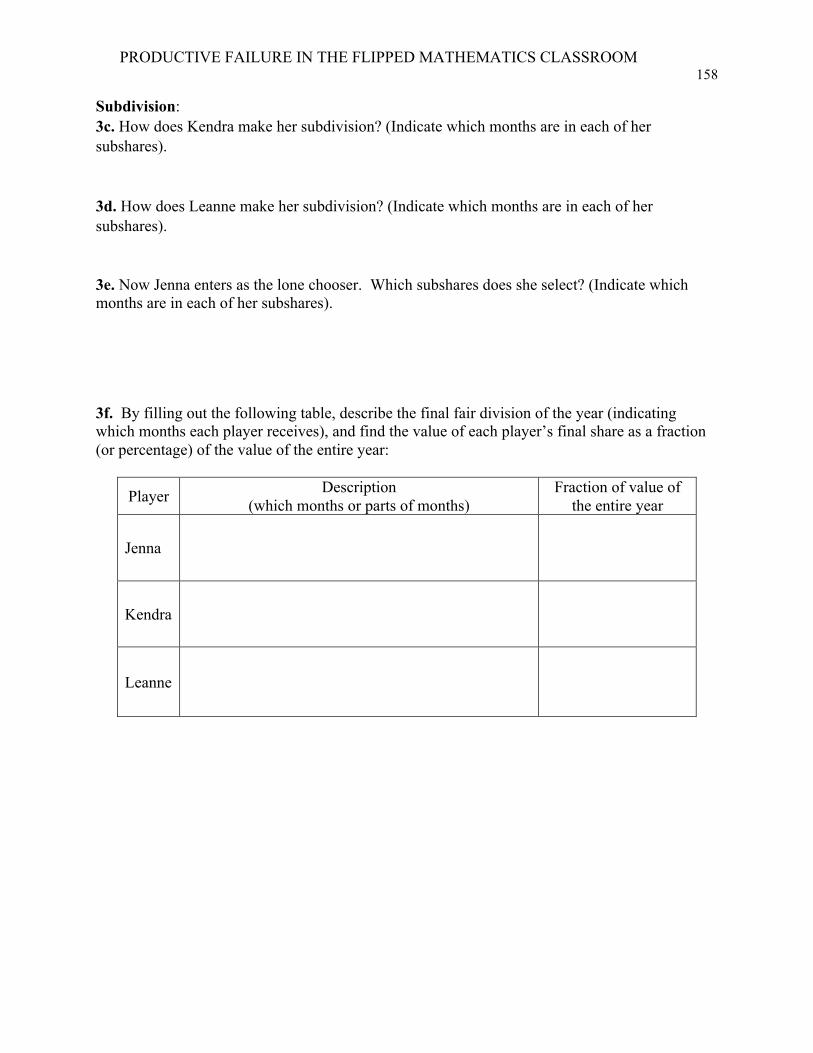
PRODUCTIVE FAILURE IN THE FLIPPED MATHEMATICS CLASSROOM 158
Subdivision: 3c. How does Kendra make her subdivision? (Indicate which months are in each of her subshares). 3d. How does Leanne make her subdivision? (Indicate which months are in each of her subshares). 3e. Now Jenna enters as the lone chooser. Which subshares does she select? (Indicate which months are in each of her subshares).
3f. By filling out the following table, describe the final fair division of the year (indicating which months each player receives), and find the value of each player’s final share as a fraction (or percentage) of the value of the entire year:
Player Description (which months or parts of months)
Fraction of value of the entire year
Jenna
Kendra
Leanne

PRODUCTIVE FAILURE IN THE FLIPPED MATHEMATICS CLASSROOM 159
4. Alex, Blair, and Chris have equal claims to a store location, and are using the Lone Divider method to find a fair division of access to the location over the calendar year. We assume as usual that January 1 has to be one of the start/end dates when dividing the year into shares.
• Alex values each of the months April through December twice as much as each of the months January through March.
• Blair values each of July and August four times as much as each of the other months of the year.
• Chris values each of the months from January through June 1.5 times as much as each of the months from July through December.
Jan Feb Mar Apr May Jun Jul Aug Sep Oct Nov Dec Total Alex Blair Chris
4a. Suppose that Blair is the Divider. What are the shares which Blair produces, described in terms of which months (or parts of months) are contained in each share?
4b. Does a standoff occur here? Whether there is a standoff or not, find a fair division of the year, i.e. indicate which months (or parts of months) each player receives in the end.

PRODUCTIVE FAILURE IN THE FLIPPED MATHEMATICS CLASSROOM 160
5. As part of a last will, a grandfather leaves behind a house, a car, and a wedding ban to his three grandchildren: Sara, Simone, and Cheryl. They use the Method of Sealed Bids to distribute the assets, and write out their bids as follows:
house car wedding ban
Sara
$150,000 $6,000 $3,000
Simone
$170,000 $8,000 $5,000
Cheryl
$125,000 $10,000 $3,000
5a. Find each player’s minimum fair share amount.
Total value of goods
Min. fair share amount
Sara Simone Cheryl
5b. Describe the first settlement (for each player, indicate the items received and amount of cash initially paid or received as of this first stage).
Items received
$ initially paid by player $ initially received by
player Sara Simone
Cheryl
5c. Describe the final settlement (for each player, indicate the items received and net amount of cash paid or received as of the end of the process).
Items received
Net $ paid by player Net $ received by player
Sara Simone Cheryl

PRODUCTIVE FAILURE IN THE FLIPPED MATHEMATICS CLASSROOM 161
6. Jason, Keith, and Clark have are dividing a set of 15 toys – 3 fidget spinners (F), 6 pogs (P), and 6 containers of gak (G) using the Method of Markers.
• Jason loves fidget spinners but hates pogs and gak. • Keith loves fidget spinners and pogs equally well but hates gak. • Clark loves pogs and gak equally well but hates fidget spinners.
The toys are lined up in an array as follows:
G G G P P P F F F P P P G G G
6a. Place markers for each person above based on their value systems. 6b. Describe the allocation of toys to each player and describe what toys are left over. 6c. Suppose that the players agree that each one can pick an extra toy from the leftovers. Suppose Jason picks first, Clark picks second, and Keith picks third. Describe which leftover toys each one would pick.

PRODUCTIVE FAILURE IN THE FLIPPED MATHEMATICS CLASSROOM 162
Appendix D
Posttest 1. A large university has four bus routes, called W, X, Y, and Z. The university has 100 buses, and must apportion these among the routes in proportion to the daily number of passengers on each route. The total number of bus passengers each day is 50,000. 1a. Which are the seats, which are the states, and what plays the role of population in this apportionment problem? seats:_________________states:___________________population: _____________________ 1b. Find the standard divisor for this apportionment problem, and explain the meaning of the standard divisor in this context. 1c. Suppose we try to use 480 as a modified divisor in Jefferson's method. Find all the modified quotas:
bus route Passengers per day modified quota Jefferson apportionment of
seats W 20,800 X 13,400 Y 9,100 Z 6,700 Total Does this modified divisor work for Jefferson's method, and if so, what is the apportionment of buses to routes (indicate the apportionment in the table)? If not, should the modified divisor we try next be greater than 480 or less than 480? Explain.

PRODUCTIVE FAILURE IN THE FLIPPED MATHEMATICS CLASSROOM 163
1d. If we were using the Huntington-Hill method to apportion the buses, and we tried using the modified divisor 511, how many buses would be given to route X based on this modified divisor?
[You don’t have to work out the full apportionment, just the number of buses which would be apportioned to route X based on the modified divisor 511.]
bus route
Passengers per day
Modified quota Huntington-Hill rounding cutoff
Huntington-Hill apportionment
X 13,400
Show enough work to demonstrate that you understand how to apply the method.
2. Consider a small country with a population of 16,500 people and three states, D, E, and F.
State Population Hamilton
Apportionment
D 814
E 7,403
F 8,283
Total 16,500
There are 150 seats in the legislature that must be apportioned among the three states by their population.
2a. Use Hamilton’s method to apportion the 150 seats to the three states. Use as many of the blank columns as you need to show your work.

PRODUCTIVE FAILURE IN THE FLIPPED MATHEMATICS CLASSROOM 164
2b. Suppose an additional seat is added to the legislature. Use Hamilton’s method to apportion the 151 total seats to the three states.
State Population Hamilton
Apportionment
D 814
E 7,403
F 8,283
Total 16,500
2c. What flaws, if any, do the results of 2a and 2b indicate about Hamilton’s method of apportionment? Please explain your reasoning.
3. Jenna, Kendra, and Leanne use the Lone Chooser method to divide the use of a vacation timeshare over the course of a year. Leanne is the divider, Kendra is the first chooser, and Jenna is the lone chooser. Each has a different preference of when the timeshare is useful for vacationing. Their individual preferences are as follows:
Jan Feb Mar Apr May Jun Jul Aug Sep Oct Nov Dec Total Jenna 1 1 1 1 1 1 1 1 1 1 1 1 12 Kendra 1 1 1 1 1 1 0 0 0 0 0 0 6 Leanne 1 1 1 1 1 1 2 2 2 2 2 2 18 Division: 3a. Where does Leanne make her first division? 3b. Describe Kendra’s share (i.e. which months does she receive) and Leanne’s share (which months does she receive) at the end of the division stage.

PRODUCTIVE FAILURE IN THE FLIPPED MATHEMATICS CLASSROOM 165
Subdivision: 3c. How does Kendra make her subdivision? (Indicate which months are in each of her subshares). 3d. How does Leanne make her subdivision? (Indicate which months are in each of her subshares). 3e. Now Jenna enters as the lone chooser. Which subshares does she select? (Indicate which months are in each of her subshares).
3f. By filling out the following table, describe the final fair division of the year (indicating which months each player receives), and find the value of each player’s final share as a fraction (or percentage) of the value of the entire year:
Player Description (which months or parts of months)
Fraction of value of the entire year
Jenna
Kendra
Leanne

PRODUCTIVE FAILURE IN THE FLIPPED MATHEMATICS CLASSROOM 166
4. Alex, Blair, and Chris have equal claims to a store location, and are using the Lone Divider method to find a fair division of access to the location over the calendar year. We assume as usual that January 1 has to be one of the start/end dates when dividing the year into shares.
• Alex values each of the months April through December twice as much as each of the months January through March.
• Blair values each of July and August four times as much as each of the other months of the year.
• Chris values each of the months from January through June 1.5 times as much as each of the months from July through December.
Jan Feb Mar Apr May Jun Jul Aug Sep Oct Nov Dec Total Alex Blair Chris
4a. Suppose that Blair is the Divider. What are the shares which Blair produces, described in terms of which months (or parts of months) are contained in each share?
4b. Does a standoff occur here? Whether there is a standoff or not, find a fair division of the year, i.e. indicate which months (or parts of months) each player receives in the end.

PRODUCTIVE FAILURE IN THE FLIPPED MATHEMATICS CLASSROOM 167
5. As part of a last will, a grandfather leaves behind a house, a car, and a wedding ban to his three grandchildren: Sara, Simone, and Cheryl. They use the Method of Sealed Bids to distribute the assets, and write out their bids as follows:
house car wedding ban
Sara
$150,000 $6,000 $3,000
Simone
$170,000 $8,000 $5,000
Cheryl
$125,000 $10,000 $3,000
5a. Find each player’s minimum fair share amount.
Total value of goods
Min. fair share amount
Sara Simone Cheryl
5b. Describe the first settlement (for each player, indicate the items received and amount of cash initially paid or received as of this first stage).
Items received
$ initially paid by player $ initially received by
player Sara Simone
Cheryl
5c. Describe the final settlement (for each player, indicate the items received and net amount of cash paid or received as of the end of the process).
Items received
Net $ paid by player Net $ received by player
Sara Simone Cheryl

PRODUCTIVE FAILURE IN THE FLIPPED MATHEMATICS CLASSROOM 168
6. Jason, Keith, and Clark have are dividing a set of 15 toys – 3 fidget spinners (F), 6 pogs (P), and 6 containers of gak (G) using the Method of Markers.
• Jason loves fidget spinners but hates pogs and gak. • Keith loves fidget spinners and pogs equally well but hates gak. • Clark loves pogs and gak equally well but hates fidget spinners.
The toys are lined up in an array as follows:
G G G P P P F F F P P P G G G
6a. Place markers for each person above based on their value systems. 6b. Describe the allocation of toys to each player and describe what toys are left over. 6c. Suppose that the players agree that each one can pick an extra toy from the leftovers. Suppose Jason picks first, Clark picks second, and Keith picks third. Describe which leftover toys each one would pick.

PRODUCTIVE FAILURE IN THE FLIPPED MATHEMATICS CLASSROOM 169
7. (Conceptual understanding question) Every fair division method has as built-in disincentive for dishonest play. This exercise illustrates the disincentive for dishonest bidding in the lone-divider method. Four partners (Burly, Curly, Greedy, and Dandy) are dividing a million dollar property using the lone-divider method. Using a map, Dandy divides the property into four parcels, s1, s2, s3, and s4. The table below shows the value of the four parcels in the eyes of each partner. s1 s2 s3 s4 Dandy $250,000 $250,000 $250,000 $250,000 Burly $400,000 $200,000 $200,000 $200,000 Curly $280,000 $320,000 $200,000 $200,000 Greedy $320,000 $280,000 $280,000 $120,000
7a. Describe the outcome of the fair division assuming that all players make honest bids. 7b. Suppose that Burly and Curly both bid honestly, but Greedy decides to cheat and bid for only s1 (figuring that he will then get that parcel). Under the right set of circumstances, Greedy could end up with a share worth only $220,000. Describe how this could happen. 8. (Conceptual understanding question) Consider the problem of apportioning M seats between two states, A and B. Let qA and qB denote the standard quotas of A and B, respectively, and assume that these quotas have decimal parts that are not equal to 0.5. Explain why in this case 8a. Hamilton’s and Webster’s methods must give the same apportionment. 8b. the Alabama paradox cannot occur under Hamilton’s method. 8c. violations of the quota rule cannot occur under Webster’s method.

PRODUCTIVE FAILURE IN THE FLIPPED MATHEMATICS CLASSROOM 170
Appendix E
Survey
1. Have you watched all of the instructional videos for each lesson in the unit? ( ) Yes ( ) No
2. How many times have you watched the videos? ( ) once ( ) twice ( ) 3 or more times
3. Where do you watch the videos? ( ) home ( ) bus ( ) other
4. What device do you use to access the videos? ( ) computer ( ) tablet ( ) smart phone

PRODUCTIVE FAILURE IN THE FLIPPED MATHEMATICS CLASSROOM 171
Appendix F
Focus Group Interview Protocol
Good evening and welcome to our focus group session. Thanks for taking the time to join me to talk about your experiences in this class. My name is John Kerrigan, from Rutgers University, and I am here to get some information from you about your experiences in a flipped classroom this semester. You were invited because you have participated in a research study in Math 103 this semester.
There are no wrong answers but rather differing points of view. Please feel free to share your point of view even if it differs from what others have said. Keep in mind that I’m just as interested in negative comments as positive comments, and at times the negative comments are the most helpful.
You've probably noticed an electronic device out. I am tape recording the session because I don't want to miss any of your comments. People often say very helpful things in these discussions and I can't write fast enough to get them all down. We will be identifying ourselves by number, as I won't use any names in my reports. You may be assured of complete confidentiality.
Well, let's begin. I've placed number cards on the table in front of you as a way to identify yourself. Let's find out some more about each other by going around the table. Start by saying your number, then tell me your year at Rutgers and your major. As you respond to each question, please be sure to identify yourself by your number and not your name.
(0) Did you collaborate with students in other sections of this course?
(1) Can you describe the learning activities in this past unit?
(2) How do you find the learning activities? Why?
(3) What do you think is most important in your mathematics inquiry process?
(4) What aspects of the course design would you like to see strengthened?
(5) Is there anything else you’d like to tell me about the course design that might not have been addressed by any of the previous questions?
Thank you so much for taking the time to allow me to speak with you about your experiences with the flipped classroom. Your feedback is greatly appreciated.

PRODUCTIVE FAILURE IN THE FLIPPED MATHEMATICS CLASSROOM 172
Appendix G
Classroom Schedule and Question Protocol
Approximately 7:40-7:50 PM: Student-driven review of videos Students will have the opportunity to submit all of their pre-class questions to me using a Google Form. I will in turn answer their questions prior to their taking the quiz. Approximately 7:51-8:01 PM: Quiz Quizzes will be the same for both sections. Students will not receive any assistance from me during the quiz. Approximately 8:05-8:45: Problem solving in groups of 3-4 I will use the following questioning strategies in class when students ask for help in both treatment conditions:
Tuesday Class Monday Class
When students have difficulty initiating the problem solving process
I will first direct students to collaborate with a peer on the problem. If this has already happened, I will have students refer back to their video notes, sample problems, and textbook.
I will first direct students to collaborate with a peer on the problem. If this has already happened, I will have students refer back to their video notes, sample problems, invention task work, invention task video solution, and textbook. I will also encourage them to reflect back on their productive failure experience and what kinds of prior knowledge they could retrieve to solve the problem.
When students have made some progress but ask for help arriving at a solution
I will challenge myself to create a student-led discussion where I will not repeat, rephrase, or validate what students say. Examples: “Can anyone build on that?” “Thoughts?” “Do we agree or disagree?”. This might also involve highlighting critical features of students’ work (Kapur & Bielaczyc, 2012), where I will point out aspects of students’ in-class work that are important to finding the solution. For example, this could include the standard divisor in an
I will challenge myself to create a student-led discussion where I will not repeat, rephrase, or validate what students say. Examples: “Can anyone build on that?” “Thoughts?” “Do we agree or disagree?”. This might also involve highlighting critical features of students’ work (Kapur & Bielaczyc, 2012), where I will point out aspects of students’ in-class and invention task work that are important to finding the solution. For example, this could

PRODUCTIVE FAILURE IN THE FLIPPED MATHEMATICS CLASSROOM 173
apportionment problem and the fair share in a fair division problem. It will be up to the student to figure out how to use the critical features.
include the standard divisor in an apportionment problem and the fair share in a fair division problem. It will be up to the student to figure out how to use the critical features.
When students need specific factual information or need help executing a process
I will refer students to course materials, such as the open source textbook, previously solved problems, and video sets. Examples of statements will include, “Re-read this paragraph together,” “Refer back to the mixed review problem in your textbook,” “Refer back to the problem you previously solved,” and “Re-watch the video on the skill at hand.”
I will refer students to course materials, such as the open source textbook, invention task, and video sets. Examples of statements will include, “Re-read this paragraph together,” “Refer back to the mixed review problem in your textbook,” “Refer back to the invention task problem and its solution,” and “Re-watch the video on the skill at hand.”
When students ask for confirmation on their proposed solutions
I will push students for explanation. Examples include, “Why?” “How do you know?” and “Explain that to me.”
I will push students for explanation. Examples include, “Why?” “How do you know?” and “Explain that to me.”
Approximately 8:45-9:00 PM: Additional problems
• The control group will continue working on the assignment, and I will continue using the same strategies described above.
• The experimental group will work on the invention task during the four weeks of the study. I will not provide any assistance to students during this time.

PRODUCTIVE FAILURE IN THE FLIPPED MATHEMATICS CLASSROOM 174
Appendix H
Field Notes
Week #5 CONTROL: needed help with setting up ratios. Worked to scaffold responses and turn questions back to students. EXPERIMENTAL: needed more help with vocabulary (what does standard divisor mean, what does standard quota mean, etc.). Seemed more comfortable with performing calculations related to standard divisor, standard quota, etc. This group had more questions before the quiz. Week #6 CONTROL: issues with rounding based on H-H (up or down), when to modify a divisior, how using an MD changes other parts of the problem, more students pulling up videos to refer and looking back at notes. Issues explaining what final answers mean in context. For divider-chooser: concept of mathematically fair not crystal clear. Adjustment for next class: list of critical feature summary to begin the class session. EXPERIMENTAL: Issues with understanding what the modified divisor does and what it represents, how to compare a quota to a rounding cutoff, students did not have clear knowledge of the process for each different method, heavily relying on notes, not clear on what the apportionment represents, trouble connecting different methods. Week #7 CONTROL: issues with combining into a supershare and dividing so that it is a fair share, more issues with lone chooser than lone divider potentially because there are more steps involved, issues with grasping the idea of having more players so you divide by n amount of players, not just by 2...Difficulty with supershare divider/chooser and fair share for people EXPERIMENTAL: Confusion about the methods and how to distinguish which ones to use. This week there were less questions about how to execute each method once they knew which one to use. Group work was better. Less questions about the getting the right answer, more about making sure they were doing the correct steps. Some questions on supershare division. Week #8 CONTROL- problems with allocating the surplus (when to add it to fair share and when to subtract), some minor confusions with adding the total amounts together and dividing by the number of players…. Subtracting order for earned minus paid. EXPERIMENTAL - fair share dividing by # of items not number of players, reviewed invention task solution and how fair share there was based on number of players.