production of chemicals by microwave thermal treatment … · production of chemicals by microwave...
TRANSCRIPT
UNIVERSITÉ DE MONTRÉAL
PRODUCTION OF CHEMICALS BY MICROWAVE
THERMAL TREATMENT OF LIGNIN
SHERIF FARAG
DÉPARTEMENT DE GÉNIE CHIMIQUE
ÉCOLE POLYTECHNIQUE DE MONTRÉAL
THÉSE PRÉSENTÉE
EN VUE DE L’OBTENTION
DU DIPLÔME DE PHILOSOPHIAE DOCTOR
(GÉNIE CHIMIQUE)
DÉCEMBRE 2013
© Sherif Farag, 2013.
UNIVERSITÉ DE MONTRÉAL
ÉCOLE POLYTECHNIQUE DE MONTRÉAL
Cette thèse intitulée :
PRODUCTION OF CHEMICALS BY MICROWAVE
THERMAL TREATMENT OF LIGNIN
présentée par : FARAG Sherif
en vue de l’obtention du diplôme de : Philosophiae Doctor
a été dûment acceptée par le jury d’examen constitué de :
M. STUART Paul, Ph.D., président
M. CHAOUKI Jamal, Ph.D., membre et directeur de recherche
M. AKYEL Cevdet, D.Sc.A., membre et codirecteur de recherche
M. SRINIVASAN Bala, Ph.D., membre
M. HAWARI Jalal, Ph.D., membre

iii
DEDICATION
To my beloved family

iv
ACKNOWLEDGMENTS
Thanks be to God for everything I have in my life.
I would never have been able to finish this dissertation without the guidance of my supervisors,
help from my friends, and support from my parents and my wife.
First of all, I would like to sincerely thank my supervisor, Dr. Jamal Chaouki, for his guidance,
encouragement, understanding, patience, and most importantly, his friendship during my Ph.D.
His mentorship was paramount in finding the optimum methodology and achieving my
objectives. He encouraged me to grow as an independent thinker, which improved not only my
scientific thinking, but all aspects of my life.
For everything you have done for me, Dr. Jamal Chaouki, I thank you.
I would like to express my deep thanks to my co-supervisor, Dr. Cevdet Akyel, for his support,
guidance, encouragement, and helpful suggestions regarding the all issues belonging to his field.
I am also thankful to all my committee members for agreeing to be a member of the jury.
I would also like to thank Dr. Amr Sobhy, who was the first researcher in this field in Dr.
Chaouki’s group. He is a good friend and always willing to help and give excellent suggestions.
I would like to extend my thanks to all my colleagues and friends in Dr. Chaouki’s group for
sharing knowledge and ideas. I am thankful to Ms. Soumaya Benzennou, and Mr. Philippe
Leclerc, for helping me to write the French section of this dissertation. Many thanks also to Dr.
Levent Erdogan (Electrical Engineering Department, École Polytechnique de Montréal) for his
assistance to measure the dielectric properties of the investigated materials.
Special thanks go to all secretaries and technical staff of the chemical engineering department; in
particular, Ms. Martine Lamarche, Mr. Robert Delisle, Mr. Yazid Belkhir, Mr. Jean Huard, and
Mr. Gino Robin, for their assistance.

v
I am grateful for the financial and technical support from Lignoworks NSERC Strategic Network
(www.lignoworks.ca), and the Agricultural Biorefinery Innovation Network (ABIN).
I would never have accomplished this dissertation without the lovely life that I have with my
family: my wife Mai Attia, and my kids Yara and Omer. I would like to express my deep thanks
for their support, encouragement, patience, understanding, and unwavering love from my wife in
good times and bad.
Finally, and most important, I would like to express my fervent thanks to my parents, for
everything they have done for me. Indeed, they are the main reason behind all my successes. I
also wish to extend my thanks to my sisters and brothers—and in particular, my older brother
Nasser—for their love, support, and encouragement.
Sherif FARAG
École Polytechnique de Montréal
Fall 2013

vi
RÉSUMÉ
Ce travail a pour but d’étudier le potentiel de convertir un des composants de la biomasse
lignocellulosique, la lignine, en produits à valeur ajoutée en utilisant la pyrolyse assistée par
microondes (MWP). Pour atteindre cet objectif, plusieurs étapes ont été franchies. Nous avons
tout d’abord réussi à prédire les profils de température au sein d’un matériau exposé aux ondes
électromagnétiques (EMW) à l’aide d’un modèle mathématique tridimensionnel. Ensuite, un
TGA-microondes (MW-TGA) original a été développé et mis en œuvre pour l’étude cinétique.
Subséquemment, une comparaison entre la pyrolyse assistée par microondes et conventionnelle a
été réalisée. L’étude structurelle détaillée de la bio-huile produite via MWP de la lignine kraft a
été discutée en troisième étape. Finalement, un modèle cinétique des produits de la MWP ainsi
que des produits chimiques extraits de la lignine kraft a été mis en place.
Tout d’abord, un modèle mathématique tridimensionnel a été présenté pour simuler le profil de
température à l’intérieur d’un matériau exposé aux ondes électromagnétiques à 2.45 GHz. Les
applications de COMSOL-Multiphysics ont permis de simuler le profil de température transitoire
pour la pinède, le carbone, le Pyrex et des combinaisons de ces matériaux sous différentes
conditions. Les résultats prédits ont été comparés aux données expérimentales pour la validation
du modèle. Cette étude nous a permis de conclure que le chauffage microondes (MWH) induit à
une distribution non-uniforme de la température dûment à la longueur de pénétration (Dp) et à la
perte surfacique de chaleur. Toutefois, le gradient de température peut être minimisé
significativement si l’on réduit les dimensions du matériau exposé à deux fois la Dp et l’on place
un bon isolant thermique à sa surface. Le positionnement des matériaux avec forte/faible capacité
de convertir la radiation microonde en chaleur pourrait favoriser des zones chaudes/froides
désirées à l’intérieur du matériau chauffé, ce qui permet un profil spécifique de température. En
outre, l’addition de matériaux de forte capacité de convertir les microondes en chaleur à la charge
permet d’atteindre des températures beaucoup plus importantes comparées au cas du matériau
seul exposé à la même puissance et temps de chauffage. Les discussions présentées dans cette
étude visent à améliorer l’état de l’art par rapport aux profils de température dans un matériau

vii
composite soumis au chauffage microondes ainsi qu’à développer une approche pour
influencer/contrôler ces profils de température selon la sélection des matériaux.
L’objectif principal de la deuxième étape est d’étudier la cinétique de la MWP versus la pyrolyse
conventionnelle (CP). Pour ce faire, un MW-TGA original a été construit et équipé d’un
thermomètre novateur. Ce thermomètre est exempt des désavantages des thermomètres
traditionnels dans le cas du MWH. Ainsi, le travail expérimental impliquant la MWP et la CP de
la sciure de bois a été accompli. Des programmes MATLAB® ont été développés pour estimer
les paramètres cinétiques, à savoir l’énergie d’activation, le facteur pré-exponentiel ainsi que
l’ordre de la réaction (Ea, ko, et n, respectivement). Nous avons essentiellement conclu de ce
travail que la MWP a une vitesse de réaction plus importante que celle de la CP. Ceci peut
s’expliquer par le fait que les EMW oscillantes ont engendré un mouvement chaotique plus aigu
des molécules ce qui influence le paramètre ko. Malgré cet effet remarquable sur ce ko, l’énergie
d’activation demeure presque constante dans les deux cas. La possibilité de l’influence directe
des ondes sur les liaisons intermoléculaires semble être ténue vu que la longueur des ondes est
beaucoup plus grande que la distance intramoléculaire. Ce résultat est aussi puissant qu’il
permettrait d’interpréter une grande majorité des effets du MWH reportés dans différentes
réactions.
La troisième étape présente une analyse détaillée de la structure des huiles produites par MWP de
la lignine kraft. L’effet de deux paramètres a été évalué : (1) l’ajout d’un bon convertisseur de
microondes-en-chaleur (noir de carbone) entre 20 et 40 wt%, et (2) la puissance nominale des
microondes entre 1.5 et 2.7 kW. Cinq combinaisons pour ces deux variables ont été choisies pour
lesquelles la radiation microondes a été gardée pendant 800 s. Les températures finales atteintes,
mesurées en tant que valeur moyenne spatiale, étaient 900, 980, 1065, 1150, et 1240 K. Les
rendements en produits de pyrolyse, solides, gaz condensables, et gaz non-condensables ont été
comparés pour les conditions opératoires étudiées. Les gaz condensables collectés ont été séparés
selon une phase-huile, prédominée de produits chimiques, et une phase aqueuse contenant surtout
de l’eau et ayant une densité moindre que la phase-huile. Les résultats obtenus montrent que
l’augmentation de la vitesse de chauffe et de la température finale induit une augmentation du

viii
rendement en produits liquides. Les produits identifiés dans les huiles par GC-MS étaient
majoritairement aromatiques : gaïacols, phénols, and catéchols. Toutefois, autour de 60 wt% n’a
pas pu être identifié par GC-MS d’où le recours à la spectroscopie RMN 31
P et 13
C offrant plus de
détails sur la composition structurelle des huiles. Selon l’analyse RMN, 80% du carbone détecté
dans la phase-huile était un carbone aromatique. Les groupes hydroxyliques aliphatiques perçus
dans la matière première ont été éliminés significativement dans l’huile; ceci est attribué à la
formation provisoire de la molécule d’eau pendant la MWP. La concentration en groupes
hydroxyliques phénoliques C5 substitués/condensés a baissée en faveur des groupes gaïacol, p-
hydroxyphenyl, et catéchol hydroxyle. Un cheminement de dégradation détaillé pour chacune de
ces conversions a été suggéré. Une telle étude est essentielle à la compréhension du cheminement
de dégradation ainsi qu’à la composition structurelle des huiles de pyrolyse.
La quatrième étape fait l’objet d’une étude cinétique pour la MWP de la lignine kraft en
appliquant des modèles tridimensionnels. Pour atteindre cet objectif, le MW-TGA utilisé pour la
deuxième étape a été modifié et utilisé. Les modifications apportées ont permis de séparer les gaz
produits (condensables et non-condensables) en sept parties. Le matériau convertisseur de
microondes-en-chaleur a été ajouté à 30 wt% de la masse totale et la puissance nominale était de
2.1 kW. Le premier modèle considère la conversion de la matière première en solide, gaz
condensable et gaz non-condensable en considérant que chaque produit est un bloc individuel.
Dans le second modèle, le liquide est séparé en huile, contenant que des produits chimiques et
0% d’eau, et en eau ne contenant aucun produit chimique. Les produits sont ainsi l’huile, l’eau,
les gaz non-condensables et le solide. De plus amples recherches ont été réalisées dans le
troisième modèle en analysant l’huile produite par GC-MS. L’huile est donc subdivisée en quatre
catégories : (1) phénoliques, contenant tous les composés phénoliques identifiés, (2) aromatiques
à haute masse moléculaire, comportant toutes les molécules lourdes et les produits non identifiés
par GC-MS, (3) aromatiques monocyclique non-phénoliques et (4) aliphatiques. Par conséquent,
le troisième modèle considère la pyrolyse de la lignine en sept produits : ceux cités
précédemment plus l’eau, les gaz non-condensables et le solide. Les paramètres cinétiques de
chaque modèle ont été estimés et appliqués pour prédire la distribution des produits pour chaque
modèle. Finalement, les résultats prédits ont été comparés aux données expérimentales aux fins
de validation.

ix
ABSTRACT
This work investigates the potential of converting one of the lignocellulosic biomass components,
lignin, into value-added bio-products using microwave pyrolysis (MWP). To achieve this
objective, a multi-step process was devised and accomplished. First, temperature profiles within a
material exposed to electromagnetic waves (EMW) were predicted using a three dimensional
mathematical model. Second, an original microwave-thermo gravimetric analyzer (MW-TGA)
was designed and built for kinetic purposes, and the kinetics of MWP were investigated in
contrast to conventional pyrolysis (CP). Third, a detailed structural investigation of a bio-oil
produced from of kraft lignin using MWP was discussed at various conditions. Finally, a kinetic
modeling of the MWP products from kraft lignin was achieved quantitatively, as well as
qualitatively.
In the first step, a three-dimensional mathematical model was created to simulate temperature
profiles inside a material exposed to EMW at 2.45 GHz. COMSOL-Multiphysics applications
were used to simulate transient temperature profiles of pinewood, carbon, Pyrex, and
combinations of these materials under different conditions. The predicted results were compared
against the experimental data in order to validate the presented model. The key conclusions of
this study show that microwave heating (MWH) leads to non-uniform distribution of temperature
due to material penetration depth (Dp) and surface heat loss. However, limiting the dimensions of
the exposed material to twice the Dp and placing strong thermal insulation on the surface
significantly minimize temperature gradients. The locations of materials which are strong or
weak microwave-to-heat convertors can be manipulated to create desired hot or cold zones inside
the heated material, which leads to specific temperature profiles. In addition, the homogenous
mixing of a material strong microwave-to-heat converter with the payload exhibits a significant
increase in temperature, compared to the virgin material exposed to the same power and heating
time. This study aims at improving the understanding of temperature profiles within composite
materials subjected to MWH, as well as developing approaches to influence/control temperature
profiles through material selection.
x
The main objective of the second step was to investigate the kinetics of MWP in contrast to CP.
To achieve this objective, an original MW-TGA was built and equipped with an innovative
thermometer, which does not suffer from the traditional drawbacks, particularly in case of MWH.
Subsequently, experimental work on MWP and CP of sawdust was conducted. MATLAB®
program codes were employed to estimate the kinetic parameters, activation energy, pre-
exponential factors, and reaction orders (Ea, ko, and n, respectively). The key conclusions of this
investigation indicate that MWP has a faster reaction rate than CP. This is a consequence of
enhancing the molecular chaotic motion resulting from the oscillating EMW: the molecular
mobility, which is represented by ko. Even though this noticeable effect on ko, the estimated value
of Ea was almost the same in both cases, this might be a consequence of the tenuous possibility of
direct hacking the molecule-bonds by applied EMW, since the wavelength of EMW is much
longer than the intermolecular distance of the target material. This result is so significant that it
can account for most of the effects observed in different reactions when MWH is applied.
The third step investigated a detailed structural and compositional analysis of a bio-oil produced
from kraft lignin using MWP. The effects of two parameters were considered: (1) loading of a
strong microwave-to-heat convertor (char), 20-40 wt%, and (2) microwave nominal setting
power, 1.5-2.7 kW. Five combinations of these two variables were chosen and applied for 800s
of MWH. The reached final temperatures, measured as mean values, were 900, 980, 1065, 1150,
and 1240 K. The yields of the pyrolysis products, solid, condensable gas, and non-condensable
gas were compared at the conditions under investigation. The collected condensable gas was
separated into oil phase, which is mostly chemicals, and aqueous phase, which is mostly water
and lower density than the oil phase. The obtained results showed that increases the heating rate
leads to an increase in the yield of the liquid product. The identified chemical compounds in the
oil phase using GC-MS were mostly aromatics: guaiacols, phenols, and catechols. Nonetheless, at
60 wt%, the oil phases could not be identified using GC-MS. Therefore, 31
P and 13
C NMR
spectroscopy were used to provide further detailed structural information. Based on the NMR
analyses, up to 80% of the detected carbon atoms in the oil phase were aromatic carbons. The
detected aliphatic hydroxyl groups in the virgin material were significantly eliminated in the oil
phase, and this was attributed to water forming in the interim of MWP. The decreased
concentrations of C5 substituted/condensed phenolic hydroxyl groups after MWP were attributed
xi
to an increase in the concentrations of guaiacyl, p-hydroxyphenyl, and catechol hydroxyl groups.
Detailed degradation pathways for each of those conversions were suggested. Such an
investigation is significant because it aims at improving the understanding of the degradation
pathways of a lignin network, as well as the structure of the obtained bio-oil.
In the final step, a kinetic investigation of kraft lignin products made from MWP was
accomplished by applying three different models. To achieve this objective, the MW-TGA that
was built in the second step was modified and used in this step. The modifications done on the
MW-TGA enable the distribution of vapor products (condensable and non-condensable) up to 7
parts in the interim of MWP. The applied conditions were 30 wt% of char and a microwave
nominal power setting of 2.1 kW. The first model considered the virgin material converted into
condensable gas, non-condensable gas, and remaining solid, taking into consideration each
product as an individual lump. In the second model, the liquid product was separated into oil,
which is entirely chemical and contains 0 wt% water, and water, which contains 0 wt%
chemicals. Therefore, the lumps of the second model were oil, water, non-condensable gas, and
solid. Further investigations were achieved in the third model by analysing the oil product using
GC-MS. The oil product was partitioned into four groups: (1) phenolics group, which contains all
the identified phenolic components, (2) heavy molecular weight components group, which
contents all the heavy molecular weight and the undefined components using a GC-MS analyzer,
(3) aromatics with a single ring (non-phenolics) group, and (4) aliphatics group. Hence, the third
model considered lignin converted into seven products, the above four groups, plus water, non-
condensable gas, and solid. The kinetic parameters of each model were estimated, and then
applied to predict the yield of each product at the selected temperatures. Finally, the predicted
results were compared against the experimental data, which showed a high capacity of the
presented models to estimate product yields.
xii
TABLE OF CONTENT
DEDICATION .............................................................................................................................. III
ACKNOWLEDGMENTS ............................................................................................................. IV
RÉSUMÉ ....................................................................................................................................... VI
ABSTRACT .................................................................................................................................. IX
TABLE OF CONTENT ...............................................................................................................XII
LISTE OF TABLES ................................................................................................................... XVI
LISTE OF FIGURES .............................................................................................................. XVIII
LIST OF ABBREVIATIONS .................................................................................................... XXI
CHAPTER 1 INTRODUCTION ............................................................................................... 1
1.1 Background ...................................................................................................................... 1
1.2 The Lignocellulosic Biomass Components ...................................................................... 1
1.3 Lignin Structure ................................................................................................................ 3
1.4 Conversion of Biomass .................................................................................................... 4
1.4.1 Pyrolysis of Biomass .................................................................................................... 4
1.5 Microwave Heating Fundamentals ................................................................................... 6
1.6 Microwave-Assisted Pyrolysis ....................................................................................... 10
1.7 Temperature Gradient in MWH ..................................................................................... 12
1.8 Effect of MWH on Different Reactions ......................................................................... 12
1.9 Pyrolysis of Lignin and Products Investigation ............................................................. 14
1.10 Pyrolysis Modeling ........................................................................................................ 16
CHAPTER 2 OBJECTIVES AND METHODOLOGY.......................................................... 18

xiii
CHAPTER 3 ARTICLE 1: TEMPERATURE PROFILE PREDICTION WITHIN
SELECTED MATERIALS HEATED BY MICROWAVES AT 2.45GHZ................................. 20
3.1 Introduction .................................................................................................................... 22
3.2 Fundamentals of MWH .................................................................................................. 24
3.2.1 Microwave/Material Interaction ................................................................................. 24
3.2.2 The Main Parameters Describing MWH .................................................................... 25
3.2.3 Dissipated/Absorbed Power ....................................................................................... 25
3.2.4 Penetration Depth and Power Penetration Depth ....................................................... 26
3.2.5 Estimation of the Dissipated/Absorbed Power Term ................................................. 27
3.3 Mathematical Model ...................................................................................................... 28
3.4 Results ............................................................................................................................ 29
3.4.1 The Effect of Dp on the Temperature Profile for a Pinewood Block ......................... 31
3.4.2 The Effect of Different Material Types ...................................................................... 34
3.4.3 The Effect of Adding Material with Stronger Interaction with the EMW ................. 34
3.4.4 The Effect of Replacing a Fraction of the Wood Block with Carbon ........................ 35
3.4.5 The Effect of the Spatial Position of Carbon within the Cube ................................... 36
3.4.6 The Effect of Two Carbon Cylinders in the Wooden Cube ....................................... 37
3.4.7 The Effect of Replacing a Fraction of the Wood with Materials of Weak Interaction
with EMW .............................................................................................................................. 39
3.5 Experimental Validation of the Model ........................................................................... 39
3.6 Conclusion and Future Developments ........................................................................... 41
CHAPTER 4 ARTICLE 2: A KINETIC INVESTIGATION OF MICROWAVE
PYROLYSIS OF SAWDUST USING AN ORIGINAL MICROWAVE –
THERMOGRAVIMETRIC ANALYZER .................................................................................... 44
4.1 Introduction .................................................................................................................... 46
xiv
4.2 The Experimental Work ................................................................................................. 49
4.2.1 The Material ............................................................................................................... 49
4.2.2 The Experimental Setup ............................................................................................. 50
4.3 The Development for Measuring the Transient Mean Temperature .............................. 51
4.4 The Conventional Pyrolysis Method .............................................................................. 57
4.5 The Kinetic Model ......................................................................................................... 57
4.6 Parameter Estimation ..................................................................................................... 59
4.7 The Results ..................................................................................................................... 59
4.7.1 The Decomposition Fraction vs. Temperature ........................................................... 59
4.7.2 The Estimated Kinetic Parameters ............................................................................. 60
4.8 The Discussion ............................................................................................................... 62
4.9 The Conclusion .............................................................................................................. 64
Acknowledgements .................................................................................................................... 65
CHAPTER 5 ARTICLE 3: A DETAILED COMPOSITIONAL ANALYSIS AND
STRUCTURAL INVESTIGATION OF A BIO-OIL FROM MICROWAVE PYROLYSIS OF
KRAFT LIGNIN..... ...................................................................................................................... 66
5.1 Introduction .................................................................................................................... 68
5.2 The Experimental Work ................................................................................................. 71
5.2.1 The Virgin Material .................................................................................................... 71
5.2.2 The Experimental Design ........................................................................................... 72
5.2.3 The Experimental Setup ............................................................................................. 73
5.2.4 The Method ................................................................................................................ 74
5.3 Results and Discussion ................................................................................................... 75
5.3.1 The Products Distribution .......................................................................................... 75
5.3.2 The GC-MS Analysis ................................................................................................. 77

xv
5.3.3 The Quantitative 31
P NMR Analyses for the Oil Phase ............................................. 80
5.3.4 Quantitative 13C NMR Analyses for the Oil Phase ................................................... 86
5.4 Conclusions and Future Work ........................................................................................ 90
5.5 Acknowledgements ........................................................................................................ 90
CHAPTER 6 ARTICLE 4: A LUMPED APPROACH IN KINETIC MODELING OF
MICROWAVE-PYROLYSIS OF KRAFT LIGNIN .................................................................... 92
6.1 Introduction .................................................................................................................... 94
6.2 The Experimental Work ................................................................................................. 96
6.2.1 The Virgin Material .................................................................................................... 96
6.2.2 The Experimental Setup ............................................................................................. 97
6.2.3 The Method ................................................................................................................ 98
6.3 The Implemented Kinetic Models ................................................................................ 100
6.3.1 The First Model ........................................................................................................ 101
6.3.2 The Second Model ................................................................................................... 102
6.3.3 The Third Model ...................................................................................................... 103
6.4 The Parameters Estimation ........................................................................................... 104
6.5 The Results and Discussions ........................................................................................ 105
6.6 Maximize the Phenolics Yield ..................................................................................... 115
6.7 The Validation of the Presented Models ...................................................................... 116
6.8 The Conclusion and Future Work ................................................................................ 118
CHAPTER 7 GENERAL DISCUSSION .............................................................................. 120
CHAPTER 8 CONCLUSION AND RECOMMENDATIONS ............................................ 124
8.1 Conclusions .................................................................................................................. 124
8.2 Future Work and Recommendations ............................................................................ 127
REFERENCES ............................................................................................................................ 128

xvi
LISTE OF TABLES
Table 1.1: The dielectric properties of selected materials (Durka, Van Gerven et al. 2009) ........... 8
Table 3.1: Input parameters for MWH model (Vos, Mosman et al. 2003, D.E. Clark 2005, Kol
2009) ....................................................................................................................................... 30
Table 3.2: Domain characteristics defined in the model ................................................................ 30
Table 4.1: Summary of the effects of MWH on different reactions .............................................. 47
Table 4.2: The estimated kinetic parameters in MWP and CP of sawdust .................................... 61
Table 4.3: Effect of MWH on reaction kinetics compared to CH .................................................. 63
Table 5.1: The coded vales and the corresponding actual values applied in MWP of Kraft lignin
................................................................................................................................................ 72
Table 5.2: The measured water content in the aqueous and oil phase at every run ....................... 77
Table 5.3: The identified chemical components in the oil and aqueous phases using GC-MS ..... 79
Table 5.4: Concentrations of different hydroxyl groups determined by quantitative 31P NMR
spectroscopy of the virgin lignin and the oil phases obtained after microwave pyrolysis at
various power levels, char wt%, and temperatures. ............................................................... 82
Table 5.5: Concentrations of different types of carbon atoms measured by quantitative 13C NMR
spectroscopy of the virgin lignin and the oil phase after pyrolysis at different power settings,
char wt%, and temperatures ................................................................................................... 87
Table 5.6: Concentrations of different hydroxyl groups determined by quantitative 31P NMR
spectroscopy of the virgin lignin and the oil phases obtained after microwave pyrolysis and
conventional pyrolysis at various conditions ......................................................................... 89
Table 5.7: Concentrations of different types of carbon atoms measured by quantitative 13C NMR
spectroscopy of an oil phase produced after microwave pyrolysis and conventional pyrolysis
at various conditions ............................................................................................................... 89
Table 6.1: The estimated kinetic parameters of the 1st pyrolysis model ...................................... 107

xvii
Table 6.2: The The measured water content in the aqueous and oil phases ................................ 108
Table 6.3: The estimated kinetic parameters of the water and oil products. ................................ 110
Table 6.4: The identified chemical components in the oil and aqueous phases using GC-MS
[mg/g] ................................................................................................................................... 112
Table 6.5: The estimated kinetic parameters of the extracted chemical groups. ......................... 115

xviii
LISTE OF FIGURES
Figure 1-1: Schematic representation: (A) cellulose, (B) hemicellulose, and (C) lignin (Gu, Ma et
al. 2013) .................................................................................................................................... 2
Figure 1-2: The three monolignols of a native lignin network: (A) coumaryl alcohol, (B)
coniferyl alcohol, and (C) sinapyl alcohol ............................................................................... 3
Figure 1-3: Pyrolysis of a lignin network and produced fragments in the liquid phase. ................. 5
Figure 1-4: The electromagnetic spectrum (source: image courtesy of NASA) .............................. 6
Figure 1-5: Molecular oscillations in present of an oscillating electromagnetic field .................... 7
Figure 1-6: Evolution of scientific research in the area of MWP in 2010 as compared to previous
years (Luque, Menendez et al. 2012) ..................................................................................... 10
Figure 1-7: Schematic diagram of pyrolysis in one direction (A) CP and (B) MWP .................... 11
Figure 1-8: Materials heated by MWH, (A) rubber stopper and (B) wood cube ........................... 12
Figure 3-1: Wood blocks heated by 2.45 GHz microwaves for 360 s at: (A) 2.3 kW with FC, (B)
2.3 kW with PI, and (C) Power 2.7 kW with FC ................................................................... 23
Figure 3-2: Schematic representation of the thermal balance on a dielectric element in the system
................................................................................................................................................ 29
Figure 3-3: Line selected to simulate and measure the temperature profiles ................................. 31
Figure 3-4: Temperature profiles on the selected line parallel to x axis and has 43 mm in y & z
axis (time in seconds): (A) With FC and (B) With PI ............................................................ 32
Figure 3-5: The effect of heating time at constant microwave power on temperature profiles ..... 32
Figure 3-6: Temperature profiles for FC: (A) For 200 mm cube side length and (B) For 400 mm
cube side length ...................................................................................................................... 33
Figure 3-7: The effect of thermal conductivity values on Dp: (A) k=0.25 and (B) k=0.5 .............. 34
Figure 3-8: Effect of substituting wood with carbon over 300 s of MWH: (A) 50 wt-% carbon
and (B) 75 wt-% carbon ......................................................................................................... 35
xix
Figure 3-9: The effect of a carbon cube in the core of the wood block: (A) FC and (B) PI .......... 36
Figure 3-10: The effect of a 3 mm carbon layer on the surface of the wood block: (A) FC and (B)
PI ............................................................................................................................................ 37
Figure 3-11: Wood block with two holes (D=13 mm) ................................................................... 38
Figure 3-12: Temperature profiles in the case of two carbon cylinders inside the wood block: (A)
At the five points (A, B, C, D, and E) and (B) at the block center line ................................. 38
Figure 3-13: Effect of a Pyrex cube in the wood block core: (A) FC and (B) PI .......................... 39
Figure 3-14 Experimental and predicted results for validation of the model for the case of Free
Convection (FC) ..................................................................................................................... 40
Figure 3-15: Experimental and theoretical results for verification of the model in the case of a
wood block with two carbon cylinders .................................................................................. 41
Figure 4-1: The microwave thermo-gravimetric analyzer setup .................................................... 51
Figure 4-2: Drawing of the air-thermometer .................................................................................. 53
Figure 4-3: The measured and the reference temperature values vs. the heating time .................. 53
Figure 4-4: The axial transient temperature profiles within the sawdust (time in seconds) .......... 56
Figure 4-5: The predicted mean temperatures vs. the experimental, within the heated material ... 56
Figure 4-6: (A) & (C) the decomposition fraction vs. temperature, experimental and predicted;
and (B) & (D) the contour maps of CP and MWP respectively ............................................ 60
Figure 4-7: The capability of the presented model: (A) CP and (B) MWP ................................... 61
Figure 5-1: The three monolignols of a lignin network: (A) coumaryl alcohol, (B) coniferyl
alcohol, and (C) sinapyl alcohol ............................................................................................. 68
Figure 5-2: The experimental set-up .............................................................................................. 73
Figure 5-3: The transient mean temperature of MWP of Kraft lignin at two various conditions .. 74
Figure 5-4: The product distribution for the conditions under investigation ................................. 76
Figure 5-5: GC-MS chromatographs for the oil phase ................................................................... 78
Figure 5-6: Quantitative 31
P NMR spectrum for the oil phase and the virgin material .................. 81

xx
Figure 5-7: Possible degradation pathways for: (A) aliphatic hydroxyl group, (B) carboxyl acid,
and (3) guaiacyl hydroxyl groups ........................................................................................... 84
Figure 5-8: Possible degradation pathways of C5 substituted/condensed phenolic hydroxyl group:
(A) β-5, (B) 4-O-5, and (C) 5-5 .............................................................................................. 84
Figure 5-9: Quantitative 13
C NMR spectra for the oil phase and the virgin material .................... 86
Figure 6-1: The experimental setup, MW-TGA connected with a product manifold .................... 97
Figure 6-3: The measured and the predicted transient mean temperature of the MWP of Kraft
lignin at 2.1 kW and 30 wt% char ........................................................................................ 100
Figure 6-4: (A) The experimental and predicted remaining solid fraction, (B) the contour map of
the calculated deviations using a first order reaction rate, (C) the transient condensable gas
yield, and (D) the transient non-condensable gas yield ....................................................... 106
Figure 6-5: The experimental and predicted yield of: (A) the oil phase and (B) formed water. The
points are the experimental, and the line is the fitting ......................................................... 109
Figure 6-6: The typical GC-MS chromatographs: (A) the oil phase, and (B) the aqueous phase111
Figure 6-7: The experimental and predicted yields: (A) phenolics, (B) HMWC (C) ASR-Non-Ph,
and (D) aliphatics. The points are the experimental, and the line is the fitting .................... 114
Figure 6-8. The estimated Phenolics yield at different heating rates and temperatures [g/g lignin].
.............................................................................................................................................. 116
Figure 6-9: The capability of the presented models: (A) the first model, (B) the second model,
and (C) & (D) the third model. ............................................................................................. 117

xxi
LIST OF ABBREVIATIONS
A Instantaneous yield of the aliphatic compounds
ASR-Non-Ph, Instantaneous yield of the aromatic single ring and non phenolic compounds
C Specific heat
Dp Penetration depth
Erms Root mean square of the electrical field
Ea Activation energy
f Frequency
G Transient yield of the non-condensable gas product
Hrms Root mean square of the magnetic field
K Thermal conductivity
k0 Pre-exponential factor
L Transient yield of the condensable gas product
m Mass
n Reaction rate
O Instantaneous yield of the oil product
P Power dissipated
pc Properties of carbon
Ph Instantaneous yield of the phenolics group
pm Properties of new mixture
pw Properties of pinewood
R The universal gas constant
S Remaining solid yield
S∞ Final solid fraction

xxii
T Temperature
t Time
V Volume
W Instantaneous yield of the water product
x Decomposition fraction
β Heating rate
휀∗ Complex permittivity
휀/ Dielectric constant
휀// Electric loss factor
휀0 Electric permittivity of free space
휀𝑒𝑓𝑓//
Effective dielectric loss factor
𝜇0 Magnetic permeability of free space
𝜇𝑒𝑓𝑓//
Effective magnetic loss factor
𝑡𝑎𝑛𝛿 Loss tangent
𝜔 Angular frequency
α Attenuation factor
ρ Density

1
CHAPTER 1 INTRODUCTION
1.1 Background
Forests are one the most significant of Canada’s resources, covering more than 400 million
hectares, approximately half of the total area of the country and 10 per cent of the earth’s treed
area (Benoit 2008). This potential has established the forest industry as one of the cornerstones of
the Canadian economy. In 2006, this sector contributed 3% to Canada’s total gross domestic
product (GDP). In addition, it provided more than 300,000 jobs, and between 500,000 and
600,000 indirect jobs across the country (Benoit 2008). Recently, however, the forest industry
has reached a crossroads as it has been facing unexpected challenges for the past few years. The
most serious of these challenges are increasing the competition with low-cost sources of wood,
and the decline North American demand. The production of value-added forest-based products,
in addition to traditional products, is one of the main solutions that can be applied to ensure a
sustainable future for the industry. Therefore, this project aims to investigate the potential for
converting lignocellulosic biomass/biomass waste into a value-added bio-product. This product
diversification can deal with the current challenges, address the growing list of environmental
concerns, and take advantage of expected rapid increase in price and demand of petrochemical-
based energy and products.
1.2 The Lignocellulosic Biomass Components
Lignocellulosic biomass is composed of three intertwined components: cellulose, hemicellulose,
and lignin. The distribution of each component depends on many factors, such as the species, the
environment in which it was grown, and the extraction technique. Generally, the dry weight basis
of each is 35-45% cellulose, 25–30% hemicellulose, and 20–35% lignin (Zakzeski, Bruijnincx et
al. 2010, de Wild, Huijgen et al. 2012, Mu, Ben et al. 2013). The key to distinguishing between
these three components is chemical structure, which can also help determine resistance to
decomposition. As shown in Figure 1-1, hemicellulose is rich in branches and it is weakest
compared with the other two components. It decomposes at a temperature range of 220-315 oC

2
with a solid residue of 20 wt% at 900 oC. Cellulose consists of long polymers of glucose without
branches; therefore, it is stronger than hemicellulose. It decomposes between 315 oC and 400
oC
with 6.5 wt% of solid residue at 900 o
C. Lignin mainly consists of aromatics with various
branches, and the activity of the chemical bonds covers a wide range. Thus lignin is the strongest
component compared to cellulose and hemicellulose; it decomposes over a temperature range of
100-900 oC with a solid residue of 45 wt% at 900
oC (Yang, Yan et al. 2007).
(A) (B)
(C)
Figure 1-1: Schematic representation: (A) cellulose, (B) hemicellulose, and (C) lignin (Gu, Ma et
al. 2013)

3
1.3 Lignin Structure
Lignin is found in between and within plant cells, filling the cellulose and hemicellulose, and
acting as a glue to hold them together. Lignin is not just one type; rather, it is many, all with
complex chemical structures. Generally speaking, lignin is a three-dimensional amorphous
polymer and one of the most complex organic aromatic polymers in nature (Zakzeski, Bruijnincx
et al. 2010, Kibet, Khachatryan et al. 2012, Mu, Ben et al. 2013). Still, the exact structure of a
native lignin network is unknown. However, it is believed to be based upon three aromatic
alcohols: p-coumaryl, coniferyl, and sinapyl, as depicted in Figure 1-2 (Zakzeski, Bruijnincx et
al. 2010, de Wild, Huijgen et al. 2012, Kibet, Khachatryan et al. 2012).
(A) (B) (C)
Figure 1-2: The three monolignols of a native lignin network: (A) coumaryl alcohol, (B)
coniferyl alcohol, and (C) sinapyl alcohol
Although lignin is the only renewable resource among aromatics in nature, it has received less
research attention than cellulose and hemicellulose (Ben and Ragauskas 2011, Mu, Ben et al.
2013). Furthermore, the annual production of lignin as a byproduct in the US paper industry is
over 50 million tons, but only 2% of it is converted into bio-products, while the rest is combusted
to recover energy (Ben and Ragauskas 2011). Accordingly, the production of value-added lignin-
based products would valorize the material and deal with the waste issue. In addition, it will
address the unexpected challenges faced by the Canadian forestry industry over the past few
years.

4
1.4 Conversion of Biomass
Biomass can be converted into bio-products and/or energy using different routes, the most
important being biochemical and thermochemical technologies. In the former, biological
organisms and/or biological catalysts are used for the transformation. This can be effected
through the application of different techniques such as fermentation, transesterification, and
methane production in landfills. In the latter, heat and catalysts are employed using three main
approaches, pyrolysis, gasification, and combustion, the key difference between them being the
oxygen ratio: combustion is a complete oxidation, and gasification is a partial oxidization,
whereas pyrolysis is a zero oxidation.
1.4.1 Pyrolysis of Biomass
Pyrolysis is a process of thermal decomposition of the chemical bonds of a target material,
performed by heating the material in an inert environment. Thus it offers less pollution compared
to the other thermochemical techniques, gasification and combustion. The decomposition
temperature varies depending on the material, the type of pyrolysis process used, and a few other
minor factors.
In general, pyrolysis produces three main products: (1) solid fraction, called ―char,‖ consisting
mostly of carbon. Char has many potential uses, such as solid fuel, feedstock for gasification,
feedstock for activated carbon production, a soil additive, and others (Imam and Capareda 2012).
(2) Condensable gas (bio-oil), which is a potential source for value-added chemicals and/or
alternative fuel sources that could replace petrochemicals (Motasemi and Afzal 2013). Bio-oil
contains hundreds of chemical components as a result of the breakdown a virgin material
network. Figure 1-3 shows an example for a lignin network and some of the fragments produced
in the liquid phase via pyrolysis. (3) Non-condensable gas, which is combustible, and can be used
directly to produce heat. It can also be considered as feedstock to produce chemicals via further
processes (de Wild, Huijgen et al. 2012).

5
The yield and quality of the pyrolysis products depend primarily on the applied conditions. For
instance, in slow pyrolysis (T=550-950 K and t=450-550 s) the main product is solid, while in
fast pyrolysis (T=850-1250 K and t=0.5-10 s) and flash pyrolysis (T=1050-1300 K and t<0.5 s),
the main product is liquid (Motasemi and Afzal 2013). Furthermore, the feedstock characteristics,
presence of a catalyst, design of the pyrolyser, and other conditions will affect the product
quantity and/or quality as well. For example, the pyrolysis of sawdust pellets produced 58 wt% of
condensable gas (Ren, Lei et al. 2012), whereas the pyrolysis of polystyrene plastic waste
produced up to 80 wt% liquid (Karaduman 2002). In sum, controlling the pyrolysis conditions
could lead to the desired product, both quantitatively and qualitatively.
Figure 1-3: Pyrolysis of a lignin network and produced fragments in the liquid phase
The required heat energy in pyrolysis can be obtained via heat transfer from a heating source
using any conventional heating (CH) technique. In this case, pyrolysis is called ―conventional
pyrolysis‖ (CP). Alternatively, it can be generated within the material itself using microwave
O
CH3
CH3
OH
OH
O
CH3 CH3
CH3
CH3
OH
OCH3 CH3
O
OH
O
CH3
CH3
CH3
CH3
OH
CH3
CH3
Pyrolysis Process

6
heating (MWH), which is called ―microwave pyrolysis‖ (MWP). MWP is selected for application
in this work, as it can produce more bio-chemicals, particularly liquids, than the other
thermochemical techniques, gasification and combustion. Further information regarding MWH as
well as MWP will be presented in the next chapters.
1.5 Microwave Heating Fundamentals
Microwave heating is one of the electromagnetic processes, which also include X-ray, infrared,
visible light, etc.; each holds a specific frequency range and corresponding wavelength. As
depicted in Figure 1-4, the selected frequencies of MWH range between 0.3 and 300 GHz, in
order to prevent overlap with other applications (Jones, Lelyveld et al. 2002). In North America,
2.45 GHz is the allowed frequency for laboratory applications (Tang, Xia et al. 2008, Chiavaro,
Barnaba et al. 2009, Mutyala, Fairbridge et al. 2010).
Figure 1-4: The electromagnetic spectrum (source: image courtesy of NASA)
Microwave heating is a mechanism of converting electromagnetic waves (EMW) into heat
energy within a target material. This conversion occurs inside the whole or a part of the payload
as it depends on the penetration limits of the applied EMW. Therefore, MWH is defined as ―a
volumetric energy conversion mechanism,‖ which is completely different than the superficial
heat transfer of conventional heating. This mechanism depends mainly on the agitation of
molecules of the exposed material in the presence of an alternating EMW. The molecules of the

7
exposed material form electric dipoles, which try to orient themselves to be in phase with the
oscillating electric field, as depicted in Figure 1-5-A. This polarization is primarily responsible
for generating heat energy inside the target material. On the other hand, as shown in Figure 1-5-
B, free-moving ions are affected by the alternating field; however, this transformation is
relatively small compared to that of the dipole oscillations.
(A) (B)
Figure 1-5: Molecular oscillations in present of an oscillating electromagnetic field
Since the agitation is restricted by the molecular interactions, the system temperature is increased.
As known, temperature is a measure of average kinetic energy of particles in a body (Clark, Folz
et al. 2000, Oloyede and Groombridge 2000, Durka, Gerven et al. 2009). Certainly, this agitation
depends on the specifications of the applied EMW, as well as the characteristics of the exposed
material. The most affected parameters are ―dielectric constant‖ (ε/), which represents the amount
of electric energy that can be stored within the heated material, and ―loss factor‖ (ε//), which
represents the ability of the heated material to dissipate microwave energy. The ratio between
these two parameters is called ―loss tangent‖ (tan δ), which is used to convert microwave energy
to thermal energy within a material. Table 1.1 shows ε/, ε
//, and tan δ of selected materials; further
information regarding the parameters governing MWH will be presented in Chapter 3.
Alternating
Electric field
+
-
+
-
+
-
+
-
+
+ +
Dipole redistribution Charge redistribution

8
Table 1.1: The dielectric properties of selected materials (Durka, Van Gerven et al. 2009)
Material ε/
ε// 𝒕𝒂𝒏𝜹
Vacuum 1.00 0 0
Air 1.0006 0 0
Water 80.4 9.89 0.123 (at 2.45GHz)
Methanol 32.6 21.48 0.659 (at 2.45 GHz)
Ethanol 24.3 22.86 0.941(at 2.45 GHz)
Glass 4.82 0.026 0.0054 (at 3 GHz)
Styrofoam 1.03 0.0001 0.0001 (at 3 GHz)
PTFE 2.08 0.0008 0.0004 (at 10 GHz)
Titanium oxide 50 0.25 0.005
Zirconium oxide 20 2 0.1
Zinc oxide 3 3 1.00
Magnesium oxide 9 0.0045 0.0005
Aluminum oxide 9 0.0063 0.0007
Microwave heating could be employed to avoid many issues and limitations associated with CH,
such as temperature gradient inside and outside the heated material, and char layer formation in
conventional pyrolysis. In addition, under controlled conditions, MWH can save more in energy
consumption as well as enhance product quantity and quality, as reported in numerous
publications (Lucchesi, Chemat et al. 2004, Karthikeyan, Balasubramanian et al. 2006, Budarin,
Clark et al. 2009, Pan, Wu et al. 2009, Zhang and Zhao 2010, Paixão, Monteiro et al. 2011,
Chandra Shekara, Jai Prakash et al. 2012). Variously sized and non-homogeneous feedstock is
acceptable since MWH is a volumetric heating mechanism; however, penetration limits must be
considered. As well, MWH is easily and rapidly initiated and terminated, which would increase
production speed in different sectors. EMW only interacts with particular types of materials; thus,
it can effectuate selective heating. This dramatically reduces the amount of heat energy needed to

9
achieve a particular end, which results in lower running costs and decreases the potential of
thermal hazards. Furthermore, MWH allows for a higher level of control and more compact
equipment, which can result in higher precision and safety, and magnetrons are available in a
wide range of power outputs, which makes the process highly scalable. Last but not least, EMW
can be generated and then guided to a target material anywhere, which makes the process highly
flexible.
In contrast to the above advantages of MWH, EMW radiation presents an additional hazard in
relation to thermal heating. The advantage of EMW only interacting with particular materials can
be a problem in some cases, which makes the use of a microwave-receptor essential. The
materials used in the construction of reactors are limited according to the ability to interact with
EMW. The more sophisticated MWH apparatuses require an increase in the initial cost of the
total system, which often leads to the choice of multiple smaller units rather than one large unit.
Recently, MWH has attracted a staggering amount of attention in scientific research, which is
realized in the number of publications and patent applications over the last few years (See Figure
1-6). Although MWH has been proven as a powerful heating mechanism, especially in converting
of biomass/waste into value-added products; it has not been industrialized yet (Motasemi and
Afzal 2013). However, it has been established in a number of other applications, such as drying,
extraction, separation, and reactivation (Oloyede and Groombridge 2000, Jones, Lelyveld et al.
2002).

10
Figure 1-6: Evolution of scientific research in the area of MWP in 2010 as compared to previous
years (Luque, Menendez et al. 2012)
1.6 Microwave-Assisted Pyrolysis
Employing MWH in pyrolysis would avert a number of issues/limitations associated with CH,
the most important being char layer formation during CP. In CH, heat is transferred from a
heating source to the outer surface of the heated material. Thus, surface temperature begins to
rise, which results in heat transfer towards the core, primarily by thermal conduction. Once the
temperature reaches the pyrolysis temperature, the heated material begins to decompose from the
surface to the core. This forms a layer of char that grows in the same direction of the heat
transfer, which behaves likewise a thermal insulator. This layer limits heat transfer through the
heated material, which results in an outer surface hotter than the core, as shown in Figure 1-7-A.
Consequently, volatile products would be affected quantitatively and/or qualitatively as a result
of further thermal degradation during the flow out through this layer due to the pressure gradient
at the pyrolysis zone. On the other hand, in MWH, EMW penetrate the entire heated material at
almost the same time, limited only by penetration limits. Therefore, theoretically, MWH should
lead to uniform temperature distribution within the heated material. However, in practice, it is
likely to produce non-uniform temperature distribution, as the core is often hotter than the surface
(Yang and Gunasekaran 2001, Cuccurullo, Berardi et al. 2002, Pandit and Prasad 2003,
11
Campañone and Zaritzky 2005, Rattanadecho 2006, Gunasekaran and Yang 2007, Ciacci,
Galgano et al. 2010). This is a result of different factors, which will be discussed in Chapter 3.
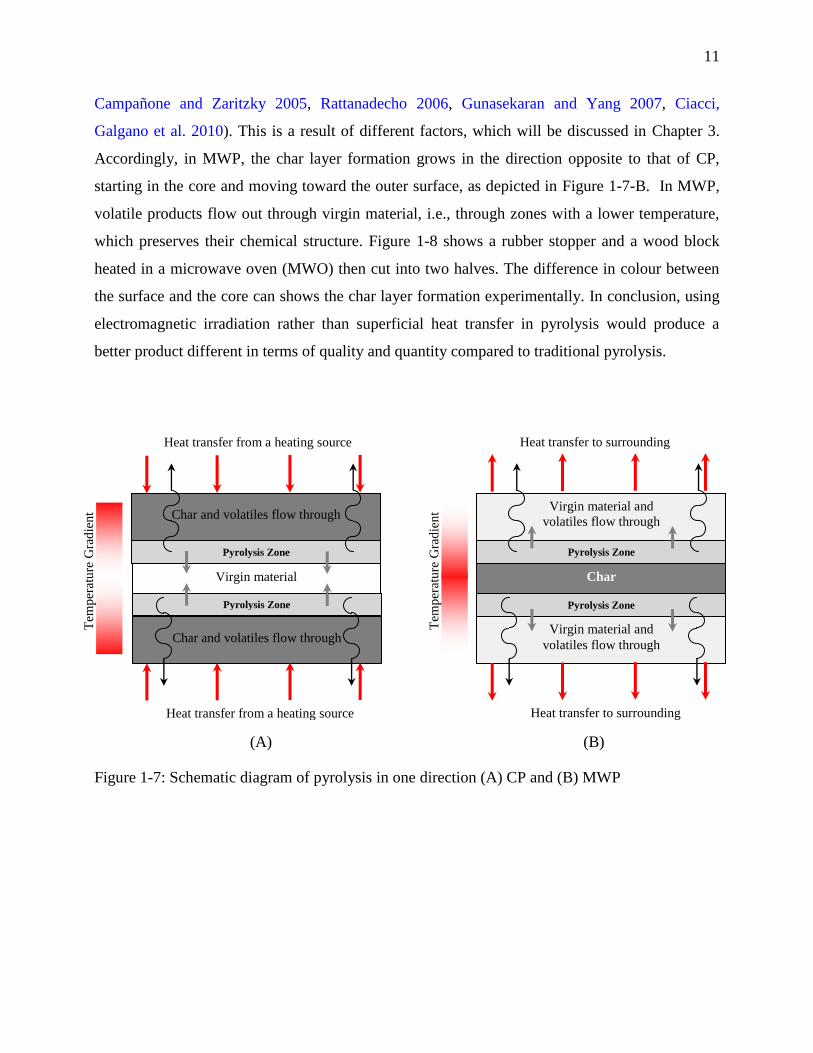
Accordingly, in MWP, the char layer formation grows in the direction opposite to that of CP,
starting in the core and moving toward the outer surface, as depicted in Figure 1-7-B. In MWP,
volatile products flow out through virgin material, i.e., through zones with a lower temperature,
which preserves their chemical structure. Figure 1-8 shows a rubber stopper and a wood block
heated in a microwave oven (MWO) then cut into two halves. The difference in colour between
the surface and the core can shows the char layer formation experimentally. In conclusion, using
electromagnetic irradiation rather than superficial heat transfer in pyrolysis would produce a
better product different in terms of quality and quantity compared to traditional pyrolysis.
(A) (B)
Figure 1-7: Schematic diagram of pyrolysis in one direction (A) CP and (B) MWP
Heat transfer to surrounding
Virgin material and
volatiles flow through
Heat transfer to surrounding
Char
Tem
per
atu
re G
rad
ien
t Virgin material and
volatiles flow through
Pyrolysis Zone
Pyrolysis Zone
Virgin material
Tem
per
atu
re G
rad
ien
t
Char and volatiles flow through
Char and volatiles flow through
Pyrolysis Zone
Pyrolysis Zone
Heat transfer from a heating source
Heat transfer from a heating source

12
(A) (B)
Figure 1-8: Materials heated by MWH, (A) rubber stopper and (B) wood cube
1.7 Temperature Gradient in MWH
Although temperature gradient is a key factor in MWH, only a modest effort has been made to
investigate this. For example, in brief, Ciacci, Galgano et al. (Ciacci, Galgano et al. 2010)
simulated a MWP of a wood block, taking in to consideration heat and mass transfer. Campañone
and Zaritzky (Campañone and Zaritzky 2005) predicted temperature profiles within different
geometries: a sphere, an infinite cylinder, and a slab. Pandit and Prasad (Pandit and Prasad 2003)
simulated temperature profiles within a potato, using finite element analysis. The key conclusion
of those studies was that MWH leads to non-uniform temperature distribution and/or hot spots
inside the heated material. The same conclusion was arrived at by Zhou, Puri et al. (Zhou, Puri et
al. 1995), Rattanadecho (Rattanadecho 2006), Gunasekaran and Yang (Gunasekaran and Yang
2007), and Miura, Kaga et al. (Miura, Kaga et al. 2004). Further information regarding the
examination of reviewing this aspect in the scientific literature will be presented in Chapter 3. In
spite of the efforts made, the simulation of temperature profiles within materials exposed to
EMW still needs further investigation. Approaches that can be employed to control in the
reported observations are almost entirely absent. Furthermore, different scenarios required to
investigate how to achieve a desired temperature profile. Therefore, a goal of this work is to
investigate these missed points, which will be presented in Chapter 3.
1.8 Effect of MWH on Different Reactions
Indeed, in the scientific literature, extensive research has been reported on the effects of MWH on
different reactions. This section summarizes the key conclusions of some of the publications
Surface Core Core Core
13
related to this work; in addition, a further literature review will be presented in Chapter 4. Zhang
and Zhao (Zhang and Zhao 2010) studied the production of 5-hydroxymethylfurfural and furfural
from corn stalk, rice straw, and pine wood in an ionic liquid, and reported that MWH increased
product yield and decreased reaction time. Budarin, Clark et al. (Budarin, Clark et al. 2009)
investigated the preparation of bio-oils using MWP on wheat straw; the oils produced were rich
in aromatics compared to those produced using CP. Krzan and Zagar (Krzan and Zagar 2009)
studied the liquefaction of wood with glycols using p-toluenesulfonic acid as a catalyst, applying
MWH. The authors concluded that MWH decreases the liquefaction time and minimizes the
loading of catalyst. Menéndez, Domínguez et al. (Menéndez, Domínguez et al. 2004) investigated
MWP of four different types of wet sewage sludge, and MWP was found to achieve the reaction
much faster than through by CP; in addition, it produced more non-condensable gas yield.
Lucchesi, Chemat et al. (Lucchesi, Chemat et al. 2004) studied solvent-free microwave extraction
of oil from basil, garden mint, and thyme. The authors reported that MWH achieved the reaction
in less time compared to CH. In addition, a noticeable savings in energy consumption were
achieved: 0.25 kWh compare to 4.5 kWh with CH. Similar results were reported by Paixão,
Monteiro et al. (Paixão, Monteiro et al. 2011). Orozco, Ahmad et al. (Orozco, Ahmad et al. 2007)
found that MWH increased the glucose yield of grass and cellulose in dilution of phosphoric acid
and water. Furthermore, it has higher reaction rate at moderate temperatures. Karthikeyan,
Balasubramanian et al. (Karthikeyan, Balasubramanian et al. 2006) realized that MWH
completed extraction of polycyclic aromatic hydrocarbon from airborne particles within minutes,
compared to hours using CH, and the obtained products were different in quality. Sithambaram,
Nyutu et al. (Sithambaram, Nyutu et al. 2008) found that MWH enhanced conversion of K-OMS
catalyzed oxidation of tetralin compared to CH: (52–88%) and (42–80%), respectively. A similar
conclusion was arrived at by Chandra Shekara, Jai Prakash et al. (Chandra Shekara, Jai Prakash
et al. 2012) in an investigation of the solventless acylation of p-cresol with different carboxylic
acids over BEA zeolite. To conclude, MWH shows noticeable demonstrated effects on reaction
rate, reaction temperature, energy consumption, catalyst loading, and other parameters.
Although extensive research has been reported on this aspect, few attempts have been made to
find a scientific explanation for the observed effects. Few researchers have done a comparison
between MWH and CH based using a kinetic study. Adnadjevic and Jovanovic (Adnadjevic and

14
Jovanovic 2012), Adnađević, Gigov et al. (Adnađević, Gigov et al. 2008), Fukushima,
Kashimura et al. (Fukushima, Kashimura et al. 2013), Sun, Wang et al. (Sun, Wang et al. 2012)
Chen, Wang et al. (Chen, Wang et al. 2013), Yan, Hu et al. (Yan, Hu et al. 2012), Adnadjević and
Jovanović (Adnadjević and Jovanović 2012), and Li, Han et al. (Li, Han et al. 2013) reported
that reaction activation energy (Ea) in the case of MWH is less than that of CH as a result of an
effect related to applied EMW. In fact, this is a doubtful statement because the wavelength of
applied EMW, 12.24 cm, is much longer than the intermolecular distance of the heated material.
On the other hand, Mazo, Estenoz et al. (Mazo, Estenoz et al. 2012) and Yadav and Borkar
(Yadav and Borkar 2006) have found that the Ea is the same for both cases, MWH and CH.
Regarding the effect on the pre-exponential factor (ko), Adnadjevic and Jovanovic (Adnadjevic
and Jovanovic 2012), Adnađević, Gigov et al. (Adnađević, Gigov et al. 2008), and Mazo,
Estenoz et al. (Mazo, Estenoz et al. 2012) reported that the ko in MWH is lower than that of CH.
Indeed, this statement is not acceptable based on the MWH mechanism, which mainly depends
on the agitation of the molecules of the heated material, i.e., ko should be higher in MWH than
CH. On the contrary, Adnadjević and Jovanović (Adnadjević and Jovanović 2012), Li, Han et al.
(Li, Han et al. 2013), Temur Ergan and Bayramoglu (Temur Ergan and Bayramoglu 2011), and
Yadav and Borkar (Yadav and Borkar 2006) have found the opposite, that ko in MWH is higher
than that in CH. To sum up, even though significant effects have been discovered in different
MWH reactions, little effort has been made to interpret these observations. In addition, many of
the published conclusions are inconsistent with each other. Thus another aim of this project is to
investigate this, which will be presented in Chapter 4.
1.9 Pyrolysis of Lignin and Products Investigation
As mention earlier, pyrolysis, combustion, and gasification are the three techniques of
thermochemical technology. Each is employed for a specific purpose: combustion is used to
generate heat energy, whereas gasification is used to produce synthesized gas. Pyrolysis is
applied to produce bio-products in the form of solid, condensable gas, and non condensable gas.
Pyrolysis liquid has received more interesting than solid and gas products in scientific research,
as it has the potential to produce value-added bio-chemicals. In addition, it can be used as a fuel
resource to replace petrochemical-based fuels. However, the complexity of crude liquid created
15
by pyrolysis makes further processes for upgrading, such as dehydration and separation,
essential. This level of complexity is affected by the pyrolysis condition, the structure of virgin
material, and many other conditions. For example, liquids obtained from the pyrolysis of lignin
are more complex than those obtained from cellulose and hemicellulose. Accordingly, the
characterization of pyrolysis liquids is limited by many factors, in addition to the basic issues
regarding the limitations of analyzers. Thus, scientific publications that present detailed structural
investigations of bio-oils are quite scarce.
The pyrolysis of lignin, using MWH or CH, has been investigated for the past two decades, but
few studies have examined the liquid product qualitatively; the majority investigated it
quantitatively. This section presents a brief literature review of this aspect; in addition, further
reviews will be presented in Chapter 5 and Chapter 6. Zheng, Chen et al. (Zheng, Chen et al.
2013) investigated the fast pyrolysis of lignin under a catalytic reaction of Mo2N/γ-Al2O3, using a
pyrolysis-gas chromatography/mass spectrometry system (Py-GC-MS). Choi and Meier (Choi
and Meier 2013) studied the pyrolysis of kraft lignin under effect of different temperatures and
catalysts, using GC-MS/GC-FID to analyze the liquid product. Jiang, Nowakowski et al. (Jiang,
Nowakowski et al. 2010) examined the temperature dependence of the composition of lignin
pyrolysis products employing Pr-GC-MS. Lou, Wu et al. (Lou, Wu et al. 2010) investigated the
effect of temperature and catalysts (sodium chloride, Permutite) on the pyrolysis of bamboo
lignin, using Py-GC-MS. Zhang, Resende et al. (Zhang, Resende et al. 2012) studied the
pyrolysis of three lignin types, prairie cord grass, aspen, and synthetic kraft lignin, using Py-GC-
MS and TGA/FTIR. De Wild, Huijgen et al. (de Wild, Huijgen et al. 2012) investigated the
pyrolysis of lignin from two different biomass sources using a fluidized bed reactor. In that work,
the obtained condensable gas product was analyzed using GC-MS. Luo, Wang et al. 2012 (Luo,
Wang et al. 2012) examined the thermal behaviour of organosolv lignin under the catalytic effect
of zeolites using TGA-FTIR.
Most of the publications on this subject focus on investigating the liquid products from lignin
pyrolysis employed GC-MS, TGA, and/or FT-IR analyses. However, these techniques are limited
because of the complexity of the crude liquid, which results in many chemical compounds that

16
could not be identified. For instance, GC-MS cannot identify around 40 wt% of the cured oil, and
using FT-IR for the quantitative analysis of a complex mixture is limited (Ben and Ragauskas
2011). Consequently, a full structural investigation of a bio-oil has not been achieved; in
addition, scientific publications that present compositional analyses of bio-oils, particularly from
lignin pyrolysis, are few in number. Therefore, the third aim of this project is the compositional
analysis and structural investigation of a bio-oil from the MWP of lignin at various conditions,
which will be presented in Chapter 5.
1.10 Pyrolysis Modeling
The pyrolysis of lignin has been investigated from different aspects, such as product distribution
(Jiang, Nowakowski et al. 2010, Lou and Wu 2011), the presence of catalysis (Mullen and
Boateng 2010, Rutkowski 2011), and kinetics (Ferdous, Dalai et al. 2002, Montané, Torné-
Fernández et al. 2005, Mani, Murugan et al. 2008, Faravelli, Frassoldati et al. 2010, Jiang,
Nowakowski et al. 2010, Janković 2011). Extensive studies have been conducted to model lignin
pyrolysis using a single step global reaction. This model considers the virgin material as
decomposed into volatiles and solid. However, it cannot distinguish between condensable and
non-condensable products. Thus, an investigation of single/multi step parallel reactions is
required, which can predict further outcomes.
Virgin material y char + (1-y) volatiles
Virgin Material Virgin Material
In spite of the extensive publications regarding this aspect, the kinetic modeling of individual
pyrolysis products, both qualitative and quantitative, is scarce in the scientific literature. It may
Ks2
Non-Condensable Gas
Condensable Gas
Remaining Solid
Ks
Kl
Kg Kl Kg2
Non-Condensable Gas
Condensable Gas
Remaining Solid
Ks
Kg
17
be a consequence of particular failings of the experimental setup. As a result, most of the current
pyrolysis models investigate only volatile products quantitatively, without modeling their
chemical composition. As will be discussed in Chapter 5, qualitative investigation is so
significant because it can distinguish between products with the same yield. Therefore, the fourth
step in this work aims to investigate the kinetics of the pyrolysis products as well as the extracted
chemicals from MWP of lignin, which will be presented in Chapter 5. Such investigations will
lead to an improved understanding of the underlying processes, and provide needed information
for the rational design and scaling-up the pyrolysis reactor.

18
CHAPTER 2 OBJECTIVES AND METHODOLOGY
The main purpose of this work is to investigate the potential of converting lignin into value-
added bio-products. In order to accomplish this, the following steps will be taken:
1. Simulate temperature profiles within selected materials exposed to microwave heating
(MWH).
2. Design and manufacture an innovative thermometer that does not suffer from the
drawbacks of traditional thermometers.
3. Design and build an original thermogravimetric analyzer that works using MWH and is
equipped with a product manifold, for kinetic purposes.
4. Study the reaction kinetics of microwave pyrolysis (MWP), in contrast to conventional
pyrolysis (CP) and interpret the obtained results.
5. Study the composition and structure of the condensable gases produced by MWP of kraft
lignin using different analysis techniques.
6. Design a kinetic model of the MWP products of kraft lignin, both quantitatively and
qualitatively.
Chapters 4 to 7 will present the achievement of these objectives and the scientific findings.
Chapter 3 will first present a three-dimensional mathematical model to simulate temperature
profiles inside a material exposed to electromagnetic irradiation at 2.45 GHz. In order to do this,
COMSOL-Multiphysics applications will be used to simulate the transient temperature profiles of
pinewood, carbon, Pyrex, and combinations of such under different conditions. Chapter 4 will
present a kinetic investigation of the MWP of sawdust using an original MW-TGA. In this
chapter, the full descriptions of the MW-TGA will be presented. Chapter 5 will discuss the
detailed compositional analysis and structural investigation of a condensable gas phase obtained
from the MWP of kraft lignin. In this chapter, different degradation pathways of a lignin network
will be presented after analysing the obtained liquids. Chapter 6 will present a kinetic modeling
of MWP products from kraft lignin using a lumped approach. Further investigations for the oil

19
phase will be presented using different techniques, which will enable modeling of the extracted
chemicals as well. Finally, Chapter 7 will present the conclusions of this work and the
recommendations for the future investigations.

20
CHAPTER 3 ARTICLE 1: TEMPERATURE PROFILE PREDICTION
WITHIN SELECTED MATERIALS HEATED BY MICROWAVES AT
2.45GHz
Sherif Faraga, Amr Sobhy
a, Cevdet Akyel
b, Jocelyn Doucet
a and Jamal Chaouki
a
aCRIP-Biorefinery Centre, Department of Chemical Engineering, École Polytechnique de Montréal.
bDepartment of Electrical Engineering, École Polytechnique de Montréal.
P.O. Box 6079, Station Centre-ville, Montréal, QC, Canada H3C 3A7.
(Published in Applied Thermal Engineering Journal - doi:10.1016/j.applthermaleng.2011.10.049)
Presentation of the article: A three-dimensional mathematical model to simulate transient
temperature profiles within selected materials exposed to electromagnetic irradiation will be
presented. COMSOL-Multiphysics applications will be employed to simulate the temperature
profiles of pinewood, carbon, Pyrex, and combinations of such using different scenarios. The
predicted results will be compared against experimental data to validate the model.

21
Abstract
This work presents a three-dimensional mathematical model to simulate temperature profiles
inside a material heated by electromagnetic waves (EMW) at 2.45 GHz. COMSOL-Multiphysics
was used to simulate transient temperature profiles of pinewood, carbon, Pyrex, and
combinations of such under different conditions. The model predicts that, upon exposing an
86mm wooden cube to 2.45 GHz EMW for 300 s, the core temperature reached 595 K at a setting
of 60K/min, while the outer surface 365 K at 15 K/min. By mixing 50% carbon with the wooden
block, the model anticipated the cube core to reach 990 K at 140 K/min, compared to 1350 K at
212 K/min with 75% carbon at the same power and after the same time. By inserting a 125 cm3
carbon cube inside the wood cube, the core reaches 3200 K, while the outer surface was 375 K
and 636 K for free convection (FC) and perfect insulator (PI), respectively. Placing the same
volume of carbon on the surface of the wood cube yielded a maximum temperature of 660 K
under FC, compared to 1280 K with PI. Changing the material of the core cube from Carbon to
Pyrex yields a temperature of 324 K in the core, with 365 K and 605 K on the outer surface in the
case of FC or PI, respectively. The average percentage relative error between the measured and
the predicted temperatures was ±4% and ±15% inside the pinewood and carbon respectively.
Keywords: Microwave heating, Temperature profiles, Absorbing power, Temperature prediction,
Heat equation, Energy efficiency.

22
3.1 Introduction
A number of industrial sectors have benefited from the contrast between of microwave heating
(MWH) mechanisms and conventional heating (CH). Most importantly, MWH mechanisms reply
on energy conversion directly with the target material, leading heat generation volumetrically
rather than through the surface of the material, as is the case with CH. Furthermore, it is well
established that electromagnetic waves (EMW) have a high interaction with powder samples
(Durka, Van Gerven et al. 2009, Li, Zhang et al. 2009). This can be used to distribute hot spots
inside the media being heated to increase the microwave-induced energy transfer. Under
controlled conditions, it has been demonstrated that MWH can reduce energy consumption and
allow for higher product selectivity in certain reactions compared to CH (Camelia Gabriel and
Mingosb 1998, Thostenson and Chou 1999, Oloyede and Groombridge 2000, Datta and Ni 2002,
Jones, Lelyveld et al. 2002, Will, Scholz et al. 2003, Domínguez, Menéndez et al. 2005, Zhu, Wu
et al. 2006, Geedipalli, Rakesh et al. 2007, Orozco, Ahmad et al. 2007, Badamali, Clark et al.
2008, Tang, Xia et al. 2008, Xu, Jiang et al. 2008, Budarin, Clark et al. 2009, Chiavaro, Barnaba
et al. 2009, Durka, Gerven et al. 2009, Ma, Liu et al. 2009, Wan, Chen et al. 2009, Mutyala,
Fairbridge et al. 2010).
Theoretically, MWH should lead to equivalent heat generation within the material. However, in
practice, it is likely to produce a non-uniform temperature distribution (Yang and Gunasekaran
2001, Cuccurullo, Berardi et al. 2002, Pandit and Prasad 2003, Campañone and Zaritzky 2005,
Rattanadecho 2006, Gunasekaran and Yang 2007, Ciacci, Galgano et al. 2010). This aspect
makes modeling of the heat transfer mechanisms rather complex. As an example, Figure 3-1
shows wooden blocks heated in a microwave oven for 360 s at different power settings. Although
Figure 3-1-A and Figure 3-1-B were heated at same power setting (2.3 kW), use of thermal
insulation on the outer surface influenced their core temperature. While Figure 3-1-C was heated
at 2.7 kW for the same time (360 s), Figure 3-1-B still produced a higher temperature compared
to others. These variances result from different parameters, the most important being the heat
transfer on the outer surface (Yang and Gunasekaran 2001, Geedipalli, Rakesh et al. 2007).

23
(A) (B) (C)
Figure 3-1: Wood blocks heated by 2.45 GHz microwaves for 360 s at: (A) 2.3 kW with FC, (B)
2.3 kW with PI, and (C) Power 2.7 kW with FC
Temperature profiles for materials exposed to MWH have been studied in the literature (Klinbun
and Rattanadecho , Zhou, Puri et al. 1995, Campañone and Zaritzky 2005); Most of these studies
reported that MWH leads to non-uniform distribution of temperature and hot and/or cold spots
inside the heated material (Zhou, Puri et al. 1995, Pandit and Prasad 2003, Miura, Kaga et al.
2004, Campañone and Zaritzky 2005, Gunasekaran and Yang 2007, Ciacci, Galgano et al. 2010),
but a little effort has been done in order to study how can be controlling in those observations.
The primary objective of this work is to present the development and validation of a
mathematical model to predict temperature profiles within a wood cube subjected to MWH. The
model was solved using COMSOL-Multiphysics applications, taking into account the effect of
(1) heat induction in a wooden cube of known dielectric and physical properties upon irradiation
by 2.45 GHz microwaves at 2.3 KW nominal power and (2) heat transfer due to free convection
or perfect insulator (FC or PI) at the surface of the cube. The software COMSOL-Multiphysics
will then be used to predict temperature profiles within the wood cube (1) subjected to surface
heat loss, (2) subjected to perfect insulation at the surface, (3) upon replacing a volume of wood
with an excellent converter of microwave to heat (carbon), and (4) upon replacing the same
volume of wood with a microwave-transparent material (Pyrex). Cases (3) and (4) are compared
to (1) and (2) to highlight the variation of temperature profiles within composite exposed to
MWH in the presence of materials of contrasting dielectric, and physical properties. Such
discussions aim at (1) improving the understanding of temperature profiles within composite
materials heated by microwaves and (2) developing approaches to influence/control temperature
profiles through material selection.
Outer
Surface Core Core
Outer
Surface Core
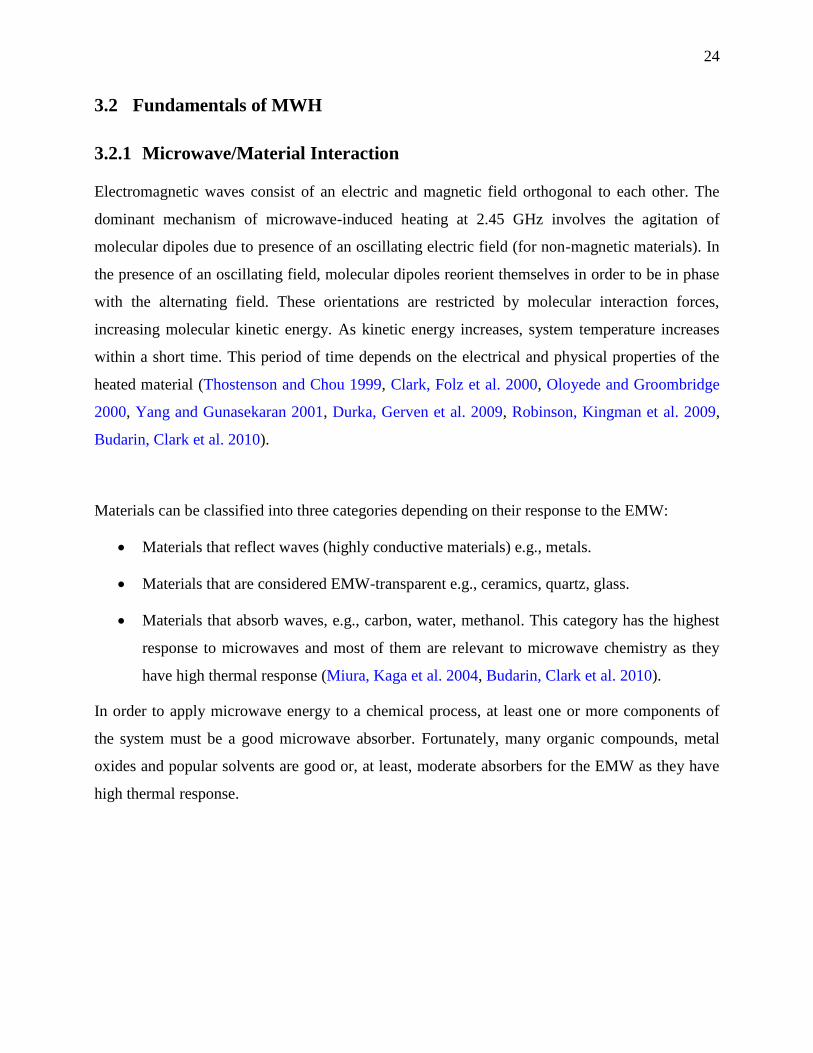
24
3.2 Fundamentals of MWH
3.2.1 Microwave/Material Interaction
Electromagnetic waves consist of an electric and magnetic field orthogonal to each other. The
dominant mechanism of microwave-induced heating at 2.45 GHz involves the agitation of
molecular dipoles due to presence of an oscillating electric field (for non-magnetic materials). In
the presence of an oscillating field, molecular dipoles reorient themselves in order to be in phase
with the alternating field. These orientations are restricted by molecular interaction forces,
increasing molecular kinetic energy. As kinetic energy increases, system temperature increases
within a short time. This period of time depends on the electrical and physical properties of the
heated material (Thostenson and Chou 1999, Clark, Folz et al. 2000, Oloyede and Groombridge
2000, Yang and Gunasekaran 2001, Durka, Gerven et al. 2009, Robinson, Kingman et al. 2009,
Budarin, Clark et al. 2010).
Materials can be classified into three categories depending on their response to the EMW:
Materials that reflect waves (highly conductive materials) e.g., metals.
Materials that are considered EMW-transparent e.g., ceramics, quartz, glass.
Materials that absorb waves, e.g., carbon, water, methanol. This category has the highest
response to microwaves and most of them are relevant to microwave chemistry as they
have high thermal response (Miura, Kaga et al. 2004, Budarin, Clark et al. 2010).
In order to apply microwave energy to a chemical process, at least one or more components of
the system must be a good microwave absorber. Fortunately, many organic compounds, metal
oxides and popular solvents are good or, at least, moderate absorbers for the EMW as they have
high thermal response.

25
3.2.2 The Main Parameters Describing MWH
For non-magnetic material, the main parameter which describes the level of heat generation
inside a microwave absorbent material is the complex permittivity 휀∗ as represented in equation
(3-1).
휀∗ = 휀/ − j휀// (3-1)
The real part of the complex permittivity is called dielectric constant (ε/) which represents the
amount of electric energy that can be stored within the heated material. The imaginary part is
called ―loss factor‖ (ε//) and represents the ability of the heated material to dissipate microwave
energy. The ratio between these parts is called ―loss tangent‖; it is used to convert microwave
energy to thermal energy within a material (Camelia Gabriel and Mingosb 1998, Clark, Folz et al.
2000, Chiavaro, Barnaba et al. 2009, Durka, Gerven et al. 2009, Castro-Giráldez, Fito et al. 2010,
Guo, Wang et al. 2010), as represented in equation (3-2).
𝑡𝑎𝑛𝛿 =휀//
휀/
(3-2)
3.2.3 Dissipated/Absorbed Power
The dissipated power inside a microwave cavity could be represented as energy generated inside
a heated material. For non-magnetic materials, it can be represented in the form of equation (3-3).
𝑃 = 𝜔 휀0 휀𝑒𝑓𝑓//
𝐸𝑟𝑚𝑠2 (3-3)
or
𝑃 = 2𝜋𝑓 휀/ 𝑡𝑎𝑛𝛿 𝐸𝑟𝑚𝑠2 (3-4)
Where P is the absorbed power per unit volume [W/m3], 휀𝑒𝑓𝑓
// is the effective dielectric loss factor
(휀0휀𝑒𝑓𝑓//
=휀/𝑡𝑎𝑛𝛿) [-], 𝜔 is the angular frequency (𝜔 = 2𝜋𝑓) [s-1
], and 𝐸𝑟𝑚𝑠 is the root mean
square of the electric field [V/m].

26
In the case of magnetic materials, equation (3-4) should be replaced by equation (3-5)
(Rattanadecho 2006, Manoj Gupta 2007, Robinson, Kingman et al. 2009, Ramasamy and
Moghtaderi 2010).
𝑃 = 𝜔 휀0 휀𝑒𝑓𝑓//
𝐸𝑟𝑚𝑠2 + 𝜔 𝜇0 𝜇𝑒𝑓𝑓
// 𝐻𝑟𝑚𝑠
2 (3-5)
Where 𝜇𝑒𝑓𝑓//
is the effective magnetic loss factor [-], and 𝐻𝑟𝑚𝑠 is the magnetic field [A/m].
Microwave frequencies ranged between 106 (radio frequencies) and 10
12 Hz (infrared
frequencies). Frequencies allocated for commercial applications are 0.915, 2.45, 5.8, and 22 GHz.
In laboratory experiments, a frequency of 2.45 GHz is typically used (Tang, Xia et al. 2008,
Chiavaro, Barnaba et al. 2009, Mutyala, Fairbridge et al. 2010).
3.2.4 Penetration Depth and Power Penetration Depth
Electric fields and generated power decay exponentially inside the material. The penetration
depth (D) is defined as the depth where the magnitude of the electric field drops by a factor 1𝑒
with respect to the surface value. In a similar manner, the power penetration depth (Dp) is the
distance where the power density is reduced by a factor 1𝑒 of the surface. Equation (3-6)
describes the relationship between D and Dp, where α is called the attenuation factor and can be
represented generally by equation (3-7). For high loss (휀𝑒𝑓𝑓//
≫ 휀/) and low loss (휀𝑒𝑓𝑓//
≪ 휀/)
mediums, equations (3-8) and (3-9) apply, respectively (Campañone and Zaritzky 2005, Manoj
Gupta 2007).
𝐷𝑝 =𝐷
2=
1
2𝛼
(3-6)
𝛼 = 𝜔 𝜇/𝜇𝑜 휀/ 휀𝑜 1 + (휀𝑒𝑓𝑓
// / 휀/)2
1/2
− 1
2
(3-7)

27
𝛼 =𝜔
2 𝜇/𝜇𝑜 휀𝑜
휀/휀𝑒𝑓𝑓
//
(3-8)
𝛼 =𝜋휀𝑒𝑓𝑓
//
𝜆0 휀/
(3-9)
Lambert’s law describes the power penetration in one dimension as shown in equation (3-10)
(Zhou, Puri et al. 1995, Bail, Koutchma et al. 2000, Yang and Gunasekaran 2001, Rattanadecho
2006, Manoj Gupta 2007).
𝑃 = 𝑃𝑜𝑒(−2𝛼𝑦 ) (3-10)
In a nutshell, equation (3-4) represents generated power, while equation (3-10) represents local
value of the power at a certain distance from the surface of the heated material.
3.2.5 Estimation of the Dissipated/Absorbed Power Term
Due to the difficulty of measuring and calculating the electric field strength inside a microwave
cavity, an energy balance was performed to estimate the power term using an empirical approach
(Campañone and Zaritzky 2005) as shown in equation (3-11).
𝑚 𝐶 ∆𝑇
𝑉 𝑡 = 2𝜋𝑓 휀/ 𝑡𝑎𝑛𝛿 𝐸𝑟𝑚𝑠
2 (3-11)
Where m is the water mass, C is the specific heat, ΔT is the temperature difference, V is the water
volume, and t is the heating time. It is then assumed that 2𝜋𝑓𝐸𝑟𝑚𝑠2 is independent of the material
but is related to the specific microwave oven used at a specific power. For that purpose, an
experimental setup was used to heat a constant mass of water (휀/ = 78, 휀// = 12, and 𝐷𝑝 =
1.44cm @2.45 GHz (Manoj Gupta 2007)) in a Pyrex cylinder with a PI on the outer surface. For
9.9 g (10 ml) of water, ∆𝑇=68 K and t=20 s @ 2.3 kW setting power. By substituting in equation

28
(3-11) a general absorbed energy equation is obtained for any material heated by the microwave
oven (Microwave Research Inc; Model: BP-211, 230 V, and Total power 3.2 kW). This
calculation was done with a power setting of 2.3 kW. For this specific power, the following
equation can be derived (3-12):
(𝑃𝑜)𝑚𝑎𝑡𝑒𝑟𝑖𝑎𝑙 = 2.25 × 10⁶(휀/ 𝑡𝑎𝑛𝛿)𝑚𝑎𝑡𝑒𝑟𝑖𝑎𝑙 W/m3 (3-12)
3.3 Mathematical Model
Consider an element of volume of dimensions ∆x, ∆y, and ∆z from a larger block element with
dimensions l, h, and w in the x, y, and z coordinates system. The following assumptions are made:
1) Variation of volume and physical/electrical properties are considered negligible.
2) All materials considered are non-magnetic material, i.e., magnetic field’s interaction is
negligible.
3) Neglect any effect related to chemical reaction during the heating process.
4) Uniform distribution of the EMW inside the oven cavity.
By applying the energy balance on this element with the set of assumptions and initial conditions,
it is possible to obtain the final form of the energy equation as shown in equation (3-13).
k ∇2T + Po
3 (e
−iD p
i + ei−lD p ) = ρ C
∂T
∂t (3-13)
Where i refers to the Cartesian coordinates: x, y, and z. The term l must be replaced by h and w
when i is y and z respectively.
Initial and Boundary Conditions:
At t=0: T=T0 at any point inside or outside the block
In the case of FC heat transfer by conduction is equal to by convection therefore;
@ t>0 i.e. x=0, l; −𝑘𝜕𝑇
𝜕𝑥= (𝑇 − 𝑇0)
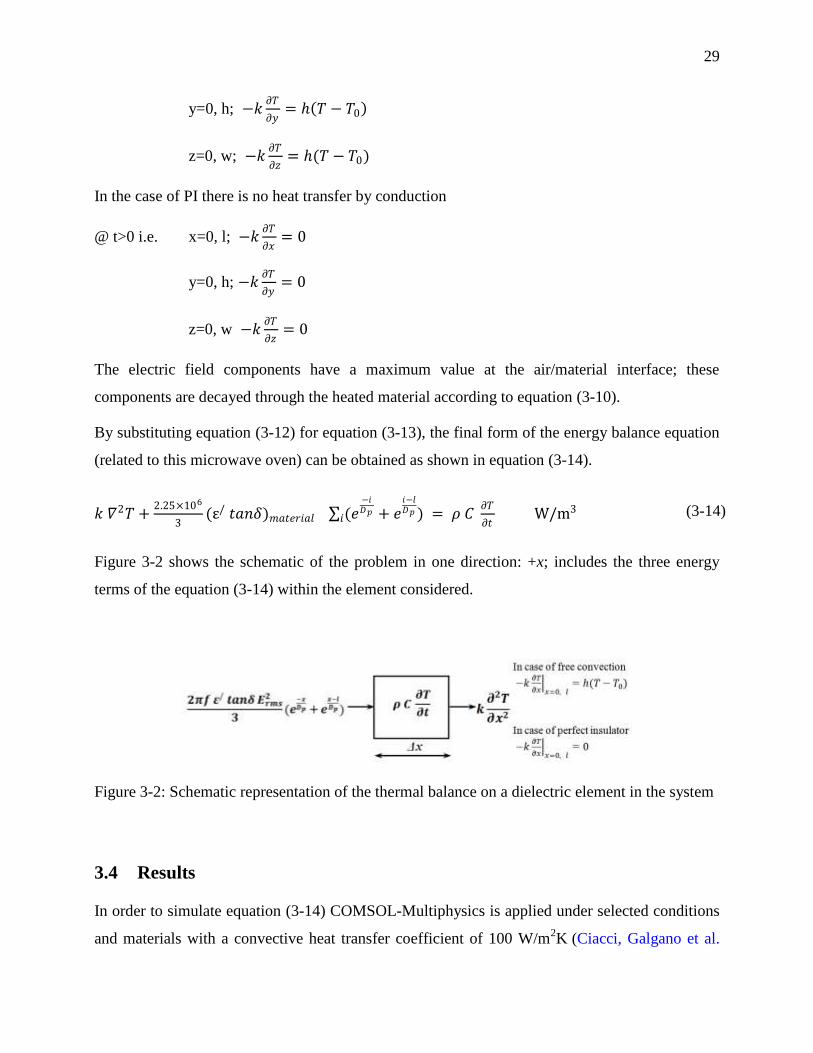
29
y=0, h; −𝑘𝜕𝑇
𝜕𝑦= 𝑇 − 𝑇0
z=0, w; −𝑘𝜕𝑇
𝜕𝑧= (𝑇 − 𝑇0)
In the case of PI there is no heat transfer by conduction
@ t>0 i.e. x=0, l; −𝑘𝜕𝑇
𝜕𝑥= 0
y=0, h; −𝑘𝜕𝑇
𝜕𝑦= 0
z=0, w −𝑘𝜕𝑇
𝜕𝑧= 0
The electric field components have a maximum value at the air/material interface; these
components are decayed through the heated material according to equation (3-10).
By substituting equation (3-12) for equation (3-13), the final form of the energy balance equation
(related to this microwave oven) can be obtained as shown in equation (3-14).
𝑘 𝛻2𝑇 +2.25×10⁶
3(ε/ 𝑡𝑎𝑛𝛿)𝑚𝑎𝑡𝑒𝑟𝑖𝑎𝑙 (𝑒
−𝑖𝐷𝑝
𝑖 + 𝑒𝑖−𝑙𝐷𝑝 ) = 𝜌 𝐶
𝜕𝑇
𝜕𝑡 W/m3 (3-14)
Figure 3-2 shows the schematic of the problem in one direction: +x; includes the three energy
terms of the equation (3-14) within the element considered.
Figure 3-2: Schematic representation of the thermal balance on a dielectric element in the system
3.4 Results
In order to simulate equation (3-14) COMSOL-Multiphysics is applied under selected conditions
and materials with a convective heat transfer coefficient of 100 W/m2K
(Ciacci, Galgano et al.
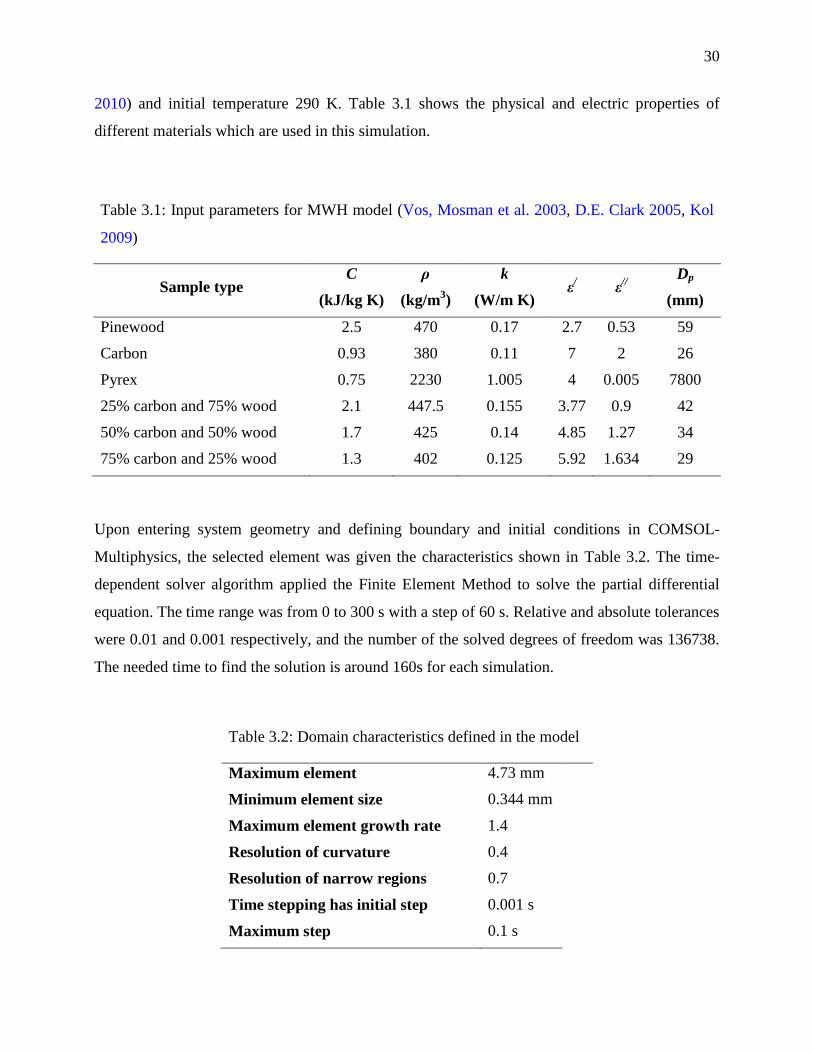
30
2010) and initial temperature 290 K. Table 3.1 shows the physical and electric properties of
different materials which are used in this simulation.
Table 3.1: Input parameters for MWH model (Vos, Mosman et al. 2003, D.E. Clark 2005, Kol
2009)
Sample type C
(kJ/kg K)
ρ
(kg/m3)
k
(W/m K) ε
/ ε
//
Dp
(mm)
Pinewood 2.5 470 0.17 2.7 0.53 59
Carbon 0.93 380 0.11 7 2 26
Pyrex 0.75 2230 1.005 4 0.005 7800
25% carbon and 75% wood 2.1 447.5 0.155 3.77 0.9 42
50% carbon and 50% wood 1.7 425 0.14 4.85 1.27 34
75% carbon and 25% wood 1.3 402 0.125 5.92 1.634 29
Upon entering system geometry and defining boundary and initial conditions in COMSOL-
Multiphysics, the selected element was given the characteristics shown in Table 3.2. The time-
dependent solver algorithm applied the Finite Element Method to solve the partial differential
equation. The time range was from 0 to 300 s with a step of 60 s. Relative and absolute tolerances
were 0.01 and 0.001 respectively, and the number of the solved degrees of freedom was 136738.
The needed time to find the solution is around 160s for each simulation.
Table 3.2: Domain characteristics defined in the model
Maximum element 4.73 mm
Minimum element size 0.344 mm
Maximum element growth rate 1.4
Resolution of curvature 0.4
Resolution of narrow regions 0.7
Time stepping has initial step 0.001 s
Maximum step 0.1 s
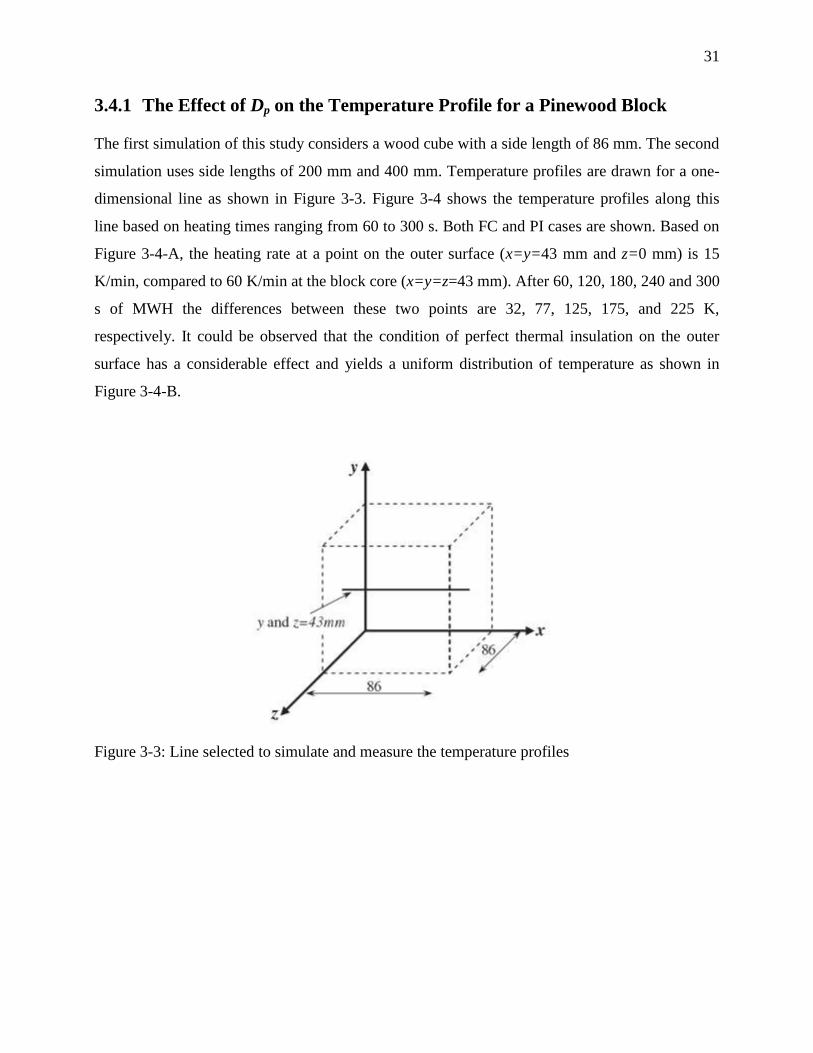
31
3.4.1 The Effect of Dp on the Temperature Profile for a Pinewood Block
The first simulation of this study considers a wood cube with a side length of 86 mm. The second
simulation uses side lengths of 200 mm and 400 mm. Temperature profiles are drawn for a one-
dimensional line as shown in Figure 3-3. Figure 3-4 shows the temperature profiles along this
line based on heating times ranging from 60 to 300 s. Both FC and PI cases are shown. Based on
Figure 3-4-A, the heating rate at a point on the outer surface (x=y=43 mm and z=0 mm) is 15
K/min, compared to 60 K/min at the block core (x=y=z=43 mm). After 60, 120, 180, 240 and 300
s of MWH the differences between these two points are 32, 77, 125, 175, and 225 K,
respectively. It could be observed that the condition of perfect thermal insulation on the outer
surface has a considerable effect and yields a uniform distribution of temperature as shown in
Figure 3-4-B.
Figure 3-3: Line selected to simulate and measure the temperature profiles

32
(A) (B)
Figure 3-4: Temperature profiles on the selected line parallel to x axis and has 43 mm in y & z
axis (time in seconds): (A) With FC and (B) With PI
In order to study the effect of long heating times, temperature profiles were generated in the case
of FC, as shown in Figure 3-5. These suggest that as heating time increases a parabolic profile
replaces the flat section, indicating a considerable temperature difference between the surface and
the core of the block.
Figure 3-5: The effect of heating time at constant microwave power on temperature profiles

33
Figure 3-6-A presents the temperature profile for a block with a 200 mm side length. Compared
to the smaller block presented earlier (86 mm); the temperature profile has a noticeably different
shape. In fact, larger dimensions emphasize the effect of penetration depth where the local power
density diminishes exponentially with distance. The fine balance between convection on the
surface and heat generation (Beer-Lambert law) yields a maximum value a few centimeters
below the surface and not in the core.
Penetration depth for wood is around 60 mm. For the smaller block (86 mm), the side length is
less than twice the wood Dp value, and will therefore experience full power density as the waves
penetrate 60 mm from each face. Increasing the side length illustrates the impact of the Dp value
and explains why it has a non-negligible effect on the temperature profiles with larger wood
blocks (200 mm and 400 mm).
(A) (B)
Figure 3-6: Temperature profiles for FC: (A) For 200 mm cube side length and (B) For 400 mm
cube side length
To investigate the effect of thermal conductivity (k) of the target material, the model was
resolved for two values of thermal conductivity: 0.25 and 0.5 W/m K. The results are shown in
Figure 3-7 and compared to the thermal conductivity of 0.17 W/m K. It is observed that the

34
maximum temperature decreases with increasing k as a result of heat transfer by conduction. It is
also clear that the effect of the thermal conductivity on the temperature gradient is negligible
compared to the effect of Dp.
(A) (B)
Figure 3-7: The effect of thermal conductivity values on Dp: (A) k=0.25 and (B) k=0.5
3.4.2 The Effect of Different Material Types
3.4.3 The Effect of Adding Material with Stronger Interaction with the EMW
Carbon is one of the materials that strongly absorb microwaves and convert them to heat. Table
3.1 presents selected physical and electric properties of Carbon. In comparison, pinewood and
carbon have a value of ε/ =7 and ε// =2 (Vos, Mosman et al. 2003), and of ε/= 2.7 and ε// =0.5 for
pinewood, respectively (Kol 2009). Therefore, carbon offers better interaction with microwaves
than pinewood as a result of larger values. Furthermore, its density and heat capacity are about
3/4 and 1/3 the values of pinewood, respectively. Therefore carbon can be used as a good
microwave thermal catalyst because it will focalize the energy generated by MWH (Menéndez,
Domínguez et al. 2004). Three studies have been performed to further investigate the effect of
carbon additives as well as the effect of various concentrations on the temperature profiles.

35
3.4.4 The Effect of Replacing a Fraction of the Wood Block with Carbon
In this study, the block material is assumed to be a homogeneous composite of pinewood and
carbon at two different ratios: 50% and 75% by weight. The physical and electric properties of
the new mixture are calculated assuming a linear relationship between the percentage of carbon
in the mixture as presented in equation (3-15),
𝑃𝑚 = 𝑥𝐶 𝑃𝑐 + (1 − 𝑥𝐶) 𝑃𝑤 (3-15)
where pm, pc, and pw are properties of the new mixture, carbon and pinewood, respectively
While xC is the percentage of carbon in the mixture.
(A) (B)
Figure 3-8: Effect of substituting wood with carbon over 300 s of MWH: (A) 50 wt-% carbon
and (B) 75 wt-% carbon
The change on temperature profile as an effect of carbon replacing wood in the block could be
seen in Figure 3-8. The baseline case (0% carbon) is presented in Figure 3-4-A. Based on values
along the core (centerline), the baseline has a heating rate of 60 K/min and reaches up to 140
K/min and 212 K/min for the 50% and 75% carbon cases, respectively. Therefore, theoretically,
the replacing 50% of the wood with leads to doubling the heating rate compared to pinewood,
while the 75% replacement yields triple the rate. By increasing the carbon percentage from 0 to
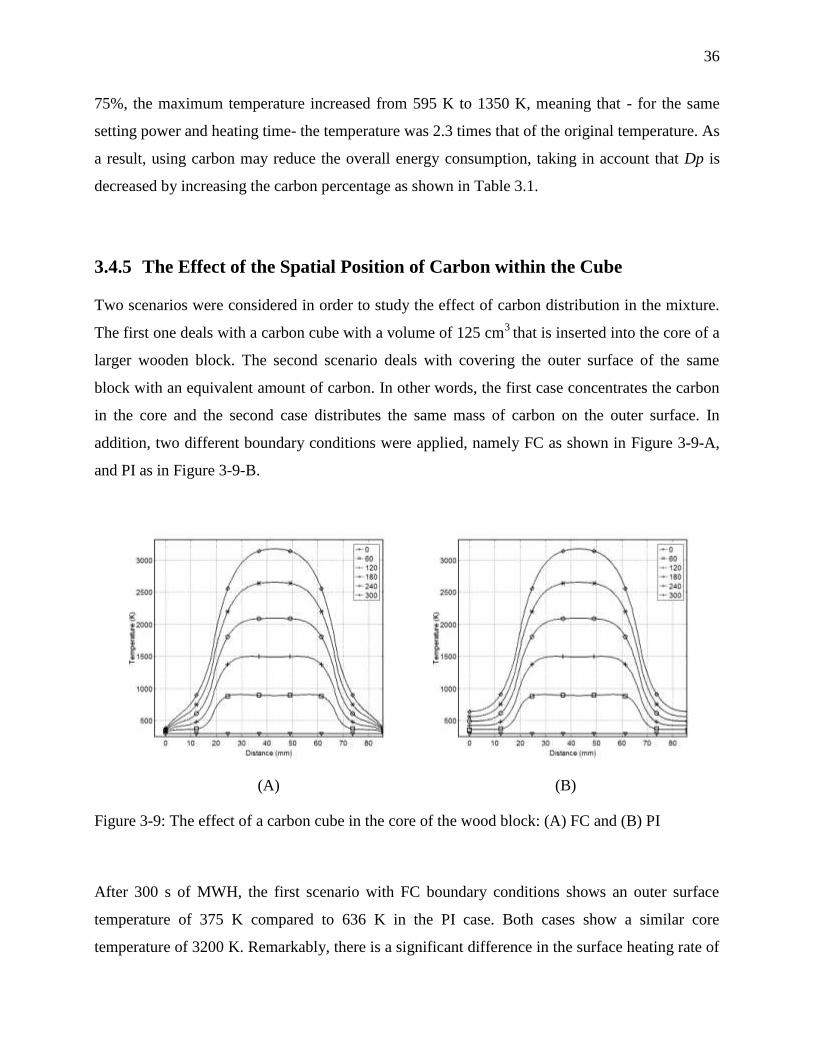
36
75%, the maximum temperature increased from 595 K to 1350 K, meaning that - for the same
setting power and heating time- the temperature was 2.3 times that of the original temperature. As
a result, using carbon may reduce the overall energy consumption, taking in account that Dp is
decreased by increasing the carbon percentage as shown in Table 3.1.
3.4.5 The Effect of the Spatial Position of Carbon within the Cube
Two scenarios were considered in order to study the effect of carbon distribution in the mixture.
The first one deals with a carbon cube with a volume of 125 cm3
that is inserted into the core of a
larger wooden block. The second scenario deals with covering the outer surface of the same
block with an equivalent amount of carbon. In other words, the first case concentrates the carbon
in the core and the second case distributes the same mass of carbon on the outer surface. In
addition, two different boundary conditions were applied, namely FC as shown in Figure 3-9-A,
and PI as in Figure 3-9-B.
(A) (B)
Figure 3-9: The effect of a carbon cube in the core of the wood block: (A) FC and (B) PI
After 300 s of MWH, the first scenario with FC boundary conditions shows an outer surface
temperature of 375 K compared to 636 K in the PI case. Both cases show a similar core
temperature of 3200 K. Remarkably, there is a significant difference in the surface heating rate of
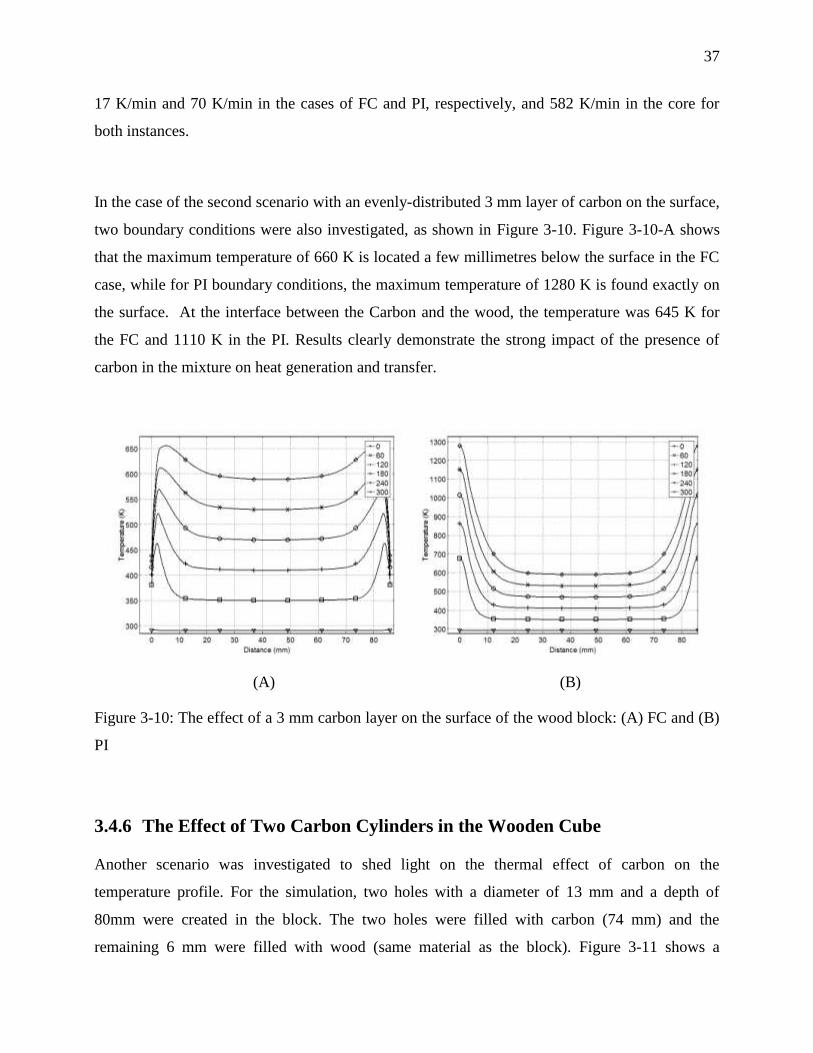
37
17 K/min and 70 K/min in the cases of FC and PI, respectively, and 582 K/min in the core for
both instances.
In the case of the second scenario with an evenly-distributed 3 mm layer of carbon on the surface,
two boundary conditions were also investigated, as shown in Figure 3-10. Figure 3-10-A shows
that the maximum temperature of 660 K is located a few millimetres below the surface in the FC
case, while for PI boundary conditions, the maximum temperature of 1280 K is found exactly on
the surface. At the interface between the Carbon and the wood, the temperature was 645 K for
the FC and 1110 K in the PI. Results clearly demonstrate the strong impact of the presence of
carbon in the mixture on heat generation and transfer.
(A) (B)
Figure 3-10: The effect of a 3 mm carbon layer on the surface of the wood block: (A) FC and (B)
PI
3.4.6 The Effect of Two Carbon Cylinders in the Wooden Cube
Another scenario was investigated to shed light on the thermal effect of carbon on the
temperature profile. For the simulation, two holes with a diameter of 13 mm and a depth of
80mm were created in the block. The two holes were filled with carbon (74 mm) and the
remaining 6 mm were filled with wood (same material as the block). Figure 3-11 shows a

38
representation of this setup. Temperatures were measured in five different locations: two on the
outer surfaces (A&E), one in the core (C) and the last two in the interface between the carbon
cylinders and the sawdust (B&D). Figure 3-12-A shows the profiles at these five locations, while
Figure 3-12-B shows the profiles at the center line. The center of the carbon cylinder reached a
higher temperature of 1345 K, as opposed to that in the interface which reached 970 K. Within
6.5 mm there is a temperature ratio of about 1.5 times the interface value.
Figure 3-11: Wood block with two holes (D=13 mm)
(A) (B)
Figure 3-12: Temperature profiles in the case of two carbon cylinders inside the wood block: (A)
At the five points (A, B, C, D, and E) and (B) at the block center line

39
3.4.7 The Effect of Replacing a Fraction of the Wood with Materials of Weak
Interaction with EMW
Pyrex is one of the materials those exhibit weak interactions with EMW at 2.45 GHz. Pyrex has
constants of ε/=4 and ε//=0.005 (D.E. Clark 2005). We reproduced the simulations outlined in
the previous sections but replaced the carbon core with Pyrex. Figure 3-13 shows the temperature
profiles obtained with the same two boundary conditions (FC and PI). In both cases, the core did
not exhibit any change in temperature (324 K) while the surface reached 365 K and 605 K for FC
and PI, respectively. These results are due to the negligible EMW/Pyrex interaction. Moreover,
Pyrex has low thermal conductivity; therefore its core had low temperature.
(A) (B)
Figure 3-13: Effect of a Pyrex cube in the wood block core: (A) FC and (B) PI
3.5 Experimental Validation of the Model
Two experimental setups were used for validation. In the first, three experiments were carried
out. In each case, a wood cube (86 mm) was heated inside a microwave oven for selected time
intervals (60, 120, or 180 s). At the end of the heating period, the cube is removed from the
microwave oven and five K-type thermocouples quickly inserted at five points: 0, 21.5, 43, 64.5,
and 86 mm. Thermocouples were connected to Data acquisition (OMB-DAQ-3000 Series) to
record the temperature values directly at a rate of 6 readings per second. Figure 3-14 shows the
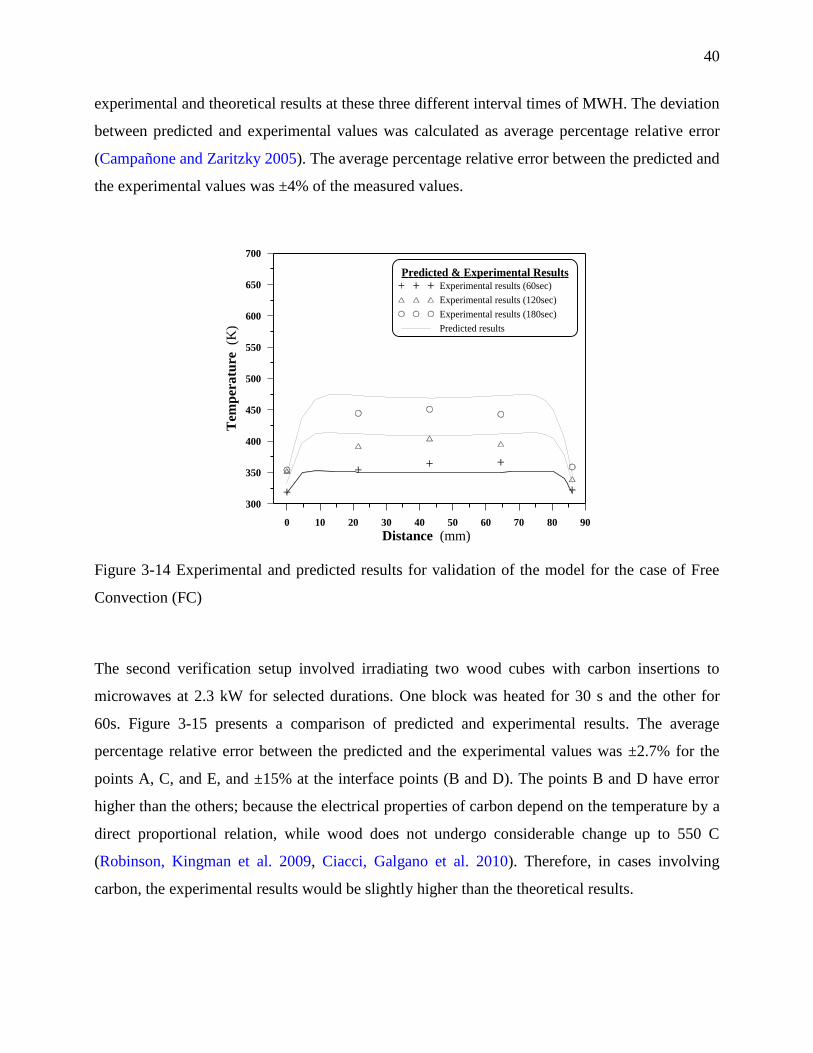
40
experimental and theoretical results at these three different interval times of MWH. The deviation
between predicted and experimental values was calculated as average percentage relative error
(Campañone and Zaritzky 2005). The average percentage relative error between the predicted and
the experimental values was ±4% of the measured values.
0 10 20 30 40 50 60 70 80 90
Distance (mm)
300
350
400
450
500
550
600
650
700
Tem
per
atu
re
(K)
Predicted & Experimental ResultsExperimental results (60sec)
Experimental results (120sec)
Experimental results (180sec)
Predicted results
Figure 3-14 Experimental and predicted results for validation of the model for the case of Free
Convection (FC)
The second verification setup involved irradiating two wood cubes with carbon insertions to
microwaves at 2.3 kW for selected durations. One block was heated for 30 s and the other for
60s. Figure 3-15 presents a comparison of predicted and experimental results. The average
percentage relative error between the predicted and the experimental values was ±2.7% for the
points A, C, and E, and ±15% at the interface points (B and D). The points B and D have error
higher than the others; because the electrical properties of carbon depend on the temperature by a
direct proportional relation, while wood does not undergo considerable change up to 550 C
(Robinson, Kingman et al. 2009, Ciacci, Galgano et al. 2010). Therefore, in cases involving
carbon, the experimental results would be slightly higher than the theoretical results.

41
0 10 20 30 40 50 60 70 80 90
Distance (mm)
250
300
350
400
450
500
550
600
650
700
750
800
Tem
per
atu
re
(K)
Predicted & Experimental Results
Experimental results (30sec)
Experimental results (60sec)
Predicted results
Figure 3-15: Experimental and theoretical results for verification of the model in the case of a
wood block with two carbon cylinders
3.6 Conclusion and Future Developments
A three-dimensional mathematical model to predict/control transient temperature profiles within
selected materials exposed to MWH at 2.45 GHz has been developed, solved by COMSOL-
Multiphysics for different scenarios, and validated.
Key conclusions of this work include:
MWH leads to non-uniform distribution of temperature which is strongly affected by
penetration depth (Dp) and surface heat loss.
Limiting dimensions of the payload to twice Dp, and placing strong thermal insulation on
the surface may minimize temperature gradients significantly.
Choice of location of materials with contrasting levels of microwave-to-heat conversion
may be used to create desired cold/hot zones and achieve a specific temperature profile in
the workload.
Homogenous mixing of materials which are strong microwave-to-heat converters with the
payload leads to maintaining the shape of the temperature profile while exhibiting a
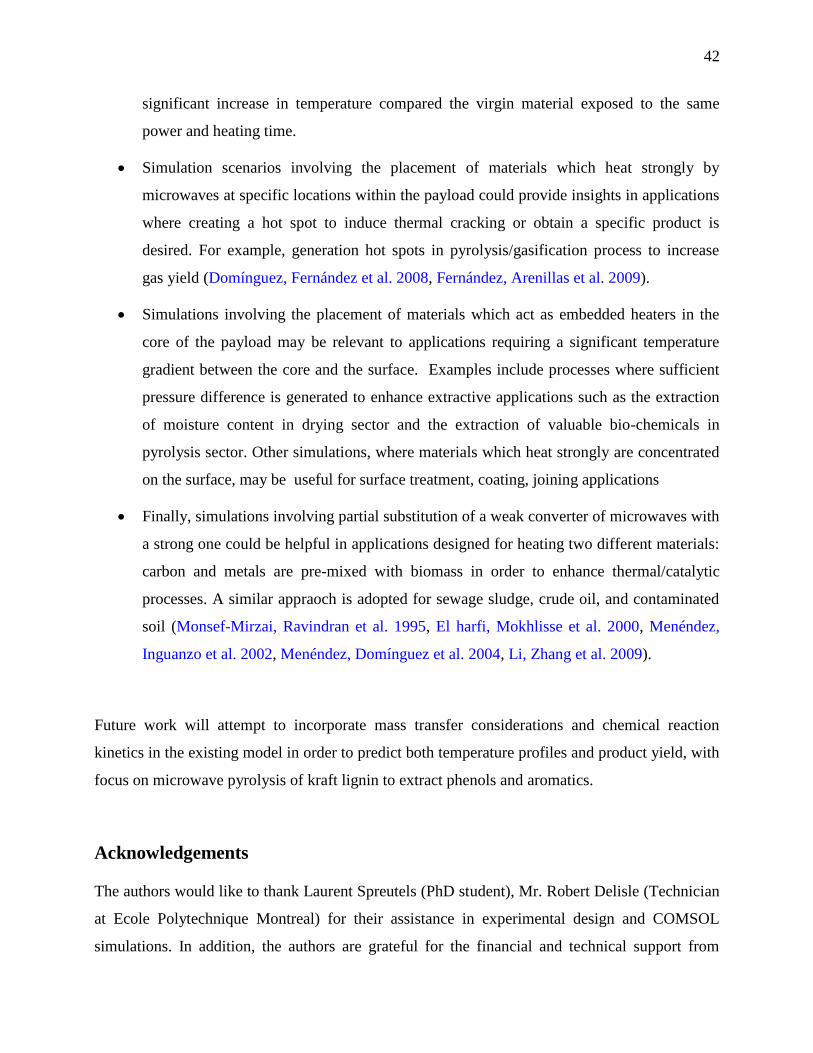
42
significant increase in temperature compared the virgin material exposed to the same
power and heating time.
Simulation scenarios involving the placement of materials which heat strongly by
microwaves at specific locations within the payload could provide insights in applications
where creating a hot spot to induce thermal cracking or obtain a specific product is
desired. For example, generation hot spots in pyrolysis/gasification process to increase
gas yield (Domínguez, Fernández et al. 2008, Fernández, Arenillas et al. 2009).
Simulations involving the placement of materials which act as embedded heaters in the
core of the payload may be relevant to applications requiring a significant temperature
gradient between the core and the surface. Examples include processes where sufficient
pressure difference is generated to enhance extractive applications such as the extraction
of moisture content in drying sector and the extraction of valuable bio-chemicals in
pyrolysis sector. Other simulations, where materials which heat strongly are concentrated
on the surface, may be useful for surface treatment, coating, joining applications
Finally, simulations involving partial substitution of a weak converter of microwaves with
a strong one could be helpful in applications designed for heating two different materials:
carbon and metals are pre-mixed with biomass in order to enhance thermal/catalytic
processes. A similar appraoch is adopted for sewage sludge, crude oil, and contaminated
soil (Monsef-Mirzai, Ravindran et al. 1995, El harfi, Mokhlisse et al. 2000, Menéndez,
Inguanzo et al. 2002, Menéndez, Domínguez et al. 2004, Li, Zhang et al. 2009).
Future work will attempt to incorporate mass transfer considerations and chemical reaction
kinetics in the existing model in order to predict both temperature profiles and product yield, with
focus on microwave pyrolysis of kraft lignin to extract phenols and aromatics.
Acknowledgements
The authors would like to thank Laurent Spreutels (PhD student), Mr. Robert Delisle (Technician
at Ecole Polytechnique Montreal) for their assistance in experimental design and COMSOL
simulations. In addition, the authors are grateful for the financial and technical support from

43
Canadian research networks: LIGNOWORKS (lignoworks.ca), and the (Agricultural Biorefinery
Innovation Network) ABIN.

44
CHAPTER 4 ARTICLE 2: A KINETIC INVESTIGATION OF
MICROWAVE PYROLYSIS OF SAWDUST USING AN ORIGINAL
MICROWAVE –THERMOGRAVIMETRIC ANALYZER
Sherif Farag and Jamal Chaouki
aCRIP-Biorefinery Centre, Department of Chemical Engineering, École Polytechnique de Montréal.
P.O. Box 6079, Station Centre-ville, Montréal, QC, Canada H3C 3A7.
(Submitted in Journal of Analytical and Applied Pyrolysis)
Presentation of the article: In this article, a kinetic investigation of microwave pyrolysis of
sawdust in contrast to conventional pyrolysis will be presented. To accomplish this investigation,
an original microwave thermogravimetric analyzer equipped with an innovated thermometer was
built. The kinetics parameters in both cases were estimated and subsequently used to compare the
predicted results against the experimental data.

45
Abstract
The main objective of this work is to investigate reaction kinetics of microwave-pyrolysis
(MWP) of sawdust in contrast to conventional pyrolysis (CP). To achieve this objective, an
original microwave thermo-gravimetric-analyzer was built and equipped with an innovated
thermometer. This thermometer does not suffer from the traditional thermometer drawbacks. The
kinetic parameters, activation energy, pre-exponential factor, and reaction order (Ea, ko, and n),
were estimated using a MATLAB® program code. The obtained result demonstrates that the
estimated value of ko in MWP is around three-times that of CP. Accordingly, MWP may have a
faster reaction rate than that of CP. This could be due to the molecular chaotic motion resulting
from the oscillating-electromagnetic-waves. Nevertheless, this tangible effect on ko, the estimated
value of Ea is almost the same in the two cases. This may be related to the wavelength of the
oscillating-electromagnetic-waves, which is much longer than the intermolecular-distance of the
heated material.
Keywords: Microwave Heating, Thermo-gravimetric Analyzer, Microwave-Thermo-gravimetric
Analyzer, Microwave Pyrolysis, and Reaction Kinetics.

46
4.1 Introduction
Microwave heating (MWH) is a volumetric energy conversion mechanism which is the result of
agitating the dipoles of the heated material due to exposure to an alternating electromagnetic
field. Under controlled conditions, MWH demonstrates some advantages in contrast to
conventional heating (CH), e.g., temperature gradients inside and outside the heated material, and
no direct contact between the heated material and the heating source. Further information
regarding MWH was reported in Farag, S., et al. (Farag, Sobhy et al. 2012).
For non-magnetic materials, the main parameter that describes how EMW are converted to
thermal energy is called complex permittivity (휀∗). It is defined in equation (4-1) (Camelia
Gabriel and Mingosb 1998, Clark, Folz et al. 2000, Durka, Gerven et al. 2009, Castro-Giráldez,
Fito et al. 2010, Guo, Wang et al. 2010, Farag, Sobhy et al. 2012). The real part of 휀∗ is called the
dielectric constant, while the imaginary part is called the loss factor.
휀∗ = 휀/ − j휀// (4-1)
Loss tangent (𝑡𝑎𝑛𝛿) is defined by the ratio between the imaginary and the real parts as in
equation (4-2). To maximize conversion of EMW to thermal energy 𝑡𝑎𝑛𝛿 should be chosen with
a high value (Monsef-Mirzai, Ravindran et al. 1995, Menéndez, Domínguez et al. 2004, Li,
Zhang et al. 2009).
𝑡𝑎𝑛𝛿 =휀//
휀/ (4-2)
The power absorbed by the heated material decays exponentially according to Lambert’s law as
in equation (4-3) (Zhou, Puri et al. 1995, Bail, Koutchma et al. 2000, Yang and Gunasekaran
2001, Rattanadecho 2006). Where Dp is the power penetration depth, and y is the measured
distance from the outer surface.
𝑃 = 𝑃𝑜 𝑒(−𝑦𝐷𝑝
) (4-3)

47
In the scientific literature, a great effort has been made to investigate effects of MWH on
chemical reactions. Most of the reported effects were observed on reaction rate, product quality,
and energy consumption. Table 4.1 shows some of the reported effects in different reactions.
Table 4.1: Summary of the effects of MWH on different reactions
The authors and objective Conclusion
Chandra Shekara, Jai Prakash et al. 2012
(Chandra Shekara, Jai Prakash et al. 2012)
Solventless acylation of p-cresol with
different carboxylic acids over BEA zeolite
MWH achieves more conversion in contrast to
CH: 50-80% compared to less than 20% in CH
Paixão, Monteiro et al. 2011 (Paixão,
Monteiro et al. 2011)
Modification of MOR zeolites via
desilication treatments with NaOH
MWH is promoting Si extraction from the
zeolite framework without a significant loss in
crystallinity,
MWH allows modification of the porosity of
samples,
MWH is faster with less energy consumption
compared to CH
Patil, Gude et al. 2011(Patil, Gude et al.
2011)
Transesterification of Camelina sativa oil
using metal oxide catalysts
In MWH, the reaction rate constants are two
orders of magnitude higher than those obtained
with CH
Zhang and Zhao 2010 (Zhang and Zhao
2010)
Production of 5-hydroxymethylfurfural
and furfural from lignocellulosic biomass
(Corn stalk, rice straw, and pine wood) in
an ionic liquid
MWH increases product yield and decreases
reaction time
Pan, Wu et al. 2009 (Pan, Wu et al. 2009)
Preparation of platinum dioxide
nanoparticles via MWH and CH.
The obtained nanoparticles via MWH are smaller
and more narrowly distributed than those
obtained by CH,
In the hydrogenation of cyclohexene the
obtained particles have a higher catalytic activity

48
than those obtained by CH
Budarin, Clark et al. 2009 (Budarin, Clark
et al. 2009)
Preparation of high-grade bio-oils by
MWP of wheat straw as a pellet form
The produced oil via MWP contains few
impurities and is rich in aromatics compared to
the other oil produced by the conventional
methods
Zhou, Zhong et al. 2009 (Zhou, Zhong et
al. 2009)
Crystallization of zeolite T using MWH as
well as CH
MWH has a faster reaction than that in CH
Guiotoku, Rambo et al. 2009 (Guiotoku,
Rambo et al. 2009)
Investigating of hydrothermal
carbonization of Pine sawdust and
cellulose
MWH increases the carbonization yield
Krzan and Zagar 2009 (Krzan and Zagar
2009)
Liquefaction of wood with glycols using p-
toluenesulfonic acid as a catalyst
MWH decreases liquefaction time with
minimum catalyst use
Dogan and Hilmioglu 2009 (Dogan and
Hilmioglu 2009)
Dissolution of cellulose in N-
methylmorpholine-N-oxide.
MWH has a shorter time compared to the
traditional methods
Sithambaram, Nyutu et al. 2008
(Sithambaram, Nyutu et al. 2008)
K-OMS catalyzed oxidation of tetralin
MWH enhances the conversion compared to CH:
(52–88%), and (42–80%), respectively
Orozco, Ahmad et al. 2007
(Orozco,
Ahmad et al. 2007)
Studying dilution of grass and cellulose in
phosphoric acid at different concentrations
with water
MWH produces high yields of glucose in a short
time compared to the traditional methods.
MWH has a high reaction rate at moderate
temperature, which prevents the formation of hot
spots.
Karthikeyan, Balasubramanian et al. 2006
(Karthikeyan, Balasubramanian et al.
2006)
Polycyclic aromatic hydrocarbon
extraction from airborne particles
The extraction time in MWH can be completed
in minutes compared to hours as in the
traditional methods, with more different
chemical components.
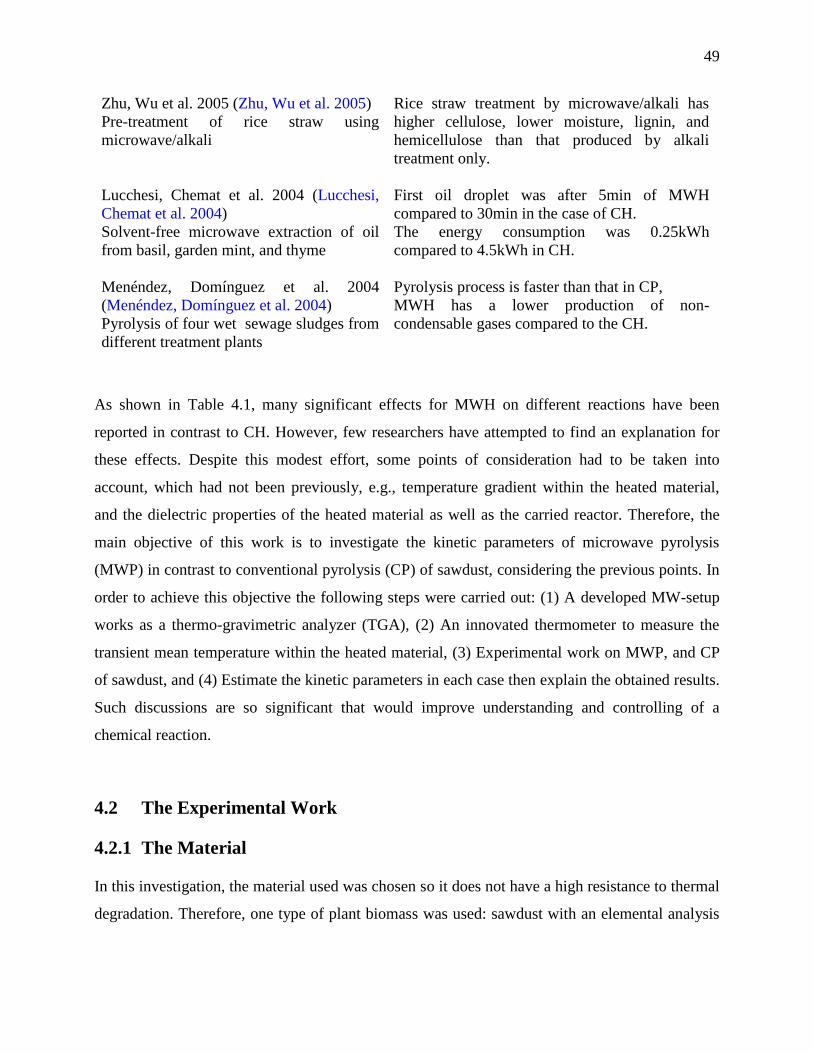
49
As shown in Table 4.1, many significant effects for MWH on different reactions have been
reported in contrast to CH. However, few researchers have attempted to find an explanation for
these effects. Despite this modest effort, some points of consideration had to be taken into
account, which had not been previously, e.g., temperature gradient within the heated material,
and the dielectric properties of the heated material as well as the carried reactor. Therefore, the
main objective of this work is to investigate the kinetic parameters of microwave pyrolysis
(MWP) in contrast to conventional pyrolysis (CP) of sawdust, considering the previous points. In
order to achieve this objective the following steps were carried out: (1) A developed MW-setup
works as a thermo-gravimetric analyzer (TGA), (2) An innovated thermometer to measure the
transient mean temperature within the heated material, (3) Experimental work on MWP, and CP
of sawdust, and (4) Estimate the kinetic parameters in each case then explain the obtained results.
Such discussions are so significant that would improve understanding and controlling of a
chemical reaction.
4.2 The Experimental Work
4.2.1 The Material
In this investigation, the material used was chosen so it does not have a high resistance to thermal
degradation. Therefore, one type of plant biomass was used: sawdust with an elemental analysis
Zhu, Wu et al. 2005 (Zhu, Wu et al. 2005)
Pre-treatment of rice straw using
microwave/alkali
Rice straw treatment by microwave/alkali has
higher cellulose, lower moisture, lignin, and
hemicellulose than that produced by alkali
treatment only.
Lucchesi, Chemat et al. 2004 (Lucchesi,
Chemat et al. 2004)
Solvent-free microwave extraction of oil
from basil, garden mint, and thyme
First oil droplet was after 5min of MWH
compared to 30min in the case of CH.
The energy consumption was 0.25kWh
compared to 4.5kWh in CH.
Menéndez, Domínguez et al. 2004
(Menéndez, Domínguez et al. 2004)
Pyrolysis of four wet sewage sludges from
different treatment plants
Pyrolysis process is faster than that in CP,
MWH has a lower production of non-
condensable gases compared to the CH.

50
of C=48.3%, H=6.22%, O=45.2%, N=0.22% and S=0, and proximate analysis of Char=16%,
Volatile= 81%, and Ash=2.9%.
4.2.2 The Experimental Setup
The experimental work was carried out in a bench scale microwave oven (MW-O) (Microwave
Research Inc; Model: BP-211, 230 V, 2.45 GHz, and power setting up to 3.2 kW). Two opposing
holes were drilled into the oven side-walls, 24 mm in diameter, to connect the inlet and outlet
lines to the reactance carried reactor as well as to enable visual access during the heating process.
An alumina box (muffle) was used inside the oven cavity to protect the oven’s electronic devices
from the emitted heat or unwanted/unexpected explosions, or combustion during the MWP. The
dimensions of the oven cavity are 510×250×320 mm, whereas the dimensions of the muffle are
390×180×170 mm. A Pyrex cylinder semi-batch reactor with a volume of 0.37 l was used inside
the muffle. Limitations of the penetration depth were carefully considered while designing the
used reactor and choosing the sample weight.
In order to achieve the main objective of this work two modifications were made to make this
traditional MW-O work as a TGA with MWH rather than CH, which explains why it is called
MW-TGA. The first modification makes it possible to measure weight-loss of the heated material
during exposure to EMW. This was done by connecting the carrier reactor with a scale (Denever
Instrument; Model: SI-2002, Weighting capacity: 2000 g, Readability: 0.01 g, Repeatability
<±0.01 g, Linearity: <±0.02 g, and Response time (average): 1.1 s) fixed on the top of the MW-O
via the two opposite holes as shown in Figure 4-1.
The total weight of the designed system, i.e., the reactor, the long bar, and the suspension wires,
is ≈ 800 g. This weight, however, does not affect the measurements because the key parameter is
the characteristics of the scale used. The scale capacity is 2000 g and the readability is 0.01 g,
i.e., as long as the total weight of the designed system and the sample is less than 2000 g, this
system can be used.

51
Figure 4-1: The microwave thermo-gravimetric analyzer setup
Specific procedures were followed to load a sample into the MW-TGA. First, the reactor was
filled with the virgin material via the left side port, outside the oven cavity. Second, it was
inserted inside the muffle-cavity, and the two side tubes were connected, with male/female
connections. Third, the air-thermometer (it will be explained in details in the next section) was
inserted carefully inside the right-side tube after which the whole system was suspended using
the wires that were connected with the metallic bar. Then, the signal cables of the scale and the
pressure transducer were connected, as shown in Figure 4-1. Finally, the traditional procedures of
pyrolysis as in the conventional TGA were implemented, as will be mentioned later. To insure
the re-productivity, the experiments in CP and MWP were repeated and the average values will
be processed.
The second modification makes the MW-TGA possible to measure transient mean temperature
within the heated material. The following section describes in detail this development.
4.3 The Development for Measuring the Transient Mean Temperature
The three most popular techniques used for measuring the temperature are the thermocouple, the
infrared, and the fiber optics thermometer. Using a thermocouple-thermometer inside a MW-O
and during the heating process is dangerous with low accuracy due to the metallic probe

52
interaction with EMW. The thermocouple-thermometer has been used in some publications
inside the MW-O but after switching off the oven-power (Zhang, Hayward et al. 2003, Lucchesi,
Chemat et al. 2004, Gunasekaran and Yang 2007, Ma 2009, Sun, Wang et al. 2012). It should be
noted that there is heat lost after switching off the oven-power. The infrared-thermometer is the
best way to measure the temperature without any contact between its probe and the heated
material. However, it measures surface temperature only; thus, it is suitable only for thin
materials. Moreover, it has high sensitivity to ambient conditions and reactor material; therefore,
it needs frequent recalibration (Stuerga and Gaillard 1996, Will, Scholz et al. 2003, Lucchesi,
Chemat et al. 2004, Menéndez, Domínguez et al. 2004). The fiber optics-thermometer has many
advantages compared to the previous two thermometers, e.g., frequent recalibration is not
necessary, it is independent of reactor material, and it can be used to measure the temperature at
any point within the heated material. However, it measures a point temperature, and special
attention must be paid to avoid damaging the probe (Durka, Van Gerven et al. 2009).
In order to solve this problem, an innovated thermometer to measure transient mean temperature
within a material exposed to EMW was made, called an air-thermometer. As shown in Figure
4-2, the air-thermometer consists of two Quartz tubes. The first one is used as a thermometer-
probe, while the second is used to transfer the pressure built-up inside the probe to a pressure
transducer (Dynisco Model: PT311, Fluch Giaphram pressure transducer, Range: 0-25 psi and
Accuracy: ±0.5% full scale). These tubes are made of Quartz to eliminate the interaction with
EMW: ε/ = 3.8, ε// = 0.0001, and tan δ=0.00003 @2.45GHz, while it is 1.006, 0.0, and 0.0,
respectively, for air (Durka, Van Gerven et al. 2009), which is used as a working media. To
record the built-up pressure signals directly, the pressure transducer is connected to a data
acquisition (OMB-DAQ-3000 Series, 1-MHz, 16Bit USB Data Acquisition Modules), and a
particular interface is used (OMEGASOFT Data Acquisition Software Rev7.0 501470B-01).

53
Figure 4-2: Drawing of the air-thermometer
A mathematical derivation was carried out to obtain a mathematical formula that connects the
pressure built-up and the probe surrounding-temperature. A type-K thermocouple was used to
validate this formula in a range from ambient temperature up to 1100 K, using a CH-oven. The
temperature values that were measured by the air-thermometer and the reference values that were
measured by the thermocouple were plotted against the heating time, as shown in Figure 4-3.
Figure 4-3: The measured and the reference temperature values vs. the heating time
0 20 40 60 80 100
Time [min]
200
300
400
500
600
700
800
900
1000
1100
Tem
per
atu
re
[K]
Thermocouple
Air-thermometer

54
The response time of the air-thermometer was investigated, using a CH-oven controlled by an
automatic controller. This controller works by switching on/off during the heating time, and then
compares the achieved temperature with the setting value. If the achieved-temperature is less
than the setting value, the controller switches On then Off again, etc. As shown in Figure 4-3, the
air thermometer follows each interval of heating with an acceptable response time. The deviation
between the measured and the reference temperatures was calculated as an average percentage
relative error (APRE) as in Farag, S., et al (Farag, Sobhy et al. 2012). APRE was ±5% of the
reference value. Above 850 K, some of the measured values have an error around 50 K, which
should be considered. Nonetheless, herein, the presented result is not really affected by this error
as the applied temperature range is not greater than 800 K. Besides, further effort is in progress to
improve the thermometer accuracy.
Another verification was done by comparing the measured values during the pyrolysis of sawdust
and the values predicted by the mathematical model that was published by Farag, S., et al. 2012
(Farag, Sobhy et al. 2012). This model was developed to be suitable for the geometry of the
heated material and the carrier reactor as well as the setting power that was used in this work. In
addition, the transient values of the physical and electric properties of sawdust were considered.
The predicted temperatures were obtained by applying the energy balance on an element with the
dimensions ∆x, ∆y, and ∆z from the heated material, using the set of boundaries and initial
conditions that were published in Farag, S., et al (Farag, Sobhy et al. 2012). Upon entering the
system geometry in COMSOL-Multiphysics, the time-dependent solver algorithm applied the
Finite Element Method to solve the partial differential equation of the energy balance, with a time
range from 0 to 320 s. Further details regarding this model were published in Farag, S., et al
(Farag, Sobhy et al. 2012).
The dielectric properties of sawdust were measured at a temperature range of 298-900 K, using a
―Microwave and millimeter-wave vector network analyzer‖ (Anritsu 37369D Microwave, 2-Port
Vector Network Analyzer, 40 MHz to 40 GHz), and a circular resonance cavity at 2.45 GHz. An
inert environment (N2) was kept during these measurements to keep the transient composition of
the material similar to that produced during the pyrolysis. A linear fitting was found for each step

55
as in equations (4-4) and (4-5) for the dielectric constant and the loss factor, respectively. The
obtained equations are only presented here, while the graphs are not presented.
휀 298−740 𝐾/
= 3 × 10⁻⁴𝑇 + 1.49
휀 740−900 𝐾/
= 4 × 10⁻³𝑇 − 1.42
(4-4)
휀 298−806 𝐾//
= 2.43 × 10⁻⁵𝑇 + 0.07
휀 806−900 𝐾//
= 5 × 10⁻³𝑇 − 4.05
(4-5)
The nearly-horizontal line (298-740K for ε/, and 298-806K for ε
//) represents the dielectric
properties during pyrolysis, while the rapid-increase line (740-900 K for ε/, and 806-900 K for ε
//)
represents when char is formed (The solid product from the pyrolysis of sawdust). Char has a
high interaction with EMW as its elemental composition is ≈90% carbon. Therefore, the
dielectric properties of sawdust increased rapidly once char is formed. This result is in agreement
with that was reported by Robinson, J.P., et al. 2009 (Robinson, Kingman et al. 2009).
Figure 4-4 illustrates the predicted axial transient temperature profiles within the sawdust, and
Figure 4-5 shows the transient mean values of these profiles compared to the measured values
using the air-thermometer. The APRE was ±6% of the measured value.
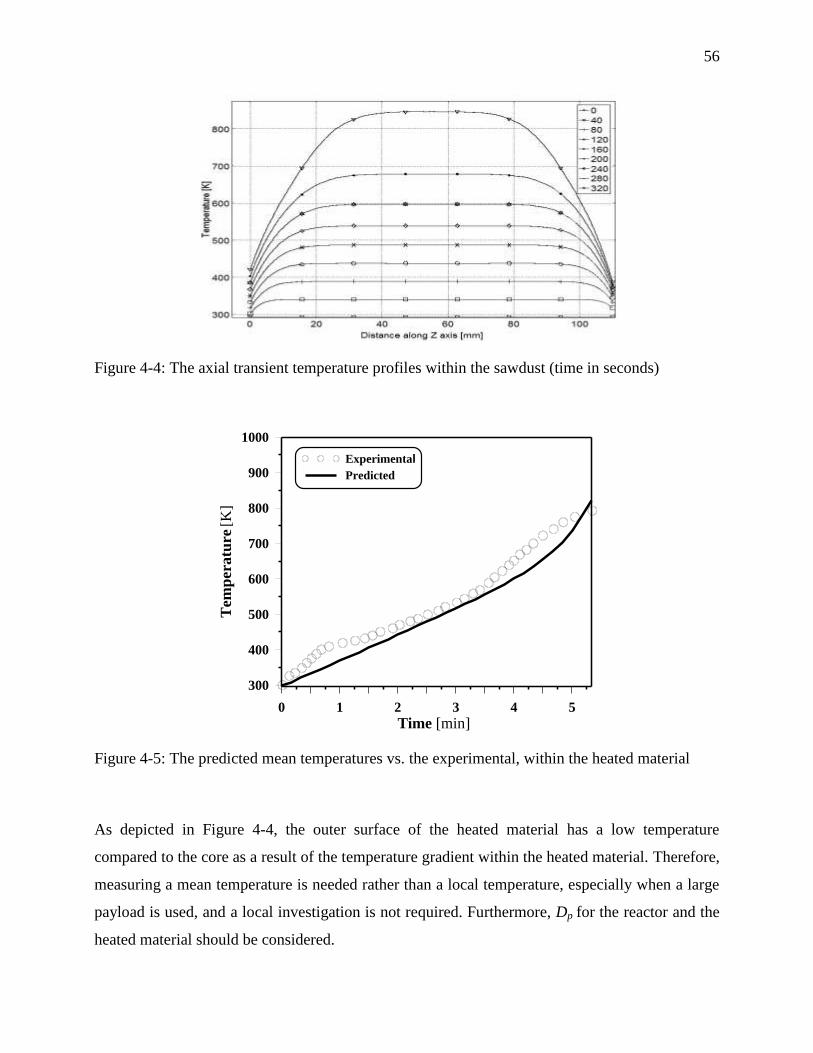
56
Figure 4-4: The axial transient temperature profiles within the sawdust (time in seconds)
0 1 2 3 4 5
Time [min]
300
400
500
600
700
800
900
1000
Tem
pera
ture
[K
]
Experimental
Predicted
Figure 4-5: The predicted mean temperatures vs. the experimental, within the heated material
As depicted in Figure 4-4, the outer surface of the heated material has a low temperature
compared to the core as a result of the temperature gradient within the heated material. Therefore,
measuring a mean temperature is needed rather than a local temperature, especially when a large
payload is used, and a local investigation is not required. Furthermore, Dp for the reactor and the
heated material should be considered.

57
4.4 The Conventional Pyrolysis Method
Conventional pyrolysis of sawdust was carried out in a TGA (TGA Q5000 Autosampler). The
crucible used was made of platinum with a height of ≈ 1mm and a diameter of ≈ 10mm. The
weight loss of the sample was measured during pyrolysis at atmospheric pressure and under
controlled inert gas flow and temperature. The following procedures were employed during
pyrolysis: the sample was placed at room temperature then heated in a nitrogen atmosphere with
a flow rate of 50 ml/min and a constant heating rate of 30 oC/min. Once the temperature reached
600 oC, an isothermal process was started for 5 min under the same inert gas flow rate, and then
the pyrolysis process was stopped.
Different experiments on sawdust at different initial masses (5, 10, 15 mg) and particle sizes (1
mm-355 µm) were carried out in a TGA by Radmanesh et al. 2006 (Radmanesh, Courbariaux et
al. 2006). The obtained results show no distinct change in weight loss curves for the different
initial weights and particle sizes used. In addition, as a preliminary step in this work different
initial masses (5 mg - 35 mg) were used in the CP, to extend the initial mass range used in
Radmanesh’s study. The same result was obtained; therefore, the used sample with the used
particle size is below the limit where inter- and intra-particle transformation may affect the
kinetics. As a result, the mass transfer limitations were not considered in this study.
The heat transfer limitations in the case of CP were investigated. The calculated Biot number was
less than 0.1, which means that heat transfer by conduction inside the heated material is higher
than heat transfer by convection. Therefore, heat transfer limitations were not considered in this
work as well.
4.5 The Kinetic Model
A kinetic model with n reaction order was employed to estimate kinetic parameters in the MWP
and CP of sawdust; as shown in equation (4-6).

58
𝑑𝑥
𝑑𝑡= 𝐾 (1 − 𝑥)𝑛 (4-6)
Where x is the decomposition fraction of the virgin material [-], and 𝐾 is the reaction rate
constant; it is defined by the Arrhenius equation, as in equation (4-7).
𝐾 = 𝑘𝑜 ∗ 𝑒
−𝐸𝑎𝑅
1𝑇
− 1𝑇𝑟 (4-7)
Where k0*= k0 exp(-Ea/R Tr); k0 is the pre-exponential factor [time
-1]; it represents of molecular
mobility and depends on molecule vibration frequency (Lidström, Tierney et al. 2001). Ea is the
activation energy [J/mol] that is needed to breakdown the molecule bonds. R is the universal gas
constant [J/mol K], T is the reaction temperature [K], and and Tr is a reference temperature [K],
600K. Therefore, equation (4-6) can be rewritten as shown in equation (4-8).
The decomposition fraction can be defined as in equation (4-9), where V is the weight lost up to
time t. It equals the difference between the initial weight (W0) and the weight at this time (Wt). V*
is the maximum available volatility from the virgin material and can be obtained by proximate
analysis.
𝑑𝑥
𝑑𝑡= 𝑘𝑜
∗ 𝑒−𝐸𝑎𝑅
1𝑇
− 1𝑇𝑟 (1 − 𝑥)𝑛 (4-8)
𝑥 =𝑊𝑜 −𝑊𝑡
𝑊𝑜 −𝑊∞
=𝑉
𝑉∗ (4-9)
In order to generalize this model to be independent of the pyrolysis heating rate (β), equation
(4-8)was divided by β, hence equation (4-8) is rewritten as in equation (4-10).
𝑑𝑥
𝑑𝑇=𝑘𝑜∗
𝛽 𝑒
−𝐸𝑎𝑅
1𝑇
− 1𝑇𝑟 (1 − 𝑥)𝑛 (4-10)

59
4.6 Parameter Estimation
Equation (4-10) was implemented in a MATLAB® program code. Multidimensional
unconstrained/constrained nonlinear minimization (MATLAB’s fminsearch/fminsearchbnd) was
used to estimate the model parameters (ko, Ea, and n) using the initial conditions obtained from
the experimental work. The optimum values of these parameters were chosen based on
minimizing the square difference between the predicated and the experimental results (xModel
and
xExp
). In addition, a contour map was performed to obtain an overall view of the complete suitable
values, and then the optimal ones were chosen.
To solve the non-linear ordinary differential equation, equation (4-10), MATLAB’s ODE45
using the default options was employed. The deviation of xModel
from xExp
was calculated
according to equation (4-12), where N is the number of fitted points (experimental points) and p
is the number of model parameters (Chen, Zhang et al. , Radmanesh, Courbariaux et al. 2006).
𝑂𝑏𝑗 =1
𝑁 − 𝑝 (𝑥𝑖
𝑀𝑜𝑑𝑒𝑙 − 𝑥𝑖𝐸𝑥𝑝 )2
𝑛
𝑖=1
(4-11)
𝐷𝑒𝑣𝑖𝑎𝑡𝑖𝑜𝑛 − % = 100 × 𝑂𝑏𝑗 (4-12)
4.7 The Results
4.7.1 The Decomposition Fraction vs. Temperature
In order to investigate the kinetics of MWP in contrast to CP, the pyrolysis of sawdust was
carried out with a mass of 50 g in the MW-TGA @ 2.7 kW and 35 mg in a conventional TGA.
Figure 4-6-A and Figure 4-6-C show the decomposition fraction vs. temperature in each case, and
Figure 4-6-B and Figure 4-6-D depict the contour maps for the suitable values of k*
o and Ea, and
the corresponding deviations in both cases.
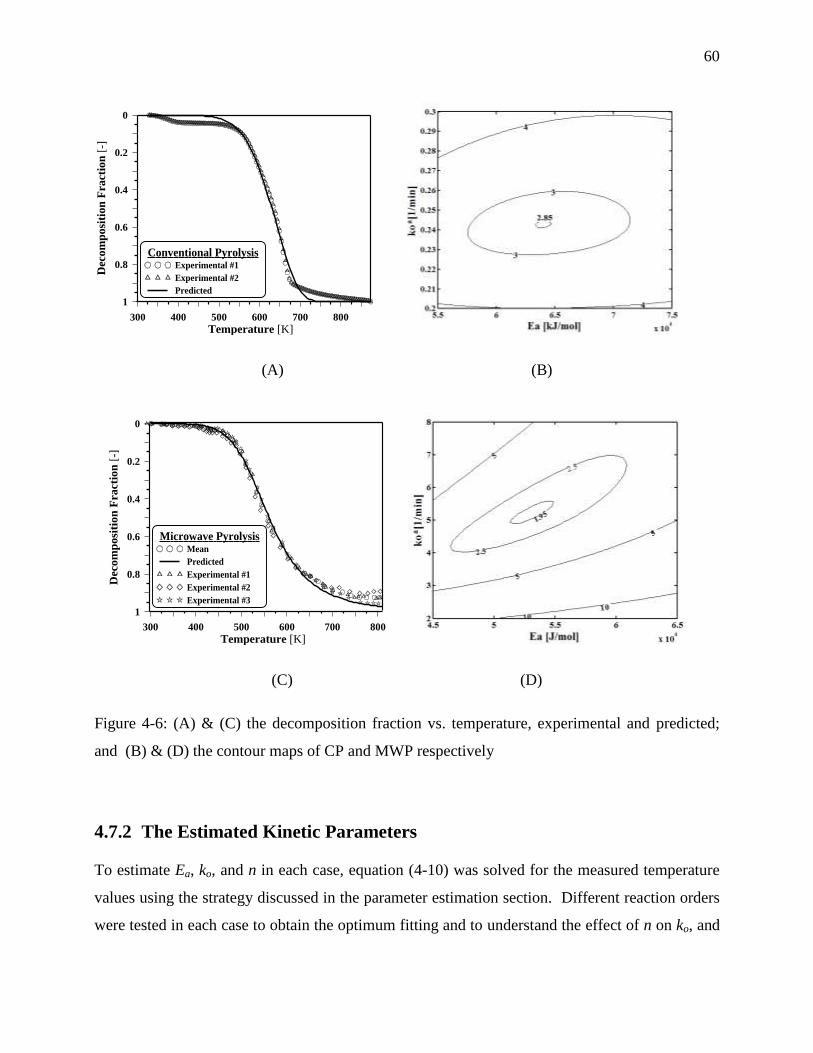
60
300 400 500 600 700 800
Temperature [K]
1
0.8
0.6
0.4
0.2
0
Dec
om
posi
tion
Fra
ctio
n [
-]
Conventional PyrolysisExperimental #1
Experimental #2
Predicted
(A) (B)
300 400 500 600 700 800
Temperature [K]
1
0.8
0.6
0.4
0.2
0
Decom
posi
tion
Fracti
on
[-]
Microwave PyrolysisMean
Predicted
Experimental #1
Experimental #2
Experimental #3
(C) (D)
Figure 4-6: (A) & (C) the decomposition fraction vs. temperature, experimental and predicted;
and (B) & (D) the contour maps of CP and MWP respectively
4.7.2 The Estimated Kinetic Parameters
To estimate Ea, ko, and n in each case, equation (4-10) was solved for the measured temperature
values using the strategy discussed in the parameter estimation section. Different reaction orders
were tested in each case to obtain the optimum fitting and to understand the effect of n on ko, and

61
Ea. The estimated kinetic parameters were listed in Table 4.2. These values are in agreement with
those reported by Aqsha, Mahinpey et al. 2011 (Aqsha, Mahinpey et al. 2011).
Figure 4-7 demonstrates a validation of the presented model, which compares the predicted
results against the experimental data in each case. As it is obvious, the presented model, at the
selected temperature, has a high capability to estimate the decomposition fraction with minor
deviations.
0 0.2 0.4 0.6 0.8 1
Experimental Data
0
0.2
0.4
0.6
0.8
1
Pre
dic
ted
Res
ult
s
0 0.2 0.4 0.6 0.8
Experimental Data
0
0.2
0.4
0.6
0.8
Pred
icte
d R
esu
lts
(A) (B)
Figure 4-7: The capability of the presented model: (A) CP and (B) MWP
Table 4.2: The estimated kinetic parameters in MWP and CP of sawdust
Ea [kJ/mol] ko [min-1
] n [-] Process
65 1 x 10⁵
2 CP
55 3 x 10⁵ 1 MWP

62
4.8 The Discussion
According to the estimated kinetic parameters, there may not be evidence on the effect of MWH
on Ea as the MWP and CP have almost the same estimated value; however, the effect on ko is
obvious. The estimated value of ko in the MWP is more than three-times that of the CP. As
mentioned in the introduction, the nature of the MWH mechanism mainly depends on agitating
the dipoles of the heated material, which results in more chaotic motion. In addition, ko was
interpreted as a collision frequency, determined using the kinetic theory. Indeed, these two facts
can elucidate that MWH could enhance the molecule collisions, which leads to an increase in ko.
A similar explanation was documented by Yadav and Borkar 2006. Despite this tangible effect
on ko, Ea is almost the same in both cases. This could be due to the huge difference between the
wavelength of the oscillating EMW, which is 12.24 cm at a frequency of 2.45 GHz, and the
intermolecular distance of the heated material, which is negligible compared to the wavelength.
This renders the effect of the EMW on Ea doubtful as EMW cannot hack the molecular bonds
directly.
Table 4.3 demonstrates different kinetic investigations of different reactions, some of which have
reported that ko was increased under MWH, while Ea is either constant or decreased. On the other
hand, some investigators have claimed that Ea and/or ko were decreased under MWH. Indeed, this
inconsistent could be a result of using one of the traditional thermometers without considering its
drawbacks, as mentioned previously. In addition, it could be related to the employed parameter
estimation technique.

63
Table 4.3: Effect of MWH on reaction kinetics compared to CH
Author Objective Thermometer Ea ko
Adnadjevic and
Jovanovic 2012
(Adnadjevic and
Jovanovic 2012)
A kinetic investigation of sucrose
hydrolysis at the acidic ion-exchange
resin using CH and MWH
A fibre optics
thermometer
less less
Adnađević, Gigov
et al. 2008
(Adnađević, Gigov
et al. 2008)
A kinetic study of fullerol formation
in MWH and CH
A thermocouple
thermometer
less less
Fukushima,
Kashimura et al.
2013(Fukushima,
Kashimura et al.
2013)
Study of reduction behavior of
copper (II) oxide in MWH
An infrared
thermometer
less
Sun, Wang et al.
2012 (Sun, Wang et
al. 2012)
A kinetic study of the decomposition
of waste printed circuit boards under
MWH and CH
Offline and online
thermocouples
less
Chen, Wang et al.
2013 (Chen, Wang
et al. 2013)
A kinetics investigation of
Glycolysis of Poly (ethylene
terephthalate) using MWH
less
Yan, Hu et al. 2012
(Yan, Hu et al.
2012)
Investigation of emulsifier-free
emulsion polymerization of N-
hydroxymethyl acrylamide, methyl
methacrylate, and styrene using
MWH
less
Mazo, Estenoz et
al. 2012(Mazo,
Estenoz et al. 2012)
Investigate the transesterification of
castor oil with maleic anhydride
using CH and MWH
A thermocouple
thermometer
equal less
Adnadjević and
Jovanović 2012
(Adnadjević and
Jovanović 2012)
The isothermal kinetics of ethanol
adsorption from aqueous solution
onto a zeolite type carbon molecular
sieve under CH and MWH
A fibre optic
thermometer
less more
Li, Han et al. 2013
(Li, Han et al.
2013)
A kinetic investigation of the
microwave liquefaction of corn stove
in the presence of ethylene glycol
using sulfuric acid as a catalyst
A fibre optic
thermometer
less more

64
Temur Ergan and
Bayramoglu
2011(Temur Ergan
and Bayramoglu
2011)
Kinetics investigation of the
decomposition of potassium
persulfate
Infrared
thermometer
more more
Yadav and Borkar
2006(Yadav and
Borkar 2006)
Generation of perlauric acid directly
from lauric acid and hydrogen
peroxide.
Four-blade pitched
turbine impeller
was used for
agitation
equal more
Herein, the presented exegesis could be helpful to explain some of the observations reported in
the literature regarding effects of MWH on reaction rates (Salmoria, Dall'Oglio et al. 1998,
Lidström, Tierney et al. 2001, Lucchesi, Chemat et al. 2004, Menéndez, Domínguez et al. 2004,
Karthikeyan, Balasubramanian et al. 2006, Orozco, Ahmad et al. 2007, Dogan and Hilmioglu
2009, Guiotoku, Rambo et al. 2009, Krzan and Zagar 2009, Zhang and Zhao 2010, Patil, Gude et
al. 2011). This explanation was arrived at based on a reaction kinetics investigation and without
investigating the selectivity side, which would be different. Therefore, the future work will
attempt to investigate the effect of MWP on product selectivity in contrast with CP. Such
discussion is so significant that it would improve the understanding and control of a chemical
reaction.
4.9 The Conclusion
This work investigated the kinetics of microwave pyrolysis (MWP) in contrast to conventional
pyrolysis (CP) of sawdust. In order to complete this investigation, an original MW-TGA was
built and equipped with an innovated thermometer. This thermometer measures transient-mean
temperature, which could eliminate the drawbacks suffered by the traditional thermometers.
The temperature profiles within the heated material were estimated using COMSOL-
Multiphysics applications. To make this estimation, the dielectric properties of sawdust were
measured at the same temperature range that was used in MWP. Based on the estimated profiles,

65
measuring a point/surface temperature of a material exposed to electromagnetic irradiation will
give a temperature completely different from the temperature of all the bulk material, which
cannot be employed in kinetic purposes.
The kinetic parameters were estimated in MWP and CP using a MATLAB® program code. The
obtained result demonstrates that MWP may have a reaction rate faster than that of CP, for the
molecular chaotic motion. This is the result of agitating the heated material dipoles by the
oscillating electromagnetic waves. On the other hand, the estimated activation energy is almost
the same in the two cases. This may be related to the wave length of the oscillating
electromagnetic field, which is much longer than the intermolecular distance of the heated
material. This exegesis was achieved by a kinetic investigation, and without investigating the
selectivity side, which would be different.
Acknowledgements
The authors would like to thank Mr. Cédric Ginart (Glassblower at Montreal University) and Mr.
Robert Delisle (Technician at Ecole Polytechnique Montreal) for their assistance in the
experimental setup, and Dr. Levent Erdogan (Electrical Engineering Department, Ecole
Polytechnique Montreal) for his assistance in this work. In addition, the authors are grateful for
the financial and technical support from Lignoworks NSERC Strategic Network
(www.lignoworks.ca).

66
CHAPTER 5 ARTICLE 3: A DETAILED COMPOSITIONAL ANALYSIS
AND STRUCTURAL INVESTIGATION OF A BIO-OIL FROM
MICROWAVE PYROLYSIS OF KRAFT LIGNIN
Sherif Faraga, Dongbao Fu
b, Philip G. Jessop
b, and Jamal Chaouki
a
aCRIP-Biorefinery Centre, Department of Chemical Engineering, École Polytechnique de Montréal.
P.O. Box 6079, Station Centre-ville, Montréal, QC, Canada H3C 3A7.
b Department of Chemistry, Queen’s University, 90 Bader Lane, Kingston, Ontario K7L 3N6, Canada.
(Journal of Analytical and Applied Pyrolysis)
Presentation of the article: This article presents a detailed structural investigation of
condensable gases produced via microwave pyrolysis of kraft lignin at various conditions.
Different analysis techniques are performed on the oil phase, such as GC-MS, 31
P NMR and 13
C.
Furthermore, different degradation pathways based on the obtained analyses will be explained.
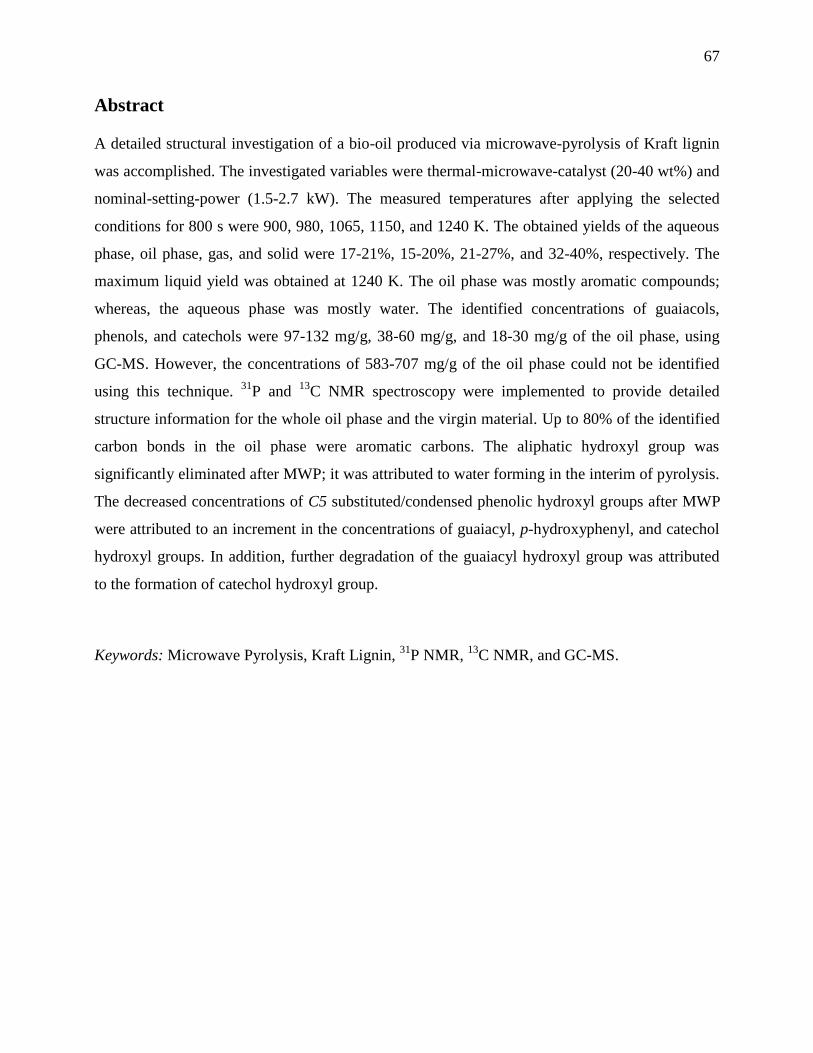
67
Abstract
A detailed structural investigation of a bio-oil produced via microwave-pyrolysis of Kraft lignin
was accomplished. The investigated variables were thermal-microwave-catalyst (20-40 wt%) and
nominal-setting-power (1.5-2.7 kW). The measured temperatures after applying the selected
conditions for 800 s were 900, 980, 1065, 1150, and 1240 K. The obtained yields of the aqueous
phase, oil phase, gas, and solid were 17-21%, 15-20%, 21-27%, and 32-40%, respectively. The
maximum liquid yield was obtained at 1240 K. The oil phase was mostly aromatic compounds;
whereas, the aqueous phase was mostly water. The identified concentrations of guaiacols,
phenols, and catechols were 97-132 mg/g, 38-60 mg/g, and 18-30 mg/g of the oil phase, using
GC-MS. However, the concentrations of 583-707 mg/g of the oil phase could not be identified
using this technique. 31
P and 13
C NMR spectroscopy were implemented to provide detailed
structure information for the whole oil phase and the virgin material. Up to 80% of the identified
carbon bonds in the oil phase were aromatic carbons. The aliphatic hydroxyl group was
significantly eliminated after MWP; it was attributed to water forming in the interim of pyrolysis.
The decreased concentrations of C5 substituted/condensed phenolic hydroxyl groups after MWP
were attributed to an increment in the concentrations of guaiacyl, p-hydroxyphenyl, and catechol
hydroxyl groups. In addition, further degradation of the guaiacyl hydroxyl group was attributed
to the formation of catechol hydroxyl group.
Keywords: Microwave Pyrolysis, Kraft Lignin, 31
P NMR, 13
C NMR, and GC-MS.

68
5.1 Introduction
Recently, biomass has been employed as a renewable resource of value-added bio-chemicals.
Developing bio-chemicals is one opportunity for dealing with the unexpected challenges that
have faced the forest industry in North America for the past few years, such as decreasing
demand and competition with low cost sources of wood. As well, generating energy from
biomass is one way to compensate for the rapid increase in energy demand expected in the next
few years .
Lignocellulosic biomass is composed of three intertwined components: cellulose, hemicellulose,
and lignin. The dry basis weight of each is 35-45%, 25–30%, and 20–35%, respectively
(Zakzeski, Bruijnincx et al. 2010, de Wild, Huijgen et al. 2012, Mu, Ben et al. 2013).This
distribution depends on the species, the environment in which it was grown, and other factors.
Lignin is a three dimensional amorphous polymer, one of the most complex organic aromatic
polymers in nature (Zakzeski, Bruijnincx et al. 2010, Kibet, Khachatryan et al. 2012, Mu, Ben et
al. 2013), but the exact structure of the untreated lignin network is unknown. However, it is
believed to be based upon three aromatic alcohols: p-coumaryl, coniferyl, and sinapyl alcohol, as
depicted in Figure 5-1 (Zakzeski, Bruijnincx et al. 2010, de Wild, Huijgen et al. 2012, Kibet,
Khachatryan et al. 2012).
OH
OH
OH
OH
O
CH3OH
OH
O
CH3
O
CH3
A B C
Figure 5-1: The three monolignols of a lignin network: (A) coumaryl alcohol, (B) coniferyl
alcohol, and (C) sinapyl alcohol

69
Even though lignin is the only renewable source of aromatics in nature and the third-most
abundant natural polymer after cellulose and hemicellulose, it has received less attention in
research than the other biomass components (Ben and Ragauskas 2011, Mu, Ben et al. 2013). In
addition, the annual product of lignin in the US paper industry is over 50 million tons, yet only
2% of this material is converted to bio-products (Ben and Ragauskas 2011), whereas the rest is
combusted to recover energy.
Lignin can be converted into chemicals and/or energy using thermal, biological, or physical
technology. One of the techniques applied in thermal technology is pyrolysis. Pyrolysis is a
thermal decomposition of chemical bonds by supplying heat energy in an oxygen-free
environment. The main pyrolysis products are: (1) solid, mostly carbon, which can be used as a
solid fuel, soil additive, and other applications. (2) Condensable gas, which is a potential source
for value added chemicals that could replace petrochemicals; and (3) non-condensable gas, which
is combustible (de Wild, Huijgen et al. 2012, Doucet, Laviolette et al. 2013). The needed heat
energy for pyrolysis can be provided by heat transfer from a heating source. Otherwise, it can be
generated within the heated material by an electromagnetic exposure (microwave heating). This
pyrolysis is called ―microwave pyrolysis‖ (MWP).
Microwave heating (MWH) is a volumetric energy conversion mechanism within the target
material rather than superficial heat transfer as in conventional heating (CH). MWH has been
established in different sectors as it can eliminate several issues/limitations in contrast to CH such
as formation of a temperature gradient inside and outside the heated material, and char layer
formation of pyrolysis material. Furthermore, it has been demonstrated that a desired temperature
gradient and/or hot or cold spots can be generated within the payload in a simple way, compared
to CH (Farag, Sobhy et al. 2012). In addition, under controlled conditions, MWH can reduce
energy consumption and award higher product selectivity compared to CH (Camelia Gabriel and
Mingosb 1998, Thostenson and Chou 1999, Oloyede and Groombridge 2000, Datta and Ni 2002,
Jones, Lelyveld et al. 2002, Will, Scholz et al. 2003, Domínguez, Menéndez et al. 2005, Zhu, Wu
et al. 2006, Geedipalli, Rakesh et al. 2007, Orozco, Ahmad et al. 2007, Badamali, Clark et al.
2008, Tang, Xia et al. 2008, Xu, Jiang et al. 2008, Budarin, Clark et al. 2009, Chiavaro, Barnaba
70
et al. 2009, Durka, Gerven et al. 2009, Ma, Liu et al. 2009, Wan, Chen et al. 2009, Mutyala,
Fairbridge et al. 2010). Further details regarding MWH can be found in (Farag, Sobhy et al.
2012).
Pyrolysis of lignin and characterization of the liquid product have been investigated over the past
two decades. Zheng, Chen et al. 2013 have investigated fast pyrolysis of lignin under the catalytic
effect of Mo2N/γ-Al2O3 (Zheng, Chen et al.). The experimental work was carried out using a
pyrolysis-gas chromatography/mass spectrometry system (Py-GC-MS). The authors reported that
using Mo2N/γ-Al2O3 in the fast pyrolysis of lignin significantly decreased oxygenated volatile
organic products and increased aromatic hydrocarbons, mostly benzene and toluene. The
maximum yield is obtained at 700 ˚C. Lou, Wu et al. 2010 have examined the effect of
temperature and catalysts (sodium chloride, Permutite) on the pyrolysis of bamboo lignin (Lou,
Wu et al. 2010). Py-GC-MS was employed for this study. The obtained results show that the
degradation of bamboo lignin took place over the temperature range from 250 oC to 600
oC. The
catalysts enhanced the formation of volatile products (oil and gas pahse) and decreased the yield
of solid product. Increasing the catalyst loading enhanced the yields of small molecular
compounds acetic acid, benzene series, furfural, and phenol. Choi and Meier 2013 investigated
the pyrolysis of Kraft lignin under the effect of different temperatures and catalysts (Zeolite
HZSM-5, FCC and Olivine) (Choi and Meier 2013). GC-MS/GC-FID were used to analyze the
liquid product. The obtained results show that increasing the pyrolysis temperature decreased the
solid and non-condensable gas yields, whereas the liquid yield was increased. Yields of acids,
sugars, benzenes and phenols were almost the same when the catalysts were applied but the
guaiacols yields were decreased when HZSM-5 was applied. Increasing the pyrolysis temperature
decreased the yield of higher molecular weight compounds and increased the yield of lower
molecular weight compounds. Zhang, Resende et al. 2012 studied the pyrolysis of three lignin
types: prairie cord grass, aspen, and synthetic Kraft lignin (Zhang, Resende et al. 2012). In this
study, Py-GC-MS and TGA/FTIR were employed. The authors reported that prairie cord grass
lignin released more alkyls than the other two types of lignin. On the other hand, aspen lignin
produced a high yield of liquid product. Jiang, Nowakowski et al. 2010 investigated the
temperature dependence of the composition of lignin pyrolysis products using Pr-GC-MS (Jiang,
Nowakowski et al. 2010). The authors reported that the maximum yield of phenolics was

71
obtained at 600oC. Most of the phenolic compounds had a concentration less than 1%. De Wild,
Huijgen et al. 2012 investigated the pyrolyis of lignin from two different biomass sources using a
fluidized bed reactor (de Wild, Huijgen et al. 2012). GC-MS was employed to analyze the liquid
product. A liquid yield was found in the range of 40-60 wt%, and the solid product was found in
30-40 wt% . The yields of the extracted chemicals were affected by changing the biomass source.
Luo, Wang et al. 2012 have studied the thermal behaviour of organosolv lignin under the
catalytic effect of zeolites (Luo, Wang et al. 2012). TGA-FTIR was used in this study. The
results showed that the catalysts inhibited the remaining solid product and decreased the yields of
oxygenated compounds. In addition, the formation of CO2 and CH4 was increased.
As has been shown, most of the previous work has been done by employing GC-MS, TGA, or
FT-IR. Nevertheless, the complexity of the pyrolysis crude liquid limits the use of these
instruments due to different issues. Consequently, many chemical components could not be
identified. For instance, around 40 wt% of the pyrolysis oil could not be identified using GC-MS.
In addition, the ability of FT-IR for the quantitative analyses of a complex mixture is limited
(Ben and Ragauskas 2011). Therefore, the main goal of the present study was to investigate the
structures of Kraft lignin pyrolysis liquids under different MWP conditions. This was
accomplished using quantitative NMR to analyze the liquid products and the virgin material as it
can provide detailed structural information. Such investigations improve understanding about
MWP mechanisms, which leads to more control in the degradation pathways.
5.2 The Experimental Work
5.2.1 The Virgin Material
The virgin material used in this work was softwood Kraft lignin received from FPInnovations,
Montreal, Canada. It was precipitated from a Canadian Kraft mill by using a patent pending
process that is called "The LignoForce System(tm)
". Lignin was characterized via CHNS analysis:
C=63.27%, H=5.79%, N=0.07%, and S=1.56%, and approximate analysis: fixed carbon=37%,
volatiles=62%, and ash=1%. In addition, it was analysed using quantitative 13
C NMR and 31
P
NMR spectroscopy as will be shown later. Since lignin does not interact well with microwaves, it

72
was mixed with char, which is the solid product of lignin pyrolysis; in order to improve the
conversion of microwaves to heat.
5.2.2 The Experimental Design
To study the effect of MWP conditions on product distribution and crude liquid structure, a
central composite experimental design method was applied. This method gave the optimal
number of experiments as well as the conditions of each. In this work, two independent
parameters were chosen (Ai): (1) the concentration of a MW-thermal-catalyst (A1 [wt%]) with
A1,min= 20 and A1,max= 40 in the total initial mass (lignin + char) and (2) the MW-nominal setting
power (A2 [kW]) with A2,min= 1.5 and A2,max= 2.7. The variables Ai were coded as ai according to
equation (5-1).
𝑎𝑖 =𝐴𝑖 − 𝐴𝑜∆𝐴
(5-1)
where ai is a dimensionless coded value, Ai is the real value of an independent variable, and Ao is
the real value of the independent variable at the center point (0,0). ΔA is the step change, which
equals 10 for the first parameter and 0.6 for the second one. Table 5.1 shows the coded and actual
values for the independent parameters. In order to guarantee the reproducibility, each experiment
was repeated three times, and the average value was represented as will be shown later.
Table 5.1: The coded vales and the corresponding
actual values applied in MWP of Kraft lignin
Run
#
Coded value Actual value
Char
wt%
Nominal
Power
Char
wt%
Nominal
power
[kW]
1 -1 -1 20 1.5
2 -1 1 20 2.7
3 0 0 30 2.1
4 1 -1 40 1.5
5 1 1 40 2.7

73
5.2.3 The Experimental Setup
The experimental work was carried out in a bench scale Microwave-oven (MW-O) (Microwave
Research Inc; Model: BP-211, 230 V, 2.45 GHz, and setting power up to 3.2 kW). The oven
cavity has inner dimensions of 510×250×320 mm. As electronic devices are highly affected by
the surrounding temperature, an alumina box (muffle) with the dimensions of 390×180×170 mm
was kept inside the oven cavity during the heating. This muffle protects the oven’s electronic
devices from most of the emitted heat and unwanted/unexpected explosions, or combustion
during MWP. A quartz semi-batch cylinder reactor was used after connecting it to a condensation
system to collect the condensable gas while the non-condensable gas passes directly through, as
shown in Figure 5-2.
Figure 5-2: The experimental set-up
The employed condensation system consists of a set of vertical metallic tubes. These tubes were
connected in series at one end while the other ends were connected via a 500 ml two neck Pyrex
flask. The reactor outlet was connected to the condensation system via a metallic connection.
This connection was kept at 200 oC, to avoid any condensation before the freezing zone.

74
Temperature measurement was done using the innovated thermometer that was used in Farag.
and Chaouki. 2013; refer to that paper for a detailed description, calibration, and validation of
this thermometer (Farag. and Chaouki. 2013). Figure 5-3 shows the transient mean temperatures
within Kraft lignin at two different concentrations of char, 20 and 40 wt%, and one nominal
setting power, 2.7 kW. In this work, since MWP was done at non-isothermal conditions, the
presented temperatures are the final ones, which were reached at the end of the heating period,
800 s.
0 200 400 600 800
Time [s]
300
500
700
900
1100
1300
Tem
per
atu
re [
K]
2.7 kW and 40 wt% char
2.7 kW and 20 wt% char
Figure 5-3: The transient mean temperature of MWP of Kraft lignin at two various conditions
5.2.4 The Method
The procedures of each experiment were as follows. First, a constant initial mass of 300 g (char: x
wt% + lignin: (1- x) wt%) was carefully placed in the reactor. Afterward, the reactor was inserted
inside the MW-O cavity and then connected for temperature measurement, to the inert gas inlet,
and the product outlet, as illustrated in Figure 5-2. Secondly, the whole system was purged in the
beginning by an inert gas (N2); furthermore, N2 was kept during the pyrolysis. A nominal setting
power, according to Table 5.1, was adjusted and held for 800s, which is the microwave exposure
time for each experiment.

75
In the meantime, for each experiment the condensable liquid was condensed within the freezing
zone, whereas the non-condensable gas passed directly through. After each experiment, the solid
product was collected and weighed as soon as it cooled to ambient temperature. The same
approach was used for the liquid product. The mass of non-condensable gas was calculated by
subtracting the liquid and solid masses from the initial lignin mass ((1-x) times the total initial
mass). The collected liquid mixture was separated into two phases: (1) an oil phase, and (2) an
aqueous phase which is less dense than the oil phase. Finally, methanol was added (5 wt%) to
every liquid product, and the liquids were kept refrigerated until analysis.
The oil and aqueous phases were analysed using GC-MS (PerkinElmer Clarus 680 Gas
Chromatograph and a PerkinElmer Clarus 600T Mass Spectrometer), quantitative 31
P and 13
C
NMR spectroscopy (Bruker Avance 500 MHz NMR spectrometer). The detailed methods of
these analyses have been published previously (Fu, Farag et al. 2014). Water content of each
sample was determined by Karl-Fischer Titration using a Mettler Toledo C20 Coulometric KF
Titrator. These analyses and measurements were done on a mix of three samples produced via
three repetitions at the same conditions.
5.3 Results and Discussion
5.3.1 The Products Distribution
The power setting and char wt% that were used at each run produced a specific heating rate and
therefore a specific final temperature. A comparison made between two runs having the same
nominal power setting but different concentrations of char demonstrated that char concentration
had a greater effect on the final temperature than the nominal power setting. For instance, when
the concentration of char was changed from 20% to 40% at 1.5 kW, the final temperature was
increased by 250 oC. On the other hand, when the power setting was changed from 1.5 kW to 2.7
kW at 20% of char concentration, the final temperature was increased by 80 oC. This means the
same heating rate can be obtained at a lower power setting by raising the char concentration.
However, char concentration should be optimized in order to prevent an adverse effect on the
product distribution and quality.

76
Figure 5-4 shows the yields of each product for the conditions under investigation. These yields
were calculated based on the initial mass dry basis. The presented values are the average of three
repetitions under the same conditions, and the presented error bars are their standard deviations.
The maximum deviation was ±2 for the all products except for the aqueous phase, it was ±1.
Considering that char does not have any weight loss during pyrolysis, it was examined separately
at the measured temperatures.
Figure 5-4: The product distribution for the conditions under investigation
As shown in Figure 5-4, increasing the final temperature increased the total liquid product. For
example, when the temperature was changed from 900 K to 1240 K, the total liquid yield was
increased from 32 wt% to 40 wt%. The same trend has been reported by Choi and Meier. 2013
(Choi and Meier 2013). However, this result could be either beneficial or problematic depending
on the structure of the obtained liquid and the yield of the desired chemicals. For this reason, we
chose to focus not only on quantitative but also on qualitative characterization of the liquids.
0
10
20
30
40
50
60
70
80
90
100
900 980 1065 1150 1240
Pro
duct
wt%
Temperature [K]
Solid
Gas
Aqueous Phase
Oil Phase

77
The yield of oil phase (red in Figure 5-4) was calculated from the total liquid yield minus the
aqueous phase yield. Although the liquids produced at 1065 K and 1150 K have almost the same
yield, the one produced at 1150 K has 12% more oil in the aqueous phase than did the one at
1065 K. In addition, the liquid produced at 980 K, which has the maximum water content in the
oil phase, has almost the same total oil wt% as the one at 1065 K.
Table 5.2: The measured water content in the aqueous and oil phase at every run
Run # Temp
[K]
Water content [wt%]
Aqueous
phase
Oil
phase
Total
liquid
Relative to
initial mass
1 900 91 10 53 17
2 980 76 21 47 17
3 1065 90 14 49 18
4 1150 78 14 44 16
5 1240 73 12 44 18
Alternatively, if another consideration is applied, another condition can be the best.
Consequently, different analyses were applied on the liquid products to achieve investigations
based on the structure of the obtained liquid, not only based on the obtained quantity of liquids.
5.3.2 The GC-MS Analysis
Simply obtaining a high yield of oil is insufficient; it is important to know and to be able to
optimize the composition of the oil. All the liquid products, in total ten samples, were analyzed
using GC-MS, for characterizing the extracted chemical compounds via MWP of lignin. Figure
5-5 shows the GC-MS chromatographs for the oil phase, five samples in total, and Table 5.3 lists
the 42 organic compounds that were identified quantitatively and qualitatively in the oil and
aqueous phases.
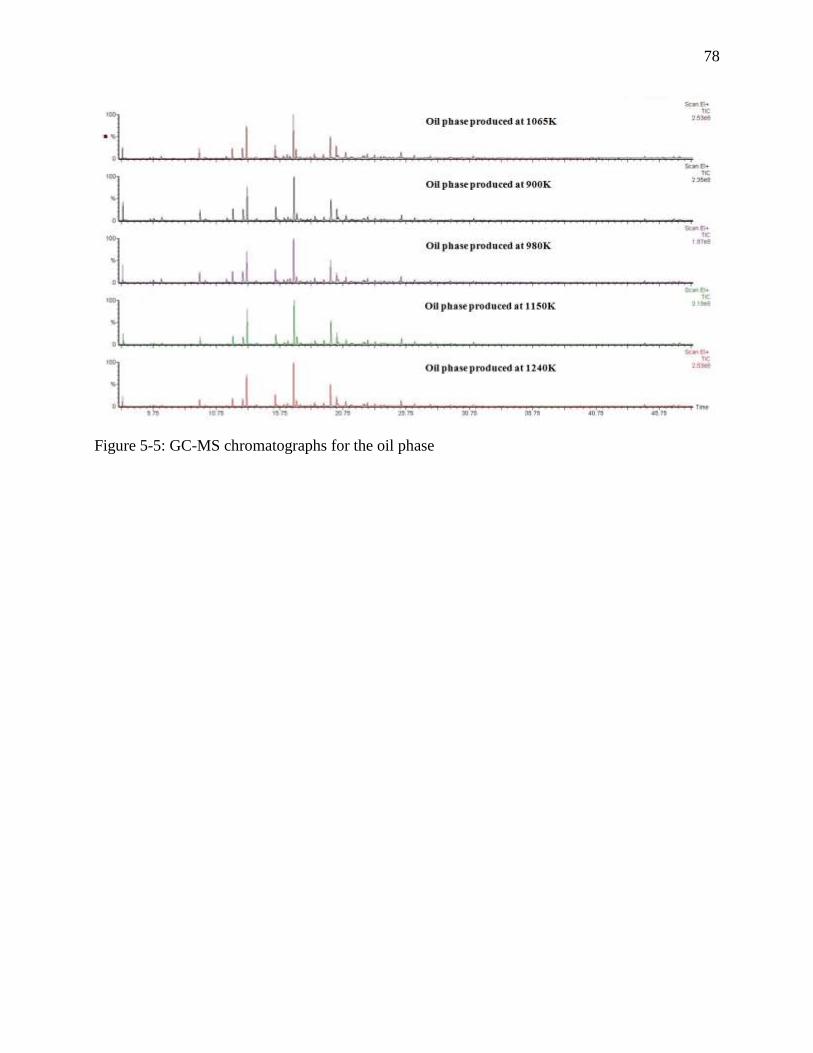
78
Figure 5-5: GC-MS chromatographs for the oil phase
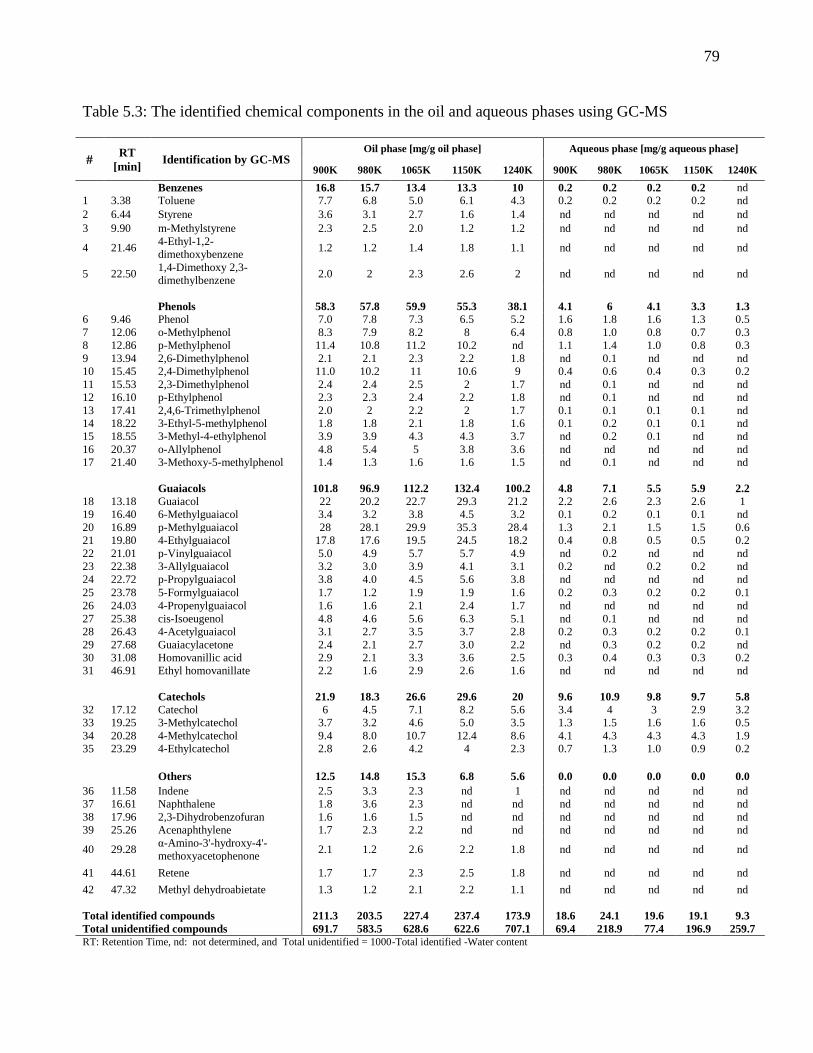
79
Table 5.3: The identified chemical components in the oil and aqueous phases using GC-MS
# RT
[min] Identification by GC-MS
Oil phase [mg/g oil phase] Aqueous phase [mg/g aqueous phase]
900K 980K 1065K 1150K 1240K 900K 980K 1065K 1150K 1240K
Benzenes 16.8 15.7 13.4 13.3 10 0.2 0.2 0.2 0.2 nd
1 3.38 Toluene 7.7 6.8 5.0 6.1 4.3 0.2 0.2 0.2 0.2 nd
2 6.44 Styrene 3.6 3.1 2.7 1.6 1.4 nd nd nd nd nd
3 9.90 m-Methylstyrene 2.3 2.5 2.0 1.2 1.2 nd nd nd nd nd
4 21.46 4-Ethyl-1,2-
dimethoxybenzene 1.2 1.2 1.4 1.8 1.1 nd nd nd nd nd
5 22.50 1,4-Dimethoxy 2,3-
dimethylbenzene 2.0 2 2.3 2.6 2 nd nd nd nd nd
Phenols 58.3 57.8 59.9 55.3 38.1 4.1 6 4.1 3.3 1.3
6 9.46 Phenol 7.0 7.8 7.3 6.5 5.2 1.6 1.8 1.6 1.3 0.5
7 12.06 o-Methylphenol 8.3 7.9 8.2 8 6.4 0.8 1.0 0.8 0.7 0.3
8 12.86 p-Methylphenol 11.4 10.8 11.2 10.2 nd 1.1 1.4 1.0 0.8 0.3
9 13.94 2,6-Dimethylphenol 2.1 2.1 2.3 2.2 1.8 nd 0.1 nd nd nd
10 15.45 2,4-Dimethylphenol 11.0 10.2 11 10.6 9 0.4 0.6 0.4 0.3 0.2
11 15.53 2,3-Dimethylphenol 2.4 2.4 2.5 2 1.7 nd 0.1 nd nd nd
12 16.10 p-Ethylphenol 2.3 2.3 2.4 2.2 1.8 nd 0.1 nd nd nd
13 17.41 2,4,6-Trimethylphenol 2.0 2 2.2 2 1.7 0.1 0.1 0.1 0.1 nd
14 18.22 3-Ethyl-5-methylphenol 1.8 1.8 2.1 1.8 1.6 0.1 0.2 0.1 0.1 nd
15 18.55 3-Methyl-4-ethylphenol 3.9 3.9 4.3 4.3 3.7 nd 0.2 0.1 nd nd
16 20.37 o-Allylphenol 4.8 5.4 5 3.8 3.6 nd nd nd nd nd
17 21.40 3-Methoxy-5-methylphenol 1.4 1.3 1.6 1.6 1.5 nd 0.1 nd nd nd
Guaiacols 101.8 96.9 112.2 132.4 100.2 4.8 7.1 5.5 5.9 2.2
18 13.18 Guaiacol 22 20.2 22.7 29.3 21.2 2.2 2.6 2.3 2.6 1
19 16.40 6-Methylguaiacol 3.4 3.2 3.8 4.5 3.2 0.1 0.2 0.1 0.1 nd
20 16.89 p-Methylguaiacol 28 28.1 29.9 35.3 28.4 1.3 2.1 1.5 1.5 0.6
21 19.80 4-Ethylguaiacol 17.8 17.6 19.5 24.5 18.2 0.4 0.8 0.5 0.5 0.2
22 21.01 p-Vinylguaiacol 5.0 4.9 5.7 5.7 4.9 nd 0.2 nd nd nd
23 22.38 3-Allylguaiacol 3.2 3.0 3.9 4.1 3.1 0.2 nd 0.2 0.2 nd
24 22.72 p-Propylguaiacol 3.8 4.0 4.5 5.6 3.8 nd nd nd nd nd
25 23.78 5-Formylguaiacol 1.7 1.2 1.9 1.9 1.6 0.2 0.3 0.2 0.2 0.1
26 24.03 4-Propenylguaiacol 1.6 1.6 2.1 2.4 1.7 nd nd nd nd nd
27 25.38 cis-Isoeugenol 4.8 4.6 5.6 6.3 5.1 nd 0.1 nd nd nd
28 26.43 4-Acetylguaiacol 3.1 2.7 3.5 3.7 2.8 0.2 0.3 0.2 0.2 0.1
29 27.68 Guaiacylacetone 2.4 2.1 2.7 3.0 2.2 nd 0.3 0.2 0.2 nd
30 31.08 Homovanillic acid 2.9 2.1 3.3 3.6 2.5 0.3 0.4 0.3 0.3 0.2
31 46.91 Ethyl homovanillate 2.2 1.6 2.9 2.6 1.6 nd nd nd nd nd
Catechols 21.9 18.3 26.6 29.6 20 9.6 10.9 9.8 9.7 5.8
32 17.12 Catechol 6 4.5 7.1 8.2 5.6 3.4 4 3 2.9 3.2
33 19.25 3-Methylcatechol 3.7 3.2 4.6 5.0 3.5 1.3 1.5 1.6 1.6 0.5
34 20.28 4-Methylcatechol 9.4 8.0 10.7 12.4 8.6 4.1 4.3 4.3 4.3 1.9
35 23.29 4-Ethylcatechol 2.8 2.6 4.2 4 2.3 0.7 1.3 1.0 0.9 0.2
Others 12.5 14.8 15.3 6.8 5.6 0.0 0.0 0.0 0.0 0.0
36 11.58 Indene 2.5 3.3 2.3 nd 1 nd nd nd nd nd
37 16.61 Naphthalene 1.8 3.6 2.3 nd nd nd nd nd nd nd
38 17.96 2,3-Dihydrobenzofuran 1.6 1.6 1.5 nd nd nd nd nd nd nd
39 25.26 Acenaphthylene 1.7 2.3 2.2 nd nd nd nd nd nd nd
40 29.28 α-Amino-3'-hydroxy-4'-
methoxyacetophenone 2.1 1.2 2.6 2.2 1.8 nd nd nd nd nd
41 44.61 Retene 1.7 1.7 2.3 2.5 1.8 nd nd nd nd nd
42 47.32 Methyl dehydroabietate 1.3 1.2 2.1 2.2 1.1 nd nd nd nd nd
Total identified compounds 211.3 203.5 227.4 237.4 173.9 18.6 24.1 19.6 19.1 9.3
Total unidentified compounds 691.7 583.5 628.6 622.6 707.1 69.4 218.9 77.4 196.9 259.7
RT: Retention Time, nd: not determined, and Total unidentified = 1000-Total identified -Water content

80
Because the chemical structure of lignin is largely aromatic, all the identified compounds are
aromatics as well. The identified chemical compounds in the oil and aqueous phases are
presented in five groups: benzenes, phenols, guaiacols, catechols, and others. The aqueous phase
contained so little organic content that identified organic compounds totalled only 9.3-24.1 mg/g
in the aqueous phase; in contrast, 173.9-237.4 mg/g were found in the oil phase. Consequently,
the remainder of this work will focus on the oil phase only.
The most abundant group of compounds in the oil phase was the guaiacols, which were found in
a concentration range of 97-130 mg/g. Phenols were found at 38-60 mg/g while catechols were
found within 18-30 mg/g. Other identified chemical compounds were collectively found in a
concentration of 9-19 mg/g.
In general, the maximum concentration of the total identified compounds (237.4 mg/g of oil
phase) was found at 1150 K. The maximum concentration of guaiacols and catechols was
produced at 1150K. On the other hand, the maximum concentration of phenols and others was
found at 1065 K. The maximum concentration of benzenes was at 900 K. However, there was a
concentration from 580 mg/g to 700 mg/g in the oil phase of compounds, probably higher
molecular weight compounds that could not be identified using GC-MS. Therefore, GC-MS
analysis is inadequate to fully describe the composition.
5.3.3 The Quantitative 31
P NMR Analyses for the Oil Phase
Quantitative 13
P NMR spectroscopy was used to further characterize the oil phase as well as the
virgin material, in a total of six samples. The quantitative 31
P NMR spectra were acquired after in
situ derivatization with 2-chloro-4,4,5,5-tetramethyl-1,3,2-dioxaphospholane (TMDP) to measure
the hydroxyl groups' contents in the samples; this method was developed by Granata and
Argyropoulos (Granata and Argyropoulos 1995). Figure 5-6 depicts the 31
P NMR spectra for the
five oils produced at the selected conditions, and the 6th
spectrum for lignin. Table 5.4
summarizes the integration for every sample.
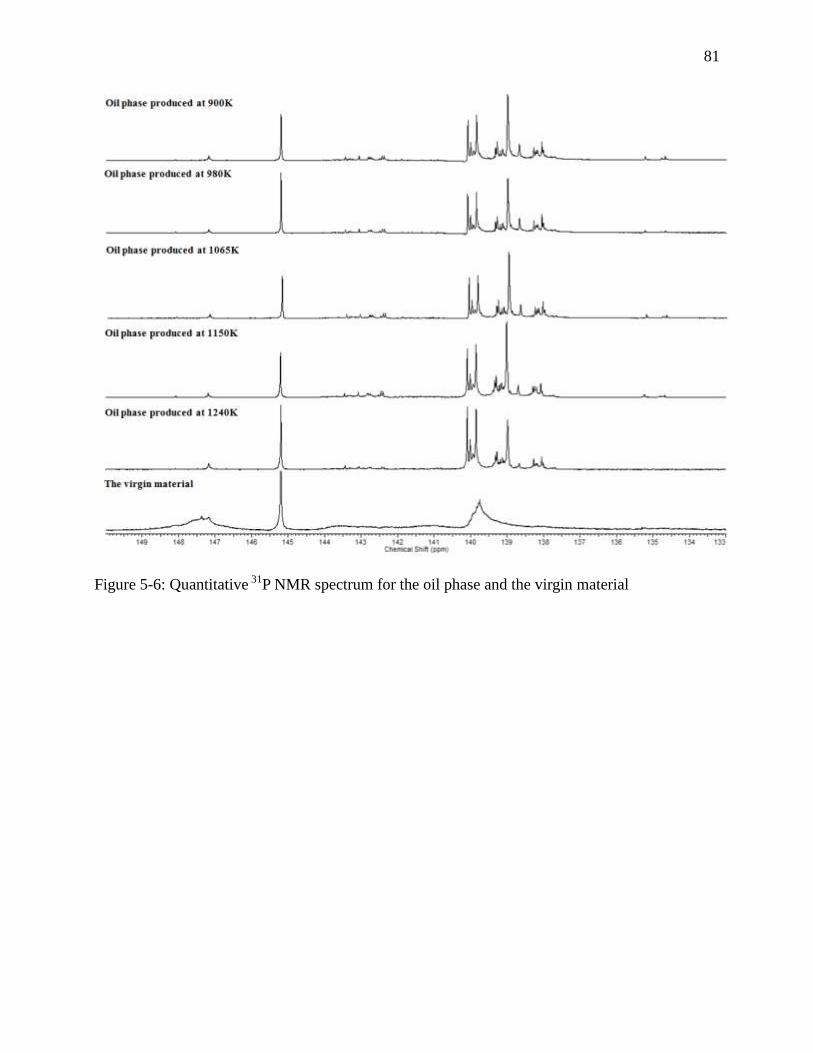
81
Figure 5-6: Quantitative 31P NMR spectrum for the oil phase and the virgin material
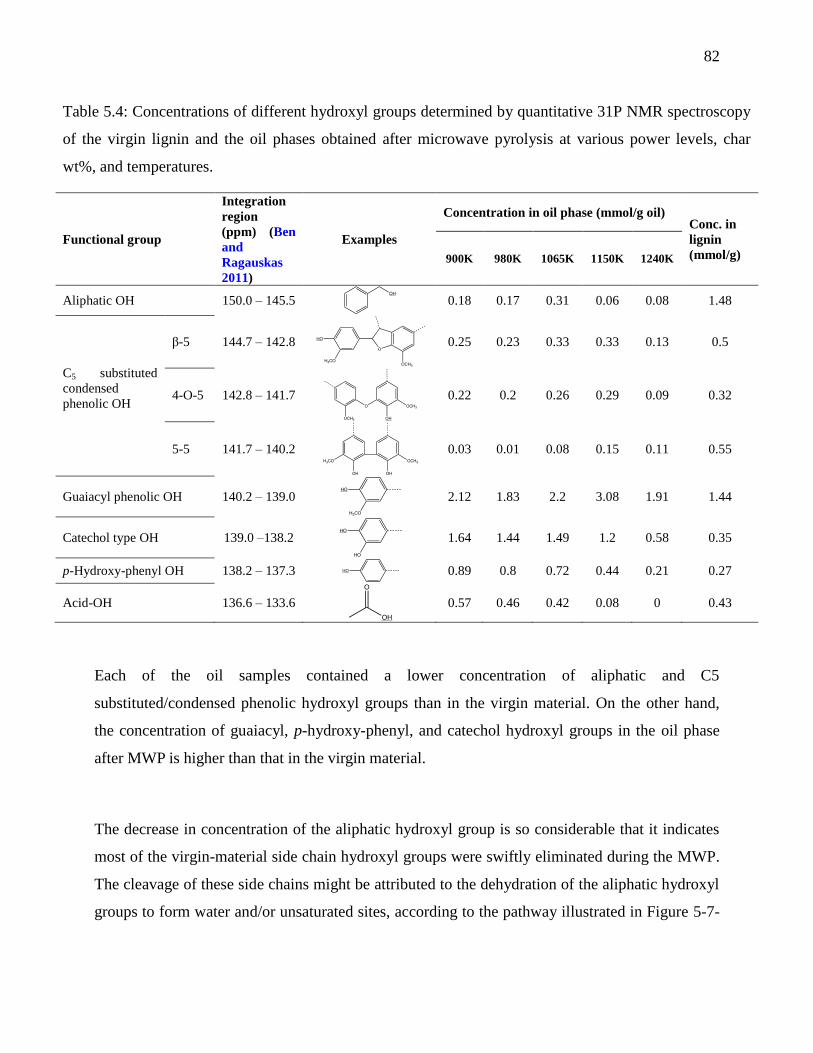
82
Table 5.4: Concentrations of different hydroxyl groups determined by quantitative 31P NMR spectroscopy
of the virgin lignin and the oil phases obtained after microwave pyrolysis at various power levels, char
wt%, and temperatures.
Functional group
Integration
region
(ppm) (Ben
and
Ragauskas
2011)
Examples
Concentration in oil phase (mmol/g oil) Conc. in
lignin
(mmol/g) 900K 980K 1065K 1150K 1240K
Aliphatic OH 150.0 – 145.5
0.18 0.17 0.31 0.06 0.08 1.48
C5 substituted
condensed
phenolic OH
β-5 144.7 – 142.8
0.25 0.23 0.33 0.33 0.13 0.5
4-O-5 142.8 – 141.7
0.22 0.2 0.26 0.29 0.09 0.32
5-5 141.7 – 140.2
0.03 0.01 0.08 0.15 0.11 0.55
Guaiacyl phenolic OH 140.2 – 139.0
2.12 1.83 2.2 3.08 1.91 1.44
Catechol type OH 139.0 –138.2
1.64 1.44 1.49 1.2 0.58 0.35
p-Hydroxy-phenyl OH 138.2 – 137.3
0.89 0.8 0.72 0.44 0.21 0.27
Acid-OH 136.6 – 133.6
0.57 0.46 0.42 0.08 0 0.43
Each of the oil samples contained a lower concentration of aliphatic and C5
substituted/condensed phenolic hydroxyl groups than in the virgin material. On the other hand,
the concentration of guaiacyl, p-hydroxy-phenyl, and catechol hydroxyl groups in the oil phase
after MWP is higher than that in the virgin material.
The decrease in concentration of the aliphatic hydroxyl group is so considerable that it indicates
most of the virgin-material side chain hydroxyl groups were swiftly eliminated during the MWP.
The cleavage of these side chains might be attributed to the dehydration of the aliphatic hydroxyl
groups to form water and/or unsaturated sites, according to the pathway illustrated in Figure 5-7-
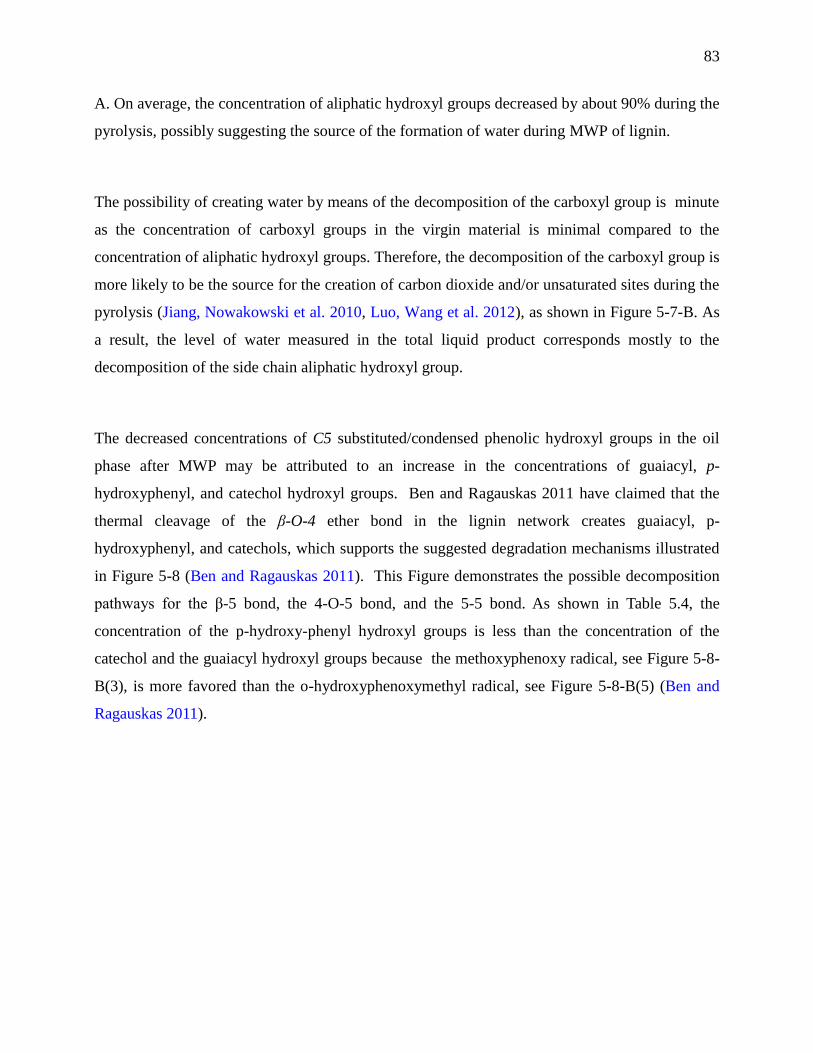
83
A. On average, the concentration of aliphatic hydroxyl groups decreased by about 90% during the
pyrolysis, possibly suggesting the source of the formation of water during MWP of lignin.
The possibility of creating water by means of the decomposition of the carboxyl group is minute
as the concentration of carboxyl groups in the virgin material is minimal compared to the
concentration of aliphatic hydroxyl groups. Therefore, the decomposition of the carboxyl group is
more likely to be the source for the creation of carbon dioxide and/or unsaturated sites during the
pyrolysis (Jiang, Nowakowski et al. 2010, Luo, Wang et al. 2012), as shown in Figure 5-7-B. As
a result, the level of water measured in the total liquid product corresponds mostly to the
decomposition of the side chain aliphatic hydroxyl group.
The decreased concentrations of C5 substituted/condensed phenolic hydroxyl groups in the oil
phase after MWP may be attributed to an increase in the concentrations of guaiacyl, p-
hydroxyphenyl, and catechol hydroxyl groups. Ben and Ragauskas 2011 have claimed that the
thermal cleavage of the β-O-4 ether bond in the lignin network creates guaiacyl, p-
hydroxyphenyl, and catechols, which supports the suggested degradation mechanisms illustrated
in Figure 5-8 (Ben and Ragauskas 2011). This Figure demonstrates the possible decomposition
pathways for the β-5 bond, the 4-O-5 bond, and the 5-5 bond. As shown in Table 5.4, the
concentration of the p-hydroxy-phenyl hydroxyl groups is less than the concentration of the
catechol and the guaiacyl hydroxyl groups because the methoxyphenoxy radical, see Figure 5-8-
B(3), is more favored than the o-hydroxyphenoxymethyl radical, see Figure 5-8-B(5) (Ben and
Ragauskas 2011).

84
OH
O
CH3
OH
O
OH
OH
CH4CH3
(C)
O
O
H
O
OH- CO2
(B)
OH
(A)
CH2
+
+
+-
CH3
+OH2OH- OH H
- CO2
+H
+2
+CH3 H+ 2
(1)
(1)
(1)
(2)
(2)
(2)
(3)
(3)
(3)
+H
Figure 5-7: Possible degradation pathways for: (A) aliphatic hydroxyl group, (B) carboxyl acid,
and (3) guaiacyl hydroxyl groups
O
OH
H3COOCH3
.
.
COH
H3CO
C
O
OCH3
.
.
H+
H+
OH
H3CO
O
OCH3
.
.
H+
H+
OCH3OH
OHH3CO
.
.
C
OCH3OH
.
C
OHH3CO
.
OCH3OH
.OHH3CO
.
O
OCH3 OH
OCH3
.
.
O
OCH3
.
C
OH
OCH3
.
H+ H
+
OH
OCH3
.
OH
OCH3
.
OH
.
O
CH2
OH
.
CH2 O-
(C)(B)(A)
(1)
(2)
(5)
(6)
(3)
(4)
(3)
(4)
(1)
(2)
(3)
(4)
(1)
(2)
Figure 5-8: Possible degradation pathways of C5 substituted/condensed phenolic hydroxyl group:
(A) β-5, (B) 4-O-5, and (C) 5-5
Comparing the increases in the concentrations of guaiacyl (up to 2-fold increase), 4-
hydroxyphenyl (up to 3-fold), and catechol hydroxyl groups (up to 5-fold) shows that the

85
increase in the catechol hydroxyl group is significantly greater than the increase in the guaiacyl,
and p-hydroxyphenyl groups. This may be due to the further degradation of the guaiacyl hydroxyl
group into the catechol hydroxyl group, which is more favored than the degradation of the
guaiacyl hydroxyl into the 4-hydroxyphenyl hydroxyl group, as shown in Figure 5-7-C, and
Figure 5-8-B(5) respectively. This confirms what was mentioned earlier. However, increasing the
pyrolysis temperature decreases the concentration of catechols, as shown in Table 5.4. This might
be the result of further degradations of the produced catechols. Ledesma, Marsh et al. 2002
(Ledesma, Marsh et al. 2002) reported catechol pyrolysis at a range of 973-1273 K, using CH,
with a residence time of 0.4 s. According to their results, the decomposition of catechol started
slowly at 873 K and then increased significantly at 973 K to 1173 K. This is in agreement with
the results presented here; catechols concentration decreased from 1.64 to 1.49 mmol/g when the
temperature increased from 900 to 1065 K and decreased further when the temperature increased
to 1240K. This confirms the occurrence of further degradation of the produced catechols. Many
suggested mechanisms for this decomposition reported by Ledesma, Marsh et al. 2002 (Ledesma,
Marsh et al. 2002).
The GC-MS analysis presented in Table 5.3 and the 31
P NMR analyses are in agreement that the
most abundant identified groups are the guaiacols. This suggests that guaiacol groups are
abundant in the materials that could not be identified by GC-MS.
Since lignin does not interact well with electromagnetic waves (EMW), the decomposition of
aliphatic hydroxyl groups is more sensitive to the char wt% than to the nominal power setting.
For instance, at the nominal power setting of 1.5 kW, the concentration of aliphatic hydroxyl
groups was decreased from 0.18 to 0.06 mmol/g when the char wt% was increased from 20 to
40%. In addition, at the nominal power setting of 2.7 kW, it was decreased from 0.17 to 0.08
mmol/g, at the same char wt% concentrations, as illustrated in Table 5.4. In other words, the
nominal power setting has a negligible effect on the degradation of aliphatic hydroxyl groups
compared to the effect of char wt%.

86
5.3.4 Quantitative 13C NMR Analyses for the Oil Phase
In order to achieve full characterization for the functional groups in the oil phase as well as the
virgin material, quantitative 13
C NMR spectroscopy was performed on every sample, for a total
of six samples. Figure 5-9 depicts a typical 31
C NMR spectra and Table 5.5 summarizes the
integration for the analysed samples.
Figure 5-9: Quantitative 13
C NMR spectra for the oil phase and the virgin material

87
Table 5.5: Concentrations of different types of carbon atoms measured by quantitative 13C NMR
spectroscopy of the virgin lignin and the oil phase after pyrolysis at different power settings, char
wt%, and temperatures
Functional group
Integration
region (ppm)
(Ben and
Ragauskas
2011)
Examples
Concentration in oil phase (C mol%) Conc.
in
lignin
(C
mol%) 900K 980K 1065K 1150K 1240K
Carbonyl or Carboxyl 215.0 – 166.5
0.11 0.06 0.0 0.0 0.0 0
Aromatic C-O 166.5 – 142.0
23.5 23.9 26.1 28.4 25.4 32.18
Aromatic C-C 142.0 – 125.0
10.8 11.6 11.7 6.2 8.3 21.05
Aromatic C-H 125.0 – 95.8
46.1 42.2 39.9 42.2 43.0 21.21
Aliphatic C-O 95.8 – 60.8
0.0 0.0 0.0 0.1 0.0 0
Methoxyl-Aromatic 60.8 – 55.2
9.5 10.4 11.5 12.3 11.1 22.38
Alip
hatic
C-C
Total 55.2 – 0.0
10.0 12.0 10.7 10.8 12.1 3.19
Methyl - Aromatic 21.6 – 19.1
4.3 6.0 5.6 5.4 5.7 0
Methyl - Aromatic
ortho to a hydroxyl
or methoxyl group
16.8 – 15.4
5.4 4.3 4.2 4.3 4.6 0
Up to 80% of the identified carbons in the oil phase are aromatic carbons, which is similar to
what was reported by Ben and Ragauskas. 2011, 70-80% (Ben and Ragauskas 2011). This result
is very significant because it demonstrates that the oil phase is mostly aromatics, which is logical
according to the chemical structure of lignin. The number of aromatic C-O and C-C bonds in the
oil phase was less than that in the virgin-material. On the other hand, the number of aromatic C-H
bonds in the oil phase was more than that in the virgin material for all the investigated conditions.
Together, the 13
C NMR and 31
P NMR results support the degradation pathways proposed above.
The decreased number of C-O aromatic bonds after the MWP may be due to the decomposition
of the ether bond during MWP, as illustrated in Figure 5-8. In addition, the further decomposition

88
of the o-hydroxyphenoxymethyl radical could have contributed to the decrease, as in Figure 5-8-
B ((5), (6)), although this is not favored. The decreased number of Carom-C bonds may be due to
the degradation of the carboxyl hydroxyl group and the C5 substituted/condensed phenolic
hydroxyl groups, as in β-5 and 5-5 bonds, as presented in Figures 5-7-B and 5-8, respectively. On
the other hand, the increased number of Carom-H bonds may be due to the decomposition of the
ether bond during pyrolysis and the degradation of Carom-C bonds, as illustrated in Figure 5-8. In
addition, the changes in the number of C-H bond are interrelated with the modifications in the C-
C and C-O bonds. As a result, when the percentage of C-O and/or C-C bonds was reduced, the
percentage of C-H bonds increased, as shown in Table 5.5. The increased number of Cmethyl-Carom
bonds may be due to the cleavage of the aliphatic hydroxyl groups, as shown in Figure 5-7-A.
Table 5.6 shows the measured hydroxyl groups in this work in contrast to those published by Ben
and Ragauskas, 2011 using CP (Ben and Ragauskas 2011). In general, both methods (CP and
MWP) caused the same change, either an increase or a decrease, in the concentrations of the
different types of OH groups in the oil relative to the virgin lignin. However, the concentration of
most hydroxyl types after MWP at each temperature is lower than that in CP. For example, the
concentration of aliphatic hydroxyl groups was lower after MWP than after CP. This resulted in a
greater yield of the aqueous phase, in this work, than that reported in Ben and Ragauskas, 2011.
Table 5.7 shows the same comparison for the carbon atoms detected by quantitative 13
C NMR.
Again, in general, both methods (CP and MWP) caused the same change, either an increase or a
decrease, in the concentrations of the different types of C atoms in the oil relative to the virgin
lignin. Nonetheless, higher concentrations of Carom-O and Carom-H were found after MWP than
after CP. The reason for that might be due to differences in the average and maximum
temperatures, the difference in the virgin material characteristics, and/or the applied heating
mechanism. Accordingly, further effort is needed to explore this point, which will be considered
in the future work.

89
Table 5.6: Concentrations of different hydroxyl groups determined by quantitative 31P NMR
spectroscopy of the virgin lignin and the oil phases obtained after microwave pyrolysis and
conventional pyrolysis at various conditions
Functional group MWP (mmol/g oil)
CP (mmol/g oil) (Ben and Ragauskas 2011)
900K 980K 1065K 1150K 1240K lignin 673K 773K 873K 973K Lignin
Aliphatic OH 0.18 0.17 0.31 0.06 0.08 1.48 0.28 0.36 0.36 0.35 1.73
C5 substituted
condensed phenolic OH
β-5 0.25 0.23 0.33 0.33 0.13 0.5 0.47 0.47 0.4 0.41 0.59
4-O-5 0.22 0.2 0.26 0.29 0.09 0.32 0.26 0.31 0.31 0.34 0.42
5-5 0.03 0.01 0.08 0.15 0.11 0.55 0.35 0.35 0.31 0.3 0.76
Guaiacyl phenolic OH 2.12 1.83 2.2 3.08 1.91 1.44 3.05 2.93 2.33 2.28 1.53
Catechol type OH 1.64 1.44 1.49 1.2 0.58 0.35 1.34 1.49 2.02 2.22 0.17
p-Hydroxy-phenyl OH 0.89 0.8 0.72 0.44 0.21 0.27 0.33 0.46 0.49 0.55 0.14
Acid-OH 0.57 0.46 0.42 0.08 0 0.43 0.26 0.33 0.37 0.37 1.05
Table 5.7: Concentrations of different types of carbon atoms measured by quantitative 13C NMR
spectroscopy of an oil phase produced after microwave pyrolysis and conventional pyrolysis at
various conditions
Functional group MWP (C mol%) CP (C mol%) (Ben and Ragauskas 2011)
900K 980K 1065K 1150K 1240K lignin 673K 773K 873
K
973
K Lignin
Carbonyl or Carboxyl 0.11 0.06 0.0 0.0 0.0 0 0.5 0.6 0.9 0.3 1.6
Aromatic C-O 23.5 23.9 26.1 28.4 25.4 32.18 15.7 16.3 16.7 20.6 27.3
Aromatic C-C 10.8 11.6 11.7 6.2 8.3 21.05 14 15.9 22.7 26.9 25.8
Aromatic C-H 46.1 42.2 39.9 42.2 43.0 21.21 36.5 33.2 29.7 29.4 26.4
Aliphatic C-O 0.0 0.0 0.0 0.1 0.0 0 0.6 0.5 0.1 0.5 5.8
Methoxyl-Aromatic 9.5 10.4 11.5 12.3 11.1 22.38 9.6 8.5 5.4 4.5 12.9
Ali
phat
ic
C-C
Total 10.0 12.0 10.7 10.8 12.1 3.19 23.1 25 24.4 17.8 0.3
Methyl - Aromatic 4.3 6.0 5.6 5.4 5.7 0 3.9 4.3 4.5 3.2 0.0
Methyl - Aromatic ortho to a hydroxyl or methoxyl
group
5.4 4.3 4.2 4.3 4.6 0 2.4 2.7 3.3 2.2 0.0

90
5.4 Conclusions and Future Work
A detailed compositional analysis and structural investigation of bio-oil produced via microwave
pyrolysis (MWP) of Kraft lignin was accomplished. MWP was performed at different conditions
of weight-% of a thermal-microwave-catalyst (char, 20-40%) and nominal power setting (1.5-2.7
kW). GC-MS analysis was implemented on the oil and aqueous phases, and 31
P and 13
C NMR
analyses were performed on the oil phase and the virgin material. One of the main conclusions of
this work includes the greater effect of char wt% than power setting on the heating rate.
Increasing the pyrolysis final temperature augmented the total obtained liquid yield. However,
beneficial depending on the structure of the liquid phases as well as the water content. The
identified concentrations of chemical compounds obtained in the oil phase were 173.9-237.4
mg/g in contrast to 9.3-24.1mg/g identified in the aqueous phase. Nonetheless, a concentration of
583-707 mg/g of the oil phase could not be identified, due to the limitations of the GC-MS.
Therefore, a GC-MS analysis is inadequate to provide a detailed structure of the pyrolysis liquids.
On the basis of 31
P and 13
C NMR analyses, up to 80% of the carbon atoms in the oil phase were
aromatic carbons. The concentration of aliphatic hydroxyl groups in the virgin material was
significantly decreased by the MWP. This was attributed to water forming during the thermal
degradation of the lignin network. The decreased concentrations of C5 substituted/condensed
phenolic hydroxyl groups after MWP could be attributed to the increase in the concentrations of
guaiacyl, p-hydroxyphenyl, and catechol hydroxyl groups.
One of the demonstrated conditions will be performed in a kinetic modeling study to simulate the
MWP products, solid, liquid, and gas, as well as the extracted chemicals phenolics, aliphatics,
and tar using a lumping approach.
5.5 Acknowledgements
The authors thank Mr. Yazid Belkhir and Mr. Robert Delisle (Technicians at Ecole Polytechnique
Montreal) for their assistance in the experimental setup, and Dr. Levent Erdogan (Electrical
Engineering Department, Ecole Polytechnique Montreal) and Ms. Mai Attia (Student at UQAM
University Montreal) for their assistance in this work. In addition, the authors are grateful for the

91
financial and technical support from Lignoworks NSERC Strategic Network (lignoworks.ca), and
providing the virgin material from FPInnovations, Montreal, Quebec, Canada.

92
CHAPTER 6 ARTICLE 4: A LUMPED APPROACH IN KINETIC
MODELING OF MICROWAVE-PYROLYSIS OF KRAFT LIGNIN
Sherif Faraga, Lamfeddal Kouisni
b, and Jamal Chaouki
a
aCRIP-Biorefinery Centre, Department of Chemical Engineering, École Polytechnique de Montréal.
P.O. Box 6079, Station Centre-ville, Montréal, QC, Canada H3C 3A7.
bFPInnovations-Pulp&Paper Division, 570 Saint-Jeab Blvd. Pointe-Claire, QC, Canada
(Published in energy & fuels Journal, DOI: 10.1021/ef4023493)
Presentation of the article: The MW-TGA that was built in the second article and the obtained
results in the third article will be employed to describe the kinetics of microwave pyrolysis of
kraft lignin. Three different models will be presented: the first model, considers the virgin
material converted into solid, condensable gas, and non condensable gas. The second model
distinguishes between the water and the chemicals extracted in the condensable gas. The third
model presents further investigations for the extracted chemicals in the oil phase.
93
Abstract
This work presents three kinetic models based on a lumping approach to describe the microwave
pyrolysis of kraft lignin. The first model considered the formation of the main pyrolysis products,
condensable gas, non-condensable gas, and the remaining solid, taking into consideration each as
an individual lump. The second model investigated the liquid product while dividing the
condensable gas into oil and water products. The oil product contains only chemicals whereas the
water product does not contain any chemicals. In the third model, the oil product was separated
into four main groups: (1) phenolics, which contain all the identified phenolic components using
a GC-MS analyzer; (2) heavy molecular weight components, which contain all the identified
heavy molecular weight and undefined components, using GC-MS; (3) non-phenolic aromatics
with a single ring; and (4) aliphatics. The comparison of the predicted results using the estimated
kinetic parameters against the experimental data showed the high capability of the presented
models to estimate the products yield under the selected conditions.
Keywords: Microwave Pyrolysis, Microwave-thermo-gravimetric Analyzer, Kraft lignin, and
Reaction Kinetics

94
6.1 Introduction
Lignocellulosic biomass is composed of three intertwined components: cellulose, hemicellulose,
and lignin. The percentage of each varies from one species to another, one environment to
another, and depending on many other conditions. Generally, the dry weight basis of each
component is 35-45%, 25–30%, and 20–35%, respectively (Zakzeski, Bruijnincx et al. 2010, de
Wild, Huijgen et al. 2012, Mu, Ben et al. 2013). Lignin is considered the only renewable source
of aromatic hydrocarbons on earth and is the third most abundant natural polymer after cellulose
and hemicellulose (Zakzeski, Bruijnincx et al. 2010, Kibet, Khachatryan et al. 2012, Mu, Ben et
al. 2013). In the US paper industry, the annual production of lignin as a byproduct is over 50
million tons; however, only 2% of this amount is converted into bio-products, while the rest is
combusted to recover energy and recycle the pulping chemicals.
Lignin can be considered as a renewable resource with a great potential as an alternative to fossil
fuel based chemicals. This approach would be one of the best routes to valorize lignin and deal
with the challenges that have been facing the Canadian forest industry for the last few years.
Furthermore, it would help to compensate for the increase in demand and prices for energy and
chemicals.
In general, thermal, biological, and physical technologies are the three most popular technologies
used to convert lignin into energy and/or chemicals. Pyrolysis is one of the techniques belonging
to thermal technology. It is the thermal decomposition of the chemical bonds of a target material
by means of supplying heat in an inert environment. The case of providing essential heat energy
via electromagnetic irradiation is called microwave pyrolysis (MWP), which is applied in this
work. Further information regarding the fundamentals of microwave heating can be found in
references (Farag, Sobhy et al. 2012, Doucet, Laviolette et al. 2013).
Pyrolysis of lignin produces three main products: (1) solid, which is mostly carbon ≈ 90 wt%; (2)
non-condensable gas, which is combustible; and (3) condensable gas. The condensable gas can be

95
separated into oil and aqueous phases. The oil phase is denser than the aqueous phase and mostly
aromatics, whereas the aqueous phase is mostly water, ≈75 wt% (Farag., Fu. et al. 2013). The
yield of these products depends on several parameters, such as pyrolysis temperature, heating
rate, residence time, presence of a catalyst, pyrolyser design, and the characteristics of the virgin
material, etc.
In the scientific literature, the pyrolysis of lignin has been investigated from several different
aspects, such as product distributions (Jiang, Nowakowski et al. 2010, Lou and Wu 2011),
presence of a catalyst (Mullen and Boateng 2010, Rutkowski 2011), and reaction kinetics
(Ferdous, Dalai et al. 2002, Montané, Torné-Fernández et al. 2005, Mani, Murugan et al. 2008,
Faravelli, Frassoldati et al. 2010, Jiang, Nowakowski et al. 2010, Janković 2011). However, only
a modest effort was made in these investigations. Nevertheless, in spite of this modest effort,
publications that investigate the kinetics of pyrolysis products compositionally are quite scarce in
the literature. This is a consequence of the particular requirements in the experimental setup,
which forced most of the researchers investigate the kinetic of devolatilization rather than the
kinetics of individual products. Accordingly, a kinetic study that takes into consideration the
composition of the pyrolysis products is essential. Such a study would lead to an improved
understanding of the underlying processes and provide the necessary information for the rational
design and scaling-up of pyrolysis reactors. Therefore, this work does not only intend to
investigate the kinetics of lignin MWP products, i.e., solid, liquid, and gas, but will also consider
further details about the composition of the liquid phase.
In order to achieve this objective, the microwave thermo-gravimetric analyzer (MW-TGA) that
was used in Farag and Chaouki 2013 (Farag. and Chaouki. 2013) was modified and employed in
this work. The modifications made in this setup make it possible to distribute the vapor product
up to 7 parts during MWP, which makes the kinetic investigation of the pyrolysis products
compositionally attainable.
96
This work was carried out by applying the best experimental condition reported in reference
(Farag., Fu. et al. 2013), which gave the maximum concentration of phenolics in the liquid
product. CHNS, 13
C NMR, 31
P NMR, and approximate analyses were implemented on the virgin
material. Gas Chromatograph-Mass Spectrometer (GC-MS) analysis and water content
measurement were performed on the obtained liquids. Subsequently, the results were processed
mathematically to calculate the yield of each product at the selected temperatures. Finally, three
kinetic models based on the lumping approach were applied, and their kinetic parameters were
estimated. The yield of each product was predicted using the estimated parameters and then
compared against the experimental data to validate the presented models.
6.2 The Experimental Work
6.2.1 The Virgin Material
In this work, the virgin material was softwood kraft lignin supplied by FPInnovations, Pointe-
Claire, Quebec, Canada. It was precipitated from a Canadian kraft mill using The LignoForce
System™
a patent pending process that was developed by FPInnovations and licenced to
NORAM Engineers and Constructors, Vancouver, BC, Canada for commercialization. Lignin
was characterized by CHNS elemental analysis (C=63.27%, H=5.79%, N=0.07%, and S=1.56%),
and approximate analysis (fixed carbon=37%, volatiles=62%, and ash=1%). The 13
C and 31
P
NMR analyses were performed on the virgin material and reported in reference (Farag., Fu. et al.
2013) and will, therefore, not be presented here.
According to the dielectric and physical properties of the virgin material, lignin is not a good
microwave-to-heat convertor. However, it needs a high temperature to fully decompose as its
structure is rather complex. Therefore, enough heat energy must be provided for the occurrence
of pyrolysis. Otherwise, the extracted product takes the form of a tar-like product, which is ex-
pulsed out of the lignin particles forming an extremely sticky material. Finally, after cooling, the
formed material converts into a very strong block, which is exceedingly difficult to break down.
Accordingly, lignin was mixed with char, which is the solid product of the MWP of lignin, by a
constant ratio of 30% weight basis. Char was only considered as a microwave-to-heat convertor,
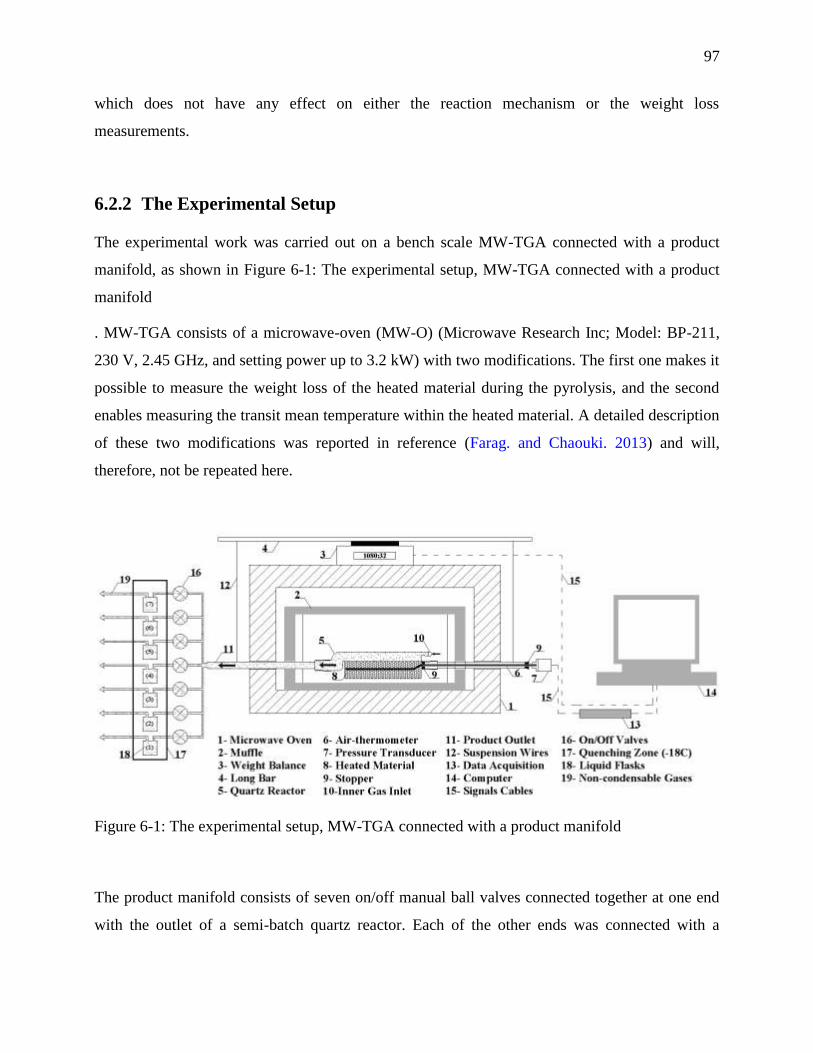
97
which does not have any effect on either the reaction mechanism or the weight loss
measurements.
6.2.2 The Experimental Setup
The experimental work was carried out on a bench scale MW-TGA connected with a product
manifold, as shown in Figure 6-1: The experimental setup, MW-TGA connected with a product
manifold
. MW-TGA consists of a microwave-oven (MW-O) (Microwave Research Inc; Model: BP-211,
230 V, 2.45 GHz, and setting power up to 3.2 kW) with two modifications. The first one makes it
possible to measure the weight loss of the heated material during the pyrolysis, and the second
enables measuring the transit mean temperature within the heated material. A detailed description
of these two modifications was reported in reference (Farag. and Chaouki. 2013) and will,
therefore, not be repeated here.
Figure 6-1: The experimental setup, MW-TGA connected with a product manifold
The product manifold consists of seven on/off manual ball valves connected together at one end
with the outlet of a semi-batch quartz reactor. Each of the other ends was connected with a

98
condenser, kept at -18 oC using a traditional freezer. The condensation system consists of sets of
vertical metallic tubes. Each set was connected in series at one end, whereas the other end was
connected to a 500 ml two neck Pyrex flask. These flasks were used to collect the condensable
gases while the non-condensable gas passes directly through. In order to prevent a vapor
condensation barrier to the condensers forming, all the connections and the product manifold
were kept at 200 oC using external-temperature heat cables (Flexible electric heating tape, AWH-
051-020D; 760 oC; 1.3 A; 156 W; and 120 V, HTS/Amptek, USA)
6.2.3 The Method
The procedures of the experimental work are described below. First, the freezing zone was
switched on to reduce the condensers temperature to -18 oC. In the meantime, the electric heaters
were switched on to keep the temperature barrier to the condensation system at 200 oC. Second,
the reactor was filled with an initial mass of 70 wt% of lignin + 30 wt% of char and then
connected as shown in Figure 6-1: The experimental setup, MW-TGA connected with a product
manifold
. Subsequently, the signal cables of the scale and the thermometer were connected with a data
acquisition system, and the whole system was purged by an inert gas (N2). Third, the valves of
the product manifold were closed, except for valve number 1, which was kept open. After that,
the oven power was adjusted to 2.1 kW and switched on for 800 s, which is the required time for
full conversion. Once the payload temperature reached T1, which is a selected temperature, valve
number 2 was turned on, and at the same time valve number 1 was turned off. The same
procedures were repeated at the other selected temperatures, T2, T3, T4, T5, and T6, which led to
the collection of the liquid product within different temperature ranges. Within the limitations of
the design setup, 6 liquids in total could be collected. Finally, after 800 s of MWP and once the
obtained liquids and the solid product had reached the ambient temperature, they were collected
and weighted. The mass of the non-condensable gas was calculated by subtracting the liquid and
solid masses from the initial mass of lignin. The obtained liquids were separated into the oil
phase, which is the dense one and contains mostly chemicals and the aqueous phase, which is
lower in density than the oil phase, and contains mostly water.

99
The analyses of every liquid sample (12 samples in total) were carried out at FPInnovations, QC,
Canada, using a Varian 3900 GC equipped with a Saturn 2100T MS (ion trap) and selective ion
chromatogram for peak integration. The column used was DB-1701, 30 m × 0.25 mm ID× 0.25
µm film thickness with an injector temperature of 280 °C. Helium was used as the carrier gas
with a constant flow rate of 1 ml/min and a split ratio of 75:1. The MS scan range was 41-650
amu, 70 eV, with an ion trap detector and the transfer line temperature was 300 °C. The oven was
held at 70 °C for 2 min and then ramped up at 5 °C/min to 300 °C; the total run time was 48 min.
Prior to the GC-MS injection, 25 µl of each oil phase was diluted to 1 ml of MeOH, while 250 µl
of each aqueous phase was diluted to 1 ml of MeOH. Then, every sample was filtered with a 5
µm Teflon membrane to remove the presence of particles. The identification of the individual
compound was performed by comparing the mass spectrum to those reported in the ―NIST MS
Search V2.0‖ Library. Identification of a probability match using the GC-MS software library is
less than 90 for a good portion of the compounds. Quantitation is based on an internal standard
with a relative response factor of 1 used for all compounds.
Water content in the oil and aqueous phases was measured using a Metrohm Titrando 836/803
with a KF titration unit.
Transient mean temperatures were measured using the innovated thermometer that was used in
Farag. and Chaouki. 2013 (Farag. and Chaouki. 2013); kindly refer to that paper for a detailed
description, calibration, and validation of this thermometer. Figure 2 shows the measured values,
using this thermometer, and the predicted ones, using the mathematical model published in Farag,
Sobhy et al. 2012 (Farag, Sobhy et al. 2012), taking into consideration the characteristics of
lignin as well as the pyrolysis conditions.

100
0 200 400 600 800
Time [K]
300
500
700
900
1100
1300
Tem
per
atu
re [
K]
Experimental
Predicted
Figure 6-2: The measured and the predicted transient mean temperature of the MWP of Kraft
lignin at 2.1 kW and 30 wt% char
6.3 The Implemented Kinetic Models
Three different kinetic models based on the lumping approach were implemented in this work.
The first model considered that the virgin material was converted into three main products: solid,
condensable gas, and non-condensable gas. The condensable gas was separated into oil and
aqueous phases, and the water content was measured in both phases. Subsequently, further
mathematical processes were carried out on the measurements to present two products: oil, which
has only chemicals with no water content; and water, which does not contain any chemicals.
Herein, since the virgin material was first dried, the obtained water was considered as a product,
which could be the result of a cleavage of the lignin site chain hydroxyl groups, as was presented
in references (Farag., Fu. et al. 2013). Therefore, the second model assumed that the lignin was
converted into four main products: solid, oil, water, and non-condensable gas.
GC-MS was performed on the oil phase as well as the aqueous phase. Then, the results were
processed mathematically to present the yield of four chemical groups at the selected
temperatures: (1) phenolics group, which contains all the identified phenolic components; (2)
heavy molecular weight components group (HMWC), which contains all the heavy molecular

101
weight and unidentified components using the GC-MS analyzer; (3) aromatics with a single ring
non-phenolics group (ASR-Non-Ph); and (4) aliphatics group, which contains all the identified
aliphatic components. Accordingly, the third model considered that lignin was converted into
seven products: the previous four chemical groups, plus solid, water, and non-condensable gas
products.
6.3.1 The First Model
The first model assumes the reactant, which is the virgin material, is converted into three
products: solid, condensable gas, and non-condensable gas. Each product is formed via a parallel
elementary reaction, as follows.
Lignin
𝑑𝑆
𝑑𝑡= −𝑘𝑜𝑠 𝑒
−𝐸𝑎𝑠𝑅𝑇 𝑆 − 𝑆∞
𝑛𝑠 = −𝑘𝑜𝑙 𝑒−𝐸𝑎𝑙𝑅𝑇 𝑆 − 𝑆∞
𝑛𝑙 − 𝑘𝑜𝑔 𝑒−𝐸𝑎𝑔𝑅𝑇 𝑆 − 𝑆∞
𝑛𝑔 (6-1)
𝑑𝐿
𝑑𝑡= 𝑘𝑜𝑙 𝑒
−𝐸𝑎𝑙𝑅𝑇 𝑆 − 𝑆∞
𝑛𝑙 (6-2)
𝑑𝐺
𝑑𝑡= 𝑘𝑜𝑔 𝑒
−𝐸𝑎𝑔𝑅𝑇 𝑆 − 𝑆∞
𝑛𝑔 (6-3)
where; ko is the pre-exponential factor [time-1
], Ea is the apparent activation energy [J/mol K], T
is the reaction temperature [K], and R is the universal gas constant [J/mol K]. The subscripts s, l,
and g are referring to the solid product, which is the remaining solid as it is very difficult to
distinguish between the un-reacted lignin and the produced char; the liquid, which is the
condensable gas; and gas, which is the non-condensable gas, respectively. S, L and G are the
remaining solid, the condensable gas, and the non-condensable gas yields at any time/temperature
Remaining Solid
Condensable Gas
Non-Condensable Gas

102
[-], respectively. S∞ is the final solid yield, which is the measured weight of solid at the final
temperature to the feed weight of lignin [-].
6.3.2 The Second Model
As mentioned earlier, the second model considers that the virgin material is converted into four
products: solid, oil, water, and non-condensable gas. Each was formed via a parallel elementary
reaction with its own kinetic parameters, as follows.
Lignin
𝑑𝑆
𝑑𝑡= −𝑘𝑜𝑠 𝑒
−𝐸𝑎𝑠𝑅𝑇 𝑆 − 𝑆∞
𝑛𝑠
= −𝑘𝑜𝑜 𝑒−𝐸𝑎𝑜𝑅𝑇 𝑆 − 𝑆∞
𝑛𝑜 − 𝑘𝑜𝑤 𝑒−𝐸𝑎𝑤𝑅𝑇 𝑆 − 𝑆∞
𝑛𝑤 − 𝑘𝑜𝑔 𝑒−𝐸𝑎𝑔𝑅𝑇 𝑆 − 𝑆∞
𝑛𝑔 (6-4)
𝑑𝑂
𝑑𝑡= 𝑘𝑜𝑜 𝑒
−𝐸𝑎𝑜𝑅𝑇 𝑆 − 𝑆∞
𝑛𝑜 (6-5)
𝑑𝑊
𝑑𝑡= 𝑘𝑜𝑤 𝑒
−𝐸𝑎𝑤𝑅𝑇 𝑆 − 𝑆∞
𝑛𝑤 (6-6)
where, o and w refer to the oil and water products. O and W are the yields of the oil and water
products, respectively. The remaining solid and the non-condensable gas yields can be obtained
from Equations (6-2) and (6-3), respectively.
Remaining Solid
Oil
Water
Non-Condensable Gas

103
6.3.3 The Third Model
The third model takes into consideration the chemical composition of the liquid product.
Therefore, it considers the reactant is converted into seven products: remaining solid, phenolics,
ASR-Non-Ph, aliphatics, HMWC, water, and non-condensable gas.
Lignin
𝑑𝑆
𝑑𝑡= −𝑘𝑜𝑠 𝑒
−𝐸𝑎𝑠𝑅𝑇 𝑆− 𝑆∞ 𝑛𝑠
= −𝑘𝑜𝑃 𝑒−𝐸𝑎𝑃𝑅𝑇 𝑆 − 𝑆∞
𝑛𝑃 − 𝑘𝑜𝐴𝑆𝑅 −𝑁𝑜𝑛 −𝑃 𝑒
−𝐸𝑎𝐴𝑆𝑅 −𝑁𝑜𝑛 −𝑃𝑅𝑇 𝑆 − 𝑆∞
𝑛𝐴𝑆𝑅 −𝑁𝑜𝑛 −𝑃
− 𝑘𝑜𝑎 𝑒−𝐸𝑎𝑎𝑅𝑇 𝑆 − 𝑆∞
𝑛𝑎 − 𝑘𝑜𝑡 𝑒−𝐸𝑎𝑡𝑅𝑇 𝑆 − 𝑆∞
𝑛𝑡 − 𝑘𝑜𝑤 𝑒−𝐸𝑎𝑤𝑅𝑇 𝑆 − 𝑆∞
𝑛𝑤 − 𝑘𝑜𝑔 𝑒−𝐸𝑎𝑔𝑅𝑇 𝑆 − 𝑆∞
𝑛𝑔
(6-7)
𝑑𝑃
𝑑𝑡= 𝑘𝑜𝑃 𝑒
−𝐸𝑎𝑃𝑅𝑇 𝑆 − 𝑆∞
𝑛𝑃 (6-8)
𝑑(𝐴𝑆𝑅 − 𝑁𝑜𝑛 − 𝑃)
𝑑𝑡= 𝑘𝑜𝐴𝑆𝑅𝑁𝑃
𝑒−𝐸𝑎𝐴𝑆𝑅𝑁𝑃
𝑅𝑇 𝑆 − 𝑆∞ 𝑛𝐴𝑆𝑅 −𝑁𝑜𝑛 −𝑃 (6-9)
𝑑𝐴
𝑑𝑡= 𝑘𝑜𝑎 𝑒
−𝐸𝑎𝑎𝑅𝑇 𝑆 − 𝑆∞
𝑛𝑎 (6-10)
𝑑(𝐻𝑀𝑊𝐶)
𝑑𝑡= 𝑘𝑜𝐻𝑀𝑊𝐶
𝑒−𝐸𝑎𝐻𝑀𝑊𝐶 𝑡
𝑅𝑇 𝑆 − 𝑆∞ 𝑛𝐻𝑀𝑊𝐶 (6-11)
where Ph, ASR-Non-Ph, A, and HMWC are the instantaneous yield of phenolics, aromatics with a
single ring non-phenolics, aliphatics, and heavy molecular weight components group,
Remaining Solid
Phenolics
ASR-Non-Ph
Aliphatic
HMWC
Water
Non-Condensable Gas

104
respectively. The water yield can be obtained from Equation (6-6), whereas the remaining solid
and the non-condensable gas yields can be had from Equations (6-2) and (6-3), respectively.
In order to eliminate the effect of the heating rate (β), the reaction rate equations from (6-1) to
(6-11) were divided by β. Therefore, they become temperature based rather than time based,
which means the left hand side becomes 𝑑
𝑑𝑇 rather than
𝑑
𝑑𝑡.
6.4 The Parameters Estimation
In order to estimate the kinetic parameters, ko, Ea, and n, the reaction rate equations of each
model were implemented in MATLAB® program codes after the transfer to a linear domain, as in
the form of equation (6-12).
𝑦 = 𝑎𝑜 + 𝑎1𝑥1 + 𝑎2𝑥2 (6-12)
where, the dependent parameter, y, is the natural logarithm (ln) of dS/dT, and ao, a1 and a2 are
constants equal to ln ko/β, Ea/R, and n, respectively. The independent parameters, x1 and x2,
represent 1/T and ln (S- S∞), respectively.
MATLAB’s fminsearch/fminsearchbnd was applied using the initial conditions that were
obtained from the experimental work. The optimum values of the estimated parameters were
acquired based on minimizing the square difference between the predicated result and the
experimental data (yModel
and y
Exp), according to equations (6-13) and (6-14), where N is the
number of fitted points and p is the number of model parameters (Chen, Zhang et al. ,
Radmanesh, Courbariaux et al. 2006). Furthermore, a contour map was created to obtain an
overall view for all the suitable values, and then the optimal ones were chosen.
𝑂𝑏𝑗 =1
𝑁 − 𝑝 (𝑥𝑖
𝑀𝑜𝑑𝑒𝑙 − 𝑥𝑖𝐸𝑥𝑝 )2
𝑛
𝑖=1
(6-13)
𝐷𝑒𝑣𝑖𝑎𝑡𝑖𝑜𝑛 − % = 100 × 𝑂𝑏𝑗 (6-14)

105
The estimated parameters were applied to predict the yields of each product using Ode(s)
MATLAB’s solvers to solve the ordinary differential equation of each implemented model.
6.5 The Results and Discussions
Microwave pyrolysis of kraft lignin was carried out using a constant weight percentage of a
microwave-to-heat converter, 30%, and a constant nominal power setting, 2.1 kW. Figure 6-3-A
demonstrates the transient remaining solid fraction at the selected temperatures, experimental and
predicted. The experimental data was fitted using the scenario explained previously. In order to
check the sensitivity of the implemented model, different reaction orders including a first and
second order were applied during the fitting procedures. The first and second reaction orders are
presented here, while the remaining orders were found in-between and are, therefore, not
presented. Figure 6-3-B shows a contour map for the deviations between the experimental data
and the predicted results at different estimated values of ko and corresponding values of Ea. This
was performed by applying a first order reaction rate as it is representative of the experimental
results much better than the other investigated orders. Consequently, the first order reaction rate
was chosen for the remaining solid fraction for the remainder.
Figure 6-3-C shows the condensable gas yield, while Figure 6-3-D illustrates the non-
condensable gas yield at the selected temperatures. Table 6.1 presents the estimated kinetic
parameters of the remaining solid fraction, condensable gas, and non-condensable gas at a first
order reaction rate.

106
300 500 700 900 1100
Temperature [K]
0
0.2
0.4
0.6
0.8
1Y
ield
[-]
Remaining Solid
Experimental
Predicted at n=1
Predicted at n=2
(A) (B)
300 500 700 900 1100
Temperature [K]
0
0.1
0.2
0.3
0.4
0.5
0.6
Yie
ld [
-]
Condensable Gas
Experimental
Predicted at n=1
300 500 700 900 1100
Temperature [K]
0
0.1
0.2
0.3
0.4
0.5
0.6
Yie
ld [
-]
Non-condensable Gas
Experimental
Predicted at n=1
(C) (D)
Figure 6-3: (A) The experimental and predicted remaining solid fraction, (B) the contour map of
the calculated deviations using a first order reaction rate, (C) the transient condensable gas yield,
and (D) the transient non-condensable gas yield
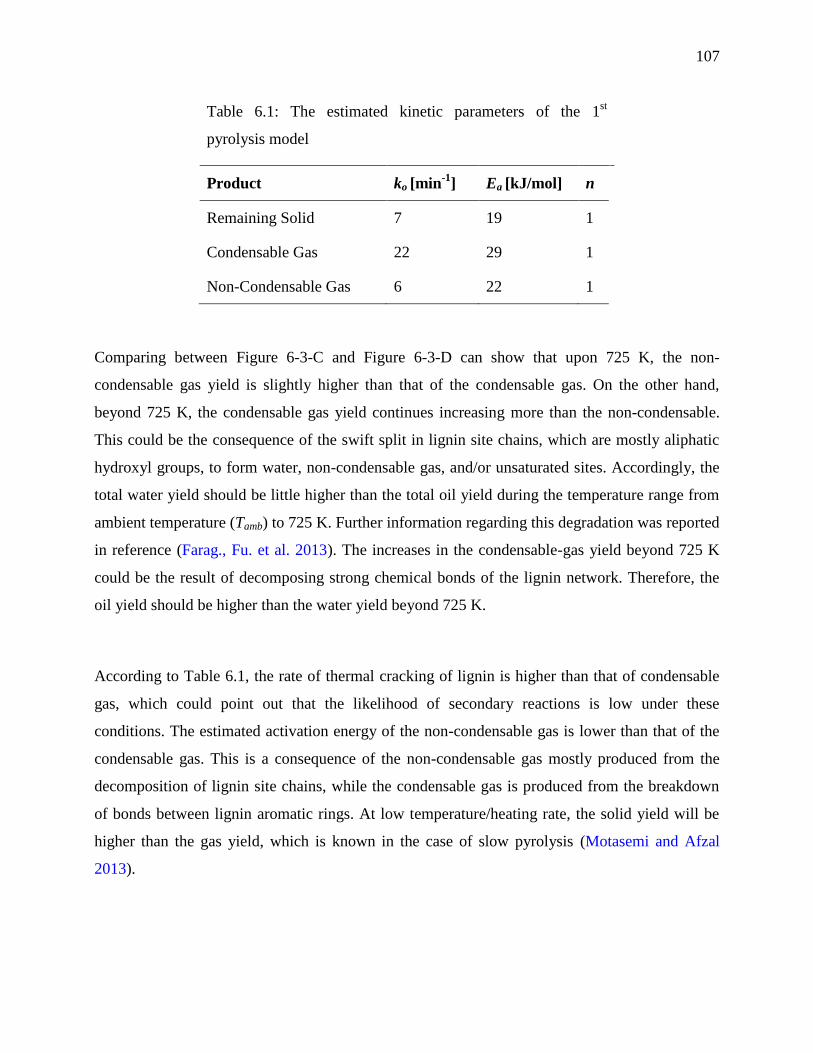
107
Table 6.1: The estimated kinetic parameters of the 1st
pyrolysis model
Product ko [min-1
] Ea [kJ/mol] n
Remaining Solid 7 19 1
Condensable Gas 22 29 1
Non-Condensable Gas 6 22 1
Comparing between Figure 6-3-C and Figure 6-3-D can show that upon 725 K, the non-
condensable gas yield is slightly higher than that of the condensable gas. On the other hand,
beyond 725 K, the condensable gas yield continues increasing more than the non-condensable.
This could be the consequence of the swift split in lignin site chains, which are mostly aliphatic
hydroxyl groups, to form water, non-condensable gas, and/or unsaturated sites. Accordingly, the
total water yield should be little higher than the total oil yield during the temperature range from
ambient temperature (Tamb) to 725 K. Further information regarding this degradation was reported
in reference (Farag., Fu. et al. 2013). The increases in the condensable-gas yield beyond 725 K
could be the result of decomposing strong chemical bonds of the lignin network. Therefore, the
oil yield should be higher than the water yield beyond 725 K.
According to Table 6.1, the rate of thermal cracking of lignin is higher than that of condensable
gas, which could point out that the likelihood of secondary reactions is low under these
conditions. The estimated activation energy of the non-condensable gas is lower than that of the
condensable gas. This is a consequence of the non-condensable gas mostly produced from the
decomposition of lignin site chains, while the condensable gas is produced from the breakdown
of bonds between lignin aromatic rings. At low temperature/heating rate, the solid yield will be
higher than the gas yield, which is known in the case of slow pyrolysis (Motasemi and Afzal
2013).

108
The condensable gas was divided into oil and aqueous phases and then the water content was
measured in both. Table 6.2 shows the measured value in every sample at the corresponding
temperatures. The obtained measurements were processed using equation (6-15) to calculate the
accumulated yield of water.
Table 6.2: The The measured water content in the aqueous and oil phases
Temperature range [K] Aqueous Phase
[wt%]
Oil Phase
[wt%]
295 - 530 90 8
530 - 697 90 8
679 - 776 80 8
776 - 859 89 8
859 - 950 84 8
950 - 1066 80 7
𝑊𝑎𝑡𝑒𝑟 𝑌𝑖𝑒𝑙𝑑𝑇 = (𝑤𝑎𝑞 % × 𝑚𝑎𝑞 )𝑖 + (𝑤𝑜% × 𝑚𝑜)𝑖 𝑖=𝑇𝑖=𝑇𝑎𝑚𝑏
𝑚𝑖
(6-15)
𝑂𝑖𝑙 𝑌𝑖𝑒𝑙𝑑𝑇 = ((100 − 𝑤𝑎𝑞 %) × 𝑚𝑎𝑞 )𝑖 + ((100 −𝑤𝑜%) × 𝑚𝑜)𝑖 𝑖=𝑇𝑖=𝑇𝑎𝑚𝑏
𝑚𝑖
(6-16)
where, water yieldT is the ratio between the weight of the formed water at temperature T to the
initial feed weight of lignin [wt%]. The waq% and wo% are the measured water content in the
aqueous and oil phases [wt%], respectively. The maq, mo, and mi are the obtained weights of the
aqueous phase, oil phase, and initial feed of lignin [g], respectively. The same scenario was
performed to calculate the accumulated yield of oil, using equation (6-16).

109
Figure 6-4-A demonstrates the accumulated yield of the obtained oil at the selected temperatures,
which contains 0% water content. Figure 6-4-B illustrates the yield of the water, which contains
0% chemicals. Table 6.3 shows the kinetic parameters of the two products, while for the solid
and non-condensable gas products, the parameters can be obtained from Table 6.1.
As expected, the swift split of the lignin site chains formed mainly water in addition to the non-
condensable gas, and/or the unsaturated sites. As a result, the water yield was found to be slightly
higher than the oil yield in the temperature range from Tamb to 725 K. In contrast, as soon as the
temperature reached 725 K, the water yield became lower than the oil yield. As a result, the
temperature of 725 K could be a critical temperature as most of the lignin network site chains had
been decomposed.
300 500 700 900 1100
Temperature [K]
0
0.05
0.1
0.15
0.2
0.25
0.3
Yie
ld
[-]
Oil Phase
Experimental
Predicted at n=1
300 500 700 900 1100
Temperature [K]
0
0.05
0.1
0.15
0.2
0.25
0.3
Yie
ld [
-]
Water
Experimental
Predicted at n=1
(A) (B)
Figure 6-4: The experimental and predicted yield of: (A) the oil phase and (B) formed water. The
points are the experimental, and the line is the fitting

110
Table 6.3: The estimated kinetic parameters of
the water and oil products.
Product ko [min-1
] Ea [kJ/mol] n
Water 9 27 1
Oil 27 33 1
According to Table 6.3, the estimated activation energy of the water is lower than that of the oil,
as the water is mostly formed due to the cleavage of the lignin site chains, whereas the oil is
formed due to the decomposing stronger bonds in the lignin network. Therefore, at high
temperature, the formation rate of oil is higher than that of formatting the water.
As mentioned above, the third model predicts the yield of the selected chemical groups. To
achieve this objective GC-MS was performed on the oil phase as well as the aqueous phase, in a
total of 12 samples, using the method that was mentioned above.
Figure 6-5 depicts the typical GC-MS chromatographs of the analyzed samples, and Table 6.4
summarizes the integration for every sample. In the GC-MS spectrum, the numbers from 1 to 6
refer to the collected sample temperature range, e.g., number 1 means the sample was collected
within the first temperature range, from 295K to 530K, etc. The letters h and L refer to the oil
phase and the aqueous phase, respectively.

111
(A)
(B)
Figure 6-5: The typical GC-MS chromatographs: (A) the oil phase, and (B) the aqueous phase
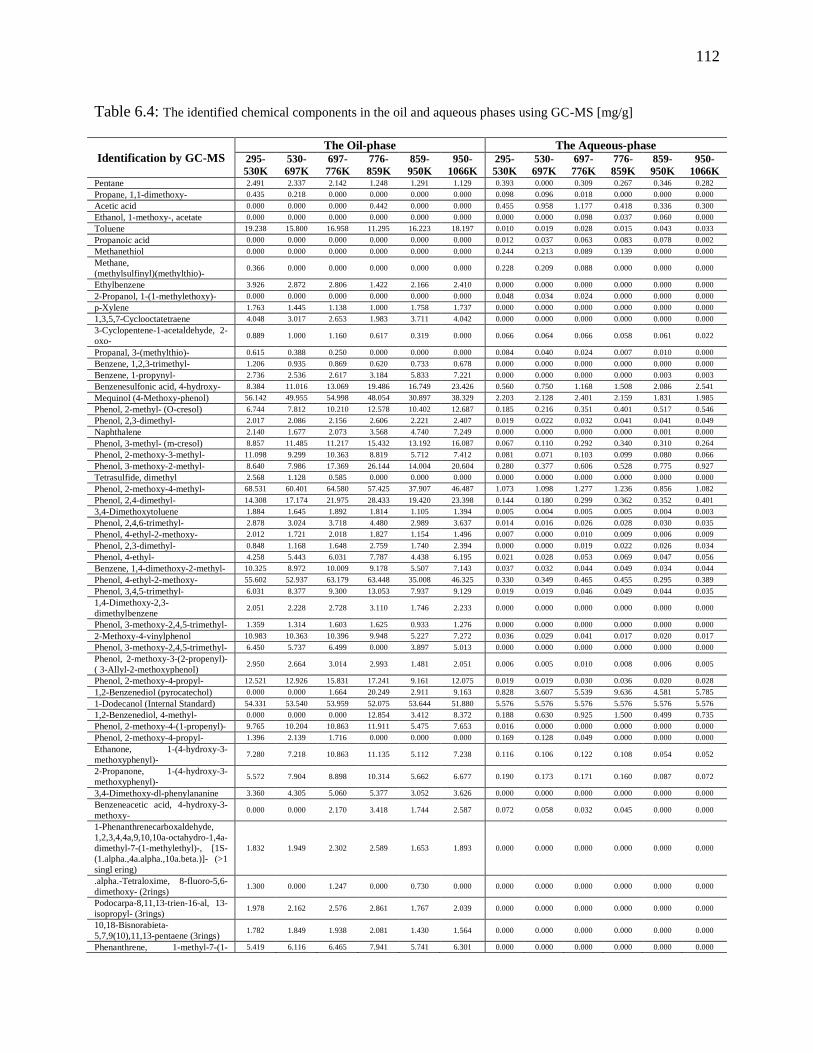
112
Table 6.4: The identified chemical components in the oil and aqueous phases using GC-MS [mg/g]
Identification by GC-MS The Oil-phase The Aqueous-phase
295-
530K
530-
697K
697-
776K
776-
859K
859-
950K
950-
1066K
295-
530K
530-
697K
697-
776K
776-
859K
859-
950K
950-
1066K Pentane 2.491 2.337 2.142 1.248 1.291 1.129 0.393 0.000 0.309 0.267 0.346 0.282
Propane, 1,1-dimethoxy- 0.435 0.218 0.000 0.000 0.000 0.000 0.098 0.096 0.018 0.000 0.000 0.000
Acetic acid 0.000 0.000 0.000 0.442 0.000 0.000 0.455 0.958 1.177 0.418 0.336 0.300
Ethanol, 1-methoxy-, acetate 0.000 0.000 0.000 0.000 0.000 0.000 0.000 0.000 0.098 0.037 0.060 0.000
Toluene 19.238 15.800 16.958 11.295 16.223 18.197 0.010 0.019 0.028 0.015 0.043 0.033
Propanoic acid 0.000 0.000 0.000 0.000 0.000 0.000 0.012 0.037 0.063 0.083 0.078 0.002
Methanethiol 0.000 0.000 0.000 0.000 0.000 0.000 0.244 0.213 0.089 0.139 0.000 0.000
Methane,
(methylsulfinyl)(methylthio)- 0.366 0.000 0.000 0.000 0.000 0.000 0.228 0.209 0.088 0.000 0.000 0.000
Ethylbenzene 3.926 2.872 2.806 1.422 2.166 2.410 0.000 0.000 0.000 0.000 0.000 0.000
2-Propanol, 1-(1-methylethoxy)- 0.000 0.000 0.000 0.000 0.000 0.000 0.048 0.034 0.024 0.000 0.000 0.000
p-Xylene 1.763 1.445 1.138 1.000 1.758 1.737 0.000 0.000 0.000 0.000 0.000 0.000
1,3,5,7-Cyclooctatetraene 4.048 3.017 2.653 1.983 3.711 4.042 0.000 0.000 0.000 0.000 0.000 0.000
3-Cyclopentene-1-acetaldehyde, 2-
oxo- 0.889 1.000 1.160 0.617 0.319 0.000 0.066 0.064 0.066 0.058 0.061 0.022
Propanal, 3-(methylthio)- 0.615 0.388 0.250 0.000 0.000 0.000 0.084 0.040 0.024 0.007 0.010 0.000
Benzene, 1,2,3-trimethyl- 1.206 0.935 0.869 0.620 0.733 0.678 0.000 0.000 0.000 0.000 0.000 0.000
Benzene, 1-propynyl- 2.736 2.536 2.617 3.184 5.833 7.221 0.000 0.000 0.000 0.000 0.003 0.003
Benzenesulfonic acid, 4-hydroxy- 8.384 11.016 13.069 19.486 16.749 23.426 0.560 0.750 1.168 1.508 2.086 2.541
Mequinol (4-Methoxy-phenol) 56.142 49.955 54.998 48.054 30.897 38.329 2.203 2.128 2.401 2.159 1.831 1.985
Phenol, 2-methyl- (O-cresol) 6.744 7.812 10.210 12.578 10.402 12.687 0.185 0.216 0.351 0.401 0.517 0.546
Phenol, 2,3-dimethyl- 2.017 2.086 2.156 2.606 2.221 2.407 0.019 0.022 0.032 0.041 0.041 0.049
Naphthalene 2.140 1.677 2.073 3.568 4.740 7.249 0.000 0.000 0.000 0.000 0.001 0.000
Phenol, 3-methyl- (m-cresol) 8.857 11.485 11.217 15.432 13.192 16.087 0.067 0.110 0.292 0.340 0.310 0.264
Phenol, 2-methoxy-3-methyl- 11.098 9.299 10.363 8.819 5.712 7.412 0.081 0.071 0.103 0.099 0.080 0.066
Phenol, 3-methoxy-2-methyl- 8.640 7.986 17.369 26.144 14.004 20.604 0.280 0.377 0.606 0.528 0.775 0.927
Tetrasulfide, dimethyl 2.568 1.128 0.585 0.000 0.000 0.000 0.000 0.000 0.000 0.000 0.000 0.000
Phenol, 2-methoxy-4-methyl- 68.531 60.401 64.580 57.425 37.907 46.487 1.073 1.098 1.277 1.236 0.856 1.082
Phenol, 2,4-dimethyl- 14.308 17.174 21.975 28.433 19.420 23.398 0.144 0.180 0.299 0.362 0.352 0.401
3,4-Dimethoxytoluene 1.884 1.645 1.892 1.814 1.105 1.394 0.005 0.004 0.005 0.005 0.004 0.003
Phenol, 2,4,6-trimethyl- 2.878 3.024 3.718 4.480 2.989 3.637 0.014 0.016 0.026 0.028 0.030 0.035
Phenol, 4-ethyl-2-methoxy- 2.012 1.721 2.018 1.827 1.154 1.496 0.007 0.000 0.010 0.009 0.006 0.009
Phenol, 2,3-dimethyl- 0.848 1.168 1.648 2.759 1.740 2.394 0.000 0.000 0.019 0.022 0.026 0.034
Phenol, 4-ethyl- 4.258 5.443 6.031 7.787 4.438 6.195 0.021 0.028 0.053 0.069 0.047 0.056
Benzene, 1,4-dimethoxy-2-methyl- 10.325 8.972 10.009 9.178 5.507 7.143 0.037 0.032 0.044 0.049 0.034 0.044
Phenol, 4-ethyl-2-methoxy- 55.602 52.937 63.179 63.448 35.008 46.325 0.330 0.349 0.465 0.455 0.295 0.389
Phenol, 3,4,5-trimethyl- 6.031 8.377 9.300 13.053 7.937 9.129 0.019 0.019 0.046 0.049 0.044 0.035
1,4-Dimethoxy-2,3-
dimethylbenzene 2.051 2.228 2.728 3.110 1.746 2.233 0.000 0.000 0.000 0.000 0.000 0.000
Phenol, 3-methoxy-2,4,5-trimethyl- 1.359 1.314 1.603 1.625 0.933 1.276 0.000 0.000 0.000 0.000 0.000 0.000
2-Methoxy-4-vinylphenol 10.983 10.363 10.396 9.948 5.227 7.272 0.036 0.029 0.041 0.017 0.020 0.017
Phenol, 3-methoxy-2,4,5-trimethyl- 6.450 5.737 6.499 0.000 3.897 5.013 0.000 0.000 0.000 0.000 0.000 0.000
Phenol, 2-methoxy-3-(2-propenyl)-
( 3-Allyl-2-methoxyphenol) 2.950 2.664 3.014 2.993 1.481 2.051 0.006 0.005 0.010 0.008 0.006 0.005
Phenol, 2-methoxy-4-propyl- 12.521 12.926 15.831 17.241 9.161 12.075 0.019 0.019 0.030 0.036 0.020 0.028
1,2-Benzenediol (pyrocatechol) 0.000 0.000 1.664 20.249 2.911 9.163 0.828 3.607 5.539 9.636 4.581 5.785
1-Dodecanol (Internal Standard) 54.331 53.540 53.959 52.075 53.644 51.880 5.576 5.576 5.576 5.576 5.576 5.576
1,2-Benzenediol, 4-methyl- 0.000 0.000 0.000 12.854 3.412 8.372 0.188 0.630 0.925 1.500 0.499 0.735
Phenol, 2-methoxy-4-(1-propenyl)- 9.765 10.204 10.863 11.911 5.475 7.653 0.016 0.000 0.000 0.000 0.000 0.000
Phenol, 2-methoxy-4-propyl- 1.396 2.139 1.716 0.000 0.000 0.000 0.169 0.128 0.049 0.000 0.000 0.000
Ethanone, 1-(4-hydroxy-3-
methoxyphenyl)- 7.280 7.218 10.863 11.135 5.112 7.238 0.116 0.106 0.122 0.108 0.054 0.052
2-Propanone, 1-(4-hydroxy-3-
methoxyphenyl)- 5.572 7.904 8.898 10.314 5.662 6.677 0.190 0.173 0.171 0.160 0.087 0.072
3,4-Dimethoxy-dl-phenylananine 3.360 4.305 5.060 5.377 3.052 3.626 0.000 0.000 0.000 0.000 0.000 0.000
Benzeneacetic acid, 4-hydroxy-3-
methoxy- 0.000 0.000 2.170 3.418 1.744 2.587 0.072 0.058 0.032 0.045 0.000 0.000
1-Phenanthrenecarboxaldehyde,
1,2,3,4,4a,9,10,10a-octahydro-1,4a-
dimethyl-7-(1-methylethyl)-, [1S-
(1.alpha.,4a.alpha.,10a.beta.)]- (>1
singl ering)
1.832 1.949 2.302 2.589 1.653 1.893 0.000 0.000 0.000 0.000 0.000 0.000
.alpha.-Tetraloxime, 8-fluoro-5,6-
dimethoxy- (2rings) 1.300 0.000 1.247 0.000 0.730 0.000 0.000 0.000 0.000 0.000 0.000 0.000
Podocarpa-8,11,13-trien-16-al, 13-
isopropyl- (3rings) 1.978 2.162 2.576 2.861 1.767 2.039 0.000 0.000 0.000 0.000 0.000 0.000
10,18-Bisnorabieta-
5,7,9(10),11,13-pentaene (3rings) 1.782 1.849 1.938 2.081 1.430 1.564 0.000 0.000 0.000 0.000 0.000 0.000
Phenanthrene, 1-methyl-7-(1- 5.419 6.116 6.465 7.941 5.741 6.301 0.000 0.000 0.000 0.000 0.000 0.000

113
methylethyl)- (3rings)
1-Phenanthrenecarboxylic acid,
1,2,3,4,4a,9,10,10a-octahydro-1,4a-
dimethyl-7-(1-methylethyl)-,
methyl ester, [1R-
(1.alpha.,4a.beta.,10a.alpha.)]-
(3rings)
14.152 16.964 20.896 23.533 19.214 21.754 0.000 0.000 0.000 0.000 0.000 0.000
Total 455.461 443.440 507.670 549.954 381.149 471.878 13.896 17.399 21.671 25.471 19.112 21.378
The analyzed samples were collected during the selected temperature ranges, which explains why
they are not presented at specific temperatures; rather, they are presented at temperature ranges,
as shown in Table 6.4. Further mathematical procedures were implemented on this data to obtain
the accumulated yields of each group, using the scenario that was discussed earlier. The
identified chemical components in the oil and the aqueous phases were classified into four
groups: (1) phenolics, (2) HMWC, (3) ASR-Non-Ph, and (4) aliphatics. Figure 6-6 shows the
instantaneous experimental and predicted yields of each group, and Table 6.5 shows their
estimated kinetic parameters. The rest of the MWP products, which are the remaining solid,
water, and non-condensable gas, can be obtained from the first and second models.
The total identified components in the oil phase ranged from 381to 549 mg/g for oil, and 13.9 to
25.7 mg/g for the aqueous phase since the aqueous phase is mostly water. The presented HMWC
yield was calculated by subtracting the ―water content + the other three identified groups‖ from
100.
According to Figure 6-6, the formation rate of phenolics and HMWC groups is much higher than
that of ASR-Non-Ph and aliphatics groups. This is related to the structure of the lignin network,
which is totally poly-aromatics and mostly phenolics compounds. In addition, the nature of the
applied heating mechanism could decrease the probability of a secondary reaction to produce
aliphatics, as an example.

114
300 500 700 900 1100
Temperature [K]
0
0.05
0.1
0.15
0.2
0.25
0.3Y
ield
[-]
Phenolics
Experimental
Predicted at n=1
300 500 700 900 1100
Temperature [K]
0
0.05
0.1
0.15
0.2
0.25
0.3
Yie
ld [
-]
HMWC
Experimental
Predicted at n=1
(A) (B)
300 500 700 900 1100
Temperature [K]
0
0.004
0.008
0.012
0.016
0.02
Yie
ld [
-]
ASR-Non-Ph
Experimental
Predicted at n=1
300 500 700 900 1100
Temperature [K]
0
0.004
0.008
0.012
0.016
0.02
Yie
ld [
-]Aliphatics
Experimental
Predicted at n=1
(C) (D)
Figure 6-6: The experimental and predicted yields: (A) phenolics, (B) HMWC (C) ASR-Non-Ph,
and (D) aliphatics. The points are the experimental, and the line is the fitting

115
Table 6.5: The estimated kinetic parameters of the extracted
chemical groups.
Product ko [min-1
] Ea [kJ/mol] n
Phenolics 21 38 1
HMWC 22 35 1
ASR-Non-Ph 1 40 1
Aliphatics 20 47 1
The activation energy estimated for aliphatics is higher than that estimated for the other groups.
This is a consequence of the energy needs to form aliphatics from an aromatic ring, which are
higher than those needed to create phenolics or HMWC from lignin directly. On the other hand,
the activation energy of HMWC is lower than that of the other groups. This is because the energy
needs to produce some aromatic rings connected with each other is lower than the energy needs
to produce the same rings but each as an individual ring, such as phenols, for example. Since the
structure of phenolics and ASR-Non-Ph is almost similar, as they have a single aromatic ring,
their estimated activation energies are similar as well. However, the pre-exponential factor is
different as most of the aromatics in the virgin material can produce phenolics much easier than
aromatics that are not phenolics.
6.6 Maximize the Phenolics Yield
The estimated kinetic parameters were employed to simulate yields of the phenolics group at
different heating rates and the same investigated temperature range, as depicted in Figure 6-7.
Increasing the heating rate from 10-100 K/min enhanced the phenolics yield from 0.024 to 0.1
g/g of lignin; however, the heating rates above 150 K/min resulted in the opposite. As known, at
low heating rates, vapor products do not escape rapidly like at high heating rates, which would
increase the chance of further decomposition when the products are being formed. On the other

116
hand, a high heating rate could not enable the molecular bonds to be fully decomposed. Thus, it
would increase the heavy products yield; accordingly, the phenolics yield decreased at heating
rates above 150 K/min. Among these heating rates, an optimum value that maximizes phenolics
yield should be found and applied; theoretically, it is 110 K/min in this work.
Figure 6-7. The estimated Phenolics yield at different heating rates and temperatures [g/g lignin].
Indeed, besides applying the optimum heating rate, many factors should be considered in this
aspect, such as high heat transfer and short vapor residence time. Furthermore, rapidly cooling
the vapor product is essential to eliminate further reactions to breakdown the condensable gas
into gaseous products. Also, and most importantly, a carefully controlled pyrolysis reaction is
essential, particularly at high heating rates.
Further attention will be paid to maximize the phenolics yield using different scenarios and at
optimum heating rates obtained from this work; subsequently, the yield of the other groups will
be estimated according to the best scenario and considered in future work.
6.7 The Validation of the Presented Models
The presented models were validated against the experimental data, as depicted in Figure 6-8.
Figure 6-8 -A -A shows the first model products, condensable gas, non-condensable gas, and
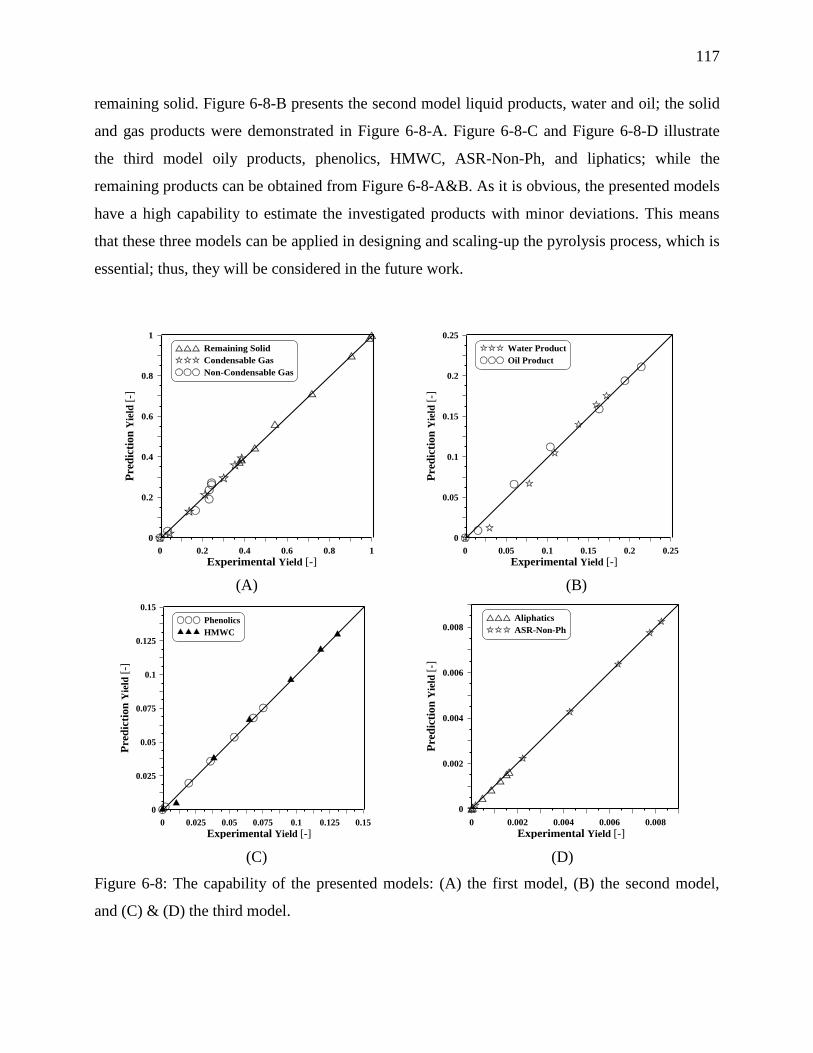
117
remaining solid. Figure 6-8-B presents the second model liquid products, water and oil; the solid
and gas products were demonstrated in Figure 6-8-A. Figure 6-8-C and Figure 6-8-D illustrate
the third model oily products, phenolics, HMWC, ASR-Non-Ph, and liphatics; while the
remaining products can be obtained from Figure 6-8-A&B. As it is obvious, the presented models
have a high capability to estimate the investigated products with minor deviations. This means
that these three models can be applied in designing and scaling-up the pyrolysis process, which is
essential; thus, they will be considered in the future work.
0 0.2 0.4 0.6 0.8 1
Experimental Yield [-]
0
0.2
0.4
0.6
0.8
1
Pre
dic
tion
Yie
ld [
-]
Remaining Solid
Condensable Gas
Non-Condensable Gas
0 0.05 0.1 0.15 0.2 0.25
Experimental Yield [-]
0
0.05
0.1
0.15
0.2
0.25
Pre
dic
tion
Yie
ld [
-]
Water Product
Oil Product
(A) (B)
0 0.025 0.05 0.075 0.1 0.125 0.15
Experimental Yield [-]
0
0.025
0.05
0.075
0.1
0.125
0.15
Pred
icti
on
Yie
ld [
-]
Phenolics
HMWC
0 0.002 0.004 0.006 0.008
Experimental Yield [-]
0
0.002
0.004
0.006
0.008
Pre
dic
tion
Yie
ld [
-]
Aliphatics
ASR-Non-Ph
(C) (D)
Figure 6-8: The capability of the presented models: (A) the first model, (B) the second model,
and (C) & (D) the third model.
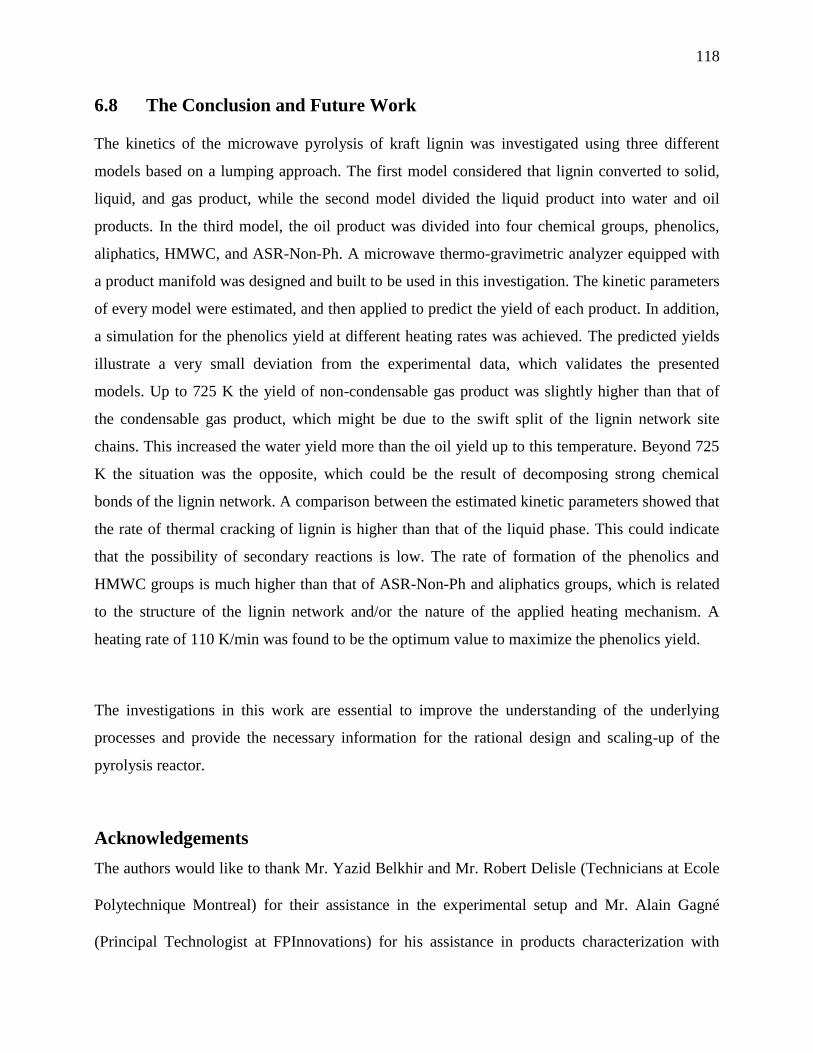
118
6.8 The Conclusion and Future Work
The kinetics of the microwave pyrolysis of kraft lignin was investigated using three different
models based on a lumping approach. The first model considered that lignin converted to solid,
liquid, and gas product, while the second model divided the liquid product into water and oil
products. In the third model, the oil product was divided into four chemical groups, phenolics,
aliphatics, HMWC, and ASR-Non-Ph. A microwave thermo-gravimetric analyzer equipped with
a product manifold was designed and built to be used in this investigation. The kinetic parameters
of every model were estimated, and then applied to predict the yield of each product. In addition,
a simulation for the phenolics yield at different heating rates was achieved. The predicted yields
illustrate a very small deviation from the experimental data, which validates the presented
models. Up to 725 K the yield of non-condensable gas product was slightly higher than that of
the condensable gas product, which might be due to the swift split of the lignin network site
chains. This increased the water yield more than the oil yield up to this temperature. Beyond 725
K the situation was the opposite, which could be the result of decomposing strong chemical
bonds of the lignin network. A comparison between the estimated kinetic parameters showed that
the rate of thermal cracking of lignin is higher than that of the liquid phase. This could indicate
that the possibility of secondary reactions is low. The rate of formation of the phenolics and
HMWC groups is much higher than that of ASR-Non-Ph and aliphatics groups, which is related
to the structure of the lignin network and/or the nature of the applied heating mechanism. A
heating rate of 110 K/min was found to be the optimum value to maximize the phenolics yield.
The investigations in this work are essential to improve the understanding of the underlying
processes and provide the necessary information for the rational design and scaling-up of the
pyrolysis reactor.
Acknowledgements
The authors would like to thank Mr. Yazid Belkhir and Mr. Robert Delisle (Technicians at Ecole
Polytechnique Montreal) for their assistance in the experimental setup and Mr. Alain Gagné
(Principal Technologist at FPInnovations) for his assistance in products characterization with

119
GC-MS and KF. In addition, the authors are grateful for the financial and technical support from
Lignoworks NSERC Strategic Network (www.lignoworks.ca).

120
CHAPTER 7 GENERAL DISCUSSION
The potential of Canadian forests has established the forest industry one of the cornerstones of
the Canadian economy. However, this industry has reached a crossroads because it has been
facing unexpected challenges for the past few years. One of the solutions that can be applied to
ensure a sustainable future for the industry is the production of value-added forest-based
products. Thus, this project investigated the potential for converting one of the lignocellulosic
biomass components, lignin, into a value-added bio-product.
One of the routes applied to convert lignin to bio-products is pyrolysis. Pyrolysis is a process of
thermal decomposition of the chemical bonds of a target material, which is performed by heating
the material in an inert environment. In general, pyrolysis produces three main products, solid,
condensable gas, and non-condensable gas. Herein, the required heat energy in pyrolysis is
generated within the material itself using microwave heating (MWH); thus, this pyrolysis is
called microwave pyrolysis (MWP).
As known, temperature measurement/simulation within a material exposed to electromagnetic
waves (EMW) is rather complex. Therefore, as a first step in this project, temperature profiles
inside a material heated by EMW at 2.45 GHz were simulated using a three-dimensional
mathematical model. COMSOL-Multiphysics was used to simulate transient temperature profiles
of pinewood, carbon, Pyrex, and combinations of such under different conditions. Subsequently,
the predicted results were compared against the experimental data in order to validate the
presented model. The average percentage relative error between the measured and the predicted
temperatures was ±4% and ±15% inside the pinewood and carbon respectively.
The presented model predicts that, upon exposing an 86mm wooden cube to 2.45 GHz of EMW
for 300 s, the core temperature reached 595 K, while the outer surface 365 K. This means, MWH
leads to non-uniform distribution of temperature which is strongly affected by penetration depth
(Dp) and surface heat loss. This could be avoided by limiting dimensions of the payload to twice
121
Dp, and placing a strong thermal insulation on the surface. By mixing 50% carbon with the
wooden block, the model anticipated the cube core to reach 990 K, compared to 1350 K with
75% carbon at the same power and after the same time. As a result, homogenous mixing of
materials which are strong microwave receptor with the payload leads to exhibiting a significant
increase in temperature compared to the virgin material exposed to the same power and heating
time. By inserting a 125 cm3 carbon cube inside the wood cube, the core reaches 3200 K, while
the outer surface was 375 K. Placing the same volume of carbon on the surface of the wood cube
yielded a maximum temperature of 660 K. Changing the material of the core cube from Carbon
to Pyrex yields a temperature of 324 K in the core, with 365 K on the outer surface. Therefore,
choice of location of materials with contrasting levels of microwave-to-heat conversion may be
used to create desired cold/hot zones and achieve a specific temperature profile in the workload.
Indeed, such discussions could provide insights in: (1) applications where creating a hot spot to
induce thermal cracking or obtain a specific product is desired, e.g., generation hot spots in
gasification process to increase gas yield. (2) Applications requiring a significant temperature
gradient between the core and the surface to generate sufficient pressure difference to enhance
extractive applications such as the extraction of moisture content in drying sector and the
extraction of valuable bio-chemicals in pyrolysis sector. (3) Applications where surface
treatment, coating, joining, etc., are used.
Indeed, this study was extremely useful as a first step in this project to improve the understanding
of temperature profiles within composite materials subjected to MWH.
In literature, different kinetic investigations of different reactions have been demonstrated;
however, most of them are inconsistent with each other. Actually, this inconsistent might be a
result of using one of the traditional thermometers without considering its drawbacks in case of
MWH. Therefore, in the second step, the reaction kinetics of MWP of sawdust in contrast to
conventional pyrolysis (CP) was investigated. In order to complete this investigation, an original
microwave thermo-gravimetric-analyzer (MW-TGA) was built and equipped with an innovated
thermometer. This thermometer does not suffer from the traditional thermometer drawbacks

122
when MWH is applied. Subsequently, the kinetic parameters, activation energy, pre-exponential
factor, and reaction order (Ea, ko, and n), were estimated using a MATLAB® program code.
According to the estimated values of the kinetic parameters, there may not be evidence on the
effect of MWH on Ea because the MWP and CP have almost the same estimated value; however,
the effect on ko is obvious. The estimated value of ko in the MWP is more than three-times that of
the CP. This could be a consequence of the nature of the MWH mechanism, which mainly
depends on agitating the dipoles of the heated material, and results in more chaotic motion. In
addition, ko was interpreted as a collision frequency, determined using the kinetic theory. Indeed,
these two facts can elucidate that MWH could enhance the molecule collisions, which leads to an
increase in ko. Despite this tangible effect on ko, Ea is almost the same in both cases, which might
be due to the huge difference between the wavelength of the oscillating EMW and the
intermolecular distance of the exposed material. This renders the effect of the EMW on Ea
doubtful as EMW cannot hack the molecular bonds directly.
At this point, temperature of a material exposed to MWH can be measured, using the innovated
thermometer, and/or estimated, using the mathematical model. Therefore, in the third step, a
detailed structural investigation and compositional analysis of a liquid produced via MWP of
kraft lignin was accomplished under various conditions. The key variables in this investigation
were concentration of a microwave receptor, char, (20-40 wt%) and nominal-setting-power (1.5-
2.7 kW). This resulted temperatures after applying the selected conditions of 800 s of 900, 980,
1065, 1150, and 1240 K. The maximum yield of the obtained liquid (oil and aqueous phases) was
found at 1240 K; however, beneficial depending on the structure of the liquid phases as well as
the water content. GC-MS analysis was implemented on the oil and aqueous phases, and 31
P and
13C NMR analyses were performed on the oil phase and the virgin material.
Due to the limitations of the GC-MS analysis, the concentrations of 583-707 mg/g of the oil
phase could not be identified using this technique. As a result, GC-MS analysis is inadequate to
provide a detailed structure of the pyrolysis liquids. Accordingly, 31
P and 13
C NMR spectroscopy
were implemented to provide detailed structure information for the whole oil phase and the virgin
material. Up to 80% of the carbon atoms in the oil phase were aromatic carbons. The
123
concentration of aliphatic hydroxyl groups in the virgin material was significantly eliminated by
the MWP, which might be attributed to form water during the thermal degradation of the lignin
network. The decreased concentrations of C5 substituted/condensed phenolic hydroxyl groups
after MWP were attributed to an increment in the concentrations of guaiacyl, p-hydroxyphenyl,
and catechol hydroxyl groups. Indeed, such investigations improve understanding about MWP
mechanisms, which leads to more control in the degradation pathways.
One of the performed conditions in the previous investigation was used to achieve a kinetic
modeling of the MWP products quantitatively as well as qualitatively. To perform this modelling,
the MW-TGA, which was built in the second step, was equipped with a product manifold to
separate the vapor product at various temperatures. This kinetic modelling presents three kinetic
models based on a lumping approach. The first model considered that lignin converted to
condensable gas, non-condensable gas, and the remaining solid, while the second model divided
the liquid product into water and oil products, taking into consideration each as an individual
lump. In the third model, the oil product was separated into four main groups: (1) phenolics,
contain all the identified phenolic components using a GC-MS analyzer; (2) heavy molecular
weight components, contain all the identified heavy molecular weight and undefined components,
using GC-MS; (3) non-phenolic aromatics with a single ring; and (4) aliphatics. The kinetic
parameters of every model were estimated, and then applied to predict the yield of each product.
The predicted yields illustrate a very small deviation from the experimental data, which validates
the presented models. Finally, a simulation for the phenolics yield at different heating rates was
achieved. The optimum heating rate that maximizes phenolics yield was 110 K/min in this
simulation. At heating rates less than 110 K/min, vapor products do not escape rapidly like at
high heating rates, which would increase the chance of further decomposition. Heating rates
higher than 110 K/min could not enable the molecular bonds to be fully decomposed. Thus, it
would increase the heavy products yield; accordingly, the phenolics yield decreased at heating
rates above 110 K/min.

124
CHAPTER 8 CONCLUSION AND RECOMMENDATIONS
8.1 Conclusions
In this study, the potential for converting kraft lignin into value-added bio-products was
investigated. Electromagnetic irradiation using a pyrolytic technique was employed to achieve
this objective. The obtained results and conclusions of this work are compliant with the
objectives described in Chapter 2 and are as follows.
Objective 1: Simulate temperature profiles within selected materials exposed to microwave
heating (MWH).
Conclusion 1: Chapter 3 presents a three-dimensional mathematical model developed to predict
transient temperature profiles within selected materials exposed to MWH at 2.45 GHz. The key
conclusion of this work is that MWH is strongly affected by the surface heat loss and penetration
depth (Dp) of the exposed material. Therefore, it leads to non-uniform temperature distribution
inside the heated material. However, placing a strong thermal insulation on the surface and
limiting dimensions of the target material to twice Dp minimizes temperature gradients
significantly. The homogenous mixing of strong microwave-receptive materials with the payload
exhibits a dramatic increase in temperature compared the virgin material exposed to the same
power and heating time. Furthermore, desired cold/hot zones inside the heated material can be
achieved by choosing of location of materials with contrasting levels of microwave-to-heat
conversion. Such findings provide insight into applications where creating a hot/cold spot to
obtain and/or enhance specific products is essential, such as gasification, pyrolysis, and drying.
Objective 2: Design and manufacture an innovative thermometer that does not suffer from the
drawbacks of traditional thermometers.
Conclusion 2: In Chapter 4, an innovative thermometer to measure transient mean temperature
inside a microwave oven was designed and manufactured, called an air-thermometer. In order to
verify the air-thermometer measurements, the measured temperatures were compared against the
125
reference values measured by a traditional thermocouple. In addition, further verification was
conducted against predicted temperatures using the model presented in Chapter 3. This showed a
good agreement between the measured temperatures and the reference temperatures.
Objective 3: Design and build an original thermogravimetric analyzer that works using MWH
and is equipped with a product manifold, for kinetic purposes.
Conclusion 3: In Chapter 4, an experimental setup similar to a TGA was built for kinetic
purposes, called the MW-TGA, which operates by MWH. In Chapter 6, this MW-TGA was
equipped with a product manifold to distribute the vapor product up to 7 parts at selected
temperatures/times. According to the sensitivity of the installed balance, MW-TGA has good
results, even when using very large samples, compared to those obtaining using a traditional
TGA.
Objective 4: Study the reaction kinetics of microwave pyrolysis (MWP), in contrast to
conventional pyrolysis (CP) and interpret the obtained results.
Conclusion 4: Chapter 5 presents a kinetic investigation of MWP in contrast to conventional
pyrolysis (CP) of sawdust, using the air-thermometer and MW-TGA. According to the estimated
kinetic parameters in both cases, MWP may have a reaction rate faster than that of CP. This is a
consequence of enhancing the molecular chaotic motion produced by the oscillating
electromagnetic field. On the other hand, the estimated activation energy is almost the same in
CP and MWP. This may be related to the wavelength of the oscillating electromagnetic field,
which is much longer than the intermolecular distance of the heated material. This explanation
was achieved based on the kinetic aspect and without investigating from the selectivity side,
which would be different.
Objective 5: Study the composition and structure of the condensable gases produced by MWP of
kraft lignin using different analysis techniques.
Conclusion 5: Chapter 5 discusses the compositional analysis and structural investigation of
liquids obtained from the MWP of kraft lignin under various conditions. The key conclusion of
126
this discussion includes the greater effect of char wt% than the microwave power setting on the
heating rate, as the native lignin is not strong receptive to microwaves. Increasing the heating rate
increased the total obtained liquid yield; however, beneficial depending on the liquid structure
and the water content. A concentration of 583-707 mg/g of the oil phase could not be identified,
due to the limitations of the GC-MS. As a result, GC-MS analysis is inadequate for providing a
detailed structure of the pyrolysis liquids. According to 31
P and 13
C NMR analyses, up to 80% of
the measured carbon atoms in the oil phase were aromatic. The concentration of aliphatic
hydroxyl groups in the virgin material was significantly decreased by MWP. This was a
consequence of the swift cleavage of the lignin side chain hydroxyl groups, which was attributed
to water forming during pyrolysis.
Objective 6: Design a kinetic model of the MWP products of kraft lignin, both quantitatively and
qualitatively.
Conclusion 6: Chapter 6 examines the kinetics of MWP of kraft lignin using three different
models, based on a lumping approach. The first model converts lignin to solid, liquid, and gas
products, while the second model divides the liquid into water and oil products. In the third
model, the oil product is divided into four chemical groups: phenolics, aliphatics, HMWC and
ASR-Non-Ph. The kinetic parameters of these models were estimated and applied to predict the
yield of each product. Furthermore, a simulation was designed for the phenolics yield at different
heating rates. The predicted yields illustrate a very small deviation from the experimental data,
which validates the presented models. A comparison between the estimated kinetics parameters
shows that the rate of thermal cracking of lignin is higher than that of the liquid phase, which
may indicate that the possibility of secondary reactions is low. The rate of formation of the
phenolics and HMWC groups is much higher than that of the ASR-Non-Ph and aliphatics groups,
which is related to the structure of the lignin network and/or the nature of the applied heating
mechanism. A heating rate of 110 K/min was found to be the optimum value for maximizing the
phenolics yield.

127
8.2 Future Work and Recommendations
1- The further investigation of ways to minimize water content in the liquid product is
essential;
2- The further investigation of ways to maximize specific chemical compounds is needed;
3- Different separation techniques for the obtained oil are required; and
4- The process needs to be scaled up and studied economically.
128
REFERENCES
Adnađević, B., M. Gigov, M. Sindjic and J. Jovanović (2008). "Comparative study on isothermal
kinetics of fullerol formation under conventional and microwave heating." Chemical Engineering
Journal 140(1–3): 570-577.
Adnadjevic, B. K. and J. D. Jovanovic (2012). "A comparative kinetics study on the isothermal
heterogeneous acid-catalyzed hydrolysis of sucrose under conventional and microwave heating."
Journal of Molecular Catalysis A: Chemical 356(0): 70-77.
Adnadjević, B. K. and J. D. Jovanović (2012). "Kinetics of Isothermal Ethanol Adsorption onto a
Carbon Molecular Sieve under Conventional and Microwave Heating." Chemical Engineering &
Technology 35(4): 761-768.
Aqsha, A., N. Mahinpey, T. Mani, F. Salak and P. Murugan (2011). "Study of sawdust pyrolysis
and its devolatilisation kinetics." The Canadian Journal of Chemical Engineering 89(6): 1451-
1457.
Badamali, S. K., J. H. Clark and S. W. Breeden (2008). "Microwave assisted selective oxidation
of lignin model phenolic monomer over SBA-15." Catalysis Communications 9(13): 2168-2170.
Bail, A. L., T. Koutchma and H. S. Ramaswamy (2000). "MODELING OF TEMPERATURE
PROFILES UNDER CONTINUOUS TUBE-FLOW MICROWAVE AND STEAM HEATING
CONDITIONS." Journal of Food Process Engineering 23(1): 1-24.
Ben, H. and A. J. Ragauskas (2011). "NMR Characterization of Pyrolysis Oils from Kraft
Lignin." Energy & Fuels 25(5): 2322-2332.
Benoit, L. (2008). CANADA’S FOREST INDUSTRY: RECOGNIZING THE CHALLENGES
AND OPPORTUNITIES. Report of the Standing Committee on Natural Resources, HOUSE OF
COMMONS CANADA. 39th PARLIAMENT: 1-2.
Budarin, V. L., J. H. Clark, B. A. Lanigan, P. Shuttleworth, S. W. Breeden, A. J. Wilson, D. J.
Macquarrie, K. Milkowski, J. Jones, T. Bridgeman and A. Ross (2009). "The preparation of high-
grade bio-oils through the controlled, low temperature microwave activation of wheat straw."
Bioresource Technology 100(23): 6064-6068.
Budarin, V. L., J. H. Clark, B. A. Lanigan, P. Shuttleworth and D. J. Macquarrie (2010).
"Microwave assisted decomposition of cellulose: A new thermochemical route for biomass
exploitation." Bioresource Technology 101(10): 3776-3779.
Camelia Gabriel, a. S. G., a Edward H. Grant,a,b Ben S. J. Halsteadb and D. Michael P. and
Mingosb (1998). "Dielectric parameters relevant to microwave dielectric heating." Chemical
Society Reviews 27: 213-222.
Campañone, L. A. and N. E. Zaritzky (2005). "Mathematical analysis of microwave heating
process." Journal of Food Engineering 69(3): 359-368.
Castro-Giráldez, M., P. J. Fito and P. Fito (2010). "Application of microwaves dielectric
spectroscopy for controlling pork meat (Longissimus dorsi) salting process." Journal of Food
Engineering 97(4): 484-490.

129
Chandra Shekara, B. M., B. S. Jai Prakash and Y. S. Bhat (2012). "Microwave-induced
deactivation-free catalytic activity of BEA zeolite in acylation reactions." Journal of Catalysis
290(0): 101-107.
Chen, D.-Y., D. Zhang and X.-F. Zhu "Heat/mass transfer characteristics and nonisothermal
drying kinetics at the first stage of biomass pyrolysis." Journal of Thermal Analysis and
Calorimetry: 1-8.
Chen, F., G. Wang, C. Shi, Y. Zhang, L. Zhang, W. Li and F. Yang (2013). "Kinetics of
glycolysis of poly(ethylene terephthalate) under microwave irradiation." Journal of Applied
Polymer Science 127(4): 2809-2815.
Chiavaro, E., C. Barnaba, E. Vittadini, M. T. Rodriguez-Estrada, L. Cerretani and A. Bendini
(2009). "Microwave heating of different commercial categories of olive oil: Part II. Effect on
thermal properties." Food Chemistry 115(4): 1393-1400.
Choi, H. S. and D. Meier (2013). "Fast pyrolysis of Kraft lignin—Vapor cracking over various
fixed-bed catalysts." Journal of Analytical and Applied Pyrolysis 100(0): 207-212.
Ciacci, T., A. Galgano and C. Di Blasi (2010). "Numerical simulation of the electromagnetic
field and the heat and mass transfer processes during microwave-induced pyrolysis of a wood
block." Chemical Engineering Science 65(14): 4117-4133.
Clark, D. E., D. C. Folz and J. K. West (2000). "Processing materials with microwave energy."
Materials Science and Engineering A 287(2): 153-158.
Cuccurullo, G., P. G. Berardi, R. Carfagna and V. Pierro (2002). "IR temperature measurements
in microwave heating." Infrared Physics & Technology 43(3-5): 145-150.
D.E. Clark, D. C. F. (2005). What is microwave processing. Microwave Solutions for Ceramic
Engineers. D. C. F. D.E. Clark, C.E. Folgar, M.M. Mahmoud. Westerville, OH The American
Ceramics Society, Inc: 1–26.
Datta, A. K. and H. Ni (2002). "Infrared and hot-air-assisted microwave heating of foods for
control of surface moisture." Journal of Food Engineering 51(4): 355-364.
de Wild, P. J., W. J. J. Huijgen and H. J. Heeres (2012). "Pyrolysis of wheat straw-derived
organosolv lignin." Journal of Analytical and Applied Pyrolysis 93(0): 95-103.
Dogan, H. and N. D. Hilmioglu (2009). "Dissolution of cellulose with NMMO by microwave
heating." Carbohydrate Polymers 75(1): 90-94.
Domínguez, A., Y. Fernández, B. Fidalgo, J. J. Pis and J. A. Menéndez (2008). "Bio-syngas
production with low concentrations of CO2 and CH4 from microwave-induced pyrolysis of wet
and dried sewage sludge." Chemosphere 70(3): 397-403.
Domínguez, A., J. A. Menéndez, M. Inguanzo and J. J. Pis (2005). "Investigations into the
characteristics of oils produced from microwave pyrolysis of sewage sludge." Fuel Processing
Technology 86(9): 1007-1020.
Doucet, J., J.-P. Laviolette, S. Farag and J. Chaouki (2013). "Distributed Microwave Pyrolysis of
Domestic Waste." Waste and Biomass Valorization: 1-10.
130
Durka, T., T. V. Gerven and A. Stankiewicz (2009). "Microwaves in Heterogeneous Gas-Phase
Catalysis: Experimental and Numerical Approaches." Chemical Engineering & Technology
32(9): 1301-1312.
Durka, T., T. Van Gerven and A. Stankiewicz (2009). "Microwaves in Heterogeneous Gas-Phase
Catalysis: Experimental and Numerical Approaches." Chemical Engineering & Technology
32(9): 1301-1312.
El harfi, K., A. Mokhlisse, M. B. Chanâa and A. Outzourhit (2000). "Pyrolysis of the Moroccan
(Tarfaya) oil shales under microwave irradiation." Fuel 79(7): 733-742.
Farag, S., A. Sobhy, C. Akyel, J. Doucet and J. Chaouki (2012). "Temperature profile prediction
within selected materials heated by microwaves at 2.45GHz." Applied Thermal Engineering
36(0): 360-369.
Farag., S. and J. Chaouki. (2013). "A Kinetic Investigation of Microwave Pyrolysis of Sawdust
Using an Original Microwave –Thermogravimetric Analyzer." under revision
Farag., S., D. Fu., P. G. Jessop. and J. Chaouki. (2013). "A Detailed Compositional Analysis and
Structural Investigation of a Bio-oil from Microwave Pyrolysis of Kraft Lignin."
Faravelli, T., A. Frassoldati, G. Migliavacca and E. Ranzi (2010). "Detailed kinetic modeling of
the thermal degradation of lignins." Biomass and Bioenergy 34(3): 290-301.
Ferdous, D., A. K. Dalai, S. K. Bej and R. W. Thring (2002). "Pyrolysis of Lignins:
Experimental and Kinetics Studies." Energy & Fuels 16(6): 1405-1412.
Fernández, Y., A. Arenillas, M. A. Díez, J. J. Pis and J. A. Menéndez (2009). "Pyrolysis of
glycerol over activated carbons for syngas production." Journal of Analytical and Applied
Pyrolysis 84(2): 145-150.
Fu, D., S. Farag, J. Chaouki and P. G. Jessop (2014). "Extraction of phenols from lignin
microwave-pyrolysis oil using a switchable hydrophilicity solvent." Bioresource Technology
154(0): 101-108.
Fukushima, J., K. Kashimura, S. Takayama, M. Sato, S. Sano, Y. Hayashi and H. Takizawa
(2013). "In-situ kinetic study on non-thermal reduction reaction of CuO during microwave
heating." Materials Letters 91(0): 252-254.
Geedipalli, S. S. R., V. Rakesh and A. K. Datta (2007). "Modeling the heating uniformity
contributed by a rotating turntable in microwave ovens." Journal of Food Engineering 82(3): 359-
368.
Granata, A. and D. S. Argyropoulos (1995). "2-Chloro-4,4,5,5-tetramethyl-1,3,2-
dioxaphospholane, a Reagent for the Accurate Determination of the Uncondensed and Condensed
Phenolic Moieties in Lignins." Journal of Agricultural and Food Chemistry 43(6): 1538-1544.
Gu, X., X. Ma, L. Li, C. Liu, K. Cheng and Z. Li (2013). "Pyrolysis of poplar wood sawdust by
TG-FTIR and Py–GC/MS." Journal of Analytical and Applied Pyrolysis 102(0): 16-23.
Guiotoku, M., C. R. Rambo, F. A. Hansel, W. L. E. Magalhães and D. Hotza (2009).
"Microwave-assisted hydrothermal carbonization of lignocellulosic materials." Materials Letters
63(30): 2707-2709.

131
Gunasekaran, S. and H.-W. Yang (2007). "Effect of experimental parameters on temperature
distribution during continuous and pulsed microwave heating." Journal of Food Engineering
78(4): 1452-1456.
Guo, W., S. Wang, G. Tiwari, J. A. Johnson and J. Tang (2010). "Temperature and moisture
dependent dielectric properties of legume flour associated with dielectric heating." LWT - Food
Science and Technology 43(2): 193-201.
Imam, T. and S. Capareda (2012). "Characterization of bio-oil, syn-gas and bio-char from
switchgrass pyrolysis at various temperatures." Journal of Analytical and Applied Pyrolysis
93(0): 170-177.
Janković, B. (2011). "The comparative kinetic analysis of Acetocell and Lignoboost® lignin
pyrolysis: The estimation of the distributed reactivity models." Bioresource Technology 102(20):
9763-9771.
Jiang, G., D. J. Nowakowski and A. V. Bridgwater (2010). "Effect of the Temperature on the
Composition of Lignin Pyrolysis Products." Energy & Fuels 24(8): 4470-4475.
Jiang, G., D. J. Nowakowski and A. V. Bridgwater (2010). "A systematic study of the kinetics of
lignin pyrolysis." Thermochimica Acta 498(1-2): 61-66.
Jones, D. A., T. P. Lelyveld, S. D. Mavrofidis, S. W. Kingman and N. J. Miles (2002).
"Microwave heating applications in environmental engineering--a review." Resources,
Conservation and Recycling 34(2): 75-90.
Karaduman, A. (2002). "Pyrolysis of Polystyrene Plastic Wastes with Some Organic Compounds
for Enhancing Styrene Yield." Energy Sources 24(7): 667-674.
Karthikeyan, S., R. Balasubramanian and S. W. See (2006). "Optimization and validation of a
low temperature microwave-assisted extraction method for analysis of polycyclic aromatic
hydrocarbons in airborne particulate matter." Talanta 69(1): 79-86.
Kibet, J., L. Khachatryan and B. Dellinger (2012). "Molecular Products and Radicals from
Pyrolysis of Lignin." Environmental Science & Technology 46(23): 12994-13001.
Klinbun, W. and P. Rattanadecho "Analysis of microwave induced natural convection in a single
mode cavity (Influence of sample volume, placement, and microwave power level)." Applied
Mathematical Modelling(0).
Kol, H. Ş. (2009). "THERMAL AND DIELECTRIC PROPERTIES OF PINE WOOD IN THE
TRANSVERSE DIRECTION." BioResources Vol 4, No 4
Krzan, A. and E. Zagar (2009). "Microwave driven wood liquefaction with glycols." Bioresource
Technology 100(12): 3143-3146.
Ledesma, E. B., N. D. Marsh, A. K. Sandrowitz and M. J. Wornat (2002). "An experimental
study on the thermal decomposition of catechol." Proceedings of the Combustion Institute 29(2):
2299-2306.
Li, D., Y. Zhang, X. Quan and Y. Zhao (2009). "Microwave thermal remediation of crude oil
contaminated soil enhanced by carbon fiber." Journal of Environmental Sciences 21(9): 1290-
1295.
132
Li, Z., L. Han and W. Xiao (2013). "Influence of microwave heating on the liquefaction kinetics
of corn stover in ethylene glycol." BioResources 8(3): 3453-3460.
Lidström, P., J. Tierney, B. Wathey and J. Westman (2001). "Microwave assisted organic
synthesis--a review." Tetrahedron 57(45): 9225-9283.
Lou, R. and S.-b. Wu (2011). "Products properties from fast pyrolysis of enzymatic/mild
acidolysis lignin." Applied Energy 88(1): 316-322.
Lou, R., S.-b. Wu and G.-j. Lv (2010). "Effect of conditions on fast pyrolysis of bamboo lignin."
Journal of Analytical and Applied Pyrolysis 89(2): 191-196.
Lucchesi, M. E., F. Chemat and J. Smadja (2004). "Solvent-free microwave extraction of
essential oil from aromatic herbs: comparison with conventional hydro-distillation." Journal of
Chromatography A 1043(2): 323-327.
Luo, Z., S. Wang and X. Guo (2012). "Selective pyrolysis of Organosolv lignin over zeolites with
product analysis by TG-FTIR." Journal of Analytical and Applied Pyrolysis 95(0): 112-117.
Luque, R., J. A. Menendez, A. Arenillas and J. Cot (2012). "Microwave-assisted pyrolysis of
biomass feedstocks: the way forward?" Energy & Environmental Science 5(2): 5481-5488.
Ma, H., W.-W. Liu, X. Chen, Y.-J. Wu and Z.-L. Yu (2009). "Enhanced enzymatic
saccharification of rice straw by microwave pretreatment." Bioresource Technology 100(3):
1279-1284.
Ma, S. J., et al. (2009). " A new practical method to determine the microwave energy absorption."
Minerals Engineering 22(13): 1154-1159.
Mani, T., P. Murugan and N. Mahinpey (2008). "Determination of Distributed Activation Energy
Model Kinetic Parameters Using Simulated Annealing Optimization Method for Nonisothermal
Pyrolysis of Lignin." Industrial & Engineering Chemistry Research 48(3): 1464-1467.
Manoj Gupta, E. W. W. L., Wai Leong Wong (2007). Microwaves and metals, John Wiley &
sons (Asia) Pte Ltd
Mazo, P., D. Estenoz, M. Sponton and L. Rios (2012). "Kinetics of the Transesterification of
Castor Oil with Maleic Anhydride Using Conventional and Microwave Heating." Journal of the
American Oil Chemists' Society 89(7): 1355-1361.
Menéndez, J. A., A. Domínguez, M. Inguanzo and J. J. Pis (2004). "Microwave pyrolysis of
sewage sludge: analysis of the gas fraction." Journal of Analytical and Applied Pyrolysis 71(2):
657-667.
Menéndez, J. A., M. Inguanzo and J. J. Pis (2002). "Microwave-induced pyrolysis of sewage
sludge." Water Research 36(13): 3261-3264.
Miura, M., H. Kaga, A. Sakurai, T. Kakuchi and K. Takahashi (2004). "Rapid pyrolysis of wood
block by microwave heating." Journal of Analytical and Applied Pyrolysis 71(1): 187-199.
Monsef-Mirzai, P., M. Ravindran, W. R. McWhinnie and P. Burchill (1995). "Rapid microwave
pyrolysis of coal : Methodology and examination of the residual and volatile phases." Fuel 74(1):
20-27.

133
Montané, D., V. Torné-Fernández and V. Fierro (2005). "Activated carbons from lignin: kinetic
modeling of the pyrolysis of Kraft lignin activated with phosphoric acid." Chemical Engineering
Journal 106(1): 1-12.
Motasemi, F. and M. T. Afzal (2013). "A review on the microwave-assisted pyrolysis technique."
Renewable and Sustainable Energy Reviews 28(0): 317-330.
Mu, W., H. Ben, A. Ragauskas and Y. Deng (2013). "Lignin Pyrolysis Components and
Upgrading—Technology Review." BioEnergy Research: 1-22.
Mullen, C. A. and A. A. Boateng (2010). "Catalytic pyrolysis-GC/MS of lignin from several
sources." Fuel Processing Technology 91(11): 1446-1458.
Mutyala, S., C. Fairbridge, J. R. J. Paré, J. M. R. Bélanger, S. Ng and R. Hawkins (2010).
"Microwave applications to oil sands and petroleum: A review." Fuel Processing Technology
91(2): 127-135.
Oloyede, A. and P. Groombridge (2000). "The influence of microwave heating on the mechanical
properties of wood." Journal of Materials Processing Technology 100(1-3): 67-73.
Orozco, A., M. Ahmad, D. Rooney and G. Walker (2007). "Dilute Acid Hydrolysis of Cellulose
and Cellulosic Bio-Waste Using a Microwave Reactor System." Process Safety and
Environmental Protection 85(5): 446-449.
Paixão, V., R. Monteiro, M. Andrade, A. Fernandes, J. Rocha, A. P. Carvalho and A. Martins
(2011). "Desilication of MOR zeolite: Conventional versus microwave assisted heating." Applied
Catalysis A: General 402(1–2): 59-68.
Pan, R., Y. Wu, Q. Wang and Y. Hong (2009). "Preparation and catalytic properties of platinum
dioxide nanoparticles: A comparison between conventional heating and microwave-assisted
method." Chemical Engineering Journal 153(1–3): 206-210.
Pandit, R. B. and S. Prasad (2003). "Finite element analysis of microwave heating of potato--
transient temperature profiles." Journal of Food Engineering 60(2): 193-202.
Patil, P., V. G. Gude, S. Pinappu and S. Deng (2011). "Transesterification kinetics of Camelina
sativa oil on metal oxide catalysts under conventional and microwave heating conditions."
Chemical Engineering Journal 168(3): 1296-1300.
Radmanesh, R., Y. Courbariaux, J. Chaouki and C. Guy (2006). "A unified lumped approach in
kinetic modeling of biomass pyrolysis." Fuel 85(9): 1211-1220.
Ramasamy, S. and B. Moghtaderi (2010). "Dielectric Properties of Typical Australian Wood-
Based Biomass Materials at Microwave Frequency." Energy & Fuels 24(8): 4534-4548.
Rattanadecho, P. (2006). "The simulation of microwave heating of wood using a rectangular
wave guide: Influence of frequency and sample size." Chemical Engineering Science 61(14):
4798-4811.
Ren, S., H. Lei, L. Wang, Q. Bu, S. Chen, J. Wu, J. Julson and R. Ruan (2012). "Biofuel
production and kinetics analysis for microwave pyrolysis of Douglas fir sawdust pellet." Journal
of Analytical and Applied Pyrolysis 94(0): 163-169.
Robinson, J. P., S. W. Kingman, R. Barranco, C. E. Snape and H. Al-Sayegh (2009). "Microwave
Pyrolysis of Wood Pellets." Industrial & Engineering Chemistry Research 49(2): 459-463.
134
Rutkowski, P. (2011). "Pyrolysis of cellulose, xylan and lignin with the K2CO3 and ZnCl2
addition for bio-oil production." Fuel Processing Technology 92(3): 517-522.
Salmoria, G. V., E. Dall'Oglio and C. Zucco (1998). "Aromatic nucleophilic substitutions under
microwave irradiation." Tetrahedron Letters 39(17): 2471-2474.
Sithambaram, S., E. K. Nyutu and S. L. Suib (2008). "OMS-2 catalyzed oxidation of tetralin: A
comparative study of microwave and conventional heating under open vessel conditions."
Applied Catalysis A: General 348(2): 214-220.
Stuerga, D. and P. Gaillard (1996). "Microwave heating as a new way to induce localized
enhancements of reaction rate. Non-isothermal and heterogeneous kinetics." Tetrahedron 52(15):
5505-5510.
Sun, J., W. Wang, Z. Liu, Q. Ma, C. Zhao and C. Ma (2012). "Kinetic Study of the Pyrolysis of
Waste Printed Circuit Boards Subject to Conventional and Microwave Heating." Energies 5(9):
3295-3306.
Tang, S.-Y., Z.-N. Xia, Y.-J. Fu and Q. Gou (2008). "Advances and Applications of Microwave
Spectroscopy." Chinese Journal of Analytical Chemistry 36(8): 1145-1151.
Temur Ergan, B. a. and M . Bayramoglu (2011). "Kinetic Approach for Investigating the
―Microwave Effect‖: Decomposition of Aqueous Potassium Persulfate." Industrial & Engineering
Chemistry Research 50(11): 6629-6637.
Thostenson, E. T. and T. W. Chou (1999). "Microwave processing: fundamentals and
applications." Composites Part A: Applied Science and Manufacturing 30(9): 1055-1071.
Vos, B., J. Mosman, Y. Zhang, E. Poels and A. Bliek (2003). "Impregnated carbon as a susceptor
material for low loss oxides in dielectric heating." Journal of Materials Science 38(1): 173-182.
Wan, Y., P. Chen, B. Zhang, C. Yang, Y. Liu, X. Lin and R. Ruan (2009). "Microwave-assisted
pyrolysis of biomass: Catalysts to improve product selectivity." Journal of Analytical and
Applied Pyrolysis 86(1): 161-167.
Will, H., P. Scholz, B. Ondruschka and W. Burckhardt (2003). "Multimode Microwave Reactor
for Heterogeneous Gas-Phase Catalysis." Chemical Engineering & Technology 26(11): 1146-
1149.
Xu, F., J.-X. Jiang, R.-C. Sun, D. She, B. Peng, J.-X. Sun and J. F. Kennedy (2008). "Rapid
esterification of wheat straw hemicelluloses induced by microwave irradiation." Carbohydrate
Polymers 73(4): 612-620.
Yadav, G. D. and I. V. Borkar (2006). "Kinetic modeling of microwave-assisted chemoenzymatic
epoxidation of styrene." AIChE Journal 52(3): 1235-1247.
Yan, W., X. Hu, G. Zhang, M. Deng, C. Yi and Z. Xu (2012). "Microwave assisted preparation
of monodisperse polymeric microspheres and its morphologies and kinetics." Journal of Wuhan
University of Technology-Mater. Sci. Ed. 27(6): 1100-1104.
Yang, H., R. Yan, H. Chen, D. H. Lee and C. Zheng (2007). "Characteristics of hemicellulose,
cellulose and lignin pyrolysis." Fuel 86(12–13): 1781-1788.
Yang, H. W. and S. Gunasekaran (2001). "Temperature Profiles in a Cylindrical Model Food
During Pulsed Microwave Heating." Journal of Food Science 66(7): 998-1004.

135
Zakzeski, J., P. C. Bruijnincx, A. L. Jongerius and B. M. Weckhuysen (2010). "The catalytic
valorization of lignin for the production of renewable chemicals." Chemical Reviews 110(6):
3552.
Zakzeski, J., P. C. A. Bruijnincx, A. L. Jongerius and B. M. Weckhuysen (2010). "The Catalytic
Valorization of Lignin for the Production of Renewable Chemicals." Chemical Reviews 110(6):
3552-3599.
Zhang, M., F. L. P. Resende, A. Moutsoglou and D. E. Raynie (2012). "Pyrolysis of lignin
extracted from prairie cordgrass, aspen, and Kraft lignin by Py-GC/MS and TGA/FTIR." Journal
of Analytical and Applied Pyrolysis 98(0): 65-71.
Zhang, X., D. O. Hayward and D. M. P. Mingos (2003). "Effects of Microwave Dielectric
Heating on Heterogeneous Catalysis." Catalysis Letters 88(1): 33-38.
Zhang, Z. and Z. K. Zhao (2010). "Microwave-assisted conversion of lignocellulosic biomass
into furans in ionic liquid." Bioresource Technology 101(3): 1111-1114.
Zheng, Y., D. Chen and X. Zhu "Aromatic Hydrocarbon Production by the Online Catalytic
Cracking of Lignin Fast Pyrolysis Vapors using Mo2N/γ-Al2O3." Journal of Analytical and
Applied Pyrolysis(0).
Zheng, Y., D. Chen and X. Zhu (2013). "Aromatic hydrocarbon production by the online
catalytic cracking of lignin fast pyrolysis vapors using Mo2N/γ-Al2O3." Journal of Analytical
and Applied Pyrolysis(0).
Zhou, L., V. M. Puri, R. C. Anantheswaran and G. Yeh (1995). "Finite element modeling of heat
and mass transfer in food materials during microwave heating -- Model development and
validation." Journal of Food Engineering 25(4): 509-529.
Zhou, R., S. Zhong, X. Lin and N. Xu (2009). "Synthesis of zeolite T by microwave and
conventional heating." Microporous and Mesoporous Materials 124(1–3): 117-122.
Zhu, S., Y. Wu, Z. Yu, Q. Chen, G. Wu, F. Yu, C. Wang and S. Jin (2006). "Microwave-assisted
Alkali Pre-treatment of Wheat Straw and its Enzymatic Hydrolysis." Biosystems Engineering
94(3): 437-442.
Zhu, S., Y. Wu, Z. Yu, J. Liao and Y. Zhang (2005). "Pretreatment by microwave/alkali of rice
straw and its enzymic hydrolysis." Process Biochemistry 40(9): 3082-3086.