production management gestão da produção · especificações de fabrico, cadências, requisitos...
TRANSCRIPT
1
Production ManagementGestão da Produção
2007/2008
Course included in
Master (MSc) in Mechanical EngineeringMestrado Integrado em Engenharia Mecânica
3. Methods Engineering and Process Design3. Methods Engineering and Process Design3.3 3.3 Methods and tools for methods engineering
2
Production ManagementGestão da Produção
Methods Engineering and Process Design
Methods and tools for methods engineering• Methods and Time study is the one element in scientific
management beyond all others making possible the transfer of skill from management to men… Frederick W. Taylor
• The Methods engineering procedure consists in the:– Problem or study aim identification– Work separation in small tasks– Analysis of each task (who, how, when, why, how long)– In order to define the most economic way to produce under the desire
production rate,– Taking into account operators safety and motivation.

2
3
Production ManagementGestão da Produção
Methods Engineering and Process Design
Methods and tools for methods engineering
Adaptado por Joana Costa de, Niebel 1993
Opportunities for savings through the application of methods engineering and time study
4
Production ManagementGestão da Produção
Methods Engineering and Process Design
Methods and tools for methods engineering• Uses a systematic procedure to develop a work centre:
1. Select the project2. Get and present the data3. Analyse the data4. Develop possible solutions5. Present and install the method6. Develop a job analysis7. Establish time standards8. Follow up the method
The Deming Cycle(PDCA)

3
5
Production ManagementGestão da Produção
Methods Engineering and Process Design
Methods and tools for methods engineering
6
Production ManagementGestão da Produção
Methods Engineering and Process Design
Methods and tools for methods engineering• A engenharia dos métodos segue um procedimento composto por diversas etapas fundamentais:
– Seleccionar o projecto. Tipicamente, os projectos seleccionados representam ou uma nova gama de produtos, ou produtos existentes com elevados custos de produção. Também podemos incluir nesta lista produtos que actualmente possuem dificuldades em manter a sua qualidade e que enfrentam problemas de competição.
– Obter os factos. Reunir todos os factos importantes relacionados com o produto ou serviço. Isto inclui, especificações de fabrico, cadências, requisitos de entrega, equipamentos, implantação, etc.
– Efectuar a análise. Utilizar numa primeira abordagem a análise das operações e os princípios de estudo dos tempos e de movimentos, para decidir quais as melhores alternativas. Esta primeira abordagem engloba: o propósito da operação, materiais, processo de fabrico, setup e ferramentas, condições de trabalho, implantação, manuseamento de materiais. A engenharia dos métodos questionará os detalhes do processo proposto e tentará eliminar operações, substituí-las e combiná-las ou desenvolver uma melhor sequência.
– Desenvolver o método ideal. Seleccionar o melhor procedimento para cada tarefa, inspecção, e transporte, considerando todos os pós e contras de cada alternativa (constrangimentos materiais, humanos e financeiros). Este novo método deverá eliminar os pontos de ineficiência detectados.
– Apresentar o método. Apresentação do método proposto em detalhe ao conjunto de operadores que serão responsáveis pela sua implementação e utilização.
– Implementar o método. Definição de um plano de implementação do método, onde são identificados e especificados, objectivos de desempenho a atingir, calendarização de acções e de resultados. Os objectivos deverão ser realistas, contudo deverão constituir um desafio para a equipa envolvida
– Desenvolver uma análise para o método. Analisar o método implementado para garantir que o operador ou operadores são adequados à tarefa, formados e recompensados.
– Estabelecer um tempo padrão. Estabelecer o tempo padrão realista para o método estabelecido.– Seguir o método. Se o método estiver devidamente implementado e com os resultados pretendidos,
será possível fazer novas melhorias a este mesmo método, melhorando-o continuamente.

4
7
Production ManagementGestão da Produção
Methods Engineering and Process Design
Methods and tools for methods engineering• O ciclo de melhoria contínua:
7. Identificar os problemas restantes e reaplicar todo o procedimento
• Alterar os procedimentos anteriores com as novas soluções, cujo efeito foi confirmado
6. Especificar soluçõesAgir
Todas as ferramentas• Adquirir dados• Realizar comparações antes-depois
5. Confirmar o efeito das medidas
Avaliar
Experiências• Implementar medidas/soluçõesImplem.
Tecnologia específicaExperiência
• Seleccionar as medidas para eliminar os problemas
4. Seleccionar medidas
Diagrama Causa-EfeitoDiag. de defeitosGráf. de correlaçõesDiag. de processo
• Listar todas as causas possíveis• Estudar interelações entre causas e causa-efeito• Seleccionar algumas causas e inventariar
possíveis soluções• Adquirir novos dados para prever possíveis
soluções
3. AnalisarPlanear
Diag. de defeitosHistogramasAnálise de Pareto
• Adquirir dados• Encontrar factores chave• Estruturar o problema• Estabelecer prioridades
2. Detalhar situação actual
NormalizaçãoFormação“Desenrasca” vs. prevenção
• Decidir a tarefa a melhorar• Especificar claramente as razões da melhoria
1. Seleccionar o assunto
FerramentasFunçãoPassos
8
Production ManagementGestão da Produção
Methods Engineering and Process Design
Methods and tools for methods engineering• ççççççç

5
9
Production ManagementGestão da Produção
Methods Engineering and Process Design
Methods and tools for methods engineering• Tools:
– Operations Analysis Tools
– Problem-solving Tools
• Methods• Worker and Machine Relationships• Learning curves• Methods-Time Measurement• SMED – single-minute exchange of die• Discrete-event Simulation• Line balancing• Others
• Visual observation and interviews• Process mapping• Flow Diagram/Layout• Identification of operations elements• Assembly charts• Operations process chart• Flow process chart• Worker and Machine process charts
• Pareto Analysis• Fish-bone diagrams• Gantt chart• Histograms• Correlations charts• PERT charting• Brainstorming
10
Production ManagementGestão da Produção
Methods Engineering and Process Design
Methods and tools for methods engineering• Operations Analysis Tools
– Visual observation and interviews
Questão Seguida de Acção potencial Qual é o objectivo ? Porquê ? Eliminar a actividade desnecessária Onde deve ser realizada ? Porquê ? Combinar ou alterar o local Quando deve ser realizada ? Porquê ? Combinar ou alterar a sequência Quem a deve realizar ? Porquê ? Combinar, mudar ou qualificar o operador Como deve ser realizada ? Porquê ? Simplificar ou melhorar o método
• estrangulamentos do fluxo produtivo; • trabalho envolvendo muita mão-de-obra especializada ou excessiva manipulação; • trabalho envolvendo muito tempo máquina ou equipamento dispendioso; • trabalho envolvendo muitas horas extraordinárias; • trabalho com grande percentagem de rejeições ou desperdício; • baixa eficiência do equipamento; • trabalho com grandes percentagens de tempo não produtivo; • elevada frequência de avarias; • falta de espaço; • trabalho com perigo de acidentes • trabalho referente a produtos com elevados custos de produção e reduzida margem • elevadas taxas de não-qualidade
...

6
11
Production ManagementGestão da Produção
Methods Engineering and Process Design
Methods and tools for methods engineering• Operations Analysis Tools
– Visual observation and interviewsQuestionário O QUE se faz Qual o objectivo desta fase? PORQUÊ?
É indispensável atingir esse objectivo? PORQUÊ? Aumenta-se o valor ou a qualidade do produto? PORQUÊ?
ONDE se faz É o lugar mais próprio ? PORQUÊ? Não poderíamos situar melhor o trabalho ? No local de trabalho, os locais de armazenamento, as máquinas, as ferramentas, os consumíveis utilizados são os mais adequados? PORQUÊ?
QUANDO se faz É o melhor momento ? PORQUÊ? As matérias-primas, os componentes, as ferramentas, as ordens e instruções de fabrico encontram-se no local próprio no momento mais propício? PORQUÊ? Poder-se-ía combinar esta fase com outra? PORQUÊ? Poder-se-ía alterar a sequência de fases ? PORQUÊ?
QUEM o faz O executante é qualificado para o trabalho ? PORQUÊ? Foi devidamente formado para realizar este trabalho ? PORQUÊ? Possui experiência suficiente ? PORQUÊ? As suas qualidades físicas e mentais são adequadas ? PORQUÊ?
COMO se faz É este o melhor método de execução ? PORQUÊ? Os esforços inúteis são evitados e os comandos são suaves? PORQUÊ? Os movimentos são simples e não provocam fadiga desnecessária? PORQUÊ? As movimentações de componentes e materiais são facilitadas? Desenrolam-se a uma altura do solo adequada? PORQUÊ? O ambiente e a segurança são as adequadas ? A iluminação é suficiente e as protecções são eficazes? PORQUÊ?
12
Production ManagementGestão da Produção
Methods Engineering and Process Design
Methods and tools for methods engineering• Operations Analysis Tools
– Process Mapping (materials flow, operations, information flow)
Process Mapping: FLG-Sinais de trânsito
http://www.process-mapping.co.uk/
(Joana Costa, IST, 2007)

7
13
Production ManagementGestão da Produção
Methods Engineering and Process Design
Methods and tools for methods engineering• Operations Analysis Tools
– Process Mapping (materials flow, operations, information flow)
FIM DE PRODUÇÃO
CHEGADA OPERADORES INSTALADORES /
AFINADORES
RETIRAR FERRAMENTA USADA
BUSCAR NOVA FERRAMENTA
LIMPAR PRENSA, FERRAMENTA E CHÃO
ACOPLAR FERRAMENTA NA
PRENSA
SISTEMAS AUXILIARES
COLOCAR BANDA NA FERRAMENTA
AJUSTAMENTOS
TESTES
CHAMAR
INÍCIO DE PRODUÇÃO
(Pedro Mota, IST, 2007)
(Luís Andrada, Francisco Ferro, IST, 2003)
14
Production ManagementGestão da Produção
Methods Engineering and Process Design
Methods and tools for methods engineering• Operations Analysis Tools
– Process Mapping (materials flow, operations, information flow)
Matéria Prima
Prod. Acab.Prod. Vias Fabrico
Arm.Prod.
Acabado
Reembal.
Arm. Prod.Acabado
Reembal.
Arm. Embal.
Etiquetagem
Armazém vias de Fabrico
Fabrico
Enchimento Despontagem Plumagem
Embalagem
encestar encaixotar
atar cintar
Escovaria Fina
encabar
(Gisela Gouveia, Luísa Almeida, IST, 2007)

8
15
Production ManagementGestão da Produção
Methods Engineering and Process Design
Methods and tools for methods engineering• Operations Analysis Tools
– Flow Diagram/Layout
Posto 1 Posto 2 Posto 3 Posto 4 Certificação doProduto
Portão
Escritórios
Pré-Montagem
C.K.D
Verificação Final
Entrada
MontagemEscapes
Motor
Montagem Farolins
Carrinho
EixosDianteiros
Caixa-Eixos
Caixa-Motores
Eixos Traseiros
Carrinho
Caixa-CaixaVelocidades
PortaMotores
Electro-Válvulas
PortaFarolins
10
9
C.K.D
C.K.D
Chassis
1
Tabuleiros
Carrinho
Tabuleiros
Eixos Traseiros
ChassisCarrinho
Tabuleiros
Eixos Dianteiros
Suporte RodasDianteiras
Porta-Farolins
Tabuleiros
2
Suporte RodasTraseiras
Carrinho
Tabuleiros
Mesa
Mesa
Entrada
Pneus Caixas
Caixas
Cabines
Cabines
Edificio da Administração
Cha
ssis
Descargas
CabinesChassis
Pré-Montagem
C.K.D
Linha Férrea
Linha Montagem
(Duarte Trindade, Pedro Duarte, IST, 2003)
16
Production ManagementGestão da Produção
Methods Engineering and Process Design
Methods and tools for methods engineering• Operations Analysis Tools
– Flow Diagram/Layout
(Miguel Gomes, IST, 2007)

9
17
Production ManagementGestão da Produção
Methods Engineering and Process Design
Methods and tools for methods engineering• Operations Analysis Tools
– Identification of operation elementsh: m: s:h: m: s:
1
# OPERAÇÕES1 2 3 4 5 6 7 8 9 10 11 12 13 14 15 16 17 18 19 20 21 22 23 24 25 26 27 28 29 30
AMFAMFAMFAMFAMFAMFAMFAMFAMFAMFAMFAMF
A - Aprovisionamento M - Montagem F - FixaçãoOperadores alocados:
REGISTO DE OBSERVAÇÕES INSTANTÂNEAS# folhas
6
5 Eixo dianteiro
Eixo traseiro
4
fim de medição:Inicio de medição:
OBSERVAÇÕES
Posto Nome Mecânica Pesada
N.º da mediçãoTabela de tempos aleatórios N.º
Modelo
Amortecedores dianteiros1
2 Amortecedores traseiros
Cabine - montagem da articulação e apoios
7 Escape
8 Farolins traseiros
Direcção Assistida - parte do depósito e mecânica
3
Movimentação inicial do chassis
Gancho de reboque
10 Gásoleo
11 Movimentação final do chassis
9
12
(Duarte Trindade, Pedro Duarte, IST, 2003)
18
Production ManagementGestão da Produção
Methods Engineering and Process Design
Methods and tools for methods engineering• Operations Analysis Tools
– Identification of operation elements
Tarefa Tempo
Preencher papel 0:01:00
Fechar palete 0:00:45
Ir ao computador 0:01:00
Levar a palete com Produto Acabado 0:01:30
Arrumar caixas Vazias 0:01:40
Levar as caixas vazias 0:01:00
Tirar o pelo da maquina 0:02:20
Limpar a Maquina 0:00:40
Levar o saco do lixo 0:00:40
Arrumar palete com M.P. 0:00:25
Desapertar as base 0:03:00
Desapertar os apertos 0:08:00
Colocar novas bases 0:03:00
Colocar novos apertos 0:15:00
Afinar curso dos apertos 0:15:00
Afinar carregadores 0:07:00
Afinar e testar máquina 0:10:00
Modificar máq. acabamentos 0:15:00
Afinar e testar máq. acabamentos 0:15:00
Total 1:42:00
(Pedro Mota, IST, 2007)(Pedro Quinas, Pedro Ferreira, IST, 2004)

10
19
Production ManagementGestão da Produção
Methods Engineering and Process Design
Methods and tools for methods engineering• Operations Analysis Tools
– Assembly charts (Diagramas de montagem)
1
2
4
3
5
6
7
8
9
10
S1
A1
A2
S2
A4
A3
A5
Frame
Right wheel
Left wheel
Seat
Fender
Assemble rear wheels to frame
Assemble front wheels to frame
Assemble handle-bars to fork
Assemble seat to frame
Inspect final assembly
1
2
4
3
5
6
7
8
9
10
S1
A1
A2
S2
A4
A3
A5
Frame
Right wheel
Left wheel
Seat
Fender
Assemble rear wheels to frame
Assemble front wheels to frame
Assemble handle-bars to fork
Assemble seat to frame
Inspect final assembly
20
Production ManagementGestão da Produção
Methods Engineering and Process Design
Methods and tools for methods engineering• Operations Analysis Tools
– Assembly charts (Diagramas de precedências)Oper. nº Description Time (s)
1 Starting point 02 Fit washer on left wheel 103 Fit left wheel on axle 184 Fit washer on left axle 105 Insert and fasten cotter key 156 Insert and fasten hub cap 177 Fit washer on right wheel 108 Fit right wheel on axle 189 Fit washer on right axle 1010 Insert and fasten cotter key 1511 Insert and fasten hub cap 1712 Dummy operation 013 Insert front wheel fork in frame 1814 Fit collar on front wheel fork 1115 Insert handle bars into fork 1516 Tighten front wheel collar 1817 Attach left handle grips 1218 Attach right handle grips 1219 Insert seat into frame 920 Tighten seat set screw 1821 End point 0
Total 253
1
2 3 54 6
87 9
12
1110
17
16151413
2019
18 21
10
18
18 17
10
10
10
18
18
18
12
11 15
9
15
15 17
00 012
Operations N.ofpredecessors
ti
1 0 02 1 103 1 104 2 185 2 186 3 107 3 108 4 159 4 15
10 5 1711 5 17
Operations N.ofpredecessors
ti
12 11 013 12 1814 12 915 13 1116 13 1817 14 1518 15 1819 16 1220 16 1221 20 0

11
21
Production ManagementGestão da Produção
Methods Engineering and Process Design
Methods and tools for methods engineering• Operations Analysis Tools
– Operation Process Chart (Folha ou Diagrama do Processo)
Pernas - PINHO 15x300x300
Prateleira - PINHO 15x200x300
Pernas - PINHO 30x30x400
Parafusos # 22-01
Verniz # 133-01
Tapa-poros # 123-01
Inspecção completa
Revestir
Lixar
Montar pernas
Revestir
Cortar
Inspecção final
Montar prateleira
Cortar Cortar Cortar
Aplnar Aplanar Aplanar
Unir Unir Unir
Cortar Cortar
Lixar Lixar Lixar
Verificar dimensão
Verificar dimensão
Verificar dimensão
19
18
20
1
2
4
3 8
6
10 5
9
713
12
11
1 23
15
14
16
17
4
5
22
Production ManagementGestão da Produção
Methods Engineering and Process Design
Methods and tools for methods engineering• Operations Analysis Tools
– Operation Process Chart
Pernas - PINHO 15x300x300
Prateleira - PINHO 15x200x300
Pernas - PINHO 30x30x400
Parafusos # 22-01
Verniz # 133-01
Tapa-poros # 123-01
Inspecção completa
Revestir
Lixar
Montar pernas
Revestir
Cortar
Inspecção final
Montar prateleira
Cortar Cortar Cortar
Aplnar Aplanar Aplanar
Unir Unir Unir
Cortar Cortar
Lixar Lixar Lixar
Verificar dimensão
Verificar dimensão
Verificar dimensão
19
18
20
1
2
4
38
6
10 5
9
713
12
11
123
15
14
16
17
4
5

12
23
Production ManagementGestão da Produção
Methods Engineering and Process Design
Methods and tools for methods engineering• Operations Analysis Tools
– Flow Process Chart(Diagrama do Fluxo do Processo)
24
Production ManagementGestão da Produção
Methods Engineering and Process Design
Methods and tools for methods engineering• Operations Analysis Tools
– Flow Process Chart(Diagrama do Fluxo do Processo)
(Niebel, 2003)
13
25
Production ManagementGestão da Produção
Methods Engineering and Process Design
Methods and tools for methods engineering
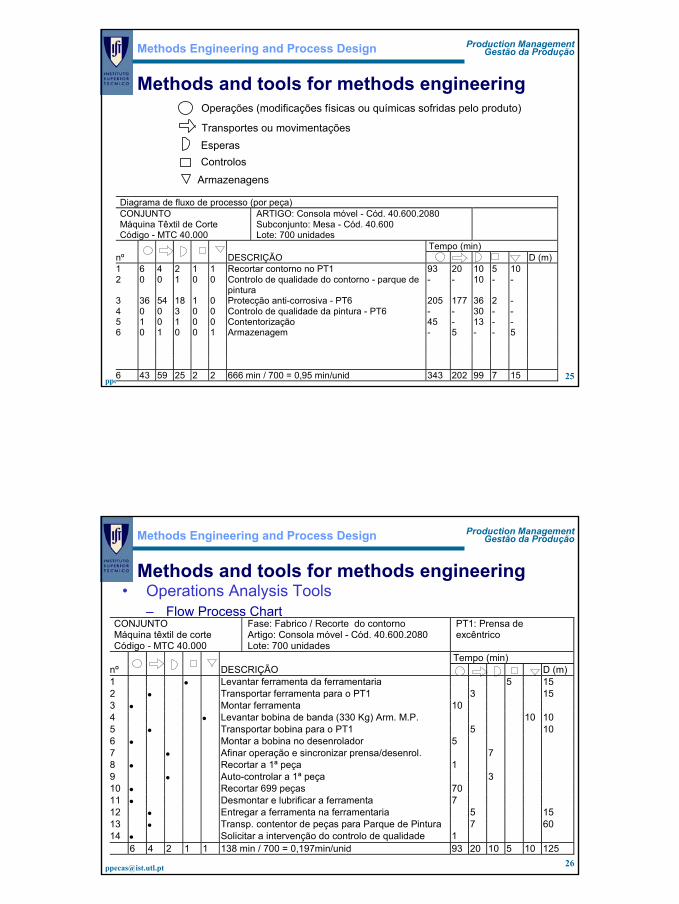
Diagrama de fluxo de processo (por peça) CONJUNTO Máquina Têxtil de Corte Código - MTC 40.000
ARTIGO: Consola móvel - Cód. 40.600.2080 Subconjunto: Mesa - Cód. 40.600 Lote: 700 unidades
Tempo (min) nº DESCRIÇÃO D (m) 1 6 4 2 1 1 Recortar contorno no PT1 93 20 10 5 10 2 0 0 1 0 0 Controlo de qualidade do contorno - parque de
pintura - - 10 - -
3 36 54 18 1 0 Protecção anti-corrosiva - PT6 205 177 36 2 - 4 0 0 3 0 0 Controlo de qualidade da pintura - PT6 - - 30 - - 5 1 0 1 0 0 Contentorização 45 - 13 - - 6 0 1 0 0 1 Armazenagem - 5 - - 5 6 43 59 25 2 2 666 min / 700 = 0,95 min/unid 343 202 99 7 15
Operações (modificações físicas ou químicas sofridas pelo produto)
Transportes ou movimentaçõesEsperasControlos
Armazenagens
26
Production ManagementGestão da Produção
Methods Engineering and Process Design
Methods and tools for methods engineering• Operations Analysis Tools
– Flow Process ChartCONJUNTO Máquina têxtil de corte Código - MTC 40.000
Fase: Fabrico / Recorte do contorno Artigo: Consola móvel - Cód. 40.600.2080 Lote: 700 unidades
PT1: Prensa de excêntrico
Tempo (min) nº DESCRIÇÃO D (m) 1 • Levantar ferramenta da ferramentaria 5 15 2 • Transportar ferramenta para o PT1 3 15 3 • Montar ferramenta 10 4 • Levantar bobina de banda (330 Kg) Arm. M.P. 10 10 5 • Transportar bobina para o PT1 5 10 6 • Montar a bobina no desenrolador 5 7 • Afinar operação e sincronizar prensa/desenrol. 7 8 • Recortar a 1ª peça 1 9 • Auto-controlar a 1ª peça 3 10 • Recortar 699 peças 70 11 • Desmontar e lubrificar a ferramenta 7 12 • Entregar a ferramenta na ferramentaria 5 15 13 • Transp. contentor de peças para Parque de Pintura 7 60 14 • Solicitar a intervenção do controlo de qualidade 1 6 4 2 1 1 138 min / 700 = 0,197min/unid 93 20 10 5 10 125
14
27
Production ManagementGestão da Produção
Methods Engineering and Process Design
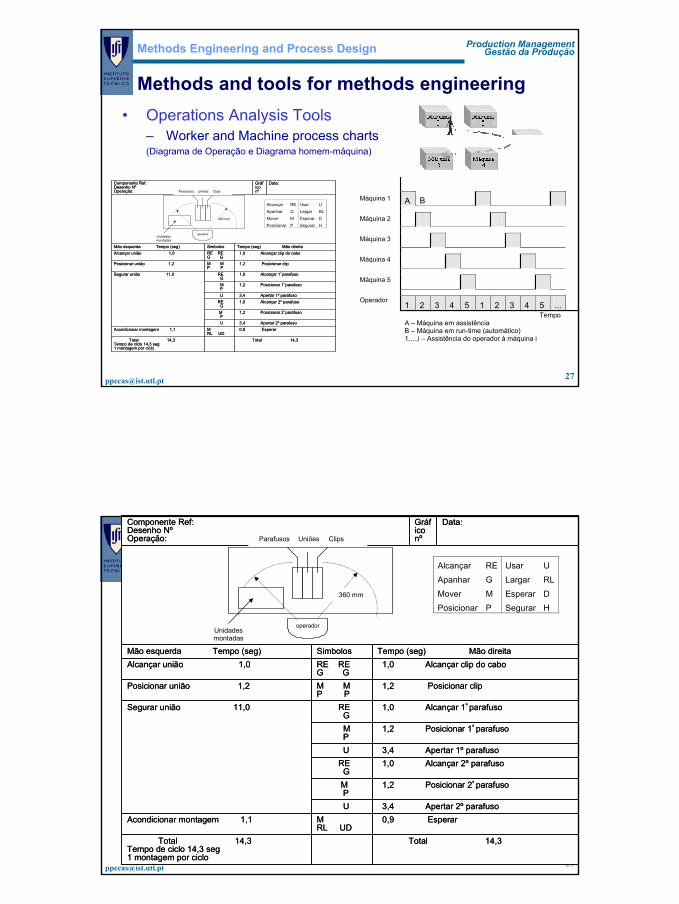
Methods and tools for methods engineering• Operations Analysis Tools
– Worker and Machine process charts(Diagrama de Operação e Diagrama homem-máquina)
Total 14,3Total 14,3Tempo de ciclo 14,3 seg1 montagem por ciclo
0,9 EsperarMRL UD
Acondicionar montagem 1,13,4 Apertar 2º parafusoU
1,2 Posicionar 2º parafusoMP
1,0 Alcançar 2º parafusoREG
3,4 Apertar 1º parafusoU
1,2 Posicionar 1º parafusoMP
1,0 Alcançar 1º parafusoREG
Segurar união 11,0
1,2 Posicionar clipM MP P
Posicionar união 1,2
1,0 Alcançar clip do caboRE REG G
Alcançar união 1,0Tempo (seg) Mão direita SimbolosMão esquerda Tempo (seg)
Data:Gráfico nº
Componente Ref:Desenho NºOperação:
Total 14,3Total 14,3Tempo de ciclo 14,3 seg1 montagem por ciclo
0,9 EsperarMRL UD
Acondicionar montagem 1,13,4 Apertar 2º parafusoU
1,2 Posicionar 2º parafusoMP
1,0 Alcançar 2º parafusoREG
3,4 Apertar 1º parafusoU
1,2 Posicionar 1º parafusoMP
1,0 Alcançar 1º parafusoREG
Segurar união 11,0
1,2 Posicionar clipM MP P
Posicionar união 1,2
1,0 Alcançar clip do caboRE REG G
Alcançar união 1,0Tempo (seg) Mão direita SimbolosMão esquerda Tempo (seg)
Data:Gráfico nº
Componente Ref:Desenho NºOperação: Parafusos
operador
360 mm
Unidades montadas
Uniões Clips
Alcançar RE Usar U Apanhar G Largar RLMover M Esperar D Posicionar P Segurar H
A
B
1 2 3 4 5 1 2 3 4 5 ... Tempo A – Máquina em assistência B – Máquina em run-time (automático) 1,...,i – Assistência do operador à máquina i
Máquina 1
Máquina 2
Máquina 3
Máquina 4
Máquina 5
Operador
28
Production ManagementGestão da Produção
Methods Engineering and Process Design
Methods and tools for methods engineering• Operations Analysis Tools
– Worker and Machine process charts (Diagrama de Operação)
Total 14,3Total 14,3Tempo de ciclo 14,3 seg1 montagem por ciclo
0,9 EsperarMRL UD
Acondicionar montagem 1,13,4 Apertar 2º parafusoU
1,2 Posicionar 2º parafusoMP
1,0 Alcançar 2º parafusoREG
3,4 Apertar 1º parafusoU
1,2 Posicionar 1º parafusoMP
1,0 Alcançar 1º parafusoREG
Segurar união 11,0
1,2 Posicionar clipM MP P
Posicionar união 1,2
1,0 Alcançar clip do caboRE REG G
Alcançar união 1,0Tempo (seg) Mão direita SimbolosMão esquerda Tempo (seg)
Data:Gráfico nº
Componente Ref:Desenho NºOperação:
Total 14,3Total 14,3Tempo de ciclo 14,3 seg1 montagem por ciclo
0,9 EsperarMRL UD
Acondicionar montagem 1,13,4 Apertar 2º parafusoU
1,2 Posicionar 2º parafusoMP
1,0 Alcançar 2º parafusoREG
3,4 Apertar 1º parafusoU
1,2 Posicionar 1º parafusoMP
1,0 Alcançar 1º parafusoREG
Segurar união 11,0
1,2 Posicionar clipM MP P
Posicionar união 1,2
1,0 Alcançar clip do caboRE REG G
Alcançar união 1,0Tempo (seg) Mão direita SimbolosMão esquerda Tempo (seg)
Data:Gráfico nº
Componente Ref:Desenho NºOperação: Parafusos
operador
360 mm
Unidades montadas
Uniões Clips
Alcançar RE Usar U Apanhar G Largar RL Mover M Esperar D Posicionar P Segurar H
15
29
Production ManagementGestão da Produção
Methods Engineering and Process Design
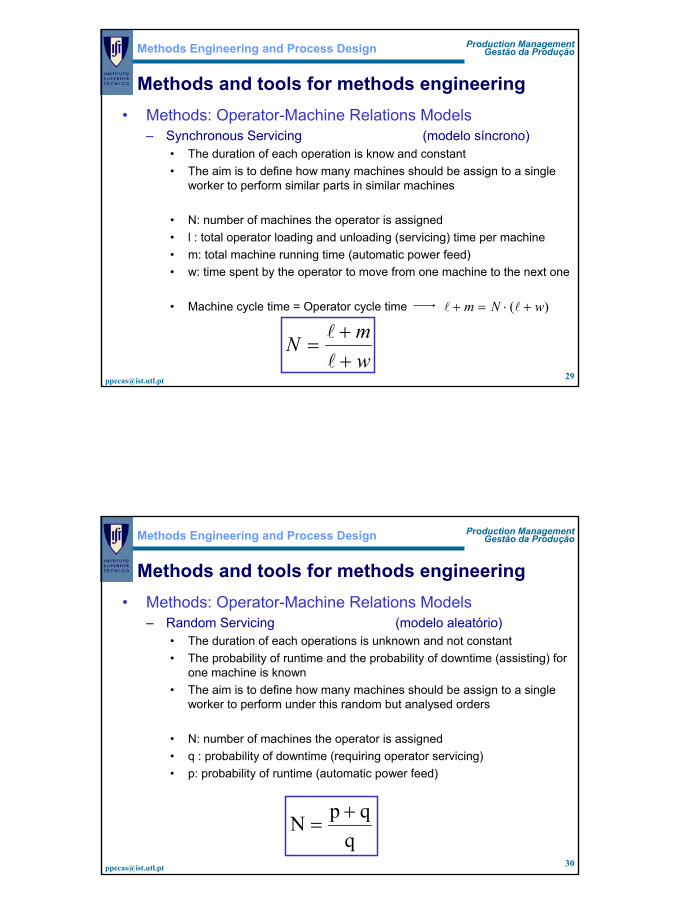
Methods and tools for methods engineering• Methods: Operator-Machine Relations Models
– Synchronous Servicing (modelo síncrono)• The duration of each operation is know and constant• The aim is to define how many machines should be assign to a single
worker to perform similar parts in similar machines
• N: number of machines the operator is assigned• l : total operator loading and unloading (servicing) time per machine• m: total machine running time (automatic power feed)• w: time spent by the operator to move from one machine to the next one
• Machine cycle time = Operator cycle time )( wNm +⋅=+ ll
wmN
++
=l
l
30
Production ManagementGestão da Produção
Methods Engineering and Process Design
Methods and tools for methods engineering• Methods: Operator-Machine Relations Models
– Random Servicing (modelo aleatório)• The duration of each operations is unknown and not constant• The probability of runtime and the probability of downtime (assisting) for
one machine is known• The aim is to define how many machines should be assign to a single
worker to perform under this random but analysed orders
• N: number of machines the operator is assigned• q : probability of downtime (requiring operator servicing) • p: probability of runtime (automatic power feed)
qqpN +
=

16
31
Production ManagementGestão da Produção
Methods Engineering and Process Design
Methods and tools for methods engineering•Methods: Operator-Machine Relations Models
– Synchronous Servicing: example 1A company has several laser cutting machines and several operators able to work with the laser. For a specific order the company must deliver 1000 parts. Each laser can only produce one part at the time and the estimated laser cutting is 5 min. From several years of experience its estimated that the operator will spent 2 min to load the laser and 1 min to unload the laser. The average time spent by the operator to walk from one laser to the next one is around 0,5 min. The laser cost per hour is 250 €/h and the operator is 20 €/h. The customer accepts a delivery time of 2 weeks (10 days). What is the best work station configuration to perform this order ?Problem solving:l = 2+1 = 3min m = 5 min w = 0,5 min N= (3+5)/3+0,5) = 2,28 mach./operatorSo, there are two possibilities:N = 2 1 operator with 2 machinesoperator cycle time = N (l+w) = 2 (3+0,5) = 7 minmachine cycle time = l + m = 3 + 5 = 8 minN = 3 1 operator with 3 machinesoperator cycle time = N (l+w) = 3 (3+0,5) = 10,5 minmachine cycle time = l + m = 3 + 5 = 8 min
wmN
++
=l
l
The machines are the bottleneck.The WS cycle time is 8 min.The operator is not fully used.
The operator is the bottleneck.The WS cycle time is 10,5 min.The machines are not fully used.
32
Production ManagementGestão da Produção
Methods Engineering and Process Design
Methods and tools for methods engineering•Methods: Operator-Machine Relations Models
– Synchronous Servicing: example 1 (cont.)N = 2 1 operator with 2 machinesWS cycle time = tc ws = 8 min (operator idle time: 1 min/cycle (8-7)/8 = 12,5%Number of parts per cycle = Npc = N * number of parts per machine = 2.1 = 2Product cycle time = tc = tc ws /Npc = 8/2 = 4 minProduction rate = CAD = 1/tc = 1/4 = 0,25 u/min = 15 u/h = 120 u/day1000 parts will be produced in 1 WS during 1000/120 = 8,3 days fulfil delivery time.The part cost will be: Cu = (1.20 + 2.250)/15 = 34,67 €/u.N = 3 1 operator with 3 machinesWS cycle time = tc ws = 10,5 min (machine idle time: 2,5 min/cycle (10,5-8)/10,5 = 24%Number of parts per cycle = Npc = N * number of parts per machine = 3.1 = 3Product cycle time = tc = tc ws /Npc = 10,5/3 = 3,5 minProduction rate = CAD = 1/tc = 1/3,5 = 0,286 u/min = 17,1 u/h = 137,1 u/day1000 parts will be produced in 1 WS during 1000/137,1 = 7,3 days fulfil delivery time.The part cost will be: Cu = (1.20 + 3.250)/17,1 = 45,03 €/u. The best WS configuration is 1 operator with 2 Lasers, since theThe best WS configuration is 1 operator with 2 Lasers, since the productivity is higher.productivity is higher.
wmN
++
=l
l

17
33
Production ManagementGestão da Produção
Methods Engineering and Process Design
Methods and tools for methods engineering•Methods: Operator-Machine Relations Models
– Synchronous Servicing: example 1 (cont.) wmN
++
=l
l
time Operator Laser 1 Laser 2 time Operator Laser 1 Laser 2 Laser 30,5 L1 loading running 0,5 L1 loading running running0,5 L1 loading running 0,5 L1 loading running running0,5 L1 loading running 0,5 L1 loading running running0,5 L1 loading running 0,5 L1 loading running running0,5 T running running 0,5 T running running running0,5 L2 running unloading 0,5 L2 running unloading running0,5 L2 running unloading 0,5 L2 running unloading running0,5 L2 running loading 0,5 L2 running loading IDLE0,5 L2 running loading 0,5 L2 running loading IDLE0,5 L2 running loading 0,5 L2 running loading IDLE0,5 L2 running loading 0,5 L2 running loading IDLE0,5 T running running 0,5 T running running IDLE0,5 IDLE running running 0,5 L3 running running unloading0,5 IDLE running running 0,5 L3 running running unloading0,5 L1 unloading running 0,5 L3 IDLE running loading0,5 L1 unloading running 0,5 L3 IDLE running loading
0,5 L3 IDLE IDLE loading0,5 L3 IDLE IDLE loading0,5 T IDLE IDLE running0,5 L1 unloading IDLE running0,5 L1 unloading IDLE running
34
Production ManagementGestão da Produção
Methods Engineering and Process Design
Methods and tools for methods engineering•Methods: Operator-Machine Relations Models
– Synchronous Servicing– Proposed exercises:
• In example1, for a delivery time of 7,5 days (instead of 10), what is the best WS configuration ? S: N=2
• And for a delivery time of 5 days ? S: N=2• And if it was required to deliver 10 000 unities in 73 days ? N=2• Consider an operator cost of 40,00 €/h to run the WS after the 8 hours
shift (the maximum number of hour per operator is 3 hours). Consider also, there is only 3 lasers available for this order. What would be the best WS configuration to deliver 1000 unities in 7,5 days ? S: N=2 working 7,5 days plus 6,7 hours in extra-period or N=2 working 7,5 days and other WS N=1 working 13,4 hours in the normal period.
– And Also:• 2.2• 2.3• 2.8
wmN
++
=l
l

18
35
Production ManagementGestão da Produção
Methods Engineering and Process Design
Methods and tools for methods engineering•Methods: Operator-Machine Relations Models
– Random Servicing: example 2A company with several laser cutting equipments performs several kinds of parts differing in size and shape. Through a time-study it was found that about 60% of the production time each laser is performing part cutting without operator assistance. The rest of the time (40%) is required to load and unload parts by the operator. Each laser produce average 25 parts per hour. The laser hour cost is 250 €/h and the operator cost is 20 €/h. What is the best number of lasers to assign to each operator aiming to maximise productivity ?Problem solving:p = 60% Q = 40% N= (0,6+0,4)/0,4) = 2,5 mach./operator
So, there are two possibilities:N = 2 1 operator with 2 machines
N = 3 1 operator with 3 machines
MODEL (p+q)N
qqpN +
=
36
Production ManagementGestão da Produção
Methods Engineering and Process Design
Methods and tools for methods engineering•Methods: Operator-Machine Relations Models
– Random Servicing: example 2 (cont.)N = 2 1 operator with 2 machines( p + q )2 = p2 + 2pq + q2 1 = 0,36 + 0,48 + 0,1636% time: The lasers are working without operator assistance48% time: One laser is working (cutting); the other is requiring assistance (load or unload).16% time: The two laser are requiring assistance, but only one is being assisted.So, the operator is idle 36% of the timeThe machine are working 2.36% (cutting) + 48% (cutting) + 48% (load/unload) + 16% (load/unload).The total is 184% of 200% available are being use in production. 16% of 200% of machine time is idle time.So, there is 92% is used for laser cutting and 8% is no-productive time.Production rate = CAD = CAD one machine . Number of machines . Productive time = 25 . 2 . 0,92 = 46 u/h.Cu = (1.20+2.250)/46 = 11,30 €/u.N = 3 1 operator with 3 machines( p + q )3 = p3 + 3p2q +3pq2 + q3 1 = 0,216 + 0,432 + 0,288 + 0,06421,6% time: The lasers are working without operator assistance.43,2% time: Two laser are working (cutting); the other being assisted by the operator (load or unload).28,8% time: One laser are working (cutting); the others two are requiring assistance (load or unload).Only one is being assisted.6,4% time: The three lasers are requiring assistance, but only one is being assisted. So two are waiting for assistance.So, the operator is idle 21,6% of the time.The machine are working 3.21,6% (cutting) + 2.43,2% (cutting) + 43,2% (load/unload) + 28,8% (cutting) + 28,8% (load/unload) + 6,4% (load/unload).The total is 258,4% of 300% available are being use in production. 41,6% of 300% of machine time is idle time.So, there is 86,13% is used for laser cutting and 13,87% is no-productive time.Production rate = CAD = CAD one machine . Number of machines . Productive time = 25 . 3 . 0,8613 = 64,6 u/h.Cu = (1.20+3.250)/64,6 = 11,92 €/u.
The best WS configuration is 1 operator with 2 Lasers, since theThe best WS configuration is 1 operator with 2 Lasers, since the productivity is higher.productivity is higher.
wmN
++
=l
l

19
37
Production ManagementGestão da Produção
Methods Engineering and Process Design
Methods and tools for methods engineering•Methods: Operator-Machine Relations Models
– Random Servicing– Proposed exercises:
• 2.1• 2.9
•Methods: Learning Curves– See annex– Proposed exercises:
• 1.1• 1.2• 1.3• 1.4• 1.5
38
Production ManagementGestão da Produção
Methods Engineering and Process Design
Readings• E. Henriques, P. Peças, Gestão da Produção I, Capitulo:
Estudo dos Métodos, 2003.• Chase, Aquilano, Jacobs, Chapter 11, Production and
Operations Management, McGraw-Hill, 1998.
• Also recommended:– The proposed exercises.