production and trade of ict from an eu perspective
TRANSCRIPT

OCTOBER 2021 Research Report 456
Production and Trade of ICT from an EU Perspective Mahdi Ghodsi (coordinator), Amat Adarov, Dimitrios Exadaktylos, Robert Stehrer and Roman Stöllinger
The Vienna Institute for International Economic Studies Wiener Institut für Internationale Wirtschaftsvergleiche


Production and Trade of ICT from an EU Perspective MAHDI GHODSI (COORDINATOR) AMAT ADAROV DIMITRIOS EXADAKTYLOS ROBERT STEHRER ROMAN STÖLLINGER
Mahdi Ghodsi is Economist at The Vienna Institute for International Economic Studies (wiiw) and external Lecturer at Vienna University of Economics and Business (WU). Amat Adarov is Senior Economist at the World Bank. He contributed to this study while he was employed at wiiw. Dimitrios Exadaktylos is Economist at Alma Economics, London, UK and PhD Candidate at the IMT School for Advanced Studies Lucca, Italy. Robert Stehrer is Scientific Director at wiiw. Roman Stöllinger is Economist at wiiw. Research for this paper was financed by the Anniversary Fund of the Oesterreichische Nationalbank (Project No.18128). Support provided by Oesterreichische Nationalbank for this research is gratefully acknowledged. The information and views set out in this article are those of the authors and do not necessarily reflect the official opinion of The Vienna Institute for International Economic Studies, the Oesterreichische Nationalbank, or the World Bank.


Abstract
The competitiveness of industries and countries is shaped more and more by technological advancement in the production and use of information and communications technology (ICT). This report considers the supply side of ICT goods and services. It studies the drivers of ICT production location and trade across countries with a focus on the relative position of the EU. The analyses clearly indicate that the EU must step up its efforts to accelerate the shift towards digital production and strengthening the ICT sector that produces the required technologies and services. In addition, from a trade policy perspective, a harmonised set of standards and regulatory framework is to be aimed at to minimise mismatches in technical specifications and requirements. This will lead to the diffusion of positive externalities and should allow for a smooth operation of the global value chains in these products.
Keywords: information and communications technology, digitalisation, production patterns, trade patterns
JEL classification: F14, O33, L11, L63


CONTENTS
Abstract ............................................................................................................................................................................5
1. Introduction .................................................................................................................................................... 11
2. ICT capital formation and growth ........................................................................................................ 13
2.1. Introduction ....................................................................................................................................13 2.2. Growth accounting results .............................................................................................................13 2.3. Econometric analysis .....................................................................................................................16
3. The production side of ICT technology at aggregate level ....................................................... 19
3.1. Introduction ....................................................................................................................................19 3.2. Definition of the ICT sector and the PREDICT dataset ..................................................................20 3.3. The role of the ICT sector at the global level .................................................................................23 3.4. The ICT sector in a cross-country perspective ..............................................................................33 3.5. A look inside the EU: The ICT sectors of the EU member states ..................................................45
4. ICT production from a firm-level perspective ............................................................................... 52
4.1. Introduction ....................................................................................................................................52 4.2. Data ...............................................................................................................................................52 4.3. Firm-level comparisons between selected regions producing in ICT sectors ................................53 4.4. Innovative performance of firms in ICT sectors .............................................................................54 4.5. Labour productivity across sectors ................................................................................................55 4.6. Total factor productivity of manufacturing firms .............................................................................56 4.7. Top five ICT producers – global versus EU27 ...............................................................................58
5. Trade in ICT goods ...................................................................................................................................... 65
5.1. Introduction ....................................................................................................................................65 5.2. Geographical patterns ....................................................................................................................67 5.3. Trade policy measures for ICT goods ............................................................................................71
6. Summary and conclusions ....................................................................................................................... 77
References ................................................................................................................................................................... 81
Appendix ...................................................................................................................................................................... 85

TABLES AND FIGURES
Table 1 / Growth accounting results ......................................................................................................... 14 Table 2 / Growth contributions of tangible and intangible ICT assets ...................................................... 15 Table 3 / Estimation results for value-added growth ................................................................................ 17 Table 4 / Estimation results for value-added growth with detailed capital asset types ............................ 18 Table 5 / Definition of the ICT sector in the PREDICT dataset ................................................................ 21 Table 6 / Comparison of the comprehensive and the operational definition of the ICT sector ................. 22 Table 7 / Comparison of the comprehensive and the operational definition of the ICT sector ................. 24 Table 8 / Compound annual growth rates of the ICT sector and the total economy, 2000-2016 ............. 27 Table 9 / Compound annual growth rates of the ICT sector in main producer countries, 2000-2016 ...... 35 Table 10 / Share of main producer regions in global expenditure on business R&D, nominal values,
2000, 2006, 2013, 2016 ........................................................................................................... 43 Table 11 / Member states’ shares in EU-wide ICT sector value added and employment, 2000
and 2018 .................................................................................................................................. 46 Table 12 / Average labour productivity across sectors (in thousand USD), 2009-2018 ........................... 56 Table 13 / TFP across EU27 countries and aggregate regions, 2009-2018 ............................................ 57 Table 14 / Top five companies in terms of turnover by sector in 2016 in global ICT manufacturing
and services sectors ................................................................................................................ 59 Table 15 / Top five companies in terms of turnover by sector in 2016 in ICT manufacturing and
services sectors of EU27 countries. ......................................................................................... 62 Figure 1 / Composition of capital stocks by asset groups ........................................................................ 14 Figure 2 / Nominal and real value added and price deflators for the ICT sector ...................................... 25 Figure 3 / Price deflators in the ICT sector and the overall economy ...................................................... 25 Figure 4 / The role of the global ICT sector in the global economy .......................................................... 28 Figure 5 / Development of global labour productivity, ICT sector and overall economy, 2000-2016 ....... 29 Figure 6 / R&D intensity of the ICT sector and of the overall economy, 2000-2016 ................................ 30 Figure 7 / Global labour productivity in the ICT and main economic sectors, averages 2000-2016 ........ 31 Figure 8 / Global R&D intensity in the ICT and main economic sectors, averages 2000-2016 ............... 32 Figure 9 / R&D shares of the ICT (sub-) sectors in the economy, manufacturing and services .............. 33 Figure 10 / The role of the ICT sector in the main ICT producing economies .......................................... 37 Figure 11 / Development of world market shares, ICT sector and overall economy, 2000-2016 ............ 39 Figure 12 / Real labour productivity of the ICT sector in main producer countries, 2000-2016 ............... 40 Figure 13 / Real labour productivity gaps to the US in the ICT sector, average 2000-2016 .................... 41 Figure 14 / R&D intensity in the ICT sector in the main producer countries, 2000-2016 ......................... 44 Figure 15 / R&D intensity in the ICT sector and main sub-sectors, averages 2000-2016 ....................... 45 Figure 16 / Specialisations of EU member states in the ICT sector relative to the EU average, 2016 .... 47 Figure 17 / Compound annual growth rates of the ICT sector across member states, 2000-2018 .......... 48 Figure 18 / Real labour productivities in the ICT sector, selected EU member states, 2000-2016 .......... 49 Figure 19 / Real labour productivity in the ICT sector and main sub-sectors, averages 2000-2016 ........ 50 Figure 20 / EU member states’ shares in EU-wide expenditure on business R&D, 2000 and 2016 ........ 51 Figure 21 / R&D intensity in the ICT sector and main sub-sectors, averages 2000-2016 ....................... 51 Figure 22 / Average turnover of large ICT firms with more than 249 employees by region in
billion USD, 2009-2018 ............................................................................................................ 53

Figure 23 / Aggregate market share of ICT firms in six major countries over 2009-2018 ........................54 Figure 24 / Mean R&D expenditure per year (million USD, 2015) ............................................................55 Figure 25 / Evolution of the of TFP (in logarithms) and allocative efficiency of ICT manufacturing
firms, 2009-2018 .......................................................................................................................58 Figure 26 / Aggregate market share of top five ICT firms in each sector, during 2009-2018 ...................64 Figure 27 / Aggregate market share of top five ICT producers by sector, EU27 ......................................64 Figure 28 / Worldwide exports of ICT goods, billion USD by product category; share in total exports,
2012–2018 ................................................................................................................................67 Figure 29 / Top 20 exporters of ICT goods, billion USD by product category; share of ICT exports
in total exports, 2018 ................................................................................................................68 Figure 30 / Diversification of exports of ICT goods by categories of 20 top exporters in 2018 .................68 Figure 31 / Top 20 importers of ICT goods, billion USD by product category; and share of ICT
imports in total imports, 2018 ...................................................................................................69 Figure 32 / Diversification of imports of ICT goods by categories, of 20 top importers in 2018 ................70 Figure 33 / Trade balance in ICT goods relative to total trade in selected countries, 2018 ......................71 Figure 34 / Development of tariffs levied on ICT goods traded bilaterally during 2012-2018, EU27
versus non-EU27 ......................................................................................................................72 Figure 35 / Trade-weighted average tariffs levied on global bilaterally traded ICT goods, by product
category, 2012-2018 .................................................................................................................72 Figure 36 / Development of TBTs collected by UNCTAD imposed on ICT goods traded bilaterally
during 2012–2018 .....................................................................................................................74 Figure 37 / Development of TBTs notified to the WTO imposed on ICT goods traded bilaterally
during 2012–2018 .....................................................................................................................75 Figure 38 / Average stock number of TBTs collected by UNCTAD imposed on ICT goods traded
bilaterally, by product category, 2012–2018 .............................................................................76 Figure 39 / Average number of TBTs notified to the WTO imposed on ICT goods traded bilaterally,
by product category, 2012-2018 ...............................................................................................76


INTRODUCTION 11 Research Report 456
1. Introduction
In the current era of digitalisation the competitiveness of countries, industries and firms is driven by technological advancement based on the application of information and communications technology (ICT), the use of ICT goods and services and ICT capital accumulation. Therefore, the role and effects of ICT – or ‘digitalisation’ in general – has been widely discussed over the past decades, either by emphasising its role in productivity growth or by examining potential implications for labour demand and needed skills. Specifically, there is a large evolving literature analysing the potential impacts on employment levels and structures (for recent contributions, see Autor and Salomons, 2018; Benzell et al., 2015; Sachs et al. 2015; Arntz et al., 2016; Chiacchio et al., 2018). However, comparatively less attention has been paid, and less in-depth analysis provided, regarding the supply side of ICT products and services and ICT production (as an example, see European Commission, 2009; JRC, 2017). One of the main arguments counteracting the negative impact of ‘digitalisation’ on employment levels (due to its huge labour-saving potential) is that such technologies and the respective capital inputs have to be produced, which can offset the labour-shedding effects of these developments to some extent – an aspect that is emphasised in the older literature, starting with David Ricardo. This is of particularly concern to Europe, with a low share of ICT value added generated compared with Asia and the US, which have become the leading producers. Therefore, this report looks more carefully at the supply side of the digital economy and ICT assets.
Looking at the production side, a study by the Joint Research Centre (JRC, 2017) puts the share of the ICT sector value added in the world total, according to its definition, at about 4% in the European Union (EU), compared with 16% in Taiwan, 9% in Korea, and still about 2 percentage points lower than in the US and Japan. Further, while the US share of gross output of operational ICT (NACE 26.1-26.4) manufacturing industries in the world total fell from 25% in 1995 to 9% in 2015 (see Figure 1), its value-added share in the world total only dropped from 28% to 21%. This also coincides with the emerging role in the sector of the two countries with the highest population density worldwide, namely China and India. In China, the US superstars have been heavily investing in this sector, and India is a source of offshoring and outsourcing of multinational enterprises (MNEs).
These global production structures also have implications for trade patterns in ICT products, and this has recently become a concern with respect to supply-chain shortages and strategic autonomy considerations of the EU. Liberalisation in trade and the globalisation process have resulted in the fragmentation of production across the world; they have led US producers of ICT to establish their manufacturing lines in countries with lower costs of production factors and they have driven up the employment of technicians and low-skilled workers and gross output growth in China and some East European countries. While middle-income trap countries feel a slowdown in economic growth, the US superstars gain in value by utilising their productive capacities, thus pushing the technology even further. The major value added in the sector is still produced in the headquarters in the US, where the R&D expenditures are used to facilitate the innovation process by high-skilled scientists stimulating the technological advancements in the sector. This is often reflected in the registration of new patents, which

12 INTRODUCTION Research Report 456
may be sold or transferred as intangible assets to the subsidiaries to maintain the level of competitive innovation and produce new products with new procedures.
This report looks carefully looks at these issues and is structured as follows. In the next section we present some descriptive statistics on the relative importance of ICT capital formation for growth. This is followed in Section 3 by a discussion of the most important patterns of production of ICT from an industry perspective. In Section 4 we outline the most important patterns and trends based on firm-level data. Trade in ICT products is then described in Section 5, and Section 6 concludes.

ICT CAPITAL FORMATION AND GROWTH 13 Research Report 456
2. ICT capital formation and growth
2.1. INTRODUCTION
In this first section we discuss the relative importance of ICT capital as a driver of value-added growth, drawing on the empirical results in a recent research paper accompanying the EU KLEMS Release 2019 (Adarov and Stehrer, 2019). The EU KLEMS Release 20191 is a dataset which distinguishes 14 different capital asset types, including intangible assets outside the boundaries of national accounts (see Haskel and Westlake (2018) for a detailed discussion on the role of intangible assets). Importantly for this report, it allows differentiating between non-ICT and ICT capital. The latter group can be split into tangible assets (information technology and communications technology) versus intangible capital (software and databases). The focus of this section is to assess the contribution of ICT capital growth to value-added growth using a growth accounting framework. The data and methods are summarised in Stehrer et al. (2019) and the results are presented in Section 2.2. These data are then used further in an econometric exercise to identify the (positive) impact of ICT capital growth on real value-added growth (see Section 2.3).
2.2. GROWTH ACCOUNTING RESULTS
In this section, the growth performance of the two European country groups – the countries which have been EU members since 1995 (EU15) and the Central and East European countries which joined later (EU-CEE) – plus Japan and the US are considered, drawing on the EU KLEMS Release 2019 Analytical Database, i.e. including a larger set of intangible assets. Before presenting the growth accounting results, a quick overview of capital stock data is given.
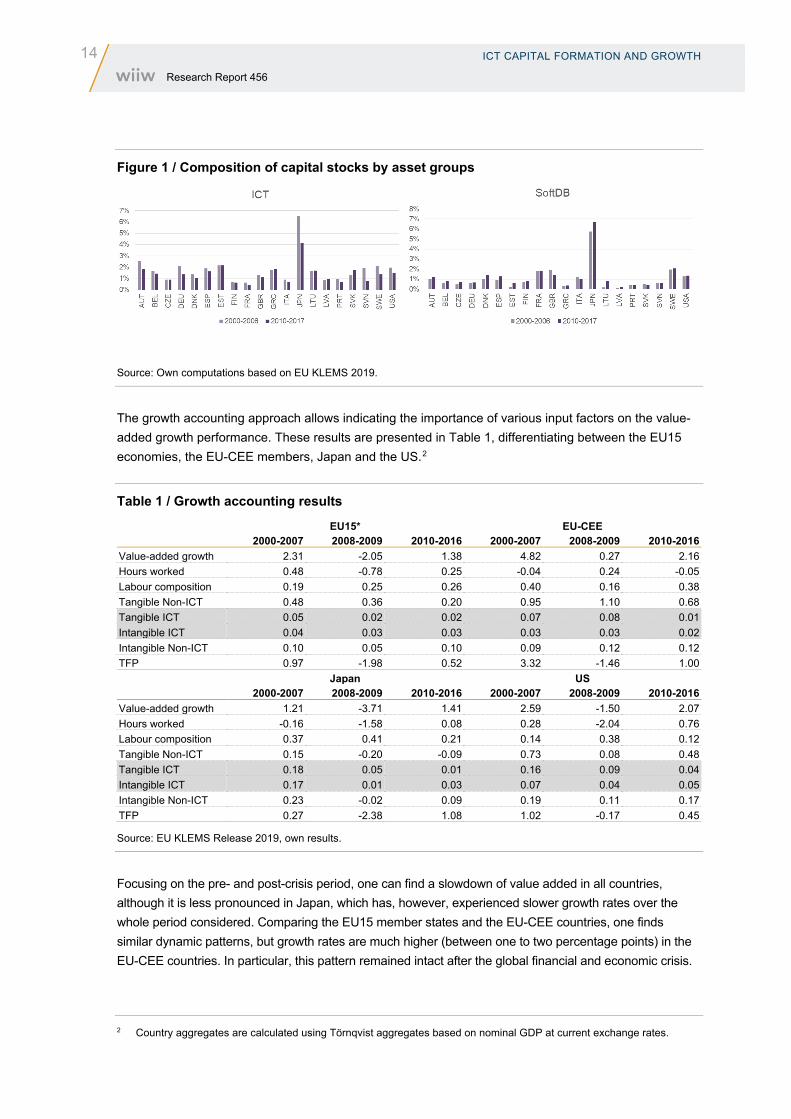
Figure 1 shows the shares of tangible ICT and intangible ICT capital asset aggregates in total capital stocks and intensities with respect to the labour employed, also examining the changes between the pre- and post-crisis periods (for the countries for which the detailed capital asset composition is available in the EU KLEMS 2019). It should be noted that most of the capital stock value (about 90% on average) is attributed to Non-ICT capital, and in particular construction. Japan stands out from the rest of the sample with a smaller share of Non-ICT capital and particularly high shares of ICT, SoftDB and RD capital in the total capital stock (see Figure 1). European countries exhibit significant heterogeneity in terms of capital composition. While no significant changes are observed in the shares of tangible and intangible ICT capital in total capital stocks (there is a marginal increase in the share of SoftDB along with a slight decrease in the share of tangible ICT in total capital stock). Among the European countries, Austria, Sweden and Denmark appear to be the leaders at the digital capital frontier as measured by the importance of ICT and SoftDB relative to both total capital stocks.
1 The update has been funded by the European Commission (DG ECFIN) under service contract ECFIN-116-2018/SI2.784491. Data are available at www.euklems.eu.
14 ICT CAPITAL FORMATION AND GROWTH Research Report 456
Figure 1 / Composition of capital stocks by asset groups
Source: Own computations based on EU KLEMS 2019.
The growth accounting approach allows indicating the importance of various input factors on the value-added growth performance. These results are presented in Table 1, differentiating between the EU15 economies, the EU-CEE members, Japan and the US.2
Table 1 / Growth accounting results
EU15* EU-CEE 2000-2007 2008-2009 2010-2016 2000-2007 2008-2009 2010-2016 Value-added growth 2.31 -2.05 1.38 4.82 0.27 2.16 Hours worked 0.48 -0.78 0.25 -0.04 0.24 -0.05 Labour composition 0.19 0.25 0.26 0.40 0.16 0.38 Tangible Non-ICT 0.48 0.36 0.20 0.95 1.10 0.68 Tangible ICT 0.05 0.02 0.02 0.07 0.08 0.01 Intangible ICT 0.04 0.03 0.03 0.03 0.03 0.02 Intangible Non-ICT 0.10 0.05 0.10 0.09 0.12 0.12 TFP 0.97 -1.98 0.52 3.32 -1.46 1.00 Japan US 2000-2007 2008-2009 2010-2016 2000-2007 2008-2009 2010-2016 Value-added growth 1.21 -3.71 1.41 2.59 -1.50 2.07 Hours worked -0.16 -1.58 0.08 0.28 -2.04 0.76 Labour composition 0.37 0.41 0.21 0.14 0.38 0.12 Tangible Non-ICT 0.15 -0.20 -0.09 0.73 0.08 0.48 Tangible ICT 0.18 0.05 0.01 0.16 0.09 0.04 Intangible ICT 0.17 0.01 0.03 0.07 0.04 0.05 Intangible Non-ICT 0.23 -0.02 0.09 0.19 0.11 0.17 TFP 0.27 -2.38 1.08 1.02 -0.17 0.45
Source: EU KLEMS Release 2019, own results.
Focusing on the pre- and post-crisis period, one can find a slowdown of value added in all countries, although it is less pronounced in Japan, which has, however, experienced slower growth rates over the whole period considered. Comparing the EU15 member states and the EU-CEE countries, one finds similar dynamic patterns, but growth rates are much higher (between one to two percentage points) in the EU-CEE countries. In particular, this pattern remained intact after the global financial and economic crisis.
2 Country aggregates are calculated using Törnqvist aggregates based on nominal GDP at current exchange rates.

ICT CAPITAL FORMATION AND GROWTH 15 Research Report 456
However, the focus of this section is on the growth components. The broad picture suggests that growth before the crisis in the EU15, the EU-CEE countries and the US was largely driven by total factor productivity (TFP) growth. Hours worked and labour composition contributed relatively more in the EU countries than in the US. Further, investment in tangible assets (in particularly Non-ICT capital) played a significant role, especially in the EU-CEE economies. Non-ICT capital also contributed more to growth in the US compared with the EU15 member states. Growth of intangible assets played only a minor role, albeit showing positive contributions in all country groups. On the other hand, growth in Japan before the crisis was mostly driven by labour composition changes, ICT capital and intangible assets (particularly software and databases). As a percentage of GDP, the contributions of ICT assets to growth have been below 4% of total GDP growth in Europa, much higher in Japan (28%) and also higher in the US with about 8%.
The growth performance after the crisis shows a significant decline in the contribution of total factor productivity in the EU15, the EU-CEE and the US, whereas TFP growth picked up in Japan. The contributions of changes in the composition of labour remained relatively stable (with the exception of Japan). Growth of Non-ICT capital still played an important role in the EU-CEE countries and the US, but less so in the other two groups. Interestingly, the contributions of ICT asset growth to overall GDP growth recorded a slight decline for the EU countries after the crisis (about 2%); however, the contributions declined significantly for Japan (to 3%) and halved for the US (to about 4%). Table 2 presents the results for the individual EU member states (plus Norway) for which data are available.
Table 2 / Growth contributions of tangible and intangible ICT assets
2000-2007 2008-2009 2010-2016
Value
added Tangible
ICT Intangible
ICT Value
added Tangible
ICT Intangible
ICT Value
added Tangible
ICT Intangible
ICT AT 2.65 0.03 0.06 -1.30 0.00 0.03 1.34 0.02 0.05 BE 2.36 0.03 0.02 -0.63 0.01 0.02 1.42 0.01 0.01 BG 5.71 2.31 -0.12 0.03 1.38 -0.05 0.02 CZ 4.57 0.07 0.04 -0.95 0.05 0.05 1.84 0.03 0.03 DE 1.84 -0.02 0.03 -2.71 -0.07 0.03 2.12 0.01 0.02 DK 1.89 0.08 0.06 -2.29 -0.01 0.04 1.51 0.06 0.03 EE 7.49 -9.99 0.02 0.04 3.48 0.07 0.03 EL 3.77 -1.87 0.07 0.00 -3.83 -0.05 -0.02 ES 3.74 0.20 0.06 -1.17 0.16 0.04 0.32 0.09 0.04 FI 3.45 0.04 0.05 -4.20 0.06 0.01 0.65 0.03 0.01 FR 2.19 0.02 0.06 -1.09 0.01 0.06 1.30 0.02 0.04 IE 5.16 -3.88 0.02 0.01 6.27 0.06 0.04 IT 1.49 0.03 0.02 -3.31 0.00 0.00 0.02 0.00 0.01 LT 7.35 -6.90 0.01 0.13 3.23 0.05 0.06 LU 4.44 -2.78 0.18 0.01 3.08 0.27 0.06 LV 8.05 -7.59 -0.04 -0.01 1.61 -0.03 0.02 NL 2.27 0.10 0.08 -0.32 0.06 0.05 1.23 0.03 0.07 NO 2.25 0.12 0.03 -0.48 0.09 0.07 1.37 0.01 0.03 RO 5.77 1.57 0.18 -0.02 2.55 -0.02 0.02 SE 3.27 0.11 0.07 -3.14 0.13 0.08 3.29 0.03 0.19 SI 4.44 -2.34 -0.06 0.01 1.04 -0.03 0.00 SK 5.33 0.09 0.01 0.24 0.18 -0.01 2.77 0.02 0.03 UK 2.82 0.10 0.04 -2.38 0.03 0.01 2.00 0.01 0.00
Sources: EU KLEMS Release 2019; own results.

16 ICT CAPITAL FORMATION AND GROWTH Research Report 456
2.3. ECONOMETRIC ANALYSIS
Based on these data, we perform an econometric analysis based on the EU KLEMS sample of countries, which, after dropping outliers Cyprus, Luxembourg and Malta, amounts to 23 countries over the period 2000-2017.3 The specification is based on the log-differenced version of the Cobb-Douglas production function, which explains real value-added growth ∆ ln Ycjt as a function of the growth of real capital inputs (ΔlnKcjt), the growth of labour inputs (ΔlnLcjt) and the TFP growth term (Δln Acjt), calculated as a residual.
∆ ln Ycjt = α ΔlnLcjt + βΔlnKcjt + Δln Acjt
For the purposes of the analysis the capital input variable is split into components, so that the set Q = {ICT; SoftDB; NonICT; RD; OInnProp; EconComp} comprises the main capital asset groups (in terms of capitals services growth):
∆ ln Ycjt = αΔlnLcjt + �β𝑞𝑞q∈Q
ΔlnKqcjt + Δln Acjt
Alternative specifications also include hours worked and labour composition instead of labour services (as discussed above, the labour composition variable in the baseline specification is decomposed as ∆ ln Lcjt = ∆ ln LCcjt + ∆ ln Hcjt). In order to control for unobserved heterogeneity at the country and sector levels and alleviate potential omitted variable issues, we also include fixed effects (country, sector, year fixed effects or their interaction, depending on the specification). The model is first estimated using country-level aggregates via fixed effects (‘FE’) as the baseline estimator (controlling for country fixed effects), and the pooled OLS (‘POLS’) and Arellano-Bover/ Blundell-Bond system GMM (‘System GMM’) are also reported as alternatives for comparison. The estimation results are reported in Table 3.
As expected, the growth of labour services, particularly its hours worked component, contributes positively to real value-added growth with high statistical significance and the marginal impact of about 0.6, implying that a 1 percentage point (pp) change in the growth of labour services is associated with a 0.6 pp change in value-added growth. Notably, among the different capital asset groups, only ICT and EconComp enter positively and are statistically significant. A 1 pp increase in the growth of the economic competencies assets translates into about 0.1 pp growth of value added. The marginal contribution of tangible ICT capital is 0.04 for the baseline specification, which implies that a 1 pp increase in the growth of tangible ICT capital leads to the growth of real value added of about 0.04 pp. Additional estimations with detailed asset types reported in Table 4 suggest that these results are largely attributed to CT and AdvMRes capital. Estimations at the sectoral level do not yield statistically significant results pertaining to the impact of ICT capital on real value-added growth.
3 The sample includes the following countries: AT, BE, CZ, DE, DK, EE, EL, ES, FI, FR, IE, IT, JP, LT, LV, NL, NO, PT, SE, SI, SK, UK, US.

ICT CAPITAL FORMATION AND GROWTH 17 Research Report 456
Table 3 / Estimation results for value-added growth FE FE POLS System GMM
1 2 3 4
Labour services 0.573*** 0.485*** 0.609***
(0.087) (0.079) (0.104) Hours worked 0.623*** (0.092) Labour composition -0.049 (0.176) ICT 0.042*** 0.036*** 0.037** 0.058***
(0.012) (0.010) (0.014) (0.013) NonICT -0.152 -0.246 0.209 -0.264
(0.212) (0.205) (0.205) (0.238) SoftDB 0.003 0.003 0.005 0.004
(0.004) (0.004) (0.005) (0.004) RD -0.010 -0.003 -0.044 -0.016
(0.040) (0.038) (0.043) (0.038) OInnProp 0.016 -0.003 0.051 -0.020
(0.044) (0.041) (0.045) (0.039) EconComp 0.123*** 0.102*** 0.093** 0.149***
(0.043) (0.035) (0.044) (0.050) Value added, lag 0.121*
(0.072) Constant 0.022*** 0.032*** 0.017*** -0.006
(0.004) (0.004) (0.004) (0.004)
Observations 335 335 335 320 R-squared 0.764 0.784 0.718
Note: Country, industry and year fixed effects are included in the FE models. All variables are included in log-differences. Standard errors clustered by country are included in parentheses. *, **, *** indicate statistical significance at the 10%, 5% and 1% levels respectively. Sources: EU KLEMS Release 2019; own results.

18 ICT CAPITAL FORMATION AND GROWTH Research Report 456
Table 4 / Estimation results for value-added growth with detailed capital asset types FE FE POLS POLS System GMM System GMM
1 2 3 4 5 6
Labour services 0.521*** 0.434*** 0.559*** (0.077) (0.082) (0.085)
Hours worked 0.581*** 0.497*** 0.607*** (0.078) (0.103) (0.086)
Labour composition -0.080 0.001 -0.226 (0.177) (0.164) (0.269)
RStruc -0.104 -0.151 -0.107 -0.163 -0.258* -0.272* (0.118) (0.113) (0.130) (0.140) (0.154) (0.139)
OCon -0.125 -0.143 -0.005 0.007 -0.074 -0.091 (0.149) (0.143) (0.158) (0.159) (0.138) (0.139)
OMach -0.020 -0.051 0.178** 0.157** -0.058 -0.076* (0.050) (0.048) (0.077) (0.074) (0.053) (0.046)
TraEq 0.016 0.005 0.029 0.026 0.010 0.006 (0.039) (0.036) (0.041) (0.044) (0.059) (0.053)
IT 0.020 0.012 0.014 0.014 0.038** 0.022 (0.015) (0.013) (0.016) (0.015) (0.017) (0.015)
CT 0.034*** 0.034*** 0.036*** 0.033*** 0.034*** 0.032*** (0.006) (0.007) (0.007) (0.007) (0.007) (0.007)
Cult 0.005 0.008 0.001 -0.000 -0.005 0.001 (0.007) (0.006) (0.009) (0.009) (0.009) (0.008)
RD -0.006 -0.005 -0.031 -0.023 -0.012 -0.002 (0.038) (0.036) (0.037) (0.035) (0.032) (0.031)
Soft_DB 0.004 0.003 0.008 0.009 0.004 0.004 (0.005) (0.005) (0.007) (0.007) (0.005) (0.005)
OIPP 0.009 0.007 0.027** 0.023** 0.008 0.005 (0.012) (0.010) (0.011) (0.011) (0.008) (0.008)
AdvMRes 0.121*** 0.098*** 0.073** 0.057* 0.146*** 0.122*** (0.029) (0.029) (0.030) (0.032) (0.042) (0.038)
Design -0.017 0.008 0.015 0.004 -0.053 -0.025 (0.076) (0.077) (0.064) (0.061) (0.095) (0.087)
POCap 0.006 -0.009 0.028 0.033 0.009 0.004 (0.045) (0.048) (0.031) (0.035) (0.054) (0.056)
VT 0.036* 0.025 0.029* 0.024 0.040*** 0.032** (0.017) (0.015) (0.014) (0.015) (0.015) (0.013)
Value added, lag 0.085 0.044 (0.085) (0.087)
Constant 0.021*** 0.032*** 0.015*** 0.021*** -0.004 0.002 (0.004) (0.005) (0.004) (0.004) (0.006) (0.006)
Observations 335 335 335 335 320 320 R-squared 0.779 0.797 0.746 0.759
Note: Country, industry and year fixed effects are included in the FE models. All variables are included in log-differences. Standard errors clustered by country are included in parentheses. *, **, *** indicate statistical significance at the 10%, 5% and 1% levels respectively. Sources: EU KLEMS Release 2019; own results.

THE PRODUCTION SIDE OF ICT TECHNOLOGY AT AGGREGATE LEVEL 19 Research Report 456
3. The production side of ICT technology at aggregate level
3.1. INTRODUCTION
This chapter provides an overview of the ICT sector from the production side, globally and in leading countries, with a special emphasis on the situation in European countries. The focus is on the cross-country performances of ICT industries and their changes over time. For this we employ the definition of the OECD (2007), which demarcates the ICT sector with a view to measuring the supply side of this increasingly important segment of the economy. It is essential to emphasise this, because large parts of the literature that address the economic impacts of ICT technologies and the phenomenon of digitalisation (explicitly or implicitly) deal with the use of such technologies, that is, the demand side. The mushrooming literature on the effects of the installation of industrial robots on employment (Acemoglu and Restreop, 2017; 2018; Autor and Salomons, 2018; Chiacchio et al., 2018; Dauth et al. (2017); Firgo et al., 2018; Ghodsi et al., 2020) is a case in point. Industrial robots, for example, are most intensively used in the automotive industry. This may have productivity-enhancing effects as well as employment effects in both the industry and in the upstream and downstream industries. But at the same time it is also clear that although car makers are intensive users, they are typically not the producers of industrial robots or ICT technologies more generally. Another good example is the banking industry, a frontrunner in the application of electronic communication (e.g. e-payment systems) and another heavy user of ICT, but for the most part it is not the creator of these technologies or the underlying innovations and R&D efforts.
While the interest in the demand side of ICT stems from the numerous implications for productivity, employment and other macroeconomic indicators, the supply side is essential for at least two reasons. First, as the economy undergoes a digital transformation in which firms increasingly switch to ICT-driven production processes, the industries which produce the necessary ICT infrastructures and provide the relevant ICT services should flourish. In other words, the ICT-producing sector can be expected to comprise the lead industries of the ‘digital revolution’. Hence, the ICT-producing industries are presumably as important for the overall economic development as was the textile industry in the eighteenth century, iron and steel in the late nineteenth century or the semi-conductor industry in the 1970s and 1980s (microcomputer revolution).4 The reason why (at least in a structuralist perspective) having strong domestic lead industries spurs economic growth is that these industries create a virtuous circle between the necessary skills and the goods that are in high demand. Therefore countries which hold comparative advantages in ICT industries are likely to benefit from the (expected) expansion of these industries – directly and via demand spillovers to the rest of the economy (see Reinert, 2007 for a historical perspective on lead sectors such as shipbuilding; see Rennstich, 2008 for a discussion in the context of the digital transformation). Second, lead sectors are typically R&D-intensive and innovative
4 The importance of semiconductors and microprocessors during the automation revolution illustrates the close connection between the latter and the digital revolution, which is typically associated with the growing introduction of cyber-physical systems that connect the physical and digital world of production.

20 THE PRODUCTION SIDE OF ICT TECHNOLOGY AT AGGREGATE LEVEL Research Report 456
industries characterised by an oligopolistic market structure. Therefore, lead sectors are also ‘strategic sectors’ with a high potential for economic rents (see e.g. Brander and Spencer, 1985; Krugman, 1986).
Against this background this paper draws on the 2019 version of the PREDICT dataset, described further in the next section (see also JRC, 2017), to analyse the EU’s positions in the production of ICT goods and services with regard to production, value added, employment, R&D and productivity relative to its main competitor countries, including the US, Japan, China and Korea.
3.2. DEFINITION OF THE ICT SECTOR AND THE PREDICT DATASET
The analysis of the ICT sector in this section is entirely based on the PREDICT dataset,5 which was explicitly developed for the purpose of investigating various aspects of this increasingly important part of the economy. More precisely, we make specific use of the 2019 version of the dataset, which covers the period 1995-2018 and comprises 41 countries, including all EU member states,6 although not all indicators for all the countries are available over the entire sample period. However, the entries for the years 2017 and 2018 are nowcasts estimated by the JRC (2018) and are only available for the aggregates of the ICT sector and for a limited number of indicators. Therefore large parts of the analysis have to be limited to the time span until 2016.
The dataset covers a wide array of indicators, out of which we use gross output, value added, employment (measured in persons), labour productivity and business expenditure on R&D (BERD). The PREDICT dataset offers two definitions of the ICT sector, which both follow the OECD definition of the sector (OECD, 2007). These are the comprehensive definition and the operational definition (JRC, 2017). The former employs a more detailed industry decomposition, which allows circumventing the ICT sector in full alignment with the OECD definition. The operational definition relies on a cruder industry structure, which has the advantage that the required data are available for a larger set of countries. This is why this paper makes use of the operational definition, although it also shows that the differences between the two definitions are rather small (Table 5).
5 The database is available at: https://data.jrc.ec.europa.eu/dataset/6c6f7ce7-893b-48e9-b074-2baaa4b6c7d8/resource/4625572c-eb0e-409d-aa60-33e0243e52e9
6 The United Kingdom is still considered to be an EU member state in this section, which was true over the sample period.

THE PRODUCTION SIDE OF ICT TECHNOLOGY AT AGGREGATE LEVEL 21 Research Report 456
Table 5 / Definition of the ICT sector in the PREDICT dataset
(a) Comprehensive definition
NACE Rev.2 code ICT sector code Industry description B ICT manufacturing industries
261 BA Manufacture of electronic components and boards 262 BB Manufacture of computers and peripheral eq. 263 BC Manufacture of communication eq. 264 BD Manufacture of consumer electronics 268 BE Manufacture of magnetic and optical media 465 TW ICT trade industries
C ICT services industries 610 CA Telecommunications 611 CA1 Wired telecommunications activities 612 CA2 Wireless telecommunications activities 613 CA3 Satellite telecommunications activities 619 CA4 Other telecommunications activities
CB Computer and related activities 582 CB1 Software publishing 620 CB2 Computer programming, consultancy, related act. 631 CB3 Data processing, hosting and related act; web portals 951 CB4 Repair of computers & communication eq.
A=B+TW+C ICT Total
(b) Operational definition
NACE Rev.2 code ICT sector code Industry description B' B'. ICT manufacturing industries
261 BA Manufacture of electronic components and boards 262 BB Manufacture of computers and peripheral eq. 263 BC Manufacture of communication eq. 264 BD Manufacture of consumer electronics
C C. ICT services industries 61 CA Telecommunications
582, 62, 631, 951 CB Computer and related activities A'=B'+C A'. ICT Total (operational)
Note: Industries according to NACE Rev. 2 classification. Source: JRC, 2017, Tables 1 & 2.
The main difference between the two definitions in terms of scope is that the operational definition does not include the magnetic and optical media industry (NACE 268) and the ICT trade industries (NACE 465). Hence, according to the operational definition, the ICT sector comprises large parts of the electronics industry, telecommunications services and computer services, including related services.7
For the EU, Norway and Japan systematic data on both the comprehensive and the operational definition are available, which allows for a quantitative comparison of the size of the ICT sector according to the two definitions. These comparisons are shown for value added, gross output and employment, to the extent that such data are available (Table 6).
7 For a detailed discussion of the different possibilities to delineate the digital economy, see IMF (2018).

22 THE PRODUCTION SIDE OF ICT TECHNOLOGY AT AGGREGATE LEVEL Research Report 456
Table 6 / Comparison of the comprehensive and the operational definition of the ICT sector
European Union (EU) value added gross output employment
year compr. oper'l diff compr. oper'l diff compr. oper'l diff 2000 428 387 9.6% 898 828 7.9% 5.57 4.97 10.6% 2005 506 464 8.3% 1,076 997 7.4% 5.68 5.09 10.4% 2010 540 494 8.5% 1,151 1,059 8.0% 5.89 5.33 9.6% 2015 629 578 8.0% 1,315 1,225 6.9% 6.47 5.90 8.8% 2016 642 591 7.9% 1,318 1,230 6.7% 6.59 6.01 8.8%
Norway value added gross output employment
year compr. oper'l diff compr. oper'l diff compr. oper'l diff 2000 5.6 5.1 9.1% 14 13 6.8% 0.07 0.06 15.3% 2005 7.6 7.0 8.1% 15 14 5.7% 0.07 0.06 12.1% 2010 10.7 9.7 9.9% 21 20 6.2% 0.08 0.07 13.4% 2015 11.4 10.7 6.2% 22 21 4.5% 0.08 0.07 9.7% 2016 11.4 10.7 6.1% 22 21 4.3% 0.08 0.07 8.8%
Japan value added gross output employment
year compr. oper'l diff compr. oper'l diff compr. oper'l diff 2000 369 322 12.7% 732 663 9.5% 2.51 2.12 15.7% 2005 261 229 12.3% 505 455 9.9% 2.46 2.10 14.6% 2010 299 272 8.8% 591 549 7.2% 2.55 2.25 11.9% 2015 260 235 9.6% 504 466 7.5% 2.42 2.12 12.5% 2016 289 262 9.6% 564 522 7.5% 2.40 2.10 12.5%
Note: compr. = comprehensive definition; oper’l = operational definition; diff = difference expressed in per cent of the comprehensive definition. Value added and gross output are nominal values in EUR billion. Employment in millions. Sources: PREDICT dataset; authors’ elaboration.
The differences between the two definitions are not negligible and are in the magnitude of around 10% for (nominal) value added and somewhat lower in the case of gross output. The differences are slightly larger for Japan but show the same declining trend over time.
These differences are mainly explained by the ICT trade industries that are excluded from the operational definition. Apart from the greater data availability, the operational definition of the ICT sector is also preferable if one is interested in the production side of ICT, to which the ICT trade industries do not really contribute (since they serve a distributional function).
The differences are again larger in terms of employment, indicating that the ICT trade services industries are characterised by lower labour productivity compared with the rest of the ICT sector.
While Table 6 shows nominal values for gross output and value added, much of the subsequent analysis is based on real values. This implies that the price deflators provided in the PREDICT dataset will be exploited as well. Unfortunately, deflators are not provided for all sectors, such as the ICT services sector, for example. The missing deflators are calculated using the value added weighted deflators of the industries included in the sector. Moreover, no deflators are provided for the nowcast estimates.

THE PRODUCTION SIDE OF ICT TECHNOLOGY AT AGGREGATE LEVEL 23 Research Report 456
Hence, the averages of the industry- and sector-specific yearly changes in the deflator over the period 2010-2016 are imputed as deflators for the years 2017 and 2018.
A useful feature of the PREDICT dataset is that, while focused on the ICT sector, it also includes the same information for sector aggregates such as the manufacturing sector or the services sector and the total economy. This allows, inter alia, calculating the relative importance of the ICT sector in the EU economy as well as in other countries.
3.3. THE ROLE OF THE ICT SECTOR AT THE GLOBAL LEVEL
Digital technologies are crucial to most capital goods, industrial products and everyday life. The ICT industries are key enablers of both production and the knowledge systems, and EU policies have therefore attributed a strategic role to digital technologies in the promotion of growth, innovation and competitiveness. As a result, the dynamics of the ICT sector and its relative size are key indicators for the economy. This applies to individual countries and regions as well as to the world as a whole because of its impact on the technological frontier and productivity growth. For this purpose, the world is composed of the EU, Australia, Brazil, Canada, Switzerland, China, India, Japan, Korea, Norway, Russia, Taiwan and the US.
Before examining the size of the ICT sector, we provide a short overview of the composition of the ICT sector (Table 7). According to the (operational) OECD definition, the ICT sector employed some 40 million people worldwide in 2016, who produced value added worth EUR 2.7 trillion, more than three times the amount recorded for 1995. Characteristic for a ‘lead sector’, both value added and employment expanded in the ICT sector. Importantly, this holds true for the ICT sector as a whole as well as for each individual ICT industry.
Another striking feature that emerges from this sectoral decomposition is that the ICT sector is dominated by the services industries – telecommunications and computer (plus related) services – which account for between two thirds and three quarters of its value added and employment. The various electronics industries, i.e. the ICT manufacturing industries, contribute only about one quarter to one third of the ICT sector’s total value added and employment.8 Among the ICT manufacturing industries, electronic components and telecommunications equipment are the largest sectors. In the ICT services sector, the relative importance of telecommunications services and computer services varies over time. In terms of value added, the share of computer services increased substantially from 26% in 1995 to 43% in 2016. The corresponding employment share also rose, albeit more moderately, from 39% in 1995 to 43% in 2016.
8 The corresponding shares of the ICT manufacturing industries of the ICT sector’s total gross output are slightly higher, given the bigger role of inter-industry transactions (both domestically and internationally) and hence of material inputs in this part of the economy.

24 THE PRODUCTION SIDE OF ICT TECHNOLOGY AT AGGREGATE LEVEL Research Report 456
Table 7 / Comparison of the comprehensive and the operational definition of the ICT sector
(a) Nominal value added
nominal value added EUR billion in % of ICT Total 1995 2000 2016 1995 2000 2016 B'. ICT manufacturing industries 263 495 655 31.1% 30.8% 23.9%
Electronic components and boards 123 240 369 14.6% 14.9% 13.5% Computers and peripheral eq. 51 87 86 6.1% 5.4% 3.1% Communication eq. 64 136 144 7.5% 8.4% 5.3% Consumer electronics 22 29 52 2.6% 1.8% 1.9%
C. ICT services industries 581 1,113 2,087 68.9% 69.2% 76.1% Telecommunications 360 601 893 42.6% 37.4% 32.6% Computer and related activities 222 512 1,193 26.2% 31.9% 43.5%
A'. ICT Total 844 1,608 2,741 100.0% 100.0% 100.0%
(b) Employment
employment persons million in % of ICT Total 1995 2000 2016 1995 2000 2016 B'. ICT manufacturing industries 4.90 9.09 14.05 34.2% 37.5% 35.5%
Electronic components and boards 2.00 4.46 7.54 14.0% 18.4% 19.0% Computers and peripheral eq. 0.72 1.64 2.71 5.0% 6.8% 6.9% Communication eq. 0.99 1.58 2.26 6.9% 6.5% 5.7% Consumer electronics 0.47 1.14 1.53 3.3% 4.7% 3.9%
C. ICT services industries 11.17 15.14 25.56 77.9% 62.5% 64.5% Telecommunications 5.56 6.77 8.72 38.8% 27.9% 22.0% Computer and related activities 5.61 8.37 16.83 39.2% 34.5% 42.5%
A'. ICT Total (operational) 14.34 24.23 39.61 100.0% 100.0% 100.0%
Note: Global economy comprises the following economies: EU, Australia, Brazil, Canada, Switzerland, China, India, Japan, Korea, Norway, Russia, Taiwan and the US. Employment data for China is missing for 1995. Sources: PREDICT dataset; authors’ elaboration.
One important aspect when analysing the ICT sector are price developments. Price developments matter because the global prices of many ICT goods and services decline over time (Figure 2). The decline in the (value added-based) price of outputs produced by the ICT sector was particularly pronounced between 2000 and 2010.9 Thereafter the price deflator more or less stagnated. This price development means that before the base year, which is 2010, value added in real terms is significantly lower than the corresponding nominal values.10 For example, in the year 2000 the real value added of the global ICT sector amounted to EUR 1.111 billion, compared with EUR 1.608 billion in nominal terms. Hence, the distinction between real and nominal values is important, especially for the analysis of the dynamics over time.
9 The analysis in real terms is limited to the period starting 2000 and above, as the price deflators of some countries for the years 1995 to 1999 appear to be unrealistically high or low. This includes the transition economies, for which the PREDICT dataset reports implausibly low price deflators, as well as the US, which features extremely high price deflators for the period 1995-1999.
10 The same applies to gross output.

THE PRODUCTION SIDE OF ICT TECHNOLOGY AT AGGREGATE LEVEL 25 Research Report 456
Figure 2 / Nominal and real value added and price deflators for the ICT sector
Note: Global economy comprises the following economies: EU, Australia, Brazil, Canada, Switzerland, China, India, Japan, Korea, Norway, Russia, Taiwan and the US. Real value added at the world level is calculated as the value added weighted average of the national (industry-level) price deflators. Sources: PREDICT dataset; authors’ elaboration.
Figure 3 / Price deflators in the ICT sector and the overall economy
Note: Global economy comprises the following economies: EU, Australia, Brazil, Canada, Switzerland, China, India, Japan, Korea, Norway, Russia, Taiwan and the US. Real value added at the world level is calculated as the value added weighted average of the national (industry-level) price deflators. Services sector excludes trade services industries. Sources: PREDICT dataset; authors’ elaboration.
100
110
120
130
140
150
pric
e de
flato
r
1000
1500
2000
2500
3000
valu
e ad
ded
2000 2005 2010 2015Year
nominal real
price deflator (2010=100)
50
100
150
200
250
pric
e de
flato
r (20
10=1
00)
2000 2005 2010 2015Year
ICT sector ICT manufacturing industries
ICT services industries total economy
manufacturing sector services sector

26 THE PRODUCTION SIDE OF ICT TECHNOLOGY AT AGGREGATE LEVEL Research Report 456
The declining price level in the ICT sector is also important, because it is in contrast with the overall price development of the global economy. While inflation was generally subdued over the past two decades, especially in developed countries, the overall price deflator shows a mild positive trend (Figure 3). The opposing price trends are observable in the total ICT sector in comparison with the total economy as well as in the main sub-sectors, the ICT manufacturing sector and the ICT services sector, although the decline in prices was much more pronounced in the ICT manufacturing sector. This pattern is typically explained by the fact that manufacturing goods are highly tradable goods, which implies tougher competition on the one hand and higher productivity growth on the other hand. Whether this explanation is also applicable to the ICT services sector would be an interesting subject for further research, because many ICT services are also tradable or provided by globally operating MNEs via foreign subsidiaries. Therefore, the differences in the price development between the global ICT manufacturing sector and the ICT services sector may be explained by higher productivity growth in the manufacturing industry.
Before taking a closer look at productivity trends, it is interesting to consider the ICT sector’s growth performance, again benchmarking it against the total economy (Table 8). Such a comparison is insightful in many respects. First of all, it confirms the characterisation of the ICT sector as a lead sector, because growth was much higher there than in the economy as a whole, irrespective of whether one looks at employment, real value added or real output. For example, real valued added grew by 5.8% annually in the ICT sector, compared with 1.7%11 in the overall economy (i.e. global GDP).
Table 8 also illustrates the importance of price developments. Both the nominal value added and the nominal gross output developments would suggest that the total economy grew faster than the ICT sector, which is, however, entirely due to the diverging price trends. The employment figures show clearly that the ICT sector developed more dynamically, adding 3% more jobs each year, compared with 0.7% employment growth annually for the total economy. The distinction between ICT manufacturing industries and the ICT services industries shows that real value-added (and gross output) growth was stronger in the former, while employment growth was higher in the latter. This pattern points to the higher capital intensity of the ICT manufacturing sector compared with the services part of the ICT sector, and to stronger labour productivity growth.
11 At 1.7% annually, the global growth rate for the period 2000-2016 found in the PREDICT dataset is considerably lower than the 2.8% average found in the World Bank’s Word Development Indicators for real GDP growth. While it is not entirely clear where the difference comes from, it does not alter the results with regard to the substantial growth differential between the ICT sector and total GDP.

THE PRODUCTION SIDE OF ICT TECHNOLOGY AT AGGREGATE LEVEL 27 Research Report 456
Table 8 / Compound annual growth rates of the ICT sector and the total economy, 2000-2016
Employment
value added gross output nominal real nominal real ICT sector 3.12% 3.39% 5.79% 3.02% 5.48%
ICT manufacturing 2.76% 1.76% 7.47% 2.28% 7.77% ICT services 3.33% 4.01% 4.55% 3.48% 4.17%
Total Economy 0.67% 3.69% 1.69% 4.03% 1.97%
Manufacturing 0.95% 3.10% 2.31% 4.12% 3.17% Services (except trade) 2.21% 3.69% 1.44% 3.62% 1.33%
Note: Growth rates are compound annual growth rates. Global economy comprises the following economies: EU, Australia, Brazil, Canada, Switzerland, China, India, Japan, Korea, Norway, Russia, Taiwan and the US. Real value added at the world level is calculated as the value added weighted average of the national (industry-level) price deflators. Services sector excludes trade services industries. Sources: PREDICT dataset; authors’ elaboration.
Given the evidence so far that the ICT sector is something of a lead sector, it is also interesting to investigate its importance in the overall economy (Figure 4). At the global level, it accounted for about 5.5% of real GDP (value added), 5.8% of gross output and 5.5% and 3.3% of employment in 2016. Interestingly, the shares for the ICT manufacturing industries in the total manufacturing sector and the ICT services industries in the total services sector, excluding trade services, is higher than for the total ICT sector. This can be explained by the fact that in these calculations the services sector excludes trade services, because the ICT trade services are not part of the ICT sector (operation definition) either (see section 3.2).
Reflecting the growth dynamics described above, the share of the ICT sector in the overall economy increased over time in real terms (value added and output) and in terms of output, but not in nominal terms. It also seems that the growing importance of the ICT sector in the global economy has been a continuous process that was only marginally (if at all) affected by the global financial crisis of 2008-2009.
At this stage it is useful to point out that all the developments at the global level are potentially also influenced by the changing relative importance of countries in the worldwide ICT sector.

28 THE PRODUCTION SIDE OF ICT TECHNOLOGY AT AGGREGATE LEVEL Research Report 456
Figure 4 / The role of the global ICT sector in the global economy
(a) value added: nominal real
(b) gross output: nominal real
(c) employment:
Note: Global economy comprises the following economies: EU, Australia, Brazil, Canada, Switzerland, China, India, Japan, Korea, Norway, Russia, Taiwan and the US. Real value added at the world level is calculated as the value added-weighted average of the national (industry-level) price deflators. Services sector excludes trade services industries. Sources: PREDICT dataset; authors’ elaboration.
0.0%
2.0%
4.0%
6.0%
8.0%
10.0%
2000 2005 2010 2016
ICT sector share in % of total economyICT manufacturing share in % of manufacturingICT services share in % of services
0.0%
2.0%
4.0%
6.0%
8.0%
10.0%
2000 2005 2010 2016
ICT sector share in % of total economyICT manufacturing share in % of manufacturingICT services share in % of services
0.0%
2.0%
4.0%
6.0%
8.0%
10.0%
2000 2005 2010 2016
ICT sector share in % of total economyICT manufacturing share in % of manufacturingICT services share in % of services
0.0%
2.0%
4.0%
6.0%
8.0%
10.0%
2000 2005 2010 2016
ICT sector share in % of total economyICT manufacturing share in % of manufacturingICT services share in % of services
0.0%
2.0%
4.0%
6.0%
2000 2005 2010 2016
ICT sector share in % of total economyICT manufacturing share in % of manufacturingICT services share in % of services

THE PRODUCTION SIDE OF ICT TECHNOLOGY AT AGGREGATE LEVEL 29 Research Report 456
The fundamental reasons for the superior growth performance of the ICT sector (and its sub-sectors) compared with the overall economy are its higher labour productivity, higher labour productivity growth (Figure 5) and higher R&D intensity (Figure 6), that is, business expenditure on R&D (BERD) as a share of GDP.
Not only is labour productivity in the ICT sector considerably higher than in the overall economy, its growth is also much stronger in real terms. The growth trajectory of labour productivity in the ICT sector and of total labour productivity seems to be synchronised but generally more dynamic in the former. This was true in particular in the most recent years, 2015 and 2016.
Figure 5 / Development of global labour productivity, ICT sector and overall economy, 2000-2016
Note: Global economy comprises the following economies: EU, Australia, Brazil, Canada, Switzerland, China, India, Japan, Korea, Norway, Russia, Taiwan and the US. Labour productivity at the global level is the weighted average over the constituting countries. Sources: PREDICT dataset; authors’ elaboration.
The same pattern can be observed in the development of global R&D intensities (Figure 6). As expected, the R&D intensity of the ICT sector is much higher than that of the overall economy, which is why it is generally considered to be a sector of strategic importance. Moreover, in real terms there is a clear upward trend in R&D intensity for the ICT sector – despite the already elevated level – whereas the economy as a whole is essentially characterised by a flat line.
20000
30000
40000
50000
60000
70000
labo
ur p
rodu
ctiv
ity
2000 2005 2010 2015Year
ICT sector - nominal ICT sector - realtotal economy - nominal total economy - real

30 THE PRODUCTION SIDE OF ICT TECHNOLOGY AT AGGREGATE LEVEL Research Report 456
Figure 6 / R&D intensity of the ICT sector and of the overall economy, 2000-2016
Note: Global economy comprises the following economies: EU, Australia, Brazil, Canada, Switzerland, China, India, Japan, Korea, Norway, Russia, Taiwan and the US. R&D intensity at the global level is the (BERD-based) weighted average over the constituting countries. Sources: PREDICT dataset; authors’ elaboration.
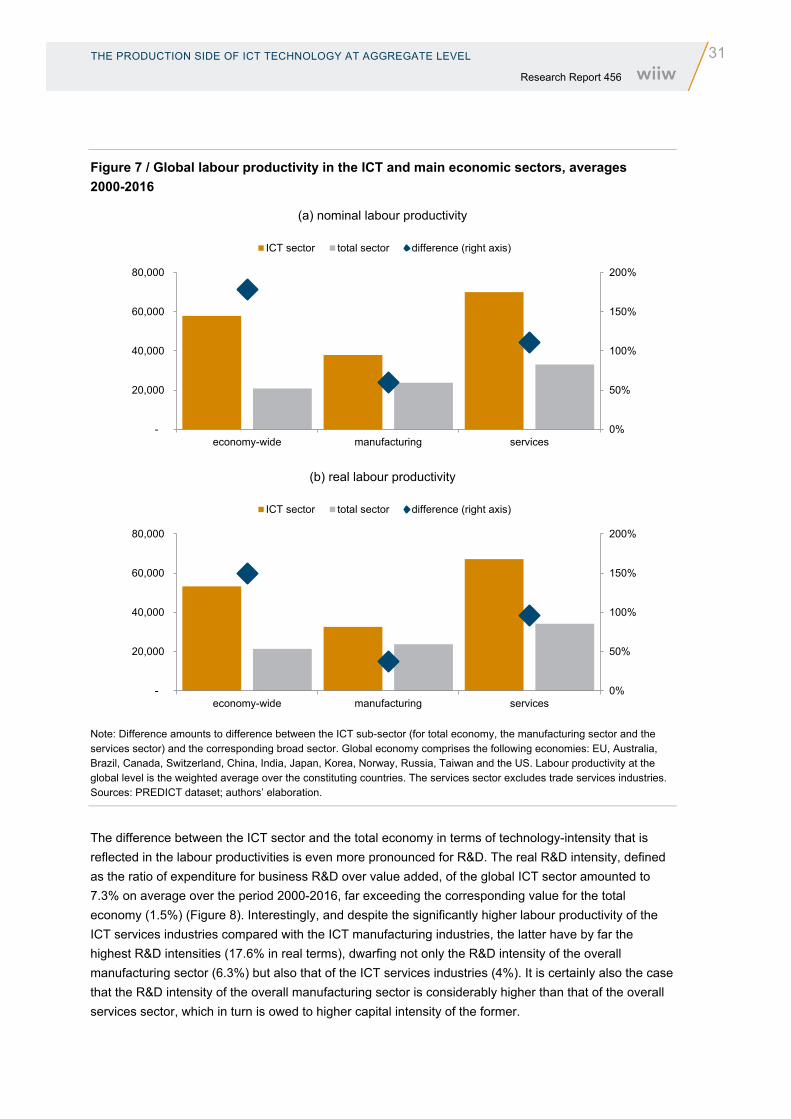
At least as telling as the development over time is the direct comparison between labour productivities across (sub)-sectors (Figure 7). Based on averages over the period 2000-2016, it turns out that labour productivity in the ICT sector in real terms,12 at EUR 53,280, is two-and-a-half times higher than the economy-wide labour productivity (EUR 21,391). Looking at the sub-sectors, it is also interesting to note that the ICT services sector, with EUR 67,142, enjoys higher real labour productivity than the ICT manufacturing sector (EUR 32,658). In both ICT sub-sectors real labour productivity is considerably higher than in the corresponding broad sectors of the economy. The productivity advantages of ICT sub-sectors amount to 37% for manufacturing and 96% for services. The labour productivity advantage of the ICT services sector vis-á-vis the ICT manufacturing industries is much more pronounced than in the comparison between the overall manufacturing sector and the overall services sector. In fact, the result that labour productivity in ICT services exceeds that of the services sector is partially because the services sector here excludes the trade services industries. Moreover, this productivity constellation for the global economy is not found in all countries, as will be discussed in the next section, although it holds for the ICT sub-sectors. This emphasises that especially the ICT services industries are very distinct from many other parts of the broader services sector.
12 The patterns are qualitatively the same for the nominal labour productivities, as can be seen in Figure 6 (a).
20000
30000
40000
50000
60000
70000la
bour
pro
duct
ivity
2000 2005 2010 2015Year
ICT sector - nominal ICT sector - realtotal economy - nominal total economy - real
THE PRODUCTION SIDE OF ICT TECHNOLOGY AT AGGREGATE LEVEL 31 Research Report 456
Figure 7 / Global labour productivity in the ICT and main economic sectors, averages 2000-2016
(a) nominal labour productivity
(b) real labour productivity
Note: Difference amounts to difference between the ICT sub-sector (for total economy, the manufacturing sector and the services sector) and the corresponding broad sector. Global economy comprises the following economies: EU, Australia, Brazil, Canada, Switzerland, China, India, Japan, Korea, Norway, Russia, Taiwan and the US. Labour productivity at the global level is the weighted average over the constituting countries. The services sector excludes trade services industries. Sources: PREDICT dataset; authors’ elaboration.
The difference between the ICT sector and the total economy in terms of technology-intensity that is reflected in the labour productivities is even more pronounced for R&D. The real R&D intensity, defined as the ratio of expenditure for business R&D over value added, of the global ICT sector amounted to 7.3% on average over the period 2000-2016, far exceeding the corresponding value for the total economy (1.5%) (Figure 8). Interestingly, and despite the significantly higher labour productivity of the ICT services industries compared with the ICT manufacturing industries, the latter have by far the highest R&D intensities (17.6% in real terms), dwarfing not only the R&D intensity of the overall manufacturing sector (6.3%) but also that of the ICT services industries (4%). It is certainly also the case that the R&D intensity of the overall manufacturing sector is considerably higher than that of the overall services sector, which in turn is owed to higher capital intensity of the former.
0%
50%
100%
150%
200%
-
20,000
40,000
60,000
80,000
economy-wide manufacturing services
ICT sector total sector difference (right axis)
0%
50%
100%
150%
200%
-
20,000
40,000
60,000
80,000
economy-wide manufacturing services
ICT sector total sector difference (right axis)

32 THE PRODUCTION SIDE OF ICT TECHNOLOGY AT AGGREGATE LEVEL Research Report 456
Figure 8 / Global R&D intensity in the ICT and main economic sectors, averages 2000-2016
(a) nominal R&D intensity
(b) real R&D intensity
Note: Global economy comprises the following economies: EU, Australia, Brazil, Canada, Switzerland, China, India, Japan, Korea, Norway, Russia, Taiwan and the US. R&D intensity at the global level is the (BERD-based) weighted average over the constituting countries. The services sector excludes trade services industries. Sources: PREDICT dataset; authors’ elaboration.
Notwithstanding the comparatively lower R&D intensity of the ICT services sector, it is also true that at more than 40% it accounts for a very large share of R&D undertaken in the services sector (Figure 9). Since the manufacturing sector is much more R&D-intensive than the services sector, the share of the ICT manufacturing sector is generally much lower, standing at about 20% in 2016. Overall, the ICT sector accounted for about one quarter of the overall business expenditure on R&D worldwide. For the purpose of comparison, the ICT sector’s value-added share is just above 5%, whereas its employment share is about 3.5% (see Figure 4 above). Hence, this extremely high R&D share underlines the importance of the ICT sector for technological developments and confirms once more its role as a high-tech lead sector.
0%
200%
400%
600%
0.0%
5.0%
10.0%
15.0%
20.0%
economy-wide manufacturing services
ICT sector total sector difference (right axis)
0%
200%
400%
600%
0.0%
5.0%
10.0%
15.0%
20.0%
economy-wide manufacturing services
ICT sector total sector difference (right axis)

THE PRODUCTION SIDE OF ICT TECHNOLOGY AT AGGREGATE LEVEL 33 Research Report 456
Figure 9 / R&D shares of the ICT (sub-) sectors in the economy, manufacturing and services
Note: Based on nominal business expenditure on R&D. Global economy comprises the following economies: EU, Australia, Brazil, Canada, Switzerland, China, India, Japan, Korea, Norway, Russia, Taiwan and the US. The services sector excludes trade services industries. Sources: PREDICT dataset; authors’ elaboration.
The combined analysis of global labour productivity and R&D intensity as two major indicators for the technology intensity of an industry or sector delivers an interesting result: the ICT services industries managed to achieve very high labour productivity despite limited R&D intensity, which is comparatively low. The explanation for this could be either a lack of competition (possibly due to the ‘winner takes all’ type of competition) and significant economic rents accruing to the ‘superstar firms’ of the ICT services sector, or to the differences in the composition of the workforce, i.e. a more highly skilled workforce in the ICT services sector. The most likely explanation is that it is the result of a combination of these two factors.
3.4. THE ICT SECTOR IN A CROSS-COUNTRY PERSPECTIVE
Having discussed the characteristics and the developments of the global ICT sector, this section takes a look at the ICT sectors of the main ICT-producing economies. These are the EU, the US, Japan and Korea, as well as China and India as two of the key emerging economies in the ICT industry. Taken together, these six economies account for about 90% (or more) of the global ICT sector in terms of value added, output and employment. As will be shown, the growth dynamics and relative importance of the ICT sectors in the main producer countries vary considerably and partly deviate from the global trend.
3.4.1. Importance and growth dynamics of the ICT sector
The global ICT sector has been portrayed as a lead sector because of its impressive growth dynamics in terms of both employment and real value added. In advanced economies, including the EU, the growth performance of the ICT sector is not particularly outstanding, however, at least not as far as employment generation is concerned. In the EU the average annual employment growth in the overall ICT sector in the period 2000-2016 amounted to a meagre 1.2% (Table 9). This is still considerably higher than employment growth in the total EU economy, but it is much lower than the world average in the ICT sector (3.1%). A
15%
20%
25%
30%
35%
40%
45%
2000 2005 2010 2015
ICT sector in % of total economy
ICT manufacturing sector in % of total manufacturing
ICT services sector in % of total services

34 THE PRODUCTION SIDE OF ICT TECHNOLOGY AT AGGREGATE LEVEL Research Report 456
similar situation prevailed in the US and Japan, where employment growth was actually negative. In Korea employment growth was somewhat more dynamic but still below the global growth rate.
The reason for the anaemic employment growth in the ICT sectors of advanced economies is found in the industry’s manufacturing segment. In the EU, the US and Japan employment growth was strongly negative – even more negative than in the overall manufacturing sector. Among the reasons were the high productivity of ICT manufacturing industries and the offshoring activities of MNEs. The flip side of these employment trends in advanced economies were high employment growth rates in emerging economies, above all in China and India. In these countries employment growth in the ICT sector exceeded 6% and 5%, respectively, in their manufacturing ICT industries.
Mirroring the global picture, the ICT sector is clearly expanding in terms of nominal13 and even more so in terms of real value added and also output. Given the EU’s concern about falling behind the US in key enabling technologies such as ICT, it is reassuring that the European ICT sector grew at par with that of the US in terms of real value added. A grain of salt is that the manufacturing part of the ICT sector was underperforming in comparison with the US. Interestingly, the real value added and output of the ICT services sector grew faster in the EU than in the US.
13 An exception here in Japan, where value added and output growth was slightly negative between 2000 and 2016.

THE PRODUCTION SIDE OF ICT TECHNOLOGY AT AGGREGATE LEVEL 35 Research Report 456
Table 9 / Compound annual growth rates of the ICT sector in main producer countries, 2000-2016
(a) Advanced economies
Employment value added gross output nominal real nominal real European Union ICT sector 1.19% 2.69% 5.01% 2.51% 4.82%
ICT manufacturing -3.53% -2.65% 1.40% -3.52% 0.50% ICT services 2.09% 3.58% 5.34% 4.10% 5.87%
Total Economy 0.48% 2.77% 1.36% 2.78% 1.37% Manufacturing -1.01% 1.84% 1.30% 1.97% 1.42% Services (except trade) 1.36% 3.17% 1.60% 3.33% 1.76%
United States ICT sector -0.56% 2.13% 4.99% 0.61% 3.43%
ICT manufacturing -4.13% -1.41% 4.75% -4.55% 1.42% ICT services 0.36% 3.19% 3.95% 2.15% 2.90%
Total Economy 0.48% 2.61% 0.66% 2.31% 0.36% Manufacturing -2.07% 0.99% -0.01% 0.76% -0.24% Services (except trade) 1.03% 3.08% 0.78% 2.96% 0.66%
Japan ICT sector -0.07% -1.29% 3.19% -1.48% 2.99%
ICT manufacturing -2.96% -3.29% 4.98% -3.59% 4.65% ICT services 1.85% -0.30% 1.17% 0.10% 1.57%
Total Economy 0.12% -1.04% -0.41% -0.88% -0.25% Manufacturing -1.17% -1.47% 0.14% -1.10% 0.52% Services (except trade) 1.11% -0.75% -0.37% -0.56% -0.17%
Korea ICT sector 2.31% 4.38% 7.03%
ICT manufacturing 1.45% 4.89% 8.46% ICT services 3.11% 3.52% 4.67%
Total Economy 1.35% 4.75% 2.54% 5.08% 2.87% Manufacturing 0.30% 4.94% 3.98% Services (except trade) 3.02% 5.22% 2.39%
(b) Emerging economies
Employment value added gross output nominal real nominal real China ICT sector 6.18% 15.59% 18.66% 16.07% 19.15%
ICT manufacturing 5.76% 14.10% 20.30% 15.62% 21.90% ICT services 6.89% 17.16% 15.49% 17.48% 15.81%
Total Economy 0.46% 13.60% 9.70% 14.24% 10.31% Manufacturing 2.06% 12.68% 10.71% 14.49% 12.48% Services (except trade) 3.32% 15.62% 10.03% 15.17% 9.60%
India ICT sector 6.15% 13.04% 12.54% 11.46% 10.97%
ICT manufacturing 5.63% 5.24% 5.51% 4.97% 5.24% ICT services 6.23% 13.91% 13.22% 12.93% 12.25%
Total Economy 1.05% 9.09% 3.41% 8.29% 2.65% Manufacturing 1.62% 7.99% 3.55% 7.13% 2.74% Services (except trade) 3.21% 10.16% 6.54% 10.07% 6.44%
Note: Growth rates are compound annual growth rates. Real value added is calculated using country-specific (industry-level) price deflators. Services sector excludes trade services industries. Sources: PREDICT dataset; authors’ elaboration.

36 THE PRODUCTION SIDE OF ICT TECHNOLOGY AT AGGREGATE LEVEL Research Report 456
Still, it is somewhat disturbing that a globally expanding sector such as the ICT sector is not capable of creating more employment throughout the EU (as well as other advanced economies). Much of the new jobs in ICT industries – both manufacturing and services – seem to appear in China and India, part of which is related to relocation of production activities of multinational firms in developing countries. Both countries also posted double-digit average annual growth rates of real value added and real output for the period 2000-2016. While these figures may be influenced by comparatively low base values (in 2000), it is still an impressive development in one of the most technology-intensive sectors. Comparing the growth rates of China and India, it is also interesting to see that China experienced higher growth in ICT manufacturing industries, whereas India recorded higher growth rates in its ICT services industries. This is in line with the notion of China being the ‘factory of the world’ and India being a more services-oriented economy, sometimes referred to as the ‘office of the world’. It should be noted, though, that China has clearly outgrown its role as a mere factory economy and developed considerable technological capabilities through both imitation and absorption of foreign technologies and its own substantial R&D efforts.
While the growth dynamics of the ICT sector are by and large comparable across the advanced economies, the relative importance of this sector varies considerably (Figure 10). Focusing first on the EU and considering real value added, the share of the ICT sector amounted to less than 5% in 2016. While this constitutes a significant increase compared with 2000, it is also a fact that the ICT sector plays a smaller role in the EU economy than in its major competitor countries. In the US and Japan the ICT sector contributed about 6% to the national GDP, with the corresponding share in Korea being 10%. These figures are compatible with the conclusions by the IMF (2018) regarding the size of the digital sector, which, the report claims, is generally still less than 10% in most economies when measured by valued added, income or employment.14 While the ICT sector as defined here and the IMF’s definition of the digital sector do not fully overlap, they nevertheless comprise a similar set of industries.
The perceived technological gap between the EU and the US is a long-standing concern of EU industrial policy (e.g. Eaton et al. 1998; Foster et al., 2013, Landesmann and Stöllinger 2020). The fact that the ICT sector in the EU economy is comparatively small is of particular concern given the close relationship between ICT and the digital economy, which is one of the strategic priorities (‘flagship initiatives’) of the EU’s 2020 growth strategy.
14 The data are of course also in line with those reported by the Joint Research Centre in their PREDICT Key Facts Report (JRC 2017).

THE PRODUCTION SIDE OF ICT TECHNOLOGY AT AGGREGATE LEVEL 37 Research Report 456
Figure 10 / The role of the ICT sector in the main ICT producing economies
(a) Nominal value added
(b) Real value added
(c) Employment
Note: Services sector excludes trade services industries. Sources: PREDICT dataset; authors’ elaboration.
0%
5%
10%
15%
2000 2016 2000 2016 2000 2016
ICT sector share in % of totaleconomy
ICT manufacturing share in % ofmanufacturing
ICT services share in % of services
EU USA Japan Korea China Indien
20.1% 20.0%
0%
5%
10%
15%
2000 2016 2000 2016 2000 2016
ICT sector share in % of totaleconomy
ICT manufacturing share in % ofmanufacturing
ICT services share in % of services
EU USA Japan Korea China Indien
24.4%
0%
5%
10%
15%
2000 2016 2000 2016 2000 2016
ICT sector share in % of totaleconomy
ICT manufacturing share in % ofmanufacturing
ICT services share in % of services
EU USA Japan Korea China Indien
38 THE PRODUCTION SIDE OF ICT TECHNOLOGY AT AGGREGATE LEVEL Research Report 456
The transformation towards a digital economy is further elaborated in the ‘Digital Agenda for Europe’ (European Commission 2018), recently updated and specified in a communication by the Commission (European Commission 2020a), and the EU’s updated industrial policy strategy (European Commission, 2020b) calls not only for the transition to a green economy but also to a digital economy.
Against the background of these policy objectives, the relatively modest role played by the ICT sector in the EU economy would indicate that great efforts are needed to boost the expansion of the ICT sector. This is true for both the manufacturing and the services part of the ICT sector, although the difference compared with main competitor countries is particularly striking where manufacturing is concerned. Focusing again on the gap with the US, Figure 9 illustrates clearly that in 2016 the EU was lagging behind especially in the ICT manufacturing sector, irrespective of whether real or nominal value added or employment are considered. In terms of employment, for example, the share of the ICT manufacturing sector amounted to 2% in the EU, compared with 5% in the US. This comparison is certainly influenced by the fact that the US manufacturing sector has shrunk considerably over the past decade and is therefore modest in size, but the comparison with other countries, such as Japan or Korea, shows that this is not the only explanation for this result. The gap between the EU and the US in the ICT services sector is smaller (and in the case of employment non-existent). As pointed out in the context of the growth dynamics, this relatively good positioning of the EU in the services segment suggests that the data require further scrutiny, given the frequently voiced concern that the EU economy lacks a sufficient number of leading software and online platform providers, with German software company SAP being a rare exception (see EPSC 2019).
3.4.2. Productivity and world market shares in the ICT sector
While the relative size of a sector is likely to reflect its international competitiveness, more direct performance indicators are sector productivity, which reflects the aggregate productivity of firms, and world market shares, a measure for success in international markets.
Starting with the world market shares of gross output (panel a) and value added (panel b) – both nominal – in the ICT sector, Figure 11 shows a rather typical pattern that qualitatively resembles the trends in global GDP shares and overall gross output shares after the past two decades. The economic triad, the EU, the US and Japan, experienced a marked decline in their world marked shares in the gross output of ICT goods and services produced, which is mirrored by strongly growing world market shares for China and much more modest gains for India (over the period 2000-2016). Korea managed to keep its world market share in the ICT sector more or less constant albeit at a low level.
An important recent modification of these broad trends is that in the early 2010s the US was able to stop and reverse the declining trend in its world market share not only in the ICT sector but also in the overall economy. After 2016 such a trend reversal is no longer observable.

THE PRODUCTION SIDE OF ICT TECHNOLOGY AT AGGREGATE LEVEL 39 Research Report 456
Figure 11 / Development of world market shares, ICT sector and overall economy, 2000-2016
(a) nominal gross output
(b) nominal value added
Note: Global economy comprises the following economies: EU, Australia, Brazil, Canada, Switzerland, China, India, Japan, Korea, Norway, Russia, Taiwan and the US. Labour productivity at the global level is the weighted average over the constituting countries. Sources: PREDICT dataset; authors’ elaboration.
0
10
20
30
40
wor
ld m
arke
t sha
re (i
n %
)
2000 2005 2010 2015Year
EU USA
Japan Korea
China India
0
10
20
30
40
wor
ld m
arke
t sha
re (i
n %
)
2000 2005 2010 2015Year
EU USA
Japan Korea
China India

40 THE PRODUCTION SIDE OF ICT TECHNOLOGY AT AGGREGATE LEVEL Research Report 456
A comparison of the trends in gross output and value added also illustrates that the former probably overstates the strong position of China in the ICT sector. In terms of gross output, China had a world market share of 30% in 2016, clearly surpassing the share of the US (25%) and even more clearly that of the EU (20%). Looking at value added, the data show a different picture, whereby in 2016 the US remained the undisputed market leader, responsible for one third of global value added generated by the ICT sector. The EU’s share of global value added by the ICT sector accounted for about 22%, only slightly more than its gross output share, making it the second most important producer, followed by China. One reason for the significant difference in the output and value added-based ICT market shares of the US and the rather limited difference in the EU could be different outsourcing strategies. In the EU a much larger part of the offshoring activities of MNEs are regional in scope, giving rise to regional global value chains (GVCs) that imply joint production by EU member states. In other words, intra-EU offshoring does not drive a wedge between gross output and value added-based world market shares of the EU.
In any case, the trend depicted in Figure 11 is a reminder of the urgent need for realising the European Digital Agenda and a reinforced European industrial policy strategy, including massive investment support that provides a push for the digital transformation of the production processes, incorporating cyber-physical systems of production.
Figure 12 / Real labour productivity of the ICT sector in main producer countries, 2000-2016
Note: Global economy comprises the following economies: EU, Australia, Brazil, Canada, Switzerland, China, India, Japan, Korea, Norway, Russia, Taiwan and the US. Real labour productivity calculated using national sector-specific price deflators. Sources: PREDICT dataset; authors’ elaboration.
The developments of the real labour productivities in the six main ICT-producing regions are interesting in many ways (Figure 12). First of all, the productivity differences in the ICT sector in the developed producer countries are extremely high, much higher than for the global average (which was found to be EUR 53,280 on average in 2000-2016), and above all much higher than in China and India. While the productivities are trending upwards in all countries, there is significant variance in the dynamics. Mirroring the different sizes of the ICT sector in the EU and the US as well as in the world market
0
50000
100000
150000
200000
real
labo
ur p
rodu
ctiv
ity
2000 2005 2010 2015Year
EU USA
Japan Korea
China India

THE PRODUCTION SIDE OF ICT TECHNOLOGY AT AGGREGATE LEVEL 41 Research Report 456
shares, US labour productivity in the ICT sector (EUR 214,000) was, according to the PREDICT data, more than double that in the EU (EUR 102,600) in 2016. This implies a considerable widening in the productivity gap compared with 2000. With a short exception, real labour productivity in the EU was also inferior to Japanese productivity, and by 2015 Korea had also caught up with the EU in terms of labour productivity.
Another striking feature of Figure 12 are the low labour productivities of China and India. Apart from the much lower real labour productivity in these economies per se, the offshoring activities of (mainly Western) MNEs tend to intensify the productivity differences, as it leaves ‘high-powered’ ICT sectors in the US, the EU and Japan, while emerging economies in their role as ‘factory economies’ (Baldwin and Lopez-Gonzalez, 2015) perform the actual production activities, which tend to have a lower potential for generating value added and hence result in lower productivities (Stöllinger, 2019).
The extent of both the EU’s productivity gap with the US and leading Asian competitor as well as the massive distance of China and India from the ‘ICT productivity frontier’ is depicted in Figure 13 for the ICT sector and the two main sub-sectors, with all gaps referring to the period averages (2000-2016).
Figure 13 / Real labour productivity gaps to the US in the ICT sector, average 2000-2016
Note: Labour productivity gap (LPGAP) of country j to the US is calculated as LPj
GAP = ( LPUS – LPj ) / LPUS * 100 where a value of 0 indicates labour productivity equal to that of the US. The average for China comprises the period 2006-2016; the average for India comprises the period 2000-2013. Sources: PREDICT dataset; authors’ elaboration.
The figure shows that the EU’s ICT productivity gap with the US exceeds 40% overall and for the ICT services sector, while the gap amounts to more than 50% for ICT manufacturing. In general, US productivity advantages are suggested to be huge also compared with other main producer countries. In fact, it is only in the Japanese ICT services sector that the productivity gap vis-à-vis the US is less than 20%.
While one potential explanation for these massive productivity differences could be different methods of calculating the price deflators (e.g. due to the US applying hedonic pricing methods that try to
- 10.00 20.00 30.00 40.00 50.00 60.00 70.00 80.00 90.00 100.00
EU
Japan
Korea
China
India
gap to US real labour productivity(0 = equal to US productivity)
ICT services ICT manufacturing ICT sector

42 THE PRODUCTION SIDE OF ICT TECHNOLOGY AT AGGREGATE LEVEL Research Report 456
incorporate quality aspects in the calculation of deflators), it turns out that the productivity gap between the EU and the US is of similar size in terms of nominal labour productivity. This rules out these types of methodological differences as a source for the striking differences in productivity. A potential explanation could be the different behaviour of firms with respect to expenditure on R&D, which is discussed next.
3.4.3. The ICT sector’s contribution to business R&D
Investment in R&D is a key activity to remain at the technological frontier as well as a major production factor (next to physical capital and R&D personnel). This becomes clear in the latest version of the System of National Accounts (SNA 2008), where expenditure on R&D is recorded as investment feeding into the stock of intangible assets.
As shown in Table 10, the dominance of the US with regard to the shares in overall R&D expenditure by businesses may indeed be a main reason for the productivity advantage enjoyed by the US ICT sector. By 2016 the US accounted for almost half of global R&D expenditure in the ICT sector, showing an upward trend in the most recent years. Moreover, the US share in global R&D expenditure exceeds the country’s share in overall R&D expenditure by a wide margin (48% versus 37% in 2016). The opposite is true for the EU, where the share of European companies in R&D in the ICT sector is both declining and significantly below the EU’s share in total R&D (14% versus 22% in 2016). The situation is similar in both sub-sectors, the ICT manufacturing and the ICT services sector, with EU companies accounting for a particularly low share in the former (8% of the global total in 2016).

THE PRODUCTION SIDE OF ICT TECHNOLOGY AT AGGREGATE LEVEL 43 Research Report 456
Table 10 / Share of main producer regions in global expenditure on business R&D, nominal values, 2000, 2006, 2013, 2016
ICT sector Total economy ICT manufacturing sector
Manufacturing sector
ICT services sector Services sector
European Union
2000 17.0 22.9 14.6 22.3 22.9 31.7 2006 18.8 27.5 16.1 25.8 23.3 32.3 2013 16.1 24.5 10.6 21.7 24.8 32.0 2016 13.7 21.9 8.0 19.3 22.5 28.7
United States
2000 45.3 45.2 38.8 40.3 61.5 53.8 2006 44.8 39.6 35.7 37.9 60.0 46.8 2013 44.3 34.2 36.8 32.5 56.4 42.9 2016 48.0 37.3 41.0 34.8 58.7 48.8
Japan
2000 28.7 22.6 35.2 29.0 9.0 7.8 2006 19.0 18.3 26.6 22.2 6.4 7.9 2013 12.0 13.8 16.3 16.9 5.1 5.6 2016 9.3 12.2 12.0 14.8 5.2 5.7
Korea
2000 3.6 2.0 4.1 2.4 2.0 1.1 2006 6.9 3.5 10.2 4.4 1.5 1.0 2013 9.9 4.5 14.9 5.5 1.9 1.3 2016 9.8 4.6 15.0 5.8 1.7 1.3
China
2000 1.5 1.4 1.7 0.5 2006 3.5 4.3 4.9 5.1 1.3 1.2 2013 9.9 15.6 13.6 19.0 4.0 4.3 2016 12.5 18.2 17.3 22.1 5.2 5.7
India
2000 0.2 2006 0.3 0.4 0.0 0.4 0.8 0.4 2013 0.3 0.6 0.0 0.5 0.8 0.5 2016 0.7
Note: R&D intensity is the share of business expenditure on R&D in value added in each country. China: data for 2005 not available; India: data for 2000 and 2016 not available. The services sector excludes trade services industries. Sources: PREDICT dataset; authors’ elaboration.
Impressive is (once more) the R&D performance of the Chinese ICT sectors. Starting from negligible shares in the year 2000 (for 2000-2005 data are only available for the ICT manufacturing sector), China contributed almost 13% to worldwide business R&D expenditure in the ICT sector and 17% in the sector’s manufacturing segment in 2016. This is yet another piece of evidence suggesting that China is no longer solely acting as the factory of the world but has developed substantial R&D capacities. In contrast, in this comparison India plays a marginal role when it comes to ICT R&D, including in the ICT services sector, where it accounted for less than 1% of the sub-sector’s global R&D expenditures in 2016. These ‘world market shares’ in R&D are probably a better reflection of the leading role of US companies in the realm of ICT than the corresponding value-added shares. The reason for this is that

44 THE PRODUCTION SIDE OF ICT TECHNOLOGY AT AGGREGATE LEVEL Research Report 456
the functional division of labour leads to a situation where comparatively little production takes place within the US because it is regularly offshored to low-wage destinations, which consequently leads to lower US shares in (especially) gross output and (also) value added.
Figure 14 / R&D intensity in the ICT sector in the main producer countries, 2000-2016
Note: R&D intensity is the share of business expenditure on R&D in value added in each country. China: data for the years 2000-2005 not available. India: data for the years 2000-2002 and 2014-2016 not available. Sources: PREDICT dataset; authors’ elaboration.
Another interesting metric is the R&D intensity of the ICT sector. Figure 15 shows that in this respect Korea outperforms the US (ranking second) thanks to strong increases between 2000 and 2014. Again, the EU as a bloc seems to fall behind due to a less dynamic development of the ICT sector’s R&D intensity, which hovered around 5% over the period 2000-2016. This means that by 2016 the EU was more or less at par with China in this respect.
What should be kept in mind, though, is that R&D intensity also depends on the structure of the economy. For example, it seems that extremely high R&D intensity at the economy level is influenced by the fact that the country has a comparatively small trade services industry – at least compared with the US. This becomes obvious in Figure 15, which shows that over the period 2000-2016 R&D intensity in the US was on average higher than in Korea in the manufacturing ICT sector and in the ICT services sector – where the latter excludes the trade services industries – but not in the overall ICT sector, where the trade services industries are included. Likewise, R&D intensity in the EU was higher than in China in both ICT sub-sectors, but both economies recorded almost identical R&D intensities for the overall ICT sector.
Hence, R&D intensities, while highly informative for the position of countries in the production of new ICT technologies, need to be carefully interpreted with the influence of the overall structure of the economy in mind, which may or may not be relevant for the performance of the ICT sector. This, however, does not change the fact that the EU underperforms in terms of R&D intensity when compared with other developed producer countries (with the exception of the Japanese ICT services sector). This is rather
0
5
10
15
20
25
Inte
nsity
of b
usin
ess
R&
D e
xpen
ditu
re
2000 2005 2010 2015Year
EU USA
Japan Korea
China India

THE PRODUCTION SIDE OF ICT TECHNOLOGY AT AGGREGATE LEVEL 45 Research Report 456
bad news for the high-aiming objectives of the EU’s Digital Agenda and related policy fields, such as industrial policies aiming at the digital transformation.
Figure 15 / R&D intensity in the ICT sector and main sub-sectors, averages 2000-2016
Note: R&D intensity is the share of business expenditure on R&D in value added in each country. The services sector excludes trade services industries. Sources: PREDICT dataset; authors’ elaboration.
3.5. A LOOK INSIDE THE EU: THE ICT SECTORS OF THE EU MEMBER STATES
While the high degree of economic integration attained justifies considering the EU as one economy, it is at the same time composed of a large set of diverse and highly heterogeneous economies with different specialisation patterns and technological capacities. Therefore, this section supplements the discussion in the previous section by briefly outlining member states’ positions in the ICT sector within the EU.
In this respect, a first observation is that, given the existing differences in economic size, the four largest member states (Germany, France, Italy and the UK15) accounted for about 60% of EU-wide real value added generated by the EU ICT sector in 2018 (Table 11). In the case of employment, the corresponding share was still 50%.
A striking feature of the figures in Table 11 is that the share of the so-called ‘new member states’ (which are those that joined the EU in 2004 or later) in EU-wide ICT employment is considerably higher (20% in 2018) than their real value-added share (9% in 2018). This points to significant productivity differences in the EU, which will be discussed further below. This is true for both the ICT manufacturing sector and the ICT services sector, whereby the share of the former tends to be larger. That is a characteristic which the new member states, comprising mostly CEE countries, share with Germany and also Italy. The opposite pattern is found for France and the UK as well as the other 15 member states (i.e. those joining the EU before 2004, except the four largest economies).
15 Across the sample period, the UK was still an EU member.
0
5
10
15
20
25
EU USA Japan Korea China India
R&D
inte
nsity
ICT sector ICT manufacturing sector ICT services sector

46 THE PRODUCTION SIDE OF ICT TECHNOLOGY AT AGGREGATE LEVEL Research Report 456
Table 11 / Member states’ shares in EU-wide ICT sector value added and employment, 2000 and 2018
(a) real value added
ICT sector ICT manufacturing ICT services 2000 2018 2000 2018 2000 2018 Germany 19.4 20.3 23.0 32.0 18.5 18.8 France 17.6 16.0 15.1 10.7 18.3 16.0 Italy 10.6 9.2 5.9 10.4 11.8 8.9 United Kingdom 20.2 17.1 14.5 8.2 21.7 17.4 Other EU15 28.3 28.5 38.4 26.8 25.7 30.6 New member states 3.9 8.9 3.1 11.9 4.1 8.4
(b) employment
ICT sector ICT manufacturing ICT services 2000 2018 2000 2018 2000 2018 Germany 17.0 17.4 17.9 22.0 16.8 17.0 France 13.7 12.2 9.2 7.0 15.0 12.7 Italy 11.1 9.6 8.2 10.6 11.9 9.5 United Kingdom 18.2 17.1 13.9 6.9 19.4 18.2 Other EU15 25.4 23.7 27.6 17.6 24.8 24.4 New member states 14.6 19.9 23.3 35.9 12.1 18.2
Note: Other EU15 comprises Austria, Belgium, the Netherlands, Luxembourg, Ireland, Spain, Portugal, Denmark, Sweden, Finland, Greece. New member states comprises Bulgaria, Romania, Croatia, Czechia, Slovakia, Hungary, Poland, Slovenia, Estonia, Latvia, Lithuania, Cyprus, Malta. Ireland: data for 2015-2018 extrapolated. Sources: PREDICT dataset; authors’ elaboration.
When identifying the ICT specialisation patterns within the EU, it is useful to look not only at the share of the ICT sector in the total economy but also at the relative importance of the two sub-sectors. This is done in Figure 16, which shows member states’ (total) ICT sector shares (in terms of value added) relative to the EU on the horizontal axis and the ratio between the real value added generated by the ICT manufacturing sector and the ICT services sector, also relative to the corresponding ratio in the EU.
Therefore, economies that have a relatively large ICT sector are found further to the right in Figure 16. Examples would be Ireland, Sweden or Finland. The relatively high importance of the ICT sector may be due to a focus on ICT manufacturing industries, which would result in a high ICT manufacturing to services ratio and put countries at the upper part of the figure. Examples for countries with large ICT manufacturing sectors with a manufacturing focus are Hungary, Finland and Estonia. Member states with large ICT manufacturing sectors and a specialisation in ICT services (to be found on the lower right part) include Ireland, Sweden and also France. Note that three of the four largest EU economies, i.e. Germany, Italy and also the UK, do not feature particularly large ICT sectors. These specialisation patterns (or rather a lack of specialisation in ICT industries) in major economies are part of the explanation for the subdued performance of the EU in comparison with its main global competitor countries (see Section 3.4). Note also that there are some countries (e.g. Greece, Latvia, Portugal and also Austria) which risk missing the digital transformation if the size of the ICT sector can serve as an indicator for an economy’s preparedness for such a transformation.
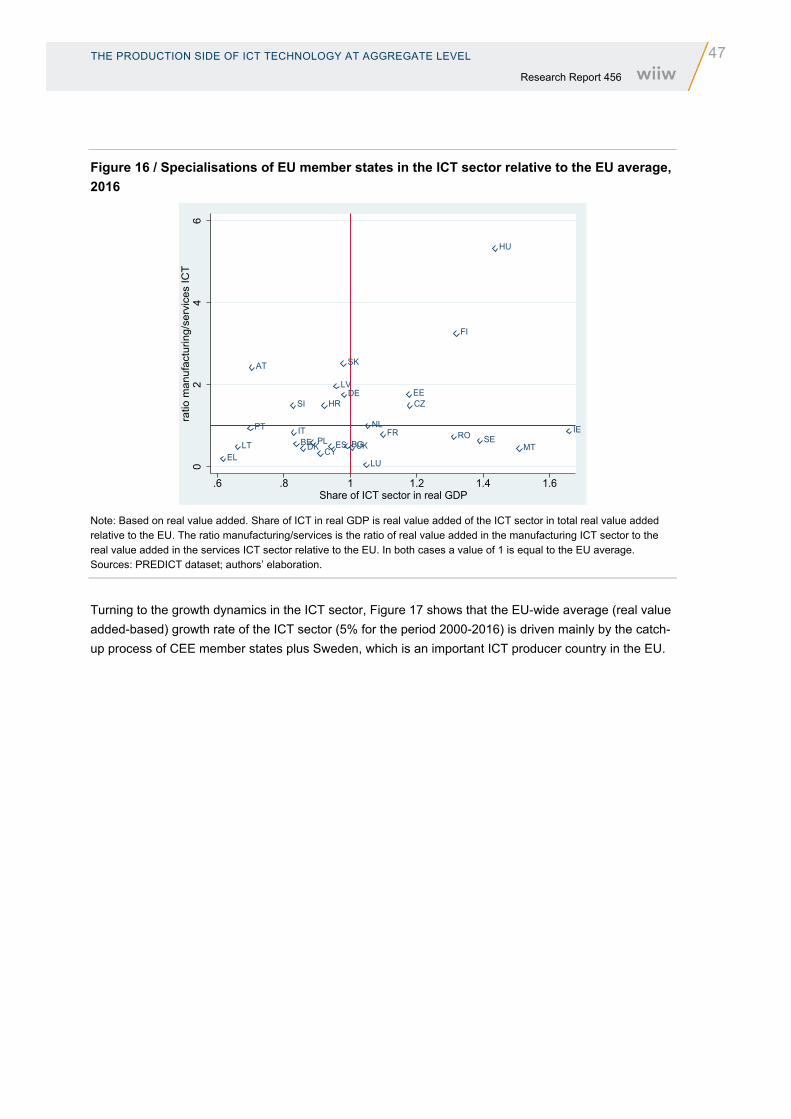
THE PRODUCTION SIDE OF ICT TECHNOLOGY AT AGGREGATE LEVEL 47 Research Report 456
Figure 16 / Specialisations of EU member states in the ICT sector relative to the EU average, 2016
Note: Based on real value added. Share of ICT in real GDP is real value added of the ICT sector in total real value added relative to the EU. The ratio manufacturing/services is the ratio of real value added in the manufacturing ICT sector to the real value added in the services ICT sector relative to the EU. In both cases a value of 1 is equal to the EU average. Sources: PREDICT dataset; authors’ elaboration.
Turning to the growth dynamics in the ICT sector, Figure 17 shows that the EU-wide average (real value added-based) growth rate of the ICT sector (5% for the period 2000-2016) is driven mainly by the catch-up process of CEE member states plus Sweden, which is an important ICT producer country in the EU.
AT
BE BGCY
CZDE
DK
EE
ELES
FI
FR
HR
HU
IEITLT
LU
LV
MT
NL
PLPT
RO SE
SI
SK
UK
02
46
ratio
man
ufac
turin
g/se
rvic
es IC
T
.6 .8 1 1.2 1.4 1.6Share of ICT sector in real GDP
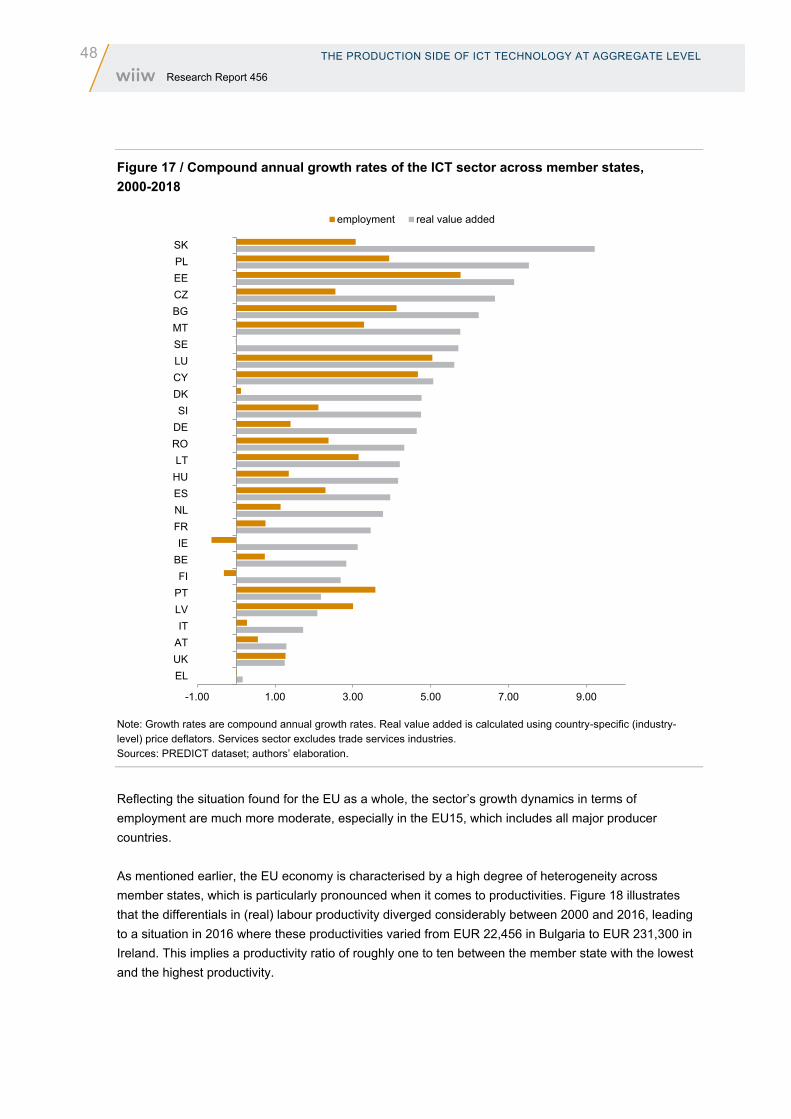
48 THE PRODUCTION SIDE OF ICT TECHNOLOGY AT AGGREGATE LEVEL Research Report 456
Figure 17 / Compound annual growth rates of the ICT sector across member states, 2000-2018
Note: Growth rates are compound annual growth rates. Real value added is calculated using country-specific (industry-level) price deflators. Services sector excludes trade services industries. Sources: PREDICT dataset; authors’ elaboration.
Reflecting the situation found for the EU as a whole, the sector’s growth dynamics in terms of employment are much more moderate, especially in the EU15, which includes all major producer countries.
As mentioned earlier, the EU economy is characterised by a high degree of heterogeneity across member states, which is particularly pronounced when it comes to productivities. Figure 18 illustrates that the differentials in (real) labour productivity diverged considerably between 2000 and 2016, leading to a situation in 2016 where these productivities varied from EUR 22,456 in Bulgaria to EUR 231,300 in Ireland. This implies a productivity ratio of roughly one to ten between the member state with the lowest and the highest productivity.
-1.00 1.00 3.00 5.00 7.00 9.00
ELUKATIT
LVPTFI
BEIE
FRNLESHULT
RODESI
DKCYLUSEMTBGCZEEPLSK
employment real value added

THE PRODUCTION SIDE OF ICT TECHNOLOGY AT AGGREGATE LEVEL 49 Research Report 456
Figure 18 / Real labour productivities in the ICT sector, selected EU member states, 2000-2016
Note: Based on real value added. Sources: PREDICT dataset; authors’ elaboration.
This constellation naturally has implications for EU internal cohesion on the one hand, and international competitiveness vis-à-vis major competitor countries on the other hand. With a view to cohesion, this diverging development (which is not only driven by strongly rising productivities in leading economies but also by stagnating or even declining trends, e.g. in Croatia) is hardly satisfactory and risks leaving several members states behind, if not as users of ICT goods and services, then at least as producers of ICT goods and services.
On the assumption that in all likelihood not all member states will operate at the productivity frontier, the existing differential allows at least some member states, especially Ireland and Sweden, to move closer to the productivity frontier, currently defined by the US.
The data for the ICT sub-sectors confirm the large productivity differentials (Figure 19). Interestingly, in the countries with the highest labour productivities, notably Sweden and Finland,16 the productivity in the ICT manufacturing sector exceeds the level in the services segment. This is generally not the case in the CEE member states (e.g. Hungary, Czechia, Slovakia), not even in those countries that were identified as having comparatively large ICT sectors (e.g. Hungary). The most likely explanation for this is that firms in different countries fulfil different functions within international value chains.
16 The situation of Ireland is different because the country’s sector-level productivity is strongly influenced by US subsidiaries, which includes numerous headquarters responsible for the European market.
0
50000
100000
150000
200000
250000
real
labo
ur p
rodu
ctiv
ity
2000 2005 2010 2015Year
Germany France
Italy UK
Ireland Denmark
Sweden Finland
Estonia Hungary
Bulgaria Romania
Croatia Greece

50 THE PRODUCTION SIDE OF ICT TECHNOLOGY AT AGGREGATE LEVEL Research Report 456
Figure 19 / Real labour productivity in the ICT sector and main sub-sectors, averages 2000-2016
Note: Real labour productivity is value added-based. The services sector excludes trade services industries. Sources: PREDICT dataset; authors’ elaboration.
It should be noted, though, that at this level of aggregation (with broadly defined sectors) productivity differences do not translate directly into international competitiveness and world market shares (otherwise the US should hold much larger shares). Rather, these substantial productivity differences also reflect (at least partly) the fact that member states specialise in different industry niches (product specialisation) and above all in different functions within global (or regional) value chains (functional specialisation).
The different functional specialisation patterns become apparent in the data on business R&D expenditure. First, R&D tends to be even more concentrated than value added or employment, and this is also the case in the EU ICT sector (Figure 20). Germany, France, Italy and the UK accounted for 62% of the sector’s expenditure on business R&D, and adding Sweden and Finland increases the share to almost three quarters in 2016.
Most importantly, CEE member states have negligible R&D shares, which points to their role as factory economies within European value chains, with the EU core countries (such as Germany or France) taking responsibility for headquarter and R&D functions (Stöllinger 2019).
Second, there are massive differences in member states’ R&D intensities in the ICT sector. The most interesting aspect of these data are the peaks in the R&D intensities in the manufacturing segment of the ICT sector, which are present in the high-productivity countries (e.g. Sweden and Finland) and the four largest EU economies, but not in the CEE member states. This confirms the assertion made above that the CEE economies – even within the ICT manufacturing sector – perform different functions than the EU15 countries.
-
20,000
40,000
60,000
80,000
100,000
120,000
140,000
160,000
180,000
200,000
AT BE BG CY CZ DE DK EE EL ES FI FR HR HU IE IT LT LU LV MT NL PL PT RO SE SI SK UK
Rea
l lab
our p
rodu
ctiv
ity
ICT sector ICT manufacturing sector ICT services sector
317,963

THE PRODUCTION SIDE OF ICT TECHNOLOGY AT AGGREGATE LEVEL 51 Research Report 456
Figure 20 / EU member states’ shares in EU-wide expenditure on business R&D, 2000 and 2016
Note: Based on nominal expenditure on business R&D (BERD). Sources: PREDICT dataset; authors’ elaboration.
Figure 21 / R&D intensity in the ICT sector and main sub-sectors, averages 2000-2016
Note: R&D intensity is the share of business expenditure on R&D in value added in each country. The services sector excludes trade services industries. Sources: PREDICT dataset; authors’ elaboration.
0 5 10 15 20 25
LVLTMTLUCYHRSKSI
EEHUBGROELPTCZDKPLIE
ESBEATNLFI
SEIT
UKDEFR
Share in EU-wide business R&D in the ICT sector
2016 2000
0
5
10
15
20
25
30
35
40
AT BE BG CY CZ DE DK EE EL ES FI FR HR HU IE IT LT LU LV MT NL PL PT RO SE SI SK UK
R&D
inte
nsity
ICT sector ICT manufacturing sector ICT services sector

52 ICT PRODUCTION FROM A FIRM-LEVEL PERSPECTIVE Research Report 456
4. ICT production from a firm-level perspective
4.1. INTRODUCTION
This section provides an overview of the supply side of ICT industries derived from firm-level data. The descriptive analysis is based on a large panel of companies around the world.
The use of ICT in production processes was a key determinant of economic growth during the second part of the twentieth century, and over the past years the ICT sector has grown at an even faster pace. The internet is an indispensable tool for business activities. The availability of devices with high computational power has led to rapid economic development in fields such as big data and artificial intelligence (AI), which are used in many other sectors of the economy. Policy makers and companies tend to pay a lot of attention to emerging technologies. It is therefore necessary to describe how ICT companies perform and produce ICT goods and services around the globe. Superstars such as Apple Inc., the Microsoft Corporation, Alphabet Inc. and AT&T are major examples of ICT firms which have grown substantially in the past decades.
The key to the success of these growing superstars has been their ability to be constantly innovative. Innovative processes allow companies to introduce new products, services and production procedures, which ultimately gives them a larger market share in the global economy (Friedrich et al., 2011). In this section we therefore also provide a snapshot of the productivity and innovative processes of firms dealing in ICT over the years in the most significant ICT-producing regions. Labour productivity and total factor productivity are the main indicators of firms’ productivity. R&D expenditure as the input of innovative processes and the number of granted patents as the output of these innovative process are used as the main proxies for innovation in ICT firms. It indicates a positive relationship between the innovative process and productivity. We focus on the productivity and innovative processes of the leading ICT producers over the period 2001-2018. We use R&D expenditure as the input of the innovative process and the number of granted patents as its output. Our findings imply that policy makers should aim to improve innovative activities.
4.2. DATA
Our data are collected from the Orbis database provided by the Bureau van Dijk. It consists of 182,145 companies active in the ICT sector of 39 countries17 in 2009-2018. A list of these countries is provided in Appendix Table A.1 in the Appendix. ICT firms are selected based on their core sector of activity, and ICT manufacturing and services sectors are borrowed from the operational definition provided by the technical report of the Joint Research Centre (JRC) of the European Commission on the 2018 PREDICT database (Benages et al., 2018). These sectors are based on the operational definition of ICT sectors that are presented in panel (b) of Table 5 in section 3 above, where we also clarify which sectors are considered ‘ICT manufacturing’ and which ‘ICT services’.
17 In the case of China, we exclude observations with less than 10 employees because of noisy data.

ICT PRODUCTION FROM A FIRM-LEVEL PERSPECTIVE 53 Research Report 456
Outliers in the data are filtered by excluding extreme values using a boxplot technique. Furthermore, some firms with extremely large turnover values which list very few employees and are mostly located in China are also excluded from the analysis. We use labour productivity as a proxy for productivity, defined as the ratio of turnover to the number of employees. For ICT manufacturing sectors we also use TFP estimated using Ackerberg et al. (2015); see Appendix B for details. As mentioned above, we use R&D expenditure and the number of granted patents for the innovative process.
To make the data comparable across countries and over the years, we express them in constant 2015 US dollars using price deflators and exchange rates. The first source is the Structural Analysis (STAN) database provided by the OECD, which gathers deflators for gross output, intermediate goods and capital goods by sector of activity. Then, where the data from OECD STAN are missing, the Eurostat database is used, which provides deflators (producer price index) of capital and intermediate goods in aggregate and gross output for each sector separately. We use price deflators sourced by National Statistics, Republic of China (Taiwan) for Taiwan.18 Exchange rates are given by Orbis.
4.3. FIRM-LEVEL COMPARISONS BETWEEN SELECTED REGIONS PRODUCING IN ICT SECTORS
Figure 22 depicts the evolution of the average turnover of each region’s large ICT firms with at least 250 employees in both the manufacturing and the services sector over the period 2009-2018. Firms active in the US have much higher levels of turnover, which is on average about USD 3.7 billion and more than four times the average turnover of large ICT firms in other regions.
Figure 22 / Average turnover of large ICT firms with more than 249 employees by region in billion USD, 2009-2018
Sources: Orbis; Eurostat; OECD; authors’ own elaboration.
18 If values are missing even at aggregate levels of sectors, we elaborate using the GDP deflator (or its growth rate) sourced from the same source we use as deflators for each country.
3
3.2
3.4
3.6
3.8
4
4.2
4.4
0.1
0.6
1.1
1.6
2.1
2009 2010 2011 2012 2013 2014 2015 2016 2017 2018
US
firm
s -b
illion
USD
Billio
n U
SD
China EU27 India Japan
South Korea Rest of the world United States - rhs
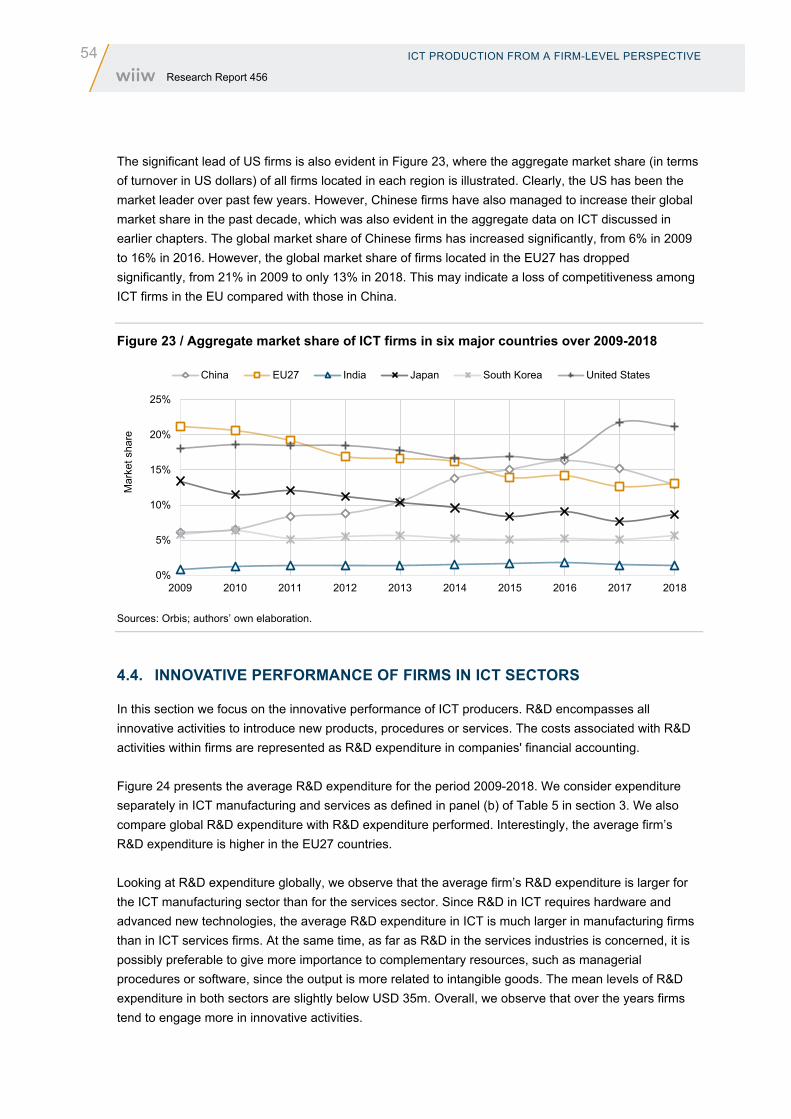
54 ICT PRODUCTION FROM A FIRM-LEVEL PERSPECTIVE Research Report 456
The significant lead of US firms is also evident in Figure 23, where the aggregate market share (in terms of turnover in US dollars) of all firms located in each region is illustrated. Clearly, the US has been the market leader over past few years. However, Chinese firms have also managed to increase their global market share in the past decade, which was also evident in the aggregate data on ICT discussed in earlier chapters. The global market share of Chinese firms has increased significantly, from 6% in 2009 to 16% in 2016. However, the global market share of firms located in the EU27 has dropped significantly, from 21% in 2009 to only 13% in 2018. This may indicate a loss of competitiveness among ICT firms in the EU compared with those in China.
Figure 23 / Aggregate market share of ICT firms in six major countries over 2009-2018
Sources: Orbis; authors’ own elaboration.
4.4. INNOVATIVE PERFORMANCE OF FIRMS IN ICT SECTORS
In this section we focus on the innovative performance of ICT producers. R&D encompasses all innovative activities to introduce new products, procedures or services. The costs associated with R&D activities within firms are represented as R&D expenditure in companies' financial accounting.
Figure 24 presents the average R&D expenditure for the period 2009-2018. We consider expenditure separately in ICT manufacturing and services as defined in panel (b) of Table 5 in section 3. We also compare global R&D expenditure with R&D expenditure performed. Interestingly, the average firm’s R&D expenditure is higher in the EU27 countries.
Looking at R&D expenditure globally, we observe that the average firm’s R&D expenditure is larger for the ICT manufacturing sector than for the services sector. Since R&D in ICT requires hardware and advanced new technologies, the average R&D expenditure in ICT is much larger in manufacturing firms than in ICT services firms. At the same time, as far as R&D in the services industries is concerned, it is possibly preferable to give more importance to complementary resources, such as managerial procedures or software, since the output is more related to intangible goods. The mean levels of R&D expenditure in both sectors are slightly below USD 35m. Overall, we observe that over the years firms tend to engage more in innovative activities.
0%
5%
10%
15%
20%
25%
2009 2010 2011 2012 2013 2014 2015 2016 2017 2018
Mar
ket s
hare
China EU27 India Japan South Korea United States

ICT PRODUCTION FROM A FIRM-LEVEL PERSPECTIVE 55 Research Report 456
Interestingly, the comparison between the EU27 and the global sample shows that average R&D expenditure is larger for the EU27 (Figure 24, right-hand scale). R&D expenditure is possibly concentrated among a few superstars in non-EU countries, whereas R&D expenditure in the EU is more equally dispersed among ICT firms. Furthermore, investment in R&D, which contracted until 2015, subsequently rose again, and by 2018 R&D expenditure had returned to the same high levels as those observed in the first years of our analysis.
Figure 24 / Mean R&D expenditure per year (million USD, 2015)
Sources: Orbis; authors’ own elaboration.
4.5. LABOUR PRODUCTIVITY ACROSS SECTORS
In this section we analyse briefly the labour productivity of ICT firms across five large ICT-producing regions. Table 12 presents the average level of labour productivity by sector and country. Labour productivity is defined as the ratio of a firm’s turnover in 2015 constant US dollars over its number of employees. We calculate the mean level for the period 2009-2018.
On average, the telecommunications sector is the most productive in the EU27, US, Japan and South Korea. The manufacturing sector performs relatively well compared with the rest of the sectors in all regions with the exception of China, which achieves high levels of labour productivity in the Software publishing and Data processing sectors. The most important reason could be the extensive economy of scale in telecommunications services, which can supply services to millions of users with ample capital and infrastructure while employing very few people, so that the capital to labour ratio for such a service sector is relatively high. Repair of computers has the lowest levels of labour productivity in the EU and China, as this service is considered to be very labour-intensive. Repairs and debugging of ICT goods and services should usually be based on labour rather than capital, although such a service may require large soft and hard ICT assets, which should be used by technicians and skilful labour on repair and maintenance. It rarely happens that debugging and repair are done automatically by an AI asset. Therefore, such a service always needs labour for maintenance, which makes it a labour-intensive sector and leads to lower labour productivity.
80
85
90
95
100
105
110
115
8
13
18
23
28
33
2009 2010 2011 2012 2013 2014 2015 2016 2017 2018
Aver
age
R&D
in m
illion
USD
Global manufacturing Global services EU services EU manufacturing - rhs

56 ICT PRODUCTION FROM A FIRM-LEVEL PERSPECTIVE Research Report 456
Table 12 / Average labour productivity across sectors (in thousand USD), 2009-2018
Sector EU27 US China Japan South Korea India
ICT manufacturing 281.78 (65,045) 383.49 (2,537) 193.67 (30,585) 319.39 (9,799) 343.66 (19,269) 176.43 (81)
Software publishing 398.04 (31,223) 288.43 (1,119) 408.68 (2,341) 142.95 (33,098) 168.86 (22,966) 60.29 (6)
Telecommunications 501.54 (63,321) 581.42 (528) 338.04 (1,099) 411.61 (1,676) 522.45 (1,487) 98.62 (7)
Computer programming,
consultancy and related activities
171.51
(488,402) 384.08 (986) 141.91 (2,875) 291.64 (2,461) 258.73 (5,013) 127.53 (91)
Data processing, hosting and
related activities; web portals
114.69
(137,147) 320.76 (260) 1327.58 (154) 180.76 (1,544) 232.24 (1,692) 870.21 (2)
Repair of computers and
communication equipment 94.28 (39,789) - (0) 128.53 (19) 215.07 (327) 201.29 (348) 97.73 (1)
Note: Number of observations in parentheses. Source: Orbis, Eurostat, OECD; authors’ own elaboration.
4.6. TOTAL FACTOR PRODUCTIVITY OF MANUFACTURING FIRMS
The ICT manufacturing sector is typically a capital-intensive sector. Therefore, measuring a firm’s efficiency through labour productivity may be misleading. TFP is an index which takes capital stock, labour and intermediate inputs into account as inputs of a production process that yields a composite product (goods or service). Hence TFP is often considered to be a more accurate way to measure productivity and efficiency of firms to convert inputs of production into outputs (Hulten, 2001; Katayama et al., 2009; Van Beveren, 2012). To this end, we estimate TFP using the framework developed by Ackerberg et al. (2015). The appendix at the end of this report provides more information on the estimation of TFP. We estimate a ‘gross output’-based production function, using turnover as the dependent variable.
Table 13 presents the mean and standard deviation of TFP (in logarithmic terms) of all ICT firms within selected countries for the period 2009-2018 separately. In that way, we select years after the financial crisis.
Within the EU27, the countries of Central and Northern Europe are the leaders (Luxembourg, Ireland, Austria, Belgium and Germany) with the highest average TFP, which indicates the efficiency of the ICT manufacturing firms located in these countries, while the least productive countries are located in the eastern and southern parts of Europe (Latvia, Croatia, Lithuania, Malta and Greece). This indicates a possible regional pattern, suggesting that Western Europe is typically more efficient than the Southeast.
On average, the US appears to be the most productive region in the sample, followed by the EU27 and India. In the latter case, however, one should consider the small number of observations, which may affect the interpretation of our results. The lowest level of TFP is recorded in China. The very large average TFP for Indian firms may be because our sample consists of a selection of the largest and most productive firms, whose financial data are fully reported to the Indian authorities and are also available in Orbis.

ICT PRODUCTION FROM A FIRM-LEVEL PERSPECTIVE 57 Research Report 456
Table 13 / TFP across EU27 countries and aggregate regions, 2009-2018
Country Mean TFP Standard deviation TFP Number of observations Austria 4.939 0.81 183 Belgium 4.929 0.48 670 Bulgaria 4.366 0.97 1545 Czechia 4.194 0.57 2684 Germany 4.901 0.62 2410 Denmark 4.492 0.32 78 Spain 4.313 0.59 6512 Finland 4.693 0.80 1172 France 4.806 0.67 3739 Greece 4.106 0.49 394 Croatia 3.915 0.49 2361 Hungary 4.514 0.82 980 Ireland 4.964 0.69 442 Italy 4.835 0.84 18498 Lithuania 4.082 0.41 214 Luxembourg 5.258 0.65 20 Latvia 3.547 0.76 729 Malta 4.098 0.38 33 Netherlands 4.835 0.48 238 Poland 4.393 0.58 999 Portugal 4.379 0.61 896 Romania 4.164 0.89 2982 Sweden 4.544 0.57 2729 Slovenia 4.477 0.59 1102 Slovakia 4.322 0.58 1251 EU27 4.562 0.80 52861 US 4.667 0.50 2332 China 4.037 0.43 30029 Japan 4.277 0.46 9194 South Korea 4.200 0.40 18422 India 4.540 1.05 72
Source: Orbis, OECD, Eurostat; authors’ own elaboration.
In addition to the average TFP, we can also report how productive firms evolved over time by calculating their allocative efficiency. Figure 25 presents the evolution of simple average TFP and the allocative efficiency for each region. We calculate ‘capital-based’ allocative efficiency following Olley and Pakes (1996) as the log difference between the capital-weighted mean of TFP and the unweighted mean of TFP of all firms in the ICT manufacturing sector. When allocative efficiency increases over time, it indicates that more capital is allocated to more productive firms (Force, 2014). In all regions, capital stock is allocated to less productive firms as the log difference between the capital-weighted TFP and the simple average TFP is negative, which indicates some inefficiency within sectors. The lowest misallocation of capital stock is observed in the US.

58 ICT PRODUCTION FROM A FIRM-LEVEL PERSPECTIVE Research Report 456
Figure 25 / Evolution of the of TFP (in logarithms) and allocative efficiency of ICT manufacturing firms, 2009-2018
Sources: Orbis; OECD; Eurostat; authors’ own elaboration
4.7. TOP FIVE ICT PRODUCERS – GLOBAL VERSUS EU27
Based on past studies that analyse the leading companies in the digital economy (Acker et al., 2016; 2012; Friedrich et al., 2011), this section provides a brief analysis of superstar ICT firms. Table 14 illustrates the top five largest companies in each two-digit sector for the year 2016 in terms of their total turnover in US dollars. The table presents each firm’s market share in terms of its turnover, capital and labour relative to market aggregates and also its profit margin. The last two columns also illustrate the sum of R&D expenditure based on previous-year prices and the number of patents owned by companies that are also granted by the official patent offices.
In the ICT manufacturing sector (manufacture of computer, electronic and optical products), superstar firms come from the US, South Korea, China and Japan. Interestingly, their labour share in the sector is comparatively low relative to their revenue and capital share. This indicates that these firms produce more because they are more capital-intensive and enjoy economies of scale. As expected, they have a large positive profit margin. Moreover, they invest heavily in R&D, which is why they own many granted patents that were published in 2016. This indicates not only that they care about producing new technologies to stay competitive in the sector, but also that they protect their technologies through intellectual property rights by investing in resources to obtain grants for their novel technologies.
Regarding the ICT services sectors, innovation activity appears to be lower than in ICT manufacturing in most cases, both in terms of R&D expenditure and in the amount of granted patents. As expected, superstar firms such as Apple, Samsung Electronics, Alphabet, AT&T and Microsoft seem to dominate each sector's market. Most of the top leading firms in each sector are located in the US, except for the sector Repair of computers and personal and household goods, as no firm-level data are available for the US in this sector, in which the top five firms are based in the Netherlands, the UK, France and Russia.
-6.1
-5.6
-5.1
-4.6
-4.1
-3.6
-3.1
2009 2010 2011 2012 2013 2014 2015 2016 2017 2018
Log
of a
lloca
tive
effic
ienc
y
China EU27 India Japan South Korea United States

ICT PRODUCTION FROM A FIRM-LEVEL PERSPECTIVE 59 Research Report 456
Table 14 / Top five companies in terms of turnover by sector in 2016 in global ICT manufacturing and services sectors
Manufacture of computer, electronic and optical products
Company Country Revenue share
(%) Capital share
(%) Labour share
(%) Profit Margin
(%)
R&D expenditure (billion, USD
2015)
Patents
Apple Inc. United States 6.90 11.56 1.12 28.46 9.94 4309
Samsung
Electronics
Co.,Ltd.
South Korea 3.55 4.67 0.90 13.11 10.91 19845
Hon hai
Precision
Industry Co., Ltd.
Taiwan 3.27 2.08 0.07 4.76 0.95 10477
Huawei
Technologies
Co., Ltd.
China 2.22 0.65 1.36 6.71 - 1501
Intel Corp United States 1.90 4.19 1.03 21.78 12.55 6099
Publishing activities
Company Country Revenue share
(%) Capital share
(%) Labour share
(%) Profit Margin
(%)
R&D expenditure (billion, USD
2015)
Patents
Microsoft
Corporation United States 18.63 15.40 6.39 28.13 11.86 259
Oracle Corp United States 7.57 13.70 7.62 30.89 5.73 1696
SAP S.E. Germany 2.97 8.02 0.79 22.88 3.27 810
IBM Japan, Ltd. Japan 1.55 0.38 0.90 9.79 - 0
VMware, Inc. United States 1.45 1.80 1.12 21.25 1.49 55
Telecommunications
Company Country Revenue share
(%) Capital share
(%) Labour share
(%) Profit Margin
(%)
R&D expenditure (billion, USD
2015)
Patents
AT&T Inc. United States 9.47 10.22 5.40 12.10 1.63 399
Verizon
Communications
Inc.
United States 7.28 6.09 3.24 16.66 - 435
China Mobile
Ltd. China 5.91 3.76 9.93 - - 0
Comcast
Corporation United States 4.67 4.59 3.20 17.74 - 404
Vodafone Group
Public Limited
Company
United Kingdom 3.68 4.36 2.25 -1.18 0 150
cond.

60 ICT PRODUCTION FROM A FIRM-LEVEL PERSPECTIVE Research Report 456
Table 14 / Continued
Computer programming, consultancy and related activities
Company Country Revenue share
(%) Capital share
(%) Labour share
(%) Profit Margin
(%)
R&D expenditure (billion, USD
2015)
Patents
Alphabet Inc. United States 8.89 8.30 1.73 26.75 13.80 7896
International
Business
Machines Corp.
United States 7.87 9.84 9.15 15.43 5.67 685
Google Ireland
Limited Ireland 2.73 0.14 0.07 5.12 - 0
Facebook, Inc. United States 2.72 4.09 0.41 45.29 5.86 51
Cognizant
Technology
Solutions Corp.
United States 1.33 0.76 6.26 17.48 - 13
Information service activities
Company Country Revenue share
(%) Capital share
(%) Labour share
(%) Profit Margin
(%)
Total R&D expenditure (billion, USD
2015)
Patents
Automatic Data
Processing Inc. United States 9.04 3.78 9.22 19.15 0.60 0
First Data
Corporation United States 8.97 20.76 3.88 4.15 - 8
Booking.com
B.V. Netherlands 5.82 1.90 0.26 40.33 - 0
Alliance Data
Systems Corp United States 5.53 5.38 2.75 11.73 - 2
Fiserv Inc United States 4.26 7.27 3.72 23.16 - 43
Repair of computers and personal and household goods
Company Country Revenue share
(%) Capital share
(%) Labour share
(%) Profit Margin
Total R&D expenditure (billion, USD
2015)
Patents
Oranjewoud
N.V. Netherlands 12.91 11.12 4.98 0.93 0.00 2
Fujitsu Services
Limited United Kingdom 12.15 31.40 5.34 5.27 0.01 0
Computacenter
(UK) Limited United Kingdom 8.80 3.38 2.27 4.19 - 0
Hewlett-
Packard Centre
de
Competences
France
France 4.21 1.63 0.60 1.88 - 0
Huawei
Technologies
Co.Ltd Russia 3.16 1.06 23.66 -8.59 - 0
Source: Orbis, OECD, Eurostat, World Bank, National Statistics Rep. of China; authors’ own elaboration.

ICT PRODUCTION FROM A FIRM-LEVEL PERSPECTIVE 61 Research Report 456
Table 15 illustrates the top five firms by sector within the EU27, while the shares presented in the columns are the global shares in turnover, capital and employment. Excluded from this table are EU27 firms that are already included in the global top five firms presented in Table 14. Irish-based firms dominate the manufacturing industry, followed by firms based in the Netherlands. In the sectors of Publishing activities, Computer programming and Information services the list of countries in which the respective firms are based is more varied, since all top five firms are located in five different countries. Two of the five firms in the telecommunications sector are located in the Netherlands and another two in France, while one firm is based in Italy. France dominates the sector Repair of computers.
Comparing the top EU27 producers with global superstars, one can observe that the five largest firms in the world in terms of turnover have much larger revenue, capital and labour shares in the global market. Moreover, the innovation activity of the top five EU firms is not as intensive as that of the top five firms in the world, which suggests that the European superstars are less innovative and consequently less competitive than the non-EU top producers in a given ICT sector.
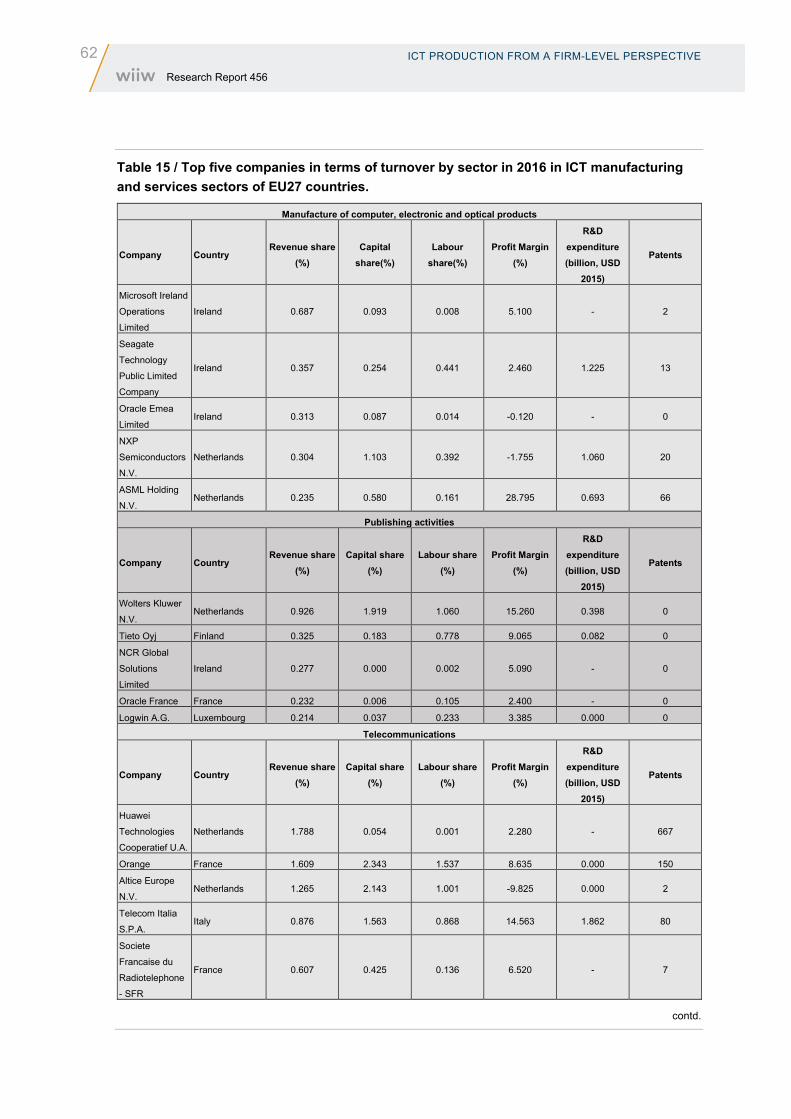
62 ICT PRODUCTION FROM A FIRM-LEVEL PERSPECTIVE Research Report 456
Table 15 / Top five companies in terms of turnover by sector in 2016 in ICT manufacturing and services sectors of EU27 countries.
Manufacture of computer, electronic and optical products
Company Country Revenue share
(%) Capital
share(%) Labour
share(%) Profit Margin
(%)
R&D expenditure (billion, USD
2015)
Patents
Microsoft Ireland
Operations
Limited
Ireland 0.687 0.093 0.008 5.100 - 2
Seagate
Technology
Public Limited
Company
Ireland 0.357 0.254 0.441 2.460 1.225 13
Oracle Emea
Limited Ireland 0.313 0.087 0.014 -0.120 - 0
NXP
Semiconductors
N.V.
Netherlands 0.304 1.103 0.392 -1.755 1.060 20
ASML Holding
N.V. Netherlands 0.235 0.580 0.161 28.795 0.693 66
Publishing activities
Company Country Revenue share
(%) Capital share
(%) Labour share
(%) Profit Margin
(%)
R&D expenditure (billion, USD
2015)
Patents
Wolters Kluwer
N.V. Netherlands 0.926 1.919 1.060 15.260 0.398 0
Tieto Oyj Finland 0.325 0.183 0.778 9.065 0.082 0
NCR Global
Solutions
Limited
Ireland 0.277 0.000 0.002 5.090 - 0
Oracle France France 0.232 0.006 0.105 2.400 - 0
Logwin A.G. Luxembourg 0.214 0.037 0.233 3.385 0.000 0
Telecommunications
Company Country Revenue share
(%) Capital share
(%) Labour share
(%) Profit Margin
(%)
R&D expenditure (billion, USD
2015)
Patents
Huawei
Technologies
Cooperatief U.A.
Netherlands 1.788 0.054 0.001 2.280 - 667
Orange France 1.609 2.343 1.537 8.635 0.000 150
Altice Europe
N.V. Netherlands 1.265 2.143 1.001 -9.825 0.000 2
Telecom Italia
S.P.A. Italy 0.876 1.563 0.868 14.563 1.862 80
Societe
Francaise du
Radiotelephone
- SFR
France 0.607 0.425 0.136 6.520 - 7
contd.

ICT PRODUCTION FROM A FIRM-LEVEL PERSPECTIVE 63 Research Report 456
Table 15 / Continued
Computer programming, consultancy and related activities
Company Country Revenue share
(%) Capital share
(%) Labour share
(%) Profit Margin
(%)
R&D expenditure (billion, USD
2015)
Patents
Ireland Limited Ireland 1.308 0.028 0.018 1.380 - 0
Ericsson AB Sweden 1.191 0.451 0.413 -4.130 3.891 30
Amadeus IT
Group, S.A. Spain 0.412 0.656 0.020 25.570 0.317 65
Intel
Deutschland
GMBH
Germany 0.325 0.064 0.077 1.870 - 6
Gemalto N.V. Netherlands 0.324 0.378 - 9.390 0.197 124
Information service activities
Company Country Revenue share
(%) Capital share
(%) Labour share
(%) Profit Margin
(%)
R&D expenditure (billion, USD
2015)
Patents
Spotify AB Sweden 2.113 0.710 0.146 -2.660 - 25
Snaitech S.P.A. Italy 0.722 0.571 0.121 -3.953 0.000 0
Sgarik SAS France 0.671 0.030 0.011 2.040 - 0
Geoquest
Systems B.V. Netherlands 0.663 4.296 0.002 0.340 - 28
International
Business
Machines of
Belgium
Belgium 0.468 0.265 0.226 -8.930 - 0
Repair of computers and personal and household goods
Company Country Revenue share
(%) Capital share
(%) Labour share
(%) Profit Margin
(%)
Total R&D expenditure (billion, USD
2015)
Total patents
Xerox France 2.68 9.04 0.35 6.72 - 0
Konica Minolta
Business
Solutions France
France 2.32 3.81 0.66 1.18 - 0
Fujitsu
Technology
Solutions
France 1.16 0.49 0.24 -0.91 - 0
Diebold Nixdorf France 1.02 0.39 0.17 3.17 - 0
NCR France France 0.85 0.19 0.22 2.49 - 0
Sources: Orbis; OECD; Eurostat; authors’ own elaboration.
Figure 26 depicts the percentage of aggregate market shares in terms of turnover of the top five global ICT producers by sector and year over the period 2009-2018. A lower market share of the top five at the end of the period for all these sectors compared with the beginning of the period is evident. This is mostly due to the rise of newly established firms in each global sector. The largest decline in market share is visible for the top five firms in Software publishing services, where their market share declined from 58% in 2009 to 33% in 2018.

64 ICT PRODUCTION FROM A FIRM-LEVEL PERSPECTIVE Research Report 456
Figure 26 / Aggregate market share of top five ICT firms in each sector, during 2009-2018
Sources: Orbis; OECD; Eurostat; National Statistics Rep. of China; authors’ own elaboration.
Figure 27 / Aggregate market share of top five ICT producers by sector, EU27
Sources: Orbis; OECD; Eurostat; authors’ own elaboration.
For a comparison between the top five producers in the world and those in the EU27, see Figure 27, where results for the top five firms in the EU27 are illustrated. Again, we exclude any EU27 firm that is classified as a top five firm globally. As expected, aggregate market shares of these firms are much smaller than the market share of the top five global producers of ICT. However, the market share of the top five producers in the EU27 is more stable over the period. The top five EU27 manufacturers have suffered the steepest loss in their market share with a decline from 5.6% in 2009 to 2.2% in 2018.
0
10
20
30
40
50
60
70
2009 2010 2011 2012 2013 2014 2015 2016 2017 2018
Glo
bal m
arke
t sha
re in
per
cent
age
poin
t
ICT manufacturing Software Publishing Telecommunications
Programming & consultancy Information service activities Repair of computers
0
1
2
3
4
5
6
7
8
9
2009 2010 2011 2012 2013 2014 2015 2016 2017 2018Glo
bal m
arke
t sha
re in
per
cent
age
poin
t
ICT manufacturing Software Publishing Telecommunications
Programming & consultancy Information service activities Repair of computers

TRADE IN ICT GOODS 65 Research Report 456
5. Trade in ICT goods
5.1. INTRODUCTION
While it seems that only a few advanced economies are producers of ICT goods, other countries in the world are major users demanding and importing ICT goods. By analysing the bilateral trade flows of ICT goods, the supply (or producer) side of ICT goods is linked to the demand (or user) side. Furthermore, trade policy measures play an important role in the development of bilateral trade flows. In this section we provide a descriptive analysis of tariffs and various types of non-tariff measures (NTMs) imposed on the global bilateral trade flows of ICT goods. Technical barriers to trade (TBTs) from two sources – the WTO and UNCTAD – are used to provide a comprehensive analysis of the trade policies targeting ICT goods. We will focus on how the EU27 differs from other countries in the world in terms of imports, exports and trade policy measures.
Global production structures in the ICT industry have implications for the trade in ICT products too. The liberalisation of trade and the globalisation process have led to the fragmentation of production across the world. US producers of ICT have established their manufacturing lines in countries with lower costs of production factors, such as the South and East Asian economies. This has led to rapid employment growth among technicians and low-skilled workers and gross output growth in China, South and East Asia, and some East European countries. In the meantime, since the conclusion of the Information Technology Agreement by the members of the WTO in December 1996, tariffs levied on the import of ICT goods have been reduced substantially. However, the use of regulatory NTMs, which adjust the standards and regulations in the importing product market, has been on the rise. These developments mean that the global value chains for the production of ICT goods are more closely intertwined than ever before. The production process of an ICT product is spread over numerous countries, and values are added in several stages of production while crossing several borders via trade. For instance, semiconductors are major intermediate inputs that are used not only in the production of final ICT goods but also of many other products, such as automobiles and machinery, for example. As these semiconductors are produced in only a few countries hosting superstar ICT firms, the border closures caused by the COVID-19 pandemic have resulted in the recent shortage of semiconductors, illustrating the importance of smooth and frictionless trade in ICT goods.
While middle-income trap countries are feeling the slowdown in economic growth, the US superstars have been gaining in value by utilising their productive capacities, thus pushing the technology even further. As also discussed in the previous chapter, the major value added in the sector is still produced in the company headquarters in the US, where R&D expenditures are spent on facilitating the innovation process by high-skilled scientists stimulating the technological advancements in the sector. This is often reflected in the registration of new patents, which may be sold or transferred as intangible assets to the subsidiaries to maintain the level of competitive innovation and produce new products with new procedures.
In this chapter we provide a comprehensive descriptive analysis of the development of trade in ICT goods and the trade policy measures imposed at a detailed product level. In doing so, careful distinctions are made between trade in intermediate goods (e.g. Electronic components or

66 TRADE IN ICT GOODS Research Report 456
semiconductors), capital goods (e.g. computers) and final consumption goods (e.g. consumer electronics). UNCTAD has recently classified ICT goods in its Harmonised System (HS) revision 2012.19 These goods are classified in five broad categories: Computers and peripheral equipment, Communication equipment, Consumer electronic equipment, Electronic components, and Miscellaneous. To ensure accuracy regarding the exports of ICT goods using this UNCTAD classification, one can use the trade data starting from 2012, as concordance tables from HS 2012 to earlier HS revisions (e.g. HS 1996) do not give a one-to-one product for these ICT goods.
The global demand for digitalisation has been the main driver of trade in ICT goods. Figure 28 depicts the worldwide exports of ICT goods in US dollars by five product categories and the share of ICT exports in total exports over the period 2012–2018. In 2018 exports of ICT goods stood at about USD 2trn, which marks a 50% increase since 2012, whereas growth in total global exports during these seven years was only 18%. Thus, the share of ICT in total exports increased from 8.7% in 2012 to 10.9% in 2018, which is depicted in the right-hand-side (rhs) axis in Figure 28. However, corresponding the HS codes of these ICT goods from revision 2012 to revision 2000, UNCTAD shows that the share of exports of ICT in total exports at the time of the dot-com boom in 2000 was at its highest level of 16.1%.20
As illustrated in Figure 28, the largest category of exports in ICT are Electronic components, whose share in total ICT exports rose from 28% in 2012 to 35% in 2018. Electronic components are intermediate inputs, such as technologically advanced semiconductors, which are used in many other ICT goods and sectors. The second major category in ICT exports is Communication equipment, which accounted for around 27% of ICT exports in 2018. Sensitive and political issues surrounding the production of this communication equipment, and the need to maintain privacy and security despite the surveillance of these products by giant Chinese tech firms such as Huawei and ZTE and US tech producers such as Apple or Google, have become a challenging obstacle on the path of China-US diplomacy (Segal, 2018). The third major category of exports relates to Computers and peripheral equipment. Total exports of this important ICT capital grew from USD 402bn in 2012 to USD 489bn in 2018. However, its share in total ICT exports declined from 30% to 24% over the same period. This decline could be the result of the digitalisation era, which started at the beginning of this century with a large initial investment in these goods by households and businesses and has gradually become a steady investment in US dollar terms. Consumer electronic equipment is the next important category of ICT exports and covers various electric appliances, such as headphones, radio, video cameras and monitors. Total exports of these products almost stagnated during the period of analysis, whereas its share in total ICT exports dropped from 14% in 2012 to only 9% in 2018. The smallest category of ICT exports is Miscellaneous, whose share in total ICT exports has been hovering around 4% during the period of analysis. For instance, solid-state, non-volatile data storage, which is usually referred to as the read-only memory (ROM) of a computer, is one of the few products in this category. Lasers, aerials and media for sound recording are other products in this category.
19 https://unctadstat.unctad.org/EN/Classifications/DimHS2012Products_Ict_Hierarchy.pdf 20 https://unctad.org/en/pages/newsdetails.aspx?OriginalVersionID=2007&Sitemap_x0020_Taxonomy=UNCTAD%20Home

TRADE IN ICT GOODS 67 Research Report 456
Figure 28 / Worldwide exports of ICT goods, billion USD by product category; share in total exports, 2012–2018
Sources: WITS; COMTRADE; UNCTAD; authors’ elaboration.
5.2. GEOGRAPHICAL PATTERNS
5.2.1. Main exporters
In the next section we investigate the geographical distribution of the 20 top exporters of ICT goods. In Figure 29 we see that Asian countries are indeed the major exporters of these products. As mentioned above, the large inflows of FDI into Southeast Asia led to the establishment of large producers of high-tech ICT products. China was the top exporter with ICT goods worth USD 655bn in 2018, which was around 26% of its total goods exports. As Figure 30 illustrates, 37% of these Chinese ICT exports consisted of Communication equipment, 32% of Computers and peripheral equipment, 18% of Electronic components, 11% of Consumer electronic equipment and 2% of Miscellaneous. This highlights just how diversified China is in the production of these goods.
The EU27 as a whole exported ICT goods worth about USD 100bn in 2018, ranking it only fifth among the largest exporter of these goods after China, Hong Kong, South Korea and Singapore. It is important to note that this figure excludes intra-EU trade; if intra-EU trade is included, the EU27 is ranked third after Hong Kong. Only about 28% of the EU’s total goods exports consist of ICT exports, which reveals a much weaker comparative advantage with respect to other Asian top exporters, namely Hong Kong with a 54% share of ICT exports in total exports, Vietnam with 33% and Malaysia with 32%. However, as Figure 30 shows, exports of ICT goods from the EU27 are also more diversified across the four main categories. By looking at the distribution of export categories among the member states, Figure 30 indicates that exports of ICT are quite diversified among the EU economies, whereas Asian countries specialise mostly in exports of Electronic components. Exports of Electronic components account for 74% and 71% of total ICT exports from Singapore and South Korea, respectively. This shows that Southeast Asian countries have a comparative advantage in supplying these technologically advanced intermediate inputs to the global factory of ICT goods. As these countries are geographically distant from
8.0%
8.5%
9.0%
9.5%
10.0%
10.5%
11.0%
45
145
245
345
445
545
645
2012 2013 2014 2015 2016 2017 2018
SHAR
E IN
ICT
IMPO
RTS
IN %
BILL
ION
USD
Share of ICT in total exports - rhs Computers and peripheral equipment
Communication equipment Consumer electronic equipment
Electronic components Miscellaneous

68 TRADE IN ICT GOODS Research Report 456
the EU and the US, the COVID-19 pandemic has caused severe disruptions to the supply of these crucial components.
Figure 29 / Top 20 exporters of ICT goods, billion USD by product category; share of ICT exports in total exports, 2018
Sources: WITS; COMTRADE; UNCTAD; authors’ elaboration.
Figure 30 / Diversification of exports of ICT goods by categories of 20 top exporters in 2018
Sources: WITS; COMTRADE; UNCTAD; authors’ elaboration.
0%
10%
20%
30%
40%
50%
60%
0
100
200
300
400
500
600
700
Shar
e of
ICT
expo
rts in
tota
l exp
orts
in %
Billio
n U
SD
Computers and peripheral equipment Communication equipment
Consumer electronic equipment Electronic components
Miscellaneous Share of ICT in total exports - rhs
0%
10%
20%
30%
40%
50%
60%
70%
80%
90%
100%
Shar
e in
tota
l IC
T ex
ports
in %
Computers and peripheral equipment Communication equipment Consumer electronic equipment
Electronic components Miscellaneous

TRADE IN ICT GOODS 69 Research Report 456
5.2.2. Main importers
While the data on the top exporters tell us where the ICT goods are produced, data on the top importers indicate the utilisation of ICT goods on the demand side. The Top 20 importers of ICT goods according to their imports in each product category and the share of ICT imports in their total imports are presented in Figure 31. The US as the top importer accounted for ICT goods worth USD 335bn in 2018, which equates to about 13% of total US goods imports. Figure 32 shows that 37% of these imports consisted of Computers and peripheral equipment, followed by Communication equipment with 34%. Assembly lines of Apple products such as iPhones, iPads and MacBooks in China and East Asia are prime examples of the type of products that reflect the large imports of ICT goods into the US, especially from the leading category of Computers and peripheral equipment.
As the second-largest importer, Hong Kong’s imports of ICT goods in 2018 made up about 48% of its total imports and were worth USD 299bn. It is evident that Hong Kong is a major factory of ICT goods, as half of its imports and exports consist entirely of ICT goods and its total trade in ICT goods accounted for about 170% of its GDP in 2018. China is the third-largest importer of ICT goods with USD 268bn, which corresponds to about 13% of its total imports. The most interesting fact about Chinese trade in ICT goods is that 72% of its imports consist of Electronic components, while imports of Communication equipment and Computers and peripheral equipment account for 11% and 9%, respectively. Again, this points to the importance of China as a global factory of ICT goods at the centre of global value chains. In fact, China imports major intermediate inputs in the form of Electronic components from other producers such as South Korea, Singapore and Japan in Southeast Asia and from advanced economies such as the US and the EU. These inputs are then assembled and turned into ICT final goods, which adds value to them and makes China the major exporter of ICT goods. It is worth mentioning that during the US-China trade war and after the sanctioning of ZTE by the US administration in April 2018 the Chinese company was forced to cease some of its major production operations due to the lack of supply of microchips from US producers.
Figure 31 / Top 20 importers of ICT goods, billion USD by product category; and share of ICT imports in total imports, 2018
WITS; COMTRADE; UNCTAD; authors’ elaboration.
0%
10%
20%
30%
40%
50%
60%
050
100150200250300350400
Shar
e of
ICT
impo
rts in
tota
l im
ports
in %
Billio
n U
SD
Computers and peripheral equipment Communication equipment
Consumer electronic equipment Electronic components
Miscellaneous Share of ICT in total imports - rhs

70 TRADE IN ICT GOODS Research Report 456
Figure 32 / Diversification of imports of ICT goods by categories, of 20 top importers in 2018
Sources: WITS; COMTRADE; UNCTAD; authors’ elaboration.
The EU27 is the fourth-largest importer of ICT products from other countries around the world. In fact, when intra-EU27 trade is included, the EU27 is the largest importer in the world. While 28% of extra-EU27 exports were accounted for by ICT goods in 2018, only about 11% of total extra-EU27 imports of goods were in ICT. In 2018 the EU27 imported ICT goods worth USD 257bn but only exported ICT goods worth USD 100bn, making it one of the many countries in the world with a trade deficit in ICT goods. Only 12 countries21 had a positive trade balance in ICT goods in 2018, four of which are members of the EU.
The trade balance in ICT goods of some selected countries is depicted in Figure 33. It shows that the US had the largest trade deficit in ICT goods in 2018 at USD 271bn, equivalent to about 6.7% of its total trade. The EU27 had the second-largest trade deficit in ICT goods at USD 156bn, which corresponds to about 5.6% of its total trade. Germany, the largest economy in the EU, had a USD 28bn trade deficit in this sector (about 1% of its total trade), while France, the next-largest economy, had a USD 16bn deficit (about 1.3% of its total trade). In fact, all EU 27 economies, with the exception of Czechia, the Slovak Republic, Ireland and Malta, recorded trade deficits in this sector, which may indicate their lack of competitiveness in the global ICT market. However, China, South Korea and Hong Kong enjoyed large trade surpluses of USD 387bn, USD 97bn and USD 10bn, respectively, in the ICT sector.
21 These countries are China, Czechia, Ireland, Israel, Korea, Rep., Malaysia, Malta, Philippines, Singapore, Slovak Republic, Thailand, Vietnam
0%
10%
20%
30%
40%
50%
60%
70%
80%
90%
100%
Shar
e in
tota
l IC
T im
ports
in %
Computers and peripheral equipment Communication equipment Consumer electronic equipment
Electronic components Miscellaneous

TRADE IN ICT GOODS 71 Research Report 456
Figure 33 / Trade balance in ICT goods relative to total trade in selected countries, 2018
Sources: WITS; COMTRADE; UNCTAD; authors’ elaboration.
5.3. TRADE POLICY MEASURES FOR ICT GOODS
5.3.1. Tariffs levied against ICT goods
In this sub-section we give an overview of the tariffs levied against the exports of ICT goods in the world. Figure 34 presents the development of the tariffs levied on ICT goods traded bilaterally by all non-EU27 countries and the EU27 countries separately over the period 2012-2018. Simple averages are made on all bilateral flows including zero trade flows, while trade values are used as the weights in the calculation of weighted tariffs. As the figure shows, simple average tariffs imposed by non-EU27 countries on these products declined from around 7.15% in 2012 to 6.47% in 2018 on all products. However, trade-weighted tariffs imposed by non-EU27 countries increased from 1.7% in 2012 to 2.5% in 2018, with a slight peak of 3.3% in 2015. The reason why weighted tariffs show a smaller value than simple tariffs is that exporters of products direct their exports endogenously through the tariff lines with the lowest tariff costs. Furthermore, when comparing the non-EU27 tariffs with the tariffs imposed by the EU27, one can observe that the latter are much smaller than the former. In fact, import-weighted average tariffs
-8% -6% -4% -2% 0% 2% 4% 6% 8% 10%
United StatesEU27India
IcelandUnited Kingdom
CyprusRomania
FinlandNorwayCroatia
SpainPortugalSweden
LuxembourgGreeceJapan
DenmarkFrance
ItalySwitzerland
BulgariaGermanySlovenia
AustriaLithuania
NetherlandsPolandLatvia
BelgiumEstonia
HungaryCzechiaSlovakia
Hong KongIreland
MaltaSouth Korea
China

72 TRADE IN ICT GOODS Research Report 456
imposed by the EU on ICT goods hovered around only 0.2% during this period, while the simple average tariff was about 1.9%. This is mostly because the EU is one of the major members of the Information Technology Agreement concluded in December 1996.
Figure 34 / Development of tariffs levied on ICT goods traded bilaterally during 2012-2018, EU27 versus non-EU27
Sources: WITS; COMTRADE; UNCTAD; authors’ elaboration.
Figure 35 / Trade-weighted average tariffs levied on global bilaterally traded ICT goods, by product category, 2012-2018
Sources: WITS; COMTRADE; UNCTAD; authors’ elaboration.
Figure 35 represents the weighted tariffs of each product category traded bilaterally during the period 2012-2018. It shows that tariffs levied against exports of Consumer electronic equipment are higher than tariffs imposed on other products. The simple average of tariffs levied against exports of Consumer electronic equipment during the period is around 10%, which is much higher than the simple average tariffs
0%
1%
2%
3%
4%
5%
6%
7%
8%
2012 2013 2014 2015 2016 2017 2018
Non-EU27 simple average tariffs Non-EU27 weighted average tariffs
EU27 simple average tariffs EU27 weighted average tariffs
0%
1%
2%
3%
4%
5%
6%
7%
2012 2013 2014 2015 2016 2017 2018
Tarif
fs in
%
Global weighted average tariffs Computers and peripheral equipment
Communication equipment Consumer electronic equipment
Electronic components Miscellaneous

TRADE IN ICT GOODS 73 Research Report 456
imposed on other ICT products, whereas the weighted tariffs against the exports of these products stand at around 4.5%, with the peak of 5.9% in 2015. While simple average tariffs on these products did not rise and experienced no peak in 2015, a peak of weighted average tariffs in 2015 against the exports of Consumer electronic equipment indicates that in 2015 trade flows were directed at countries and tariff lines with higher tariffs. Following the agreements of the WTO that is treating the most-favoured nation (MFN) tariffs imposed by the developed economies, developing countries are able to impose larger tariffs than developed countries do. Therefore, it seems that in 2015 more developing countries have been importing goods in ‘Consumer electronic equipment’ that has led to a peak in trade-weighted tariffs.
5.3.2. Investigation of TBTs imposed on ICT goods
Regulatory NTMs, such as TBTs embedding technical regulations and standards concerning health, safety, environmental quality etc., could be the most important trade policy measures with a quality impact on ICT products traded globally. Therefore, a detailed study of quality NTMs imposed on ICT goods would indicate their policy implications. Two sources of NTM data from the WTO and UNCTAD will be used here to provide a comprehensive analysis of these measures. UNCTAD collects NTM data with the help of national statistics that gather NTMs from official gazettes and regulative updates. While these domestic NTMs may be available in each country’s customs and trade offices, they may not be easily accessible to exporters, causing trade frictions. Therefore, the efforts made by UNCTAD to collect such databases have improved transparency significantly. The NTM database22 published by the WTO Secretariat is based on the notifications received from its members. Thus, these notifications represent the official announcement by member countries of the NTMs they have imposed. WTO agreements such as the TBT agreement oblige members to notify their NTMs to the WTO Secretariat to increase transparency in the imposition of trade policy measures and to improve smooth and frictionless trade across the globe.
Figure 36 presents the development of TBTs collected by UNCTAD that are imposed against the imports of ICT goods by non-EU27 countries and the EU27 over the period 2012–2018. The average stock number of TBTs imposed on each 6-digit product traded bilaterally since 2012, including zero trade flows, averaged over the sample of countries is shown on the rhs axis. As can be seen, the average stock number of TBTs imposed by non-EU27 countries increased from 0.008 TBTs per product in 2012 to 0.4 per product in 2018. The major increases happened in 2015 and 2016. However, the average stock number of TBTs imposed by the EU27 increased from 0.47 in 2012 to 5 in 2018. This is mainly due to the frequent imposition by the EU27 of regulatory NTMs to regulate the single market.
In addition to the average number of TBTs, two other measures of TBTs are also used and depicted in this graph. The frequency index (FI) of each country 𝑖𝑖 in year 𝑡𝑡 is calculated as the number of its tariff lines affected by TBTs divided by the total number of import tariff lines, including zero trade flows, as follows:
𝐹𝐹𝐹𝐹𝑖𝑖𝑖𝑖 =∑ ∑ 𝑇𝑇𝑇𝑇𝑇𝑇𝑖𝑖𝑖𝑖ℎ𝑖𝑖𝐷𝐷 𝑉𝑉𝑖𝑖𝑖𝑖ℎ𝑖𝑖𝐷𝐷𝐷𝐷
ℎ𝑖𝑖
∑ ∑ 𝑉𝑉𝑖𝑖𝑖𝑖ℎ𝑖𝑖𝐷𝐷𝐷𝐷ℎ𝑖𝑖
(1)
22 This database can be found here: http://i-tip.wto.org/goods/default.aspx?language=en. The data have been improved by Ghodsi et al. (2017), who found the missing HS codes for many of the NTMs through fuzzy text matching algorithms.

74 TRADE IN ICT GOODS Research Report 456
where 𝑇𝑇𝑇𝑇𝑇𝑇𝑖𝑖𝑖𝑖ℎ𝑖𝑖𝐷𝐷 is a dummy variable taking the value of 1 if there is a TBT imposed by importer 𝑖𝑖 against the exports of product ℎ from exporting country 𝑗𝑗 in year 𝑡𝑡; where 𝑉𝑉𝑖𝑖𝑖𝑖ℎ𝑖𝑖𝐷𝐷𝐷𝐷 is a dummy variable equal to 1 for a tariff line of exporting product ℎ from exporting country 𝑗𝑗 to importer 𝑖𝑖 in year 𝑡𝑡. Thus, Figure 36 depicts the average of the FI of all importers of ICT goods.
The coverage ratio is calculated similar to the frequency index, with an additional trade weight for each tariff line. Thus, the coverage ratio (CR) of each country 𝑖𝑖 in year 𝑡𝑡 is calculated as follows:
𝐶𝐶𝐶𝐶𝑖𝑖𝑖𝑖 =∑ ∑ 𝑇𝑇𝑇𝑇𝑇𝑇𝑖𝑖𝑖𝑖ℎ𝑖𝑖𝐷𝐷 𝑉𝑉𝑖𝑖𝑖𝑖ℎ𝑖𝑖𝐷𝐷
ℎ𝑖𝑖
∑ ∑ 𝑉𝑉𝑖𝑖𝑖𝑖ℎ𝑖𝑖𝐷𝐷ℎ𝑖𝑖
(2)
where 𝑉𝑉𝑖𝑖𝑖𝑖ℎ𝑖𝑖𝐷𝐷 represents the export value of product ℎ from exporting country 𝑗𝑗 to importer 𝑖𝑖 in year 𝑡𝑡. Figure 36 also depicts the average CR of all importers of ICT goods.
As depicted in Figure 36, both the average FI and the average CR of TBTs in ICT goods follow a similar pattern over time as average numbers of TBTs. In 2015 and 2016 the FI of TBTs increases at a faster rate than the CR of TBTs or the average number of TBTs. This suggests that in 2015 more tariff lines (or products) in ICT goods are affected by TBTs. However, although the CR (and FI) of TBTs imposed by non-EU27 countries is still smaller than the CR (and FI) of TBTs imposed by the EU27, the magnitudes are much closer for the CR (FI) than for simple averages. This indicates that larger import values are linked to the TBTs imposed by the non-EU27, which may hint at the trade promotion of TBTs imposed globally.
Figure 36 / Development of TBTs collected by UNCTAD imposed on ICT goods traded bilaterally during 2012–2018
Sources: UNCTAD (2017); COMTRADE; authors’ elaboration.
0
1
2
3
4
5
6
-
0.05
0.10
0.15
0.20
0.25
0.30
0.35
0.40
2012 2013 2014 2015 2016 2017 2018
Aver
age
stoc
k nu
mbe
r of T
BTs
Cov
erag
e ra
tio a
nd fr
eque
ncy
inde
x of
TB
Ts
Non-EU27 coverage ratio of TBT Non-EU27 frequency index of TBT
EU27 coverage ratio of TBT EU27 frequency index of TBT
Non-EU27 average TBTs - rhs EU27 average TBTs - rhs

TRADE IN ICT GOODS 75 Research Report 456
Figure 37 / Development of TBTs notified to the WTO imposed on ICT goods traded bilaterally during 2012–2018
Sources: WTO I-TIP; COMTRAD; authors’ elaboration.
Figure 37 shows the development of TBTs notified to the WTO imposed by non-EU27 countries and the EU27 on ICT goods traded bilaterally during the period 2012-2018. As can be observed on the rhs axis, the average stock number of TBTs notified since 1995 to the WTO that are imposed on ICT goods at the beginning of the period is 1.8 per tariff line for non-EU countries and equal to 5.5 for EU27 countries. That is much higher than the average stock number of TBTs collected by UNCTAD, which is explained by the fact that WTO members have been notifying their NTMs to the WTO since 1995 and there were some more TBTs in existence prior to 2012. Such information is missing in the data collected by UNCTAD. Due to the lower initial value of NTMs collected by UNCTAD, the average number of TBTs listed in the UNCTAD database in 2018 is 13 time larger than in 2012, compared with the number of WTO notifications, which is only twice as large. In other words, we can observe from the WTO notifications that the average stock number of TBTs imposed by non-EU countries per ICT tariff line increased from 1.8 in 2012 to only 3.3 in 2018. However, since the EU has been implementing NTMs more regularly, the average stock number of TBTs imposed by the EU27 increased from 5.5 in 2012 to 29.5 in 2018.
Moreover, the average number of TBTs notified to the WTO per ICT tariff line increased more than the CR and FI of these TBTs between 2012 and 2018. This suggests that the TBTs notified to the WTO increased the stringency of the regulations on the existing affected tariff lines. However, we observe that the FI and CR of these TBTs also increased, which suggests that new tariff lines and tariff lines with larger export values are affected by these TBTs over time.
Figure 38 presents the average number of TBTs imposed on ICT goods traded bilaterally by product category over the period 2012-2018 as reported by UNCTAD. It shows that goods in the Communication equipment category were targeted by TBTs more than any other product category. Figure 39 presents the average number of TBTs notified to the WTO. These TBTs, too, were targeted at goods in the Communication equipment category more than at any other ICT category. Both graphs show that the second most targeted category was Consumer electronic equipment. While Computers and peripheral
0
5
10
15
20
25
30
35
- 0.10 0.20 0.30 0.40 0.50 0.60 0.70 0.80 0.90 1.00
2012 2013 2014 2015 2016 2017 2018
Aver
age
stoc
k nu
mbe
r of T
BTs
Cov
erag
e ra
tio a
nd fr
eque
ncy
inde
x of
TB
Ts
Non-EU27 coverage ratio of TBT Non-EU27 frequency index of TBT
EU27 coverage ratio of TBT EU27 frequency index of TBT
Non-EU27 average TBTs EU27 average TBTs

76 TRADE IN ICT GOODS Research Report 456
equipment was the next category most affected by TBTs according to UNCTAD, it is the last category affected by TBTs as reported by the WTO.
Figure 38 / Average stock number of TBTs collected by UNCTAD imposed on ICT goods traded bilaterally, by product category, 2012–2018
Sources: UNCTAD (2017); COMTRADE; authors’ elaboration.
Figure 39 / Average number of TBTs notified to the WTO imposed on ICT goods traded bilaterally, by product category, 2012-2018
Sources: WTO I-TIP; COMTRADE; authors’ elaboration.
-
0.2
0.4
0.6
0.8
1.0
1.2
1.4
1.6
2012 2013 2014 2015 2016 2017 2018
Aver
age
stoc
k nu
mbe
r of T
BT
Average TBTs Computers and peripheral equipment
Communication equipment Consumer electronic equipment
Electronic components Miscellaneous
2
3
4
5
6
7
8
9
10
2012 2013 2014 2015 2016 2017 2018
Aver
age
stoc
k nu
mbe
r of T
BT
Average TBTs Computers and peripheral equipment
Communication equipment Consumer electronic equipment
Electronic components Miscellaneous

SUMMARY AND CONCLUSIONS 77 Research Report 456
6. Summary and conclusions
The main findings of the report can be summarised as follows. Section 2 provides some descriptive information about the relative importance of the accumulation of ICT capital and software and database capital asset types on the relative growth performance. From a growth accounting perspective, the contributions to growth of these assets are relatively small, contributing around 5-10% to overall growth. This analysis has also highlighted, first, the relatively lower importance of these assets to growth in European countries compared with Japan and the US, and second, that the contribution has become smaller in the post-crisis period (2010-2016) compared with the years before the global financial crisis. Nonetheless, in the econometric analysis growth of ICT assets (together with intangible economic competencies assets) has been identified as a significant driver of growth. However, such an analysis does not account for where the respective ICT assets are produced or from where these are imported. This has been studied in more detail in the next sections.
Section 3 shows that the ICT sector qualifies as a lead sector characterised as a sector that is (i) expanding in terms of (real) value added, and (ii) generates an increasing number of jobs, while (iii) displaying above-average productivity levels and high R&D rates. These attributes provide a good description of the ICT sector – including its two main sub-components, ICT manufacturing and ICT services – at the global level. When looking at the ICT sectors in the main producing countries, this general characterisation has to be qualified in the EU and the other countries of the economic triad (US and Japan) because their ICT sectors were unable to create significant amounts of additional employment over the period 2000-2016. Apart from the high productivity levels observable in the ICT sector, this lack of significant employment creation can also be attributed to the functional division of labour in the global economy (resulting from the emergence of global value chains).
What is troubling from an EU perspective is the fact that it lags behind other advanced main ICT producing countries, notably the US, in terms of the sector’s share in the economy, labour productivity and R&D intensity. Particularly pronounced is the productivity differential vis-à-vis the US, where the data suggest a 40% gap. Staying at the technological frontier and reducing the productivity advantage of the US is an issue that has, rightly or wrongly, plagued European policy makers since the 1980s at the latest. According to the PREDICT data, the realm of ICT is definitely an area where such concerns are justified.
Zooming inside the EU economy and looking at individual member states has revealed that the comparatively weak position of the European ICT sector is partly attributable to the fact that none of the three largest EU economies (Germany, France, Italy) and the UK show a strong specialisation in the ICT sector. Moreover, there are very large productivity differentials within the EU, which poses a particular challenge for the bloc’s cohesion objective. On the upside, these productivity differentials also imply that the productivity and R&D gap of the leading EU member states is smaller than for the EU as a whole, which is advantageous in the context of international competitiveness.
Similar to the aggregate analysis at the sector level, it is again evident at the firm level that ICT firms in the US are the major leaders in global ICT sectors in both manufacturing and services, which is
78 SUMMARY AND CONCLUSIONS Research Report 456
highlighted in Section 4. Apple, Microsoft, AT&T, Alphabet (Google) and Automatic Data Processing are all superstars in the US, enjoying the largest global market share in terms of turnover in their two-digit NACE sectors. Some market leaders, such as Samsung Electronics in South Korea, Hon Hai Precision Industry in Taiwan and Huawei Technologies in China are among the five largest firms in the manufacture of ICT. However, the largest firms in the EU are lagging far behind in terms of market share compared with these global giants. It is also evident that a major share of capital and labour employed in the ICT two-digit sectors is allocated to the global giants. Therefore, as they are abundant in resources, they manage to allocate more resources to R&D activities, which enables them to push the frontiers of technology by introducing new products and novel production technologies. While the former helps them to gain market share and increase their revenues, the latter makes them more productive, efficient and more competitive in the global market.
While the average size of firms in the US is much larger than in other parts of the world, the size of large firms with at least 250 employees is relatively similar in the EU27, Japan and India in terms of turnover. However, after the US the largest turnover is achieved by large firms in South Korea and other Southeast Asian countries, while Chinese ICT firms are by comparison much smaller than in the rest of these regions. This indicates that firms in the EU may need to improve their competitiveness to catch up with other major ICT producers. As experienced by the global superstars, the way to achieve such a target could be by allocating more financial resources and expanding the productive and innovative capacities at the firm level. It is evident that while global superstars have much larger R&D expenditures than the EU27 superstars, in the EU27 this R&D expenditure is more equally distributed across ICT producers. The problem is that not every R&D activity leads to a positive and innovative outcome, which suggests that R&D activities in the EU are not efficiently allocated to the most pioneering and productive firms.
Publishing patents is considered to be the main indicator of successful innovative efforts through R&D activities (Van Hove, 2010). Moreover, inventors of novel technologies usually invest larger resources to get their patents granted after publishing (Davies et al., 2020), which ensures better protection for their intellectual property rights in courts. A recent paper by Exadaktylos et al. (2021) analyses the impact of patenting on the performance of firms in the ICT sector, using the same dataset as the one used in this report. The results suggest that there is a strong correlation between the number of granted patents that are owned by the ICT firm and its subsidiaries and the market share of the firm and its labour productivity. However, using the diff-in-diff technique to analyse the causation from patent to these performance indicators, the results indicate a direct significant impact of patenting only on the market share of firms that were patenting for the first time during the period 2009-2017. This means that all superstar firms which had innovated earlier and published patents earlier are excluded from the analysis, which is much more relevant for small and newly established ICT firms that are starting up in the EU. When the innovative activity of a firm leads to its first successful patent (and continues with more patents in the future), the firm gains a significant market share, while its productivity is not necessarily affected in a significant manner that is in line with past empirical studies (Balasubramanian and Sivadasan, 2011; Andrews et al., 2014). This may be related to the fact that knowledge secrecy is more important in the process than product innovation (Levin et al., 1987). Therefore, a firm aiming to improve its production process through innovation would not commercialise these new techniques by publishing a patent to prevent competitors from receiving information that could lead to more efficient production. However, introducing new products through patenting leads to higher revenues (Balasubramanian & Sivadasan, 2011) and hence a larger market share. In that case, the optimal strategy for a firm is to secure its knowledge through patenting. Therefore, the results indicate a product

SUMMARY AND CONCLUSIONS 79 Research Report 456
innovation rather than a process innovation in the ICT sector. For example, the introduction of the simplified application of a software that can work in one or several operating systems may potentially lead to new subscribers. When the software is novel and it can receive a grant from the official patent offices, then the firm should expect a significant rise in subscribers, demand and operating turnover.
Overall, global superstars, which are mostly located in the US, are pushing the frontiers of technology, and for that they enjoy large financial dividends thanks to their large global market shares. These superstars also ensure the strategic autonomy of their home countries over the production of the digital sector, the beating heart of the global economy, whose shortages have been felt deeply in many sectors and countries during the COVID-19 pandemic and the consequent border closures. Therefore, to improve the competitiveness of firms, start-ups and emerging rising stars in this sector, the policy makers at the EU may need to direct resources to more efficient and more innovative ICT firms. This could help them to introduce new products and services and consequently enable them to invest in efforts to successfully receive grants for their patents. The latter could also be supported by introducing patent boxes and giving tax credits after a successful patent application (Davies et al., 2022). As the empirical evidence also shows, such a policy will increase the global market share of EU-based firms, so that they can catch up with the global superstars and consequently improve their strategic autonomy over this vital sector.
Finally, the resulting trade patterns have been studied in Section 5. Overall, we can observe that Southeast Asian economies are the major exporters of ICT goods, with some of them also enjoying a trade surplus in this sector. The US and the EU27 are the major importers of ICT goods. Moreover, since the conclusion of the Information Technology Agreement by the members of the WTO in December 1996, tariffs imposed on the imports of ICT goods have been reduced to their lowest level by many member states. However, the use of regulatory NTMs, and in particular TBTs, has been on the rise.
From a trade policy perspective, using a longer time series of imports of ICT goods, Ghodsi (2021) finds that tariffs have no statistically significant impact on imports of ICT goods during the period 1996-2018. However, TBTs have a positive impact on imports of ICT goods in a statistically significant manner. The trade-stimulative impact of TBTs is more significant on the imports of goods in the Communication equipment category. This suggests that TBTs targeting these goods generate positive externalities, which may arise from the convergence of the regulatory frameworks across countries that improves the conformity of technical standards on communications equipment across various countries. Furthermore, keywords cited in TBT notifications may indicate the objectives of these regulatory NTMs. The empirical evidence suggests that the impact of TBTs on imports of ICT goods is very heterogenous based on their objectives. For instance, TBTs citing keywords on ‘conformity assessment’ or ‘harmonisation’ stimulate import values of ICT goods across product categories, while TBTs citing keywords such as ‘food standards’ or ‘nutrition information’ that target a universal set of products and also ICT goods hamper imports. It could be argued that some TBTs may act as a barrier to trade, while some others may stimulate trade.
The econometric results presented by Adarov and Ghodsi (2021) show that stringent regulatory TBTs imposed by a country increase the amount of cross-border investment by global MNEs active in the ICT sector, which indicates a regulatory barrier-jumping motive of FDI. This impact is much smaller for the cross-border investment by all global MNEs in all manufacturing sectors. However, trade-restrictive TBTs and sanitary and phytosanitary (SPS) measures imposed by the home of the MNE that is active in
80 SUMMARY AND CONCLUSIONS Research Report 456
the ICT sector reduces the amount of cross-border investment in the host economy. This points to a barrier against the vertical integration of the production process by the MNE. Therefore, instead of imposing trade restrictive NTMs to foster both trade and cross-border investment, which usually leads to retaliation by trading partners, policy makers should aim at designing frameworks to reduce unnecessary obstacles on trade and improve the mechanisms through which the harmonisation of standards and regulatory NTMs could facilitate the use of ICT goods produced in any country. Such mechanisms could best be designed in multilateral agreements under the auspices of the WTO or through bilateral agreements that can improve the minimum set of standards and regulatory frameworks in other countries. As noted above, goods in the Electrical equipment category, such as semiconductors, are the most important intermediate inputs in the modern digitalised factory of the world. A harmonised set of standards and regulatory framework on the production side of these goods may eliminate unnecessary mismatches in product specifications and will lead to the diffusion of positive externalities, not only in the ICT sector but also in many other sectors in the global economy, which will have a substantial impact on fostering export-oriented growth.
These cross-country analyses of the ICT sector clearly indicate that the EU must step up its efforts to (i) accelerate the shift towards digital production methods and (ii) strengthen the ICT sector that produces the required technologies and services. That is at the heart of the challenge, and it will require moving from the policy formulation stage, where the EU scores highly, to the actual implementation of these policies. Defining an appropriate industrial mission (Mazzucato, 2018) that tackles the societal challenge of the digital transformation would be a first important step in this direction, the agreement on a series of Important Projects of Common European Interest (IPCEI) in the digital domain would be a second.

REFERENCES 81 Research Report 456
References
Acemoglu, D. and Restrepo, P. (2017), Robots and Jobs: Evidence from US Labor Markets. NBER Working Paper 23285, National Bureau of Economic Research, Cambridge, MA.
Acemoglu, D. and Restrepo, P. (2018), Artificial Intelligence, Automation and Work. NBER Working Paper 24196, National Bureau of Economic Research, Cambridge, MA.
Acker, O., Gröne, F. and Schröder, G. (2012), ‘The Global ICT 50: The Supply Side of Digitization’, Strategy and Business, Issue 68.
Acker, O., Gröne, F. and Schröder, G. (2016), ‘The New Game of Global Tech’, Strategy and Business, Issue 85.
Ackerberg, D. A., Caves, K. and Frazer, G. (2015), ‘Identification properties of recent production function estimators’, Econometrica, 83(6), 2411-2451.
Adarov A. and R. Stehrer (2019), Tangible and Intangible Assets in the Growth Performance of the EU, Japan and the US. Vienna Institute for International Economic Studies (wiiw) Research Report, No. 442, Vienna, October.
Adarov, A. and Ghodsi, M. (2021), Heterogeneous Effects of Non-tariff Measures on Cross-border Investments: Bilateral Firm-level Analysis, wiiw Working Paper No. 210, Vienna, September; https://wiiw.ac.at/heterogeneous-effects-of-non-tariff-measures-on-cross-border-investments-bilateral-firm-level-analysis-p-5922.html
Andrews, D., Criscuolo, C. and Menon, C., 2014, Do resources flow to patenting firms?:Cross-country evidence from firm level data, OECD Economics Department Working Papers No. 1127.
Arntz, M., Gregory, G. and Zierahn, U. (2016), The Risk of Automation for Jobs in the OECD Countries, OECD Social, Employment and Migration Working Papers No. 189
Autor, D. and A. Salomons (2018), Is Automation Labor-Displacing? Productivity Growth, Employment, and the Labor Share, Brookings Papers on Economic Activity, 49(1), 1-63.
Balasubramanian, N. and Sivadasan, J. (2011), ‘What happens when firms patent? New evidence from US economic census data, The Review of Economics and Statistics, 93 (1), 126–146.
Baldwin, R. and Lopez‐Gonzalez, J. (2015), ‘Supply‐chain Trade: A Portrait of Global Patterns and Several Testable Hypotheses’, The World Economy, 38(11), pp. 1682-1721.
Beaudry, C. and Schiffauerova, A. (2009), ‘Who's right, Marshall or Jacobs? The localization versus urbanization debate’, Research Policy, 38(2), 318-337.
Benages E., Hernández L., Mínguez C., Pérez J., Robledo J.C., Salamanca J., Solaz M., Cardona M., López-Cobo M., Righi R. and Samoili S. (2018), The 2018 PREDICT Dataset Methodology. Joint Research Centre, European Commission. https://ec.europa.eu/jrc/sites/jrcsh/files/jrc111922.pdf
Benzell, S.G, Kotlikoff, L.J., LaGarda, G. and J.D. Sachs (2015), Robots are us. Some economics of human replacement. NBER Working Paper Series 20941, National Bureau of Economic Research, Cambridge, MA.
Brander J.A. and Spencer B.J. (1985), ‘Export subsidies and international market share rivalry’, Journal of International Economics, 18, pp. 83–100.
Canarella, G. and Miller, S.M., (2018), ‘The determinants of growth in the US information and communication technology (ICT) industry: A firm-level analysis’, Economic Modelling 70 (2018): 259-271.

82 REFERENCES Research Report 456
Chiacchio, F., Petropoulos, G. and Pichler, D. (2018), The impact of industrial robots on EU employment and wages: A local labour market approach, Bruegel Working Papers.
Coad, A. and Rao, R. (2008), ‘Innovation and firm growth in high-tech sectors: A quantile regression approach’, Research Policy, 37(4), 633-648.
Coad, A., Segarra, A. and Teruel, M. (2016), ‘Innovation and firm growth: Does firm age play a role?’, Research Policy, 45(2), 387-400.
Dauth, W., Findeisen, S., Südekum, J. and Woessner, N. (2017), German Robots – The Impact of Industrial Robots on Workers, CEPR Discussion Paper No. 12306.
Davies, R.B., Kogler, D.F. and Hynes, R. (2020), Patent boxes and the success rate of applications, CESifo Working Paper No. 8375.
De Loecker, J. (2011), ‘Product differentiation, multiproduct firms, and estimating the impact of trade liberalization on productivity’, Econometrica, 79(5), 1407-1451.
Del Monte, A. and Papagni, E. (2003), ‘RandD and the growth of firms: empirical analysis of a panel of Italian firms’, Research Policy, 32(6), 1003-1014.
Eaton, J., Gutierrez, E. and Kortum, S. (1998), ‘European technology policy’, Economic Policy, 13(27), pp. 403-438.
European Commission (2009), Computers, electronic and optical products. Comprehensive sectoral analysis of emerging competences. http://ec.europa.eu/social/main.jsp?catId=103andlangId=en
European Commission (2018,) A Digital Agenda for Europe, COM(2010)0245 final, Brussels.
European Commission (2020a), Shaping Europe's Digital Future, Communication by the Commission, COM(2020)102 final, Brussels.
European Commission (2020b) A New Industrial Strategy for Europe, Communication by the Commission, COM(2020)102 final, Brussels.
European Political Strategy Centre (EPSC) (2019), ‘EU industrial policy after Siemens-Alstom: Finding a new balance between openness and protection’, Brussels. https://ec.europa.eu/epsc/sites/epsc/files/epsc_industrial-policy.pdf
Exadaktylos, D., Ghodsi, M. and Rungi, A. (2021), What Do Firms Gain from Patenting? The Case of the Global ICT Industry. https://ssrn.com/abstract=3897611 or http://dx.doi.org/10.2139/ssrn.3897611
Firgo, M., Mayerhofer, P., Peneder, M., Piribauer, P. and Reschenhofer, P. (2018), Beschäftigungseffekte der Digitalisierung in den Bundesländern sowie in Stadt und Land. Study of the Austrian Institute of Economic Research, Vienna, December 2018.
Force, CompNet Task (2014), Micro-based evidence of EU competitiveness: The CompNet database (No. 253), NBB Working Paper.
Foster-McGregor, N., Holzner, M., Landesmann, M., Pöschl, J., Stehrer, R. and Stöllinger, R. (2013), A ‘Manufacturing Imperative’ in the EU – Europe's Position in Global Manufacturing and the Role of Industrial Policy, wiiw Research Report No. 391, October.
Friedrich, R., Gröne, F., Koster, A. and Le Merle, M. (2011), ‘Measuring Industry Digitization: Leaders and Laggards in the Digital Economy’, Strategy& White Paper (originally published by Booz and Company). https://www.strategyand.pwc.com/gx/en/insights/2002-2013/measuring-industry-digitization/strategyand-measuring-industry-digitization-leaders-laggards-digital-economy.pdf
Geroski, P., Machin, S. and Van Reenen, J. (1993), ‚The profitability of innovating firms’, The RAND Journal of Economics, 198-211.

REFERENCES 83 Research Report 456
Ghodsi, M. (2021), Impact of Technical Barriers to Trade on the Trade in Goods in the Information and Communications Technology Sector: Differentiating by Aim of the Regulatory Measure, wiiw Working Paper No. 208, Vienna, September. https://wiiw.ac.at/impact-of-technical-barriers-to-trade-on-the-trade-in-goods-in-the-information-and-communications-technology-sector-differentiating-by-aim-of-the-regulatory-measure-p-5906.html
Ghodsi, M., Grübler, J., Reiter, O. and Stehrer, R. (2017), The Evolution of Non-tariff Measures and their Diverse Effects on Trade, wiiw Research Report No. 419.
Ghodsi, M., Reiter, O., Stehrer, R. and Stöllinger, R. (2020), Robotisation, Employment and Industrial Growth Intertwined Across Global Value Chains, wiiw Working Paper No. 177, April.
Ghodsi, M., Reiter, O., Stehrer, R. and Stöllinger, R. (2020), Robotisation, Employment and Industrial Growth Intertwined across Global Value Chains. Background Paper for Chapter 2 of UNIDO’s Industrial Development Report 2020, Inclusive and Sustainable Industrial Development Working Paper Series. https://www.unido.org/api/opentext/documents/download/16413727/unido-file-16413727
Giotopoulos, I. and Fotopoulos, G. (2010), ‘Intra-industry growth dynamics in the Greek services sector: Firm-level estimates for ICT-producing, ICT-using, and non-ICT industries’, Review of Industrial Organization, 36.1: 59-74.
Griffith, R., Harrison, R. and Van Reenen, J. (2006), ‘How special is the special relationship? Using the impact of US RandD spillovers on UK firms as a test of technology sourcing’, American Economic Review, 96(5), 1859-1875.
Hall, B.H. and Mairesse, J. (1995), ‘Exploring the relationship between RandD and productivity in French manufacturing firms’, Journal of Econometrics, 65(1), 263-293.
Haskel, J. and S. Westlake (2018), Capitalism Without Capital. The Rise of the Intangible Economy. Princeton and Oxford: Princeton University Press.
Hulten, C.R. (2001), Total Factor Productivity: A Short Biography, pp. 1-54. Chicago: University of Chicago Press.
IMF (2018), Measuring the Digital Economy, Staff Report.
Jorgenson, D., Ho, M.S. and Stiroh, K.J. (2005), Productivity – Information Technology and the American Growth Resurgence. Cambridge: MIT Press.
Joint Research Centre (2017), The 2017 PREDICT Key Facts Report: An Analysis of ICT RandD in the EU and Beyond, Joint Research Centre.
Katayama, H., Lu, S. and Tybout, J. R. (2009), ‘Firm-level Productivity Studies: Illusions and a Solution’, International Journal of Industrial Organization, 27(3):403–413
Koutroumpis, P., Leiponen, A. and Thomas, L.D.W. (2020), ‘Small is big in ICT: The impact of RandD on productivity’, Telecommunications Policy 44.1: 101833.
Krugman P (ed) (1986), Strategic Trade Policy and the New International Economics. Cambridge: MIT Press.
Landesmann, M. and Stöllinger, R. (2020), ‘The European Union’s Industrial Policy’, in: Oqubay, A., Cramer, C., Chang, H.-J. and Kozul-Wright, R. (eds.) The Oxford Handbook of Industrial Policy, Oxford: Oxford University Press.
Levin, R.C., Klevorick, A.K., Nelson, R.R. and Winter, S.G. (1987), ‘Appropriating the Returns from Industrial-Research and Development’, Brookings Papers on Economic Activity, 3, 783–831.
Levinsohn, J. and Petrin A. (2003), ‘Estimating production functions using inputs to control for unobservables’, The Review of Economic Studies, 70.2 (2003): 317-341.

84 REFERENCES Research Report 456
Mansfield, E. (1980), ‘Basic research and productivity increase in manufacturing’, The American Economic Review, 70(5), 863-873.
Mazzucato, M. (2018), Mission-oriented Research and Innovation in the European Union. A problem-solving approach to fuel innovation-led growth. Luxembourg: Publications Office of the European Union. https://ec.europa.eu/info/sites/info/files/mazzucato_report_2018.pdf.
OECD (2007), Information Economy and Sector Definition based on the International Standard Classification (ISIC 4), Working Party on Indicators for the Information Society, DSTI/ICCP/IIS(2006)2/FINAL, 5 May, Paris.
Olley, G.S. and Pakes A. (1996), ‘The Dynamics of Productivity in the Telecommunications Equipment Industry’, Econometrica, Vol. 64, No. 6, November.
Reinert, E.S. (2007), How Rich Countries Got Rich and Why Poor Countries Stay Poor. New York: Hachette Book Group.
Rennstich, J. (2008), The Making of a Digital World. The Evolution of Technological Change and How It Shaped Our World. London: Palgrave Macmillan.
Roemer-Mahler, A. (2013), ‘Business conflict and global politics: the pharmaceutical industry and the global protection of intellectual property rights’, Review of International Political Economy, 20 (1), 121–152.
Sachs, J.D., Benzell S.G. and LaGarda, G. (2015), Robot: Curse or Blessing? A Basic Framework, NBER Working Paper, Series 21091.
Stehrer, R., Bykova, A., Jäger, K., Reiter, O. and Schwarzhappel, M. (2019), Industry-level growth and productivity data with a special focus on intangible assets, Deliverable 3 for DG ECFIN project Contract No. 2018, ECFIN-116/SI2.784491; forthcoming as wiiw publication.
Stöllinger, R. (2019), Testing the Smile Curve: Functional Specialisation in GVCs and Value Creation, wiiw Working Paper No. 163, Vienna, February.
Syverson, C., 2011, ‘What determines productivity?’, Journal of Economic Literature, 49 (2), 326–65.
Timmer, M.P., Inklaar, R., O’Mahony, M. and Van Ark, B. (2010), Economic Growth in Europe – A Comparative Industry Perspective. Cambridge: Cambridge University Press.
UNCTAD (2017), TRAINS NTMs: The Global Database on Non-Tariff Measures. https://trains.unctad.org/Forms/Analysis.aspx
UNCTAD (2019), TRAINS NTMs: International Classification of Non-Tariff Measures. UNCTAD/DITC/TAB/2019/5. eISBN 978-92-1-004200-0. https://unctad.org/en/Pages/DITC/Trade-Analysis/Non-Tariff-Measures/NTMs-Classification.aspx
Van Beveren, I. (2012), ‘Total Factor Productivity Estimation: A Practical Review’, Journal of Economic Surveys, 26(1):98–128.
Van Hove, J. (2010), ‘Variety and quality in intra-European manufacturing trade: The impact of innovation and technological spillovers’, Journal of Economic Policy Reform, 13(1), 43-59.
Wooldridge, J. M. (2009), ‘On estimating firm-level production functions using proxy variables to control for unobservables’, Economics Letters, 104(3), 112-114.

APPENDIX 85 Research Report 456
Appendix
APPENDIX A
Appendix Table A.1 / List of countries in the PREDICT dataset
Country ISO2 Country Country group EU European Union EU AT Austria EU member state BE Belgium EU member state BG Bulgaria EU member state CZ Czechia EU member state DE Germany EU member state DK Denmark EU member state EL Greece EU member state ES Spain EU member state FI Finland EU member state FR France EU member state HR Croatia EU member state HU Hungary EU member state IE Ireland EU member state IT Italy EU member state LT Lithuania EU member state LU Luxembourg EU member state LV Latvia EU member state MT Malta EU member state NL Netherlands EU member state PL Poland EU member state PT Portugal EU member state RO Romania EU member state SE Sweden EU member state SI Slovenia EU member state SK Slovakia EU member state BR Brazil other countries CA Canada other countries CH Switzerland other countries CN China China IL Israel Other countries IN India India JP Japan Japan KR Korea Korea NO Norway other countries RU Russia other countries TR Turkey other countries TW Taiwan other countries UK United Kingdom other countries US United States United States

86 APPENDIX Research Report 456
APPENDIX B - TFP ESTIMATION
For the calculation of firm-level total factory productivity (TFP) in the literature, it is common to assume that production in firm 𝑖𝑖 in industry 𝑗𝑗 located in country 𝑐𝑐 at time 𝑡𝑡 takes the following form of a Cobb-Douglas production function:
𝑌𝑌𝑖𝑖𝑖𝑖𝑖𝑖𝑖𝑖 = 𝐴𝐴𝑖𝑖𝑖𝑖𝑖𝑖𝑖𝑖 𝐾𝐾𝑖𝑖𝑖𝑖𝑖𝑖𝑖𝑖𝛼𝛼𝑘𝑘𝐿𝐿𝑖𝑖𝑖𝑖𝑖𝑖𝑖𝑖𝛼𝛼𝑙𝑙𝑀𝑀𝑖𝑖𝑖𝑖𝑖𝑖𝑖𝑖𝛼𝛼𝑚𝑚 (1)
where 𝑌𝑌 denotes real revenue; 𝐾𝐾, 𝐿𝐿, and 𝑀𝑀 are respectively inputs of capital, labour and materials; and 𝐴𝐴 is the traditional TFP measure. Assuming a homogeneous production function in each industry 𝑗𝑗 across all countries, in order to be able to estimate (1), we consider the log transformation:
𝑦𝑦𝑖𝑖𝑖𝑖𝑖𝑖𝑖𝑖 = 𝛼𝛼𝑖𝑖0 + 𝛼𝛼𝑘𝑘𝑘𝑘𝑖𝑖𝑖𝑖𝑖𝑖𝑖𝑖 + 𝛼𝛼𝑙𝑙𝑙𝑙𝑖𝑖𝑖𝑖𝑖𝑖𝑖𝑖 + 𝛼𝛼𝑚𝑚𝑚𝑚𝑖𝑖𝑖𝑖𝑖𝑖𝑖𝑖 + 𝜀𝜀𝑖𝑖𝑖𝑖𝑖𝑖𝑖𝑖 (2)
where lower-case letters indicate natural logarithms and 𝛼𝛼𝑓𝑓 (𝑓𝑓 = 𝑘𝑘, 𝑙𝑙,𝑚𝑚) parameters refer to the share of the contribution of traditional inputs to output; and 𝜀𝜀𝑖𝑖𝑖𝑖𝑖𝑖𝑖𝑖 is the usual error term. TFP is then defined as:
ln�𝐴𝐴𝑖𝑖𝑖𝑖𝑖𝑖𝑖𝑖� = 𝛼𝛼𝑖𝑖0 + 𝜀𝜀𝑖𝑖𝑖𝑖𝑖𝑖𝑖𝑖 (3)
Equation (2) is usually estimated for each industry (firms across one country), where 𝛼𝛼𝑖𝑖0 indicates the mean level of efficiency across firms within industry 𝑗𝑗 over time, and 𝜀𝜀𝑖𝑖𝑖𝑖𝑖𝑖𝑖𝑖 is the deviation of time-producer specific efficiency from that mean in the country. The latter has an unobservable component 𝜇𝜇𝑖𝑖𝑖𝑖𝑖𝑖𝑖𝑖 that can be corrected by semi-parametric production function estimations in the literature (Olley and Pakes, 1996; Levinsohn and Petrin, 2003; Wooldridge, 2009; De Loecker, 2011; Ackerberg et al., 2015) and a predictable observable component 𝜗𝜗𝑖𝑖𝑖𝑖𝑖𝑖𝑖𝑖. The former thus becomes an i.i.d. component including unobserved characteristics that can be correlated with the benchmark level efficiency at the industry level. Estimating equation (2) by industry, the measure of TFP then becomes:
ln�𝐴𝐴𝑖𝑖𝑖𝑖𝑖𝑖𝑖𝑖� = 𝛼𝛼𝑖𝑖0 + 𝜀𝜀𝑖𝑖𝑖𝑖𝑖𝑖𝑖𝑖 = 𝛼𝛼𝑖𝑖0 + 𝜇𝜇𝑖𝑖𝑖𝑖𝑖𝑖𝑖𝑖 + 𝜗𝜗𝑖𝑖𝑖𝑖𝑖𝑖𝑖𝑖 (4)
hence, 𝜑𝜑𝑖𝑖𝑖𝑖𝑖𝑖𝑖𝑖 = 𝛼𝛼𝑖𝑖0 + 𝜇𝜇𝑖𝑖𝑖𝑖𝑖𝑖𝑖𝑖 represents the firm’s efficiency. Therefore, after controlling for characteristics of the unobserved effects 𝜇𝜇𝑖𝑖𝑖𝑖𝑖𝑖𝑖𝑖 in regressions which show the deviation from the mean, the TFP measure at the firm-level will be calculated by the fitted parameters of the following equation:
𝜑𝜑𝑖𝑖𝑖𝑖𝑖𝑖𝑖𝑖 = 𝑦𝑦𝑖𝑖𝑖𝑖𝑖𝑖𝑖𝑖 − �𝛼𝛼�𝑘𝑘𝑘𝑘𝑖𝑖𝑖𝑖𝑖𝑖𝑖𝑖 + 𝛼𝛼�𝑙𝑙𝑙𝑙𝑖𝑖𝑖𝑖𝑖𝑖𝑖𝑖 + 𝛼𝛼�𝑚𝑚𝑚𝑚𝑖𝑖𝑖𝑖𝑖𝑖𝑖𝑖� (5)
Equation (2) will provide for the fitted values of the estimates at the industry level across all countries. In this study we use 𝜑𝜑𝑖𝑖𝑖𝑖𝑖𝑖𝑖𝑖 as the semi-parametric production function proposed by Ackerberg et al. (2015). In order to estimate TFP, we calculate factor elasticities for each industry on a global scale to be able to assess the competitiveness of firms horizontally across national borders. The intuition behind this is that the competitive pressure has a diverse impact on productivity, as it is referred to in the literature of economic geography (Beaudry and Schiffauerova, 2009). Therefore, it is assumed that the functional form of the production is uniform across the industry globally and the differences are due to the differences in TFP, which is the efficiency in choosing the best sets of inputs to produce the most of output in the industry.

IMPRESSUM
Herausgeber, Verleger, Eigentümer und Hersteller: Verein „Wiener Institut für Internationale Wirtschaftsvergleiche“ (wiiw), Wien 6, Rahlgasse 3 ZVR-Zahl: 329995655 Postanschrift: A 1060 Wien, Rahlgasse 3, Tel: [+431] 533 66 10, Telefax: [+431] 533 66 10 50 Internet Homepage: www.wiiw.ac.at Nachdruck nur auszugsweise und mit genauer Quellenangabe gestattet. Offenlegung nach § 25 Mediengesetz: Medieninhaber (Verleger): Verein "Wiener Institut für Internationale Wirtschaftsvergleiche", A 1060 Wien, Rahlgasse 3. Vereinszweck: Analyse der wirtschaftlichen Entwicklung der zentral- und osteuropäischen Länder sowie anderer Transformationswirtschaften sowohl mittels empirischer als auch theoretischer Studien und ihre Veröffentlichung; Erbringung von Beratungsleistungen für Regierungs- und Verwaltungsstellen, Firmen und Institutionen.
