production and properties of in-situ aluminum titanum diboride
TRANSCRIPT

PRODUCTION AND PROPERTIES OF IN-SITU ALUMINUM TITANUMDIBORIDE COMPOSITES FORMED BY
SLAG-METAL REACTION METHOD
A THESIS SUBMITED TOTHE GRADUATE SCHOOL OF NATURAL AND APPLIED SCIENCE
OFMIDDLE EAST TECHNICAL UNIVERSITY
BY
AHMAD CHANGIZI
IN PARTIAL FULFILLMENT OF THE EQUIREMENTSFOR
THE DEGREE OF MASTER OF SCIENCEIN
METALLURGICAL AND MATERIALS ENGINEERING
FEBRUARY 2005

Approval of the Graduate School of Natural and Application Sciences
Prof. Dr. Canan Özgen Director
I certify that this thesis satisfies all the requirements as a thesis for the degree ofMaster of Science.
Prof. Dr. Tayfur Öztürk Head of Department
This is to certify that we have read this thesis and that in our opinion it is fullyadequate, in scope and quality, as a thesis for the degree of Master of Science inMetallurgical and Materials Engineering.
Prof. Dr. Naci Sevinç Prof. Dr. Ali KalkanlCo-Supervisor Supervisor
Examining Committee Members
Prof. Dr. Tayfur Öztürk (METU,METE)
Prof. Dr. Ali Kalkanl (METU,METE)
Prof. Dr. Naci Sevinç (METU,METE)
Prof. Dr. Reza Gürbüz (METU,METE)
Assoc. Prof. Dr. Tamer Özdemir (GAZI,METE)

iii
I hereby declare that all information in this document has been obtained andpresented in accordance with academic rules and ethical conduct. I alsodeclare that, as required by these rules and conduct, I have fully cited andreferenced all material and results that are not original to this work.
Name, Last name : AHMAD CHANGIZI
Signature :

iv
ABSTRACT
PRODUCTION AND PROPERTIES OF IN-SITU ALUMINUM TITANIUM
DIBORIDE COMPOSITES FORMED BY SLAG-METAL REACTION METHOD
Changizi Ahmad
M.S., Department of Metallurgical and Materials Engineering
Supervisor : Prof.Dr.Ali Kalkanl
Co-Supervisor : Prof.Dr.Naci Sevinç
February 2005,112 Pages
In this study, production and properties of titanium diboride particle reinforced
aluminum matrix composite were investigated. TiB2 particles form in-situ through
the reaction of TiO2 and H3BO3 and Na3AlF6 in aluminum melt. The results
showed that the in-situ TiB2 particles formed were spherical in shape and had an
average diameter of 1µm .Moreover, the distribution of TiB2 particles in the
matrix were uniform. The ultimate tensile strength, yield strength, flexural stress
and hardness were found to while reduction in area and elongation were found to
decrease with increase in reinforcement content in the matrix.
Key word: Composite, In-Situ, Metal Matrix composite, Particles reinforcement,
TiB2
v
ÖZ
CURUF-METAL TEPK MES LE YER NDE ÜRET LM ALÜM NYUM
TANYUM D BORÜR KOMPOZ TLER N ÜRET VE ÖZELL KLER
Changizi Ahmad
Y.Lisans., Metalurji ve Malzeme Mühendisli i Bölümü
Tez Yöneticisi : Prof.Dr.Ali Kalkanl
Ortak Tez Yöneticisi : Prof.Dr.Naci Sevinç
ubat 2005,112 Sayfa
Bu çal mada titanyum diborür partikül takviyeli alüminyum matriksli
kompozitler üretilmi ve incelenmi tir. TiB2 partikülleri TiO2 in H3BO3 ve
Na3AlF6 ile tepkimesi sonucunda yerinde olu turulmaktad r. Sonuçlar, yerinde
olu turulan TiB2 partiküllerinin küresel biçimde oldu u ve ortalama çaplar n
yakla k 1µm civar nda oldu unu göstermi tir. Ayr ca TiB2 taneciklerinin yap
içerisinde oldukça homojen bir biçimde da lm oldu u bulunmu tur. Çekme
mukavemeti, akma mukavemeti, e me mukavemeti ve sertli in takviye oran ile
artt , sümekli in ve uzaman n ise azald tespit edilmi tir.
Anahtar Kelimeler: kompozit, yerinde üretim, metal matriksli kompozit, partikül
takviyesi, TiB2

vi
To My Parents

vii
AKNOWLEDGMENTS
I whish to express here my deep and sincere gratitude to my professors : Dr.Ali
KALKANLI and Dr.Naci SEV NÇ for their valuable guidance and encouraging
supports during this research.
Also offer my especial thank to Selen GÜRBÜZ for her pure, honest, benefited
hints, without which I may not have been able to complete my master.
Mr. Salih TÜRE and MS. Hamdiye ESKIYAZICI and all respectful staff of
department s laboratory are gratefully acknowledged for their friendly helps.
My sincere and special gratitude for my parents who supported enlightened me
through the whole long way of my study.
Finely, I would never be able to thanks my real true friends Selen GÜRBÜZ and
Gül ÇEV K their help in editing my research.
My appreciation to all of my friends who gave me hope and courage.

viii
TABLE OF CONTENTS
PLAGIARISM
ABSTRACT
ÖZ ...
ACKNOWLEDGMENTS ..
TABLE OF CONTANTS ...
LIST OF FIGURES .
CHAPTER
1.INTRODUCTION
2.LITERATURE SURVIVE ..
2.1. Introduction ...
2.2. Metal Matrix Composite
2.3. Materials Selection .
2.3.1. Reinforcement Selection ...
2.3.2. Matrix Selection
2.4. Properties of Metal Matrix Composite ...
2.4.1. Physical Properties
2.4.2. Mechanical Properties ...
2.4.2.1. Stiffness ..
2.4.2.2. Strength ..
2.4.2.3. Wear behavior
2.4.2.5. Low-cycle Fatigue ..
2.5. Thermodynamic of Metal Matrix Composite .
2.5.1. The binary phase diagram Al B ..
2.5.2. The binary phase diagram Al Ti .
2.5.3. Some useful phase diagram which used in this study...
2.6. Solubility of Materials
2.6.1. TiO2 in Cryolite Alumina ...
2.6.2. Alumina in Cryolite ...
iii
iv
v
vii
viii
xi
1
3
3
4
9
9
11
13
13
15
15
17
18
19
21
24
26
29
31
31
36

ix
2.6.3. Na3 AlF6 Al2O3 B2O3 ..
2.6.4. B2O3 TiO2 NaF
2.6.5. Titanium diboride Liquid Aluminum ..
2.6.6. Titanium dioxide - Liquid Aluminum
2.7. Processing Methods for Particle Metal Matrix Composite ..
2.7.1. Processing steps .
2.7.2. Solid phase processes .
2.7.2.1.Solid State Processing
2.7.3. Powder metallurgy
2.7.4. High - Energy - High - Rate Consolidation ...
2.7.5. Liquid phase processes ..
2.7.5.1. Liquid State Processing ...
2.7.5.2. Liquid metal ceramic particulate mixing.
2.7.5.3. Melt infiltration ...
2.7.5.3.1.Gas Pressure Infiltration Device.
2.7.5.4. Melt oxidation processes .
2.7.6. Two Phase Processes .
2.7.6.1. Osprey deposition
2.7.6.2. Rheocasting .
2.7.6.3.Variable co-deposition of multi-phase
2.7.7. In-Situ Processing .
2.7.8. Compocasting
2.7.8.1. Wettability between reinforcement
2.7.8.2. The Distribution of Reinforcement
2.8. Production of Al / TiB2 Composite
2.8.1. Formation of TiB2 through carbothermal reduction ..
2.8.2. Synthesis of titanium diboride TiB2 and Ti-Al-B .
2.8.3. Reactively cast aluminum-TiB2 alloys ..
2.8.4. In Situ Al - TiB2 MMCs by casting route .
2.8.5. In Situ Al - TiB2 MMCs by Stir Casting
2.8.6. In Situ Ceramic Particle-Reinforced Aluminum
41
42
44
44
46
47
49
49
51
52
54
54
56
57
58
59
59
59
60
61
62
64
65
66
67
68
68
69
69
70
72

x
2.8.7. Synthesis of In- Situ Al- TiB2 Composites using Stir ..
2.8.8. In Situ formed Al2O3, TiB2 and Al3Ti mixture ..
2.8.9.In Situ TiB2 reinforced Al alloy Composite
2.8.10. Production of Al- TiB2 composite with injection
2.8.11. In Situ Al -TiB2 Composite ..
2.9. Existing/Potential Applications .
3. EXPERIMENTAL PROCEDURE .
3.1. Introduction
3.2. Materials .
3.3. Production Processes ..
3.4. X-Ray diffraction Analysis
3.5. Metallographic Examination ..
3.6. Particle size determination .
3.7.Tension Tests ...
3.8.Brinell Hardness Test ..
3.9. Bending test ..
4. RESULTS AND DISCUSSION .
4.1. Formation of in-situ TiB2 particles and XRD analysis ..
4.2 Determination of the amount of TiB2 ..
4.3. Microstructure
4.4. Particle Size
4.5. Mechanical properties of Al TiB2 Composites ..
5. CONCLUSIONS .
6.REFERENCES ..
72
73
73
74
75
76
77
78
78
78
79
82
82
85
85
85
85
87
90
93
99
103
107
108

xi
LIST OF FIGURES
FIGURES
1
2
3
4
5
6
7
8
9
10
11
12
13
14
15
16
17
18
19
20
21
Specific module of several aerospace materials ..
Schematic representation of dependency of the elastic modules of
the composite on the volume fraction of particle
The binary Al B system ...
Comparison of the calculated metastable phase zone extensions
(dashed line) for different competing phases ..
Concentration of titanium vs. the oxide content, expressed as present
oxygen, in cryolite-alumina melts in equilibrium with TiO2 ...
Cryolite Titanium dioxide system
Comparison of Al2O3 solubility in the NaF-AIF3 system at 1300 K
Calculated concentrations of all solutes for an alumina-saturated
cryolite melt at 1300 K ..
cryolite alumina system
System B2O3 NaF TiO2 .
B2O3 NaF TiO2 Solubility isotherms for TiO2 .
(a)Possible reaction paths occurring during infiltration of TiO2 by
molten aluminum at 700 oC. (b) Detailed view of the Ti-Al-O
isothennal phase diagram at 700 oC for oxygen compositions greater
than 0.60 ..
Calculated TiO2-Al pseudobinary phase diagram ...
Schematic diagrams of
Operating of Gas Pressure Infiltration Device
Schematic diagrams of modified osprey technique .
Schematic diagram of the variable co-deposition technique ...
Diagram showing defining of wetting angle
Schematic diagram of molten salt reactive casting process to
production TiB2 dispersolids in A356 .
Schematic drawing of the experimental set-up ...
6
17
26
28
32
36
40
40
43
43
45
46
52
58
60
61
66
70
71

xii
22
23
24
25
26
27
28
29
30
31
32
33
34
35
36
37
38
39
40
41
42
Schematic drawing of particle injection apparatus .
Schematic diagram of an apparatus for fabrication in situ particle
A photograph of induction furnaces
Schematic diagram of an apparatus for fabrication in situ particle
reinforce ..
Photograph of hydraulic squeeze casting press ...
Optical microscope
Samples peak .......................................................................................
The schematic of the test specimen produced .
The schematic of the three point bending test specimen .
XRD pattern of Al- 0% TiB2 ,(b) XRD pattern of Al- 5% TiB2 ,
XRD pattern of TiB2 particles extracted from composite with
leaching ..............................................................................................
SEM micrograph of slag and (b) EDX Analysis .................................
The morphology of TiB2 particles extracted from composite with
leaching and (b), (c), (d) EDX Analysis of point 1, 2, and 3...............
Optical micrograph ..............................................................................
SEM micrograph of un-reinforced matrix ...........................................
SEM micrograph of Al -5 vol % TiB2 composite ...............................
SEM micrograph of Al -7.5 vol % TiB2 composite ............................
SEM micrograph of Al -10 vol % TiB2 composite .............................
XRD pattern of Al- 0% TiB2..............................................................
Variation of ultimate tensile strength with volume percent ................
Variation of elongation with volume percent of reinforcements ........
76
77
80
81
81
82
84
85
86
88
91
91
92
93
94
96
97
98
101
104
105

1
CHAPTER I
INTRODUCTION
Modern technology has placed increasing demands on materials. This need for
better materials is particularly acute in the area of dynamic structure. Where not
only high strength is required but also light weight. The efficiency of dynamic
structures such as aircraft, high speed manufacturing machinery, power-
generating equipment could be affected by an improvement in the structural
efficiency of the materials. The structural efficiency of materials is becoming even
more important as hardware and capital equipment become larger and larger.
Engineering materials such as steel, aluminum, titanium, and glass have similar
specific module, and organic materials have lower modulus-to-density rations.
This have meant that the designer must generally use lower-density materials and
increase the section size to gain flexural or bending stiffness without excessive
weight. A key problem in designing these structures pertains to the square-cube
relationship: that is, the strength and stiffness of a structure increase whit the
square of the liner dimension (cross-section area), whereas the weight increases
with the cube of the liner dimension. In order to maintain the stiffness and
strength, new design techniques must be used and high-strength, stiffer materials
are required [1].
Savings in fuel result in savings in weight which translates directly into
substantial increase in payload capabilities. A 10% saving in aircraft structural
weight increases the available reserve payload by 4%. [2]
Metal matrix composites combine metallic properties (ductility and toughness)
with ceramic properties (ductility and toughness) with ceramic properties (high
strength and high modulus), leading to greater strength in shear and compression

2
and higher service temperature capabilities. Interest in metal matrix composite for
aerospace, automotive and other structural applications had increased over the last
years, as a result of availability of relatively inexpensive reinforcements, and
development of various processing routes which result in reproducible
microstructure and properties [3].
The family of discontinuously reinforced metal matrix composites includes both
particulates and short whiskers or fibers. More recently, this class of metal matrix
composites has attracted considerable attention as result of: (a) availability of
various type of reinforcement at competitive costs, (b) the successful development
of manufacturing processes to produce metal matrix composites with reproducible
structures and properties, and (c) the availability of standard or near standard
metal working methods which can be utilized to form theses metal matrix
composite. [4]
In this study, developed a low cost method. Namely, the slag-metal reaction, to
fabrication in situ Al-TiB2 composites from the TiO2-H3BO3-Na3AlF6-Al system.
Since the price of the raw materials is low and the technology is simple, the
processing technique appears to reduce the cost of fabricating composites. The
resulting composite can be formed in one run with the casting method, and they
exhibit improved strength and ductility.

3
CHAPTER II
LITERATURE SURVEY
2.1. Introduction
Metal matrix composites have emerged as an important class of materials for
structural, wear, thermal, transportation and electrical applications, primarily as a
result of their ability to exhibit superior strength to weight and strength to cost
ratios when compared to equivalent monolithic commercial alloys [5].
Metal matrix composites can be synthesized in number of ways, these including
liquid-phase processes, solid-phase processes and two-phase process. The
composites processed using these methods suffer, in common, from matrix
reinforcement interfacial thermodynamic instability, thus limiting their ambient
and high-temperature mechanical properties. In order to circumvent this
limitation, efforts have been made to synthesize metal matrix composites in a
single step from necessary raw materials to ensure good matrix to reinforcement
compatibility and microstructure homogeneity. The main advantages of liquid
processing are the low cost; the almost unlimited freedom of design and suitability
for continues processing.
In-situ processes represent one such category of techniques used to synthesize
metal matrix composites. In-situ processes involve the synthesis of composites
such that desirable reinforcements, matrices and interfaces are formed during
processing. The successful synthesis if in-situ composite involves good
understanding of thermodynamics and reaction kinetics in order to obtain the
desirable end product. The composite synthesized using in-situ techniques exhibit
the presence of a uniform distribution of reinforcement that tends to be fine and
associated with a clean interface with the metallic matrix, which assist in the

4
formation of a stronger bond between the reinforcement and the metallic matrix.
Therefore, the reaction of both ambient and high temperature strength limits the
applicability of synthetic composite. To overcome these limitations, a new class
of naturally stable materials knows as in-situ composites have gained prominence.
One of the successful metal matrix composites is Al-TiB2, which is based on the
super hard TiB2 reinforcement and an aluminum matrix, where properties such
ductility are combined with the strength and hardness provide by TiB2 [5-6-7-8].
2.2. Metal Matrix Composite
Al- base materials are metal matrix composites that have emerged during last 30
years. Many Al-MMCs are more suitable for higher temperature operations than
un-reinforced alloys. The aim is also to get improved strength, stiffness, thermal
conductivity, abrasion resistance, creep resistance and dimensional stability. The
reinforcement is typically a ceramic martial.
The Al-MMCs can be divided by the structure of the reinforcements. There are
continuous fibers, short and particle strengthened materials. The particulate metal
matrix composites can be used partly already existing production investments and
can be produced at lower cast. They also show higher workability while they still
possess a significant increase in the performance compared to un-reinforced
alloys. The volume fraction reinforcement is usually about 5-40% in most metal
matrix composites and the particle size 1-50 µm. the relatively high fraction
makes the load transfer between the matrix and the particles important. One way
to achieve a good bonding between the particles and matrix is to form the particle
in-situ in the melt [9].
Composite materials should include component materials thus complement each
other and are compatible. With these composites, the high-modulus reinforcement
is combined with a matrix that has been selected for its ease of fabrication into
structural hardware. In addition, these are little chemical or mechanical interaction
between the two phases, which simplifies matrix reinforcement compatibility
problem. With metal matrix composites, the temperature of composite fabrication

5
is generally much higher, and the matrix has elastic modulus coefficients that are
one or two orders of magnitude higher that those of the of the organic-resin
matrices.
Chemical compatibility has been solved in metal matrix composites in two ways:
either by using low temperature fabrication techniques or by selecting
thermodynamically stable component phase that are at equilibrium with each
other. A corresponding thermal mechanical compatibility problem has been
solved ether by using ductile matrix that yields and takes up all the differential
strain necessary in thermal cycling or by selecting a matrix and reinforcement
have nearly matching thermal expansion coefficients.
Te metal matrix composite, on the other hand, has a series of advantages that are
very important in the utilization of structural materials. These advantages relate to
the same metallic properties that have led to the general primacy of metal alloys
for use in dynamic engineering structures, they include the combination of the
following properties:
1. high strength;
2. high modulus;
3. high toughness and impact properties;
4. low sensitivity to changes in temperature or thermal shock;
5. high surface durability and low sensitivity to surface flaws;
6. high electrical and thermal conductivity;
7. excellent reproducibility of conductivity;
8. excellent technological background with respect to (a) design, (b)
manufacture, (c) shaping and forming, (d) joining, (e) finishing and (f)
service durability information.
The high strength of engineering alloys compared to structural ceramics or
organic materials can be utilized in composite materials. The matrix strength is
particularly important with respect to composite properties at some angle away
from the reinforcement direction.

6
The high modules of material alloys compared to those of organic materials are
particularly significant in high modules composites. Figure 2.1 shows a
comparison of several fiber reinforcement composite materials on the basis of
specific modulus.
Boron-Epoxy Carbon-Epoxy
Boric-Aluminum
Titanium
35X107 43X107 42X107 10X107 (a)
20X107 40X107 1.9X10⁷ 10X107 (b)
10X107 1.4X10⁷ 1.3X10⁷ 4X10⁷ (c)
Figure 2.1. Specific module of several aerospace materials; composite materialsare unidirectionallly reinforced and have 50 v/o fiber. (a) Longitudinal modulusE11; (b) transverse modulus E22; (c) shear modulus G12
The high toughness and impact properties of metal alloys are very important in
composite materials, since the reinforcement is generally a liner solid and dos not
have good impact properties by itself ductile metal matrices such as aluminum,

7
titanium, or nickel-chromium alloys undergo energy absorbing plastic
deformation under impact, which is very important in many dynamic structural
applications.
The insensitivity of metal properties to changes in temperature is an important
asset of metals as matrix materials for high modulus structural composite. The
poor thermal shock resistance of ceramic materials compared to that of metals has
often deterred their use.
Structural engineering alloys are generally less sensitive to surface flaws than
ceramics or organic resin, and the surface are more durable. Small crack in
ceramics started by erosion, abrasion, or corrosion can drastically lower the
strength of a ceramic material because of the high elastic coefficients.
Metal matrix composites have high electrical thermal conductivity, which permits
the diffusion and elimination of high thermal and electrical concertinos from point
sources. Problems such as lightning strikes and hot gas impingement are less
severs if the impacting energy can be conducted away rapidly.
One of the most important assets of metal matrices is the excellent reproducibility
of wrought metal properties. No other engineering material can be as precisely
controlled to mechanical and physical specifications as the metallurgical alloys we
depend on for dynamic structures.
The metal matrix composites that have been chosen for use in high modulus
composites have a significant asset in that an excellent technological background
has been developed. This technology relates to their present use in the design of
engineering structures, including shaping, forming, and joining operations, and in
the development of finishing and coating techniques, together with comprehensive
information on service durability [1]. Table 2.1. Present a summary of the
selection criteria and requirements for the successful fabrication of metal matrix
composites [11].

8
Table 2.1. Selection criteria and requirements for PMMC systems
Criterion Requirement
mechanical properties
high strengthhigh stiffnesselevated temperaturepropertiesDesign
physical properties low densitythermal expansion
Compatibility
matrix-particle bondingthermal expansionmismatchthermal stability
goodlimitedhigh
microstructureuniform particle distributionspecific inter particledistance
formability near net shapeSoundness no gas or shrinkage porosity
Processing
Simplicity
Costlow multiplying factor withrespectto the monolithic alloy

9
2.3. Materials Selection
2.3.1. Reinforcement Selection
Selection criteria for the ceramic reinforcement include
1. elastic modulus,
2. tensile strength,
3. density,
4. melting temperature,
5. thermal stability,
6. coefficient of thermal expansion,
7. size and shape,
8. compatibility with matrix material, and
9. cost
Some selected properties of commonly used ceramic reinforcements are shown in
Table 2.2. The structural efficiency of discontinuously reinforced metal matrix
composites is a function of the density, elastic modulus, and tensile strength of the
reinforcing phases. The chemical stability and compatibility of the reinforcements
with the matrix materials are important, not only for the end application, but also
during materials fabrication. The thermal mismatch strain, , between
reinforcement and matrix is an essential consideration for composites that will be
exposed to thermal cycling. is function of the difference between the
coefficients of thermal expansion, , of the reinforcement and matrix according
to the following expression
= T
Where T is the temperature change. It is important for to be minimum in
order minimize strain accumulation. It also important to recognize that relaxation
of these strains, by the formation of a dislocation network, will alter the response
of the metal matrix composite to thermomechanical processing relative to that of
un-reinforced alloys[11].

10
Table 2.2. Typical Properties of selected reinforcement materials [10-11-12].
Reinforcement Density(g/cm3)
CTE
(µm/k)
Meltingpoint (OC)
Strength(MPa)
Modulus(Gpa)
Al2O3 3.98 7.92 2015 221(1090OC) 379(1090OC)
AlN 3.26 4.84 2069 2069(24OC) 310(1090OC)BeO 3.01 7.38 2570 24(1090OC) 190(1090OC)BN 3.48 7.50 2327 2500 195B4C 2.52 6.08 2450 2759(24OC) 448(24OC)C 2.18 -1.44 3527 - 690CeO2 7.13 12.42 2600 589(24OC) 185(24OC)HfC 12.2 6.66 3928 - 317(24OC)MgO 3.58 11.61 2620 41(1090OC) 317(1090OC)MoSi2 6.31 8.91 2030 276(1090OC) 276(1260OC)Mo2C 8.90 5.81 2500 - 228(24OC)NbC 7.60 6.84 3500 - 338(24OC)Si 2.33 3.06 1414 - 112SiC 3.21 5.40 2830 - 324(1090OC)Si3N4 3.18 1.44 1900 - 207SiO2 2.66 <1.08 1610 - 73TaC 13.90 6.46 3880 - 366(24OC)TaSi2 9.1 10.80 2200 - 338(1260OC)ThO2 9.86 9.54 3300 193(1090OC) 200(1090OC)TiB2 4.50 8.28 2920 - 414(1090OC)TiN 5.44 8.10 2950 1298 390TiC 4.93 7.60 2830 55(1090OC) 296(24OC)UO2 10.96 9.54 2847 - 172(1090OC)VC 5.77 7.16 2699 - 434(24OC)WC 15.63 5.09 2800 - 669(24OC)WSi2 9.40 9.00 2165 - 248(1090OC)ZrB2 6.09 8.28 1845 - 503(24OC)ZrC 6.73 6.66 1852 90(1090OC) 359(24OC)ZrN 7.35 7.0 2952 - 328
ZrO2 5.89 12.01 2700 83(1090OC) 132(1090OC)

11
2.3.2. Matrix Selection
Many metals have been considered as a possible matrix material for metal matrix
composites, such as aluminum, magnesium, lithium, silicon, titanium, copper,
nickel, zinc, etc. (Table 2.3). Whereas any of the commonly used structural
aluminum alloys 6xxx and 7xxx can be utilized as matrices, the use of metal
matrix composites for elevated temperature applications necessitates the presence
of thermodynamically stable dispersoids. This requirement gas been achieved by
using as alloy dispersoid system in which elemental solubility, solid state
diffusivity and interfacial energies are minimized, thereby minimizing coarsening
and interfacial reactions [13].
The requirements of low density, with reasonably high thermal conductivity, have
made aluminum and magnesium alloys the most commonly used matrices.
Regarding alloying additions, the result of several studies have shown that low
matrix alloying additions result in metal matrix composites with attractive
combinations of strength, ductility and toughness. Minor alloying elements
commonly used in wrought alloys as grain refiners, are unnecessary in
discontinuous reinforced metal matrix composites .Furthermore, these additions
should be avoided, since they might result in the formation of coarse intermetallic
compound during consolidation and subsequence processing, thus impairing the
ductility of the composite [11-14].

12
Table 2.3.The typical matrix materials used in metal matrix composites [15].
Metal Density(g/cm3)
MeltingPoint(OC)
Modulus(GPa)
Strength(MPa) Remarks
Aluminum 2.8 580 70 310 6061(T6)
Beryllium 1.9 1280 290 620 Annealed
Copper 8.9 1080 120 340Oxygen freehardened
Magnesium 1.7 570 40 280 AZ3 1B H24
Nickel 8.9 1440 210 760 Nickel 200hardened
Niobium 8.6 2470 100 280 -
Steel 7.8 1460 210 2070High Strength H-11
Superalloy 8.3 1390 210 1100 Inconel X- 760
Tin 7.2 230 40 10 -
Titanium 4.4 1650 110 1170 Ti-6 Al-4 V
Tungsten 19.4 3410 410 1520 -
Zinc 6.6 390 70 280 Alloy agada

13
2.4. Properties of Metal Matrix Composite
2.4.1. Physical Properties
The coefficient of thermal expensing of metals is larger; consequently there are
significant changes in dimensions with temperature which close tolerances. In
contrast the coefficient of thermal expansion of ceramics in much lower and
therefore it is not supervising that reinforcement with ceramic fibers or particles
leads to a reduction in .
Similar reasoning applies to thermal and electrical conductivities: in both cases
the conductivity of the reinforcement is less than that of the metallic matrix and
hence composites have lower values for these parameters than the monolithic
metal. Although there significant reduction in the conductivities on reinforcing
metals [16].
Low density metal matrix composites can readily be developed by selecting low
density alloys, such as those based on Al and Mg, for the metal matrix
composites. When structural requirements demand optimal strength density ratio
in combination with thermal stability nickel and titanium base alloys can also be
selected. Whereas most metallic matrices exhibit reasonably high thermal
conductivities (TC), their coefficients of thermal expansions (CTE) are
substantially higher than of most of the reinforcements available (Table 2.2).
Regarding the prediction of properties of metal matrix composites from the
properties of the individual components, numerous mathematical models have
been formulated. The simplest model commonly used is the rule of mixture
(ROM) approximation, in which the CTE, density, strength, modulus or any other
desired property of the metal matrix composite can be computed from the
weighted average of the individual components:
c = m Vm + r Vr (1)
14
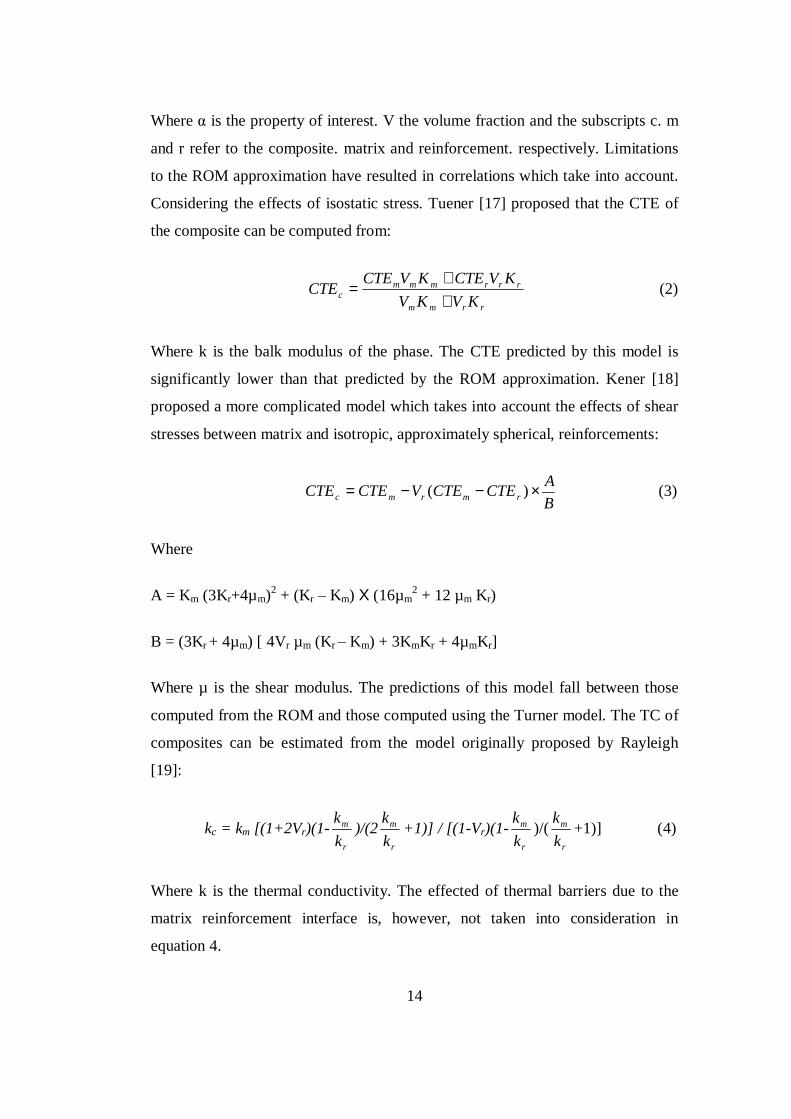
Where is the property of interest. V the volume fraction and the subscripts c. m
and r refer to the composite. matrix and reinforcement. respectively. Limitations
to the ROM approximation have resulted in correlations which take into account.
Considering the effects of isostatic stress. Tuener [17] proposed that the CTE of
the composite can be computed from:
rrmm
rrrmmmc KVKV
KVCTEKVCTECTE++
= (2)
Where k is the balk modulus of the phase. The CTE predicted by this model is
significantly lower than that predicted by the ROM approximation. Kener [18]
proposed a more complicated model which takes into account the effects of shear
stresses between matrix and isotropic, approximately spherical, reinforcements:
BACTECTEVCTECTE rmrmc ×−−= )( (3)
Where
A = Km (3Kr+4µm)2 + (Kr Km) X (16µm2 + 12 µm Kr)
B = (3Kr + 4µm) [ 4Vr µm (Kr Km) + 3KmKr + 4µmKr]
Where µ is the shear modulus. The predictions of this model fall between those
computed from the ROM and those computed using the Turner model. The TC of
composites can be estimated from the model originally proposed by Rayleigh
[19]:
kc = km [(1+2Vr)(1-r
m
kk )/(2
r
m
kk +1)] / [(1-Vr)(1-
r
m
kk
)/(r
m
kk
+1)] (4)
Where k is the thermal conductivity. The effected of thermal barriers due to the
matrix reinforcement interface is, however, not taken into consideration in
equation 4.
15
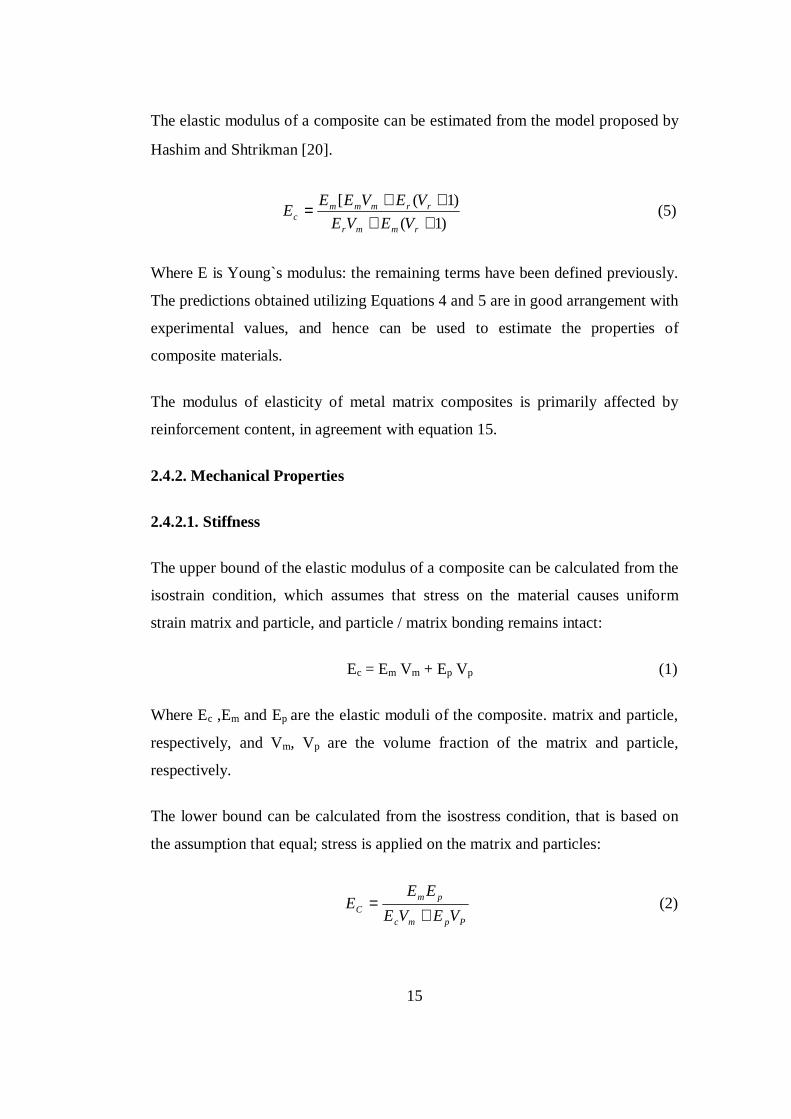
The elastic modulus of a composite can be estimated from the model proposed by
Hashim and Shtrikman [20].
)1()1([
++++
=rmmr
rrmmmc VEVE
VEVEEE (5)
Where E is Young`s modulus: the remaining terms have been defined previously.
The predictions obtained utilizing Equations 4 and 5 are in good arrangement with
experimental values, and hence can be used to estimate the properties of
composite materials.
The modulus of elasticity of metal matrix composites is primarily affected by
reinforcement content, in agreement with equation 15.
2.4.2. Mechanical Properties
2.4.2.1. Stiffness
The upper bound of the elastic modulus of a composite can be calculated from the
isostrain condition, which assumes that stress on the material causes uniform
strain matrix and particle, and particle / matrix bonding remains intact:
Ec = Em Vm + Ep Vp (1)
Where Ec ,Em and Ep are the elastic moduli of the composite. matrix and particle,
respectively, and Vm, Vp are the volume fraction of the matrix and particle,
respectively.
The lower bound can be calculated from the isostress condition, that is based on
the assumption that equal; stress is applied on the matrix and particles:
Ppmc
pmC VEVE
EEE
+= (2)

16
A schematic representation of the upper and lower bound as well as of the real
behavior is given in Figure 2.2 it can be seen that, it general, the elastic modulus
of PMMCs cannot be obtained from either the isostress or the isostrain condition.
Another equation proposed by Halpain and Tsai [21] :
p
pmc qV
sqVEE
−
+=
121
(3)
In which
sEE
EE
q
m
p
m
p
2
1
+
−= (4)
Where s is the aspect ratio of particles.

17
Ep
Ec
Isostrain condition Real behavior
restraint
Matrix Isostress condition
0 0.5 1
Vp
Figure 2.2. Schematic representation of dependency of the elastic modules of the
composite on the volume fraction of particles.
From Eqs.(1) through (5) and from 2.2 it can be seen that the stiffness of the
composites is a function of : (a) volume fraction of particles, (b) aspect ratio of
reinforcement, and (c) elastic moduli of the components [22].
2.4.2.2. Strength
Within the elastic range when it is assumed that particles do not deform under
stress but crack . the yield strength of the composite can be calculated as:
p
pmcy CD
bGG=δ 5.0−
pD (1)
Where Gm, Gp are the shear moduli of the matrix and particle, respectively, b is
Burger s vector, C is a constant related to particle strength, and Dp is the
interparticle distance. If particles undergo plastic deformation before fracture the
composite yield strength is:

18
`CbGG pm
cy =δ (2)
Thus, the strength of the PMMC is function of : (a) shear moduli of the
components, (b) reinforcement strength, and (c) interparticle distance [23].
2.4.2.3. Wear behavior
Wear is generally defined as the unwanted removal of materials by chemical or
mechanical action. Wear classifications can depend on such parameters as the
wear rate, the wear mechanism and the type of relative motion.
Wear rate under dry-sliding conditions, which are the subject of this
investigation, increases with increasing applied normal load. However, changes in
the microstructure of an alloy can affect this finding.
It is generally agreed that increasing the hardness of the contact surface pushes
this transition to higher loads.
The presence of discrete hard or soft particles in a matrix can influence wear
behavior in important ways. Reduce wear when the matrix alloy contained hard
particles. The presence of soft particles could increase wear rate. However, this
observation may have been due to the poor bonding between the particles and the
matrix.
In general, aluminum alloys display two basic wear mechanisms: oxidative or
mild wear and metallic or severe wear. The onset of severe wear is taken as the
start of seizure and the sliding distance that corresponds to this point is designated
as the point of seizure . Most studies of dry sliding wear have been concerned
with the effects of applied load, sliding velocity and alloy composition on seizure
resistance. On the other hand, applied load and, to a lesser extent, sliding velocity
influence the point at which seizure occurs, but have no effect on the mechanism
of seizure.

19
Additions of silicon, especially in the hypereutectic composition range, which
results in the formation of primary hard silicon particles in the matrix, improve the
wear resistance of aluminum alloys. Continues increase in the transition load with
increasing silicon content in this composition range. However, oxidative wear
rates appear to be independent of both silicon content and the particle size the
silicon [24].
2.4.2.5. Low-cycle Fatigue
As mentioned above, the cyclic deformation behavior of MMCs is sensitive to the
matrix microstructure. Thus, pure aluminum is used as the matrix material in
order to study the effects of fine in situ reinforcements on the LCF characteristics
of composites exclusively. At low total strain amplitudes of 0.1 and 0.2%, (Al2O3-
TiB2-/Al3Ti)/Al and (Al2O3-TiB2)/Al composites exhibit essentially stable
behavior, i.e. At higher total strain amplitudes, a gradual progressive softening
from the onset of cyclic deformation is observed in the (Al2O3-/TiB2)/Al
composite. A stable cyclic response is commonly observed in aluminum alloys
strengthened by non-shearable precipitates cycled at low strain amplitudes
[25,26].
The cyclic responses of (Al2O3-/TiB2)/Al composite reinforced with extremely
fine in situ TiB2 and Al2O3 particles at low strain amplitudes are somewhat similar
to those of the copper-based MMC reinforced with Al2O3 particles[27].
This is because the dislocation substructures inherited from prior processing are
stabilized by Al2O3 particles. It is generally known that the ceramic and metal
phases of MMCs have significantly different, coefficients of thermal expansion
(CTE). The CTE values of Al,TiB2 and Al2O3 are 26.2 x 10 -6, 4.6 x 10 -6 and
7.24 x/10-6 K-1, respectively.
That the continuous cyclic softening that occurs in the SiCp/Al composites is
resulted from the rearrangement of existing dislocation substructures formed
during processing. The virgin dislocation substructure in the composites is similar

20
to a work-hardened condition. The softening is attributed to the enlargement of
dislocation cell volume and decreasing of dislocation density during cyclic
deformation. The degree of softening is affected by the plastic strain amplitudes,
volume fraction and the size of SiC particulates.
The fatigue life of in situ (Al2O3-TiB2)/Al composite is longer than that of the ex
situ composite under given total strain amplitudes. The excellent fatigue
resistance of the in situ (Al2O3-/TiB2)/Al composite is attributed to the finer
size of particulates and to good interfacial matrix-/particle bonding. Consider the
LCF life of in situ (Al2O3-TiB2-/Al3Ti)/Al and (Al2O3-/TiB2)/Al composites.
According to the literature, the LCF life of ex situ MMCs follows a Coffin-
/Manson relationship. Moreover, the LCF life of ex situ MMCs is generally lower
than that of the unreinforced matrix. This is because the incorporation of ceramic
particle reinforcement into the metal can reduce its ductility and toughness
considerably. Mathematically, Coffin-/Manson relationship is described as:
½ p = `f (2Nf) c (1)
where 2Nf is the reversal to failure, p the plastic strain range, and `f and c the
fatigue ductility coefficient and fatigue ductility exponent, respectively. The
plastic strain range can be determined from the cyclic hysteresis loop according to
the following relation:
p = t ( / E) (2)
Where E is the Young s modulus. Dot the total strain range and Ds the applied
stress range.
An extrapolation of the best fit is made to determine the value of cyclic plastic
strain at 2Nf =/1. This corresponds to the fatigue ductility coefficient (/ `f ) and is
related to cyclic ductility of the material. The slope of the plot yields the fatigue
ductility exponent.

21
Microcracks can be observed in large Al3Ti block due to the presence of high
local stress concentration effects as discussed above. These cracks then propagate
through the Block-/matrix interface. Similarly, microcracks can also be observed
in the (Al2O3-/TiB2-/Al3Ti)/Al composite cycled at low total strain amplitude of
0.1%. Fine in situ TiB2 and Al2O3 particles remain intact with the matrix due to a
strong interfacial particle-/matrix bonding it appears that the damage of (Al2O3-
/TiB2-/Al3Ti)/Al composite is localized at the large Al3Ti block via
microcracking. In order to ensure that microcracking of Al3Ti phase indeed
occurred in the early cyclic deformation process, the fatigue tests were
periodically interrupted [28].
2.5. Thermodynamic of Metal Matrix Composite
In spite of many processing techniques developed, mechanisms of the reactions
that occur in the process are not well understood. For example, in Al Ti - B
system, several deferent reactions have been proposed between Al Ti and B.
Maxwell and Hellawell [29] suggested a ternary peritectic reaction of
L (liquid) + Al3Ti + TiB2 ( Al )
above 665°C and a ternary eutectic reaction of
L(liquid) (Al ) +Al3Ti + TiB2
below 659°C. Abdel Hamid and Durand [30] proposed two transition reactions of
L + Al3Ti ( Al ) + TiB2
L + TiB2 ( Al ) +AlB2
to occur within the temperature range of 659 - 665°C. Thermodynamic calculation
[31] has consistently shown the presence of compound phases of AlB2, TiB2,
Al3Ti and mixed boride phase of (Al, Ti)B2. Most of the studies on Al based metal

22
matrix composites (MMCs) reinforced by TiB2 were limited to experimental
investigations. There is a long traditional debate [31 - 32] on whether AlB2 and
TiB2 exist as two separate phases or as a continuous series of solid solution of the
form (Al,Ti)B2. Although several investigators [30] have reported that AlB2 and
TiB2 can coexist together. Both AlB2 and TiB2 exhibit the same crystal structures
and have lattice parameters that are very similar, Al3Ti was also discovered
among component phases when the mixture of salts and Al were heated up to
850°C and held for 35 min. As the reaction duration increased, the amount of
Al3Ti decreased [33].
In general, excess free energy, G has been used to determine the possibility of a
reaction. The free energy of a system at a temperature, T, can be written as:
G = H T S (1)
Where H and S are respectively the changes in enthalpy and entropy of two
states. It can be seen from Eq. (1) that G is only a function of temperature.
However, as G is also dependent on the concentration of the reactants, the
influence of composition on the reaction must be taken into consideration.
Consider the following reaction:
n1A1 + n2A2 n3A3 + n4A4 (2)
Where ni is the weight of composition Al. For the reactant, ni is negative; while
for the product, positive.
In the reaction, G in a reaction may be expressed as :
iiiiTPiiTPTP RTLnnRTLnnGRTLnnGG γγα ∑+∑+∆=∑+∆=∆ 00 (3)
Where 0TPG∆ is the standard free energy, i . the molar concentration of the
component i in the solution, and i is the activity coefficient of component i. From
Eq. (3), it can be seen that if i is known, the free energy GTP of the reaction in
Eq. (2) can be calculated. Lupis [34] has presented a feasible method to estimate

23
the activity coefficient i. The reason is that G is not only dependent on
temperature, but also on the concentration of the component. especially for liquid
solution. Based on Lupis method [34], the concepts of first order interaction
coefficient and second order interaction coefficient were introduced to
interpret how concentration affects the excess free energy as well as activity by
using the central atom model [35] of a metallic solution which is limited to
qualitative interpretation of the results. The central atom model assumes that
forces between atoms are short range, and neglects the effect of non-nearest
neighbors. This assumption of short range forces appears realistic for metallic
solutions whether or not one or more neighboring atom shells are being
considered. The activity of the solution can be obtained by summation of the
contributions of each atom in the solution [36].
During the sintering process, several phases such as TiO2, B2O3, A12B, TiB2,
A13Ti and A12O3 could co-exist together due to uncompleted reaction.
Thermodynamic investigation shows that all these phases are
thermodynamically favorable. Table 2.4 lists the Gibbs free energies of all the
phases at 1023 K.
Table 2.4. Gibbs free energy of different phase at 1023K.
Phase TiO2 B2O3 Al2B TiB2 Al2O3 Al3Ti Al Ti BGibbs free energy(kJ) -1031 -1304 -217 -384 -1773 -298 -43 -46 -15
From the thermodynamic data, it can be seen that TiB2 cannot be directly
formed from the reduction of TiO2 and B2O3 since both TiO2 and B2O3 have
much lower Gibbs free energy than that of TiB2. Therefore, it is suggested that
formation of in situ TiB2 be accomplished through two steps. In the first step,
since the Gibbs free energy of A12O3 is much lower than of both TiO2 and
B2O3, the oxygen atoms may be reduced by the displacement of oxygen atoms
from TiO2 and B2O3 so that the Ti and B atoms can be freed by the formation
of A12O3, The free Ti and B atoms have higher probability to react with the A1
matrix as well as react with each other. Therefore, in the second step, Al2B,

24
A13Ti and TiB2 compounds could be formed. Once TiB2 is formed, it cannot
be decomposed even though TiO2 and B2O3 have lower Gibbs free energies.
This is because A12O3 has the lowest Gibbs free energy and cannot be reduced
by either Ti or B atoms. From thermodynamic analysis, the following reaction
mechanisms are suggested.
In the first step, the reaction takes place as follows:
3TiO2 + B2O3 + 6A1 3A12O3 + 3Ti + 2B with G = -832 kJ. (4)
After the first reaction, TiO2 and B2O3 are fully reduced, Al2O3 remains as the
inner compound that will not participate in further chemical reaction due to its
low Gibbs free energy. In this system, only Al, Ti and B are available to take
part in further reactions.
In the second step of the reaction, Ti reacts with B in the A1 matrix forming
TiB2 and A13Ti as follows [38]:
2Ti + 2B + 3A1 4 TiB2 + A13Ti with G = -431 kJ (5)
2.5.1. The binary phase diagram Al – B
The phases occurring in the Al-B system have been under considerable debate.
Made experiments studying thermal arrests in all composition ranges in the binary
Al-B system revealing at least seven invariant temperatures, Later, Carlsson [38]
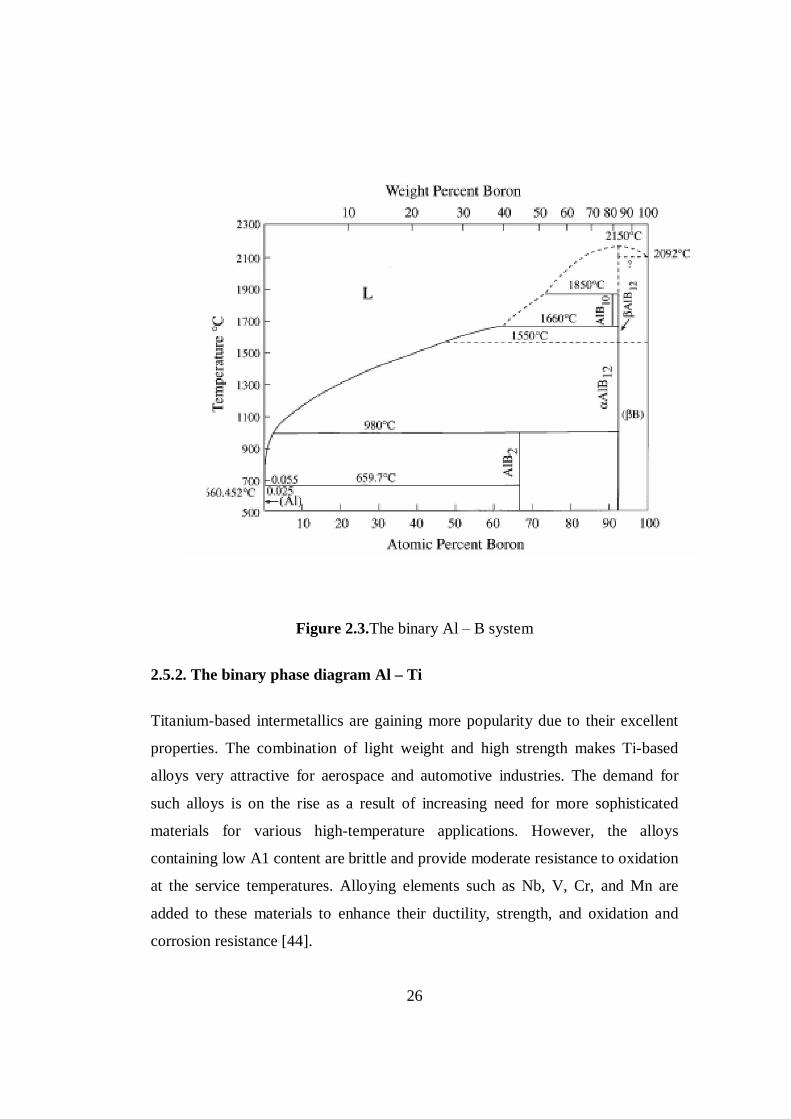
assessed the system (Figure 2.3) concluding that the stable solid phases in the
system are 3B, A1B12, AlBt2, A1B10, AlB2 and Al. Duschanek and Rogl [39]
made a critical study on these phases and the way the experiments had been
performed. Their first conclusion is that carbon has a strong influence on the
occurrence of A1B12, 3AlB12 and A1B10, Their findings suggest that 3A1B12
is carbon stabilised and in fact ,is a ternary compound A1B48C2. They also found
that A1B10 also is a ternary carbon stabilised compound, i.e. A1B24C4. Their
conclusion is that aA1B12 and A1B2 are the only true binary compounds. They
also accept the findings of Vardiman [40], who found the phase A12B3 from ion

25
implantation followed by heat treatment. This phase was reported to be stable to at
least 798 K and formed by a peritectoid transformation, Duschanek and Rogl [39]
conclude that the stable phases in the Al-B system are B, AlB12, AlB2, Al2B3
and Al.
Concerning the phase diagram there is a wide consensus that there is a eutectic
reaction at XB = 0.055 at.% [38]. The temperature for this reaction is also
accepted to occur at 932.9 K [38.40].
The peritectic reaction in which AlB2 forms from liquid and AlB12 has not yet
been exactly determined, Carlsson [38.40] reported that it occurs at 1253 K at
approximately 2.4 at.%. while Serebryanski et al. [41] determined the peritectic
concentration to be 2.5 at.% using metallographic techniques. On the other hand,
Sigworth [42] reported the solubility at the peritectic reaction to be 0.55 at.%. It
should also be noted here that among the first reports on the phase diagram it was
suggested to be eutectic with a eutectic point at approximately 30-35 at.% . The
peritectic temperature is also seemingly difficult to determine since reports on this
have given values ranging from below 1223 K up to above 1673 K as reviewed in
[39]. In the recent experimental study by Duschanek and Rogl [39] the
temperature was determined to be 1303 K, Duchanek and Rogl [39] also accepted
the peritectic composition determined by Sigworth [41].
From an experimental standpoint the system seems sensitive to impurities as well
as to the use of crucibles, Serebryanski et al. [40] reported that specimens with
boron contents above 70 at.% reacted with the beryllium oxide crucible as well as
above 1773 K. From the survey of Duschanek and Rogl [39] it is also evident that
the use of graphite crucibles alters the occurrence of phases. It is also shown that a
carbon impurity has a tendency to shift the peritectic temperature to higher
temperatures [44].
26
Figure 2.3.The binary Al B system
2.5.2. The binary phase diagram Al – Ti
Titanium-based intermetallics are gaining more popularity due to their excellent
properties. The combination of light weight and high strength makes Ti-based
alloys very attractive for aerospace and automotive industries. The demand for
such alloys is on the rise as a result of increasing need for more sophisticated
materials for various high-temperature applications. However, the alloys
containing low A1 content are brittle and provide moderate resistance to oxidation
at the service temperatures. Alloying elements such as Nb, V, Cr, and Mn are
added to these materials to enhance their ductility, strength, and oxidation and
corrosion resistance [44].

27
Numerous studies on the phase diagram of the Ti-Al system are found in
literature. The methods used to calculate the phase diagram differ and some
discrepancies still remain, Murray [45] calculated the phase diagram by
optimization of Gibbs energies with respect to phase diagram and thermochemical
data, Kattner et al. [46].
Successive peritectic reactions (L + ) and subsequently (L + ) exist in
the near equal atomic percent Ti Al alloy system. Four phases are considered in
the calculation of the high-temperature phase diagram of the near equal atomic Ti-
AI alloy system: the disordered solution phase, liquid (L), (Ti), (Ti) and the
internletallic compound (TiAl) phase. Before calculating phase equilibrium, the
Gibbs energy of the present phases has to be expressed as analytical functions of
composition, temperature and pressure, 0TiG
The disorder solution phases, liquid(L), (Ti), (Ti) could be accurately described
as random mixtures of Ti and A1 according to the quasi - subregular solution
model:
G = XTi0TiG + XAl . 0
AlG + RT [XTi LnXTi + XAl Ln XAl] + XTi XAl [G0 +G1(XTi
XAl)] (1)
Where Xi (i = Ti and Al) are the mole fractions of i component and , 0iG are the
reference state of i. The terms Go and G1 are coefficients of the terms of the excess
Gibbs energy.
Based on a sublattice model [47], the intermetallic compound (TiAl) exhibits
appreciable wide range of homogeneity and is considered to consist of two
sublattices. In the perfectly ordered compound, sublattice 1 is occupied by Ti and
sublattice 2 by Al and the formation of substitutional atoms is assumed on each
sublattice. This results in the treatment of random mixtures of Ti and Al on each
sublattice in the analytical description:
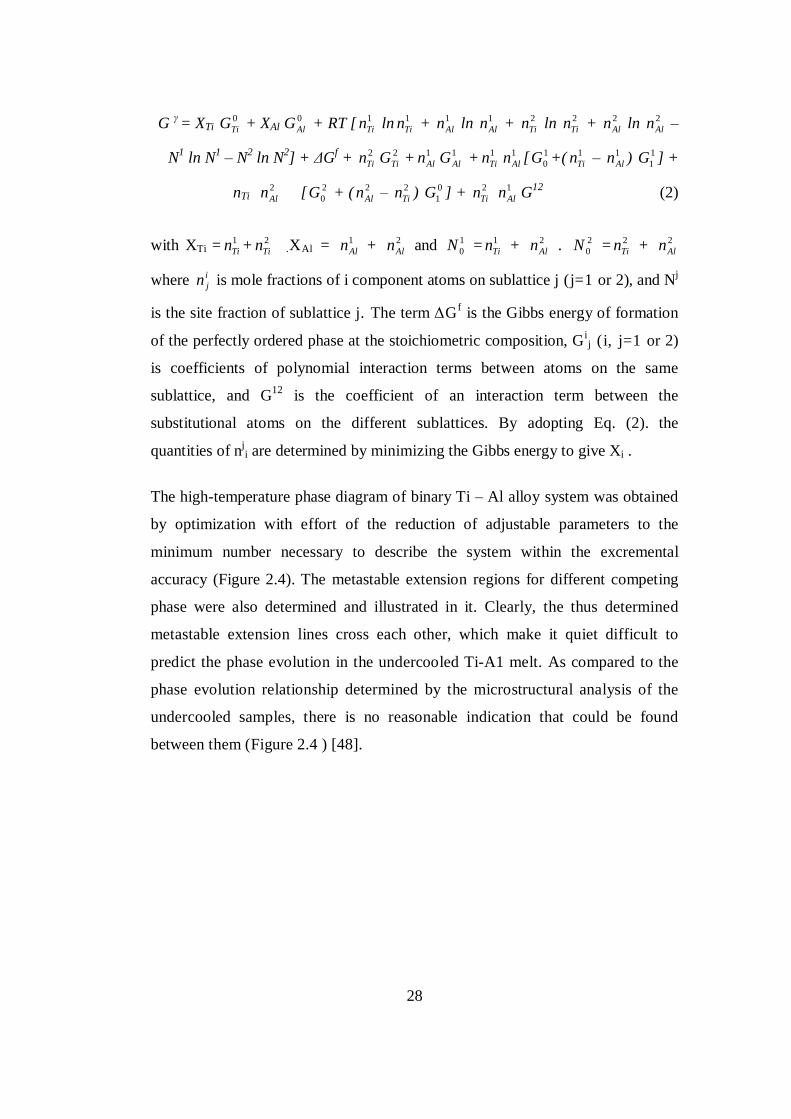
28
G = XTi0TiG + XAl
0AlG + RT [ 1
Tin ln 1Tin + 1
Aln ln 1Aln + 2
Tin ln 2Tin + 2
Aln ln 2Aln
N1 ln N1 N2 ln N2] + Gf + 2Tin 2
TiG + 1Aln 1
AlG + 1Tin 1
Aln [ 10G +( 1
Tin 1Aln ) 1
1G ] +
nTi2Aln [ 2
0G + ( 2Aln 2
Tin ) 01G ] + 2
Tin 1Aln G12 (2)
with XTi = 1Tin + 2
Tin .XAl = 1Aln + 2
Aln and 10N = 1
Tin + 2Aln . 2
0N = 2Tin + 2
Aln
where ijn is mole fractions of i component atoms on sublattice j (j=1 or 2), and Nj
is the site fraction of sublattice j. The term Gf is the Gibbs energy of formation
of the perfectly ordered phase at the stoichiometric composition, Gij (i, j=1 or 2)
is coefficients of polynomial interaction terms between atoms on the same
sublattice, and G12 is the coefficient of an interaction term between the
substitutional atoms on the different sublattices. By adopting Eq. (2). the
quantities of nji are determined by minimizing the Gibbs energy to give Xi .
The high-temperature phase diagram of binary Ti Al alloy system was obtained
by optimization with effort of the reduction of adjustable parameters to the
minimum number necessary to describe the system within the excremental
accuracy (Figure 2.4). The metastable extension regions for different competing
phase were also determined and illustrated in it. Clearly, the thus determined
metastable extension lines cross each other, which make it quiet difficult to
predict the phase evolution in the undercooled Ti-A1 melt. As compared to the
phase evolution relationship determined by the microstructural analysis of the
undercooled samples, there is no reasonable indication that could be found
between them (Figure 2.4 ) [48].

29
Figure 2.4. Comparison of the calculated metastable phase zone extensions(dashed line) for different competing phases (a, h and g) and the experimentalphase evolution results obtained by undercooling experiments (dot) for 1 =Ti50Al50, 2=Ti47Al53 and 3 = Ti44Al56 alloys.
2.5.3. Some useful phase diagram which used in this study.[49]
30

31
2.6. Solubility of Materials
2.6.1. TiO2 in Cryolite – Alumina
The analytical results for titanium and total oxygen concentrations in melts
saturated with TiO2 at 1020 °C are given in Table 2.5; the relation between them is
shown in Figure 1 and can be expressed empirically by
γβ
α−
+=][
][][2
wtpctOwtpctOwtpctTi (1)
For the range investigated. The constants , and were found by iteration to be
1.8, 0.092, and 1.7, respectively. The standard deviation of the titanium values
from this equation was found to be ±0.05 wt pct. Equation [1] is shown as a solid
line in Figure 2.5, and from it the solubility of TiO2 in cryolite at 1020 °C is 3.1 wt
pct Ti, i.e. 5.2 wt pct TiO2 [50].

32
Table 2.5 concentrations of Ti in Cryolite-Alumina Melts in Equilibrium with
solid TiO2 at 1020 OC
O (wt Pct) Ti (wt Pct) O (Wt Pct) Ti (Wt Pct)1.9 3.1 3.9 2.42 3.1 5 2.5
2.1 2.7 5 2.52.2 2.7 5.3 2.52.2 2.8 5.6 2.52.4 2.6 5.6 2.52.6 2.5 6 2.52.7 2.5 6 2.62.7 2.4 6.3 2.63.1 2.4 7.1 2.73.7 2.4 8.1* 2.73.2 2.4 8.1* 2.73.3 2.3 8.2* 2.73.5 2.4 - -
* Saturated with Al2O3
Figure 2.5 Concentration of titanium vs, the oxide content, expressed as presentoxygen, in cryolite-alumina melts in equilibrium with TiO2 at 1020 OC

33
The last three mixtures recorded in Table 2.5 (the points furthest to the right in
Figure 2.5, were saturated with alumina as well as with TiO2. This was ensured by
adding a large excess of both. The analytical results show that only around half of
the material added had dissolved.
on the activity of alumina to elucidate the mechanism of solution have been given
previously [51].Basically, if the oxide ions that have been taken into solution react
with the solvent to produce alumina, then adding alumina to the solvent will
repress the solubility. That is what happens when FeO and NiO dissolve [51]. If,
on the other hand, the solute reacts with alumina to produce some complex
species, then adding alumina to the solvent will increase the solubility. A detailed
study of the dependence of the solubility on alumina activity can reveal the
stoichiometry of the reactions involved, although there is necessarily an
assumption that the activity coefficients of the solute species are constant as the
alumina content is changed.
Figure 2.5 shows a plot of the experimental values for the titanium content of
solutions saturated with TiO2 as a function of the total oxide content of the melt,
(The total oxide content was varied by adding alumina, so that moving to the right
in Figure 2.5 represents going to higher alumina contents.) With increasing oxide
content, the titanium dioxide solubility initially decreases until the oxygen
concentration is ~3.5 wt pct. This indicates that the dissolution mechanism at low
alumina contents produces alumina, a% suggested by Eq. [1]. But at hi1lher
alumina contents, the solubility of TiO2 increases again, implying a reaction
between TiO2 and alumina to form a solute species, which has more than two
oxygen atmosphere Ti. In attempting to model the situation by interaction one
must then, at each stage, assign to the titanium the amount of oxygen
corresponding to the species currently being postulated, since it is only the
remaining oxide content that should be assigned to alumina and used to calculate
the alumina activity. This means that, until all the titanium species have been
correctly assigned, the alumina activities calculated are incorrect by an unknown
amount.

34
The equation of Dewing and Thonstad [52].
32
31
323232 OAlOAlOAl aaN += (2)
is used to convert alumina concentrations into alumina activities (N is the molar
fraction). The values of the coefficients and are 0.0772 ± 0.0025 and 0.159 ±
0.0048, respectively.
TiO2 + 2Na3Na3AlF6 = TiOF 2-xx + Al2OF2-
6 + (6 X )F- + 6Na+ (3)
The equation Eq. [3] is needlessly complicated for the present purpose and may
be written in terms of neutral species rather than ions as:
TiO2 + 2/3 AlF3 = TiF2 + 1/3 Al2O3 (4)
Since it suggests that the concentration of TiOF2 should be proportional to
Al2O3)-1/3, this equation accounts, at least qualitatively, for the initial drop in
solubility as alumina is added. One then needs to postulate a species rich in
oxygen to account for the rise in solubility at high alumina contents, and obvious
candidates are Na2TiO3 and Na4TiO4. Their formation reactions are
TiO2 + 1/3 Al2O3 + 2NaF = Na2TiO3 + 2/3 AlF3 (5)
TiO2 + 2/3 Al2O3 + 4NaF = Na4TiO4 + 4/3 AlF3 (6)
The Na2TiO3 hypothesis will be considered first. The first assumption made is
that Reactions [4] and [5] are independent of one another and that the two
equilibria are satisfied simultaneously. Next, the activities of all compounds
except alumina are considered constant-that of TiO2 because it is saturated and
those of AlF3 and NaF because the solvent composition is substantially constant.
The effects of the varying alumina and TiO2 contents on the activities of A1F3
and NaF are second order and will be neglected. One must also assume that
Henry's law applies to the solute species, so that activities can be replaced with
concentrations. This assumption seemed to work well in the cases of iron and

35
nickel[51], investigated earlier, but one may note that the concentrations of
titanium encountered are much higher than those of iron and nickel.
With these assumptions, one arrives at the following equations:
[TiOF2] = 31
1 32
−
OAlaK (7)
[Na2TiO3] = 31
2 32
−
OAlaK (8)
The constants K, and K2 are not the true equilibrium constants, since they do not
contain the activity terms for AlF3 and NaF. Square brackets indicate that the
units are in mol per 100 g solution. This concentration unit was chosen in
preference to weight percent to simplify the iterations.
The total titanium concentration is given by :
[Ti] = [TiOF2] + [ Na2TiO3] = K1 (32OAla ) -1/3 + K2(
32OAla ) +1/3 (9)
Multiplication by (32OAla ) +1/3 gives
[Ti] (32OAla )+1/3 = K1 + K2 (
32OAla ) +2/3 (10)
This equation is well suited to liner regression analysis, and iteration can be
started. All the titanium species contain at least one oxygen atom, so that
initially one oxygen atom per titanium atom is subtracted from the reported total
oxygen, and this leads to the first estimates of K, (intercept) and K2 (slope).
For the second (and subsequent) stages of the iteration, one must have an
estimate, for each experimental point, of how much of the Ti is present in each
of the forms postulated. The ratio of the two is given from Eqs. [7] and [8] by:
32
1
2
2
3232OAla
KK
TiOFTiONa
= (11)

36
With an estimate available for all of the terms on the right hand side, the oxygen
balance can be recalculated and the entire procedure repeated.
An analogous procedure is followed if one postulates Na4TiO4 as the second
species, the term (32OAla )+1/3 in Eq. [8] being replaced with (
32OAla )+1/3 [51-53].
With Phase diagram of cryolite Titanium dioxide can determine solubility of
TiO2 in Na3AF6 Figure 2.6- [53].
Figure 2.6. Cryolite Titanium dioxide system
2.6.2. Alumina in Cryolite
The solubility of A12O3 in cryolite melts and the melt structure of the NaF-
A1F3-A12O3 system have been active subjects of study for over a century
because of the industrial importance of primary aluminum production by the
Hall-Heroult process. Although many previous measurements of alumina
solubility have been published.

37
The measured solubility results are given in Table 2.6. The corresponding
melt chemistry data were calculated from the activity values for Al and Na,
which were measured by the individual activity probes. Each datum in Table
I is the average of results from two separate samples. The deviations for the
alumina solubility data from the average value for each datum point were
within 0.4 wt pct.
In Table 2.6. a maximum for the solubility of alumina in the cryolite melt
system at 1300 K occurs close to the cryolite ratio r = 4, and the solubility
decreases somewhat with further increase in the melt basicity. Also found a
maximum in alumina solubility in cryolite melts at around r = 4 at similar
temperatures. The equilibrium cryolite ratios for basic melts in Table 2.6,
were found to be systematically higher than the initial (weighed out) values.
This observation points out the uncertainty introduced for prior
measurements based on the initial cryolite ratio, without the use of any in-
situ acid/base determination.
Calculated MeltChemistry Alumina SolubilityInitial
CryoliteRatio r
EquilibriumCryolite Ratior a NaF aAlF3
WtPct
MolarFraction
3.0 2.98 0.353 4.43 X 10⁻⁷ 13.7 0.0763.5 3.58 0.459 1.56 X 10⁻⁷
14.7 0.0804.0 4.10 0.536 8.64 X 10⁻⁷ 15.2 0.0814.5 4.65 0.606 5.17 X 10⁻⁷ 15.1 0.0795.0 5.25 0.664 3.25 X 10⁻⁷ 14.8 0.0776.0 6.42 0.731 1.61 X 10⁻⁷ 14.5 0.0738.0 8.44 0.802 7.11 X 10⁻⁷ 12.7 0.06212.0 12.5 0.879 2.80 X 10⁻⁷ 10.2 0.048
Table 2.6. Measured Al2O3 Solubility Data in Basic Cryolite Melts at 1300 K
Provides an understanding of the dissolution behavior of alumina ( -A12O3
and -A12O3) over a wide melt composition range of 1.5 < r < 12.5. A
comparison of the experimentally determined alumina solubility in the NaF-
AIF3 system at 1300 K and the solubility calculated using the present model is

38
shown in Figure 2.7. The vertical dashed line in Figure 3 separates the stability
ranges for a-A12O3 and -A12O3. In Figure 2.7, the solubility of alumina is
plotted as a function of -log aNaF, with the corresponding values for cryolite
ratio r also shown on the plot. The solubility lines from the experimental
measurements and from the modeling overlap each other, and therefore, the
modeled alumina solubility is shown as a solid line in Figure 2.7, with data
points indicating the experimentally measured solubility of alumina. The
alumina solubility data in the cryolite melt with the composition range of 1.5 <
r <3(open data points), while those for the composition range of 3 < r < 12.5
(solid data points) are from the present study. The other three lines in Figure
2.8 indicate the calculated dissolved alumina con tents contributed by the
acidic, neutral, and basic solutes:
Na2A12OF6. Na2A12O2F4. and Na4A12O2F6, respectively. The concentration of
dissolved A12O3 in Figure 2.7 is expressed in molar fraction, which is based on
the three-component system NaF-AlF3A12O3, without considering the
existence of Na3A1F6, Na2A1F5, or NaA1F4. In Figure 2.8, at a low basicity,
the acidic solute Na2A12OF6 is the dominant species. However, as the melt
becomes less acidic, even for a cryolite ratio > 3, the neutral solute
Na2A12O2F4 is more important than the other two complexes. The neutral
solute reaches a maximum concentration in Figure 3 at about r = 3 to 4,
consistent with the coefficients for its formation reaction of :
)()(32)(2)(
32
4222332 lFOAlNasAlFlNaFsOAl =++
The basic solute Na4A12O2F6 gains importance in the basic melt, and reaches
a maximum concentration at r = 5 to 6, consistent with the coefficients for its
formation reaction of :
)()(32)(4)(
32
6222332 lFOAlNasAlFlNaFsOAl =++

39
The concentrations of all the assumed solute complexes in the cryolite melts
for 1.5 < r < 12.5 were calculated according to the present model, and the
calculated results are plotted in Figure 2.9. In this case, the molar fractions
refer to the solution comprising seven solutes, which sum to unity.
From Figure 2.8, in the acidic melt with the cryolite ratio r close to 1.5,
NaA1F4 and Na2A12OF6 are dominant for oxygen-free and oxygen-containing
solutes, respectively. For a less acidic melt or a basic melt, Na2AlF5 and then
NaF become the dominant oxygen-free solutes while Na2A12O2F4 is the most
important of the three oxygen containing solutes [54].
Figure 2.7.Comparison of Al2O3 solubility in the NaF-AlF3 system at 1300 K asa function of melt basicity from experiments (data points) and calculated fromthe present model (top line). The open data points for 1.5 < r < 3. while the soliddata points for 3 < r < 12.5 are from the present study. The other three linesrepresent the individual A1=03 solubility contribution by acidic (Na2Al3OF6),neutral (Na2A13O2F4), and basic (Na4Al2O2F6) solutes, respectively.

40
Figure 2.8.Calculated concentrations of all solutes for an alumina-saturatedcryolite melt at 1300 K.
With phase diagram of cryolite alumina can determine solubility Figure
2.9,[49].
Figure 2.9. cryolite alumina system

41
2.6.3. Na3 AlF6 – Al2O3 – B2O3
The density and surface tension of liquid boron oxide have values lower than
those of components of the cryolite- alumina melt. Therefore boron oxide
will obviously be a surface-active component in this system, and will be ad-
sorbed onto its surface layer
Melt (Mgm-3) (mNm-1)
B2O3(1) 1.518 83
Al2O3(l) 3.03 1000
Na3 AlF6 ( l) 2.095 136
Table 2.7. Density and surface tension components of the melt at 1000 OC
Boron oxide will interact with the components of the cryolite-alumina melt
according to the reactions the deposition of titanium is followed by an
irreversible chemical reaction:
NaF + mB2O3 = NaF*mB2O3 (m = 1. or 2) (1)
2A1F3 + B2O3 = Al2O3 + 2BF3(g) (2)
nAl2O3 + mB2O3 = nAl2O3mB2O3 (n:m = 2:1; 9:2) (3)
High losses of boron from the melt have been observed, obviously due to the
formation of gaseous boron fluoride (see reaction [2]). Stabilization of boron
oxide in the cryolite melt has been achieved by introducing B2O3 into the
melt in the form of a complex oxide Al2B2O9, Boron is deposited from a
cryolite-alumina melt in a three-electron irreversible charge transfer process
[56].
42
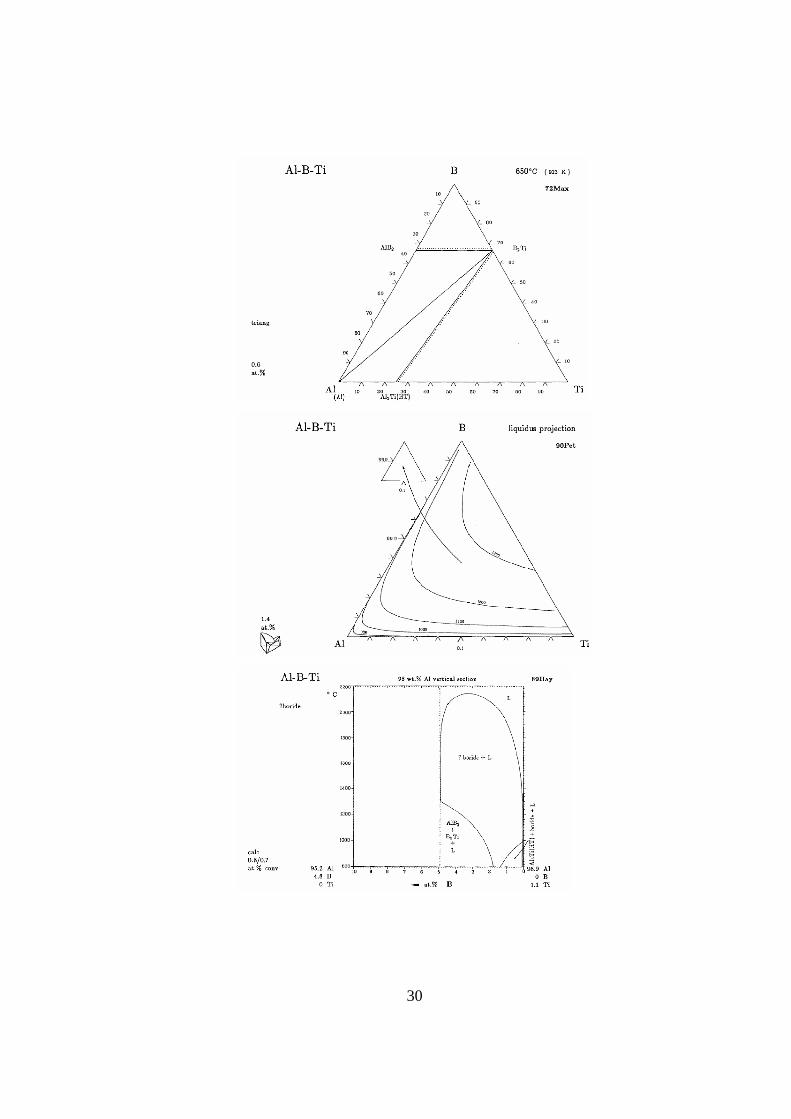
2.6.4. B2O3 – TiO2 – NaF
Mixtures along the joins Na(B2O3)F - NaTiO2F, Na(B2O3)F - TiO2, and
Na(B2O3)2F - TiO2 were melted, annealed at 600° and 900°C and quenched.
The phases were characterized by X-ray diffraction and microscopy,
"Analytical reagent" TiO2, B2O3, and NaF were used as starting materials,
Specimen preparation is described.
At 600°C the only phases identified were NaF, Na(B2O3)F, Na(B2O3)2F, and
TiO2. The binary peritectic compound Na(TiO2)F which dissociates at
1070°C was not observed in mixtures having B2O3 content above 10%
(molar) at 900°C and above. The only phases identified were NaF, TiO2, and
glass. The absence of titania-containing compounds implies that Ti02 can be
recrystallized from melt. The solubility of TiO2 in melts could be obtained by
constructing the liquidus surface. This was done as explained in Figure. 2.10-
2.11. The hatched area indicates the regions of compositions which melt
completely below 1400°C and separate acicular rutile in cooling. Higher
temperatures cause volatilization of NaF. The variation in the viscosity of
melt with temperature was carried out for six ternary mixtures.
Seven ratios of B2O3/NaF were mixed with different amounts of TiO2.
Mixtures were melted and DTA was used to fix the points at which
crystallization started (the liquidus temperature). The results were refined by
cooling melts from various temperatures within the limits of 10°, 20°, and
30°C from the temperatures established by DTA and by examining the
morphology of TiO2 crystals separated. The temperature at which the isometric
TiO2 disappeared and on cooling only acicular crystals appear was taken as the
liquidus temperature. These results were used to construct the isotherms of
solubility [55].

43
Figure 2.10. System B2O3 NaF TiO2
Figure 2.11. B2O3 NaF TiO2 Solubility isotherms for TiO2

44
2.6.5. Titanium diboride – Liquid Aluminum
Solubility of titanium diboride in molten aluminum at 1300 K is 6 X 10⁻³
wt.%. Equilibrium between liquid aluminum and solid titanium diboride is
reached within 10h of their contact in a library cell, The solubility of
aluminum in titanium diboride at 1300 K is so low that it could not be
measured [56].
2.6.6. Titanium dioxide - Liquid Aluminum
Interest in commercial applications of metal matrix composites has resulted in the
development of a variety of synthesis techniques for these materials. Typically,
these procedures have attempted to limit the reaction between the matrix and the
reinforcement by control of process temperature, time, or matrix composition.
Additionally, various reinforcement coatings have been applied to prevent this
"adverse" reaction. Other approaches, e.g., reactive infiltration, metal oxidation,
self-sustaining high-temperature synthesis, and reactive hot isostatic pressing,
have recognized the inevitability of these reactions and have used this knowledge
to fabricate composites containing a stable matrix/reinforcement interface. For
example, reactive infiltration can result in formation of a thermodynamically
stable reinforcing ceramic phase through simultaneous melt infiltration and
reaction of the porous preforms. This process also offers the advantage of
producing metal matrix composites having potentially attractive high-temperature
properties through low-cost-low-temperature processing. Finally, by altering the
stoichiometry of the reactants, composites with different compositions can be
produced.
Recently, successfully produced discontinuously reinforced A12O3-titanium
aluminum composites by reactive infiltration of TiO2 preform with molten
aluminum. These authors have shown that various reactions may be observed in
the TiO2-Al system; i.e.,
TiO2 + Al - A12O3 + A1XTiy (1)
45
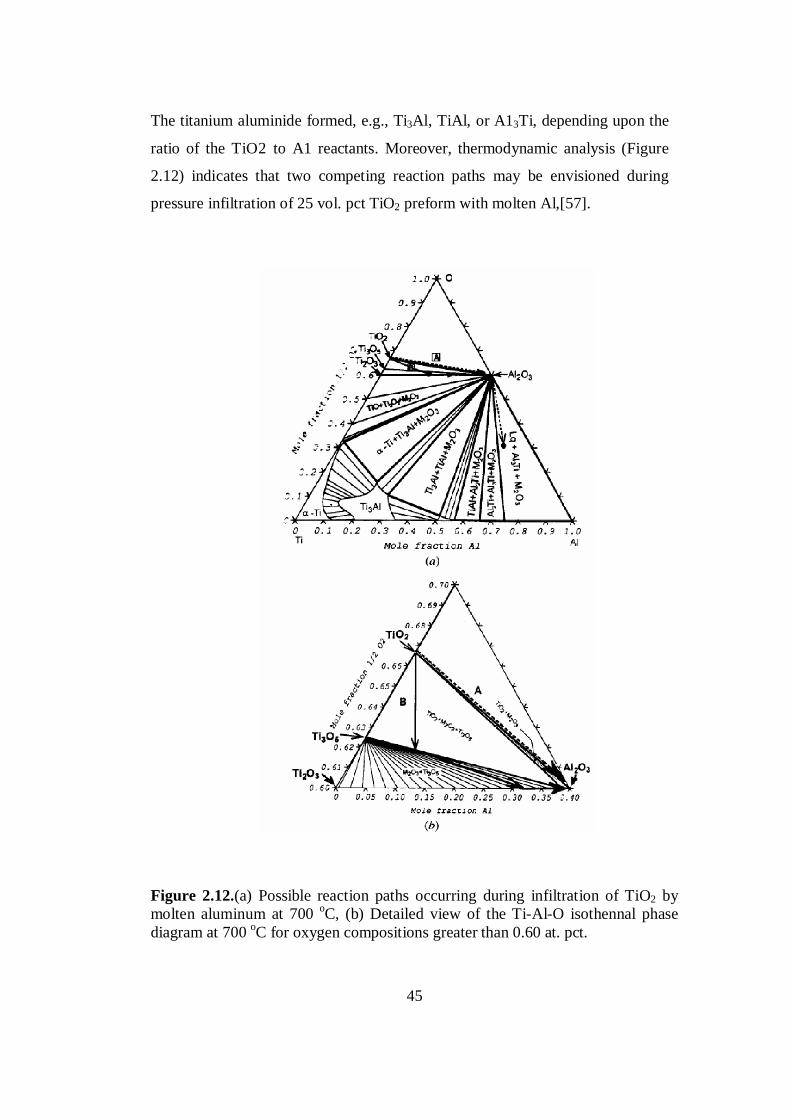
The titanium aluminide formed, e.g., Ti3Al, TiAl, or A13Ti, depending upon the
ratio of the TiO2 to A1 reactants. Moreover, thermodynamic analysis (Figure
2.12) indicates that two competing reaction paths may be envisioned during
pressure infiltration of 25 vol. pct TiO2 preform with molten Al,[57].
Figure 2.12.(a) Possible reaction paths occurring during infiltration of TiO2 bymolten aluminum at 700 oC, (b) Detailed view of the Ti-Al-O isothennal phasediagram at 700 oC for oxygen compositions greater than 0.60 at. pct.

46
Figure 2.12.(c) Calculated TiO2-Al pseudobinary phase diagram.
2.7. Processing Methods for Particle Metal Matrix Composite.
A variety of processing techniques have evolved over the last two decades in
effort to optimize the structure and properties of particulate reinforced MMCs.
The processing methods utilized to manufacture particulate reinforced MMC can
be grouped depending on the reinforcement synthesis. Accordingly, the processes
can be classified into two categories;
a) Particle incorporation processes
b) in-situ processes
In particle incorporation processes reinforcement materials are produced
separately and then added to the matrix during a secondary process. These

47
processes can be classified according to the temperature of metallic matrix during
processing. Accordingly, the processes can be classified in to three categories;
a) Solid phase processes
b) Liquid phase processes
c) Two phase processes
In in-situ processing of particulate reinforced MMCs, the reinforcing phase is
synthesized within the matrix during composite fabrication. This contrasts with
ex-situ composites where the reinforcing phase is synthesized separately and then
inserted into the matrix during a secondary process [58]. Also, there are a number
of processes and classes of in-situ composites, including processes where the
precipitation of reinforcements occurs in the liquid state and processes where
precipitation occurs in the solid state. Therefore to distinguish in-situ process from
other processes, processing techniques for particulate reinforced MMCs will be
classified into four categories as[12]:
a) Solid phase processes
b) Liquid phase processes
c) Two phase processes
d) In-Situ Processes
2.7.1. Processing steps:
Pre-processing: all steps which precede primary processing (e.g., surface
treatment of ingredient materials, or preform fabrication for infiltration
processing).
Preform: a shaped porous assembly of ingredient material elements (such as
fibres, whiskers or particles). Typically, preforms are produced for subsequent
infiltration with liquid metal, or foil-fibre-foil stacks prior to diffusion bonding.
The mechanical stability of the shape may be provided by the adjunction of a

48
binder, potentially but not always fugitive, and amounting to only a few mass %
of the preform.
Hybrid preform: a preform containing at least two types of ingredient material
elements which form at least two distinct "reinforcing" constituents in the
composite (e.g. particulate-fibre mixtures, hollow micro-spheres).
Primary processing of composites: production of composite material by
combining ingredient materials (e.g.. powdered metal and loose ceramic particles,
or molten metal and fibre preforms), but not necessarily to final shape or final
microstructure.
Continuous MMC primary process: a process for the production of MMC
material that is essentially continuous (e.g.. foil-fibre-foil diffusion bonding using
a rolling mill, or continuous infiltration).
Secondary processing: processing steps which follow primary processing, and
aim to alter the shape or microstructure of the material (e.g.. shape casting,
forging, extrusion, heat-treatment, machining). Secondary processing may change
the constituents (phases, shape) of the composite.
Consolidation of MMC: a secondary composite manufacturing process during
which composite elements are consolidated (e.g.. the consolidation of composite
elements consisting of the reinforcement coated with the matrix metal).
MMC insertion casting: a secondary process for production of partially
reinforced components, in which a pre-fabricated MMC is placed within a mould,
and incorporated into a metal or alloy by a casting process.
Partially reinforced metal component: semi-products or components which
contain MMC material metallurgically bonded to a conventional metal or alloy
(e.g. by diffusion bonding, insertion casting, co-extrusion).

49
In-situ MMC: a MMC in which the ingredient reinforcement material changes its
phase or shape during primary composite processing (e.g. TiB2 reacts to form TiC
in some metals by adding carbon). To be an MMC, the constituents must,
however, retain its local identity, although they change in shape and/or
composition (otherwise, it is an alloy).
2.7.2. Solid phase processes
The fabrication of particulate reinforced MMCs from blended elemental powders
involves a number of steps prior to final consolidation; two of the processes
powder metallurgy and high energy rate processing are described below.
2.7.2.1.Solid State Processing :
MMC diffusion bonding: a primary process for composite fabrication in the
solid state, in which stacks of matrix metal and reinforcement ingredients (usually
parallel fibre monolayers and matrix foils, see also fibre winding) are
encapsulated and bonded together after evacuation by mechanical pressure at
elevated temperature to enhance diffusion.
Foil-fibre-foil method (also called foil-fibre method): a primary composite
production process wherein layers of metal foil and ceramic monofilament fibres
are alternatively stacked to produce precursor materials for subsequent diffusion
bonding, specifically hot pressing.
Wire winding: a method for production of precursor MFRM material produced
by co-winding metal wires and ceramic fibres for subsequent diffusion bonding,
specifically hot pressing
Powder cloth method: variant of the foil-fibre-foil method for production of
MFRM, in which matrix metal powders and a binder are mixed and formed into a
cloth or foil before stacking.

50
Powder consolidation: a diffusion bonding (primary) process in which matrix in
powder form is blended or otherwise placed next to the reinforcing ingredient
material, and consolidated with or without pressure and elevated temperature.
MMC sintering: consolidation of ingredient materials at elevated temperatures
without application of pressure.
MMC liquid phase sintering: consolidation of ingredient materials comprising
the presence of a liquid phase (at least temporarily) in the compact.
MMC hot pressing: consolidation of ingredient materials by diffusion bonding
with application of pressure by means of a piston (a hot press) at temperatures
high enough to effect concurrent sintering of the matrix, which for metal matrices
is generally above the matrix recrystallisation temperature.
MMC cold pressing: consolidation of ingredient materials with application of
pressure by means of a piston, at temperatures too low to effect concurrent
sintering of the matrix, which for metal matrices is generally below the matrix
recrystallisation temperature.
MMC hot isostatic pressing (HIP): diffusion bonding of ingredient materials
with application of hydrostatic pressure by means of a gas, at temperatures high
enough to effect concurrent sintering of the matrix, which for metal matrices is
generally above the matrix recrystallisation temperature.
MMC cold isostatic pressing (CIP): cold pressing of ingredient materials with
application of hydrostatic pressure by means of a fluid (or gas), at temperatures
too low to effect concurrent sintering of the matrix, which for metal matrices is
generally below the matrix recrystallisation temperature.
MMC powder rolling: consolidation of ingredient materials with application of
pressure by means of a rolling mill, Cold rolling occurs below the recrystallisation
temperature of the metal, hot rolling at higher temperatures.

51
MMC powder extrusion: consolidation of ingredient materials with application
of pressure by means of an extrusion press, cold extrusion occurs below the
recrystallisation temperature of the metal, hot extrusion at higher temperatures.
MMC powder forging: consolidation of ingredient materials with application of
pressure by means of a forging press. Cold forging occurs below the
recrystallisation temperature of the metal, hot forging at higher temperatures.
2.7.3. Powder metallurgy
Solid phase processes invariably involve the blending of rapidly solidified
powders with particulates, platelets or whiskers, using a number of steps, as
shown in Figure.2.12.a, These include: sieving of the rapidly solidified powders;
blending with the reinforcement phase(s), pressing to approximately 75% density,
degassing and final consolidation by extrusion, forging, rolling, or some other hot
working method. This technology has been developed to various degrees of
success by various commercial manufacturers, including: Alcoa (Pennsylvania,
PA). Ceracon Inc. (Sacramento. CA).
DWA Composites Specialties Inc, (Chatsworth. CA). Naval Surface Weapons
Center. White Oak Laboratory (Silver spring. MD) and Advanced Composite
Materials Corp. (Greer. SC). The Alcoa and the Ceracon processes are shown
diagrammatically in Figure.2.12.b and c, respectively. Consolidation of the MMC
preform is achieved by hot extrusion in the Alcoa process, whereas in the Ceracon
process, final densification is achieved by hot pressing in a pressure transmitting
medium (PTM). The PM methods have been successfully applied to a large
number of metal/ceramic combinations. In terms of microstructureal requirement,
the powder metallurgy approach is superior in view of the rapid solidification
experienced by there powders. This allows the development of novel matrix
materials outside the compositional limits discated by equilibrium
thermodynamics in conventional solidification processes [11].

52
Figure 2.12. Schematic diagrams of (a) PM-MMC fabrication steps. (b) the Alcoaprocess and (c) the Ceracon process . In the Ceracon process (1) Half of the PTM(621 oC) is poured into a preheated die, and the preform is placed into the die, (2)The die is then filled completely with the remainder of the heated PTM. (3) Apressure of 180 ksi (1.24 GPa) is applied to consolidate the preform. (4) Afterpressing, the part is removed, and the hot PTM is recycled to the PTMheater.Hard-to deform metals. Frictional heating at the powder-particle

53
2.7.4. High - Energy - High - Rate Consolidation
This consolidation process of powder blends is most suitable for rapidly solidified
(RS) metals and hard-to deform metals. Frictional heating at the powder-particle
interface causes local melting and consolidation, and rapid heat extraction by the
cooler particle interior causes rapid solidification. Thus, an RS microstructure can
be better preserved by this method. High-rate consolidation leads to strengthening
of alloys (due to high dislocation density) but reduced ductility. Composites
produced by this method often contain cracks. It has yet to be shown if reasonable
composite properties can be achieved by this method.
Mechanical alloying is truly a solid-state process that can -be applied to
particulate composites. In this method, a high-energy impact mill is used to
continuously fragment and reweld the powder particles as fresh internal surfaces
are exposed. The continuous fragmentation leads to thorough mixing of the
constituents, and subsequent processes such as hot pressing and extrusion are used
to consolidate and/or synthesize the alloy or composite [59].
This approach involves the consolidation of a metal-ceramic mixture through the
application of a high energy in a short period of time. An inspection of the
available literature reveals that both mechanical and electrical high energy sources
have been successfully utilized to consolidate MMCs. The high-energy-high-rate
(1MJs-1) pulse permits the rapid heating of a conducting powder in a cold wall
die. The short time at temperature approach offers the opportunity to control
phase transformations and the degree of microstructural coarsening not readily
possible using standard powder processing methods. This process has also been
successfully applied to manufacture Al-SiC and (Ti3A1 + Nb)-SiC composites
[11].
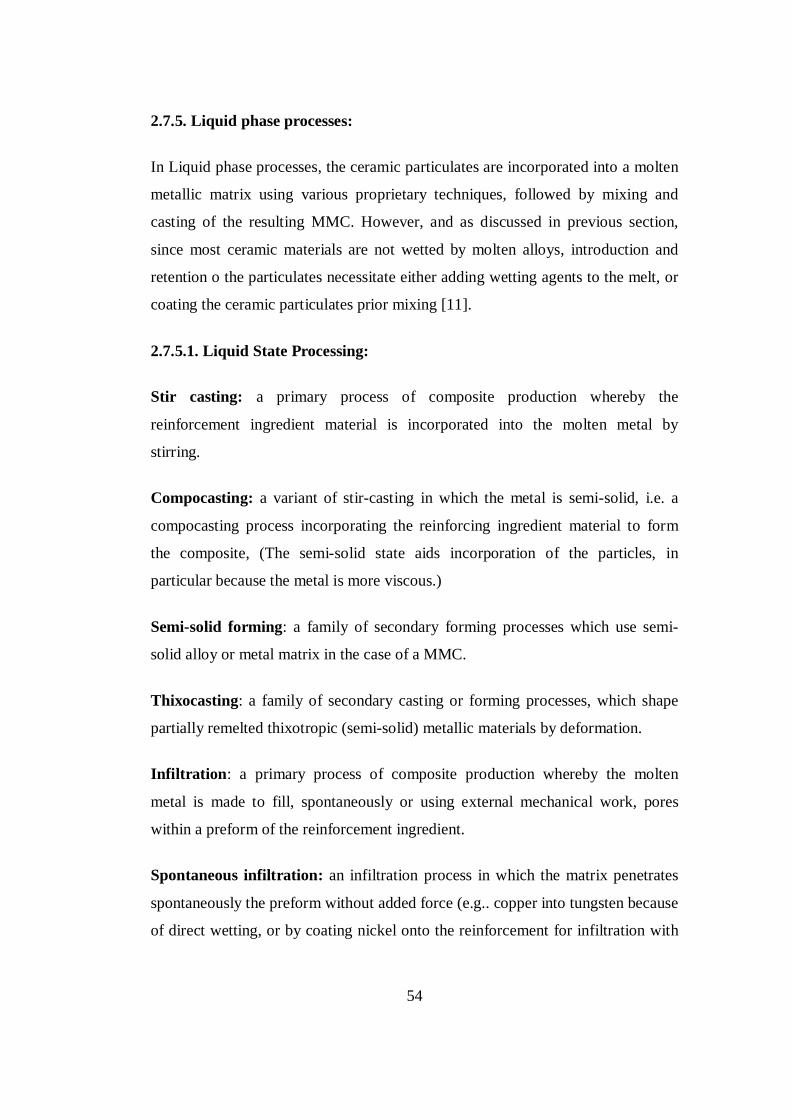
54
2.7.5. Liquid phase processes:
In Liquid phase processes, the ceramic particulates are incorporated into a molten
metallic matrix using various proprietary techniques, followed by mixing and
casting of the resulting MMC. However, and as discussed in previous section,
since most ceramic materials are not wetted by molten alloys, introduction and
retention o the particulates necessitate either adding wetting agents to the melt, or
coating the ceramic particulates prior mixing [11].
2.7.5.1. Liquid State Processing:
Stir casting: a primary process of composite production whereby the
reinforcement ingredient material is incorporated into the molten metal by
stirring.
Compocasting: a variant of stir-casting in which the metal is semi-solid, i.e. a
compocasting process incorporating the reinforcing ingredient material to form
the composite, (The semi-solid state aids incorporation of the particles, in
particular because the metal is more viscous.)
Semi-solid forming: a family of secondary forming processes which use semi-
solid alloy or metal matrix in the case of a MMC.
Thixocasting: a family of secondary casting or forming processes, which shape
partially remelted thixotropic (semi-solid) metallic materials by deformation.
Infiltration: a primary process of composite production whereby the molten
metal is made to fill, spontaneously or using external mechanical work, pores
within a preform of the reinforcement ingredient.
Spontaneous infiltration: an infiltration process in which the matrix penetrates
spontaneously the preform without added force (e.g.. copper into tungsten because
of direct wetting, or by coating nickel onto the reinforcement for infiltration with

55
aluminum, or by control of the atmosphere and the alloy composition as in the
Lanxide-PrimexÔ process).
Forced infiltration: an infiltration process which is not spontaneous, i.e., which
requires application of mechanical force onto matrix or reinforcement.
Pressure infiltration: an infiltration process in which hydrostatic pressure is
applied onto the molten matrix surface to drive the liquid into the preform.
Vacuum infiltration: an infiltration process in which a hydrostatic pressure of
one bar applied by the atmosphere onto the molten matrix drives it into an
evacuated preform. In some processes the vacuum can be self-generated, for
example by reaction of magnesium with air or oxygen in the preform.
Gas pressure infiltration: a pressure infiltration process which uses pressurized
gas to apply pressure on the metal surface driving the liquid into a preform.
Pressure assisted investment casting: an investment casting process where a
preform is integrated into the pattern and the assembly is cast while the mould and
the melt are under hydrostatic gas pressure.
Mechanical pressure infiltration: a pressure infiltration process which uses a
moving solid part to apply pressure on the melt surface driving the liquid into a
preform.
Squeeze casting infiltration: a mechanical pressure infiltration process in which
a preform is placed into a solid mould, and pressure infiltration is affected with a
moving solid piston providing laminar flow of the molten matrix into the mould.
Variants include direct squeeze casting, in which the piston surface represents a
fraction of the final casting surface; and indirect squeeze casting, in which the
piston acts on the ingate to the die.
Pressure die infiltration: an infiltration process which uses a pressure die casting
apparatus, in which a preform is placed into a solid mould, and pressure

56
infiltration is effected with a moving solid piston causing turbulent flow of the
melt upstream of the preform.
Centrifugal infiltration: an infiltration process in which centrifugal force is used
to drive the molten matrix into the preform.
Ultrasonic infiltration: an infiltration process in which ultrasonic pressure waves
are used to drive the molten matrix into the preform.
Lorentz force infiltration, or electromagnetic infiltration: an infiltration
process in which electromagnetic forces push the molten matrix into the preform.
Spray casting: a primary process of composite production whereby the metal is
sprayed onto a substrate. For composites, the reinforcement is either already
incorporated in the sprayed melt (e.g.. by stir-casting), is combined during
spraying with the metal, by injection of the reinforcement ingredient material into
the sprayed metal droplet stream, or is co-sprayed, i.e., sprayed at the same time
as the matrix onto the substrate.
2.7.5.2. Liquid metal – ceramic particulate mixing
Several approaches have been successfully utilized to introduce ceramic
particulates into an alloy melt. These include: (a) injection of powders entrained
in an inert carrier gas into the melt using an injection gun; (b) addition of
particulates into the molten stream as it fills the mould; (c) addition of particulates
into the melt via a vortex introduced by mechanical agitation; (d) addition of
small briquettes into the melt followed by stirring. (These briquettes are made
from co-pressed aggregates of the base alloy powder and the solid particulates);
(e) dispersion of the particulates in the melt by using centrifugal acceleration; (f)
pushing of the particulates in the melt by using reciprocating rods; (g) injection of
the particulates in the melt while the melt is being irradiated with ultrasound; and

57
(h) zero gravity processing. The last approach involves utilizing an ultra-high
vacuum and high temperature for long periods of time.
In the processes described above, a strong bond between the matrix and the
reinforcement is achieved by utilizing high processing temperatures (e.g. T >
900oC for the Al-Al2O, system) and alloying the matrix with an element which
can interact with the reinforcement to produce a new phase and effect "wetting"
between the matrix and the ceramic (e.g.. Li in Al-SiC system). Agitation during
processing is also essential to disrupt contamination films and adsorbed layers to
facilitate interfacial bonding.
To date, liquid phase processes have reached an advanced stage of development.
and -SiC or Al2O3 (3 to 150 gm) particulates are routinely added to a variety of
aluminum alloy matrices.
Despite the encouraging results obtained with liquid phase processes, some
difficulties exist. These include: agglomeration of the ceramic particulates during
agitation, settling of particulates, and segregation of secondary phases in the
metallic matrix, extensive interfacial reactions, and particulate fracture during
mechanical agitation [11].
2.7.5.3. Melt infiltration
In melt infiltration processes, a molten alloy is introduced into a porous ceramic
reform, utilizing either inert gas or a mechanical device as a pressurizing medium.
The pressure required combining matrix and reinforcement is a function of the
friction effects due to viscosity of the molten matrix as it fills the ceramic
preform. Wetting of the ceramic preform by the liquid alloy depends on: alloy
composition, ceramic preform material, ceramic surface treatments, surface
geometry, interfacial reactions, atmosphere, temperature and time [60].
Some of the drawbacks of this process include reinforcement damage, preform
compression, microstructural nonuniformity, coarse grain size, contact between
reinforcement fibers or particulates and undesirable interfacial reactions [61].
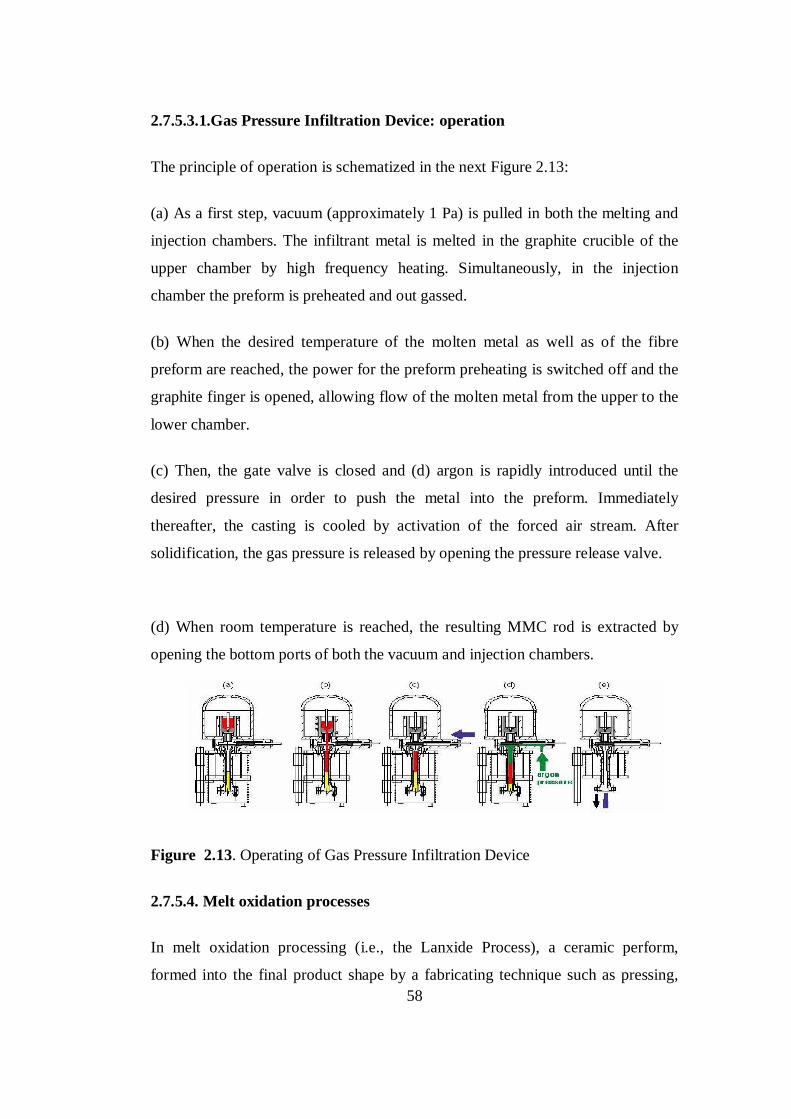
58
2.7.5.3.1.Gas Pressure Infiltration Device: operation
The principle of operation is schematized in the next Figure 2.13:
(a) As a first step, vacuum (approximately 1 Pa) is pulled in both the melting and
injection chambers. The infiltrant metal is melted in the graphite crucible of the
upper chamber by high frequency heating. Simultaneously, in the injection
chamber the preform is preheated and out gassed.
(b) When the desired temperature of the molten metal as well as of the fibre
preform are reached, the power for the preform preheating is switched off and the
graphite finger is opened, allowing flow of the molten metal from the upper to the
lower chamber.
(c) Then, the gate valve is closed and (d) argon is rapidly introduced until the
desired pressure in order to push the metal into the preform. Immediately
thereafter, the casting is cooled by activation of the forced air stream. After
solidification, the gas pressure is released by opening the pressure release valve.
(d) When room temperature is reached, the resulting MMC rod is extracted by
opening the bottom ports of both the vacuum and injection chambers.
Figure 2.13. Operating of Gas Pressure Infiltration Device
2.7.5.4. Melt oxidation processes
In melt oxidation processing (i.e., the Lanxide Process), a ceramic perform,
formed into the final product shape by a fabricating technique such as pressing,

59
injection moulding or slip casting, is continuously infiltrated by a molten alloy as
it undergoes an oxidation reaction with a gas phase (most commonly air). The
high temperature oxidation of the molten alloy in the interstices of the ceramic
preform produces a matrix material composed of a mixture of oxidation reaction
products and unreacted metal alloy .The primary advantage of this process is
derived from its ability to form complex, fully dense composite shapes. Attractive
combinations of mechanical properties have been reported for aluminum based
MMCs processed using this approach. A joint venture between Lanxide and
Alcan, the Alanx Products L.P., has commercially produced a composite
designated as Alan CG893, an alumina-aluminum alloy matrix grown around
silicon carbide filler. This product has been demonstrated to exhibit exceptional
erosive wear resistance [11].
2.7.6. Two Phase Processes:
2.7.6.1. Osprey deposition
In the Osprey process, the reinforcement particulates are introduced into the
stream of molten alloy which is subsequently atomized by jets of inert gas. The
sprayed mixture is collected on a substrate in the form of a reinforced metal
matrix billet. This approach was introduced by ALCAN as a modification of the
Osprey process [62]. See Figure. 2.14. This process combines the blending and
consolidation steps of the PM process and thus promises major savings in MMC
production.
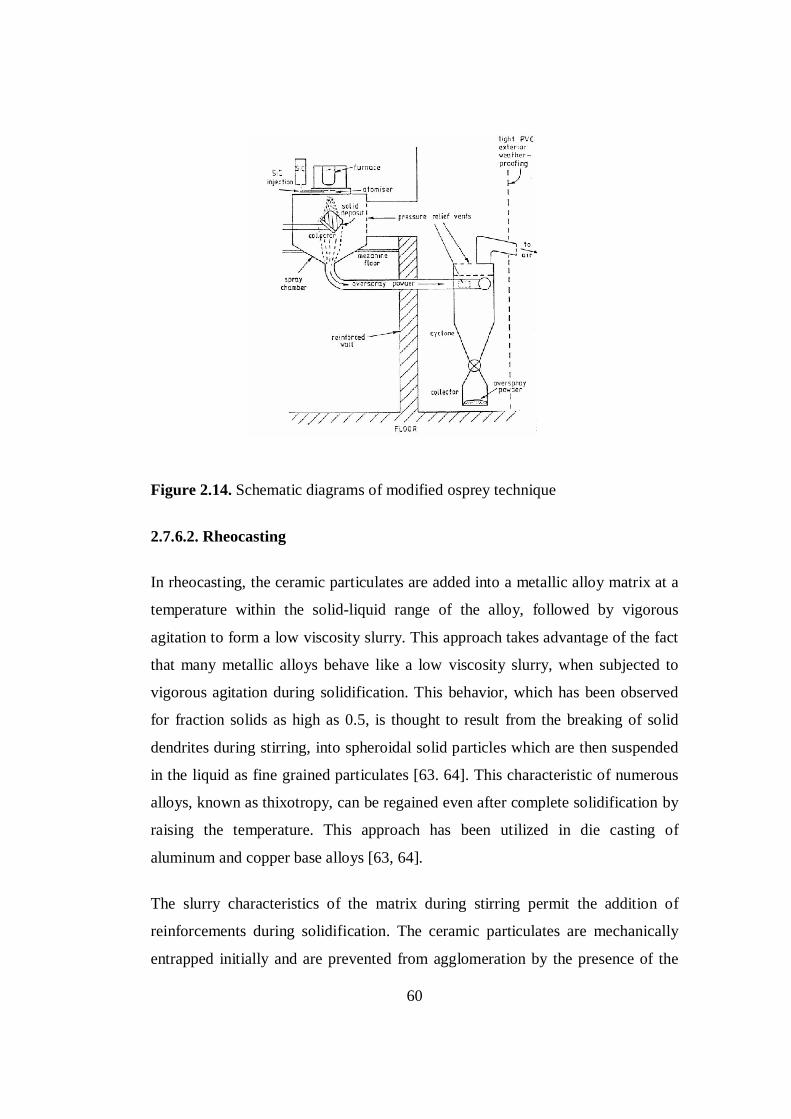
60
Figure 2.14. Schematic diagrams of modified osprey technique
2.7.6.2. Rheocasting
In rheocasting, the ceramic particulates are added into a metallic alloy matrix at a
temperature within the solid-liquid range of the alloy, followed by vigorous
agitation to form a low viscosity slurry. This approach takes advantage of the fact
that many metallic alloys behave like a low viscosity slurry, when subjected to
vigorous agitation during solidification. This behavior, which has been observed
for fraction solids as high as 0.5, is thought to result from the breaking of solid
dendrites during stirring, into spheroidal solid particles which are then suspended
in the liquid as fine grained particulates [63. 64]. This characteristic of numerous
alloys, known as thixotropy, can be regained even after complete solidification by
raising the temperature. This approach has been utilized in die casting of
aluminum and copper base alloys [63, 64].
The slurry characteristics of the matrix during stirring permit the addition of
reinforcements during solidification. The ceramic particulates are mechanically
entrapped initially and are prevented from agglomeration by the presence of the

61
primary alloy solid particles. The particulates subsequently interact with the liquid
matrix to effect bonding. Furthermore, the continuous deformation and
breakdown of the solid phases during agitation prevent particulate agglomeration
and settling. This method has been successfully utilized by Mehrabian et al. [63]
to incorporate up to 30 wt % of A1 3. SiC, and up to 21 wt % glass particles 14 to
340 pin diameter, in a partially solidified, - 0.40 to 0.45 fraction solid. Al-5%Si-
2%Fe alloy. The majority of the particulates were found to be homogeneously
distributed in the matrix, except for coarser, 3401µm size, particulates which
settled during solidification.
2.7.6.3. Variable co-deposition of multi-phase materials (VCM)
During VCM processing, the matrix material is disintegrated into a fine dispersion
of droplets using high velocity gas jets. Simultaneously, one or more jets of
strengthening phases are injected into the atomized spray at a prescribed spatial
location Figure 2.15, where the droplets contain a limited amount of volume
fraction of liquid. Hence, contact time and thermal exposure of the particulates
with the partially solidified matrix are minimized, and interfacial reactions can be
controlled. In addition, tight control of the environment during processing
minimizes oxidation [11].
Figure 2.15. Schematic diagram of the variable co-deposition technique

62
2.7.7. In-Situ Processing.
Fabrication of in-situ composites involves synthesizing the reinforcing phases
directly within the matrix. This approach is in contrast to ex-situ composites
where the reinforcements are synthesized separately and then introduced into the
matrix during a secondary process such as melting, infiltration or powder
processing [65].A variety of techniques has been devised to produce in-situ
composites. Essentially, these techniques have been derived from conventional
P/M and casting approaches and are modified to produce in-situ phases through
thermodynamic and kinetic control of the reactions [66]. Fabrication techniques
like the LanxideTM process [8], Martin-Marietta s XDTM synthesis [8], self
propagating high temperature synthesis (SHS) [67], reactive gas injection (RGI)
process [67] and plasma deposition [68-69] are widely known. Owing to the
formation of the reinforcement within the matrix during fabrication, there are
several potential advantages associated with in-situ composites. The main aspects
include size and distribution of the particles, good interfacial bonding and
economy in processing. In-situ processing is able to produce reinforcements in the
order of 0.5-5 mm [65]. This form of fine reinforcement, coupled with a better
distribution of particles, facilitates strengthening and thus leads to better
mechanical properties [71]. Similarly, this reinforcement also provides for a lower
propensity for particle fracturing [65]. Since the process involves no contact with
air or gases, a cleaner particle-matrix interface automatically dictates a higher
interfacial strength [72]. With ex-situ processing, there is difficulty in handling
fine-scale reinforcement. Particles of size less than 1 mm are extremely reactive
such that problems related to agglomeration and health hazards have to be
considered. With in-situ methods, the problems of producing and handling the
fine reinforcing phase directly are avoided. There are several approaches to
synthesize in-situ Al-TiB2 composite. Among them, stir casting is the most
economical viability. In the synthesis of Al-TiB2 composite using Al-Ti-B system,
fine TiB2 particulates are created in the Al matrix when a (Ti-B) mixture is added
to molten Al at above 1000 oC. However, the uniform distribution of the
reinforcement may be hindered by the presence of Al3Ti [73,74]. a brittle

63
compound that degrades the mechanical properties of the composite, Al3Ti
exhibits high strain-rate sensitivity [75] and its flakes have been found to initiate
and propagate cracks [73] hence causing low ductility in the composite.
Elimination of this compound is therefore a primary concern for a successful
synthesis of Al-TiB2 composite. One feasible approach is to encourage chemical
reaction between Ti with an element. For example, excess B (from B2O3) has been
employed to react with Ti (from TiO2) to produce TiB2 and Al2O3 reinforcement
in the composite [75-76].
Ceramic particle-reinforced aluminum metal matrix composites (MMCs)
fabricated by in situ processes have been extensively studied due to their
potentially low fabrication cost [76-82]. In in-situ fabrication, a chemical reaction
leads to the formation of thermodynamically stable reinforcing ceramic phase(s)
during the process. Some of these techniques include DIMOXTM. XD TM.
reactive gas infiltration and high-temperature self-propagating synthesis (SHS). In
situ MMCs can be more cost effective and have higher mechanical strength,
particularly at relatively higher operating temperature. Saving in cost may come
from the reduction or elimination of processing steps and the need to add
reinforcing components. Phase changes, recrystallization or nucleation occurring
in the in situ chemical process produce more uniform distribution of the
reinforcing phases in the sub-micrometre or even nanometre range resulting in
better mechanical properties of the final MMCs.
Using the in situ process, A1 MMCs have been fabricated using different starting
material systems. For example, in situ A12O3 particle reinforced A1 composite
has been prepared by the vortex method where the required amount of TiO2 was
added into the vortex formed in molten A1 at 1023 K. The reduced Ti from TiO2
is expected to dissolve into the Al melt producing an additional strengthening
effect [83]. TiO2 whiskers have been used to react with A1 by reaction squeeze
casting to fabricate composite materials with formation of reinforcing a-A12O3
phases and brittle TiA13 [84].

64
Reactive sintering has also been employed to produce small size TiB2-based parti-
culate MMCs from a compacted mixture of reactant powders [80]. The technique
is economical due to cheap starting powders and relatively low sintering
temperature. In addition, it may lead to the possibility of densifying the materials
with fewer additives or even without additives at all.
Al/(A12O3 + TiB2) composites have also been produced using Al-Ti-B [81], or
AlTiO2-B [82,85] as starting material system via reactive sintering route. Studies
on mechanisms of formation have verified the presence of small-size
reinforcement particles uniformly distributed in the A1 matrix with clean and
thermodynamically stable particle-matrix interfaces via suitable temperature
reactive sintering process.
A1 and its alloys have been chosen as the matrix materials mainly due to their low
melting point, low density, wide liquid temperature range, reasonably high
thermal conductivity, heat treatment capability, processing flexibility, availability
and lastly their low cost [77,81,86]. As for the reinforcement, TiB2 is chosen since
it is particularly suitable as reinforcement for Al-based reactive sintered
composites due to its high exothermic formation and thermodynamic stability in
A1 [77, 81].
2.7.8. Compocasting
The compocasting process is a method of producing particle; platelet or short fiber
reinforced metal matrix composites by pouring the reinforcing material into a
vigorously agitated molten or semi-solid metal, and then casting the mixture into a
mold or die. It has the potential of providing the lowest-cost means of producing
metal matrix composites compared to any other technology currently being
studied. The goal of the present study is to gain a better understanding of the
relationships between reinforcement type, alloy composition, and processing
parameters to the resulting microstructural and mechanical properties of the
composite.

65
A wide variety of reinforcing materials were used in this study comprising
whisker, short fiber, and particle and platelet morphologies. Silicon carbide was
the most thoroughly studied of these materials, and was employed in the form of
whiskers, platelets and particles. Titanium diboride platelets of 6 micrometer
average diameter, and short A120g fibers of 3 micrometer diameter and 3 to 75
micrometers long were also used, and both gave better results than the silicon
carbide.
The addition of high strength, high modulus, and refractory particles to a ductile
metal matrix will produce a material whose mechanical properties are
intermediate between the matrix alloy and the ceramic reinforcement. Compared
to the unreinforced alloy, such a composite can have increased yield strength,
ultimate strength, and modulus and wear resistance. This improvement will be
even more pronounced at elevated temperatures. These strength increases,
however, are obtained at the expense of reduced ductility and fracture toughness,
so the demands of each individual application will dictate the amount of
reinforcement which is appropriate.
2.7.8.1. Wettability between reinforcement material and matrix alloy
In recent years, liquid metal infiltration techniques have been used to synthesize a
variety of fiber-and particle-reinforced metal-matrix composites. However, poor
wettability of most ceramics with molten metals is a major barrier to processing of
these composites by infiltration. The characterization and enhancement of
wettability is therefore, of central importance to successful composite processing,
Wettability is customarily represented in terms of a contact angle (Figure. 2.16)
defined from the Young-Dupre equation:
SISVIV Cos σσθσ −= (1)
where σ rare the specific surface energies of subscripted interfaces between solid
(s) liquid (1) and vapor (v) phases respectively. The measurement of wettability
during infiltration is fundamentally different from the equilibrium measurements

66
of wettability using sessile drop type tech.-techniques. Moreover, measurement of
wettability of powders consisting of irregular and polysized particles is extremely
difficult. Several techniques have been proposed in the thermodynamic literature
to measure wettability, however, these techniques have been applied mostly to
non-metallic liquids and their application to metal ceramic systems with reference
to pressure casting of composites has been quite limited [88].
IVσ
Vapor Liquid SVσ
Solid SIσ
Figure 2.16. Diagram showing defining of wetting angle
When titanium diboride is used in Hall-Heroult aluminum electrolysis cells as
cathode coating, one of the essential requirements to the coating is that it should
be perfectly wetted by liquid aluminum. To measure the contact angle of liquid
aluminum the sessile drop technique was used. A sample of aluminum was placed
on a solid substrate and heated under an argon atmosphere.
At first wetting of hot-pressed titanium diboride by liquid aluminum was studied.
Right after melting the aluminum does not take the shape of a liquid droplet due
to a rigid oxide layer on its surface. However, when at higher temperature the
oxide layer disappears due to the formation of gaseous Al2O compound between
the liquid Al and solid A12O3. Indeed, at 1000°C the sample took the shape of a
liquid. After 4 min, of real Al/TiB2, contact the contact angle became about 30°,
and liquid aluminum started to penetrate into the porous titanium diboride sample.

67
In addition contact angle measurements of liquid A1 were performed on the
surface of titanium diboride deposited on a nickel cathode from the cryolite melt.
The measured contact angle was 0°, i.e., total wettability was achieved [56].
2.7.8.2. The Distribution of Reinforcement Materials
One of the problems encountered in metal matrix composite processing is the
settling of the reinforcement particles during melt holding or during casting. This
arises as a result of density differences between the reinforcement particles and
the matrix alloy melt, The reinforcement distribution is influenced during several
stages including;
a) Distribution in the liquid as a result of mixing,
b) Distribution in the liquid after mixing, but before solidification, and
c) Redistribution as a result of solidification,
The method of the introduction of particles into the matrix melt is one of the most
important aspects of the casting process. It helps in dispersing the reinforcement
materials in the melt, [89].
The particle distribution in cast composites may become inhomogeneous even
when a homogeneous state of suspension is maintained in the slurry. During the
solidification of a liquid matrix alloy containing dispersed second phase particles,
the particles in the melt can migrate towards or away from the freezing front, and
a particle near the freezing front will either be rejected or engulfed. These two
phenomena lead to the redistribution of the particles during solidification. This
means that the solidification cell size, and hence the solidification rate influence
the distribution of the reinforcement particles in the final ingot. Fine dendrite arm
spacing (DAS) produces a more uniform distribution of the particles, whereas
larger DAS leads to particle clustering [90]. Rapidly solidified structures,
therefore, give a better distribution of the particles due to finer dendrite size as

68
well as due to a limited settling of the particles resulting from the reduced time
during which the composites are in a molten state.
2.8. Production of Al / TiB2 Composite
2.8.1. Formation of TiB2 through carbothermal reduction of TiO2 and B2O3
TiO2, NiCl2, K2CO3, carbon black and B2O3 were taken in the weight ratio
(TiO2:NiCl2:K2CO3:C:B2O3= 20:5:5:12:17.4).Its equivalent molar ratio is
(TiO2:NiCl2:K2CO3:C:B2O3= 1:0,15:0,144:4:1), NiCl2 solution was prepared by
dissolving 5 g of NiCl2 in 30 ml of de-ionised water. Similarly, 5 g of K2CO3 was
dissolved in 30 ml of de-ionised water to make a solution of K2CO3. Twenty
grams of TiO2 powder was added to NiCl2 solution taken in a 500 ml capacity
glass beaker. After thorough mixing, K2CO3 solution was added. The mixture was
dried in an oven at 110 C. The dried mix, 17.4 g of B2O3 and 12 g of carbon black
were taken in a plastic container and dry ball milled for 7 h. This powder mixture
was designated as TNKCB I. After reviewing the results, two additional TNKCB
powder mixes were prepared to study the effect of concentration of TiO2 on the
formation of TiB2 whiskers. The mixes containing 0.5 and 0.25 mol of TiO2 are
designated as TNKCB II and TNKCB III, respectively. Cylindrical graphite
holder of 2.5mm wall thickness and 40mm inner diameter was filled with the
powder mixture. The holder was closed with a graphite lid having a small hole,
allowing exchange of gases between reactants and furnace chamber. The graphite
reactor (sample holder) was placed in the hot zone of high-temperature graphite
resistance furnace. The furnace was evacuated to a moderate vacuum (5×10 2
Torr) and back filled with 1 atm argon. Experiments were conducted at 940, 1100,
1200, 1400, 1500 and 1600 C for 45 min, heating rate employed was 40 C
min 1 [91].

69
2.8.2. Synthesis of titanium diboride TiB2 and Ti-Al-B metal matrix
composites
Commercial Ti, A1 and B (amorphous) powders of purity 98%, 99% and 98%
respectively were first blended in their stiochiometric ratio of Ti-66.7at%B and
Ti18.7at Al-15at%B for 60 min in a V -blender, MA of the Ti-B system was
carried out using a Fritsch PM/5 planetary ball mill operating at 250 rpm while for
the Ti-Al-B system, 200 rpm. The vial was cooled with forced air during milling
to prevent excessive temperature rise. For MA of the Ti-B system, 40 g of powder
mixture of Ti and B was loaded into a stainless steel vial, while for the Ti-Al-B
system; 10 g of powder mixture was used. Hardened steel balls of 19.05 mm
diameter were employed. The ball to powder weight ratio was maintained at about
20: 1 throughout the investigations.
To minimize oxidation, nitriding and hydriding of the blended powders, the steel
vial was first filled with research grade argon and then evacuated with a vacuum
pump, 1 % by weight of stearic acid was added as a process control agent (PCA)
to prevent excessive cold welding of the powder mixture during milling. This
ensures a balance between cold welding and fracturing of the powders during
milling.
Milling was carried out in steps of 30 min at a time, followed by an equal length
of time for cooling to room temperature before milling was resumed. The cover
and the rim of the steel vial were gently brushed to remove any loosely adherent
powder when the vial was opened. Small amounts of sample powder were
collected at regular time intervals for analysis [92].
2.8.3. Reactively cast aluminum-TiB2 alloys
Cryolite salts react with the molten Al alloy such that the titanium and boron enter
the aluminum and combine to form in situ TiB2 particles of about 1µm size. The
remaining cryolite slag is decanted from the furnace and the Al-TiB2 master alloy
alloyed to its final composition and cast to billet or waffle plate Figure 2.18.

70
Figure 2.18. Schematic diagram of molten salt reactive casting process toproduction TiB2 dispersolids in A356
The following experimental MMCs have been produced:
cast materials: A356 + 8 % TiB2
wrought materials: AA6061, 7075, 2618 + x % TiB2 (5 < x < 18)
The process has been optimised to achieve ca. 20 % reinforcement on laboratory
scale. Superior material properties are strongly dependent on the homogeneous
distribution of fine TiB2 particles in the Al matrix. The average particle size is 1 to
2 µm giving additional mechanical strength due to dispersion hardening [93].
2.8.4. In – Situ Al - TiB2 MMCs by casting route
Experiments were carried out in a dedicated gradient and quench furnace with
three heating zones that can be controlled independently ,with this furnace,
samples can be treated in a flowing protective atmosphere at a temperature up to
1100°C. Besides slow cooling, quenching in water can be easily done.
For each sample, a mixture of salts K2TiF6 + KBF4 (0.6 g) was filled into a hole
on the top of the A1 cylinder (~7 g). This setting ensured that Ti and B elements
in the salts could diffuse into the aluminum from the top of the aluminum block
during the thermal cycle. The two types of salts were mixed well with a
stoichiometric ratio to form TiB2.

71
The samples consisting of aluminum and salts were melted and solidified in a
graphite cylindrical crucible in flowing Ar atmosphere with holding temperature,
holding time, heating rate, temperature gradient and cooling rate as parameters.
The inner-wall of the crucible was coated with BN to avoid a reaction between the
sample and the graphite. Figure. 2.19. Schematically shows the experimental set-
up. The thermocouples were placed in the graphite crucibles to get the
temperatures as closely as possible to those in the melts. Heat should be produced
when the two salts react in the molten aluminum. However, the temperature
profiles of the melts showed no clear sign about any resultant temperature rising.
The possible reasons for that are as follows: the amount of salts used in this study
and thus the heat generated by the reaction were limited; the thermocouples were
not really in the melts[94].
Water
Figure 2.19. Schematic drawing of the experimental set-up [94].

72
2.8.5. In – Situ Al - TiB2 MMCs by Stir – Casting
Ti sponge powder (99.5% purity; average size 150 m), amorphous B powder
(96.1% purity; average size 1 m) and commercial aluminum AA1100 wire were
used as the initial materials. These powders of stoichiometric compositions based
on Eq. (1):
2Ti + 2B + 3Al TiB2 + Al3Ti
and of weight percentage corresponding to varying volume fractions in the
aluminum matrix were mixed manually. Graphite crucible that has been
repeatedly brush-coated with alcohol-based zirconium oxide. A vertical chamber
furnace operating under normal atmospheric conditions was used to do the
heating. The Ti B - Al mixture was preheated and manually stirred into the
molten aluminum at 1060°C before the temperature was ramped to 1080°C. It was
then maintained at the latter temperature for 30 min to allow the reaction to occur
to completion. Argon gas purged through a fine ceramic tube was used at intervals
to perform the stirring action and at the same time to remove any unduly trapped
hydrogen. The dross was scooped away twice from the melt surface, once during
the holding and again just before casting. The composite melt was cast into a
graphite mould to produce a 35 mm diameter billet. The billet was then extruded
at 350°C to a diameter of 10 mm at a rate of 2.85mm s-1[73].
2.8.6. In – Situ Ceramic Particle-Reinforced Aluminum Matrix Composite
Fabricated by reacting pressing in the TiO2 (Ti)-Al-B (B2O3) systems.
Atomized Al powder (99.6 pct purity), Ti powder (99.0 pct purity), TiO2 powder
(98.0 pct purity), B powder (99.0 pct purity), B2O3 powder (98.0 pct purity), and
SiC powder (99.0 pct purity), with an average size of 40, 60, 3.2, 150. and 3.5
Am. respectively, were used as raw materials. In powder blending, the properties
of raw materials are adjusted so that the composites will have reinforcement con-
tents, assuming that the reaction between Ti and B takes place preferentially in all
systems. For samples the molecular ratios of B/TiO2 are 0. 4/3, 513, and 211,

73
respectively. The powders were ball milled in alcohol for 8 hours and then dried.
The cold compacted powder mixture was heated to above 800 °C in a vacuum and
maintained for 10 minutes, then cooled down to 600 °C and hot pressed. The
pressed billets were extruded at an extrusion rate of 20:1 at 420 °C [95].
2.8.7. Synthesis of In- Situ Al- TiB2 Composites using Stir route
Amorphous B powder (96.1% purity; average size 1 lm) and commercial
aluminum 100 were used as the starting materials. The (Ti +B) powders with
stoichiometric composition corresponding to 15Vf %TiB2 were added into molten
aluminum after 2 h of reheating 200°C. Melting of the Al was carried out in
graphite crucible that had been repeatedly brush-coated with alcohol-based
zirconium oxide. A vertical chamber furnace operating under normal atmospheric
condition was used to do the heating. Argon gas, introduced through an alumina
tube, was used to perform the stirring at intervals. Three composite samples, one
in Al-matrix (sample A), one in Al±4.5 wt %Cu matrix (sample B) and the other
also with AI-Cu but using (Ti + B) mixture incorporated with 3 wt %C (sample C)
were synthesised. In Al samples, the (Ti + B) mixture was introduced into molten
A) at 1040°C, held for 12 min, raised to 1080°C and then held For another 18 min
before they were cast into billets. The cast billets were extruded at 350°C at an
extrusion ratio of 12:1 and at a rate of 2.85 mm/s. For each billet, three tensile
specimens with 6 min throat diameter were machined. Sample B was solutionised
at 500°C for an hour and then aged at 160° for 18 h so that the matrix was
hardened to peak-aged condition [96].
2.8.8. In – Situ formed Al2O3. TiB2 and Al3Ti mixture-reinforced aluminum
composite
Atomized aluminum powder (99.6% purity). TiO2 powder (98.0% purity) and
boron powder (99.0% purity) with an average size of 40, 3.2 pm, respectively.
were used as raw materials. The composites were fabricated by a powder
metallurgy technique, whereby aluminum, TiO2 and boron powders were ball-
milled for 8 h, During powder blending. TiO2 powder of the same weight was

74
added in samples 8, 4, 5 and 3 in order to form 10.5 vol % A12O3 in the above
composites, and different contents of boron powder were added to these four
samples to give a B/TiO2 molecular ratio of 0. 4/3, 5/3 and 2/1 in samples 8, 4, 5
and 3, respectively, so that the composites containing different contents of TiB2
and A13Ti could be produced. The cold-compacted powder mixture was heated to
above 800 oC in a vacuum and maintain for 10 min, then cooled down to 600 oC
and hot-pressed. The pressed billets were extruded at an extrusion ratio of 20:1 at
420 oC [97].
2.8.9.In – Situ TiB2 reinforced Al alloy Composite
The nominal compositions of the MMCs fabricated in the present investigation
were Al-4wt, %Cu matrix reinforced with 5, 10, and 15 wt,% in situ reactant of
TiB2 particles through the following reaction:
10A1 + 3TiO2 + 3B2O3 5A12O3 + 3TiB2
Elemental A1 and Cu powders were first blended for 2 h with TiO2 and B2O3
powders in a twin shell tumble mixer at a rotational speed of 45 rpm. Ball milling
was then carried out using a Frisch PM/5 planetary ball milling machine operating
at 150 rpm for 4 h. The weight ratio of ball to powder was controlled at 10:1 for
all millings. To prevent oxidation of the powders during milling, the ball milling
vials were vacuumed and then filled with 99.9% pure argon gas, 2.5 wt.% stearic
acid was added as a process control agent to avoid excessive cold welding of the
powders during milling.
After the milling process, the powders were cold compacted into green compacts
in the form of disc of 35 mm diameter and 40 mm thick. The green compacts were
sintered at different temperatures from 873 to 1023 K for 2 h in a Carbolite
furnace (773 K for the matrix compacts). Extrusion of the preheated compacts
into a 10 mm diameter rod was then carried out at 823 K (723 K for the matrix
compacts). The rods were solutionized at 790 K for 4 h followed by water
quenching to ensure the presence of supersaturated a phase. Hardness test

75
specimens of 5 mm thickness were then cut from the solutionized rods and aged at
180°C for specified intervals of 5 h. The aged specimens were then water
quenched and hardness-tested with Superficial Rockwell to study the aging
behavior of the specimens as well as to determine the aging time to peak hardness
[37].
2.8.10. Production of Al- TiB2 composite with injection of TiB2 powders
The starting powders (TiO2. B2O3 and AI) were weighed according to the
stoichiometry of reaction :
TiO2 + B2O3 +10/3 Al = TiB2 +5/3 Al2O3
33.36 wt.% TiO2 29.08 wt.% B2O3. 37.56 wt.% Al; and then mixed trough
extensive gentle stirring in acetone to ensure homogeneity. The mixture was then
dried and cold compacted into cylindrical pellets using a hydraulic press. The
pellets were placed into a muffle furnace preheated to 800 °C in alumina crucibles
and heated in this way. When the ignition temperature is attained, the reactions
started and completed in a short time (3-4 min). After the reaction is completed,
the crucibles were taken out of furnace and cooled in air. The porous product
obtained was then crushed to a size less then 1 mm. Particle size was further
reduced below 75 pm by milling. The mill was a vibratory disc mill of type RS1
with 3x220 V., 50 Hz. The exposure time for particles in the mill were
approximately 60 minutes Figure 2.20 [12].

76
Ceramic Particles
Vibratory arm
Motor Argon Gas
Ceramic Particles
ThermocoupleGraphite crucible
Alloy Melt Induction Furnace
Gas Bubble
Figure 2.20. Schematic drawing of particle injection apparatus. [12].
2.8.11. In – Situ Al -TiB2 Composite Fabrication by In-Melt Reaction Method
Powders of TiO2, H3BO3, and Na3AiF6 (all of analytical purity), less than 0.42 m
in size, and an Al-4.5Cu alloy ingot, were used as raw materials. The raw powders
were blended fully with the given weight ratio and then heated at 300 °C for 4
hours to dry. At the same tine, Al-4.5Cu alloy ingot was melted and superheated
to 950 °C in a resistance furnace. The mixed powders were slowly added on the
surface of the liquid Al-4.5Cu alloy. The slurry was stirred intermittently until it
had no reaction sparks. When the reactions were complete, the temperature of the
slurry was lowered. So the slurry was again heated to 900 °C, and the slurry
subsequently was permitted to sit for 10 minutes. Then the slurry was poured into
a mold at room temperature after the slag was removed, obtaining Al-4.5Cu/TiB2
composite. Figure 2.21 shows the principle of the method [98].

77
.
Figure 2.21. Schematic diagram of an apparatus for fabrication in situ particlereinforced composte : 1-mixed materials of reaction powders, 2-Al alloy melt, 3-graphit crucible, 4- heating apparatus, 5-graphite stirring bar
2.9. Existing/Potential Applications
Prototype Parts and Alloys:
(a) Automobile: conrod / Alloy 2618 + TiB2Fatigue tests on forged demonstrator parts
(b) Aerospace Applications
(b1) Helicopter Blade Sleeve Application
Tests on pancake samples and forged I-beam
(b2) Seat Track Application - Alloy 7075 +
TiB2 Continuous cast and extruded; heat-treated
(c) Wear Resistance Applications / Alloy A356
+ TiB2 Cylinder liners for automotive engines
produced by high-pressure die casting and tested
under realistic conditions in co-operation with
Al producer and automotive companies.

78
CHAPTER III
EXPERIMENTAL PROCEDURE
3.1. Introduction
In the experiments a mixture of TiO2, H3BO3 and Na3AlF6 and Al were charged
into a crucible and melted.
This way a two-liquid phase system, a liquid Al phase and a liquid slag phase
consisting of TiO2, B2O3 and Na3AlF6 was obtained. TiB2 was formed according
to the overall reaction
(B2O3) + (TiO2) + 10/3 Al(l) = TiB2 (s) + 5/3 (Al2O3)
where ( ) indicate species dissolved in slag. TiB2 (s) formed entered the liquid Al
phase forming the Al-TiB2 composite and Al2O3 formed dissolved in the slag. The
resulting of Al-TiB2 composite was cast by the squeeze casting method.
X-ray diffraction analysis, optical and scanning electron microscopic
examinations were carried out on specimens obtained form the squeeze-cast
composite. Mechanical properties of the produced composites were determined as
well.
3.2. Materials
Commercial purity A1 ( > 99.7% Al), TiO2 ( rutile, high purity > 99.8% ), H3BO3
( boric acid, high purity >99.9% ), and Na3AlF6 (cryolite, high purity >99.8% ),
powders obtained from Merck and Etibank were used in the experiments. Product
information from the manufacturer indicates that the size distributions for TiO2

79
and H3BO3 powders are similar and all are classified as fine powders. Particle
sizes of these materials are below 1µm for TiO2 and H3BO3 respectively.
3.3. Production Processes
The starting materials, TiO2, H3BO3, Na3AlF6 powders and aluminum ingots, were
weighed according to the stoichiometry of reactions:
2H3BO3 = 3H2O + B2O3 (1)
TiO2 + B2O3 + 10/3 Al = TiB2 + 5/3 Al2O3 (2)
2Al2O3 + 2Na3AlF6 = 4AlF3 + Na2Al2O4 + 2Na2O (3)
The raw powders were blended fully and then dried at 300 °C for 4 hours in order
to remove the humidity completely. As given in equation 1, boric oxide and water
vapor were produced from boric acid during heating and the water vapor left the
system. Then the TiO2, H3BO3, Na 3AlF6 powder mixture was added into the
graphite crucible, which contained the aluminum ingot. Since powders are not
electrically conductive, graphite crucible was used to melt the powders in the
induction furnace. Graphite crucible is conductive and during the melting process,
the crucible itself is heated which results in the powders getting heated and melt.
When the system was heated to 1000 oC in the induction furnace (Figure 3.1),
firstly aluminum was melted and then the powders turned into a mushy phase.
Then these semisolid powders melted and formed a slag, which lied above the
molten aluminum. Following these, aluminum entered the exothermic reaction
with slag and formed tiny sparks. During this reaction, the furnace had to be
turned off in order to prevent excessive heating of the system. The system was
stirred continuously to make a better contact between the molten metal and the
slag (Figure 3.2). This procedure was continued until no sparks were observed,
which was an indication that the reaction was complete. By the reaction between
the slag and the metal, titanium diboride was formed which entered the liquid
aluminum. Aluminum oxide forming by the reaction dissolved in the cryolite, so

80
that system at the end of the reaction consisted of a slag of cryolite and aluminum
oxide, and a slurry of aluminum and titanium diboride under the slag. When the
reactions were completed, the slag was removed from the crucible and the
produced Al TiB2 composite was poured through a gate into a hot worked tool
steel mold designed for mechanical testing specimens. The mold was preheated up
to 300oC prior to casting. The Al TiB2 was then squeeze cast under a load of 45
tons. The load was applied for about 90 seconds to complete solidification before
the composite was ejected. This squeeze casting process under pressure resulted in
a structure free of porosity, as was expected. Finally, the dog-bone ingots were
ejected from the steel dies and cooled down to room temperature in air. Figure
3.3.shows a photograph of squeeze casting hydraulic press used in this study.
Figure 3.1 A photograph of induction furnaces. They are powered by AjaxNorthrup and Ajax Magnethermic made high frequency generators. AjaxMagnethermic generator is equiped with two separate melting furnaces made byInductotherm Company which can be operated alternatively. The largeInductotherm coreless induction furnace has a melting capacity of 10 kgaluminum alloy.

81
Figure 3.2 Schematic diagram of an apparatus for fabrication in situ particlereinforced composite: 1- graphite stirring 2- slag 3- Liquid material 4-graphite5-Induction Furnace.
.
Figure 3.3 Photograph of hydraulic squeeze casting press

82
3.4. X-Ray diffraction Analysis
Samples cut from squeeze cast dog bone ingots were subjected to XRD analysis
after polishing to determine the phase present. A RIGAKU X-Ray Diffraction
equipment with copper radiation was used to obtain the X-ray diffraction patterns.
3.5. Metallographic Examination
The microstructures were investigated by means of optical microscopy Figure
3.4.(a) and scanning electron microscopy Figure 3.4(b). Optical microscopy was
conducted on both polished and etched samples. The samples were prepared using
standard grinding papers and were polished with fine alumina solution of 1 and
0.3 m .Samples were then ecthed with Tuckers I reagent (15%HF, 45%HCL,
15%HNO3, and 25%H2O) to observe the grain structure. The samples were then
examined and photographed using an Olympus light optical microscope. The
grain size was measured using the linear intercept method, as described in ASTM
E 112-88. Scanning electron microscopy (SEM) studies, on polished samples,
were conducted using JEOL 6400 microscope.
(a) (b)Figure 3.4 (a) The optical microscope used for metallographic examinations. (b)The Scanning Electron Microscope for quantitative and microstructure analysis

83
3.6. Particle size determination
The grain size of the produced Al-TiB2 composites were measured by X-rays. The
size of the grains in a polycrystalline metal or alloy has pronounced effects on
many of its properties, the best-known being the increase in strength and hardness,
which accompanies a decrease in grain size. This dependence of properties on
grain size makes the measurement of grain size a matter of some importance.
Strict diffraction condition described by Bragg`s law is true for the ideal case.
infinitely thick crystal with no imperfections and truly monochromic X-ray
source. When the size of the individual crystals is less than about 0.1 m
(1000Ao), the term particle size is usually used. Due to the limited size the
picks broaden. This occurs in such a manner that broad of peaks measured at half
height B can be related to cell or subgrain size, t, with
t = 0.9 /B cos B (1)
Where is the wavelength of the radiation used, and B is the Bragg`s angle of
the peak.
In the present study, first the sample is scanned within a wide angler range and the
peak from which the broadening is to be measured is selected.
The selected peak belonging to (200) crystal plane reflections(Figure 3.5), one can
measure the broad at half-height, but this is not enough as there are other factors
that influence the broad. One factor is the source is not monochromatic as K in
valves the doubled K 1 and K 2, other factors are geometric and depends on the
alignment and slit arrangement in the diffractometer. All these can be referred to
as instrumental broadening. Simple way of evaluating the degree of instrumental
broadening is to examine a standard sample in the same setup. In the present
excrement this is achieved by examining an annealed aluminum (at 600 oC for 20
hour) for this purpose, which gave a grain size. Because grains are large, the

84
broadening obtained in this sample is due to solely an instrumental broadening.
With such standard sample, structural broadening, B, can be evaluated as follows
222SM BBB −= (2)
Where BM is the broadening of the sample
BS is the broadening of the standard
Figure 3.5 Samples peak

85
3.7. Tension Tests
The mechanical strength of the composites specimens produced by
squeeze/pressure die casting machine were determined by tensile testing. Figure
3.6 shows the test specimens called for in ASTM D3552 for testing unidirectional
or cross-piled metal matrix composites and discontinuous metal matrix
composites in tension. When testing flat specimens, the width of the specimen
may be reduced to produce a dog bone shaped specimen as shown or a straight
side specimen may be used. Experience has shown that there is little difference in
strength result obtained from the two types of specimens.
Figure 3.6 The schematic of the test specimen produced by squeeze/pressure diecasting machine for tensile test
3.8.Brinell Hardness Test
Brinell Hardness Test determined the hardness values of the composites.
Hardness measurements were carried out according to ASTM standard E10-84
describing standard test method for brinell hardness of materials. Brinell hardness
values were obtained using a Heckert macro hardness tester. All tests were
performed with 2.5 mm diameter ball under 1.625 kg loads for 20 seconds
penetration.
3.9. Bending test
The flexural strength of the as cast composite specimens produced by
squeeze/pressure die casting machine were tested by the three point bending
tests . The three point bending test is a well-known mechanical strength test and it
will accurately give properties such as the Young s Modulus and the Tensile
Strength of a material. Three point bending tests were performed to observe the

86
fracture behavior of aluminum matrix composite with different parentage of
titanium diboride (figure 3.7). The three point bending test, the maximum fracture
loads were evaluated. These kilogram values were converted into flexural stress
(MPa) values.
The flexural stress formula is given as; σ = My/I were σ flexural stress, M the
bending moment, y the distance from the natural axis and I the moment of inertia.
The maximum flexural surface occurs in the mid-point of the specimen.
Therefore:
4LPM ×
= ;2ty = ;
12
3tbI ×= ; 22
3tbLp
××××
=σ
P : Load applied by the testing machine,
t : Thickness of the specimen
b : Width of the specimen, and
L : span length respectively
Figure 3.7 The schematic of the three point bending test specimen specimensproduced by squeeze/pressure die casting machine.

87
CHAPTER IV
RESULTS AND DISCUSSION
4.1. Formation of in-situ TiB2 particles and XRD analysis
The objective of the study was to form Al- TiB2 composites by reacting molten
aluminum with TiO2 and B2O3 dissolved in molten cryolite. Boric acid was used
as the source of B2O3 which calcined during the process according the reaction:
2H3BO3 = 3H2O + B2O3 (1)
The overall reaction for formation of TiB2 as given by:
TiO2 + B2O3 + 10/3 Al = TiB2 + 5/3 Al2O3 (2)
TiB2 forming entered the molten aluminum forming the Al-TiB2 composite and
Al2O3 forming dissolved in cryolite in accord with the overall reaction
2Al2O3 + 2Na3AlF6 = 4AlF3 + Na2Al2O4 + 2Na2O (3)
Charges were prepared so as to have 5, 7.5 and 10 volume percent TiB2 in the Al-
TiB2 composites based on stoichiometric considerations.
Al-TiB2 composite obtained was squeeze cast as explained in Chapter III.
Specimens obtained from the squeeze cast Al-TiB2 composite were subjected to
X-ray diffraction, optical microscopy and scanning electron microscopy
examinations and hardness, tensile and 3-point bending tests.
X-Ray diffraction pattern of pure Al, Al-5 Vol% TiB2 , Al-7.5 vol% TiB2 and Al-
10 vol% TiB2 samples are given in Figures 4.1(a) , 4.1(b), 4.1(c) and 4.1(d),
respectively, while the diffratometric data for TiB2 and Al given in Table 1 .

88
Table 4.1. X-Ray data
Figure 4.1 (a) XRD pattern of Al- 0% TiB2 ,(b) XRD pattern of Al- 5% TiB2 ,(c)XRD pattern of Al- 7.5% TiB2 ,(d) XRD pattern of Al-10%TiB2 ,O are Al- areTiB2
2θ Int H k l27.607 233 0 0 134.150 626 1 0 044.462 999 1 0 157.004 84 0 0 261.137 192 1 1 068.152 117 1 0 268.355 138 1 1 171.924 46 2 0 078.672 120 2 0 1
TiB2
88.436 105 1 1 2
2θ Int h k l38.471 999 1 1 144.719 455 2 0 065.095 230 2 2 078.226 228 3 1 1
Al
82.433 62 2 2 2
(a)
(b)
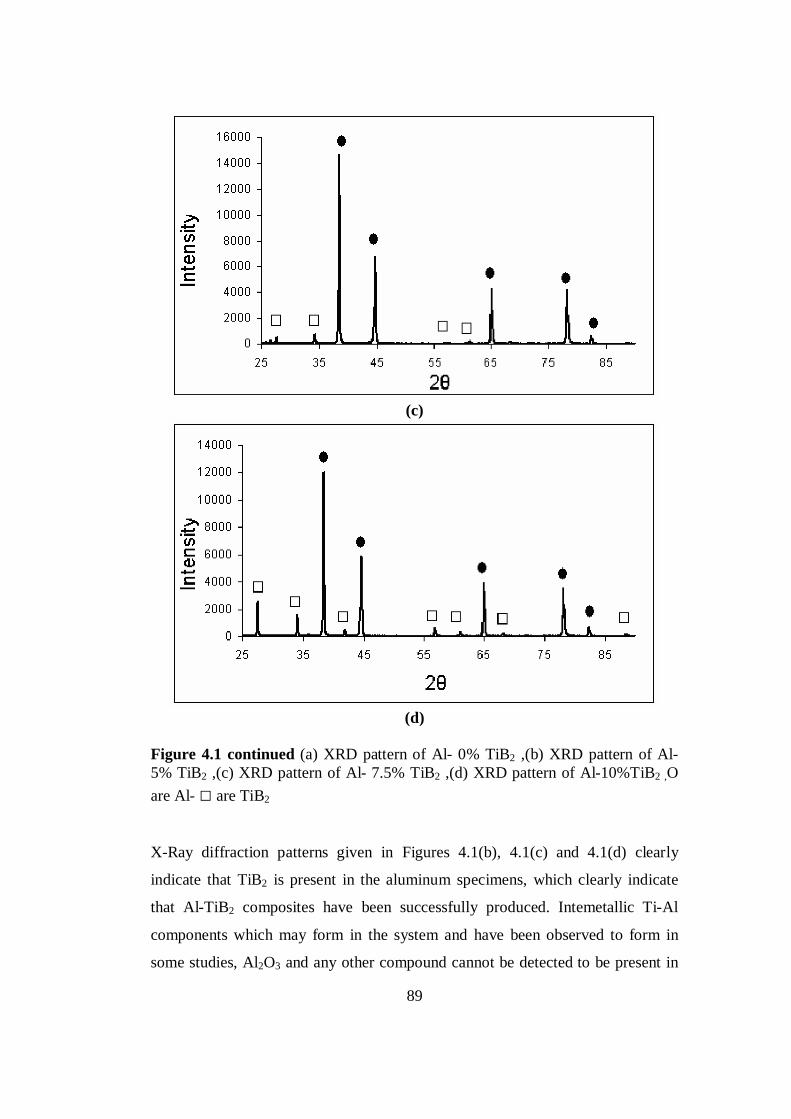
89
(c)
(d)
Figure 4.1 continued (a) XRD pattern of Al- 0% TiB2 ,(b) XRD pattern of Al-5% TiB2 ,(c) XRD pattern of Al- 7.5% TiB2 ,(d) XRD pattern of Al-10%TiB2 ,Oare Al- are TiB2
X-Ray diffraction patterns given in Figures 4.1(b), 4.1(c) and 4.1(d) clearly
indicate that TiB2 is present in the aluminum specimens, which clearly indicate
that Al-TiB2 composites have been successfully produced. Intemetallic Ti-Al
components which may form in the system and have been observed to form in
some studies, Al2O3 and any other compound cannot be detected to be present in
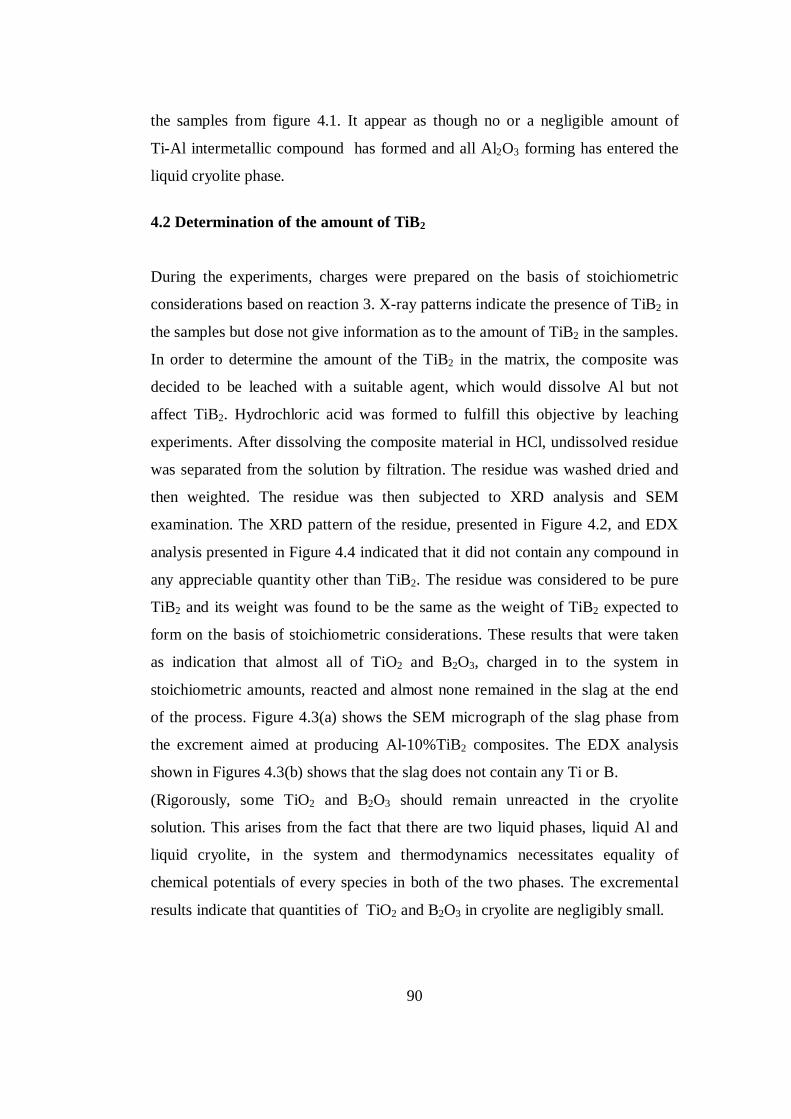
90
the samples from figure 4.1. It appear as though no or a negligible amount of
Ti-Al intermetallic compound has formed and all Al2O3 forming has entered the
liquid cryolite phase.
4.2 Determination of the amount of TiB2
During the experiments, charges were prepared on the basis of stoichiometric
considerations based on reaction 3. X-ray patterns indicate the presence of TiB2 in
the samples but dose not give information as to the amount of TiB2 in the samples.
In order to determine the amount of the TiB2 in the matrix, the composite was
decided to be leached with a suitable agent, which would dissolve Al but not
affect TiB2. Hydrochloric acid was formed to fulfill this objective by leaching
experiments. After dissolving the composite material in HCl, undissolved residue
was separated from the solution by filtration. The residue was washed dried and
then weighted. The residue was then subjected to XRD analysis and SEM
examination. The XRD pattern of the residue, presented in Figure 4.2, and EDX
analysis presented in Figure 4.4 indicated that it did not contain any compound in
any appreciable quantity other than TiB2. The residue was considered to be pure
TiB2 and its weight was found to be the same as the weight of TiB2 expected to
form on the basis of stoichiometric considerations. These results that were taken
as indication that almost all of TiO2 and B2O3, charged in to the system in
stoichiometric amounts, reacted and almost none remained in the slag at the end
of the process. Figure 4.3(a) shows the SEM micrograph of the slag phase from
the excrement aimed at producing Al-10%TiB2 composites. The EDX analysis
shown in Figures 4.3(b) shows that the slag does not contain any Ti or B.
(Rigorously, some TiO2 and B2O3 should remain unreacted in the cryolite
solution. This arises from the fact that there are two liquid phases, liquid Al and
liquid cryolite, in the system and thermodynamics necessitates equality of
chemical potentials of every species in both of the two phases. The excremental
results indicate that quantities of TiO2 and B2O3 in cryolite are negligibly small.

91
These results indicate that Al-TiB2 composites having a certain TiB2 content can
be produced by using a charge composed of cryolite and stoichiometric amounts
of TiO2 and B2O3.
Figure 4.2 XRD pattern of TiB2 particles extracted from Composite with leaching. are TiB2
(a) (b)
Figure 4.3 (a) SEM micrograph of slag and (b) EDX Analysis

92
(a)
(b)
(c)
(d)
Figure 4.4 (a) The morphology of TiB2 particles extracted from composite withleaching and (b), (c), (d) EDX Analysis of point 1, 2, and 3.

93
4.3. Microstructure
TiB2 is used as an additive for grain refinement. In this study, all of sample
surfaces were ground using SiC grinding paper of 220, 400, 800 and 1200 grid.
Samples were then polished with alumina suspension and the surfaces were
cleaned in alcohol in ultrasonic cleaner and etched with Keller s I solution. Then
they were examined with optical and scanning electron microscopy. Optical
micrographs are given in Figure 4.5.
TiB2 particles are so fine that they could not be observed in an optical
microscope, although they are easily observed in SEM micrographs. As can be
seen from Figures 4.6-4.8. After the etching process, explained in Chapter II,
grain boundaries could not be resolved due to the strong grain refinement effect of
TiB2.
Figure 4.5 (a) Optical micrograph of un-reinforced matrix, (b) Opticalmicrograph of Al -5 vol. % TiB2 composite (sample 2) X200, (c) Opticalmicrograph of Al -7.5 vol. % TiB2 composite (sample 3) X200, (d) Opticalmicrograph of Al -10 vol. % TiB2 composite (sample 4) X200
(a) (b)
(c) (d)

94
Figure 4.6 shows the SEM micrograph of aluminum without any reinforcement.
The result of the EDX analysis, which is also presented in Figure 4.6, indicates
that the matrix is composed of only aluminum.
Figure 4.6 SEM micrograph of un-reinforced matrix, EDXA plot andelemental analysis of un-reinforced matrix (sample 1)
Figure 4.7 shows the SEM micrograph of the Al-5%TiB2 sample. In this
micrograph TiB2 particles can be observed easily. EDX analysis taken from the
points, indicated as point 1 and 3 on the micrograph, showed that the particles had

95
high Ti content. Moreover, the X-Ray pattern of these samples and the results of
HCl leaching indicated the formation of titanium diboride. On the bases of these
results, it can be said that these particles are most probably titanium diboride
particles.
The EDX analysis taken from the matrix is indicated as point 2 in Figure 4.7.
Depending on this analysis, it can be derived that the matrix is composed of only
aluminum.
The sizes of the TiB2 particles, determined from this micrograph, are of the order
of 1µm.
Figure 4.8 shows the micrograph of Al-7.5% TiB2 composite material. The EDX
analysis of point 1 indicates that the white particles are TiB2. The EDX analysis of
point 2, belonging to the matrix, shows that the matrix is composed of pure
aluminum and does not contain Ti or any other element. Point 3 shows a colony of
fine size of reinforcements in the matrix.
Figures 4.9 show the micrograph and EDX analysis of Al-10% TiB2 composite.
Analysis of different points indicates that white particles are TiB2 and matrix is
pure aluminum. From the micrograph in Figure 4.9, it can be derived that the TiB2
particles are hexagonal in shape.

96
(a)
(b)
(c)
(d)
Figure 4.7 (a) SEM micrograph of Al -5 vol % TiB2 composite (Sample 2), (b)EDXA plot and analysis of point 1, (c) EDX Analysis of point 2, (d) EDXAnalysis of point 3.

97
(a)
Element WeightConc %
AtomConc %
Al 65.69 77.27Ti 34.31 22.73
(b)
Element WeightConc %
AtomConc %
Al 94.55 96.86Ti 5.45 3.14
(c)
Element WeightConc %
AtomConc %
Al 83.90 90.24Ti 16.10 9.76
(d)
Figure 4.8 (a) SEM micrograph of Al -7.5 vol % TiB2 composite (Sample 3),(b) EDX Analysis of point 1, (c) EDX Analysis of point 2, (d) EDX Analysisof point 3.
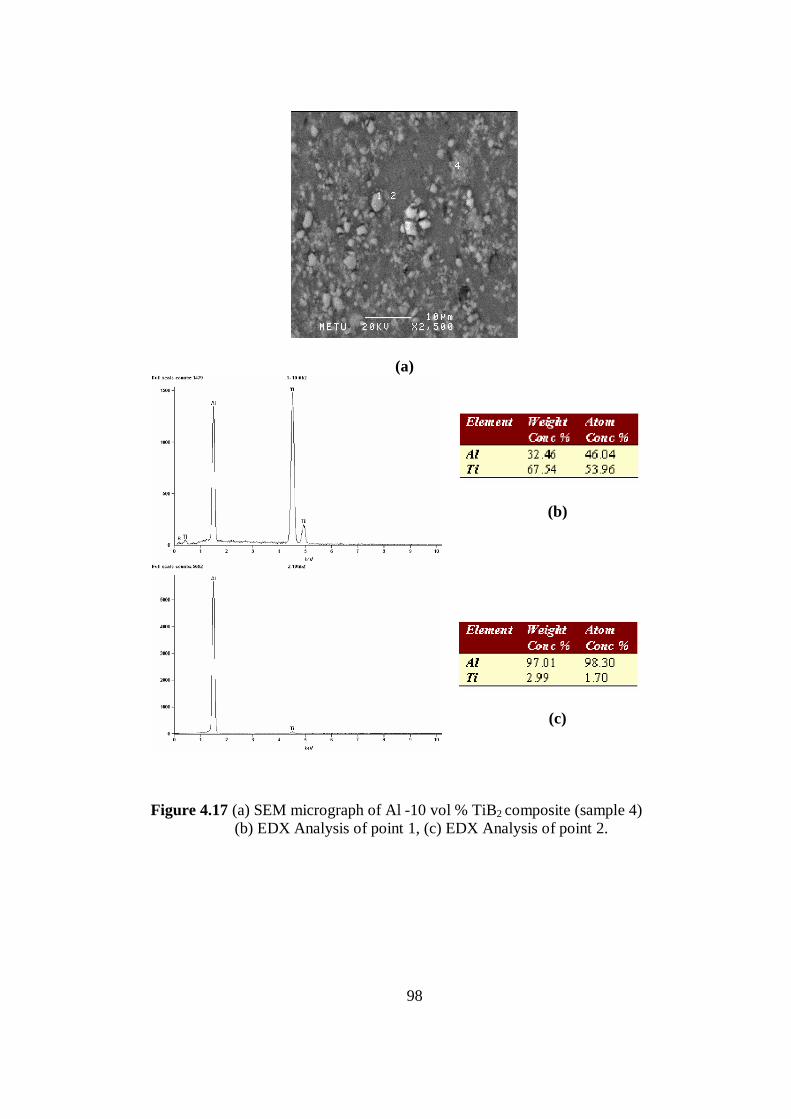
98
(a)
(b)
(c)
Figure 4.17 (a) SEM micrograph of Al -10 vol % TiB2 composite (sample 4) (b) EDX Analysis of point 1, (c) EDX Analysis of point 2.

99
(a)
(b)
Figure 4.9 continued (a) SEM micrograph of Al -10 vol % TiB2 composite(b) EDX Analysis of point 1, (c) EDX Analysis of point 2.(d) EDX Analysis ofpoint 3, (e) EDX Analysis of point 4.
4.4. Particle Size
One of the important factors, which affect the mechanical properties of materials,
is the grain size or the particle size of structure. In this study, to determine the size
of the particles, the broadening of the X-ray diffraction peaks was measured. First
of all, the sample that contained no reinforcement used, as a standard sample to
determine the change in the grain size by the addition of TiB2, was annealed at
600°C for 20 hours. The X-ray pattern of this sample is given in Figure 4.9 (a).
Then, this sample was ground, polished and macro etched with 100ml H2O- 200
ml HNO3 180 ml HCl 60 gr FeCl3. In order to determine the size of the grains,
X10 micrograph of this sample was used. Lines with 1 cm intervals were drawn

100
on the micrograph and the number of grains that cut the lines was counted. The
grain size of this sample was measured as 800µm.
In Figure 4.10 (b), (c) and (d) the X- ray diffractograme of samples, which contain
5 %, 7.5 % and 10% TiB2, are presented. To determine the change in the grain
size of aluminum by addition of 5 %, 7.5 % and 10 % TiB2, the broadening of the
(200) peaks were measured.
As it can be seen from this Figure 4.10, the broadening of the (200) peak increases
with the increase of the percentage of TiB2 particles. To calculate the grain size of
the aluminum matrix for each sample, Equations 1 and 2 given in Chapter III were
used. From the results of the calculations, which are presented in Table 4.2, it can
be seen that the increase in the volume percentage of TiB2 results in a decrease in
the grain size.
Table 4.2 Reinforcement content and grain size*
Reinforcement % Grain Size
5% 14.7 µm
7.5% 9.4 µm
10% 7.0 µm
*The broadening measurements were correlated to the experimental composite sgrain size measured by optical microscope. Since the effect of subgrain reflectionscan not be distinguished, the grain size information deduced from the linear trendline is may not be the actual grain size.

101
(a)
(b)Figure 4.10.(a) XRD pattern of Al- 0% TiB2 (b) XRD pattern of Al- 5% TiB2 (c) XRD pattern of Al- 7.5% TiB2 (d) XRD pattern of Al-10% TiB2

102
(c)
(d)Figure 4.10 continued (a) XRD pattern of Al- 0% TiB2 (b) XRD pattern of Al- 5% TiB2 (c) XRD pattern of Al- 7.5% TiB2 (d) XRD pattern of Al-10% TiB2

103
4.5. Mechanical properties of Al – TiB2 Composites
The results of mechanical tests conducted on the experimental composite samples
are summarized in Table 4.1. The values listed in the table indicate the average of
10 values determined for each parameter. The results indicate that the ultimate
tensile strength (UTS), yield strength (YS), flexural strength and hardness
increase with the increasing amount of particles in the composite.
Table 4.1. Mechanical Testing results of samples
Sample 1 Sample 2 Sample 3 Sample 4Reinforcement vol % 0 5 7.5 10UTS (MPa) 75 ± 3 120 ± 2 130 ± 1 150 ± 3[Increment %] [+60] [+73] [+100]Y.S (MPa) 26.3 ± 3 82.5 ± 4 102.2 ± 2 118.5 ± 4[Increment %] [+213] [+288] [+350]%Reduction in Area 50.5 ± 2 10.8 ± 2 6 ± 1 5.7 ± 1[Increment %] [-21] [-12] [-11]%Elongation 31.4 ± 3 3.3 ± 1 5.1 ± 1 7.4 ± 1[Increment %] [-10] [-16] [-24]Hardness (BHN) 20.1 ± 1 42.1 ± 2 52.1 ± 1 55.1 ± 3[Increment %] [+110] [+160] [+174]Flexural Strength (MPa) 72.2 ± 3 175.5 ± 2 185.3 ± 3 211.1 ± 4[Increment %] [+143] [+157] [+192]
Graphical illustrations of the results are shown in Figure 4.11. These graphs also
indicate that the ultimate tensile strength (UTS) increases with the increasing
amount of particles in the composite, as it was previously shown in Table 4.1.

104
0
20
40
60
80
100
120
140
160
180
0 2 4 6 8 10 12
Reinforcement %
UTS
(MPa
)
(a)
0
20
40
60
80
100
120
140
0 2 4 6 8 10 12
Reinforcement %
Yiel
d S
tren
gth
(MPa
)
(b)
0
50
100
150
200
250
0 2 4 6 8 10 12
Reinforcement %
Flex
ural
Str
engt
h (M
Pa)
(c)
0
10
20
30
40
50
60
70
0 2 4 6 8 10 12
Reinforcement %
Har
dnes
s (H
B)
(d)
Figure 4.11. (a) Variation of ultimate tensile strength with volume percent ofreinforcements.(b)Variation of yield strength with volume percent ofreinforcements.(c)Variation of flexural strength with volume percent ofreinforcements.(d)Variation of hardness with volume percent ofreinforcements.
Figure 4.12 shows the variation of ductility, in terms of reduction in area % and
elongation %, with amount of reinforcement. As it is seen, the ductility decreases
with the increase of reinforcement in composite. But it should be noted that a
slight increase in elongation was obtained when the amount of reinforcement is
further increased after a significant amount of decrease in elongation was
observed.

105
0
10
20
30
40
50
60
0 2 4 6 8 10 12
Reinforcement %
Duc
tility
(%R
A)
(a)
0
5
10
15
20
25
30
35
0 2 4 6 8 10 12
Reinforcement vol%
Elon
gatio
n %
(b)
Figure 4.13. (a)Variation of elongation with volume percent of reinforcements (b)Variation of ductility with volume percent of reinforcements
Finally, mechanical properties of composite produced in this study were
compared with the properties of composites produced by other methods found in
literature. The comparisons are summarized in Table 4.2. While comparing these
values, it should be noted that sometimes different processing methods, such as
extrusion and heat treatment, were applied to the materials. As compared with the
other methods, the method used in the current work supplies a more significant
increase in the strength parameters with the incremental increase in the percentage
of reinforcements. For example, by the addition of 10% reinforcement, the yield
strength and UTS values increased 350% and 100% respectively.

106
Table 4.2 Comparison of mechanical properties of Al-TiB2 metal matrixcomposites
Process Vol %Reinforcement %EL %RA UTS
MPaYS
MPaFlexuralStress
HardnessHB
0 31.4 50.5 75 26.3 72.2 20.15 3.3 10.8 120 82.5 175.5 42.1
7.5 5.1 6.0 130 102.2 185.3 52.1
In-situ Al - TiB2 Compositeformed by slag-metalreaction (present work)
10 7.4 5.7 150 118.4 211.1 55.10 13.4 24.7 150 - - 39
3.54 10.3 16.7 164 - - 53Al - 2%Mg - Al2O3 - TiB2Composite formed by meltstring [99] 5.84 11.6 20.7 154 - - 44.5
0 29.6 22.9 162 80.5 - 52.62.03 28.2 21.9 163 94.5 - 57.73.58 23.5 19.1 169 99.5 - 64.5
Al - 3%Mg - Al2O3 - TiB2Composite formed by melt -stirring [12]
4.42 20 16.7 175 108 - 73.25 1.9 - 358 258 - 837 2.8 - 387 283 - 84In-situ Al-4.5 Cu -TiB2 by in
melt reaction [198]10 3.3 - 417 317 - 87
AA1100-TiB2 in-situ stircasting [96] 7.3 4.6 - 223 171.3 - -
Al - 4.5Cu-TiB2 in-situ stircasting [96] 15 2.3 - 333 202.8 - -
5 9.2 - 124 96 - -10 6.3 - 164 128 - -Al- TiB2 Composite by stir
casting [73]15 5.5 - 153 124 - -

107
CHAPTER V
CONCLUSIONS
In this study production and properties of TiB2 particles reinforced aluminum
matrix composites were investigated. Composites were produced with slag
metal reactions. With the use of Al, boric acid, TiO2 and cryolite which are not
expensive materials. The amounts of particles in the composites were 5%, 7.5%,
10% by volume and the matrix was aluminum. Tension tests, three point bending
tests and hardness tests were performed on the samples and the effect of
reinforcement on the mechanical properties and microstructure was determined.
1. TiB2 particles were formed in-situ in the aluminum matrix through the
reaction of TiO2 and H3BO3 in the Na3AlF6 by molten Al.
2. TiB2 particles formed by slag-metal reaction were formed to be spherical in
shape and approximately 1 µm in size.
3. TiB2 particles could successfully be precipitated in the matrix and a more
homogenous distribution compared with other processing techniques such as
solid state reactive sintering, was obtained.
4. The grains were significantly refined with the formation of TiB2 particles.
5. Ultimate tensile strength, yield strength, flexural strength and hardness of the
material increased with increasing TiB2 reinforcement content in the matrix.
6. Elongation and reduction in area decreased with increasing reinforcement
content in the matrix.
Finally, it can be stated that in-situ technique used in this study can successfully
be applied to produce an Al-TiB2 with composite enhanced mechanical properties
by use cheap materials.

108
REFERENCES
1. Kenneth, G. Kreider , Composite materials , Edited by: Kenneth , G. Kreider,
Academic press.Vol 4. (1974). p.1-9,408-413
2. T.S.Srivason, I.A.Ibrahim, F.A.Mohamed, E.J.Lavernia, J.Mater.Sci. 26
(1991).p. 5965-5978
3. T.W.Chou, A.Kelly and A.Okura, Composite16 (1986) .p.43.
4. H.J.Rack.in Processing and Properties of powder metallurgy composite ,
edited by P.Kumar, K.Vedula and ARitter (The Metallurgical Society,
Warrendale, PA, (1988) .p.155.
5. S.Lakshmi, L.Lu, M.Gupta, J.Mater. Processing Technology.73 (1998) .p.160-
166
6. M.K.Aghajanian, M.A. Rocazella ,J.T.Burke, S.D.Burke, S.D.Keck,
J.Mater.Sci. 26(1991).p. 447
7. L.Anestiv, L.Froyen, L.Van Vugt, J.Mater.Sci. 37(2002) .p. 1907-1913
8. V.Shtessel, S.Sampath, M.Koczak, In-situ composites :Sci. and Tech. Edited
by .Msingh,D.Lewis , The Minerals,Materials & Materials Socity, (1994) .p.38
9. Jonas Fjellstedt On the crystallization processing of Al-base Alloys , Phd
Thesis Dep.of production Eng. the Royal Institute of Tech., Sweden , June
2001, p.10-11
10. D.M. Stefanescu, Key Engineering Materials Vol.79-80 Trans. Tech. Pub.
Switzerland ,(1993) .p.75-90
11. I.A.Ibrahim, F.A.Mohamed, E.J.Lavernia, J.Mater.Sci. 26 (1991) .p.1137-
1156
12. M.Elmadagli A study on the production of Al-TiB2 particulate reinforcement
Al composite MSc thesis ,July 2000 , METU .p.5
13. M.E.Fine, in Dispersion Strengthened Aluminium Alloys , edited by
Y.M.Kim and W.Giffith(The metallurgical society,Warrendale,PA,1988) .p.103
14. G.S.Murty, M.J.Koczak and W.E.Frazier, Scripta Metall.21 (1987) .p.141.
15. Schoutens and D.A.Zarate,Composie,7 (1986) .p.188-204
16. F.L.matthews,R.d.Rawling Composite Materials Chpman & Hall, 996. p.
91

109
17. A.L.Geiger and M.Jackson, Adv.Mater. Process 7 (1989) .p.23.
18. E.H.Kener, Proc.Phys.Soc.68B (1956) .p.808.
19. L.Raleigh, Phil.Mag. 34 (1982) .p.481.
20. J.Hashim and S.Shtrkman, J.Mech. Phys. Solids 11 (1963) .p.127.
21. Pai, B.C., In Aluminum strategies for the nineties and beyond Vol.2 ,Edt.
Dwarakadasa, E.S., Seshan, S., and Abraham, K.P.: Aluminum association of
India, (1991) .p.805.
22. D.M.Stefanecu , Key Engineering Materials vol. 79-80 Trans Tech Pub,
Switzerland (1993) .p. 75-90
23. R.asthana, P.K.Rohatgi, Adv. In Metal Matrix Composites , edit. M.A.Taha
,N.A.El-mahallawy , Trans Tech Pub (1993) .p. 77-79
24. F.M.Hosking, F.Folgar portillo, R.Wunderlin , R.Mehrabian, J. Materals Sci.
17 (1982) .p.447-498
25. Calabrese, C. Laird, Mater. Sci. Eng. 13 (1974) .p.141.
26. C. Calabrese, C. Laird, Mater. Sci. Eng. 13 (1974) .p.15.
27. Robles, K.R. Anderson, J.R. Groza, J.C. Gibeling, Metall.Mater. Trans. A 25
(1994) .p.2235.
28. S.C.Tjong, G.S.Wang, Y.W.Mai, Materials Sci. and eng. A358 (2003) .p.99-
106.
29. Maxwell I, Hellawell A. Metall Trans 1972; 3.p.1487.
30. Abdel-Hamid A, Durand F. Z Metallkd 1985; 76.p.744.
31. Murray JL, Liao PK, Spear KE. Bull Alloy Phase Diagrams 1986; 7.p.550.
32. Zupanic F, Spaic S, Krizman A. Mater Sci Technol 1998; 14.p.601.
33. Lu L, Lai MO, Chen FL. Acta Mater 1997; 45(10).p.429.
34. Lupis CHP. Chemical Thermodynamics of Materials, PTR Prentice Hall,
1983.p.235.
35. Lupis CHP, Elliott JF. Acta Metall 1967; 15.p.265.
36. N.L.Yue, L.Lu , M.O.Lai ,Composite Structure 47 (1999) .p.691-694.
37. L.Lu, M.O.Lai, Y.Su, H.L.Teo, C.F.Feng, Scripta Materialia 45, (2001)
.p.1017-1023
38. Carlson ON. Bull Alloy Phase Diagrams 1990; 116.p.560-566.
39. Duschanek H, Rogl P. J Phase Equilibria 1994; 155.p.543-552.
110
40. Vardiman RG. Acta Metall Mater 1992; 40.p.1029-1035.
41. Serebryanskii VT, Epelbaum VZ, Zhdanov GS. Russ J Inorg Chem
1967;12(9) .p.1311-1316.
42. Sigworth GK. Metall Trans A 1984;15A.p.277-282.
43. J.Fjellstedt, A.E.W.Jafors, T.EL-Benawy,Materals and design 22 (2001)
.p.443-449
44. R.G.Reddy,A/M.Yahya,L.Berwer,j.Alloy And Compounds 321(2001) .p.223-
227
45. J.L. Murray, Metall. Trans. 19A (1988) .p.243 247.
46. U.R. Kattner, J.C. Lin, Y.A. Chang, Metall. Trans. 23A (1992) .p.2081 2090.
47. B. Sundman, J. Agren, J. Phys. Chem. Solids 42 (1981) .p.297.
48. Y.Liu, Q.Shi,G.Yang, Y.Zhou, Materials Letters, 58 (2004) .p.428-431.
49. Hnadbook of Ternary Alloy Phase Diagram, ASTM, (1995)
50. T.E.Jentoftsen, O.A.Lorentsen, E.W.Dewing,G.M.Haarbrg,J.Thonstad,Metall
Mater. Trans.B ,(2002) ,Vol 33B . p.909-913
51. T.E.Jentoftsen, O.A.Lorentsen, E.W.Dewing,G.M.Haarbrg,J.Thonstad, Metall.
Mater. Trans.B ,(2002) ,Vol 33B .p.901-909
52. E.W.Dewing and J.Thonstad , Metall. Mater. Trans.B ,(1997) ,Vol 28B
.p.1098-1093.
53. Y.Zhng, R.A.Rapp ,Metall. Mater. Trans.B ,(2002),Vol 28B .p.182-186.
54. Y.Zhang, X.Wu,R.A.Rapp, Metall. Mater. Trans.B ,(2003) ,Vol 34B .p.235-
242.
55. A.E.Mchal, Phase diagram for ceramists, Annual (1991), ASM .p.159.
56. S.V.Devyatkin,G.Kaptay, J.Solid State Chemistry 154 (2000),.p.107-109.
57. I.Gheorghe, H.J.Rack, Metall. Mater. Trans.A ,(2002) ,Vol 33A.p. 2155-
2162.
58. S.G.Fishman, in ,In-Situ Composites: Science and technology, edited.
M.Singh and D.Lewis (warrendale, Pa: TMS, 1994), p.1.
59. S.Suresh,A.Mortensen,A.Needleman,Fundamental of Metal matrix
omposite,Butteworh-Heinemann,(1993).p.25.
60. T.W.Clyne,M.G.Bader,G.R.Cappleman, P.A.Hubert,J.Mater.Sci.20 (1985) 85.

111
61. A.Mortensen, J.A.Cornie, M.J.C.Fleming, Metall. Mater. Trans.A ,(1983) ,
Vol 19A .p.709.
62. T.C.Willis, Metals and Materials 4 (1988) .p.485.
63. R.Mehrabian, R.G.Riek, M.C.Flemings, Metall. Mater. Trans.B ,(1974) , Vol
5B , p.1899.
64. E.F.Fascetta.R.G.Riek .R.Mehrabian, ,M.C.Flemings,Trans.,AFS.81(1973).p.
81.
65. J.R.R.M. Aikin, J. Metals 8 (1997) .p.35.
66. V. Shtessel, S. Sampath, M. Koczak, in: M. Singh, D. Lewis (Eds.), In-Situ
Composites /Science and Technology, TMS,Pennsylvania, (1994). p. 37.
67. C.F. Feng, L. Froyen, Scripta Mater. 36 (1997) .p.467.
68. P. Sahoo, M.J. Koczak, Mater. Sci. Eng. A144 (1991) .p.37.
69. M.N. Gungor, R.M. Roidt, M.G. Burke, Mater. Sci. Eng. A144 (1991) .p.111.
70. M.S. Thompson, V.C. Nardone, Mater. Sci. Eng. A144 (1991) .p.121.
71. P.C. Maity, S.C. Panigrahi, Key Eng. Mater. 104-107 (1995) .p.313.
72. A.K. Kuruvilla, K.S. Prasad, V.V. Bhanuprasad, Y.R. Mahajan,Scripta Metall.
Mater. 24 (1995) .p.873.
73. K.L. Tee, L. Lu, M.O. Lai, J. Mater. Proc. 89-/90 (1999) .p.513-519.
74. K.L. Tee, L. Lu, M.O. Lai, Mater. Sci. Technol. 17 (2001) .p.201-206.
75. Z.Y. Ma, S.C. Tjong, Metall. Mater. Trans. 28A (1997) .p.1931.
76. C.F. Feng, L. Froyen, Scripta Mater. 36 (1998) .p.467.
77. Jacobs, J. A., & Kilduff, T. F. (1997). Eng Mater Tech Prentice Hall.
78. Gotman, L, Koczak, M. J., & Shtessel, E. (1994). Mater Sci Eng A 187.p. 189.
79. Nukami, T., & Flemings, M. C. (1995). Metall Mater Trans A 26A .p.1877.
80. Zhao, H., & Cheng, Y.-B. (1999). Cera Intern 25 .p.353.
81. Brinkman, H. J., Duszczyk, J., & Katgerman, L. (1997). Scripta Mater
37.p.293
82. Feng, C. F., & Froyen, L. (1998). Scripta Mater 39.p. 109.
83. Maity, P. C., Panigrahi, S. C., & Chakraborty, P. N. (1993). Scripta Metall et
Mater 28.p. 549.
84. Pan, J., Li, J. H., Fukunaga, H., Ning, X. G., Ye, H. Q., Yao, Z. K., & Yang,
D. M. (1997). Comp Sci Tech 57.p. 319.
112
85. Feng, C. F., & Froyen, L. (1997). Scripta Mater 36 .p.467.
86. Lloyd, D. J. (1994). Int Mater Rev 39, .p.1.
87. McCopy,J.W.,Jones,C.and Wawner,F.E.,Prepartion and Properties of Cas
Ceramic/Aluminum Composite,SAMPE Quarterly,Vol.19,No.2,Jan.1988.p. 37 8
88. R.Asthana,P.K.Rohatgi Key Engineering Materials Vol.79-80 Trans. Tech.
Pub. Switzerland ,(1993) .p.47-62 .
89. R.Asthana,P.K.Rohatgi ,S.D.Das,Int. Met. Rev.31 (1986) .p.115-139.
90. A.M.Samuel, A.Gotmare, F.H.Samuel, Comp.Sci.Tech.,53 (1995) .p.301-315.
91. R.V. Krishnarao, J. Subrahmanyam. Mater Sci Eng A 362,(2003).p. 145-
151.
92. L.Lu, M.O.Lai, H.Y.Wang, J.Mater.Sci.35 (2000 ) .p.241-284
93. J.V.Wood, P.Davies, J.L.Kellie,Mater. Sci. Technol. Vol.9 (1993) .p.833-840.
94. C.F. Feng, L. Froyen, , J.Mater.Sci.35 (2000 ).p. 837-850
95. Z.Y.Ma, S.C.Tjong, Metall Mater Trans A 286A,(Sep 1997) .p. 1931-1942.
96. K.L.Tee, L.Lu, M.O.lai, Composite Structures 47 (1999) .p.589-593.
97. Z.Y.Ma, J.H.Li, S.X.Li,X.G.Ning,Y.X.Lu,J.Bi, J. Materals Sci.31(1996)
.p.741-747.
98. Z.Y.Chen, Y.Y.Chen, Q.Shu, G.Y.An, D.Li, Y.Y.Liu , Metall Mater Trans A
(2000) 31A.p. 1959-1964.
99. A.kuro lu Aluminum oxide titanium diboride reinforced metal matrix
composite and its mechanical properties MSc thesis, (July 2004),METU .p.86