production and characterisation of uf membranes by
TRANSCRIPT
Production and characterisation of UF membranes by chemical conversion of used RO membranes
This is the Accepted version of the following publication
Lawler, Will, Antony, Alice, Cran, Marlene, Duke, Mikel, Leslie, Greg and Le-Clech, Pierre (2013) Production and characterisation of UF membranes by chemical conversion of used RO membranes. Journal of Membrane Science, 447. pp. 203-211. ISSN 0376-7388
The publisher’s official version can be found at http://www.sciencedirect.com/science/article/pii/S0376738813005814Note that access to this version may require subscription.
Downloaded from VU Research Repository https://vuir.vu.edu.au/24448/

1
Production and characterisation of UF membranes by
chemical conversion of used RO membranes
Will Lawlera, Alice Antonya, Marlene Cranb, Mikel Dukeb, Greg Lesliea, Pierre Le-Clecha,* a UNESCO Centre for Membrane Science and Technology, School of Chemical Engineering, The University of New South Wales, Sydney, NSW, Australia b Institute for Sustainability and Innovation, Victoria University, Werribee Campus, VIC, Australia * Corresponding author: [email protected]
Author contact details:
Will Lawler +91430164459
Pierre Le-Clech – +61 2 9385 5762
Greg Leslie - +61 2 9385 6092
Marlene Cran - +61 3 9919 7642
Mikel Duke - +61 3 9919 7682
Alice Antony - +61-2-9385 5373

2
Abstract
Due to the increased use of reverse osmosis (RO) membranes in the water and wastewater
industry, large numbers of used modules are expected to be produced in the coming years,
and alternative options need to be considered to limit their direct disposal in landfill. One
possible solution involves converting and reusing RO elements for ultrafiltration (UF)
applications. This study aims to systematically investigate the treatment of used RO
elements with 300,000 ppm h sodium hypochlorite (NaOCl) to remove the active polyamide
layer thus exposing the microporous polysulfone (PSf) UF support layer. An optimised
conversion method is proposed by determining the initial membrane condition and
corresponding performance in terms of rejection of proteins and humic compounds,
pathogen removal and fouling rate. A number of different membrane types and conditions
were studied and their permeability performance varied from 9.3 to 116.3 L m-2 h-1 bar-1 for
pre-wetted samples. It was shown that flux recovery of dedicated RO membranes was
unsuccessful and that storage conditions and dryness affected the conversion process. The
converted membranes demonstrated a 2.4 log removal of virus sized particles, and were
comparable to 10 kDa UF in terms of protein and humic substance rejection and fouling
propensity. A number of applications and the limitations of this novel concept are also
discussed, including preliminary results for a gravity fed drinking water treatment system for
decentralised applications.

3
1. Introduction
1.1. Membrane Lifecycle
In recent decades, the installed capacity of reverse osmosis (RO) water treatment plants has
increased considerably worldwide [1,2]. In Australia alone, the capacity has risen from less
than 100 ML/day in 1990 to nearly 3000 ML/day in 2012 [3]. Plant expansion is largely
attributable to population growth, while decreased process energy costs and improved
membrane performance remain critical contributing factors [4–6].
Thin-film-composite RO membranes using aromatic polyamide (PA) are the primary
membranes utilised in modern applications for brackish water (BW) and seawater (SW)
desalination, as well as domestic and industrial water recycling. Typically, RO membranes
consists of a dense PA active layer, a microporous polysulfone (PSf) supporting layer, and a
considerably thicker non-woven polyester base [7]. The membranes are generally
manufactured by interfacial polymerisation which physically anchors the active and support
layers together through interlocking of the pore structures [8]. Current industry consensus
suggests that the average lifespan of an RO membrane is between five and ten years,
although this is highly dependent upon feed water quality and operating conditions [9,10].
Typical RO processes use approximately one hundred 8” membrane elements per 1,000
m3/d of product water capacity for a single pass seawater system, requiring tens of
thousands of elements to be installed in large plants. Optimising membrane lifespan is
therefore critical for plant sustainability and has been the focus of recent investigations
[11,12].
In the context of this study, used membranes are defined as modules which have been
removed from their primary application due to a decline in membrane performance. Several
factors contribute to the decline of membranes performance over its lifetime, and can be
manifested by a decrease in permeation, reduction in salt rejection or increase in required
operating pressure. These may be as a result of membrane fouling, which over time can be

4
irreversible and permanently affect membrane performance. The main contributors to fouling
include a variety of contaminants such as suspended particulate matter (inorganic or
organic), dissolved organic matter, dissolved solids, and biological organisms [13–15].
Oxidative damage can also permanently impair RO membranes, resulting from incidental
exposure to chlorine compounds used for water disinfection and fouling removal at various
stages of the water treatment process [16,17]. Once in contact with chlorinated oxidants, the
active PA layer is degraded through a number of suggested reaction pathways including N-
chlorination of amine groups and aromatic ring chlorination, which can be summarised as
the weakening of PA intermolecular hydrogen bond interactions with the incorporation of
chlorine [18,19]. In addition, limited evidence has also been presented that the supporting
layers of the membrane were unaffected by moderate chlorine exposure [20].Another
significant factor affecting membrane performance is the method used for storage and
transportation. Manufacturers generally recommend soaking the element in 1% food-grade
sodium metabisulphite solution and storage in a sealed bag to maintain membrane hydration
and to preserve performance [21,22]. Failure to adequately preserve and store membranes
can lead to premature drying of the element and permeability loss resulting from increased
interchain hydrogen-bonding replacing the water-polymer bonds which facilitate permeation
[23].
In addition to optimising the lifespan of RO membranes, consideration of the reuse, recycling
and disposal of membranes could elicit further improvements in the sustainability and cost-
effectiveness of desalination and water recycling plants. In Australia, RO membranes will
ultimately be disposed in landfill, and considering the expanding industry, the mass of
disposed membranes is expected to rise to 800 tonnes/year by 2015 [3,24]. In order to
minimize the environmental impact of membrane disposal, alternative uses for end-of-life
membranes are therefore required.
5
1.2. Options for Membrane Reuse and Recycling
Several options are currently considered for RO membrane reuse. Two applications
previously addressed include recycling material components and reducing the waste impact
of disposed membranes [25]. A methodology currently under investigation also considers
the repurposing of RO membranes for secondary applications [24].
In a recent study, used RO element performance was assessed and compared to new
membranes. Although all studied membranes showed more than 96% NaCl rejection, they
were no longer in accordance with the original performance criteria of >99.5% rejection.
However, the authors proposed that the residual high level of salt-rejection would facilitate
direct membrane reuse in alternate applications such as brackish water treatment [26].
Additionally, the reuse of old RO membranes was examined by assessing their functionality
and level of ageing. Autopsy techniques were used to assess hydraulic permeability, salt
rejection, morphological and topographical variations, as well as the presence of chemical or
biological elements. Overall, it was concluded that the used RO elements featured similar
specifications to nanofiltration membranes [27].
The aforementioned studies examined the direct reuse of RO membranes without additional
membrane modification. However, radical chemical treatment on used RO membranes could
facilitate conversion for additional applications. The effects of oxidative degradation and
long-term chlorine exposure have been well documented [18,19], and the literature suggests
that removing the active layer of a retired RO membrane via oxidative degradation has the
potential to result in a separation device that has a similar physical structure to standard
polyethersulfone (PES) UF membranes [28–30]. This technique of oxidative chemical
treatment to remove the PA active layer of the RO membrane resulting in an UF membrane
is referred to as membrane conversion.
This method of RO conversion was first explored in 2002 [28], when chemical treatment by
potassium permanganate (KMnO4), NaOCl and sodium hydroxide (NaOH) was used to

6
attempt conversion of retired RO modules, for reuse in wastewater pre-treatment [31]. While
only low doses of the chemicals were used, it was concluded that KMnO4 treatment
facilitated the most extensive removal of the active layer. Importantly, the study reported that
the treated membranes displayed adequate performance in subsequent applications within
municipal wastewater treatment. The membranes were capable of a 93.9% average
reduction in turbidity [27], however, fouling was identified as a significant problem in the
application of converted RO membranes although this was not systematically studied.
A recent study by Ambrosi et al, again assessed the viability of conversion using KMnO4
treatment, and displayed that it is possible to obtain stable performance resulting in high
permeate flux at the expense of lower salt rejection [32]. A cleaning step with citric acid was
investigated to address a decrease in permeability due to the formation of a manganese
oxide layer, formed from the oxidative treatment. This study has shown that even the most
effective KMnO4 treatment resulted in only a 2 fold increase in permeability with salt rejection
reduced to 85%. Moreover, it has not been clearly demonstrated that this techniques
completely removes the active layer of the membrane and therefore presents limitations for
RO conversion into UF.
Considering the limitations in the use of KMnO4 in active layer removal, the current authors
sought to examine the most effective removal treatment [24]. The solutions tested for their
removal performances include NaOH, KMnO4 and NaOCl, with exposure intensities ranging
between 28,000 and 500,000 ppm h. The resulting membranes were tested for pure water
permeability and salt rejection and it was concluded that the active layer was completely
removed when further treatment did not result in an increase in permeability. The results
showed that NaOCl was the most successful degrading agent with exposures of 100,000
and 300,000 ppm h, using concentrations of 6.25% (w/v) for 2 h and 0.625% (w/v) for 48 h
respectively, resulting in stable flux and average salt rejections below 4%. The removal of
the PA active layer was confirmed with surface morphology analysis using scanning electron
microscopy (SEM) [25]. Both KMnO4 and NaOH treatment resulted in a significant effect on

7
salt rejection, indicating discernible damage to the membrane surface. However, flux
increase was an order of magnitude lower than NaOCl treatment, suggesting that complete
removal of the active layer was not achieved. As a result, an exposure of 300,000 ppm h of
NaOCl was recommended as the standard protocol for the continuing investigation of RO
membrane conversion. A similar methodology has been used in a recent study to convert
seawater RO (SWRO) membranes with NaOCl into brackish water RO (BWRO) and to
briefly consider the formation of UF membranes through prolonged exposure [33]. Exposure
intensities from 7,000 to 300,000 ppm h were tested, and the results were consistent with
the effects of prolonged exposure discussed in Lawler et al [24]. Furthermore, these two
recent studies found comparable permeability and rejection characteristics of the converted
membranes. Although preliminarily addressed in the previous work by the current authors
[25], the main limitation of these studies was the limited characterisation of membranes
properties and susceptibility to fouling. Moreover, discussion of the effect of used membrane
condition on subsequent converted performance has not yet be presented and converted
RO membranes are still to be benchmarked against commercially available UF membranes.
Finally, Raval et al’s examination of NaOCl treatment only utilised membranes manufactured
in house for the prolonged exposure tests, with limited discussion of the potential
applications of the the converted membranes.
1.3. Optimisation of conversion protocol
The aim of the current study is to build on previously published work and systematically
investigate opportunities for RO membrane reuse by: (a) determining the optimum protocol
for converting RO membranes, including the effect of storage conditions as identified in
preliminary study; (b) examining the effect of active layer removal on flux, rejection and
surface morphology on a range of virgin and industrially used membranes; (c) benchmarking
the efficacy and fouling of converted RO membranes against UF membranes and (d)
discussing and investigating potential applications and limitations of the converted RO
membranes.

8
2. Materials and Methods
2.1. Membranes
The characteristics of the membranes used in this study, including UF, SWRO, and BWRO
are summarised in Table 1. All RO membranes tested were PA thin-film composite
construction with a PSf support layer, and have a manufacturer stated chlorine tolerance
rating of less than 1,000 ppm h or a continuous free chlorine exposure of less than 0.1 mg/L.
Table 1: Condition and key properties of studied membranes.
Label Membrane Manufacturer NaCl Rejection Type Condition
Initial permeability
(L m-2 h-1 bar-1)
DOW DOW BW30FR 99.5* BWRO Virgin/dry 3.5 Koch1 Koch 8822HR 99.5* BWRO Used/wet 2.8 CSM CSM RE8040-FE 99.5* BWRO Used/moist 3.31 Hydra Hydranautics CPA5-LD 99.7# BWRO Used/moist 0.45 Toray Toray TML820 99.7^ SWRO Used/moist 0.32 Koch2 Koch TFC-SW 99.75^ SWRO Virgin/dry 0.8
UF 10 kDa flat sheet PAL Omega PES UF - UF Virgin 120
* 2000 ppm at 15.5 bar, 15% recovery # 1500 ppm at 15.5 bar, 15% recovery ^ 32000 ppm at 55 bar, 8% recovery
2.2. Membrane Wetting and Conversion
For this study, the conversion method was as follows: membrane samples were cut to size
from sheets of spiral wound elements and pre-conversion wetting was applied. Wetting and
testing was undertaken using a Sterlitech HP4750 high pressure dead end cell with Milli-Q™
water and pressure was applied using a nitrogen cylinder. Following the wetting step,
samples were exposed to a NaOCl solution which was protected from UV light to minimise
NaOCl deterioration. The samples were exposed to the solution for 2.4 h at room
temperature. The NaOCl used was 12.5% w/v technical grade from Ajax Finechem Pty Ltd
and the concentration was determined spectrophotometrically at a wavelength of 292.5 nm
using a molar extinction coefficient of 360 M-1cm-1 [34]. The pH of the solution was
9
maintained at 12 ± 0.5. Following conversion, samples were thoroughly rinsed and then
stored in Milli-Q™ water at 4°C prior to characterisation.
2.3. Membrane Characterisation by FTIR
Membrane samples were characterized by Fourier transform infrared (FTIR) spectroscopy
using a Shimadzu IRAffinity-1 FTIR spectrophotometer. The membranes were analysed by
attenuated total reflectance (ATR) using a Pike Technologies VeeMAXTM II variable angle
specular reflectance accessory using a 45 degree ZnSe ATR crystal. The spectra were
recorded at a resolution of 4.0 cm-1 in the range 4000-600 cm-1 with an average of 56 scans
per membrane.
2.4. Rejection Characterisation
Salt rejection characterisation was conducted using 2000 ppm of NaCl (Sigma Aldrich,
Australia) at 15 bar for RO and 1 bar for converted RO in the aforementioned dead end cell.
For advanced rejection characterisation, a solution of 10 mg/L humic acid (HA) and 10 mg/L
bovine serum albumin (BSA) (Sigma Aldrich, Australia) was passed through membrane
samples and analysed using liquid chromatography-organic carbon detection (LC-OCD),
system model 8, based on the Gräntzel thin film reactor developed by DOC Labor, Germany
[35].
2.5. Silver Nanoparticle Challenge Testing
Citrate stabilised silver nanoparticles were prepared by dissolving 9 mg of silver nitrate in 50
mL of water and bringing to boil. To the boiling solution, 1 mL of 1% sodium citrate solution
was added dropwise under vigorous stirring. After complete addition, the mixture was further
boiled for 1 h and allowed to cool at room temperature. The mixture was centrifuged at
25000 rpm for 30 min to separate the nanoparticles from the free silver ions. The
nanoparticles were then redispersed in water by sonication and stored for testing. All the

10
reagents used to prepare the nanoparticles were of analytical grade and Milli-Q™ water was
used throughout experiments. The particles were filtered through the membrane samples
using the setup described in Section 2.6, feed and permeate samples were collected after 15
and 30 min of operation and analysed for Ag content by Perkin Elmer optima 7300
inductively coupled plasma (ICP) optical emission spectrometer.
2.6. Fouling Characterisation
Fouling and cleaning experiments were performed using a laboratory-scale cross flow unit,
which allows for long-term automated cycles. The tests used 0.5% w/v NaOCl cleaning
solution and mixture of BSA, humic acid (HA), alginic acid (AA), colloidal silica and calcium
carbonate (sourced from Sigma Aldrich, Australia) as synthetic feed. Before filtration, the flat
sheet module and all membranes were rinsed with Milli-Q™ water at 30 L m-2 h-1 for 30 min
prior to the synthetic feed testing. Cole-Parmer Masterflex peristaltic pumps provided up to 2
bar of transmembrane pressure (TMP), recorded by pressure transducers, located across a
custom built plate and frame membrane cell featuring an active surface area of 0.00275 m2.
In addition, contact angle measurements were made using the sessile drop method [36].

11
3. Results and Discussion
3.1. Effect of storage conditions on hydraulic performance
The membranes used in this study, were in a variety of conditions (i.e. wet, moist or dry)
resulting from their different usage and storage history. In order to assess the potential
impact of membrane drying during storage, two membranes (DOW and Koch1) were tested
for permeability before and after artificial desiccation. In the case of the virgin dry DOW
membrane, initial wetting was done in order to simulate use and assess compaction. Drying
was achieved in a desiccator for 24 h and Milli-Q™ water under 15 bar pressure was used
for the wetting steps. The permeability change (in L m-2 h-1 bar-1) over time is presented in
Figure 1.
Figure 1: Average permeability trend of membranes under varying storage conditions (15 bar, Milli-Qtm). Left: Koch1 Right: DOW.
The Koch1 samples, which had been stored wet, quickly reached and maintained a stable
flux of 2.8 ± 0.3 L m-2 h-1 bar-1. On the other hand, the dried samples took over 10 min to
produce any permeate and the resulting permeability was significantly lower at 0.39 ± 0.2 L
m-2 h-1 bar-1. The case with DOW is slightly different, as the membrane had not been wetted
before. As a result, the initial wetting stage starts off at a slightly higher permeability but
0
0.5
1
1.5
2
2.5
3
3.5
0 10 20 30
Perm
eabi
lity
(L m
-2 h
-1 b
ar-1
)
Time (min)
Used
Rewettingafter drying
0
0.5
1
1.5
2
2.5
3
3.5
4
4.5
0 20 40 60
Perm
eabi
lity
(L m
-2 h
-1 b
ar-1
)
Time (min)
Initial Wetting
Rewetting afterdrying
12
gradually declines and stabilises as compaction of the dense PA layer occurs. Rewetting
attempts were even less successful than with the Koch samples, as it took up to 20 min for
any permeate to be produced and resulted in a permeability of only 0.2 ± 0.1 L m-2 h-1 bar-1.
The mechanism for this phenomenon is likely to be the reduction of water-polymer
interactions or by collapsing of pores via capillary forces, driven by the evaporation of water
[23]. Rehydration becomes difficult once the pores collapse, resulting in significantly lower
hydraulic performance, while theoretically retaining rejection properties. The NaCl rejection
of the dried samples was tested and no statistical difference was observed. DOW that had
not been subjected to the initial wetting stage (i.e. dry as purchased) all was also desiccated
and then wetted, however no noticeable difference in permeability was observed compared
to the initial wetting stage of samples represented in Figure 1. This supports the idea that it
is the evaporation of water from the moist pores which closes them, as the DOW membrane
was purchased and delivered dry, without a preserving agent. These results show that the
permeability loss of wet membranes subjected to desiccation, is irrecoverable using the
described method. Therefore, the importance of proper membrane storage in order to
maintin hydraulic performance is highlighted as the dry membranes resulted in a lower
average permeability than the membranes that were stored wet (or compared to new
samples).
A typical method recommended by manufacturers for effective re-wetting requires
membrane pressurisation at 10 bar while the permeate valve is closed [37]. This method
was tested at length, however no detectable additional performance was observed. Other
recommended methods for re-wetting dried elements include soaking in 50/50%
ethanol/water solution for 15 min or in 1% HCl or 4% HNO3 for 1-100 h [37]. Rewetting a RO
membrane via soaking in ethanol has been previously explored and was shown to partially
restore the initial flux [23]. Although these methods do not require a filtration system, they
increase the consumption and subsequent disposal of additional chemicals.

13
3.2. Impact of Pre-wetting on Conversion Efficiency
To assess the variation in performance of converted membranes, the process was applied to
a range of virgin and used BWRO and SWRO membranes. The effect of membrane pre-
wetting was assessed by applying the process to samples left as stored and with additional
wetting. In addition, some membranes were converted after desiccation, with and without
attempted rewetting, to simulate the worst case scenario for stored membranes. Six different
types of membranes (2 virgin and 4 used) were converted in both original and wetted states.
The wetting was conducted at 15 bar for 30 min and the conversion was based on a NaOCl
exposure of 300,000 ppm h. After conversion, the samples were tested for permeability at a
range of pressures (0-4 bar).
Figure 2: Effect of wetting (at 15 bar) on conversion efficiency (Permeability tested at 0-4 bar).
As shown in Figure 3, the pre-wetted membranes obtained up to a 14 fold increase in
permeability when compared to the un-wetted membranes; however, there was great
variation in performance from the different membrane types. The virgin DOW showed a
370% increase in permeability when wetting was applied, while Koch1 which was stored wet
achieved only 10% increase with additional wetting. DOW and Koch1 showed extremely
0
20
40
60
80
100
120
DOW Koch CSM Hydra Toray Koch2
Perm
eabi
lity
(L m
-2 h
-1 b
ar-1
)
Membrane Type
Dried
Dried + rewetted
As stored
Prewetted
Process prior to conversion

14
poor converted performance when completely desiccated, even with attempted rewetting;
however, there was still a measurable increase in permeability over their unconverted RO
state. Due to the significantly lower converted performance of the desiccated samples when
compared to wet samples, these tests were not conducted with the other membranes.
However, the results obtained clearly indicate that membrane drying is detrimental to the
success of the conversion process. The salt rejection for all converted membranes was
tested, showing less than one percent removal. This suggests that the PA layer was still
significantly compromised on these low performance membranes. One proposed
mechanism for the performance difference between the wet and dry samples is that
increased inter-chain hydrogen bonding which occurs during drying, subsequently affects the
process of ring chlorination. In addition, it is possible that the voids collapsing via capillary
forces during the drying process inhibit the penetration of the oxidising solution, thus
reducing its effectiveness [23].
The two SWRO membranes, Toray and Koch2 showed an extremely low converted
performance, with and without pre-wetting. Toray was stored moist and Koch2 was a virgin
dry sample that had not been previously wetted. While converted performance was low
compared to the BWRO samples, the membranes showed a minimum of 2 fold increase in
permeability after conversion and pre-wetted samples reaching over 9 L m-2 h-1 bar-1.
Conversely, two of the BWRO membranes (CSM and Hydra), which were extremely
fouled/damaged and had previously been used for coal seam gas water treatment
applications, showed a significant increase in permeability (8.6 and 3.5 fold respectively)
when pre-wetting was applied. Comparably, a previous study obtained a converted flux of
124 L m-2 h-1 bar-1 when applying a similar conversion protocol (300,000 ppm h of NaOCl
exposure) to an in house manufactured PA/PSf TFC SWRO membrane, following a wetting
phase [33].
The different performances between the converted SWRO, BWRO and damaged
membranes, indicate that converted performance is affected, not only by storage conditions,
15
but also by the membrane condition and construction. The difference in membrane type,
manufacturer, and the degree and nature of the fouling/damage can potentially affect the
resulting performance. Supporting this concept, it has been shown that different PSf
construction methods and additives can affect the hydraulic performance of the support layer
[30]. Additionally, it is possible that further degradation of un-wetted samples would result in
hydraulic performances comparable to the wetted samples, however this was not explored in
the current study. This variability in performance is expected to be an issue when using this
conversion method for specific reuse applications as membrane properties will need to be
carefully evaluated on a case-by-case basis with testing required for each individual module
source.
Another possible application of this treatment method is to use controlled exposure with
NaOCl to partially remove the active layer, trading increased permeability for decreased salt
rejection, resulting in a nanofiltration or high flux BWRO membrane. Based on work shown
here and previously published [24,33], it has been concluded that this controlled removal of
the active layer is possible but challenging. This is due to the varied response of different
membrane types to the conversion process and the rapid removal of the active layer as
exposure time increases. Implementation of this technique would require the testing of
optimum exposure for each membrane type and is unlikely to lead to consistent flux and
rejection performance.
The additional step of membrane wetting prior to conversion, is unfavourable in terms of
operation time, energy and required equipment. Therefore, an important consideration is the
minimum pressure of wetting required to achieve favourable results. To determine the
optimum pressure range, the virgin BOW samples wetted at different pressures were
converted using the standard method and tested in order to determine the relationship
between wetting pressure and hydraulic performance (Figure 3).
16
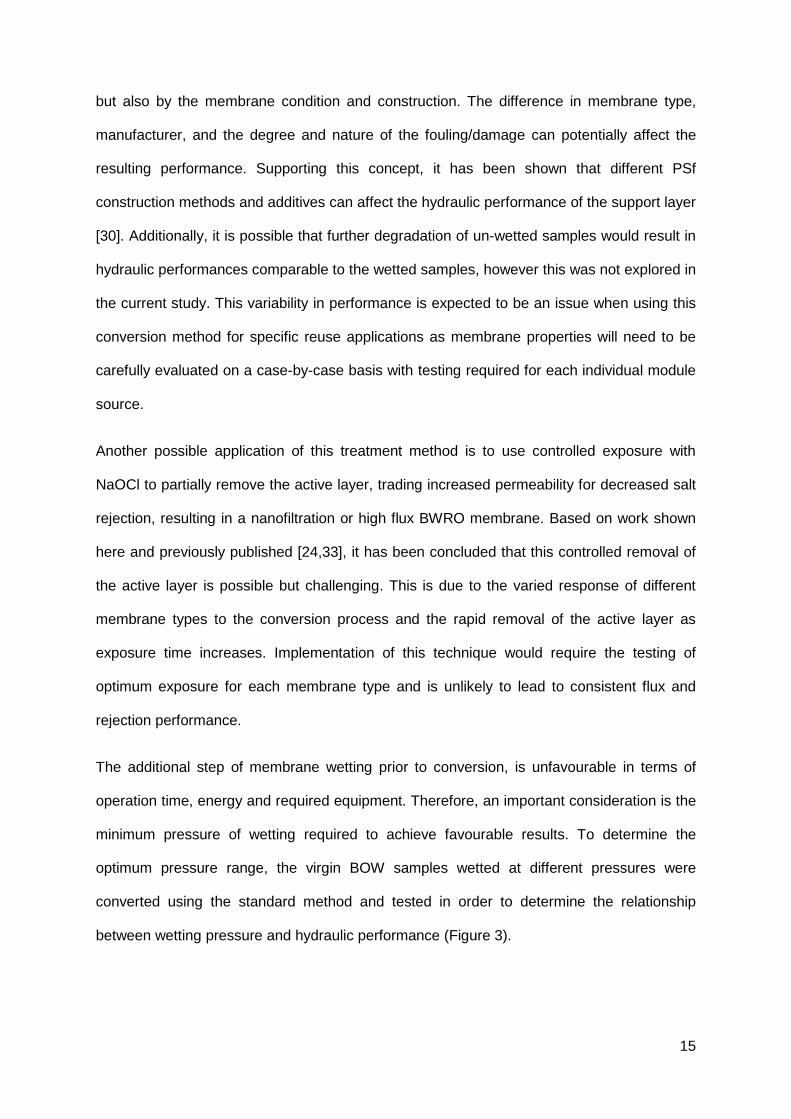
Figure 3: Performance of resulting converted DOW after treatment at various wetting pressures (Resultant permeability tested at 4 bar).
As expected, it was observed that as wetting pressure increased, so did the resulting
permeability, with a plateauing trend developing at higher pressures. Wetting at 2 bar results
in over twice the permeability of the dry samples, and the hydraulic performance continues
to improve up to 5 bar of applied pressure. Large sample variability was observed during the
triplicate analysis and the appropriate errors have been displayed. The overall trend
indicated performance up to of 59 ± 5 L m-2 h-1 bar-1 for 15 bar of prewetting pressure. The
results indicate that increasing the wetting pressure of the used RO membrane improves the
hydraulic performance of the converted membranes.
3.3. Active layer removal
During preliminary investigation, visual inspection with SEM was used to confirm the
successful removal of the active layer [25]. To further support the evidence of conversion,
chemical changes in the PA layer were investigated by FTIR spectroscopy. In Figure 4, a
select range of FTIR spectra for virgin and converted pre-wetting samples of DOW
membrane are shown.
0
10
20
30
40
50
60
70
0 5 10 15
Perm
eabi
lity
(L m
-2 h
-1 b
ar-1
)
Wetting Pressure (bar)

17
Figure 4: Infrared spectra of DOW membrane, virgin and exposed to 300.000 ppm h of NaOCl.
The spectra from the untreated membrane shows peaks at 1667 and 1542 cm-1,
corresponding to amide I and amide II bands respectively, and are associated with
predominately C=O stretching and N-H plane bending [20]. The peak at 1610 cm−1 is
representative of the C=C stretching vibrations from the aromatic amide bonds [20,38]. The
converted membrane exhibits suppression and possibly elimination of the characteristic
aromatic polyamide peaks which has been previously shown to be an indication of chlorine
damage via the mechanism of Orton rearrangement [18]. When comparing these results to
previous studies on free chlorine damage to PA membranes, the relative peak suppression
is extreme and nearly complete [19,39], a difference which can be explained by the
significantly higher oxidant exposures used. This suppression corresponds to breaking of
various bonding groups and the subsequent deterioration of the chemical structure. The
peak at 1487 cm-1, which corresponds to a characteristic peak of PSf (CH2 stretch), does not
show any significant suppression. The PSf peaks can be seen in the spectra of the
membrane due to the relatively deep penetration of the light probe compared to the PA layer
thickness. This lack of suppression indicates that the PSf layer has not been negatively
affected in this band by the conversion process [19].
0
0.2
0.4
0.6
0.8
1
13501450155016501750
Nor
mal
ised
abs
orba
nce
Wavenumber (cm-1)
Virgin
Converted
Amide I Amide II

18
Based on this qualitative assessment, the PA active layer has undergone significant
changes to its chemical structure. Along with the changes in salt rejection and hydraulic
performance presented both here and in previous work and with visual confirmation via SEM
analysis [25], it is suggested that the conversion process results in substantial and possibly
complete removal of the PA layer from the underlying membrane support layers.
3.4. Rejection Properties
Challenge testing was used to contrast the rejection performance of converted RO to
commercially available UF membranes, which were selected due to similar hydraulic
performance, and to estimate the molecular weight cut-off (MWCO) of the newly converted
membranes. A solution of proteins and humic substances were filtered and analysed by LC-
OCD [35] (Figure 5).
Figure 5: LC-OCD chromatogram for protein and humic feed and permeates from UF (10 kDa) and converted RO (DOW and Koch2).
The prominent biopolymer peak of the feed solution shows a high content of substances with
a molecular weight of above 10kDa. The right boundary of the biopolymer peak is defined by
0.00
1.00
2.00
3.00
4.00
5.00
6.00
7.00
8.00
20 30 40 50
rel.
Sig
nal R
espo
nse
Retention Time (Min)
Feed
Hum
ics
Bio
poly
mer
s
Bui
ldin
g B
lock
s
UF
DOW
Koch2
19
the start of the humics peak, which is also pronounced in the feed solution samples
(between 10 and 1 kDa). The final peak displayed is related to the building block materials,
low molecular weight acids and neutral components originating from the breakdown of
protein compounds (less than 1kDa). For all filtered samples, both the biopolymer and humic
peaks were suppressed, indicating their efficient removal and all membranes tested
exhibited a biopolymer rejection above 97%. In addition, the rejection of humic substances is
similar between the various samples, with 69% of humics retained by the PES UF
membrane and the converted RO membranes rejecting between 63 and 67%. As described
previously, the DOW membrane demonstrated a permeability more than 5 times higher than
that of the Koch2, while still presenting comparable rejection performances. Using this
comparative method, the MWCO for the converted RO membranes was estimated to be
similar to the tested UF membrane, i.e. around 10 kDa.

20
3.5. Pathogen Removal
To confirm the converted membrane rejection properties, further investigation into pathogen
removal by challenge testing was conducted to enable a more effective suitability
assessment for possible water treatment applications. Citrate stabilised silver nanoparticles
were used as a virus analogue and were selected based on consistency, ease of
manufacture and testing. Particles were filtered in a cross flow configuration, followed by
analysis of the permeate using ICP. The membrane removal efficacy was calculated as log
removal value (LRV):
Where Cin and Cout are the average particle concentrations in the feed and permeate
respectively. The results and calculated LRVs are displayed in Table 2.
Table 2: ICP results from Ag model virus particle removal.
Membrane Feed
concentration mg Ag /L
Permeate concentration
mg Ag /L Rejection (%) LRV
Converted DOW 9.19 0.035 ± 0.009 99.62 2.42
10kDa UF 8.05 0.024 ± 0.003 99.75 2.57
The 10 kDa UF and the converted DOW membrane displayed rejections above 99.5%,
equivalent to LRVs of 2.57 and 2.42 respectively for the tested particles. Previous work
conducted by our research group has revealed that the particles closely resemble the
physical characteristics of some water-borne viruses. Specifically, the particles were 62 ± 10
nm in size, had a strong negative charge of -25±4 mV and were nearly spherical in shape
[40].
These rejection values are slightly low when compared to other direct integrity testing
methods including the commonly used MS2 bacteriophage. For example, this indicator has

21
been shown to demonstrate an LRV of 3-4 for hollow fibre UF membranes of similar MWCO
values [40]. However, as operating conditions significantly affect LRVs, evaluating different
methods can be difficult and further testing is required to adequately compare the various
techniques. Ultimately however, the results indicate that the conversion process has not
compromised the integrity of the microporous UF supporting layer of the original RO
membrane or its ability to remove virus-sized compounds from the feed water.
3.6. Fouling Propensity
Fouling remains a major cause of membrane productivity loss and often dominates the
design and operation of treatment systems. To investigate the fouling potential of the
converted membranes, accelerated long term filtration experiments were performed using
both converted DOW and commercially available flat sheet UF membranes for comparison.
A solution modelling river water with high organic content (TOC of 20 mg/L) was used to
accelerate fouling and cross flow cleaning was conducted using sodium hypochlorite. The
aim was to determine if the exposed PSf surface of the converted membrane was
specifically vulnerable to fouling due to increased roughness or resistance to cleaning.
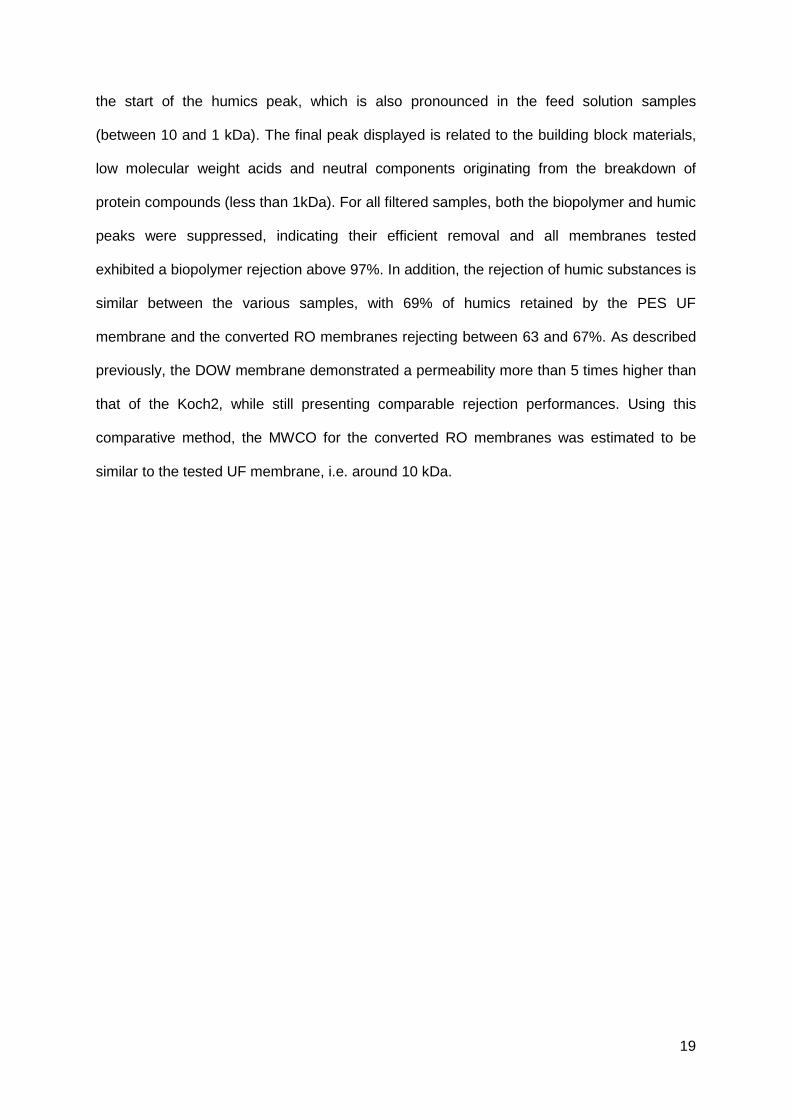
Figure 6 shows a typical series of fouling and cleaning cycles from a converted RO
membrane. The plot illustrates the change in TMP expressed as fouling rate (∆TMP/∆tcycle)
for each filtration cycle, as well as the overall TMP rate increase during the entire filtration
period (∆TMP/∆toverall). The results demonstrate a consistent fouling gradient for each cycle,
as well as an overall increase in TMP. Following each fouling cycle, the cleaning cycle was
shown to partially recover the TMP increase caused by fouling build-up.
22
Figure 6: Depiction of fouling effect for 60 min filtration and 10 min cleaning cycles at 30 L m-2 h-1.
Figure 7 shows the TMP behaviour over 32 cycles of 70 min each for the two membrane
types tested. To assess the effectiveness of the cleaning cycles, cleaning efficiency (CE)
was calculated using:
Where ∆TMPcycle is the TMP increase during the each fouling cycle and ∆TMPresidual is the
unrecovered TMP increase after the cleaning cycle. Table 3summarises the TMP and
cleaning efficiencies during consecutive cycles.
0
20
40
60
80
100
120
140
0 1 2 3 4 5 6 7 8
TMP
(kPa
)
Time (h)
∆TMP/∆tcycle ∆TMP/∆toverall
Filtration Cleaning

23
Figure 7: TMP behaviour during cyclical fouling and cleaning.
Table 3: Cleaning efficiency and changes in TMP.
Membrane type ∆TMP/∆t cycle average (kPa/h)
∆TMP/∆t overall (kPa/h)
Average cleaning efficiency (%)
Converted DOW 18.6 1.81 86.4 UF 22.6 1.01 91.7
The membrane resistance of the UF and converted RO was initially calculated as 0.30 and
0.58 × 10¹³ m-1 respectively. As fouling occurs during each cycle, a TMP increase was
observed and this was partially mitigated during each subsequent cleaning cycle as the
cleaning protocol removed the reversible fouling build-up. Over the course of the
experiments, the overall TMP increase was consistent as a result of irreversible fouling build-
up, which was not recovered during the hypochlorite cleaning cycles. However, as the silica
and calcium carbonate components of the feed do not respond to the hypochlorite cleaning,
further TMP restoration could be realised with an acidic clean.
The overall TMP increase was 1.8 and 1.0 kPa/h for the converted and UF membranes
respectively, showing a greater build-up of irreversible fouling on the converted membranes
over the same time period. The commercially available UF membrane featured an average
TMP increase per cycle of 22.6 kPa/h compared to the converted membrane rate of 18.6
0
20
40
60
80
100
120
140
160
180
0 5 10 15 20 25 30 35 40
TMP
(kPa
)
Time (h)
DOW UF

24
kPa/h, suggesting that the UF membranes fouled at a slightly faster rate during each
filtration cycle. Results by Hajibabania et al obtained using a similar protocol, model solution
and hollow fibre PVDF membranes, showed a comparable average fouling rate of 31.2
kPa/h [41]. The difference in cleaning efficiency explains how the converted membranes
fouled at a slower rate per cycle but faster overall. On average, the cleaning process was
92% effective for the UF membranes, but only 86% effective for the converted membranes,
suggesting that while the UF membranes fouled faster, they were cleaned more effectively
leading to a lower increase in ∆TMP/∆toverall. Due to the extreme nature of the chemical
treatment removing the physically interlocked PA layer from the PSf support, it is expected
that converted RO would have a higher fouling propensity than commercially manufactured
UF, resulting from high surface roughness and other altered surface properties. Average
surface roughness of membranes can affect its fouling propensity and can be determined by
atomic force microscopy (AFM). While not currently addressed, future work will assess the
effect of NaOCl treatment on the roughness of the resulting UF membrane as a prediction
tool for fouling. In practice, under the relatively extreme fouling conditions imposed during
this study, the converted membrane did show a higher fouling propensity and cleaning
resistance, but not to the degree that was initially hypothesised.
Furthermore, contact angle measurements determined that the 10 kDa UF membrane was
more hydrophobic at 83 ± 1° than the converted RO membranes at 70 ± 3°. This difference
in hydrophobicity, along with the potential difference between the protein affinity of the PES
construction of the UF membrane and the PSf construction of the converted RO membrane,
could also make a significant difference in fouling performance [42].
An important consideration, not explicitly addressed in these experiments, is the effect of the
feed spacers on membrane fouling. Feed spacers can limit the deposition of gel particles
and reduce concentration polarization [43,44], while promoting biofouling growth [45].
Further consideration of the effect of the thinner RO feed spacers on UF applications is

25
required as these may be susceptible to clogging or increased fouling, especially with feed of
high suspended solids.
Within the operating conditions of this study, the converted membranes did not suffer from
catastrophic fouling rates. However, they are still quite susceptible to resistance increases
and when compared to a commercially available UF membrane, did not respond as
favourably to a basic cleaning modality. The differences between the performance of
converted RO and manufactured UF will be an important consideration when seeking
potential applications for the converted membranes.
3.7. Potential Applications
The results of this study show that converted membranes have promising technical
performance, making them potentially suitable to replace flat sheet UF membranes for a
wide range of applications. These include the emerging applications of RO pre-treatment
[46,47], water disinfection [48] and advanced industrial and residential wastewater treatment
[49]. Other common UF applications in the food and pharmaceutical industry would be a
challenge for converted membranes, as their unsanitary nature will make compliance with
the relevant regulatory agencies difficult [50]. However, in the case of advanced wastewater
treatment and desalination pre-treatment, converted RO modules are expected to remove all
suspended solids, large organic species, and a significant fraction of pathogens present in
the feed. The variation of results from converting different membrane types signifies that
further validation and integrity testing will be required to assess the performance of each
membrane batch.
One application currently under investigation is their use in gravity driven membrane water
treatment, for use in rural communities and developing countries. Preliminary tests using a
ground water analogue feed solution, a custom designed plate and frame setup with a
surface area of 0.12 m2, and a maximum hydraulic head of 1.4 m showed promising results.

26
The system operated in a submerged configuration, using gravity driven hydraulic pressure
as the driving force.
Figure 8: Permeability decline of converted DOW membrane used in gravity driven membrane treatment.
Figure 9 shows the permeability loss experienced by the system over a period of 36 h, as
well as the effect of simple cleaning methods. For each cleaning cycle, the membranes were
removed and wiped with a sponge until visible build-up was removed, resulting in a
substantial recovery of permeability. This cleaning method, while effective in the current
configuration, would not be possible if the membranes were used as a spiral wound module.
This simple cleaning method, which is manageable by an untrained operator, allows for the
long term operation of the system and the effective restoration of flux.
In a 24 h period, the system produced 19.4 L of water which is considered enough to supply
water to a family of four in developing communities [51]. In addition the membranes reduced
the turbidity by greater than 99.9%, as well as removing 51 ± 9% of organic species, with no
drop in rejection performance after cleaning cycles. Although this presents a promising
potential application, further study on the quality of the product water is required before it can
be deemed suitable for implementation.
0
20
40
60
80
100
120
140
160
0 5 10 15 20 25 30 35 40
Perm
eabi
lity
(L m
-2 h
-1 b
ar-1
)
Time (h)
With cleaning
No cleaning

27
4. Conclusions
Building on previous work by the author and international membrane research community, a
number of characterisation techniques were applied on used RO membranes subjected to
extreme chlorine exposure in order to determine their suitability for reuse applications as UF-
like membranes. In addition, this study focused on membrane storage methods, steps were
taken to optimise the conversion pre-treatment methods, and the process was applied to a
number of industrially used membranes. Permeability assessment of wet and dried
membranes highlight the importance of proper storage conditions for RO membranes
intended for direct reuse, as only partial performance recovery was achievable after drying.
Tests were conducted to determine how different storage and pre-treatment conditions
affected the extent of the conversion. Invariably, all membrane types tested benefited from
pre-wetting, with performance increasing up to and potentially beyond 15 bar of applied
pressure.
While it was shown that the membranes perform adequately, especially in terms of
permeability and rejection, inconsistent performance across different membrane types, the
requirement for high pressure pre-wetting and high chemical doses may limit the feasibility of
large scale implementation. Each batch of membranes to be reused requires individual
characterisation and assignment to a suitable application, and the unsanitary nature of the
converted membranes possibly excludes their use in pharmaceutical and food processing
applications. However, the supply of converted RO membranes as inexpensive UF
membrane replacements for use in low cost humanitarian water treatment projects, low cost
RO pre-treatment, or wastewater treatment operations is expected to benefit the industry.
By utilising this alternative end of life option the volume of RO membranes sent to landfill will
be reduced, limiting the associated social and environmental costs. Current and future work
in this area is focused on the application of this optimised conversion process on whole RO
membrane modules on a pilot scale, with the testing of specific applications of the resulting
UF membranes. Additionally, a variety of tools including Life Cycle Assessment, will be used

28
to determine the financial and environmental sustainability of this process, when compared
to alternative end of life disposal options.
5. Acknowledgements
The authors acknowledge the financial support of the National Centre of Excellence in
Desalination Australia which is funded by the Australian Government through the Water for
the Future initiative. Collaborative partners from Monash University, Sydney water, Water
Corporation, Dow and the SkyJuice Foundation are also gratefully acknowledged.

29
6. References
[1] C. Fritzmann, J. Lowenberg, T. Wintgens, T. Melin, State-of-the-art of reverse osmosis desalination, Desalination. 216 (2007) 1–76.
[2] M. Hoang, B. Bolto, C. Haskard, S. Gray, G. Leslie, Desalination in Australia, CSIRO. (2009).
[3] Global Water Intelligence, DesalData.com online database, (2012).
[4] L.F. Greenlee, D.F. Lawler, B.D. Freeman, B. Marrot, P. Moulin, Reverse osmosis desalination: water sources, technology, and today’s challenges, Water Research. 43 (2009) 2317–48.
[5] J. Schrotter, S. Rapenne, J. Leparc, P. Remize, S. Casas, Current and Emerging Developments in Desalination with Reverse Osmosis Membrane Systems, Water Research Center of Veolia. 2 (2010) 35–65.
[6] B. Peñate, L. García-rodríguez, Current trends and future prospects in the design of seawater reverse osmosis desalination technology, Desalination. 284 (2012) 1–8.
[7] K.P. Lee, T.C. Arnot, D. Mattia, A review of reverse osmosis membrane materials for desalination—Development to date and future potential, Journal of Membrane Science. 370 (2011) 1–22.
[8] N.P. Soice, A.R. Greenberg, W.B. Krantz, A.D. Norman, Studies of oxidative degradation in polyamide RO membrane barrier layers using pendant drop mechanical analysis, Journal of Membrane Science. 243 (2004) 345–355.
[9] S.A. Avlonitis, K. Kouroumbas, N. Vlachakis, Energy consumption and membrane replacement cost for seawater RO desalination plants, Desalination. 157 (2003) 151–158.
[10] A.M. Gilau, M.J. Small, Designing cost-effective seawater reverse osmosis system under optimal energy options, Renewable Energy. 33 (2008) 617–630.
[11] G. Kang, Y. Cao, Development of antifouling reverse osmosis membranes for water treatment: A review, Water Research. 46 (2012) 584–600.
[12] M.F.A. Goosen, S.S. Sablani, Fouling of reverse osmosis and ultrafiltration membranes : A critical review, Separation Science and Technology. 39 (2004) 2261–2298.
[13] K. Kogutid, B. Kunst, RO and NF membrane fouling and cleaning and pore size distribution variations, Desalination. 150 (2002) 113–120.
[14] M.C. Amiri, M. Samiei, Enhancing permeate flux in a RO plant by controlling membrane fouling, Desalination. 207 (2007) 361–369.
30
[15] C.Y. Tang, T.H. Chong, A.G. Fane, Colloidal interactions and fouling of NF and RO membranes: a review., Advances in Colloid and Interface Science. 164 (2011) 126–43.
[16] N. Porcelli, S. Judd, Chemical cleaning of potable water membranes: A review, Separation and Purification Technology. 71 (2010) 137–143.
[17] W. Gao, H. Liang, J. Ma, M. Han, Z. Chen, Z. Han, et al., Membrane fouling control in ultrafiltration technology for drinking water production: A review, Desalination. 272 (2011) 1–8.
[18] A. Antony, R. Fudianto, S. Cox, G. Leslie, Assessing the oxidative degradation of polyamide reverse osmosis membrane—Accelerated ageing with hypochlorite exposure, Journal of Membrane Science. 347 (2010) 159–164.
[19] M.J. Cran, S.W. Bigger, S.R. Gray, Degradation of polyamide reverse osmosis membranes in the presence of chloramine, Desalination. 283 (2011) 58–63.
[20] A. Ettori, E. Gaudichet-Maurin, J.-C. Schrotter, P. Aimar, C. Causserand, Permeability and chemical analysis of aromatic polyamide based membranes exposed to sodium hypochlorite, Journal of Membrane Science. 375 (2011) 220–230.
[21] Nitto Denko Hydranautics, General Storage Procedures for Composite Polyamide (ESPA, ESNA, CPA, LFC, SWC) and Polyvinyl Derivative (PVD) RO Membrane Elements - TSA108.12, Oceanside, CA, 2012.
[22] Toray Industries, Operation, Maintenance and Handling Manual for membrane elements. Retrieved from www.torayindustries.com, (2005).
[23] J.S. Louie, I. Pinnau, M. Reinhard, Effects of surface coating process conditions on the water permeation and salt rejection properties of composite polyamide reverse osmosis membranes, Journal of Membrane Science. 367 (2011) 249–255.
[24] W. Lawler, T. Wijaya, A. Antony, G. Leslie, P. Le-Clech, Reuse of Reverse Osmosis Desalination Membranes, IDA World Congress 2011. (2011).
[25] W. Lawler, Z. Bradford-Hartke, M.J. Cran, M. Duke, G. Leslie, B.P. Ladewig, et al., Towards new opportunities for reuse, recycling and disposal of used reverse osmosis membranes, Desalination. 299 (2012) 103–112.
[26] C. Prince, M. Cran, P. Le-Clech, K. Uwe-Hoehn, M. Duke, Reuse and recycling of used desalination membranes, OzWater 2011. (2011).
[27] E. Ould Mohamedou, D.B. Penate Suarez, F. Vince, P. Jaouen, M. Pontie, New lives for old reverse osmosis (RO) membranes, Desalination. 253 (2010) 62–70.
[28] J. Rodriguez-Gonzalez, V. Jimenez, O. Trujillo, J. Veza, Reuse of reverse osmosis membranes in advanced wastewater treatment, Desalination. 150 (2002) 219–225.
[29] R.J. Petersen, Composite reverse osmosis and nanofiltration membranes, Journal of Membrane Science. 83 (1993) 81–150.

31
[30] A. Ghosh, E. Hoek, Impacts of support membrane structure and chemistry on polyamide–polysulfone interfacial composite membranes, Journal of Membrane Science. 336 (2009) 140–148.
[31] J. Veza, J. Rodriguez-Gonzalez, Second use for old reverse osmosis membranes: wastewater treatment, Desalination. 157 (2003) 65–72.
[32] A. Ambrosi, I.C. Tessaro, Study on Potassium Permanganate Chemical Treatment of Discarded Reverse Osmosis Membranes Aiming their Reuse, Separation Science and Technology. 48 (2013) 1537–1543.
[33] H.D. Raval, V.R. Chauhan, A.H. Raval, S. Mishra, Rejuvenation of discarded RO membrane for new applications, Desalination and Water Treatment. 48 (2012) 349–359.
[34] A. Hussain, P. Trudell, A.J. Repta, Quantitative Spectrophotometric Methods for Determination of Sodium Hypochlorite in Aqueous Solutions, Journal of Pharmaceutical Sciences. (1970).
[35] S.A. Huber, A. Balz, M. Abert, W. Pronk, Characterisation of aquatic humic and non-humic matter with size-exclusion chromatography - organic carbon detection - organic nitrogen detection (LC-OCD-OND), Water Research. (2010) 879–885.
[36] O. Akin, F. Temelli, Probing the hydrophobicity of commercial reverse osmosis membranes produced by interfacial polymerization using contact angle, XPS, FTIR, FE-SEM and AFM, Desalination. 278 (2011) 387–396.
[37] DOW, FILMTEC TM Reverse Osmosis Membranes Technical Manual. Retrieved from www.dowwaterandprocess.com, (2012).
[38] B.C. Donose, S. Sukumar, M. Pidou, Y. Poussade, J. Keller, W. Gernjak, Effect of pH on the ageing of reverse osmosis membranes upon exposure to hypochlorite, Desalination. 309 (2012) 97–105.
[39] G.-D. Kang, C.-J. Gao, W.-D. Chen, X.-M. Jie, Y.-M. Cao, Q. Yuan, Study on hypochlorite degradation of aromatic polyamide reverse osmosis membrane, Journal of Membrane Science. 300 (2007) 165–171.
[40] A. Antony, J. Blackbeard, G. Leslie, Removal Efficiency and Integrity Monitoring Techniques for Virus Removal by Membrane Processes, Critical Reviews in Environmental Science and Technology. 42 (2012) 891–933.
[41] S. Hajibabania, A. Antony, G. Leslie, P. Le-Clech, Relative impact of fouling and cleaning on PVDF membrane hydraulic performances, Separation and Purification Technology. 90 (2012) 204–212.
[42] Y. Baek, J. Kang, P. Theato, J. Yoon, Measuring hydrophilicity of RO membranes by contact angles via sessile drop and captive bubble method: A comparative study, Desalination. 303 (2012) 23–28.

32
[43] J. Schwinge, P.R. Neal, D.E. Wiley, D.F. Fletcher, A.G. Fane, Spiral wound modules and spacers review and analysis, Journal of Membrane Science. 242 (2004) 129–153.
[44] R.W. Baker, Membrane Technology and Applications, Second Edi, John Wiley and Sons Ltd, Chichester, England, 2004.
[45] J.S. Vrouwenvelder, D. a Graf von der Schulenburg, J.C. Kruithof, M.L. Johns, M.C.M. van Loosdrecht, Biofouling of spiral-wound nanofiltration and reverse osmosis membranes: a feed spacer problem., Water Research. 43 (2009) 583–94.
[46] D. Gille, W. Czolkoss, Ultrafiltration with multi-bore membranes as seawater pre-treatment, Desalination. 182 (2005) 301–307.
[47] A. Jonsson, G. Tragbirdh, Ultrafiltration Applications, Desalination. 77 (1990) 135–179.
[48] J.C. Mierzwa, I. Hespanhol, M.C.C. da Silva, L.D.B. Rodrigues, C.F. Giorgi, Direct drinking water treatment by spiral-wound ultrafiltration membranes, Desalination. 230 (2008) 41–50.
[49] J.M. Arnal, M.C. León, J. Lora, J.M. Gozálvez, A. Santafé, D. Sanz, et al., Ultrafiltration as a pre-treatment of other membrane technologies in the reuse of textile wastewaters, Desalination. 221 (2008) 405–412.
[50] R.D. Noble, S.A. Stern, Membrane Separations Technology, Volume 2: Principles and Applications, Elsevier Science, 1995.
[51] M. Peter-varbanets, C. Zurbru, C. Swartz, W. Pronk, Decentralized systems for potable water and the potential of membrane technology, Water Research. 43 (2009) 245–265.