product pricing: the link between product … · james creedon, senior consultant tillinghast, a...
TRANSCRIPT

James Creedon, Senior ConsultantTillinghast, a business of Towers Perrin
© 2009 Towers Perrin
Product pricing: The Link between Product Development, Financial Reporting and Profits
Joint Regional Seminar 2009Practical Actuaries and Financial Reporting
Kuala Lumpur 13-14 JulyTaipei 15-16 JulyHong Kong 17 JulyShanghai 20-21 JulyBangkok 27-28 July

© 2009 Towers Perrin 2
James Creedon, FIAJames Creedon, FIA is a senior consultant with the Tillinghast insurance consulting practice of Towers Perrin, based in Hong Kong. He also has extensive experience of life insurance in Europe after spending seven years with Tillinghast in London.
James has worked with a number of European and Asian insurers on the application of market-consistent techniques for financial reporting, performance measurement and capital management. This has included using market-consistent embedded value and economic capital metrics to quantify and manage risks and as the basis for business decisions. In Asia, he has led MCEV implementation and review projects for six large multinational groups with operations across the region including China, Hong Kong, India, Korea, Malaysia, Singapore and Taiwan.
James’s areas of expertise include:Asset-liability management and modelling;Product development, pricing and risk management of investment-linked products with guarantees;Determination of economic capital requirements and capital management; andMerger and acquisitions, due diligence and capital raisings.
James has played a key role in developing Tillinghast’s intellectual capital in the area of Mark-Consistent and European Embedded Values. James has spoken at internal, client and professional events, including the recent Society of Actuaries Webinar on MCEV, and written a number of articles on European and Market-Consistent Embedded Values.
James holds a Bachelor in Actuarial and Financial Studies (BAFS) from University College, Dublin. He is a Fellow of the Institute of Actuaries.

© 2009 Towers Perrin 3
Agenda
The aims of product pricing
A worked example – The impact of metrics on pricing results
Turning “product cost” into “product price”
Conclusions

© 2009 Towers Perrin 4
An Efficient Product Development Process –The Components
Monitor, React and After-Sales
Feasibility/ViabilityAssessment
Identify Customer Needs
Idea Generation and Management
Marketing & Sales Process
Product DesignCommercialisation,
Implementation and Launch
Check-Points -- Ensure Viability -- Go/Adapt/No-Go
Learning Loop
Protecting and enhancing your position, documenting and disseminating
Accountability: Product Development CommitteeRewards/acknowledgements at key milestonesIn the end the products may look the same but it’s how we get there that makes the difference!

© 2009 Towers Perrin 5
What is product pricing trying to achieve?
Simple answer is to calculate premiums and charges so that product is “profitable”
However not necessarily the case….
Other things to consider may includeWhat are the company’s objectives for the product? Does the product design achieve these?Competition - should the “price” charged be the same as the “cost”?How risky is the product? How do we manage them?How much capital is required?How will the product affect our company’s external metrics?How is the policyholder being treated?Are there regulatory constraints?

© 2009 Towers Perrin 6
Key aims of product pricing
Work as part of the overall product development process to produce the product that best meets the objectives of the company
Specifically, analyse and communicate potentialeffects on company, including:
ProfitabilityCapitalRisk profile and management
© 2009 Towers Perrin 7
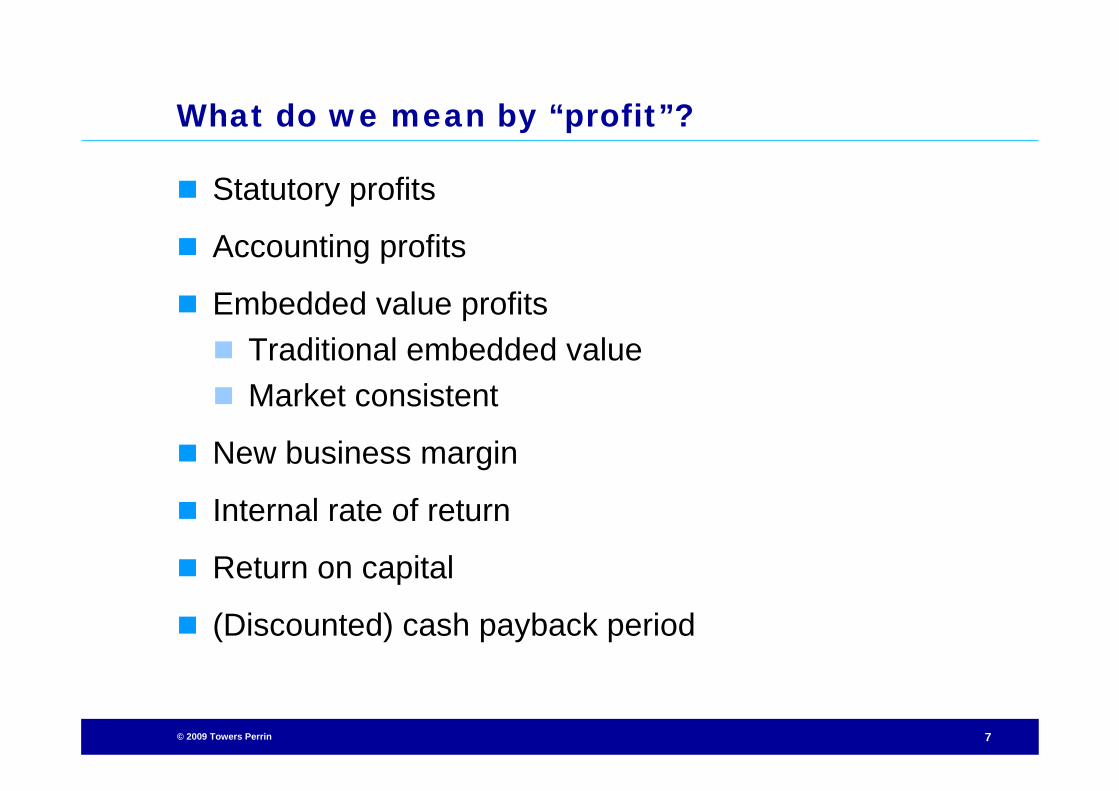
What do we mean by “profit”?
Statutory profits
Accounting profits
Embedded value profitsTraditional embedded valueMarket consistent
New business margin
Internal rate of return
Return on capital
(Discounted) cash payback period

© 2009 Towers Perrin 8
Pricing profitability metrics normally reflect reporting requirements
Key pricing metrics vary by region and company. In general, we see the following key metrics, although others will also be used:
U.S. Companies normally consider projected USGAAP earnings and internal rate of returnEuropean firms – (Market consistent) value of future profits and economic capital requirementsAsian firms – Traditional deterministic value of future profits and local statutory capital requirements. Also consider local accounting earnings
Pricing bases do not need to be exactly the same as reporting bases:
Market consistent pricingChoice of risk discount ratesTarget capital level versus regulatory minimum

© 2009 Towers Perrin 9
Pricing should go beyond just a point estimate of the product profitability…
As part of the pricing work, need to go beyond the expected profitability
Sensitivities should consider a wide range of possible events at the point of sale and in the future
Impact on capital position should consider initial and projectedcapital requirements..
…and potential requirements in adverse scenarios
Need to ensure that product risk and profitability profile is consistent with company’s overall risk appetite
How much capital does it require?
How risky is the product?
What is the impact on the overall financials?
Is it consistent with our risk appetite?

© 2009 Towers Perrin 10
…and provide full feedback to the product development team
The pricing work can support a range of other elements of the product development process, including:
Product feature alternativesAlignment with current product range Risk mitigationUnderwriting and claims managementCompetitor analysis
The pricing team needs to work closely with all the other parties involved in the product development
process

© 2009 Towers Perrin 11
The aims of product pricing
A worked example – The impact of metrics on pricing results
Turning “product cost” into “product price”
Conclusions

© 2009 Towers Perrin 12
A worked example – Market consistent versus traditional pricing
The purpose of this example is to show the impact of metrics on calculated profitability. This is to demonstrate:
How different companies may have different views of certain product typesHow certain metrics do not always reflect the actual risks in the productHow changes in reporting metrics can have a significant effect on the external view of your business

© 2009 Towers Perrin 13
The sample products cover a range of typical insurance products
We compare the value of new business for the following three products on a market-consistent and traditional embedded value basis:
Regular premium term assurance— Regular premium of 500 p.a.— 15 year termSingle premium investment-linked— SP of 3,000; 20 year term— Earnings are from annual management charge plus
administration fee less per policy expensesRegular premium traditional participating product— Regular premium of 3,150 p.a.; 15 year term— Pricing rate of 2.5% p.a.— 70:30 policyholder and shareholder split of investment and
mortality surplus

© 2009 Towers Perrin 14
Traditional pricing techniques
“Traditional” pricing based on:— Present value of future expected profits less cost
of statutory capital— Earned rate based on expected future return on
assets backing— Risk discount rate = earned rate + pricing margin— Pricing margin includes an implicit allowance for
risk that is intended to cover all risks inherent in the product
© 2009 Towers Perrin 15
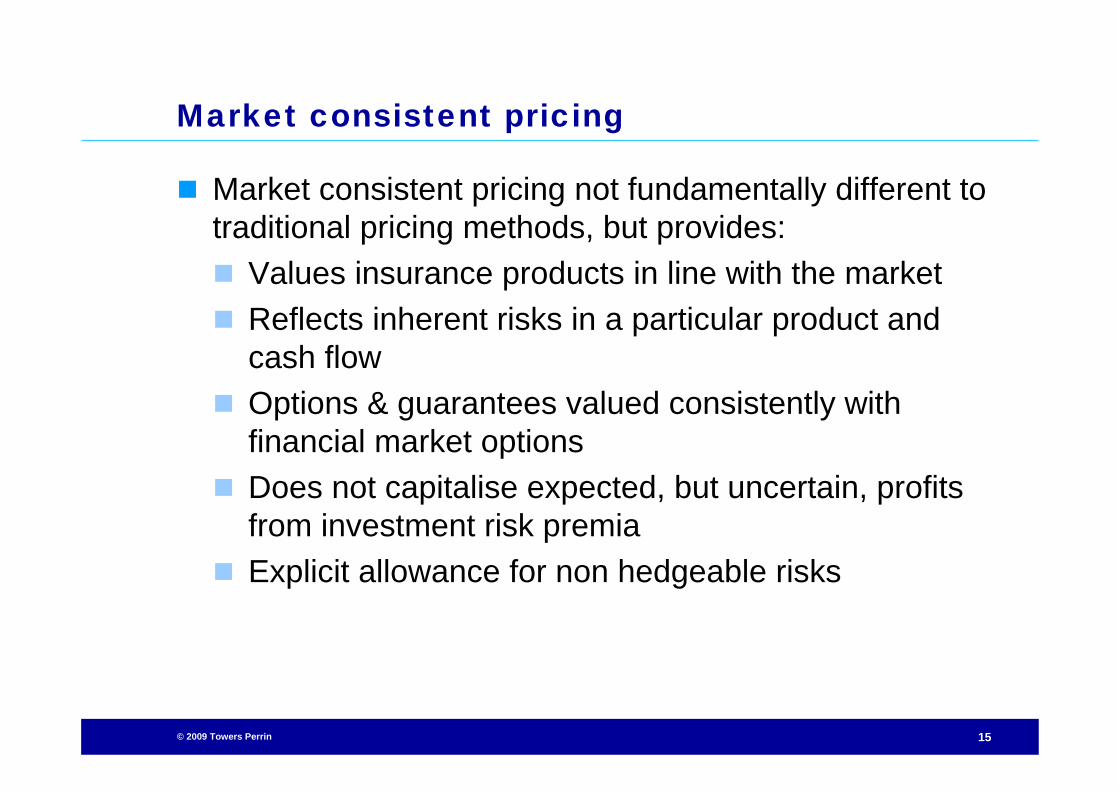
Market consistent pricing
Market consistent pricing not fundamentally different to traditional pricing methods, but provides:
Values insurance products in line with the marketReflects inherent risks in a particular product and cash flowOptions & guarantees valued consistently with financial market optionsDoes not capitalise expected, but uncertain, profits from investment risk premiaExplicit allowance for non hedgeable risks

© 2009 Towers Perrin 16
Economic assumptions
Traditional pricingInvestment return — 5% p.a. for term and participating product— 7% p.a. for investment-linked productRisk Discount Rate of 10%
Market consistent pricingReference rates of 2.5% in year 1 to 4.3% at year 20Implied swaption volatilities of between 10% and 30% by expiry date and tenor

© 2009 Towers Perrin 17
Term Assurance - The reporting basis has a significant effect on the expected profit pattern
Comparison of profit patterns on a Statutory and Embedded Value basis - Term Assurance
(1,000)
(800)
(600)
(400)
(200)
-
200
400
600
Y1 Y2 Y3 Y4 Y5 Y6 Y7 Y8 Y9 Y10 Y11 Y12 Y13 Y14 Y15
Year
Ann
ual P
rofit
TEV ProfitsStatutory Distributable Earnings

© 2009 Towers Perrin 18
Profit margins increase for term assurance business on a market consistent basis
338198Cost of Capital / allowance for NHR
7.2%6.4%New Business Margin as a percentage of PVNBP
60%38%New Business Margin as a percentage of APE
297188Value of New Business
607386PVFP before CoC
MCEVTraditional EV

© 2009 Towers Perrin 19
Sample term assurance - Profit margins are not sensitive to interest rates
29760%
18938%
Interest rates – 0.5%
Margin as a % of APE
29660%
18838%
Interest rates + 0.5%Margin as a % of APE
297188Base Case
MCEVTraditional EV
For the TEV sensitivities, we have assumed a +/- 0.5% change in the investment return and RDR assumptions

© 2009 Towers Perrin 20
Investment linked example – Expected profit profile
Comparison of profit patterns on a Statutory and Embedded Value basis - Investment Linked product
(200)
(150)
(100)
(50)
-
50
100
150
200
250
Y1 Y2 Y3 Y4 Y5 Y6 Y7 Y8 Y9 Y10 Y11 Y12 Y13 Y14 Y15 Y16 Y17 Y18 Y19 Y20
Year
Ann
ual P
rofit
TEV ProfitsStatutory Distributable Earnings

© 2009 Towers Perrin 21
Investment linked - Effect of market consistent pricing depends on charging structure
8343Cost of Capital / allowance for NHR
3.6%4.6%New Business Margin as a percentage of PVNBP
36%46%New Business Margin as a percentage of APE
109137Value of New Business
192180PVFP before CoC
MCEVTraditional EV
© 2009 Towers Perrin 22
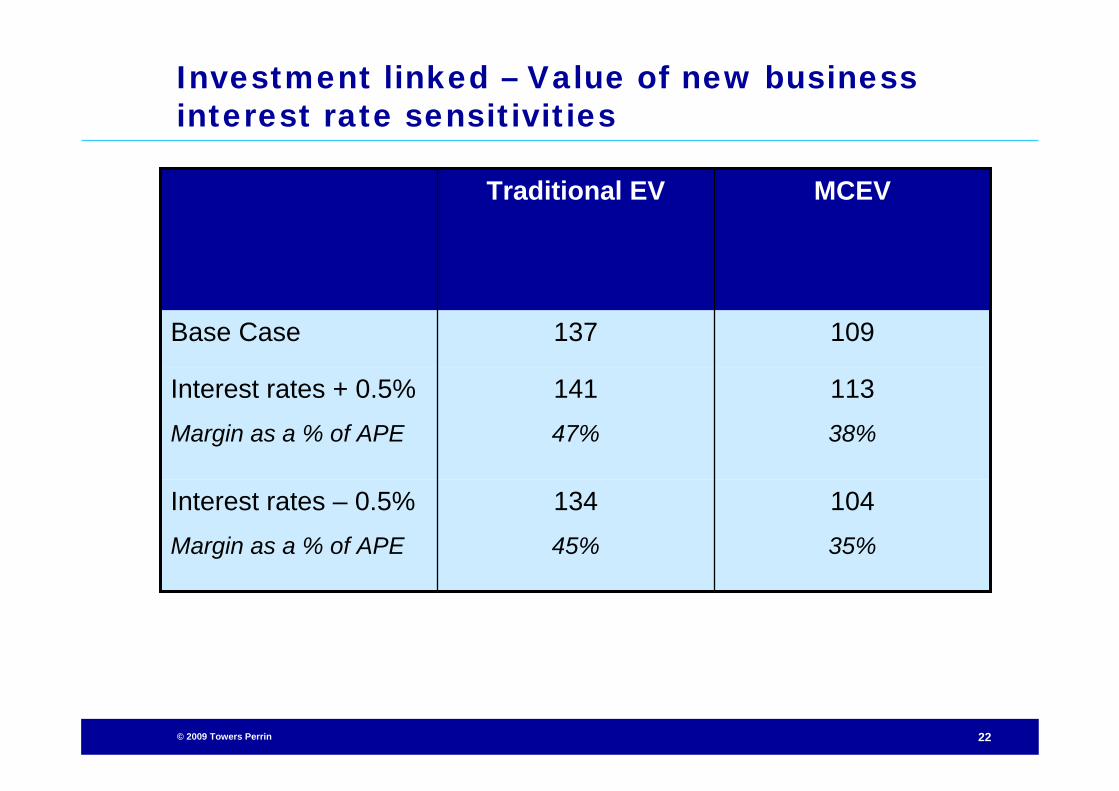
Investment linked – Value of new business interest rate sensitivities
10435%
13445%
Interest rates – 0.5%Margin as a % of APE
11338%
14147%
Interest rates + 0.5%Margin as a % of APE
109137Base Case
MCEVTraditional EV

© 2009 Towers Perrin 23
Participating product – Expected profit profile (on deterministic assumptions)
Comparison of profit patterns on a Statutory and Embedded Value basis - Par product
(200)
-
200
400
600
800
1,000
1,200
1,400
1,600
1,800
Y1 Y2 Y3 Y4 Y5 Y6 Y7 Y8 Y9 Y10 Y11 Y12 Y13 Y14 Y15
Year
Ann
ual P
rofit
TEV Profits
Statutory DistributableEarnings

© 2009 Towers Perrin 24
Participating product – Margins may reduce if include significant options and guarantees
174173Cost of Capital / allowance for NHR
530-Cost of O&Gs
3.8%7.6%New Business Margin as a percentage of PVNBP
31%45%New Business Margin as a percentage of APE
9761,418Value of New Business
1,6551,591PVFP before CoC
MCEVTraditional EV

© 2009 Towers Perrin 25
…and the sensitivity to economic conditions is much greater
554-43%
1,350-5%
Interest rates – 0.5%Percentage change
1,76681%
1,559+10%
Interest rates + 1.25% Percentage change
(785)-180%
1,235-13%
Interest rates – 1.25% Percentage change
1,284+32%
1,479+4%
Interest rates + 0.5%Percentage change
9761,418Base Case
MCEVTraditional EV

© 2009 Towers Perrin 26
How much capital is required to support the business?
Traditionally, capital requirements and sufficiency have been measured relative to regulatory capital requirements
These measures are normally simple to calculate (e.g. 4% percentage of reserves and 0.3% of the sum-at-risk in this example) but do not always reflect the underlying risks in the product
Regulatory requirements are moving towards risk-based capital requirements, so…
How do traditional regulatory capital requirements compare to estimated economic capital requirements (on a stand-alone basis) for our worked example at the point of sale?

© 2009 Towers Perrin 27
Statutory vs economic capital requirements
Mkt. Value
of Assets
Assets Liabilities
Marketconsistentliabilities
Statutory
Liability
Solvency
Margin
Excesscapital
Economic capital requirementsStatutory
Basis
Availablestat. capital
Economic
Capital
requirements
Required
Capital
Greater of statutory and excess of economic over
statutory reserves
MCVIF
AvailableEcon Capital

© 2009 Towers Perrin 28
Comparison of statutory and regulatory capital requirements by product
577%50%118%Economic as a percentage of statutory
92160751Economic capital requirements
160120637Statutory capital requirements
Traditional participating
product
SP
Unit-linked
Term Assurance

© 2009 Towers Perrin 29
Analysis of economic capital requirements for sample participating policy
160
976
1,761
260
157 282
1,897
Statutoryrequiredcapital
Derivation of economic capital requirements
MCVNB Market
Risk
Underwriting
Risk
Operating
Risk
Diversification
Required
Capital
Required
EC

© 2009 Towers Perrin 30
Summary of findings from worked example
These examples show that “profitability” can depend as much on the metrics used as the underlying products
“Traditional” reporting metrics do not necessarily give the complete picture even with sensitivity analyses
Even if not reported, economic (market consistent) measures are relevant from a business management point of view:
Include the cost of options and guaranteesReflects appropriately the different risk profiles of different product types Helps to understand the risk in the product and is linked to risk management and mitigation

© 2009 Towers Perrin 31
Agenda
The aims of product pricing
A worked example – The impact of metrics on pricing results
Turning “product cost” into “product price”
Conclusions

© 2009 Towers Perrin 32
It is helpful to split out the elements of price
Cost of Liability
Cost of Capital
Profit margin
Reflectscost of liabilities taken on.
Breakeven price in absenceof capital costs
Reflects cost of holdingcapital.
Breakeven price
Cost of production.Price at which no value added
or destroyed.‘Mechanical’ calculation
Price charged.Reflects target margins and
constraints
Price charged.No ‘mechanical’ approach
possible

© 2009 Towers Perrin 33
Targets should reflect…
The profitability that has been promised (and demonstrated) to shareholders
Management objectives
Market expectations set by peers
Management’s view of the price that can be charged in a market
Subject to:
Maximum individual risk exposures
Regulatory constraints
Diversification limits
In general, not all of these are subject to rigorous calculation. Target setting cannot be reduced to a mechanical process

© 2009 Towers Perrin 34
Agenda
The aims of product pricing
A worked example – The impact of metrics on pricing results
Turning “product cost” into “product price”
Conclusions

© 2009 Towers Perrin 35
Conclusions
Move beyond “mechanical” product pricing
Pricing metrics need to be linked to how performance is measured, but…
External metrics changeUnderstand the limitations of your pricing and reporting metrics
Separate the price charged from the product cost
Need to understand and communicate effectively the risk and profitability profile of the product so that the product development process can meet the objectives of the company
Go beyond the minimum so you can play an effective part of the product development process

© 2009 Towers Perrin 36
Thank You!
James Creedon
Senior Consultant
Tillinghast
Phone: (852) 2593-4519