product market competition and voluntary corporate social
TRANSCRIPT

1
Product Market Competition and Voluntary Corporate Social
Responsibility Disclosures
Ji Woo Ryou Robert C. Vackar College of Business & Entrepreneurship
University of Texas Rio Grande Valley Email: [email protected]
Albert Tsang
Schulich School of Business York University
E-mail: [email protected]
Kun (Tracy) Wang Research School of Accounting Australian National University E-mail: [email protected]
March 2018
Abstract
The objective of this study is to examine whether and how firms’ voluntary forward-looking non-financial disclosures, specifically corporate social responsibility (CSR) disclosures, are associated with the intensity of product market competition (PMC). Using multiple measures of PMC, including the level of non-price competition, product similarity, managers’ perceptions of competition, and reductions of industry-level import tariff, our study finds that the likelihood, frequency, and length of standalone CSR disclosures decrease with the intensity of PMC, and especially so for CSR disclosures containing product-related content. We also find that the intensity of PMC not only affects the level of CSR disclosures, but also the quality of CSR disclosures, as measured by the likelihood of CSR disclosure with external assurance and CSR disclosure following global reporting initiative (GRI) guidelines. Taken together, our findings suggest that although CSR reporting can be associated with various capital market benefits and/or even used as a marketing tool, especially when PMC is intense, the proprietary cost concern associated with such disclosures hinders firms’ CSR reporting incentives. Keywords: Proprietary costs; Voluntary disclosure; External Assurance; GRI; CSR Reporting Quality

2
Product Market Competition and Voluntary Corporate Social
Responsibility Disclosures
1. Introduction
Economic theory posits that proprietary cost is an important determinant inhibiting
firms’ voluntary disclosures (Verrecchia, 1983, 2001). 1 Despite the importance of the
proprietary cost argument in explaining firms’ disclosure incentives, prior studies typically
focus on, and examine its role in, financial disclosures (e.g., Ali et al., 2014; Chen et al., 2010;
Darrough & Stoughton, 1990; Dhaliwal et al., 2014; Li, 2010; Seavey et al., 2016; Skinner,
1994), and there is relatively little empirical evidence on the relationship between firms’
proprietary cost concern and their voluntary non-financial disclosure decisions. As such, the
objective of this study is to extend this literature and examine whether and how firms’ voluntary
non-financial disclosure decisions, specifically corporate social responsibility (CSR)
disclosures, are influenced by the intensity of product market competition (PMC).
Following the growing awareness of CSR activities in building social capital (Patten &
Zhao, 2014), reducing information asymmetry and the cost of equity capital (Crifo et al., 2015;
Dhaliwal et al., 2011, 2012), protecting firm value (Christensen, 2016), signaling firms’ future
financial perspectives (Lys et al., 2015), and creating a competitive advantage (e.g., KPMG,
2008, 2011, 2013; McWilliams & Siegel, 2011; Nikolaeva & Bicho, 2011), many corporations
have started to provide standalone CSR disclosures voluntarily during recent years, illustrating
the importance they attach to such activities and communicating their CSR initiatives to key
stakeholders, such as consumers (e.g., Luo & Bhattacharya, 2006; Muslu et al., 2017; Servaes
& Tamayo, 2013; Patten & Zhao, 2014). As a result, over the last few decades, information
1 Supporting the theory, anecdotal evidence also shows that concern regarding a firm’s competitive position is a major constraint on firms’ voluntary disclosures (Graham et al., 2005).

3
about a firm’s CSR activities and performance has become increasingly useful to customers
when making purchase decisions (Lev et al., 2010; Servaes & Tamayo, 2013).
Increased competition can also drive companies to go beyond a conventional marketing
mix to incorporate CSR attributes into their marketing initiatives in order to gain competitive
advantages (Fisman et al., 1998; Sen et al., 2006). Supporting this view, existing studies argue
that CSR engagement can be considered as an important product attribute with the potential to
increase the attractiveness of firms’ products, improve customer satisfaction and loyalty, and
ultimately lead to greater revenue and firm value (Baron, 2001; Bhattacharya & Sen, 2004;
Creyer & Ross, 1997; Navarro, 1998; Luo & Bhattacharya, 2006; Sen & Bhattacharya, 2001).
More directly supporting the importance of CSR in enhancing firms’ competitive
advantage, Flammer (2015) and Fernández-Kranz and Santaló (2010) find that increased PMC
leads to increased CSR engagement. In the same vein, Johnson (1966) and Fisman et al. (2008)
argue that the benefits of CSR can be more substantial in more competitive industries because
CSR can signal the quality of their products, thereby allowing firms to differentiate themselves
from rivals. Thus, to the extent that CSR activities have the potential to foster future sales
and/or create capital market benefits, especially when competition is intense, we predict a
positive association between the intensity of PMC and firms’ CSR reporting decisions.
On the other hand, although the literature suggests that voluntarily disclosing
information, such as non-financial CSR information, can be associated with various capital
market benefits (see Huang & Watson [2015] and Liu et al. [2017] for a review of CSR
reporting literature), the proprietary cost hypothesis suggests that managers face a trade-off
between the potential benefits associated with voluntary disclosures and the costs of revealing
proprietary information. While prior studies mainly tested the proprietary cost hypothesis using
the context of forward-looking financial disclosures such as management earnings forecasts
(see Hirst et al. [2008] for a review on major determinants of management earnings forecasts),

4
this hypothesis likely applies to forward-looking non-financial disclosure as well, as long as
the information concerned can aid firms’ current and potential rivals in competing with the
disclosing firms.
This concern is particularly pronounced for CSR reporting, given that many standalone
CSR disclosures contain information about the development process, technologies used, and
future plans of firms’ products, which can aid both potential and existing competitors to gain
competitive advantages. Consistent with our argument, Guo et al. (2004) examine the
disclosures of product-related information disclosed on the initial public offering (IPO)
prospectuses issued by biotech firms and find evidence in line with proprietary cost concern.
Following this discussion, to the extent that CSR disclosures contain competition-sensitive
information, we predict a negative positive association between the intensity of PMC and firms’
CSR reporting decisions.
Taken together, our discussion above suggests that ex ante, it is unclear whether and
how proprietary cost concern or pressure from PMC is associated with firms’ CSR reporting
incentives. Given the ambiguous relationship predicted above, whether and how voluntary
CSR disclosures are associated with the intensity of PMC is an empirical question which we
examine in this study.
Using the setting of voluntary standalone CSR disclosure to examine the effect of
proprietary cost on firms’ disclosure decisions offers several advantages. First, Leuz (2004)
notes that a major challenge in empirically testing the proprietary costs hypothesis is the lack
of settings in which proprietary disclosures are clearly voluntary. For example, Rogers and
Buskirk (2013) point out that although the management earnings forecasts literature spans
several decades, the question of whether management earnings forecasts are truly voluntary is
still an open question. In line with this view, other studies suggest that management earnings
forecasts may not be entirely voluntary because the institutional environments, such as

5
securities laws and stock exchange requirements, have a significant influence on managers’
earnings forecast decisions (Heitzman et al., 2010; Li et al., 2012). However, as opposed to
management earnings forecasts, or information disclosed in other mandatory corporate
reporting,2 standalone CSR disclosures are clearly more voluntary, especially given the fact
that they are subject to few specific reporting guidelines (Chen et al., 2016; Ramanna, 2013).
Second, compared to CSR information disclosed on firms’ annual reports or released
through other channels (e.g., corporate websites), standalone CSR disclosures tend to cover
topics that are broader in scope and provide more extensive information about CSR activities,
and often also contain information about the firm’s product development and differentiation
strategy.3 Because managers have substantial discretion over the disclosure of CSR reporting
in terms of both the quantity and the quality of the information (Muslu et al., 2017), our focus
on CSR reporting thus offers a clearer test of the existing theory (i.e., the proprietary cost
hypothesis) and its assertions on firms’ voluntary disclosure decisions. Moreover, by focusing
on standalone CSR disclosure, it not only fosters a better comparison across disclosing firms,4
but also the concern that the CSR information disclosed through other channels (e.g., in firms’
annual reports or on corporate websites) is likely bundled with other competition-sensitive
information (such as information about existing customers documented by Ellis et al. [2012])
can also be minimized. Indeed, it is common that firms release different types of information
in a bundle. For example, Liu et al. (2017) provide empirical evidence that firms tend to bundle
non-financial information strategically with negative earnings information to mitigate the
capital market consequences associated with their negative earnings news.
2 This information includes, for example, product-related information in IPO prospectuses (Guo et al., 2004), customer information in SEC filings (Ellis et al., 2012), and firms’ decision to redact material contract information from their IPO SEC registration filings (Boone et al. 2016) or financial reports (Verrecchia & Weber, 2006). 3 Examples of CSR disclosure containing product-related information are provided in Appendix B. 4 One clear advantage of providing standalone CSR reports is that it can better communicate CSR initiatives (Morsing & Schultz, 2006).

6
Data on standalone CSR disclosure of U.S. firms during the period from 1999 to 2011
were hand-collected from CorporateRegister.com. For each standalone CSR report collected,
we studied its content and identify whether or not a CSR report contains product-related
information, and if it does, how much space (e.g., the number of pages) is dedicated to such
content. Following previous studies, we use multiple proxies to measure the intensity of PMC
including (1) non-price competition (Chen et al., 2015), (2) product similarity (Hoberg &
Phillips, 2016), and (3) manager-perceived competition (Li et al., 2013).
Consistent with the prediction of the proprietary cost hypothesis, across all measures of
PMC, we find that the likelihood, frequency, and length of CSR disclosures decrease with the
intensity of PMC, and especially so for CSR disclosures containing product-related content.
To address the concern regarding the endogeneity of PMC, we further use the large reduction
of import tariff rates in the U.S. manufacturing sector during our sample period as an exogenous
shock to firms’ competitive environment (Fresard, 2010; Valta, 2012) and examine how firms’
CSR reporting practices differ following the tariff reduction. Using a difference-in-difference
methodology, consistent with the findings based on other competition measures, our result
shows that tariff reductions (i.e., a proxy for increased competitive pressure) lead to decreases
in CSR reporting.
More directly, our result shows that firms facing intensive competition pressure tend to
provide less competition-sensitive information on their CSR disclosures measured by the
number of pages containing product-related information on standalone CSR disclosure. In
addition to the level of CSR disclosure (i.e., likelihood, frequency, and length of CSR
reporting), we find that the intensity of PMC can also have a significant impact on the quality
of CSR disclosures measured by the likelihood of CSR disclosures with external assurance and

7
CSR disclosures following GRI reporting guideline.5 Together, these findings suggest that
proprietary cost is indeed an important consideration in firms’ voluntary CSR reporting
decisions.
Moreover, we document a robust positive association between the issuance of CSR
disclosure and firms’ future sales revenue after controlling for firms’ actual CSR performance,
suggesting that CSR reporting is associated with future financial performance. This finding is
consistent with the financial performance implications of CSR reporting documented by prior
studies (e.g., Lev et al., 2010; Lys et al., 2015). More importantly, our results also show that
the level of product-related information disclosures on CSR reporting (measured by the ratio
of total number of pages dedicated to product-related information in a CSR disclosure over the
total number of pages of a CSR disclosure) is positively associated with future sales revenue,
even after controlling for the issuance of firms’ CSR disclosure. This finding lends support to
the role of CSR in product market competition. Furthermore, following the argument that PMC
creates disincentives for transparent CSR disclosures, we interact the CSR reporting variable
measuring the level of product-related content on a CSR report with PMC variables in
examining the relationship between CSR reporting and future revenue. Consistent with our
finding that a higher level of PMC can have a negative effect on CSR reporting quality, the
untabulated results show that the intensity of PMC weakens the relationship between CSR
disclosure and future sales revenue.
Our paper contributes to the literature in several ways. First, one of the most notable
changes in corporate disclosure practices during recent years in countries around the world has
been the increasing number of companies that have voluntarily committed to publishing
standalone CSR reports (KPMG, 2008, 2011, 2013). However, we know relatively little about
5 We also find some, albeit relatively weak, evidence indicating that the intensity of PMC is negatively associated with the readability of standalone CSR disclosures.

8
the determinants of this emerging disclosure practice (Ramanna, 2013). The literature on CSR
reporting documents multiple firm-level characteristics as factors affecting firms’ CSR
reporting practices, such as external capital needs (Dhaliwal et al., 2011), and signaling firms’
future financial performance (Lys et al., 2015) and CEOs’ ability (Chen et al., 2017). By
providing evidence showing that the intensity of PMC attenuates firms’ CSR reporting
incentives, our study thus adds to the literature by identifying an important, yet previously
unidentified, determinant of CSR reporting—concern regarding revealing competition-
sensitive proprietary information to rivals. Examining this issue is also of contemporary
importance to regulators and other interested parties who are concerned about CSR reporting,
which is evidenced by the Securities and Exchange Commission’s (SEC) (2016) call for
feedback on the potential challenges and costs associated with disclosing CSR information.
Given the increasing trend of regulations of CSR reporting around the world (Chen, et al., 2018;
Ioannou & Serafeim, 2017), we believe it is timely and important to examine the factors that
constrain firms from voluntary CSR disclosures.
Additionally, managers frequently rank proprietary cost as one of their major concerns
in influencing their voluntary disclosure decisions (Graham et al., 2005). Despite the
prevalence of the proprietary cost argument in the accounting literature, existing studies
typically focus on the effect of proprietary costs on disclosures with a strong financial
implication,6 while other voluntary disclosures, such as the quantity and quality of CSR
disclosures, have not yet been explored. In this study, we directly examine the effect of
proprietary cost concern on firms’ CSR reporting practices, and thus our study extends research
on the role of PMC in determining managers’ reporting choices (e.g., Datta et al., 2013;
Dhaliwal et al., 2014; Ellis et al., 2012).
6 For example, prior studies examine the effect of proprietary cost on management earnings forecasts (Ali et al. 2014; Li, 2010), segment information (Botosan & Stanford, 2005), information about major customers (Ellis et al., 2012), and information about firms’ strategies (Bhojraj et al., 2004).

9
The rest of this paper is organized as follows. Section 2 summarizes the prior literature
and develops hypotheses. Section 3 describes the sample, variable definitions, and empirical
model specification. Section 4 presents the summary statistics and reports the main empirical
results. Section 5 discusses additional analyses. Finally, in Section 6, we draw our conclusions.
2. Background and Hypothesis Development
2.1. The importance of voluntary CSR disclosure
The importance of CSR activities to business has been acknowledged by both existing
research and anecdotal evidence. For example, Fombrun and Shanley (1990, p. 239) argue that
the CSR engagement of firms is an important element of product differentiation and reputation
building. Similarly, other studies (e.g., Bhattacharya & Sen, 2003; Bhattacharya et al., 2004;
Huang et al., 2017; Luo & Bhattacharya, 2006; Pérez & Del Bosque, 2015; Servaes & Tamayo,
2013) suggest that CSR is an important marketing strategy in promoting and differentiating
firms’ products, and in increasing customer satisfaction and loyalty. 7 In line with these
arguments, a survey by Cone/Ebiquity (2015) reports that 91% of global consumers expect
companies to act responsibly, and nine in ten are as likely to purchase responsible products and
services as to boycott irresponsible companies. Similarly, the Nielsen Global Survey on CSR
conducted during 2014 on more than 30,000 consumers in 60 countries suggests that 55% of
global consumers are willing to pay higher prices for products or services provided by
companies committed to positive CSR activities.8
With a growing understanding of corporate impact on both business and society,
stakeholders, such as consumers, not only expect businesses to operate responsibly, but also
7 On the basis of lab experiments, existing studies also show that CSR could affect, directly or indirectly, consumer company identification (Mohr & Webb, 2005; Sen & Bhattacharya, 2001), consumer product responses (Brown, 1998), and consumer product attitude (Beren et al., 2005). 8 See Global consumers are willing to put their money where their heart is when it comes to goods and services from companies committed to social responsibility (http://www.nielsen.com/ca/en/press-room/2014/global-consumers-are-willing-to-put-their-money-where-their-heart-is.html).

10
demand that firms robustly communicate their CSR efforts and results. Along with increasing
media coverage of CSR issues, survey evidence from Cone/Ebiquity (2015) also shows that
almost 88% of global consumers expect companies to report on the progress of their CSR
efforts. More specifically related to U.S. consumers, a recent report examining consumer
attitudes, perceptions, and behaviors around CSR reveals that 86% of U.S. consumers surveyed
expect companies not only to commit to good CSR activities, but also to communicate their
CSR actions publicly because public communication of CSR actions is perceived (by 79%
consumers) to increase the credibility of a firm’s CSR commitment.9
On the other hand, although capital market participants, such as investors, appear to be
more interested in firms’ financial information, recent evidence suggests that they are showing
increasing interest in, and paying greater attention to, how management deals with social and
environmental issues (PwC, 2017) and have increasingly considered CSR activities when
making investment decisions (Elliott et al., 2014). For example, 70% of the global investors
surveyed by PwC (2017) agree or strongly agree that it is more important for companies to
operate in a way that accounts for wide stakeholder expectations. Further supporting this view,
the recent accounting literature documents the growing importance of, and various benefits
associated with, voluntary CSR reporting for market participants, such as reducing information
asymmetry between firms and investors (Dhaliwal et al., 2011, 2012), protecting firm value
(Christensen, 2016), and signaling future financial performance (Chen et al., 2017; Lys et al.,
2015) and transparency (Chen et al., 2016; Kim et al., 2012).
In view of the strong demand for CSR information, regulators around the world have
made increased commitments and efforts requiring or encouraging firms to make CSR
disclosures during recent years (Chen et al., 2016; KPMG, 2016). One of the high-profile
attempts to regulate CSR reporting is the European Union’s adoption of Directive 2014/95/EU
9 See 2017 Cone Communications CSR study (http://www.conecomm.com/research-blog/2017-csr-study).

11
on non-financial disclosure in 2014, which requires public interest entities of a certain size to
provide CSR disclosures. In the U.S., although CSR reporting is voluntary, in April 2016 the
SEC issued a Concept Release with a call for public comments on its consideration of including
CSR disclosures in its corporate disclosure requirements.
Despite the various benefits potentially associated with communicating CSR
engagement and results, and the unprecedented pressure companies are under to do so, many
firms choose not to publish CSR reports.10 The substantial deficit of useful CSR information
available to stakeholders is also reflected in Ernst and Young’s (2015) survey, which reports
that almost two-thirds of the institutional investors surveyed around the world say companies
do not adequately disclose CSR information, and nearly 40% call for companies to do so more
fully. The significant gap between the demand for, and the supply of, CSR reports highlights
the need to explore the underlying barriers to CSR reporting.
2.2. PMC and voluntary CSR disclosure
In the absence of other considerations, the unraveling argument (Grossman, 1981;
Grossman & Hart, 1980; Milgrom, 1981) suggests that managers will voluntarily make full
disclosure of their CSR information. In contrast, the proprietary cost hypothesis (e.g., Board,
2009; Clinch & Verrecchia, 1997; Verrecchia, 1983) predicts that disclosing proprietary
information might jeopardize disclosing firms’ competitive position in the product market if
rivals or other actors make strategic use of the information to the disadvantage of the disclosing
firms. Therefore, to the extent that CSR disclosures contain competition-sensitive information,
managers’ decisions as to whether and how to report CSR information voluntarily are likely to
be a trade-off between the benefits of informing market participants, such as customers and
10 Dhaliwal et al. (2011) note that CSR disclosing firms only account for a small fraction of the population of U.S. publicly listed firms.

12
investors, and the proprietary costs of informing existing and potential rivals in a competitive
environment.
2.2.1. The positive effects of PMC on voluntary CSR disclosure
From the consumer perspective, the literature finds that CSR activities can positively
affect consumers’ attitudes, perceptions, purchase intentions, and satisfaction (e.g., Brown &
Dacin, 1997; Olsen et al., 2014; Pomering & Dolnicar, 2009; Servaes and Tamayo, 2013; Sen
et al., 2006), which in turn, increase the premiums requested for products and services, attract
new customers, and improve customer loyalty and advocacy behaviors such as positive word-
of-mouth and resilience to negative company news (Du et al., 2007; Lev et al., 2010; Sen &
Bhattacharya, 2001). In line with these findings, survey evidence also shows that CSR can
create trust among customers, attract and retain customers, and increase sales and price
premiums (Cone/Ebiquity, 2015; PwC, 2016).
Recognizing consumers as a key driver of CSR who are more concerned about firms’
CSR initiatives (Bhattacharya & Sen, 2004; Manchiraju & Rajgopal, 2017; Servaes & Tamayo,
2013), CSR disclosure can be used as an important marketing tool for more effectively dealing
with today’s increasingly competitive business environment.11 Accordingly, Hildebrand et al.
(p1359, 2011) contend that CSR appears a “near-perfect vehicle” for corporate marketing,
which can reveal not only a firm’s fundamental and relatively enduring characteristics, but also
often more distinctive and evolving characteristics. In line with these views, Eccles et al. (2014)
observe a stronger positive association between CSR and financial performance in sectors
where firms mainly compete on the basis of brands and reputations. By examining an individual
component of CSR—corporate philanthropy—Lev et al. (2010) provide empirical evidence
11 The literature acknowledges that CSR can be used as a marketing tool for building brand equity, corporate image and reputation, which in turn increase the attractiveness of their products (e.g., Hoeffler & Keller, 2002; McWilliams & Siegel, 2011; Nikolaeva & Bicho, 2011). Similarly, other studies suggest that reputation and corporate/brand image are valuable intangible assets, which can produce numerous tangible benefits in the marketplace (e.g., Fombrun & Shanley, 1990; Lev et al., 2010; Sen & Bhattacharya, 2001) such as differentiating firms from their competitors.

13
that corporate philanthropic activities are positively associated with future sales revenue,
particularly for firms that are highly sensitive to consumer perception.
In addition, prior studies show that increased competition erodes growth opportunities,
increases firm risk and uncertainty, affects a firm’s relative position on the capital markets, and
increases firms’ cost of external financing (e.g., Fresard & Valta, 2013; Hoberg et al., 2014;
Hou & Robinson, 2006; Valta, 2012). Therefore, a greater level of PMC can also lead to more
CSR disclosure if firms use CSR disclosure as a means for reducing information asymmetry
between firms and investors in order to improve their access to external capital.12 Therefore, in
light of the above discussion, we expect that firms facing greater competition are more likely
to provide CSR disclosures voluntarily.
The positive impact of CSR disclosure in a competitive environment may not be
restricted to, or primarily manifested in, the consumer and capital market domains. The
stakeholder perspective suggests that CSR disclosure is a form of stakeholder management that
builds and strengthens beneficial stakeholder relationships, which can generate multifaceted
benefits and lead to improved competitive positions. Stakeholder theory emphasizes the need
to go beyond traditional fiduciary interests to take responsibilities toward a broad range of
stakeholders for obtaining their support, which is crucial to a firm’s survival and long-term
success (Clarkson, 1995; Freeman, 1984; Freeman et al., 2001). In particular, in the presence
of increased competition that weakens a firm’s grip on its stakeholders (Zingales, 2000),
establishing and maintaining close stakeholder relationships have increasingly substituted
traditional economies of scale and become a primary driver of sustained competitive advantage
12 For example, Mattei and Platikanova (2017) find that analysts’ earnings forecasts are less precise for firms facing greater competitive threats. Valta (2012) shows that firms operating in competitive product markets are more likely to experience higher cost of debt. To the extent that CSR reporting has the potential to create capital market benefits, such as reducing cost of debt or cost of equity capital (Cheng et al., 2013), the findings of existing studies suggests that firms in highly competitive industries can have higher incentives to adopt CSR reporting strategies.

14
for firms (Lev, 2000; Morsing & Schultz, 2006).13 The efficiency and importance of CSR in
strengthening stakeholder relationships, especially when facing intense competition, is further
magnified as firms often maintain multiple stakeholder relationships (e.g., employee, investor,
and customer) simultaneously (Maignan & Ferrel, 2004; Sen et al., 2006).
The literature also suggests that given sufficient awareness, a firm’s CSR initiative may
positively affect stakeholders’ overall beliefs and attitudes toward the firm, and their intentions
to purchase products or pay a premium price for its products, and invest in the firm (e.g., Brown
& Dacin, 1997; Pomering & Dolnicar, 2009; Sen et al., 2006; Trudel & Cotte, 2009). This
discussion suggests that firms are more likely to disclose standalone CSR reports to effectively
strengthen their long-lasting relationships with multiple stakeholders in a more competitive
environment, which leads to the following hypotheses:
H1a. The intensity of PMC is positively associated with standalone CSR disclosure. H1b. The intensity of PMC is positively associated with standalone CSR disclosure containing product-related information.
2.2.2. The negative effects of PMC on voluntary CSR disclosure
Prior theoretical works (e.g., Board, 2009; Clinch & Verrecchia, 1997; Verrecchia,
1983) show that in a variety of circumstances imparting proprietary information might
jeopardize disclosing firms’ competitive position in the product markets if rivals make strategic
use of the information to their advantage. Consequently, companies have less incentive to
disclose when PMC is more intense given that the proprietary costs of voluntary disclosure are
high. This prediction is supported by a body of empirical studies in various contexts, including,
for instance, segment reporting (Bens et al., 2011; Leuz, 2004; Prencipe, 2004), management
13 For example, Hildebrand et al. (2011) note that a firm’s CSR engagements are likely to cause stakeholders to form strong and long-lasting bonds with the firm. These effective relationships with stakeholders, in turn, can generate intangible, socially complex, and imperfectly imitable resources that enhance a firm’s sustainable competitive advantage against its rivals (Hillman & Keim, 2001).

15
earnings forecasts (e.g., Ali et al., 2014; Huang et al., 2016), R&D information (Jones, 2007),
sales and costs information in public filings (Dedman & Lennox, 2009), product-related
information in IPO prospectuses (Guo et al., 2004), customer information in SEC filings (Ellis
et al., 2012), and material contract information in SEC filings (Boone et al., 2016; Verrecchia
et al., 2006).
In the context of CSR disclosure, it is plausible that voluntary disclosure of CSR
information can incur non-trivial proprietary costs. For example, CSR can be viewed as a form
of product innovation (e.g., the creation of new socially responsible product features or
categories) or process innovation (e.g., the use of a socially responsible production process),
which can differentiate a firm’s products from its competitors and contribute to a sustainable
competitive advantage (Flammer, 2015; Fernández-Kranz & Santaló, 2010; Fomburn &
Shanley, 1990; McWilliams & Siegel, 2001; 2011). Supporting this view, the opponents of
mandatory CSR disclosure rules argue that CSR disclosure regulation can decrease firm value
by forcing firms to disclose proprietary or competitively sensitive information (Ioannou &
Serafeim, 2017).
The concerns regarding the proprietary costs of CSR disclosure are evidenced by
companies’ responses to the SEC’s 2016 Concept Release, when industry commenters
expressed concerns that disclosing CSR information would be advantageous to competitors
(Thomas & Maguire, 2016). Furthermore, using a sequential game theoretical model to explain
firms’ observed reluctance to disclose environmental liability information, Li et al. (1997)
show that with stakeholders’ increasing awareness of environmental issues, the expected
proprietary costs of disclosing environmental liability information increase and thus companies
become less likely to disclose. The above discussion thus leads to our alternative hypotheses:
H2a. The intensity of PMC is negatively associated with standalone CSR disclosure.

16
H2b. The intensity of PMC is negatively associated with standalone CSR disclosure containing product-related information.
3. Sample, Variable Definitions, and Methodology
3.1. Sample selection
To test the empirical question of our study, we collect all standalone CSR disclosures
issued by U.S. firms during the period from 1999 to 2011 from the Corporate Register (an
online directory of corporate social responsibility reports), following prior studies (e.g., Chen
et al., 2016; Dhaliwal et al., 2011; Muslu et al., 2017). For each standalone CSR report collected,
we further manually collect information about whether a standalone CSR disclosure contains
product-related information disclosure, and if it does, how many pages of the disclosure are
dedicated to such information. 14 We then collect financial statement data from COMPUSTAT,
stock return data from the Center for Research in Security Prices (CRSP), the CSR performance
data from MSCI (formerly KLD), and management earnings guidance data from the First Call
database. Our final sample consists of 13,989 firm-years with no missing control variables,
associated with 2,565 distinct firms. Among them, a total of 1,120 firm-years are identified
with standalone CSR disclosure issuance during our sample period.15
Panel A of Table 1 presents the sample distribution by year and reports the summary
statistics of our main measures of CSR disclosure. Our result indicates that during our sample
period, the percentage of firms publishing standalone CSR reports ranges between 4% (in 2004)
and 12.5% (in 2010), with an average 8% of firms providing standalone CSR reports (Column
4, Ind(CSRR)). Some firms do not disclose product-related information even though they do
publish standalone CSR reports. The percentage of firms disclosing standalone CSR reports
14 Because the hand collection of standalone CSR reports and identifying the total number of pages dedicated to product-related information on each CSR report required substantial effort and time, our sample period ends in 2011. 15 Specifically, a total of 319 distinct firms issuing 1,249 standalone CSR disclosures are identified as voluntary CSR reporters during our sample period. The total number of CSR disclosures is greater than the total number of firm-year observations because some firms issued more than one standalone CSR report in a year.

17
with product-related information disclosure in each year ranges between 2.7% (in 2004) and
9.7% (in 2010), with an average 6.1% of firms providing standalone CSR reports containing
product-related information (Column 5, Ind(CSRR_P)).
The results also suggest that on average, each standalone CSR report has 38.6 pages
(Column 8, Page (CSRR)), with 5.4 pages (14%) dedicated to product-related information
(Column 9, Page (Product)), indicating that the level of product-related contents reported in
CSR disclosures is indeed non-trivial.
Panel B of Table 1 presents the sample distribution and summary statistics by the
Fama–French 48 industry classifications. The business service industry (#5) constitutes the
largest proportion of the final sample (12.17%), followed by the retail industry (#32, 7.56%)
and the electronic equipment industry (#16, 7.46%). The precious metals industry has the
lowest number of firms in our sample; however, it has the highest proportion of firms within
the industry (#28, 35.7%) issuing CSR reports. Non-pollution-prone industries such as aircraft
(#1), business supplies (#6), consumer goods (#13), and food products (#18) also have a high
proportion of firms disclosing CSR reports, suggesting that CSR-disclosing firms are not
limited to firms in high-polluting industries.
Insert Table 1 around here
3.2. Measurement of variables
3.2.1. PMC
Drawing on prior literature (Chen et al., 2015; Fresard, 2010; Hoberg & Philips, 2016;
Karuna, 2007; Li et al., 2013; Valta, 2012), we use several proxies to measure the intensity of
PMC to capture the different dimensions of competition faced by a company. First, following
Chen et al. (2015) we use non-price competition (Comp_NonPrice), calculated as the sum of
firm-level advertising expenses and R&D expenses divided by the sum of firm-level sales in
an industry, as our first proxy of PMC. This measure is developed based on the argument in

18
the economics literature that increasing advertising and R&D expenses is a non-price approach
to increase demand for a product or service (Chen et al., 2015). A higher value of
Comp_NonPrice corresponds to a greater extent of non-price competition.
The second proxy of PMC used by our study is the text-based product similarity scores
(Comp_ProdSimilarity). Hoberg and Phillips (2016) provide the product similarity vector and
firm-by-firm pairwise similarity scores by parsing the product descriptions from the firm 10-
Ks and forming word vectors for each firm to compute continuous measures of product
similarity for every pair of firms in our sample in each year. 16 A higher value of
Comp_ProdSimilarity refers to a greater extent of PMC.
The third proxy of PMC used by our study is managers’ perceived competition
(Comp_MgmPerception), as suggested by Li et al. (2013).17 The SEC recommends that the
management discussion and analysis (MD&A) section of a firm’s 10-K filing includes a
discussion of the firm’s competitive position, and thus the MD&A section provides a valuable
source for measuring managers’ perceptions of competition. Accordingly, they measure
management’s perceptions of the intensity of PMC that managers face by using textual analysis
of the firm’s 10-K filing. Specifically, Comp_MgmPerception is calculated as the number of
occurrences of “competition, competitor, competitive, compete, and competing” scaled by the
total number of words in a firm’s 10-K filing. This measurement responds to management’s
concern about PMC at the firm level. A higher value of manager perception refers to a greater
extent of PMC.
The last measure of PMC used in our study is created by exploiting an exogenous shock
to firms’ competitive environment to address endogeneity concerns (Fresard, 2010; Valta,
16 The product similarity vector data are downloaded from the Hoberg-Phillips Data Library (http://hobergphillips.usc.edu/). We thank Prof. Hoberg and Prof. Phillips for providing these data. 17 The data on managers’ perceived competition are downloaded from Prof. Li’s website: http://webuser.bus.umich.edu/feng/. We again thank Prof. Li for his generosity in providing these data to the public domain.

19
2012). Specifically, we use the reduction of import tariff rates to capture exogenous changes
to a firm’s PMC. The reduction of import tariff rates captures an unexpected reduction of trade
barriers, which facilitates the penetration of foreign rivals into a domestic product market,
resulting in intense PMC. Using tariff data for the U.S. manufacturing sector, we identify 54
industries that experienced a large import tariff rate reduction during our sample period. A
large import tariff rate reduction is defined as an import tariff reduction that is three times
greater than the median tariff reduction (Fresard, 2010; Valta, 2012). Accordingly, the
reduction of import tariff rates (Comp_TariffCut) is equal to one if an industry has experienced
a large tariff reduction at time t, and zero otherwise.18
3.2.2. CSR disclosure
We use several variables to measure firms’ voluntary CSR disclosures and their
attributes. For CSR disclosure, we use three variables including: (1) the incidence (Ind(CSRR)),
(2) frequency (Num(CSRR)), and (3) length (Page(CSRR)) of CSR reporting. Specifically,
Ind(CSRR) is an indicator variable equal to one if a firm provides any standalone CSR reporting
voluntarily in a given year, and zero otherwise. Num(CSRR) is the frequency (or total number)
of the standalone CSR reporting voluntarily issued by a firm in a given year. Page(CSRR) is
the total number of pages of all (if more than one) standalone CSR reporting voluntarily issued
by a firm in a given year.
Our discussion in Section 2 suggests that concerns regarding aiding competitors can
create a disincentive for voluntary CSR disclosures. To the extent that CSR disclosures contain
product-related information, such as future product development and innovative production
processes (see examples provided in Appendix B), these arguments should be more applicable
18 In additional analysis, following Li (2010), who classifies PMC into competition from potential versus existing rivals, we also employ two additional PMC measures (Comp_Potential and Comp_Existing). Comp_Potential is mainly derived from the three components: industry-average of property, plant and equipment, industry-average R&D expense and industry-average capital expenditures. Comp_Existing is mainly derived from the Herfindahl-Hirchman index, four-firm concentration ratio, and the total number of firms operating in an industry.
20
to CSR disclosures with product information disclosure. Thus, in our study, to tie our
arguments with our empirical designs more closely, we also introduce several additional CSR
reporting variables, including (1) Ind(CSRR_P), an indicator variable equal to one if a firm
provides product-related information/content in its standalone CSR reporting in a given year,
and zero otherwise; (2) Num(CSRR_P), the frequency (or total number) of the standalone CSR
reporting containing product-related contents voluntarily issued by a firm in a given year; (3)
Page(Product), the total number of pages of product-related information on a firm’s CSR
disclosure issued by the firm in a given year (only when the product-related information on a
single page accounts for more than half of the content of that page, we count it as one page);
and (4) Ratio(Product/Total), the ratio of total number of pages of CSR reporting dedicated to
product-related information to the total number of pages of CSR reporting.19
3.3. Methodology
To test our hypotheses, we use the following regression model to investigate whether
and how PMC is associated with standalone CSR reporting voluntarily issued by firms.
CSRRit= β0 + (β1 × COMPit) + (∑s βs × Controls) + (∑y βy × Year_Indicators) +
(∑n βn × Industry_Indicators) + ε
where CSRR is the CSR reporting variables and COMP is the PMC measures discussed above.
Following prior studies (e.g., Dhaliwal et al., 2011), we control for other factors influencing
standalone CSR disclosures, including: the total KLD score of CSR strengths (CSRPERF), firm
size (SIZE), litigation risk (LITIGATION), profitability (ROA), financial activities (FINANCE),
Tobin’s Q (TOBINQ), financial leverage (LEVERAHE), overseas income (GLOBAL), stock
liquidity (LIQUDITY), management forecast disclosure (FORECAST), and earnings quality
19 We do not find a significant relation between intensity of PMC and Ratio (Product/Total) (i.e., the ratio of total number of pages dedicated to product-related information to the total number of pages of CSR reporting) and thus these results are not tabulated. To the extent that greater levels of competition reduce the length of CSR disclosures in general and the number of pages dedicated to product related information in particular, such a finding is not surprising.

21
(ACCRUALS). All continuous variables are winsorized at the top and bottom one percentiles.
In all regressions, we also include industry and year fixed effects.
4. Results
4.1. Descriptive statistics
Panel A of Table 2 reports the descriptive statistics for all the major variables used in
the study. The lower percentage of firms providing standalone CSR disclosure (8%) during our
sample period is indeed surprising, given the significantly positive association between CSR
disclosure and the various capital market benefits documented by previous studies. The
likelihood of firms providing standalone CSR disclosures with product-related information is
even lower (6%), thereby supporting the possible higher proprietary cost concerns associated
with such disclosures. Table 2 also shows that the firms in our sample are profitable, with an
average ROA of 4.2%, and most have foreign income. Among the sample firm-years, less than
one-third (27.7%) operate in a high-litigation industry, and over 40% voluntarily issue earnings
forecasts.
Panel B of Table 2 presents the univariate comparison across firms with different levels
of competition across each of the four competition measures. We split the sample into high and
low competition subgroups based on the sample median of each competition measure. Across
all measures of competition, our CSR disclosure variables are generally smaller in the high
competition group compared to the low completion group, thereby providing initial and
preliminary support to Hypotheses 2a and 2b that PMC is negatively associated with standalone
CSR disclosures.
Insert Table 2 around here
Table 3 presents the correlation matrix of key variables, with Pearson’s correlation
coefficients in the lower triangle and Spearman’s rank correlations in the upper triangle. In

22
general, the CSR reporting variables are correlated negatively with our proxies of PMC, except
for Comp_NonPrice. Regarding the control variables, consistent with the literature, the CSR
disclosure variables tend to correlate positively with larger and globally oriented firms and
firms with more CSR strengths.
Insert Table 3 around here
4.2. Regression results
In our study, we predict that the intensity of PMC can either be positively or negatively
associated with voluntary CSR disclosure. Table 4 presents our main results using non-price
competition, Comp_NonPrice, as the proxy for PMC. Across all CSR reporting variables,
Comp_NonPrice is significantly and negatively associated with CSR disclosure, thus
supporting both Hypotheses 2a and 2b. Specifically, holding CSR performance and other
factors constant, when Comp_NonPrice increases by one unit, the log-odds of issuing
standalone CSR disclosure decreases by 8.8628 units, and the log-odds of being in a category
of higher frequency of CSR disclosure (Num(CSRR)) or longer CSR disclosure (Page(CSRR))
reduces by 7.8591 and 8.4199 units, respectively.20
The coefficients of the control variables generally have the expected signs, and are
consistent across different measures of CSR disclosure. Firms with larger size, more CSR
strengths, better profitability, higher leverage, and a global focus tend to provide more CSR
disclosures voluntarily. Conversely, firms with higher levels of external financing, Tobin’s Q,
and liquidity tend to issue less CSR disclosures. These findings are generally consistent with
those reported by prior studies (e.g., Dhaliwal et al., 2011).
Insert Table 4 around here
20 We obtain qualitatively similar results when we estimate the regressions of Page(CSRR) and Page(Product) using OLS specification instead of Ordered Logit model .

23
In our first multivariate test, we use non-price competition as the proxy for PMC. To
examine whether our results are sensitive to the measurement of competition, we employ two
alternative measures of competition based on textual analysis of firms’ 10-K filings: product
similarity (Comp_ProdSimilarity) and management’s perceptions of the intensity of
competition (Comp_MgmPerception). In contrast to the non-price competition measure, these
two measures do not rely on predetermined industry groups. To the extent that managers have
reasonably accurate perceptions of the type and level of competition they face, product
similarity and management’s perceptions of the intensity of competition should be able to
capture the dynamic competitive environment within which a firm operates.
Table 5 shows that the coefficients on Comp_ProdSimilarity are significantly negative
across all regressions with different measures of CSR disclosure. Since presumably firms with
higher product similarity are less able to differentiate their products from competitors and thus
tend to face more intense competition, our results strongly suggest that competition is
associated with lower levels of CSR disclosure. Similarly, Table 6 shows that the coefficients
on Comp_MgmPerception, i.e., management’s perceptions of the intensity of competition are
generally negative across all regressions, albeit less significant when Page(Product) is used as
the dependent variable. Together, these results again provide a strong support for our
Hypotheses 2a and 2b, suggesting a negative association between the intensity of competition
and CSR disclosures.
Insert Table 5 around here
Insert Table 6 around here

24
5. Additional Analyses
5.1. Alternative proxies of PMC
The results so far show that competition has the potential to reduce CSR disclosure.
However, a common concern is the potential endogeneity of PMC because the intensity of
competition and firms’ choice of CSR disclosure may be jointly determined. For example, a
firm could strategically use its financing policy to affect market competition by hurting its
rivals’ profitability and driving them out of the market (Valta et al., 2012); while in the
meantime, the firm’s probability of disclosing CSR information may also be affected by their
financing decisions (Dhaliwal et al., 2011). To address this concern, we explore a quasi-natural
experimental setting by examining firms’ CSR disclosure in response to an unexpected
reduction in industry import tariffs. Specifically, we use the tariff rate reduction as an
exogenous shock to firms’ competitive environment because presumably the reduction of tariff
rates can trigger competitive pressure due to the lowered barriers to entering product markets
and increased presence of foreign rivals on the domestic markets. For this purpose, we define
an indicator variable, Comp_TariffCut, which equals one if the industry has experienced a large
tariff reduction in year t and zero otherwise.
Table 7 reports the regression results. Albeit with a much smaller sample size due to
the focus on manufacturing firms, Comp_TariffCut is significantly negative in all regressions
with different measures of CSR disclosure as the dependent variable. These results substantiate
the main finding that a higher level of competition pressure significantly decreases firms’ CSR
reporting incentive.
Insert Table 7 around here
5.2. Disclosure of product-related information in CSR reporting and future sales revenues
Our results suggest that firms trade off the potential benefits of CSR disclosure against
the proprietary costs associated with such disclosure, and thus report less when facing greater

25
competitive pressures. In this section, we examine the potential implication of CSR disclosure
on future sales by empirically examining the relation between CSR disclosure and future sales
revenue measured by SALESt+1, SALESt+2, and SALESt+3, respectively.
Consistent with the positive relation between CSR disclosure and future financial
performance documented by prior studies (e.g., Lev et al., 2010; Lys et al., 2015), the results
presented in Columns 1–3 of Table 8 show a significantly positive association between CSR
disclosure measured by Ind(CSRR) and future sales across all models. More importantly, the
results also indicate a positive association between the level of product-related information on
a CSR report (measured by the ratio of total number of pages dedicated to product-related
information to the total number of pages of CSR reporting, i.e., Ratio(Product/Total)) and
future sales even after controlling for the issuance of CSR disclosure. Additionally, we do not
find a significant relation between CSR performance (CSRPERF) and future sales, which is
consistent with the mixed findings about the effect of CSR performance on future financial
performance reported in the literature (Margolis et al. 2009). Finally, in Columns 4–6, we
replace Ratio(Product/Total) by Ratio(Product/Total)_First, which is the Ratio(Product/Total)
measured from the first CSR report issued by a firm during our sample period, and rerun the
regressions to better address reverse causality concerns. We find our inferences unchanged.
As a further test, we examine the effect of competition on the relation between CSR
disclosure and future sales revenue. If proprietary cost concerns indeed affect the information
content or quality of CSR disclosure, one can predict that the relation between CSR disclosure
and future sales should be weakened when the intensity of PMC is high. To test this conjecture,
we interact the CSR disclosure variable Ratio(Product/Total) and an aggregated competition
variable Comp_Overall (created using the principal component of our competition measures
except Comp_TariffCut) which captures the overall level of PMC of each firm in our regression
models and find evidence supporting our conjecture. For example, while our results continue

26
to show a positive association between Ratio(Product/Total) and future sales, we find a
significantly negative estimated coefficient for the interaction term between
Ratio(Product/Total) and intensity of PMC measured by Comp_Overall. We do not tabulate
the results for the sake of brevity.
Insert Table 8 around here
5.3. PMC and properties/quality of CSR disclosure
In our main tests, we show that competition not only decreases the likelihood and
frequency of CSR disclosures, it also decreases the length of CSR disclosure in general and the
number of pages containing product-related information in particular. In this section, we further
examine the effect of competition on the characteristics of CSR reporting. Specifically, we
focus on the assurance of CSR reporting and the adoption of GRI guidelines, which are
arguably suggestive of the disclosure quality of CSR reports (Hahn & Kühnen, 2013; Laufer,
2003; Muslu et al., 2017).
When the verification of disclosed information is impossible or not available,
competition may reduce disclosure quality because firms may engage in a “cheap-talk”
communication game (Crawford & Sobel, 1982). Newman and Sansing (1993) show that firms
may distort their voluntary disclosures to discourage potential new competitors from entering
the market. The implication of these studies for CSR reporting is that firms may produce low
quality CSR disclosures when the competition is intense.
While the evidence from additional analysis presented above (i.e., a significant and
negative coefficient between Ratio(Product/Total) and Comp_Overall) appears to support this
conjecture, to directly and empirically test this conjecture, we obtain CSR reporting assurance
data (CSR_Assurance) and the adoption of GRI guidelines data (GRI_Report) for each
standalone CSR disclosure from Thomson Reuters ASSET4. CSR_Assurance is an indicator
variable that equals one if a firm publishes a standalone CSR report with external assurance in
27
a given year, and zero otherwise. GRI_Report is an indicator variable that equals one if a firm
publishes a standalone CSR report in accordance with GRI guidelines in a given year, and zero
otherwise. We replace the dependent variable in our regression models with CSR_Assurance
or GRI_Report, and rerun the regressions.21
Table 9 reports the regression results. Across all four measures of competition, we find
the intensity of product market competition is associated with a lower likelihood of CSR
reporting assurance and the adoption of GRI guidelines, except in Column 2. This finding is
consistent with the conjecture that the intensity of competition is likely associated with a lower
quality of CSR reporting practice.
Insert Table 9 around here
Recent studies argue that disclosure readability may also be indicative of disclosure
quality. For example, Li (2008), You and Zhang (2009) and Miller (2010) find that the level of
financial reporting readability affects investors’ willingness or ability to acquire information
from financial disclosures. Rennekamp (2012) further shows that disclosure readability affects
investors’ feelings of processing fluency, which in turn affects their related judgments and
decisions, even when disclosure readability does not affect the amount of information that they
acquire. As such, one conjecture is that when facing greater level of competition, firms are
more likely to provide less readable CSR reports in order to hide or obfuscate competition-
sensitive information. Following this argument, we examine whether and how competition is
associated with the readability of CSR disclosures.
We use the Fog and Flesch-Kincaid indices obtained from textual analysis of CSR
narrative to measure the level of readability of CSR disclosure. Consistent with our conjecture,
21 The sample sizes for the regressions reduce substantially in these tests, because only the sample with CSR reporting can be included for this test.
28
the untabulated results show some suggestive evidence that competition is associated with less
readable CSR disclosures, although in most cases, the effect is only marginally significant.
5.4. Potential versus existing rivals and CSR disclosure
The effect of competition on disclosure may be different between competition from
potential entrants and that from existing rivals (Li, 2010). To explore whether the effect of
competition on CSR disclosure varies with different type of rivals, we follow Li (2010) and
distinguish between competition from potential entrants (Comp_Potential) and competition
from existing rivals (Comp_Existing), which are constructed based on principal component
analysis of multiple industry-level competition variables (the detailed variable definitions are
provided in Appendix A). We then replace the competition measure in our regression models
by Comp_Potential and Comp_Existing, and rerun the regressions.
The results are reported in Table 10. Consistent with Li (2010)’s study on voluntary
financial disclosure measured by management earnings forecasts, Comp_Existing is associated
with less CSR disclosure; however, the coefficients are not statistically significant at
traditionally levels. Therefore, we do not have convincing evidence that competition from
existing rivals significantly affects CSR reporting. On the other hand, the coefficients on
Comp_Potential are significantly negative in all of the regression models, indicating that
competition threats from potential rivals reduce CSR disclosure.22
While our results are different from those reported by Li (2010), who shows that higher
competition from potential entrants is associated with more voluntary disclosure in the context
of management forecasts on profits and investments, Li interprets this finding as due to firms
choosing to voluntarily disclose more financial information to deter potential entrants from
entering into the markets. However, unlike forecasts on profits and investments that can be
22 For example, a one unit increase in Comp_Potential leads to a 0.1729 unit decrease in the log-odds of disclosing CSR reports, and a 0.1889 unit decrease in the log-odds of disclosing product-related information in CSR reports.

29
considered as an early revelation of information before the public release of financial
statements, the information disclosed on CSR reports, for example, product-related information
can be more competition-sensitive. Under this circumstance, disclosing CSR information may
not be perceived as a good entry deterrence strategy by managers due to the high proprietary
costs of such disclosure.23
Insert Table 10 around here
6. Conclusion
During recent years, CSR disclosures have gained significant prominence and
increasing visibility in the business world. In this study, we examine firms’ decisions regarding
CSR disclosure in the presence of PMC. We find the likelihood, frequency, and length of
standalone CSR reporting decrease with the intensity of PMC. The negative effect of
competition on CSR reporting issuance and frequency is also magnified for CSR disclosure
specifically containing product-related information. These results are robust to different
measures of competition to capture the different dimensions of PMC, including non-price
competition, product similarity, and managers’ perceptions of competition. Using tariff rate
reductions as an exogenous shock to firms’ competitive environment, we show that our finding
is unlikely to be driven by endogenous PMC.
Additional analyses show that firms experience larger sales revenue following CSR
reporting, which is consistent with the argument that firms trade off the economic benefits and
the proprietary costs of CSR reporting. Moreover, our results show that competition attenuates
the positive relation between CSR disclosure and future sales revenue, suggesting that
23 A firm’s CSR disclosure of how to embed CSR activities into its business models, especially how to harness technology and innovation to deliver CSR-oriented products and services, may provide know-how to its competitors, enabling them to mimic the disclosing firm’s successful business models and diminish its competitive advantages. Indeed, survey evidence shows that CEOs increasingly view competitor information as important for them to gain competitive advantages, especially long-term oriented information such as new product initiatives and changes in corporate strategies (PwC, 2002).

30
proprietary cost concern reduces the information content of CSR disclosure, which affects the
predictive power of CSR disclosure for future financial performance.
Our further analysis of CSR reporting characteristics indicates that competition can also
be associated with lower CSR reporting quality, measured by the likelihood of providing
external assurance for CSR disclosure, the propensity of providing CSR disclosures prepared
under GRI reporting guidelines, and the level of readability of the CSR disclosure (albeit
weakly). Finally, in contrast to prior research on competition in the context of voluntary
financial disclosure, we find that competition threats from potential rivals reduce CSR
disclosure, suggesting that the disclosure of non-financial information is not perceived by firms
as an effective strategy to deter the entry of potential rivals due to the high proprietary costs
concerns about CSR reporting. Overall, the findings of our study add to the literature by
showing that proprietary costs concerns affect not only financial disclosures, as evidenced in
the literature, but also can have a significant effect on non-financial disclosures.

31
References Ali, A., Klasa, S., & Yeung, E., 2014. Industry concentration and corporate disclosure policy. Journal
of Accounting and Economics 58, 240-264. Baron, D.P., 2001. Private politics, corporate social responsibility, and intgreated strategy. Journal of
Economics & Management Strategy 10, 7–45. Beren, G., van Riel, C.B.M., van Bruggen, G.H., 2005. Corpoate associaotns and consumber product
responses: The moderating role of corpoate brand dominance. Journal of Marketing 69, 35–48. Bens, D.A., Berger, P.G., Monahan, S.J., 2011. Discretionary disclosure in financial reporting: An
examination comparing internal firm data to externally reported segment data. The Accounting Review 86, 417–449.
Bhattacharya, C.B., Sen, S., 2003. Consumber-company identfication: A framework for understanding consumbers’ relationships with companies. Journal of Marketing 67, 76–88.
Bhattacharya, C.B., Sen, S., 2004. Doing better at doing good: When, why, and how consumers respond to corporate social initiatives. California Management Review 47, 9–24.
Bhattacharya, C.B., Smith, N,C., Vogel, D., 2004. Integrating social responsibility and marketing strategy: An introdcution. California Management Review 47, 6–8.
Bhojraj, S., Blacconiere, W.G., S’Souza, J.D., 2004. Voluntary disclosure in a multi-audience setting: an empirical investigation. The Accounting Review 79, 921–947.
Board, O., 2009. Competition and disclosure. The Journal of Industrial Economics 57, 197–213. Boone, A.L., Floros, I.V., Johnson, S.A., 2016. Redacting proprietary information at the initial public
offering. Journal of Financial Economics 120, 102–123. Botosan, C.A., Stanford, M., 2005. Managers’ motives to withhold segment disclosures and the effect
of SFAS No. 131 on analysts’ information environment. The Acconting Review 80, 751–771. Brown, T.J., Dacin, P.A., 1997. The company and the product: Corporate associations and consumer
product responses. Journal of Marketing 61, 68–84. Brown, T.J., 1998. Corporate associations in marketing: Antecedents and consequences. Corporate
Reputation Review 1, 215–233. Chen, Y., Hung, M., Wang, Y., 2018. The effect of mandatory CSR disclosure on firm profitability and
social externalities: Evidence from China. Journal of Accounting and Economics 65, 169–190. Chen, S., Matsumoto, D., Rajgopal, S., 2010. Is silence golden? An empirical analysis of firms that stop
giving quarterly eranings quidance. Journal of Accounting and Economics 51, 134–150. Chen, C.X., Matsumura, E.M., Shin, J.Y., Wu, S.Y.C., 2015. The effect of competition intensity and
competition type on the use of customer satisfaction measures in executive annual bonus contracts. The Accounting Review 90, 229–263.
Chen, L., Srinidhi, B., Tsang, A., Yu, W., 2016. Audited financial reproting and voluntary disclosure of corporate social responsibility (CSR) reports. Journal of Management Accounting Research 28, 53–76.
Chen, L., Liao, C., Tsang, A., 2017. CEO tenure and corporate social responsibility (CSR) reporting. Working paper. George Mason Univerisity.
Cheng, B., Ioannou, I., Serafeim, G., 2013. Corporate social responsibility and access to finance. Strategic Management Journal 35, 1–23.
Christensen, D. M., 2016. Corporate accountability reporting and high-profile misconduct. The Accounting Review 91, 377-399.
Clarkson, M.E., 1995. A stakeholder framework for analyzing and evaluating corporate social performance. Academy of Management Review 20, 92–117.
Clinch, G., Verrecchia, R.E., 1997. Competitive disadvantage and discretionary disclosure in industries. Australian Journal of Management 22, 125–137.
Cone/Ebiquity, 2015. Global CSR study. Cone Communications LLC. See http://www.conecomm.com/research-blog/2015-cone-communications-ebiquity-global-csr-study.
Creyer, E.H., Ross, W.T. Jr., 1997. The influence of firm behavior on purchase intension: Do consumers really care about business ethics. Journal of Consumer Marketing 14, 421–432.
Crifo, P., Forget, V.D., Teyssier, S., 2015. The price of environmental, social and governance practice disclosure: An experiment with professional private equity investors. Journal of Corporate Finance 30, 168–194.

32
Crawford, V. P., Sobel, J., 1982. Strategic information transmission. Econometrica 50, 1431–1451. Darrough, M.N., Stoughton, N.M., 1990. Financial disclosure policy in an entry game. Journal of
Accounting and Economics 12, 219–243. Datta, S., Iskandar-Datta, M., Singh, V., 2013. Product market power, industry structure, and corporate
earnings management. Journal of Banking and Finance 37: 3273–3285. Dedman, E., & Lennox, C., 2009. Perceived competition, profitability and the withholding of
information about sales and the cost of sales. Journal of Accounting and Economics 48, 210–230. Dhaliwal, D.S., Huang, S., Khurana, I.K., Pereira, R., 2014. Product market competition and conditional
conservatism. Review of Acounting Studies 19: 1309–1345. Dhaliwal, D.S., Li, O.Z., Tsang, A., Yang, Y.G., 2011. Voluntary nonfinancial disclosure and the cost
of equity capital: The initiation of corporate social responsibility reporting. The Accounting Review 86, 59–100.
Dhaliwal, D.S., Radhakrishnan, S., Tsang, A., Yang, Y.G., 2012. Nonfinancial disclosure and analyst forecast accuracy: International evidence on corporate social responsibility disclosure. The Accounting Review 87, 723–759.
Du, S., Bhattacharya, C.B., Sen, S., 2007. Reaping relational rewards from corporate social responsibility: The role of competitive positioning. International Journal of Research in Marketing 24, 224–241.
Eccles, R.G., Ioannou, I., Serafeim, G., 2014. The impact of corporate substainability on orgnaizational processes and performance. Management Science 60, 2835–2857.
Elliott, W.B., Jackson, K.E., Peecher, M.E., White, B.J., 2014. The unintended effect of corporate social responsibility performance on investors’ estimated of fundamental value. The Accounting Review 89, 275–302.
Ellis, J.A., Fee, C.E., Thomas, S.E., 2012. Proprietary costs and the disclosure of information about customers. Journal of Accounting Research 50, 685–727.
Ernst & Young, 2015. Tomorrow's Investment Rules 2.0. Ernst & Young LLP. Fernández�Kranz, D., Santaló, J., 2010. When necessity becomes a virtue: The effect of product market
competition on corporate social responsibility. Journal of Economics & Management Strategy 19, 453–487.
Fisman, R., Heal, G., Nair, V., 2008. A model of corporate philanthropy. Working paper. Columbia University.
Flammer, C., 2015. Does product market competition foster corporate social responsibility? Evidence from trade liberalization. Strategic Management Journal 36, 1469–1485.
Fombrun, C., Shanley, M., 1990. What's in a name? Reputation building and corporate strategy. Academy of Management Journal 33, 233–258.
Freeman, R.E., 1984. Strategic Management: A Stakeholder Approach. New York: Cambridge. Freeman, R.E., McVea, J.I., 2001. A stakeholder approach to strategic management. In: Hitt M,
Freeman RE & Harrison J (eds.) The Blackwell Handbook of Strategic Management. Blackwell, Malden, MA, pp. 189–207.
Fresard, L., 2010. Financial strength and product market behavior: The real effects of corporate cash holdings. The Journal of Finance 65, 1097–1122.
Frésard, L., Valta, P., 2013. Competitive pressure and corporate investment: evidence from trade liberalization. Working paper. University of Maryland.
Graham, J.R., Harvey, C.R., Rajgopal, S., 2005. The economic implications of corporate financial reporting. Journal of Accounting and Economics 40, 3–73.
Grossman, S.J., 1981. The informational role of warranties and private disclosure about product quality. The Journal of Law and Economics 24, 461–483.
Grossman, S.J., Hart, O.D., 1980. Disclosure laws and takeover bids. The Journal of Finance 35, 323–334.
Guo, R.J., Lev, B., Zhou, N., 2004. Competitive costs of disclosure by biotech IPOs. Journal of Accounting Research 42, 319–355.
Hahn, R., Kühnen, M., 2013. Determinants of sustainability reporting: A review of results, trends, theory, and opportunities in an expanding field of research. Journal of Cleaner Production 59, 5–21.

33
Heitzman, S., Wasley, C., Zimmerman, J., 2010. The joint effects of materiality thresholds and voluntary disclosure incentives on firms’ disclosure decisions. Journal of Accounting and Economics 49, 109–132.
Hildebrand, D., Sen, S., Bhattacharya, C., 2011. Corporate social responsibility: A corporate marketing perspective. European Journal of Marketing 45, 1353–1364.
Hirst, D.E., Koonce, L., Venkataraman, S., 2008. Management earnings forecasts: A revew and framework. Accountng Horizons 22, 315–338.
Hillman, A.J., Keim, G.D., 2001. Shareholder value, stakeholder management, and social issues: what's the bottom line? Strategic Management Journal 22, 125–139.
Hoberg, G., Phillips, G., Prabhala, N., 2014. Product market threats, payouts, and financial flexibility. The Journal of Finance 69, 293–324.
Hoberg, G., Phillips, G., 2016. Text-based network industries and endogenous product differentiation. Journal of Political Economy 124, 1423–1465.
Hoeffler, S., Keller, K.L., 2002. Building brand equity through corporate societal marketing. Journal of Public Policy & Marketing 21, 78–89.
Hou, K., Robinson, D.T., 2006. Industry concentration and average stock returns. The Journal of Finance 61, 1927–1956.
Huang, M., Cheng, Z., Chen I., 2017. The importance of CSR in forming customer-company identification and long-term loyalty. Journal of Services Marketing 31, 63–72.
Huang, Y., Jennings, R., Yu, Y., 2016. Product market competition and managerial disclosure of earnings forecasts: Evidence from import rariff rate reductions. The Accounting Review 92, 185–207.
Huang, X B, Watson L., 2015. Corporate social responsibility research in accounting, Journal of Accounting Literature 34, 1–16.
Ioannou, I., Serafeim, G., 2017. The consequences of mandatory corporate sustainability reporting. Working paper. London Business School.
Johnson, O., 1966. Corporate philanthropy: An analysis of corporate contribution. Journal of Business 39: 489–504.
Jones, D., 2007. Voluntary disclosure in R&D-intensive industries. Contemporary Accounting Research 24, 489–522.
Karuna, C., 2007. Industry product market competition and managerial incentives. Journal of Accounting and Economics 43, 275–297.
Kim, Y., Park, M. S., & Wier, B., 2012. Is earnings quality associated with corporate social responsibility? The Accounting Review 87, 761-796.
KPMG, 2016. Carrots Sticks: Global trends in sustainability reporting regulation and policy. KPMG International.
KPMG, 2008. KPMG International Survey of Corporate Responsibility Reporting 2008. Zurich, Switzerland: KPMG International.
KPMG, 2011. KPMG International Survey of Corporate Responsibility Reporting 2011. Zurich, Switzerland: KPMG International.
KPMG, 2013. KPMG Internatinal Survey of Corporate Responsibility Reporting 2013. Zurich, Switzerland: KPMG International.
Laufer, W.S., 2003. Social accountability and corporate greenwashing. Journal of Business Ethics 43, 253–261.
Leuz, C., 2004. Proprietary versus non-proprietary disclosures: Evidence from Germany. In: Leuz C, Pfaff D & Hopwood A (eds.) The Economics and Politics of Accounting. Oxford University Press, Oxford, pp. 164–197.
Lev, B., 2000. Intangibles: Management, Measurement, and Reporting. Brookings Institution Press, Washington, DC.
Lev, B., Petrovits, C., Radhakrishnan, S., 2010. Is doing good good for you? How corporate charitable contributions enhance revenue growth. Strategic Management Journal 31, 182–200.
Li, Y., Richardson, G.D., Thornton, D.B., 1997. Corporate disclosure of environmental liability information: Theory and evidence. Contemporary Accounting Research 14, 435–474.
Li, F., 2008. Annual report readability, current earnings, and earnings persistence. Journal of Accounting and Economics 45, 221–247.

34
Li, F., Lundholm, R., Minnis, M., 2013. A measure of competition based on 10�K filings. Journal of Accounting Research 51, 399–436.
Li, E.X., Wasley, C.E., Ximmerman, J.L., 2012. Should management earnings guidance be pooled? Classfying management earnings guidance into capital market, opportunistics, and disclose or abstain rationales: Implication for research. Working paper. University of Rochester.
Li, X., 2010. The impacts of product market competition on the quantity and quality of voluntary disclosures. Review of Accounting Studies 15, 663–711.
Liu, R., Radhakrishnan, S., Tsang, A., 2017. Corporate social responsibility research in accounting: A framework and a review. Working paper. University of Texas at Dallas.
Liu, W.-M. R., Ngo, P. T. H., & Zhu, Q., 2017. Harnessing media attention: Strategic press releases around earnings announcements. Working paper. Australian National University.
Luo, X., Bhattacharya, C.B., 2006. Corporate social reponsiblity, customer satisfaction, and market value. Journal of Marketing 70, 1–18.
Lys, T., Naughton, J.P., Wang, C., 2015. Signaling through corporate accountability reporting. Journal of Accounting and Economics 60, 56–72.
Manchiraju, H., Rajgopal, S., 2017. Does corproate social responsibility (CSR) create shareholder value? Evidence from the Indian companies Act 2013. Journal of Accounting Research 55, 1257–1300.
Maignan, I., Ferrell, O., 2004. Corporate social responsibility and marketing: An integrative framework. Journal of the Academy of Marketing Science 32, 3–19.
Margolis, J. D., Elfenbein, H. A., & Walsh, J. P., 2009. Does it pay to be good? A meta-analysis and redirection of research on the relationship between corporate social and financial performance. Working paper. Harvard University.
Mattei, M.M., Platikanova, P., 2017. Do product market threats affect analyst forecast precision? Review of Accounting Studies 22, 1628–1665.
McWilliams, A., Siegel, D., 2001. Corporate social responsibility: A theory of the firm perspective. Academy of Management Review 26, 117–127.
McWilliams, A., Siegel, D.S., 2011. Creating and capturing value: Strategic corporate social responsibility, resource-based theory, and sustainable competitive advantage. Journal of Management 37, 1480–1495.
Milgrom, P.R., 1981. Good news and bad news: Representation theorems and applications. The Bell Journal of Economics 12, 380–391.
Miller, B.P., 2010. The effects of reporting complexity on small and large investor trading. The Accounting Review 85, 2107–2143.
Mohr, L.A., Webb, D.J., 2005. The effects of corporate social resposiblity and price on consumer responses. Journal of Consumer Affairs 39, 121–147.
Morsing, M., Schultz, M., 2006. Corporate social responsibility communication: stakeholder information, response and involvement strategies. Business Ethics: A European Review 15, 323–338.
Muslu, S., Mutlu, S., Radhakrishnan, S., Tsang, A. 2017. Corporate social responsibility (CSR) reporting quality and analyst forecasts accuracy. Journal of Business Ethics, forthcoming.
Navarro, P., 1998. Why do corporations given to charity? Journal of Business 61, 65–93. Newman, P., Sansing, R., 1993. Disclosure policies with multiple users. Journal of Accounting
Research 31, 92–112. Nikolaeva, R., Bicho, M., 2011. The role of institutional and reputational factors in the voluntary
adoption of corporate social responsibility reporting standards. Journal of the Academy of Marketing Science 39, 136–157.
Nissim, D., & Penman, S. H., 2001. Ratio analysis and equity valuation: From research to practice. Review of Accounting Studies 6, 109-154.
Olsen, M.C., Slotegraaf, R.J., Chandukala, S.R., 2014. Green claims and message frames: How green new products change brand attitude. Journal of Marketing 78, 119–137.
Patten, D.M., Zhao, N., 2014. Standalone CSR reporting by U.S. retail companies. Accounting Forum 38, 132–144.

35
Pérez, A., del Bosque, I.R., 2015. Corporate social responsibility and customer loyalty: Exploring the role of identification, satisfication and type of company. Journal of Service Marketing 29, 15–25.
Pomering, A., Dolnicar, S., 2009. Assessing the prerequisite of successful CSR implementation: are consumers aware of CSR initiatives? Journal of Business Ethics 85, 285–301.
Prencipe, A., 2004. Proprietary costs and determinants of voluntary segment disclosure: evidence from Italian listed companies. European Accounting Review 13, 319–340.
PwC, 2002. One-Third of Fast-Growth CEOs Place Higher Importance on Competitor Information Than a Year Ago. Trendsetter Barometer. PricewaterhouseCoopers LLP.
PwC, 2016. 19th Annual Global CEO Survey: Redefining Business Success in a Changing World. PricewaterhouseCoopers LLP.
PwC, 2017. Global Investor Survey. PricewaterhouseCoopers LLP. Ramanna, K., 2013. A framework for research on corporate accountability reporting. Accounting
Horizons 27, 409–432. Rennekamp, K., 2012. Processing fluency and investors’ reactions to disclosure readability. Journal of
Accounting Research 50, 1319–1354. Rogers, J. L., & Van Buskirk, A., 2013. Bundled forecasts in empirical accounting research. Journal of
Accounting and Economics 55, 43-65. Seavey, S.E., Imhof. M., Watanabe, O.V., 2016. Proprietary costs of competition and financial
statement comparability. Working paper, University of Nebraska-Lincoln. SEC, 2016. Concept Release: Business and Financial Disclosure Required by Regulation S-K.
Securities and Exchange Commission. Sen, S., Bhattacharya, C.B., 2001. Does doing good always lead to doing better? Consumer reactions
to corporate social responsibility. Journal of Marketing Research 38, 225–243. Sen, S., Bhattacharya, C.B., Korschun, D., 2006. The role of corporate social responsibility in
strengthening multiple stakeholder relationships: A field experiment. Journal of the Academy of Marketing Science 34, 158–166.
Servaes, H., Tamayo, A., 2013. The impact of corporate social responsibility on firm value: The role of customer awareness. Management Science 59, 1045–1061.
Skinner, D.J., 1994. Why firms voluntarily disclose bad news. Journal of Accounting Research 32, 38–60.
Thomas, W., Maguire, A., 2016. SEC Studying Change of Regulation S-K to Require ESG Disclosures. Willkie Farr & Gallagher LLP.
Trudel, R., Cotte, J., 2009. Does it pay to be good? MIT Sloan Management Review 50, 61–68. Valta, P., 2012. Competition and the cost of debt. Journal of Financial Economics 105, 661–682. Verrecchia, R.E., 1983. Discretionary disclosure. Journal of Accounting and Economics 5, 179–194. Verrecchia, R.E., 2001. Essays on disclosure. Journal of Accounting and Economics 32, 97–180. Verrecchia, R.E., Weber, J., 2006. Redacted disclosure. Journal of Accounting Research 44, 791–814. You, H., Zhang, X., 2009. Financial reporting complexity and investor underreaction to 10-K
information. Review of Accounting Studies 14, 559–586. Zingales, L., 2000. In search of new foundations. The Journal of Finance 55, 1623–1653.

36
Appendix A Definitions of Variables
CSR Reporting Variables Ind(CSRR) An indicator variable that equals 1 if a firm provides CSR reporting in a
given year, and 0 otherwise. Ind(CSRR_P) An indicator variable that equals 1 if a firm provides CSR reporting with
product-related content in a given year, and 0 otherwise. Num(CSRR) The frequency (or total number) of CSR reports issued by a firm in a given
year. Num(CSRR_P) The frequency (or total number) of CSR reports with product-related content
issued by a firm in a given year. Page(CSRR) The total number of pages of all CSR reporting issued by a firm in a given
year. Page(Product) The total number of pages dedicated to product-related information in a
firm’s CSR reporting issued by a firm in a given year. PMC Comp_NonPrice A PMC variable measured based on the intensity of non-price-competition
(Chen et al., 2014). It is defined as the sum of firm-level advertising expense and R&D expense divided by the sum of firm-level sales in an industry.
Comp_ProdSimilarity A PMC variable measured based on level of product similarity (Hoberg & Phillips, 2016). It is defined as the firm-by-firm pairwise similarity scores by parsing the product descriptions from the firm 10-Ks and forming word vectors for each firm to compute continuous measures of product similarity for every pair of firms in our sample in each year.
Comp_MgmPerception A PMC variable measured based on the perception of level of competition from management (Li et al., 2013). It is defined as the total number of occurrences of competition-related words (NCOMP) per 1,000 total words in the 10-K (NWORDS). NCOMP is the number of times “competition, competitor, competitive, compete, competing” occur in the 10-K, including those words with an “s” appended. NWORDS is the total number of words in the 10-K.
Comp_TariffCut A PMC variable measured based on large tariff reduction. It is defined as an indicator variable that equals 1 if the industry in which a firm operates has experienced a large import tariff reduction at time t and 0 otherwise. We define an import tariff reduction that is three times greater than the median tariff reduction as a large tariff cut. Data on tariff are collected from World Trade Organization International trade and tariff data.
Comp_Potential A PMC variable measuring the level of competition threat from potential rivals. It is defined as a factor composed of proxies for PMC from potential entrants (Li, 2010). The three components of this factor are: (1) industry-average property, plant and equipment, (2) industry-average R&D expense, and (3) industry-average capital expenditures. A higher value refers to higher level of competition threat from potential rivals.
Comp_Existing A PMC variable measuring the level of competition threat from existing rivals. It is defined as a factor composed of proxies for PMC from existing rivals (Li, 2010). These three components of this factor are: (1) the Herfindahl-Hirchman Index, (2) four-firm concentration ratio measured as the sum of market shares of the four largest firms in an industry, and (3) the total number of firms operating in an industry. Higher values refer to higher levels of competition threat from existing rivals.
Control Variables
CSRPERF A firm’s CSR performance is defined as the industry-adjusted total CSR strength scores from the six major CSR rating categories including (1) environment, (2) community, (3) human rights, (4) employee relations, (5) diversity, and (6) product obtained from the KLD Research and Analytics database.
SIZE The natural logarithm of the market value of equity.

37
LITIGATION An indicator variable that equals 1 if the firm operates in a high-litigation industry (SIC codes of 2833–2836, 3570–3577, 3600–3674, 5200–5961, and 7370), and 0 otherwise.
ROA Total return on assets measured as the ratio of income before extraordinary items over total assets.
FINANCE The amount of debt or equity capital raised by the firm scaled by total assets at the beginning of the year. The amount of debt or equity capital raised by the firm is measured as the issuance of common stock and preferred shares minus the purchase of common stock and preferred shares plus the long-term debt issuance minus the long-term debt reduction.
TOBINQ Market value of common equity plus the book value of preferred stock, book value of long-term debt and current liability, scaled by the book value of total assets.
LEVERAGE Leverage ratio, which is defined as the ratio of total debt divided by total assets.
GLOBAL An indicator variable that equals 1 if the firm reports non-zero foreign income, and 0 otherwise.
LIQUIDITY The ratio of the number of shares traded in year t-1 to the total shares outstanding at the end of the year.
FORECAST An indicator variable that equals 1 if the firm issues any management earnings forecast in a given year, and 0 otherwise.
ACCRUALS The absolute value of abnormal accruals estimated based on the modified Jones model.
FIRMAGE A measure of firm age, which is defined as the natural logarithm of the number of years that the firm has been listed in COMPUSTAT North America.
WORKCAPITAL Working capital is defined as operating assets minus operating liabilities (Nissim & Penman, 2001). Operating assets are equal to total assets minus other investments; and operating liabilities are equal to total assets minus long-term debt, debt in current liabilities, common equity, preferred stock, and minority interest.
SALESGROWTH Sale growth ratio is defined as the growth in sales in year t over sales in year t-1.
BTM Book-to-market ratio is calculated as the book value of equity divided by the market value of equity.

38
Appendix B
Examples of Product-related Contents in Voluntary Standalone CSR Disclosure
Example A
2010 CYTEC Sustainability Report Source: http://www.cytec.com/sites/default/files/files/sustainabilityreports_2010.pdf Cytec Industries Inc. (a speciality chemicals and materials technology company; NYSE: CYT) ON-GOING INNOVATION EFFORTS A Focus on Renewable Raw Materials Cytec considers sustainability as a pathway of continuous improvement wherein the products and services are developed with progressively less environmental impact - as defined by the American Institute of Chemical Engineers' Institute for Sustainability. A cross-functional group of employees has been working to increase and advance the company's use of Renewable Raw Materials (RRMs). Existing products and their raw materials were assessed for their content of renewable feedstock, and technical exchange between different businesses unveiled opportunities and ideas for new products and processes. These efforts resulted in some pioneering products, for example in Cytec's Specialty Chemicals Coating Resins business where a novel platform for sustainable polyester resins was patented. The platform uses alternative raw materials based 100 percent on recycled or renewable sources. Next to the sustainable aspect, novel performance characteristics are also achieved. To answer our customers' growing demand for RRMs, Cytec will share the RRM content of our products through the Pioneering Sustainable Change website. More generally, R&D is continuously challenged to increase the amount of RRMs in all developments to reduce products' carbon footprint and improve their sustainability index calculations.

39
Example B
2001 Social Responsibility at Birstol-Myers Squibb
Source: http://www.csrwire.com/reports/946-Bristol-Meyers-Squibb-2001-Sustainability-Report
Birstol-Myers Squibb (a global biopharmaceutical company; NYSE: BMY)
The lifeblood of any pharmaceutical company must be its pharmaceutical research pipeline. The future is built around that pipeline and the new products that can come from it. It is no wonder, then, that a company like Bristol-Myers Squibb looks at pharmaceutical research and development as an opportunity to build an environmentally sound future as well. For some time now. the company has been reviewing the EHS impacts of the new products it develops. In 2001, it went a step further, putting into place a Process Greenness Scorecard, a tool that enables its research scientists to systematically evaluate chemical processes for EHS impacts and to change those processes to make them more environmentally friendly, safer and more efficient in the use of resources. The tool enables product developers to see the impacts of their choices around the chemistry of the process and consider more sustainable alternatives. Looking across 16 arameters, a chemist or chemical engineer can use the tool to determine the effect a new or changed process will have. The goal is a high score and, if need be, to raise existing scores by doing everything from promoting the recovery and recycling of solvents to minimizing the impacts of hazardous chemical reactions. To reducing waste generation or by dealing with a host of other approaches. The Scorecard, according to Bill Sivak, director, EHS Product Technology, is just one tool in the company’s comprehensive Design for Environmental Health and Safety Through Green Chemistry program. The Green Chemistry approach is now in use at the company's Pharmaceutical Research Institute and Technical Operations development sites worldwide. "We used the Scorecard recently to assess the process for making a potentially important cardiovascular drug," Bill says. "Initially, the drug was developed using the solvent methylene chloride. However, after scoring the process, the project team decided to substitute a much more environmentally friendly solvent - ethyl acetate. As a result, the efficiency of the process also improved, increasing the yield of the product for the same amount of raw materials used. Other environmental and business improvements were made as well. It's a remarkable payback for what some might see as a simple tool.” Design for EHS is not restricted to the pharmaceutical side of the business. Mead Johnson Nutritionals has developed an approach to assess environmental impacts by using a computer model called MERGE (Managing Environmental Resources Guidance And Evaluation) developed in partnership with the Alliance for Environmental Innovation. MERGE is a PC-based software application that allows environmental considerations to be incorporated quickly and easily into the design and packaging of formulated products. Says Tom Ward, vice president, Global Supply Chain, for Mead Johnson, "When moving from metal cans to plastic containers for infant formula, we reviewed the effects within our operations, such as reduced damage during transportation and overall reduced greenhouse gas emissions. We also evaluated how the change would affect the consumer. Having an easily resealable container means parents waste less formula. That saves money, helps the environment and makes life just a little easier for new parents." Designing EHS into products, through Green Chemistry tools, packaging evaluations and life cycle assessments of product impacts, is a key milestone in Bristol-Myers Squibb's journey to sustainability.
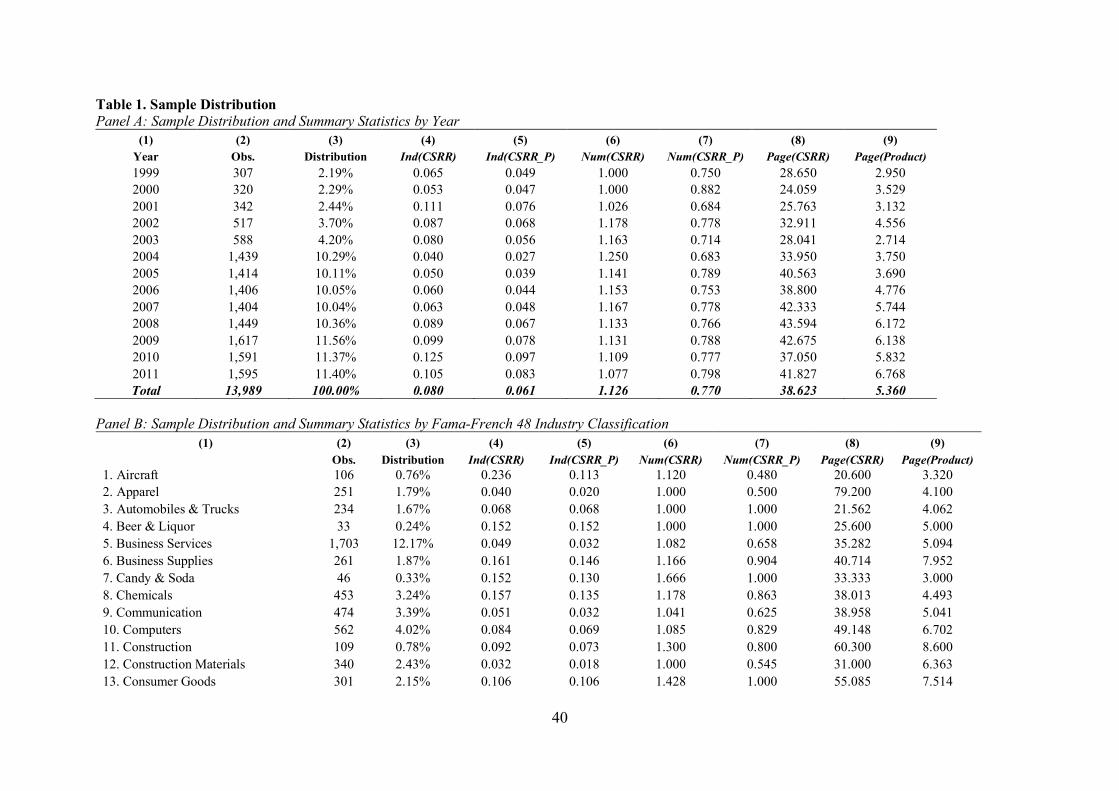
40
Table 1. Sample Distribution Panel A: Sample Distribution and Summary Statistics by Year
(1) (2) (3) (4) (5) (6) (7) (8) (9) Year Obs. Distribution Ind(CSRR) Ind(CSRR_P) Num(CSRR) Num(CSRR_P) Page(CSRR) Page(Product) 1999 307 2.19% 0.065 0.049 1.000 0.750 28.650 2.950 2000 320 2.29% 0.053 0.047 1.000 0.882 24.059 3.529 2001 342 2.44% 0.111 0.076 1.026 0.684 25.763 3.132 2002 517 3.70% 0.087 0.068 1.178 0.778 32.911 4.556 2003 588 4.20% 0.080 0.056 1.163 0.714 28.041 2.714 2004 1,439 10.29% 0.040 0.027 1.250 0.683 33.950 3.750 2005 1,414 10.11% 0.050 0.039 1.141 0.789 40.563 3.690 2006 1,406 10.05% 0.060 0.044 1.153 0.753 38.800 4.776 2007 1,404 10.04% 0.063 0.048 1.167 0.778 42.333 5.744 2008 1,449 10.36% 0.089 0.067 1.133 0.766 43.594 6.172 2009 1,617 11.56% 0.099 0.078 1.131 0.788 42.675 6.138 2010 1,591 11.37% 0.125 0.097 1.109 0.777 37.050 5.832 2011 1,595 11.40% 0.105 0.083 1.077 0.798 41.827 6.768 Total 13,989 100.00% 0.080 0.061 1.126 0.770 38.623 5.360
Panel B: Sample Distribution and Summary Statistics by Fama-French 48 Industry Classification
(1) (2) (3) (4) (5) (6) (7) (8) (9) Obs. Distribution Ind(CSRR) Ind(CSRR_P) Num(CSRR) Num(CSRR_P) Page(CSRR) Page(Product)
1. Aircraft 106 0.76% 0.236 0.113 1.120 0.480 20.600 3.320 2. Apparel 251 1.79% 0.040 0.020 1.000 0.500 79.200 4.100 3. Automobiles & Trucks 234 1.67% 0.068 0.068 1.000 1.000 21.562 4.062 4. Beer & Liquor 33 0.24% 0.152 0.152 1.000 1.000 25.600 5.000 5. Business Services 1,703 12.17% 0.049 0.032 1.082 0.658 35.282 5.094 6. Business Supplies 261 1.87% 0.161 0.146 1.166 0.904 40.714 7.952 7. Candy & Soda 46 0.33% 0.152 0.130 1.666 1.000 33.333 3.000 8. Chemicals 453 3.24% 0.157 0.135 1.178 0.863 38.013 4.493 9. Communication 474 3.39% 0.051 0.032 1.041 0.625 38.958 5.041 10. Computers 562 4.02% 0.084 0.069 1.085 0.829 49.148 6.702 11. Construction 109 0.78% 0.092 0.073 1.300 0.800 60.300 8.600 12. Construction Materials 340 2.43% 0.032 0.018 1.000 0.545 31.000 6.363 13. Consumer Goods 301 2.15% 0.106 0.106 1.428 1.000 55.085 7.514

41
14. Defense 41 0.29% 0.098 0.024 1.000 0.250 27.000 0.500 15. Electrical Equipment 199 1.42% 0.075 0.060 1.000 0.800 23.733 3.733 16. Electronic Equipment 1,044 7.46% 0.076 0.062 1.101 0.822 33.405 2.784 17. Entertainment 200 1.43% 0.040 0.000 1.000 0.000 14.375 0.000 18. Food Products 263 1.88% 0.160 0.114 1.119 0.714 32.666 8.285 19. Healthcare 263 1.88% 0.030 0.019 1.000 0.625 29.375 7.875 20. Insurance 68 0.49% 0.015 0.015 1.000 1.000 25.000 4.000 21. Machinery 714 5.10% 0.052 0.042 1.078 0.815 43.579 5.526 22. Measuring & Control Equip, 378 2.70% 0.058 0.050 1.090 0.863 43.409 6.045 23. Medical Equipment 502 3.59% 0.024 0.022 1.000 0.916 36.750 6.833 24. Non-Metal & Ind. Metal Min. 74 0.53% 0.243 0.135 1.166 0.555 59.944 3.722 25. Others 124 0.89% 0.065 0.048 1.250 0.750 42.375 10.875 26. Petroleum & Natural Gas 756 5.40% 0.116 0.095 1.045 0.818 29.113 4.636 27. Pharmaceutical Products 933 6.67% 0.088 0.062 1.168 0.710 38.650 5.433 28. Precious Metals 28 0.20% 0.357 0.107 1.500 0.300 105.300 0.600 29. Printing & Publishing 77 0.55% 0.039 0.039 1.000 1.000 18.000 2.000 30. Recreation 91 0.65% 0.077 0.033 1.285 0.428 24.857 4.428 31. Restaurants, Hotels, Motels 249 1.78% 0.080 0.068 1.200 0.850 59.200 9.200 32. Retail 1,057 7.56% 0.053 0.045 1.069 0.844 37.965 5.551 33. Rubber & Plastic Products 83 0.59% 0.048 0.036 1.000 0.750 23.000 4.750 34. Shipping Containers 65 0.46% 0.077 0.077 1.400 1.000 44.600 4.200 35. Steel Works 236 1.69% 0.064 0.059 1.133 0.933 47.466 2.133 36. Transportation 421 3.01% 0.059 0.048 1.000 0.800 41.400 4.520 37. Utilities 764 5.46% 0.190 0.148 1.144 0.779 39.200 6.655 38. Wholesale 486 3.47% 0.045 0.025 1.130 0.565 25.043 2.260
Total 13,989 100.00% 0.0800 0.061 1.126 0.769 38.623 5.360 This table reports sample distribution and the mean of major measures of CSR disclosure by year (Panel A) and by Fama-French 48 industry classification (Panel B). Only 38 industries are present in Panel B because some industries are dropped due to insufficient data to construct the measurement of competition.

42
Table 2. Descriptive Statistics and Univariate Analysis Panel A: Descriptive Statistics (N =13,989) Variables Mean Std. Dev. 25% Median 75% CSR Reporting Ind(CSRR) 0.080 0.271 0.000 0.000 0.000 Ind(CSRR_P) 0.061 0.240 0.000 0.000 0.000 Num(CSRR) 0.089 0.319 0.000 0.000 0.000 Num(CSRR_P) 0.062 0.246 0.000 0.000 0.000 Page(CSRR) 3.130 14.288 0.000 0.000 0.000 Page(Product) 0.434 2.366 0.000 0.000 0.000 Product Market Competition Comp_NonPrice 0.046 0.038 0.006 0.047 0.074 Comp_ProdSimilarity 3.742 4.851 1.290 1.985 3.912 Comp_MgmPerception 0.336 0.294 0.151 0.258 0.428 Comp_TariffCut 0.619 0.486 0.000 1.000 1.000 Control Variables CSRPERF 1.477 2.334 0.000 1.000 2.000 SIZE 7.311 1.556 6.189 7.123 8.262 LITIGATION 0.277 0.448 0.000 0.000 1.000 ROA 0.042 0.140 0.015 0.054 0.099 FINANCE 0.029 0.198 -0.043 -0.001 0.034 TOBINQ 1.818 1.423 0.954 1.369 2.160 LEVERAGE 0.213 0.206 0.021 0.190 0.326 GLOBAL 0.562 0.496 0.000 1.000 1.000 LIQUIDITY 0.939 0.100 0.911 0.998 1.000 FORECAST 0.436 0.496 0.000 0.000 1.000 ACCRUALS 0.228 0.602 0.028 0.075 0.206

43
Panel B: Univariate Analysis Comp_NonPrice
High Subgroup
(N =6,987) Low Subgroup
(N =7,002) Diff.
(High – Low) Ind(CSRR) 0.074 0.086 -0.013 *** Ind(CSRR_P) 0.056 0.065 -0.009 ** Num(CSRR) 0.083 0.096 -0.013 ** Num(CSRR_P) 0.058 0.067 -0.009 ** Page(CSRR) 2.847 3.396 -0.549 ** Page(Product) 0.371 0.497 -0.125 *** Comp_ProdSimilarity
High Subgroup
(N =6,993) Low Subgroup
(N =6,996) Diff.
(High – Low) Ind(CSRR) 0.081 0.079 0.001 Ind(CSRR_P) 0.059 0.062 -0.002 Num(CSRR) 0.089 0.090 -0.001 Num(CSRR_P) 0.060 0.065 -0.005 Page(CSRR) 2.947 3.297 -0.351 Page(Product) 0.388 0.481 -0.093 ** Comp_MgmPerception
High Subgroup
(N =3,438) Low Subgroup
(N =3,439) Diff.
(High – Low) Ind(CSRR) 0.051 0.101 -0.049 *** Ind(CSRR_P) 0.038 0.074 -0.036 *** Num(CSRR) 0.057 0.116 -0.059 *** Num(CSRR_P) 0.039 0.076 -0.037 *** Page(CSRR) 1.796 4.139 -2.343 *** Page(Product) 0.251 0.489 -0.238 *** Comp_TariffCut
High Subgroup
(N =814) Low Subgroup
(N =501) Diff.
(High – Low)
Ind(CSRR) 0.069 0.156 -0.086 ** Ind(CSRR_P) 0.044 0.156 -0.111 *** Num(CSRR) 0.076 0.156 -0.079 * Num(CSRR_P) 0.052 0.156 -0.104 *** Page(CSRR) 2.245 4.489 -2.244 Page(Product) 0.174 0.644 -0.470 ***
This table presents the summary statistics for variables used in the regression analyses (Panel A) and the univariate analysis of difference in the major CSR reporting measures across high and low competition subgroups (Panel B), which are classified based on the median value of the competition variables for the full sample. ***, **, and * indicate that the difference between the two groups is statistically significant at the 1%, 5%, and 10% level, respectively.

44
Table 3. Correlation Matrix among Selected Variables (Pearson\Spearman)
1 2 3 4 5 6 7 8 9 10 11 12 13 14 15 16 17 18 19 20 21 1 Ind(CSRR) 1.00 0.99 0.85 0.85 0.84 0.01 0.02 -0.13 -0.03 0.33 0.34 0.00 0.04 -0.06 -0.02 0.07 0.11 -0.14 0.06 -0.03 2 Num(CSRR) 0.94 0.99 0.85 0.85 0.84 0.01 0.02 -0.13 -0.03 0.33 0.34 0.00 0.04 -0.06 -0.02 0.07 0.11 -0.14 0.06 -0.03 3 Page(CSRR) 0.73 0.77 0.85 0.85 0.85 0.01 0.01 -0.13 -0.04 0.33 0.33 0.00 0.04 -0.06 -0.02 0.07 0.10 -0.14 0.06 -0.03 4 Ind(CSRR_P) 0.85 0.82 0.66 1.00 0.99 0.01 0.01 -0.11 -0.06 0.30 0.28 0.00 0.03 -0.07 -0.03 0.07 0.10 -0.14 0.06 -0.04 5 Num(CSRR_P) 0.84 0.82 0.64 0.99 0.99 0.01 0.01 -0.11 -0.06 0.30 0.28 0.00 0.03 -0.07 -0.03 0.07 0.10 -0.14 0.06 -0.04 6 Page(Product) 0.62 0.63 0.65 0.73 0.71 0.01 0.01 -0.11 -0.07 0.30 0.28 0.00 0.03 -0.06 -0.03 0.07 0.10 -0.13 0.06 -0.04 7 Comp_NonPrice 0.02 0.03 0.02 0.02 0.02 0.02 -0.07 0.24 -0.10 0.07 -0.01 0.39 0.08 -0.07 0.34 -0.25 0.38 -0.08 0.05 0.37 8 Comp_ProdSimilarity -0.02 -0.02 -0.02 -0.02 -0.02 -0.02 0.12 0.08 -0.02 0.06 0.10 0.22 -0.10 0.12 0.04 0.03 -0.18 0.21 -0.07 0.03 9 Comp_MgmPerception -0.09 -0.09 -0.08 -0.08 -0.08 -0.06 0.17 0.05 -0.10 -0.10 -0.15 0.16 0.02 0.04 0.21 -0.18 0.01 0.10 -0.04 0.13 10 Comp_TariffCut -0.03 -0.02 -0.02 -0.06 -0.06 -0.06 -0.11 -0.01 -0.11 -0.11 -0.17 -0.19 -0.12 0.02 -0.16 0.03 -0.08 -0.02 0.06 0.05 11 CSRPERF 0.40 0.41 0.36 0.37 0.37 0.33 0.11 0.00 -0.06 -0.08 0.48 0.06 0.02 -0.12 -0.02 0.08 0.14 -0.15 0.10 -0.04 12 SIZE 0.30 0.29 0.20 0.25 0.26 0.17 0.04 0.03 -0.02 -0.16 0.49 0.02 0.24 -0.10 0.21 0.16 0.16 -0.18 0.18 -0.08 13 LITIGATION 0.00 0.01 0.00 0.00 0.00 0.01 0.39 0.30 0.10 -0.19 0.08 0.11 0.01 0.00 0.17 -0.16 0.05 0.06 0.02 0.08 14 ROA 0.04 0.04 0.02 0.03 0.03 0.02 0.00 -0.13 0.03 -0.05 0.05 0.12 -0.01 -0.11 0.54 -0.30 0.06 -0.08 0.10 0.02 15 FINANCE -0.06 -0.06 -0.04 -0.06 -0.06 -0.05 -0.02 0.13 0.03 0.04 -0.11 -0.06 -0.01 -0.09 -0.02 0.13 -0.11 0.21 -0.06 0.06 16 TOBINQ -0.02 -0.01 -0.01 -0.02 -0.02 -0.01 0.30 0.16 0.18 -0.24 0.03 0.18 0.22 0.33 0.05 -0.31 0.08 0.07 0.02 0.16 17 LEVERAGE 0.04 0.04 0.03 0.04 0.04 0.04 -0.20 0.03 -0.10 0.03 0.03 -0.02 -0.13 -0.23 0.15 -0.23 -0.14 -0.10 0.06 -0.14 18 GLOBAL 0.11 0.11 0.09 0.10 0.10 0.07 0.36 -0.13 -0.01 -0.08 0.15 0.11 0.05 0.03 -0.08 0.05 -0.15 -0.17 0.04 0.09 19 LIQUIDITY -0.13 -0.12 -0.09 -0.12 -0.13 -0.07 -0.08 0.18 0.06 -0.05 -0.16 -0.09 0.04 -0.08 0.16 0.05 -0.07 -0.13 -0.08 0.06 20 FORECAST 0.06 0.05 0.04 0.06 0.05 0.06 0.07 -0.08 -0.05 0.06 0.11 0.06 0.02 0.09 -0.04 0.01 0.01 0.04 -0.06 -0.01 21 ACCRUALS 0.00 0.01 0.00 -0.01 -0.01 -0.02 0.25 0.03 0.03 0.06 0.00 -0.01 0.05 -0.01 0.05 0.05 0.01 0.05 0.02 -0.02 This table reports a correlation matrix of the variables. Pearson's correlation coefficients are shown in the lower triangle, including the diagonal, while Spearman's rank correlations appear above the diagonal. Bold indicates that the correlations are statistically significant at the 5%. Refer to Appendix A for variable definitions.

45
Table 4. Non-Price Competition and CSR Disclosure (1) (2) (3) (4) (5) (6) Dep. Var. Ind(CSRR) Ind(CSRR_P) Num(CSRR) Num(CSRR_P) Page(CSRR) Page(Product) Model Logistic Logistic Ordered Logit Ordered Logit Ordered Logit Ordered Logit Comp_NonPrice -8.8628 -15.1509 -7.8591 -14.7948 -8.4199 -11.9878
(-1.98)** (-2.25)** (-1.86)* (-2.42)** (-1.63)* (-1.89)* CSRPERF 0.3775 0.3804 0.3708 0.3818 0.3699 0.3760
(9.10)*** (10.12)*** (9.68)*** (10.78)*** (9.38)*** (12.06)*** SIZE 0.0001 0.0001 0.0001 0.0001 0.0001 0.0001
(3.67)*** (1.78)* (3.60)*** (1.93)* (2.12)** (1.07) LITIGATION -0.0877 -0.2693 -0.0992 -0.3089 0.1040 -0.0947
(-0.31) (-0.84) (-0.367) (-0.97) (0.34) (-0.28) ROA 1.7111 1.2687 1.5848 1.1974 1.5768 1.1568
(3.52)*** (2.92)*** (3.43)*** (2.76)*** (3.80)*** (2.78)*** FINANCE -0.9040 -1.3763 -0.8775 -1.4090 -0.9976 -1.4516
(-2.52)** (-4.54)*** (-2.46)** (-4.79)*** (-3.37)*** (-4.97)*** TOBINQ -0.1255 -0.0647 -0.0904 -0.0611 -0.0691 -0.0516
(-1.69)* (-0.74) (-1.40) (-0.71) (-1.08) (-0.62) LEVERAGE 0.9154 0.8792 0.8952 0.8107 0.8774 0.9023
(3.19)*** (2.70)*** (3.22)*** (2.46)** (3.14)*** (2.92)*** GLOBAL 0.7597 0.7813 0.7977 0.8120 0.7800 0.8225
(2.91)*** (2.58)*** (3.15)*** (2.77)*** (2.95)*** (2.59)*** LIQUIDITY -1.7044 -1.4853 -1.4097 -1.5120 -1.1172 -1.0040
(-2.49)** (-1.83)* (-2.40)** (-1.99)** (-1.90)* (-1.38) FORECAST 0.3624 0.3435 0.3445 0.3146 0.3678 0.3791
(3.52)*** (2.69)*** (3.43)*** (2.54)** (3.63)*** (2.87)*** ACCRUALS 0.0352 0.0824 0.0417 0.0894 0.0444 0.0868
(1.29) (1.38) (1.51) (1.57) (1.47) (1.56)
Observations 13,989 13,989 13,989 13,989 13,989 13,989 Pseudo R2 0.296 0.288 0.267 0.284 0.129 0.166 This table reports the regression results for testing the effect of non-price competition (Comp_NonPrice) on voluntary CSR reporting. All continuous variables are winsorized at the 1st and the 99th percentiles. All regressions include industry and year fixed effects and robust standard errors clustered by industry and year. ***, **, and * indicate that the estimated coefficients are statistically significant at the 1%, 5%, and 10% level, respectively. Refer to Appendix A for variable definitions.

46
Table 5. Product Similarity and CSR Disclosure (1) (2) (3) (4) (5) (6) Dep. Var. Ind(CSRR) Ind(CSRR_P) Num(CSRR) Num(CSRR_P) Page(CSRR) Page(Product) Model Logistic Logistic Ordered Logit Ordered Logit Ordered Logit Ordered Logit Comp_ProdSimilarity -0.0563 -0.0746 -0.0467 -0.0749 -0.0466 -0.0776
(-2.08)** (-2.99)*** (-1.74)* (-3.05)*** (-1.88)* (-2.90)*** CSRPERF 0.3754 0.3773 0.3692 0.3785 0.3681 0.3756
(9.04)*** (10.16)*** (9.56)*** (10.77)*** (9.23)*** (11.93)*** SIZE 0.0001 0.0001 0.0001 0.0001 0.0001 0.0001
(3.74)*** (1.62) (3.28)*** (1.74)* (1.93)* (0.81) LITIGATION -0.0513 -0.2095 -0.0690 -0.2485 0.1242 -0.0348
(-0.16) (-0.56) (-0.23) (-0.67) (0.37) (-0.09) ROA 1.5244 1.0350 1.4168 0.9578 1.4193 0.9190
(2.65)*** (1.93)* (2.59)*** (1.76)* (2.81)*** (1.79)* FINANCE -0.8808 -1.3678 -0.8560 -1.4068 -0.9812 -1.4401
(-2.38)** (-4.36)*** (-2.31)** (-4.66)*** (-3.19)*** (-4.73)*** TOBINQ -0.1217 -0.0667 -0.0862 -0.0624 -0.0657 -0.0515
(-1.58) (-0.73) (-1.28) (-0.69) (-0.97) (-0.59) LEVERAGE 0.9030 0.8494 0.8843 0.7779 0.8646 0.8855
(3.16)*** (2.59)*** (3.19)*** (2.33)** (3.10)*** (2.88)*** GLOBAL 0.7160 0.7238 0.7618 0.7539 0.7434 0.7684
(2.86)*** (2.53)** (3.12)*** (2.74)*** (2.92)*** (2.55)** LIQUIDITY -1.5918 -1.3458 -1.3152 -1.3710 -1.0428 -0.8668
(-2.40)** (-1.68)* (-2.30)** (-1.83)* (-1.81)* (-1.20) FORECAST 0.3367 0.3138 0.3230 0.2858 0.3453 0.3479
(3.38)*** (2.52)** (3.31)*** (2.38)** (3.50)*** (2.66)*** ACCRUALS 0.0246 0.0663 0.0330 0.0736 0.0361 0.0766
(0.71) (0.96) (1.00) (1.11) (0.99) (1.20)
Observations 13,989 13,989 13,989 13,989 13,989 13,989 Pseudo R2 0.297 0.288 0.268 0.285 0.129 0.167 This table reports the regression results for testing the effect of product similarity on voluntary CSR reporting. All firm-level continuous variables are winsorized at the 1st and the 99th percentiles. All regressions include industry and year fixed effects and robust standard errors clustered by industry and year. ***, **, and * indicate that the estimated coefficients are statistically significant at the 1%, 5%, and 10% level, respectively. Refer to Appendix A for variable definitions.

47
Table 6. Manager Perception on Competition and CSR Disclosure (1) (2) (3) (4) (5) (6) Dep. Var. Ind(CSRR) Ind(CSRR_P) Num(CSRR) Num(CSRR_P) Page(CSRR) Page(Product) Model Logistic Logistic Ordered Logit Ordered Logit Ordered Logit Ordered Logit Comp_MgmPerception -0.8968 -0.7753 -0.8071 -0.7738 -0.8070 -0.5242
(-2.17)** (-2.02)** (-2.02)** (-2.04)** (-2.04)** (-1.27) CSRPERF 0.3775 0.3777 0.3889 0.3748 0.4037 0.3925
(8.96)*** (21.52)*** (9.74)*** (23.53)*** (10.89)*** (11.15)*** SIZE 0.0001 0.0001 0.0001 0.0001 0.0001 -0.0001
(2.19)** (1.44) (1.96)** (1.50) (0.48) (-0.23) LITIGATION -0.8176 -1.1318 -0.7115 -1.1220 -0.7434 -0.9373
(-1.24) (-3.44)*** (-1.20) (-3.47)*** (-1.21) (-1.45) ROA 1.2258 0.4085 1.0622 0.3964 1.0698 0.2456
(1.41) (0.45) (1.40) (0.44) (1.37) (0.31) FINANCE -0.8328 -1.7517 -0.7842 -1.7605 -0.8717 -1.5283
(-1.31) (-6.09)*** (-1.31) (-6.06)*** (-1.70)* (-3.42)*** TOBINQ -0.0666 -0.0291 -0.0387 -0.0297 -0.0243 -0.0135
(-0.79) (-0.50) (-0.52) (-0.51) (-0.34) (-0.17) LEVERAGE 0.9521 1.1924 0.9474 1.1800 1.0150 1.3083
(1.84)* (4.67)*** (1.86)* (4.45)*** (1.98)** (2.26)** GLOBAL 1.0250 1.1509 1.0353 1.1530 1.0615 1.2621
(3.41)*** (4.78)*** (3.65)*** (4.84)*** (3.76)*** (3.44)*** LIQUIDITY -2.5666 -2.7944 -2.1248 -2.7388 -1.8399 -2.1250
(-2.36)** (-6.40)*** (-2.14)** (-6.40)*** (-1.91)* (-1.64) FORECAST 0.1920 0.2618 0.1729 0.2558 0.2284 0.2906
(1.47) (1.72)* (1.23) (1.71)* (1.71)* (1.56) ACCRUALS 0.0620 -0.0879 0.0644 -0.0899 0.0629 -0.0904
(1.03) (-0.68) (1.52) (-0.72) (2.15)** (-0.37)
Observations 6,877 6,877 6,877 6,877 6,877 6,877 Pseudo R2 0.302 0.304 0.270 0.296 0.143 0.181
This table reports the regression results for testing the effect of management’s perceptions of the intensity of the competition they face on voluntary CSR reporting. All firm-level continuous variables are winsorized at the 1st and the 99th percentiles. All regressions include industry and year fixed effects and robust standard errors clustered by industry and year. ***, **, and * indicate that the estimated coefficients are statistically significant at the 1%, 5%, and 10% level, respectively. Refer to Appendix A for variable definitions.

48
Table 7. Tariff Cut and CSR Disclosure (1) (2) (3) (4) (5) (6) Dep. Var. Ind(CSRR) Ind(CSRR_P) Num(CSRR) Num(CSRR_P) Page(CSRR) Page(Product) Model Logistic Logistic Ordered Logit Ordered Logit Ordered Logit Ordered Logit Comp_TariffCut -1.7972 -2.3380 -1.7244 -2.3191 -1.7833 -2.2017
(-2.29)** (-2.50)** (-2.31)** (-2.54)** (-2.47)** (-2.90)*** CSRPERF 0.4534 0.3939 0.4967 0.3938 0.5191 0.4051
(5.79)*** (4.96)*** (5.77)*** (5.08)*** (5.89)*** (4.38)*** SIZE 0.0001 0.0001 0.0001 0.0001 -0.0001 -0.0001
(1.12) (0.14) (0.71) (0.16) (-0.20) (-0.16) LITIGATION -0.1600 -1.1336 -0.0991 -1.1553 -0.0773 -0.9061
(-0.24) (-1.42) (-0.15) (-1.51) (-0.10) (-1.03) ROA -0.3558 -0.2982 -0.4507 -0.3050 -0.3899 -0.2546
(-0.36) (-0.16) (-0.46) (-0.16) (-0.37) (-0.22) FINANCE -0.1252 -1.1492 -0.0187 -1.2628 -0.0540 -0.9720
(-0.16) (-1.11) (-0.02) (-1.09) (-0.08) (-0.89) TOBINQ -0.0619 0.0706 -0.0355 0.0759 0.0216 0.0716
(-0.40) (0.43) (-0.24) (0.47) (0.17) (0.58) LEVERAGE -0.0080 -0.1143 -0.1718 -0.1519 0.0284 0.2671
(-0.01) (-0.07) (-0.14) (-0.10) (0.02) (0.19) GLOBAL 1.1229 1.2935 1.0607 1.2903 1.2229 1.1337
(2.65)*** (2.70)*** (2.36)** (2.89)*** (2.65)*** (1.84)* LIQUIDITY -3.1548 -3.0741 -3.0765 -2.8758 -1.9745 -2.7891
(-2.06)** (-1.45) (-2.02)** (-1.36) (-1.36) (-1.64) FORECAST -0.1411 -0.3586 -0.2908 -0.3340 -0.0617 -0.3855
(-0.40) (-1.15) (-0.79) (-1.03) (-0.18) (-1.04) ACCRUALS -0.1543 -0.2729 -0.1302 -0.3195 -0.1599 -0.0082
(-0.37) (-0.59) (-0.31) (-5.97)*** (-0.39) (-0.02)
Observations 1,315 1,315 1,315 1,315 1,315 1,315 Pseudo R2 0.388 0.330 0.361 0.311 0.197 0.200
This table reports the regression results for testing the effect of tariff deduction on voluntary CSR reporting. All firm-level continuous variables are winsorized at the 1st and the 99th percentiles. All regressions include industry and year fixed effects and robust standard errors clustered by industry and year. ***, **, and * indicate that the estimated coefficients are statistically significant at the 1%, 5%, and 10% level, respectively. Refer to Appendix A for variable definitions.

49
Table 8. CSR Disclosure and Future Sales Revenue (1) (2) (3) (4) (5) (6) Dep. Var. SALES t+1 SALES t+2 SALES t+3 SALES t+1 SALES t+2 SALES t+3 Model OLS OLS OLS OLS OLS OLS Ratio(Product/Total) 0.0375 0.0279 0.0136
(5.95)*** (6.02)*** (2.72)*** Ratio(Product/Total)_First 0.0654 0.0401 0.0248 (4.25)*** (2.48)** (1.14) Ind(CSRR) 0.0942 0.0970 0.0965 0.0966 0.0995 0.0973
(2.17)** (2.38)** (2.68)*** (2.17)** (2.36)** (2.68)*** CSRPERF 0.0017 0.0012 0.0013 0.0017 0.0013 0.0013
(0.34) (0.22) (0.24) (0.35) (0.23) (0.24) WORKCAPITAL 0.5031 0.4247 0.3806 0.5035 0.4249 0.3807
(1.21) (0.98) (0.88) (1.21) (0.98) (0.88) SALESGROWTH -0.0001 -0.0000 -0.0001 -0.0001 -0.0000 -0.0001
(-3.16)*** (-1.78)* (-2.26)** (-3.16)*** (-1.77)* (-2.25)** SIZE -0.0556 -0.0584 -0.0607 -0.0555 -0.0584 -0.0607
(-3.79)*** (-3.62)*** (-3.68)*** (-3.78)*** (-3.61)*** (-3.68)*** LEVERAGE -0.3182 -0.3287 -0.3334 -0.3191 -0.3294 -0.3338
(-2.75)*** (-2.67)*** (-2.53)** (-2.75)*** (-2.68)*** (-2.53)** ROA 0.2387 0.0857 0.0584 0.2384 0.0854 0.0583
(1.98)** (0.68) (0.49) (1.98)** (0.68) (0.49) BTM -0.0002 -0.0002 -0.0001 -0.0002 -0.0002 -0.0001
(-8.63)*** (-7.71)*** (-6.93)*** (-8.61)*** (-7.70)*** (-6.92)*** RDEXP -0.5239 -0.7574 -0.8829 -0.5237 -0.7573 -0.8829
(-1.82)* (-2.61)*** (-3.07)*** (-1.82)* (-2.61)*** (-3.07)*** ADEXP 2.0263 1.9550 1.8312 2.0254 1.9544 1.8308
(4.19)*** (4.54)*** (5.18)*** (4.19)*** (4.54)*** (5.18)*** FIRMAGE 0.0538 0.0503 0.0438 0.0540 0.0504 0.0438
(1.35) (1.29) (1.12) (1.36) (1.29) (1.12) Observations 13,262 12,575 11,976 13,262 12,575 11,976 Adj. R-square 0.438 0.436 0.436 0.438 0.436 0.436
This table reports the regression results for testing the effect of disclosure of product-related information in CSR reporting on future operating performance. All firm-level continuous variables are winsorized at the 1st and the 99th percentiles. All regressions include industry and year fixed effects and robust standard errors clustered by industry and year. ***, **, and * indicate that the estimated coefficients are statistically significant at the 1%, 5%, and 10% level, respectively. Ratio(Product/Total) is the ratio of total number of pages dedicated to product-related information on a CSR disclosure over the total number of pages of a CSR disclosure. Ratio(Product/Total)_First is the ratio of total number of pages dedicated to product-related information on a CSR disclosure over the total number of pages of a CSR disclosure with product-related information for the first time during our sample period. Refer to Appendix A for variable definitions of all other variables.

50
Table 9. Product Market Competition and Quality of CSR Reporting (1) (2) (3) (4) (5) (6) (7) (8) Dep. Var. CSR_Assurance GRI_Report CSR_Assurance GRI_Report CSR_Assurance GRI_Report CSR_Assurance GRI_Report Model Logistic Logistic Logistic Logistic Logistic Logistic Logistic Logistic Comp_NonPrice -40.0615 11.7618
(-4.42)*** (0.99) Comp_ProdSimilarity -0.0639 -0.0590
(-2.35)** (-2.71)*** Comp_MgmPerception -2.2570 -1.3269
(-2.03)** (-2.66)*** Comp_TariffCut -1.3812 -1.6431
(-1.40) (-2.89)*** CSRPERF 0.3589 0.3788 0.3519 0.3771 0.4769 0.4442 0.7685 0.5515
(5.49)*** (17.05)*** (7.73)*** (17.14)*** (4.23)*** (19.05)*** (4.31)*** (4.80)*** SIZE 0.0000 0.0000 0.0000 0.0000 0.0000 0.0000 -0.0000 0.0000
(0.56) (2.79)*** (1.69)* (2.59)*** (0.74) (1.28) (-1.07) (1.08) LITIGATION 2.0498 0.6245 2.3857 0.6687 3.7699 0.2599 -15.6425 -1.0165
(1.53) (1.70)* (2.50)** (1.72)* (2.10)** (0.59) (-0.00) (-1.47) ROA -2.3499 0.6115 -2.9106 0.3533 -3.5168 1.0385 -2.3320 1.6886
(-2.05)** (1.02) (-2.75)*** (0.57) (-2.62)*** (2.54)** (-0.51) (0.43) FINANCE -0.5944 -0.6958 -0.5365 -0.7264 -1.8383 -0.3284 -0.2970 -1.8082
(-0.56) (-1.34) (-0.58) (-1.30) (-0.98) (-0.30) (-0.08) (-0.51) TOBINQ 0.1461 -0.0737 0.1583 -0.0395 0.1079 -0.0693 0.3364 -0.1104
(1.02) (-1.07) (1.33) (-0.59) (0.45) (-1.95)* (1.02) (-0.42) LEVERAGE -2.8481 -0.6398 -2.8010 -0.7353 0.0960 -0.6517 -0.9889 0.5371
(-1.59) (-0.94) (-3.02)*** (-1.09) (0.04) (-0.79) (-0.23) (0.21) GLOBAL 0.1744 0.3604 0.1172 0.3657 0.4204 0.8065 0.7160 17.7190
(0.34) (1.60) (0.44) (1.61) (0.47) (13.66)*** (0.47) (0.00) LIQUIDITY -0.3800 -0.2669 -0.2601 -0.1427 2.8671 -0.7944 -3.8888 10.8342
(-0.33) (-0.33) (-0.44) (-0.18) (0.78) (-0.99) (-0.88) (2.38)** FORECAST -0.0945 -0.1037 -0.1045 -0.1357 -0.0282 -0.4321 -0.8117 -1.8819
(-0.26) (-0.56) (-0.95) (-0.75) (-0.05) (-4.33)*** (-0.82) (-3.08)*** ACCRUALS 0.1702 0.2073 0.1822 0.2025 0.8693 0.6698 0.8338 0.2073
(2.63)*** (3.63)*** (2.97)*** (3.56)*** (5.36)*** (3.16)*** (1.76)* (0.59) Observations 4,087 4,087 4,087 4,087 2,074 2,074 612 612 Pseudo R2 0.4073 0.4143 0.4054 0.4152 0.4688 0.4688 0.5407 0.5724
This table reports the logistic regression results for the effect of competition on the assurance of CSR reporting and the adoption of Global Reporting Initiative (GRI) guidelines. CSR_Assurance is an indicator variable that equals 1 if a firm publishes a standalone CSR report with external assurance in a given year and zero otherwise. GRI_Report is an indicator variable that equals 1 if a firm publishes a standalone CSR report in accordance with GRI guidelines in a given year and zero otherwise. Other variables are defined in Appendix A. All firm-level continuous variables are winsorized at the 1st and the 99th percentiles. All regressions include industry and year fixed effects and robust standard errors clustered by industry and year. ***, **, and * indicate that the estimated coefficients are statistically significant at the 1%, 5%, and 10% level, respectively.

51
Table 10. Competition from Potential versus Existing Rivals and CSR Disclosure (1) (2) (3) (4) (5) (6) Dep. Var. Ind(CSRR) Ind(CSRR_P) Num(CSRR) Num(CSRR_P) Page(CSRR) Page(Product) Model Logistic Logistic Ordered Logit Ordered Logit Ordered Logit Ordered Logit Comp_Potential -0.1729 -0.1889 -0.1569 -0.1870 -0.1327 -0.1758
(-3.24)*** (-3.95)*** (-2.91)*** (-3.94)*** (-2.37)** (-3.74)*** Comp_Existing -0.0232 -0.0374 -0.0342 -0.0446 -0.0512 -0.0399
(-0.24) (-0.33) (-0.37) (-0.40) (-0.54) (-0.36) CSRPERF 0.3726 0.3784 0.3681 0.3757 0.3669 0.3729
(8.83)*** (10.08)*** (9.47)*** (10.53)*** (9.13)*** (11.96)*** SIZE 0.0001 0.0001 0.0001 0.0000 0.0001 0.0002
(3.30)*** (1.23) (2.79)*** (1.23) (1.64) (0.15) LITIGATION -0.1426 -0.3486 -0.1403 -0.3537 0.0618 -0.1412
(-0.48) (-0.99) (-0.50) (-1.02) (0.19) (-0.38) ROA 1.6366 1.1529 1.5281 1.1200 1.5212 1.0931
(3.56)*** (2.77)*** (3.47)*** (2.71)*** (3.87)*** (2.78)*** FINANCE -0.9217 -1.4287 -0.8934 -1.4342 -1.0117 -1.4647
(-2.66)*** (-4.86)*** (-2.58)*** (-4.93)*** (-3.52)*** (-5.10)*** TOBINQ -0.1098 -0.0528 -0.0755 -0.0489 -0.0574 -0.0366
(-1.61) (-0.67) (-1.25) (-0.63) (-0.96) (-0.48) LEVERAGE 0.8891 0.8055 0.8805 0.7808 0.8670 0.8811
(3.30)*** (2.59)*** (3.40)*** (2.49)** (3.33)*** (3.15)*** GLOBAL 0.7916 0.8415 0.8222 0.8454 0.7885 0.8548
(2.98)*** (2.77)*** (3.20)*** (2.82)*** (2.94)*** (2.66)*** LIQUIDITY -1.5718 -1.3489 -1.2706 -1.3377 -1.0003 -0.8239
(-2.59)*** (-1.96)** (-2.42)** (-2.03)** (-1.89)* (-1.30) FORECAST 0.3590 0.3170 0.3438 0.3122 0.3657 0.3792
(3.68)*** (2.61)*** (3.58)*** (2.57)** (3.70)*** (2.90)*** ACCRUALS 0.0234 0.0697 0.0322 0.0730 0.0351 0.0744
(0.71) (1.04) (1.02) (1.12) (0.97) (1.18) Observations 13,989 13,989 13,989 13,989 13,989 13,989 Pseudo R2 0.298 0.294 0.269 0.287 0.130 0.168
This table reports the regression results for testing the effect of industry-level product market competition on voluntary CSR reporting. All continuous variables are winsorized at the 1st and the 99th percentiles. All regressions include industry and year fixed effects and robust standard errors clustered by industry and year. ***, **, and * indicate that the estimated coefficients are statistically significant at the 1%, 5%, and 10% level, respectively. Refer to Appendix A for variable definitions.