produce for better health annual conference macro trends
TRANSCRIPT
Copyright 2013. The NPD Group, Inc. All Rights Reserved. This presentation is Proprietary
and Confidential and may not be disclosed in any manner, in whole or in part, to any third
party without the express written consent of NPD.
Produce for Better Health
Annual Conference
Macro Trends The NPD Group
March 14, 2013
1

Background Regarding The Insights
The NPD Group, Inc. | Proprietary and Confidential
NPD provides syndicated and custom primary research to companies
involved in the food and beverage industry.
Two primary syndicated survey’s were used:
National Eating Trends- 14 day diary from primary respondent in HH
SnackTrack- yesterday snacking behavior for RTE foods (no cooking)
Other sources of data from NPD’s supplemental services
Topical Reports
Snacking in America Report
A Market for Functional Foods
Generation Mom
NET Follow Up Surveys
HealthTrack
Nutrient Intake

Home is the source of most of our meals and snacks
Home 80%
Foodservice
19%
Source
Unknown 1%
% of Occasions by Where Obtained
Note: This excludes meal skipping
Source: NPD’s Eating Patterns in America - Year Ending Feb. 2012: PBH 2013 CONFERENCE: NOT FOR ADDITIONAL DISTRIBUTION
The NPD Group, Inc. | Proprietary and Confidential

Sourcing meals from home has become more important in recent years
78.0% 77.5%
77.0% 76.9% 77.5%
77.0% 77.0% 77.5% 77.5%
77.1% 77.0% 77.4% 77.4%
77.9%
79.0% 79.3% 79.8%
'96 '97 '98 '99 '00 '01 '02 '03 '04 '05 '06 '07 '08 '09 '10 '11 '12
Percent of Occasions Coming from Home Supply
Source: NPD’s Eating Patterns in America PBH 2013 CONFERENCE: NOT FOR ADDITIONAL DISTRIBUTION
The NPD Group, Inc. | Proprietary and Confidential
Note: This excludes meal skipping

Fruit tops the list of foods and beverages consumed most often from the home
Top items
% of Occasions – Consumed In the home or Carried from Home
5
1. Fruit
2. Sandwiches (excluding frozen)
3. Milk (excluding hot chocolate)
4. Coffee
5. Vegetables
6. Carbonated Soft Drink
7. RTE Cereal
8. 100% Fruit Juice
9. Tea
10. Bread
The NPD Group, Inc. | Proprietary and Confidential
Source: NPD's National Eating Trends - 2 years through Nov. 2012PBH 2013 CONFERENCE: NOT FOR ADDITIONAL DISTRIBUTION
end dishes

The majority of the population consume fruits, vegetables or 100% fruit juice every day
Consume Do not
consume
% of Individuals Who Consume on a Typical Day
In the Home or Carried from Home
Source: NPD's National Eating Trends - 2 years through Nov. 2012 PBH 2013 CONFERENCE: NOT FOR ADDITIONAL DISTRIBUTION
The NPD Group, Inc. | Proprietary and Confidential
All forms and
uses including
juices

Among kids, milk edges out fruit as the top item
Top Items
% of Occasions – Consumed In the home or Carried from Home
7 The NPD Group, Inc. | Proprietary and Confidential
Source: NPD's National Eating Trends - 2 years through Nov. 2012 PBH 2013 CONFERENCE: NOT FOR ADDITIONAL DISTRIBUTION
1. Milk (excluding hot chocolate)
2. Fruit
3. Sandwiches (excluding frozen)
4. RTE Cereal
5. 100% Fruit Juice
6. Vegetables
Kids <18 yrs old
end dishes

… for adults, coffee is king
Top Items
% of Occasions – Consumed In the home or Carried from Home
8
1. Coffee
2. Sandwiches (excluding frozen)
3. Fruit
4. Carbonated Soft Drink
5. Vegetables
6. Milk (excluding hot chocolate)
7. Tea
8. RTE Cereal
9. 100% Fruit Juice
The NPD Group, Inc. | Proprietary and Confidential
Source: NPD's National Eating Trends - 2 years through Nov. 2012PBH 2013 CONFERENCE: NOT FOR ADDITIONAL DISTRIBUTION
1. Milk (excluding hot chocolate)
2. Fruit
3. Sandwiches (excluding frozen)
4. RTE Cereal
5. 100% Fruit Juice
6. Vegetables
Adults 18+ yrs old Kids <18 yrs old
end dishes

Fruit is among the top growing items
9
1. Yogurt (excluding frozen)
2. Fruit
3. Pizza
4. Tea
5. Bars (e.g. granola, energy)
Top Growing Items During Past Decade (2012 – 2003)
Change in % of Occasions – Consumed In the home or Carried from Home
Source: NPD's National Eating Trends - 2 years through Nov. PBH 2013 CONFERENCE: NOT FOR ADDITIONAL DISTRIBUTION
end dishes
The NPD Group, Inc. | Proprietary and Confidential

Over the long term, consumption of fruit is up somewhat while 100% juice consumption is down
2002 2003 2004 2005 2006 2007 2008 2009 2010 2011 2012
Total Fruit Vegetables Juice
The NPD Group, Inc. | Proprietary and Confidential 10
Annual Eatings per Capita - Consumed in the Home or Carried from Home
Source: NPD's National Eating Trends – years ending Nov. PBH 2013 CONFERENCE: NOT FOR ADDITIONAL DISTRIBUTION
All forms
and uses

Fruit and 100% juices are mainly consumed as an “end dish”. Vegetables have a higher share as an ingredient
81%
53%
87%
11%
4%
1%
7%
43%
13%
0%
25%
50%
75%
100%
Fruit Vegetables Juice
Ingredient
Topping
End Dish
The NPD Group, Inc. | Proprietary and Confidential 11
% of Eatings – Consumed in the Home or Carried from Home
Source: NPD's National Eating Trends – 2yrs ending Nov.’12 PBH 2013 CONFERENCE: NOT FOR ADDITIONAL DISTRIBUTION
All forms

Store fresh is the dominant form for both fruits and vegetables
77%
53%
0%
25%
50%
75%
100%
Fruit Vegetables
Store Fresh % of Eatings – Consumed in the Home or Carried from
Home
The NPD Group, Inc. | Proprietary and Confidential 12
All uses
Source: NPD's National Eating Trends – 2yrs ending Nov.’12 PBH 2013 CONFERENCE: NOT FOR ADDITIONAL DISTRIBUTION

Consumer preference for store fresh fruit has increased over time
74.4% 74.8% 75.3% 75.3% 75.0% 74.6% 75.7% 76.6% 76.2% 76.7%
10.5% 10.2% 10.0% 10.0% 9.6% 9.4% 8.8% 8.8% 9.1% 9.0%
Nov-03 Nov-04 Nov-05 Nov-06 Nov-07 Nov-08 Nov-09 Nov-10 Nov-11 Nov-12
Store Fresh Can / Jar
The NPD Group, Inc. | Proprietary and Confidential 13
Fruit by Top Forms
% of Eatings – Consumed in the Home or Carried from Home
All uses
Source: NPD's National Eating Trends – 2yrs ending Nov.’12 PBH 2013 CONFERENCE: NOT FOR ADDITIONAL DISTRIBUTION

Frozen and store fresh vegetables have grown while canned has declined
51.8% 51.7% 51.4% 51.4% 51.5% 51.8% 52.5% 53.0% 52.4% 52.8%
10.1% 10.3% 10.5% 10.7% 11.5% 12.0% 11.9% 11.6% 11.8% 12.1%
21.5% 20.9% 20.6% 20.7% 20.4% 20.1% 20.0% 19.2% 18.8% 19.1%
Nov-03 Nov-04 Nov-05 Nov-06 Nov-07 Nov-08 Nov-09 Nov-10 Nov-11 Nov-12
Store Fresh Frozen Canned
The NPD Group, Inc. | Proprietary and Confidential 14
All uses
Vegetables by Top Forms
% of Eatings – Consumed in the Home or Carried from Home
Source: NPD's National Eating Trends – 2yrs ending Nov.’12 PBH 2013 CONFERENCE: NOT FOR ADDITIONAL DISTRIBUTION
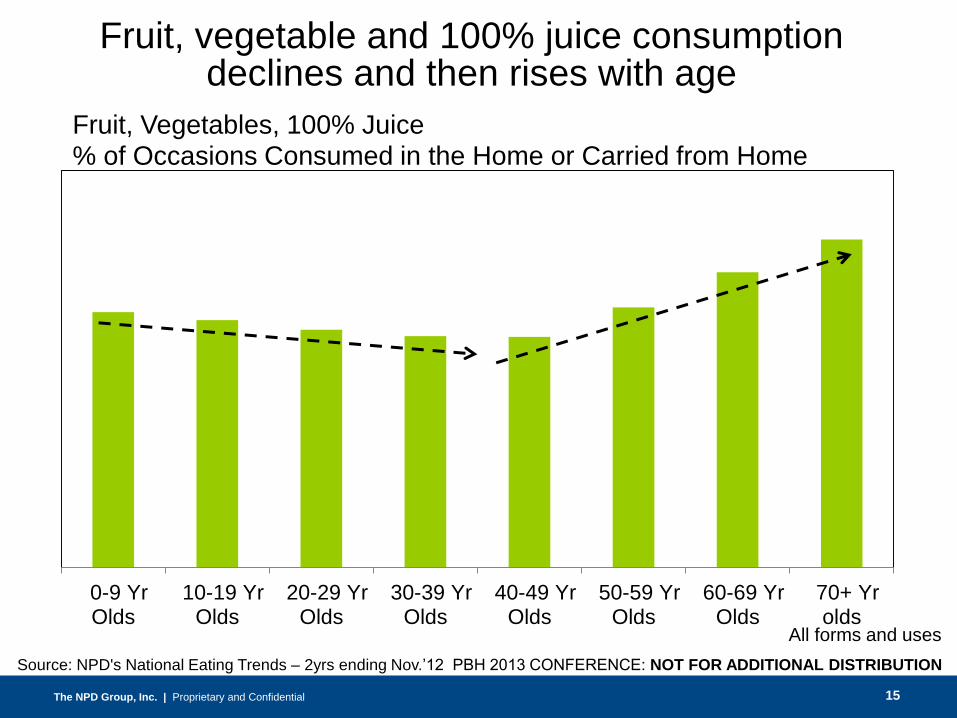
Fruit, vegetable and 100% juice consumption declines and then rises with age
0-9 YrOlds
10-19 YrOlds
20-29 YrOlds
30-39 YrOlds
40-49 YrOlds
50-59 YrOlds
60-69 YrOlds
70+ Yrolds
The NPD Group, Inc. | Proprietary and Confidential 15
Fruit, Vegetables, 100% Juice % of Occasions Consumed in the Home or Carried from Home
All forms and uses
Source: NPD's National Eating Trends – 2yrs ending Nov.’12 PBH 2013 CONFERENCE: NOT FOR ADDITIONAL DISTRIBUTION
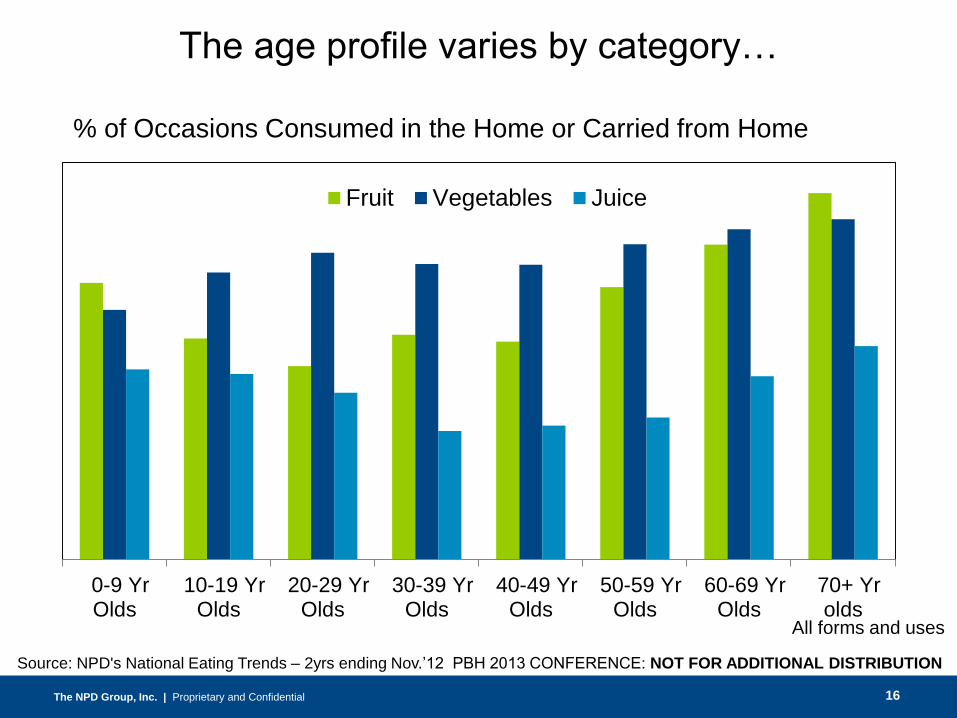
The age profile varies by category…
0-9 YrOlds
10-19 YrOlds
20-29 YrOlds
30-39 YrOlds
40-49 YrOlds
50-59 YrOlds
60-69 YrOlds
70+ Yrolds
Fruit Vegetables Juice
The NPD Group, Inc. | Proprietary and Confidential 16
% of Occasions Consumed in the Home or Carried from Home
All forms and uses
Source: NPD's National Eating Trends – 2yrs ending Nov.’12 PBH 2013 CONFERENCE: NOT FOR ADDITIONAL DISTRIBUTION

Health oriented households consume more fruits, vegetables and 100% juice
Short Cut Fuelers Family Pleasers Health Strugglers Traditional HealthFollowers
Natural HealthEmbracers
The NPD Group, Inc. | Proprietary and Confidential 17
Fruit, Vegetables, 100% Juice (all forms and uses)
% of Occasions Consumed in the Home or Carried from Home
Source: NPD's National Eating Trends – 2yrs ending Nov.’12 PBH 2013 CONFERENCE: NOT FOR ADDITIONAL DISTRIBUTION

Least Healthy ModeratelyHealthy
Most Healthy
Frequency of Snacking by NPD’s Healthy Eating Index Annual Snack Meals per Capita
SUMMARY & KEY INSIGHTS The healthier our actual eating habits, the more frequently we snack between meals
Least Healthy ModeratelyHealthy
Most Healthy
Kids <18 yrs old Adults 18+ yrs old
Source: NPD's National Eating Trends – 2yrs ending Nov.’12 PBH 2013 CONFERENCE: NOT FOR ADDITIONAL DISTRIBUTION

Fruit is the most popular between meal snack
Top items Consumed as a Between Meal Snack
% of Occasions Consumed in the Home or Carried from Home
19
1. Fruit
2. Frozen Ice Cream/Novelties
3. Cookies
4. Candy/Gum
5. Carbonated Soft Drink
6. Chips
7. Milk (excluding hot chocolate)
8. Popcorn
9. Crackers
10. Cake / Snack Cakes
The NPD Group, Inc. | Proprietary and Confidential
end dishes
Source: NPD's National Eating Trends – 2yrs ending Nov.’12 PBH 2013 CONFERENCE: NOT FOR ADDITIONAL DISTRIBUTION

Add something
to diet 26%
Take something out of diet
19%
Equally "Add to" and "Take out"
55%
Do consumers think eating healthy means adding or taking something out of the diet? … it’s both
Source: NPD’s Functional Foods & Beverages Custom Survey; June ’12 PBH 2013 CONFERENCE: NOT FOR ADDITIONAL DISTRIBUTION
% of Adults n = 1,921
The NPD Group, Inc. | Proprietary and Confidential

Questions?? Feel Free to Contact Me
Howard Goldberg Director- Food & Beverage 847.692.1736 [email protected]
The NPD Group, Inc. | Proprietary and Confidential
Thank You