processes of microstructural evolution during high-energy mechanical treatment of zno and black nio...
TRANSCRIPT

Processes of microstructural evolution during high-energy mechanicaltreatment of ZnO and black NiO powder mixture
M. Kakazey a,n, M. Vlasova a, Y. Vorobiev b, I. Leon c, M. Cabecera Gonzalez d,Edgar Arturo Chávez Urbiola b
a Centro de Investigación en Ingeniería y Ciencias Aplicadas, Universidad Autonoma del Estado de Morelos, Cuernavaca, Mexicob Unidad Querétaro del Centro de Investigación y de Estudios Avanzados del Instituto Politécnico Nacional, Querétaro, Mexicoc Centro de Investigaciones Quimicas, Universidad Autonoma del Estado de Morelos, Cuernavaca, Mexicod Facultad de Ciencias Químicas e Ingeniería, Universidad Autonoma del Estado de Morelos, Cuernavaca, Mexico
a r t i c l e i n f o
Keywords:ZnONiO blackMechanical processingMechanothermal effectsDefectsMicrostructural evolution
a b s t r a c t
Kinetics of microstructural evolution in ZnO and NiO black powder mixture during prolonged high-energy mechanical ball milling were investigated by Scanning Electron Microscopy, Laser Particle Sizer,X-ray diffraction, Electron Paramagnetic Resonance, Fourier Transform Infrared Spectroscopy and UV–visDiffuse Reflection methods. The use of these methods allows us to control the macrostructural processes(ZnO particles and NiO granules grinding, the deagglomeration and “secondary agglomeration”), themicrostructural processes (formation and annealing of different native defects in ZnO [V�
Zn : Zn0i (I), V�
Zn(II), and ðV�
Zn�2 (III) centers] and NiO black) and the mechanothermal processes in samples. This allowsto establish the relationship between microstructural evolution and the properties of the samplesdepending on the duration of the mechanical processing.
& 2014 Elsevier B.V. All rights reserved.
1. Introduction
Recently, the wide-band gap (3.3 eV) semiconductor ZnO becameof great scientific and practical interest from the standpoint ofpossibilities to modify, by creation of various impurities and defectsin ZnO lattice, its electrical, optical, magnetic and several otherphysical properties [1,2]. The ZnO–NiO system has attracted parti-cular attention as the basis for creating ultraviolet light-emittingdiodes [3,4], transparent p-NiO/n-ZnO semiconductors [5,6], ZnO/NiO stacked heterostructure [7], etc. The prediction of high-temperature ferromagnetism in ZnO doped with transition metalshas generated great interest in the system [8]. Also, room tempera-ture ferromagnetism had been reported in Ni-doped ZnO samples[9,10]. Note that most of the experiments were conducted on thinfilms obtained by low temperature solution-based growth methods,by sol–gel spin coating technique or by ultrasonic pyrolysis.
The search for new technological opportunities to enhance thelevel of ZnO doping concentration is progressing [11–14]. One ofthe most interesting methods used to modify the propertiesof powder systems is high-energy mechanical processing (MP).This method contributes to the occurrence of various mechano-chemical reactions in the samples [15–17].
The aim of this study is to explore the kinetics of macro- andmicrostructural evolution of ZnO and NiO black powder mixturesduring prolonged high-energy mechanical milling. The millingproducts were characterized by Scanning Electron Microscopy(SEM), Laser Particle Sizer (LPS), X-ray diffraction (XRD), ElectronParamagnetic Resonance (EPR), Fourier Transform Infrared Spec-troscopy (FTIR) and UV–vis Diffuse Reflection (UV–VisDR). Parti-cular attention is given to the influence of temperature changes inthe samples (from the initial temperature to the equilibriumtemperature determined by treatment regimens) on their defectstructure and the properties of the final product.
2. Experimental procedure
The starting materials were commercially available ZnO (499%purity, Reasol, Milan, Italy) and nickel oxide black (99.26% purity;Fluka Chemie J. Contents Ni (min) – 76%. T. Baker; Mexico).Scanning electron microscopy (SEM) shows that the average sizeof ZnO particle was dZnOE0.3 μm while NiO was dNiOE3–10 μm.Mixtures of ZnOþ1wt% NiO was prepared. The mechanical pro-cessing (MP) of mixtures was carried out in a Planetary Ball-Mill(type PM 400/2, Retsch Inc.). Tungsten carbide grinding “comfort”jar (volume 50 ml) and balls (3 of 20 mm and 10 of 10 mm) wereused. The ball to powder sample ratio was �28:1 in weight. The
Contents lists available at ScienceDirect
journal homepage: www.elsevier.com/locate/physb
Physica B
http://dx.doi.org/10.1016/j.physb.2014.03.0900921-4526/& 2014 Elsevier B.V. All rights reserved.
n Corresponding author. Tel.: þ52 777 3297084; fax: þ52 777 3297984.E-mail address: [email protected] (M. Kakazey).
Please cite this article as: M. Kakazey, et al., Physica B (2014), http://dx.doi.org/10.1016/j.physb.2014.03.090i
Physica B ∎ (∎∎∎∎) ∎∎∎–∎∎∎

average weight of the samples was 10 g. MP was carried out in air(in hermetically sealed jars) with rotation speed of 400 rpm.Processing times, tMP, of samples were 1, 3, 9, 30, 90 and 390 min.
Electron microscopy and X-ray microanalysis (EDS) were per-formed using a scanning electron microscope model LEO 1450 VPand an Oxford Instrument INCA Energy 200 X-ray MicroanalysisSystem. For SEM investigation, powder of the samples wasdeposited on a carbon surface and then coated by an Au–Pd alloyusing vapor deposition.
The particles size distribution, DLPS, of the processed materialwas determined by means of an Analysette 22 COMPACT, FRITSCHLaser Particle Sizer (LPS). The measuring range of the analyzer isfrom 3�102 nm to 3�105 nm. A centrifugal pump preventingheavy particles from settling and an ultrasonic bath to de-agglomerate particles are standard equipment used with theanalyzer. In this work all the measurements were made withultrasonic processing.
An X-ray diffractometer (Siemens D-500) with CuKα radiation(λ¼0.15418 nm) was used for phase identification. The averagesize of crystallites, DX, was calculated from the broadening of X-rayreflections using the Scherer formula [18]:
Bpð2θÞ ¼ 0:9λ=D cos θ; ð1Þwhere Bp(2θ) is the reflection broadening (in radians) due to theeffect of crystallite size, λ is the X-ray wavelength and θ is theBragg angle.
Room temperature Electron Paramagnetic Resonance (EPR, SE/X 2547 – Radiopan, Poznan, Poland) was used to study theformation of different paramagnetic centres of ZnOþ1.0%NiOpowder mixture during MP.
An infrared (IR) spectrophotometer (Bruker Vector 22 FTIR,Karlsruhe, Germany, with a resolution of 4 cm�1) was used in thetransmission mode in this work. The samples were mixed withKBr in a 2:60 ratio; the resulting mixtures were pressed untiltransparent plates were obtained.
The material was also characterized by UV–vis diffuse reflec-tance spectroscopy (DRS) using a Pelkin-Elmer Lamda 2 spectro-meter. The samples were prepared for measurements as follow:the circular well of 1 mm deep and 10 mm of diameter of thehorizontal sample holder was filled with raw powder without anybinding. The sample surface was flattened without application offorce. The light incidence was practically normal to the sample,and the diffuse reflectance spectrum was measured at an angle of451. For system's calibration, the reflectance of white aluminapowder was used. The measurements were done at room tem-perature in the wavelength range of 300�2000 nm.
3. Experimental results
3.1. Scanning electron microscopy
Fig. 1a shows SEM images of initial NiO (black) powder. The NiOparticles have a spherical-like shape (high sphericity) and the sizefrom 3 to 10 μm (Fig. 1a). This means that the initial NiO (black)powder is a granular powder.
SEM images of the initial and MP-prepared ZnOþ1 wt% NiOpowders are presented in Fig. 1b–d. The initial sample consisted ofZnO-particles with a spherical-like morphology (medium spheri-sity and low spherisity). The average size particle, DZnO
SEM, is�250 nm. With increasing tMP a consecutive reduction of DZnO
SEM isobserved. The ZnO particle aggregates can also be noted in Fig. 1b,c. Note that NiO granules are not observed at tMPo390 min. UsingX-ray microanalysis, no nickel was found on the surface layer ofthe ZnOþ1 wt% NiO powder samples. Only after tMP¼390 min ofMP the content of Ni atoms on the surface corresponds to its
volume content. This demonstrates that ZnO particles coat thesurface of NiO granules (particles) in samples at tMPr90 min.
3.2. Laser particle Sizer
Plots of size distribution, DZnOLPS (tMP), of individual ZnO particles
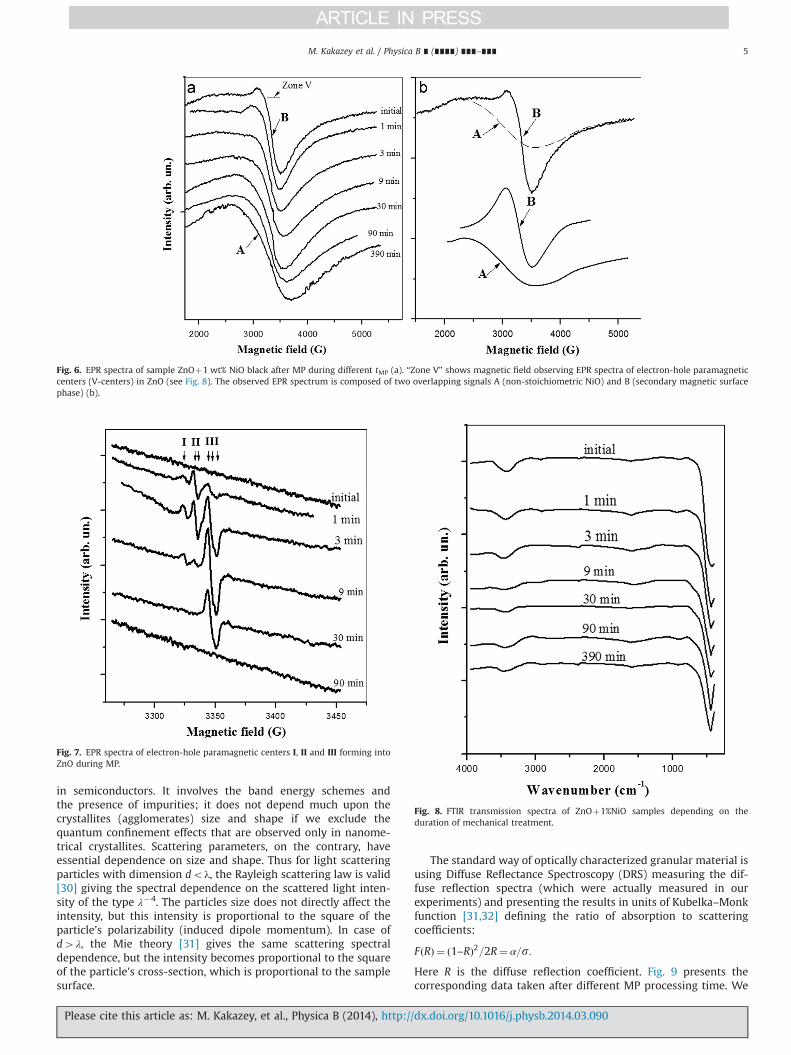
and its agglomerates DZnOLPS are presented in Fig. 2. It can be seen in
Fig. 2 that the initial mixture consisted of LPS-particle (LaserParticle Sizer) size between DZnO
LPS �3�102 to 5–8�103 nm. FortMT-30 min, the quantity of fine fraction particles with DZnO
LPSr300 nm increased (from 1% to 3%) while the maximum in thedistribution curve shifted to smaller DZnO
LPS values (from 1500 nm to850 nm), Fig. 2. The content of big particles started to increase attMP430 min. The maximum in the distribution curve shifted tohigher DZnO
LPS values while increased the milling time tMP430 min.(Figs. 2 and 3a). At time tMP430 min, the agglomerates of ZnOparticles, which cannot be destroyed by ultrasonic processing usedin the LPS Analysette 22 COMPACT, had a growing effect on theparticle size distributions plots (Figs. 2 and 3a).
3.3. X-ray
Fig. 4 shows an XRD pattern of the starting NiO black sample.The NiO black has NaCl-type structure and an average crystallitessize of about DNiO
X �40 nm. XRD patterns of ZnOþ1wt% NiO blackmixtures after MP treatment at different milling times are pre-sented in Fig. 5. The amount of NiO in the mixture is so small thatthe intensity of its XRD peaks is weak and not distinguishable inthe diffraction pattern of the mixture. Increasing the milling time,tMP, decreases the amplitude of the XRD peaks and increases itswidth. Fig. 3b shows the change of the crystallite size of ZnO, DZnO
X ,depending on the duration of МP. The ZnO crystallite size changedfrom �250 nm in the initial sample, which agree to the particlesize estimated by SEM (Fig. 2a), down to �14 nm (tMP¼390 min,Fig. 4b). The average particle size change of ZnO during МP can bedescribed using the following equation DZnO
X �1/tMP0.45.
3.4. Electron paramagnetic resonance
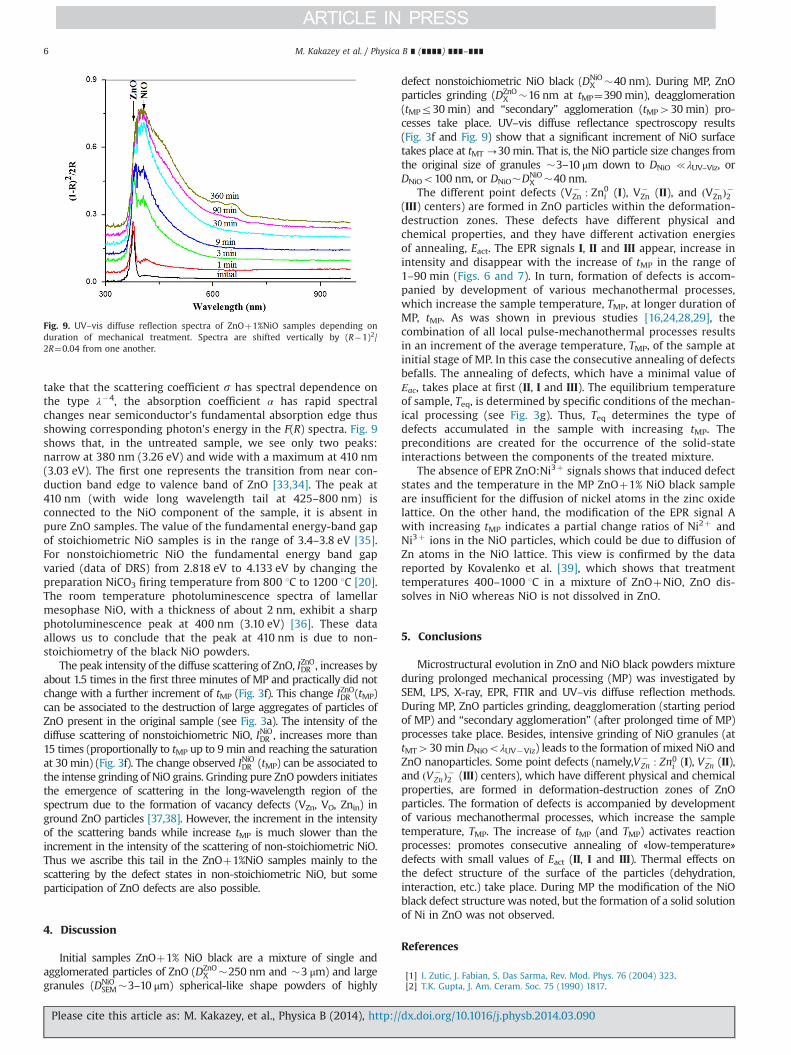
No EPR signals were detected in the initial ZnO sample.Figs. 6 and 7 show the EPR spectra of ZnO þ1%NiO samplesdepending on the duration (tMP) of its mechanical processing. EPRspectra in Fig. 6 reflect changes in the NiO component of thesample. The spectrum of the original sample can be best inter-preted as a superposition of the two signals (A and B) (Fig. 6b). Thesignal A has a gE2.12 and a line width of around 940 G. Increasingthe processing time, tMP, signal A shows a slightly narrowing andshift to higher magnetic fields. Stoichiometric NiO is antiferro-magnetic with the Néel temperature at 523 K [19] and it does notshow EPR signals at room temperature. Non-stoichiometric NiOcan show paramagnetism at room temperature, due to thepresence of Ni3þ ions in the sample. So, the EPR signal like theone observed in this study has been observed at room temperaturein NiO samples prepared by firing specpure NiCO3 in air for 6 h atdifferent firing temperatures, ranged from 800 1C to 1100 1C [20].Some thermal changes of the EPR signal (g1, g2, ΔB) were assignedto mixed valence of Ni2þ and Ni3þ with different ratios. Roomtemperature EPR signals of NiO nanoparticles may be observedalso due to the different surface paramagnetic defect states [21].
The B signal has a gE2.03 and a line width of around 430 G.Increasing tMP, a fast decrement of the B signal intensity takesplace (see Fig.3 c). After tMP430 min, the B signal disappears andonly the A signal can be observed in the EPR spectrum (Fig. 6а).The B signal may be due to ferromagnetic by-products localized onthe surface of NiO crystallites, derived from a granulation process.
M. Kakazey et al. / Physica B ∎ (∎∎∎∎) ∎∎∎–∎∎∎2
Please cite this article as: M. Kakazey, et al., Physica B (2014), http://dx.doi.org/10.1016/j.physb.2014.03.090i
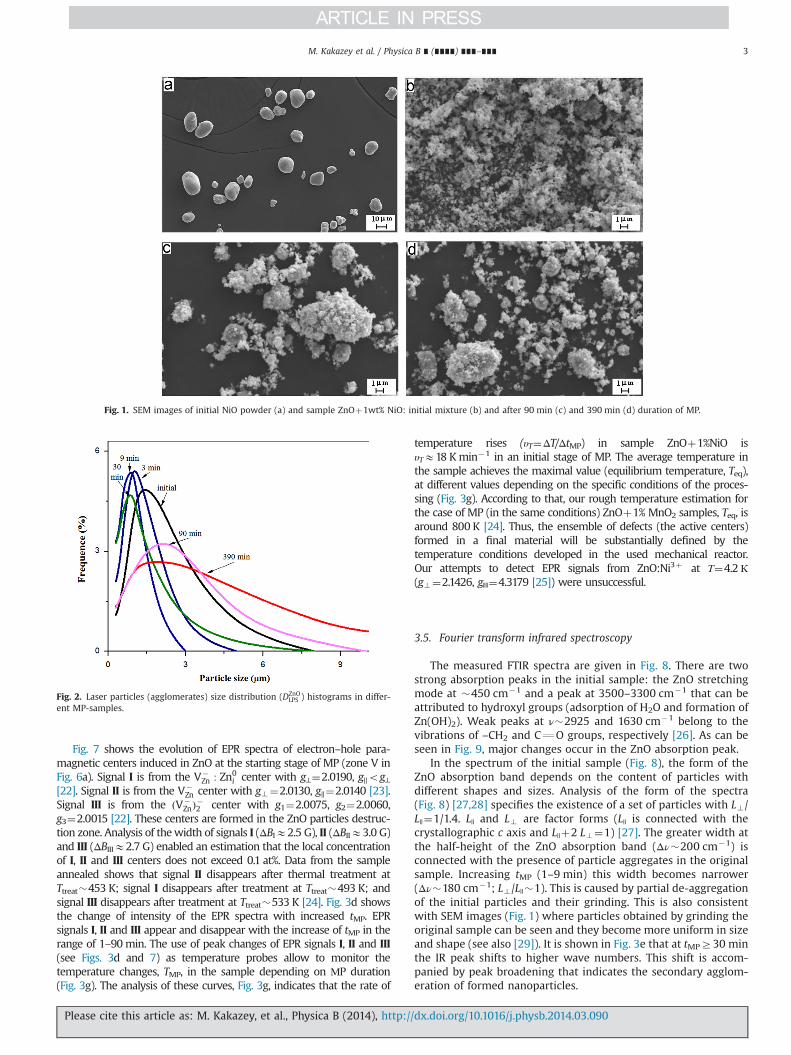
Fig. 7 shows the evolution of EPR spectra of electron–hole para-magnetic centers induced in ZnO at the starting stage of MP (zone V inFig. 6a). Signal I is from the V�
Zn : Zn0i center with g⊥¼2.0190, g‖og⊥
[22]. Signal II is from the V�Zn center with g?¼2.0130, g‖¼2.0140 [23].
Signal III is from the ðV�ZnÞ�2 center with g1¼2.0075, g2¼2.0060,
g3¼2.0015 [22]. These centers are formed in the ZnO particles destruc-tion zone. Analysis of thewidth of signals I (ΔBIE2.5 G), II (ΔBIIE3.0 G)and III (ΔBIIIE2.7 G) enabled an estimation that the local concentrationof I, II and III centers does not exceed 0.1 at%. Data from the sampleannealed shows that signal II disappears after thermal treatment atTtreat�453 K; signal I disappears after treatment at Ttreat�493 K; andsignal III disappears after treatment at Ttreat�533 K [24]. Fig. 3d showsthe change of intensity of the EPR spectra with increased tMP. EPRsignals I, II and III appear and disappear with the increase of tMP in therange of 1–90min. The use of peak changes of EPR signals I, II and III(see Figs. 3d and 7) as temperature probes allow to monitor thetemperature changes, TMP, in the sample depending on МP duration(Fig. 3g). The analysis of these curves, Fig. 3g, indicates that the rate of
temperature rises (υT¼ΔT/ΔtMP) in sample ZnOþ1%NiO isυTE18 Kmin�1 in an initial stage of MP. The average temperature inthe sample achieves the maximal value (equilibrium temperature, Teq),at different values depending on the specific conditions of the proces-sing (Fig. 3g). According to that, our rough temperature estimation forthe case of MP (in the same conditions) ZnOþ1% MnO2 samples, Teq, isaround 800 K [24]. Thus, the ensemble of defects (the active centers)formed in a final material will be substantially defined by thetemperature conditions developed in the used mechanical reactor.Our attempts to detect EPR signals from ZnO:Ni3þ at Т¼4.2 К(g?¼2.1426, g||||¼4.3179 [25]) were unsuccessful.
3.5. Fourier transform infrared spectroscopy
The measured FTIR spectra are given in Fig. 8. There are twostrong absorption peaks in the initial sample: the ZnO stretchingmode at �450 cm�1 and a peak at 3500–3300 cm�1 that can beattributed to hydroxyl groups (adsorption of H2O and formation ofZn(OH)2). Weak peaks at ν�2925 and 1630 cm�1 belong to thevibrations of –CH2 and CQO groups, respectively [26]. As can beseen in Fig. 9, major changes occur in the ZnO absorption peak.
In the spectrum of the initial sample (Fig. 8), the form of theZnO absorption band depends on the content of particles withdifferent shapes and sizes. Analysis of the form of the spectra(Fig. 8) [27,28] specifies the existence of a set of particles with L?/L||¼1/1.4. L|| and L? are factor forms (L|| is connected with thecrystallographic c axis and L||þ2 L?¼1) [27]. The greater width atthe half-height of the ZnO absorption band (Δν�200 cm�1) isconnected with the presence of particle aggregates in the originalsample. Increasing tMP (1–9 min) this width becomes narrower(Δν�180 cm�1; L?/L||�1). This is caused by partial de-aggregationof the initial particles and their grinding. This is also consistentwith SEM images (Fig. 1) where particles obtained by grinding theoriginal sample can be seen and they become more uniform in sizeand shape (see also [29]). It is shown in Fig. 3e that at tMPZ30 minthe IR peak shifts to higher wave numbers. This shift is accom-panied by peak broadening that indicates the secondary agglom-eration of formed nanoparticles.
Fig. 1. SEM images of initial NiO powder (a) and sample ZnOþ1wt% NiO: initial mixture (b) and after 90 min (c) and 390 min (d) duration of MP.
Fig. 2. Laser particles (agglomerates) size distribution (DZnOLPS ) histograms in differ-
ent MP-samples.
M. Kakazey et al. / Physica B ∎ (∎∎∎∎) ∎∎∎–∎∎∎ 3
Please cite this article as: M. Kakazey, et al., Physica B (2014), http://dx.doi.org/10.1016/j.physb.2014.03.090i

3.6. UV–vis diffuse reflectance spectroscopy
For discussion of the optical characteristics of the studiedmaterial in the visible and UV region, it is necessary to take into
account that the inhomogeneity of the sample (individual parti-cles, aggregates of particles, compact granules or crystallites)together with the fact that the characteristic size changes duringthe MP. For example, the size of the original NiO granules is biggerthan the light wavelength λ used, whereas later on (tMP-390 min)the particles resulting from their destruction become smaller thanλ. On the other hand, the average size of the individual ZnOparticles is smaller than λ and the average crystallite size in theZnO and NiO particles is also smaller than λ. The actual opticalcharacteristics are absorption coefficient α and scattering coeffi-cient s, their sum determines the total attenuation of light in thematerial. These characteristics could be ascribed to individualparticles, agglomerates or granules; therefore the size evolutionmight be important.
The absorption coefficient and its spectral dependence, inparticular, are determined by the mechanisms of optical processes
Fig. 3. Summary of consecutive changes that taken place in a mixture of ZnOþ1 wt% NiO black during longtime MP. (a) Average particle , defined sizes, (DZnO
LPS ), definedby a Laser Particle Sizer; (b) Crystallites average size, DZnO
X ; (c) Intensity of the EPRsignal B in NiO black; (d) Intensity of the EPR spectra of electron-hole centers I, IIand III in ZnO; (e) Shift of IR ZnO-peak absorption; (f) Intensity of the 380 nm and410 nm UV–vis DR peaks; (g) Average sample temperature, TMP.
Fig. 4. X-ray diffraction pattern of the initial sample NiO black.
Fig. 5. X-ray diffraction patterns of sample ZnOþ1 wt% NiO black after MP duringdifferent tMP.
M. Kakazey et al. / Physica B ∎ (∎∎∎∎) ∎∎∎–∎∎∎4
Please cite this article as: M. Kakazey, et al., Physica B (2014), http://dx.doi.org/10.1016/j.physb.2014.03.090i
in semiconductors. It involves the band energy schemes andthe presence of impurities; it does not depend much upon thecrystallites (agglomerates) size and shape if we exclude thequantum confinement effects that are observed only in nanome-trical crystallites. Scattering parameters, on the contrary, haveessential dependence on size and shape. Thus for light scatteringparticles with dimension doλ, the Rayleigh scattering law is valid[30] giving the spectral dependence on the scattered light inten-sity of the type λ�4. The particles size does not directly affect theintensity, but this intensity is proportional to the square of theparticle's polarizability (induced dipole momentum). In case ofd4λ, the Mie theory [31] gives the same scattering spectraldependence, but the intensity becomes proportional to the squareof the particle's cross-section, which is proportional to the samplesurface.
The standard way of optically characterized granular material isusing Diffuse Reflectance Spectroscopy (DRS) measuring the dif-fuse reflection spectra (which were actually measured in ourexperiments) and presenting the results in units of Kubelka–Monkfunction [31,32] defining the ratio of absorption to scatteringcoefficients:
FðRÞ ¼ ð1–RÞ2=2R¼ α=s:
Here R is the diffuse reflection coefficient. Fig. 9 presents thecorresponding data taken after different MP processing time. We
Fig. 6. EPR spectra of sample ZnOþ1 wt% NiO black after MP during different tMP (a). “Zone V” shows magnetic field observing EPR spectra of electron-hole paramagneticcenters (V-centers) in ZnO (see Fig. 8). The observed EPR spectrum is composed of two overlapping signals A (non-stoichiometric NiO) and B (secondary magnetic surfacephase) (b).
Fig. 7. EPR spectra of electron-hole paramagnetic centers I, II and III forming intoZnO during MP.
Fig. 8. FTIR transmission spectra of ZnOþ1%NiO samples depending on theduration of mechanical treatment.
M. Kakazey et al. / Physica B ∎ (∎∎∎∎) ∎∎∎–∎∎∎ 5
Please cite this article as: M. Kakazey, et al., Physica B (2014), http://dx.doi.org/10.1016/j.physb.2014.03.090i
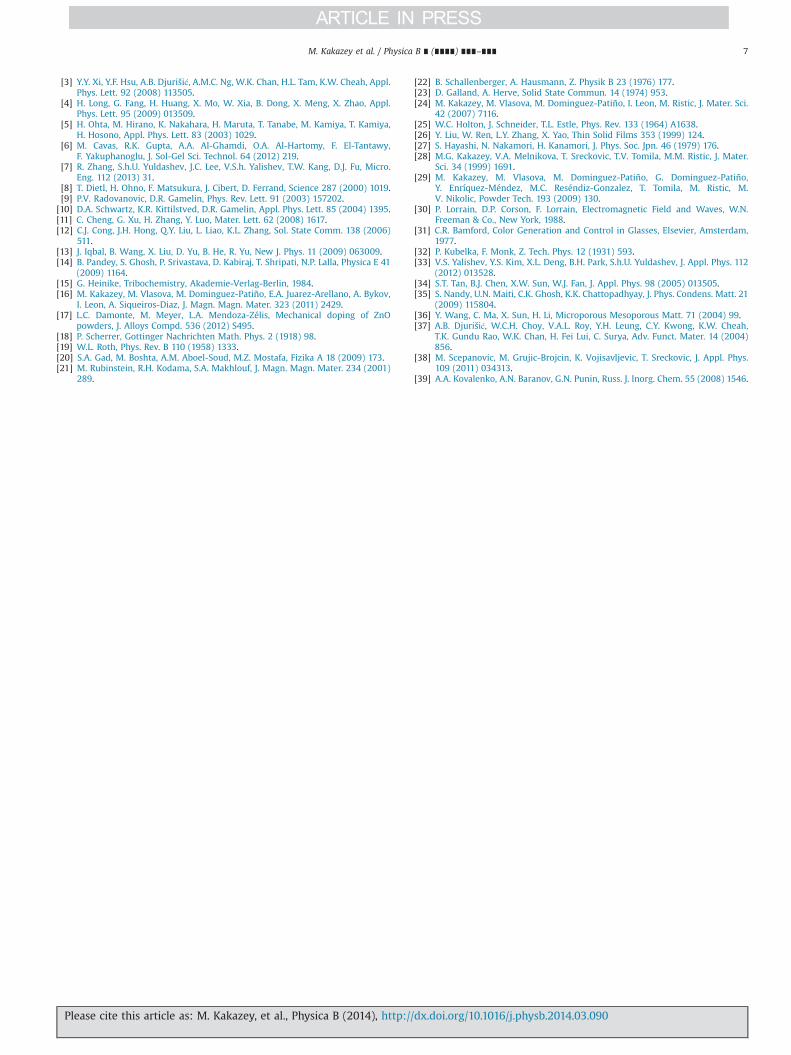
take that the scattering coefficient s has spectral dependence onthe type λ�4, the absorption coefficient α has rapid spectralchanges near semiconductor's fundamental absorption edge thusshowing corresponding photon's energy in the F(R) spectra. Fig. 9shows that, in the untreated sample, we see only two peaks:narrow at 380 nm (3.26 eV) and wide with a maximum at 410 nm(3.03 eV). The first one represents the transition from near con-duction band edge to valence band of ZnO [33,34]. The peak at410 nm (with wide long wavelength tail at 425–800 nm) isconnected to the NiO component of the sample, it is absent inpure ZnO samples. The value of the fundamental energy-band gapof stoichiometric NiO samples is in the range of 3.4–3.8 eV [35].For nonstoichiometric NiO the fundamental energy band gapvaried (data of DRS) from 2.818 eV to 4.133 eV by changing thepreparation NiCO3 firing temperature from 800 1C to 1200 1C [20].The room temperature photoluminescence spectra of lamellarmesophase NiO, with a thickness of about 2 nm, exhibit a sharpphotoluminescence peak at 400 nm (3.10 eV) [36]. These dataallows us to conclude that the peak at 410 nm is due to non-stoichiometry of the black NiO powders.
The peak intensity of the diffuse scattering of ZnO, IZnODR , increases byabout 1.5 times in the first three minutes of MP and practically did notchange with a further increment of tMP (Fig. 3f). This change IZnODR (tMP)can be associated to the destruction of large aggregates of particles ofZnO present in the original sample (see Fig. 3a). The intensity of thediffuse scattering of nonstoichiometric NiO, INiODR , increases more than15 times (proportionally to tMP up to 9 min and reaching the saturationat 30min) (Fig. 3f). The change observed INiODR (tMP) can be associated tothe intense grinding of NiO grains. Grinding pure ZnO powders initiatesthe emergence of scattering in the long-wavelength region of thespectrum due to the formation of vacancy defects (VZn, VO, Znin) inground ZnO particles [37,38]. However, the increment in the intensityof the scattering bands while increase tMP is much slower than theincrement in the intensity of the scattering of non-stoichiometric NiO.Thus we ascribe this tail in the ZnOþ1%NiO samples mainly to thescattering by the defect states in non-stoichiometric NiO, but someparticipation of ZnO defects are also possible.
4. Discussion
Initial samples ZnOþ1% NiO black are a mixture of single andagglomerated particles of ZnO (DZnO
X �250 nm and �3 μm) and largegranules (DNiO
SEM�3–10 μm) spherical-like shape powders of highly
defect nonstoichiometric NiO black (DNiOX �40 nm). During MP, ZnO
particles grinding (DZnOX �16 nm at tMP¼390min), deagglomeration
(tMPr30min) and “secondary” agglomeration (tMP430min) pro-cesses take place. UV–vis diffuse reflectance spectroscopy results(Fig. 3f and Fig. 9) show that a significant increment of NiO surfacetakes place at tMT -30min. That is, the NiO particle size changes fromthe original size of granules �3–10 μm down to DNiO {λUV–Viz, orDNiOo100 nm, or DNiO�DNiO
X �40 nm.The different point defects (V�
Zn : Zn0i (I), V�
Zn (II), and ðV�ZnÞ�2
(III) centers) are formed in ZnO particles within the deformation-destruction zones. These defects have different physical andchemical properties, and they have different activation energiesof annealing, Eact. The EPR signals I, II and III appear, increase inintensity and disappear with the increase of tMP in the range of1–90 min (Figs. 6 and 7). In turn, formation of defects is accom-panied by development of various mechanothermal processes,which increase the sample temperature, TMP, at longer duration ofMP, tMP. As was shown in previous studies [16,24,28,29], thecombination of all local pulse-mechanothermal processes resultsin an increment of the average temperature, TMP, of the sample atinitial stage of MP. In this case the consecutive annealing of defectsbefalls. The annealing of defects, which have a minimal value ofЕac, takes place at first (II, I and III). The equilibrium temperatureof sample, Teq, is determined by specific conditions of the mechan-ical processing (see Fig. 3g). Thus, Teq determines the type ofdefects accumulated in the sample with increasing tMP. Thepreconditions are created for the occurrence of the solid-stateinteractions between the components of the treated mixture.
The absence of EPR ZnO:Ni3þ signals shows that induced defectstates and the temperature in the MP ZnOþ1% NiO black sampleare insufficient for the diffusion of nickel atoms in the zinc oxidelattice. On the other hand, the modification of the EPR signal Awith increasing tMP indicates a partial change ratios of Ni2þ andNi3þ ions in the NiO particles, which could be due to diffusion ofZn atoms in the NiO lattice. This view is confirmed by the datareported by Kovalenko et al. [39], which shows that treatmenttemperatures 400–1000 1C in a mixture of ZnOþNiO, ZnO dis-solves in NiO whereas NiO is not dissolved in ZnO.
5. Conclusions
Microstructural evolution in ZnO and NiO black powders mixtureduring prolonged mechanical processing (MP) was investigated bySEM, LPS, X-ray, EPR, FTIR and UV–vis diffuse reflection methods.During MP, ZnO particles grinding, deagglomeration (starting periodof MP) and “secondary agglomeration” (after prolonged time of MP)processes take place. Besides, intensive grinding of NiO granules (attMT430 min DNiOoλUV�Viz) leads to the formation of mixed NiO andZnO nanoparticles. Some point defects (namely,V �
Zn : Zn0i (I), V �
Zn (II),and ðV �
ZnÞ�2 (III) centers), which have different physical and chemicalproperties, are formed in deformation-destruction zones of ZnOparticles. The formation of defects is accompanied by developmentof various mechanothermal processes, which increase the sampletemperature, TMP. The increase of tMP (and TMP) activates reactionprocesses: promotes consecutive annealing of «low-temperature»defects with small values of Eact (II, I and III). Thermal effects onthe defect structure of the surface of the particles (dehydration,interaction, etc.) take place. During MP the modification of the NiOblack defect structure was noted, but the formation of a solid solutionof Ni in ZnO was not observed.
References
[1] I. Zutic, J. Fabian, S. Das Sarma, Rev. Mod. Phys. 76 (2004) 323.[2] T.K. Gupta, J. Am. Ceram. Soc. 75 (1990) 1817.
Fig. 9. UV–vis diffuse reflection spectra of ZnOþ1%NiO samples depending onduration of mechanical treatment. Spectra are shifted vertically by (R�1)2/2R¼0.04 from one another.
M. Kakazey et al. / Physica B ∎ (∎∎∎∎) ∎∎∎–∎∎∎6
Please cite this article as: M. Kakazey, et al., Physica B (2014), http://dx.doi.org/10.1016/j.physb.2014.03.090i
[3] Y.Y. Xi, Y.F. Hsu, A.B. Djurišić, A.M.C. Ng, W.K. Chan, H.L. Tam, K.W. Cheah, Appl.Phys. Lett. 92 (2008) 113505.
[4] H. Long, G. Fang, H. Huang, X. Mo, W. Xia, B. Dong, X. Meng, X. Zhao, Appl.Phys. Lett. 95 (2009) 013509.
[5] H. Ohta, M. Hirano, K. Nakahara, H. Maruta, T. Tanabe, M. Kamiya, T. Kamiya,H. Hosono, Appl. Phys. Lett. 83 (2003) 1029.
[6] M. Cavas, R.K. Gupta, A.A. Al-Ghamdi, O.A. Al-Hartomy, F. El-Tantawy,F. Yakuphanoglu, J. Sol-Gel Sci. Technol. 64 (2012) 219.
[7] R. Zhang, S.h.U. Yuldashev, J.C. Lee, V.S.h. Yalishev, T.W. Kang, D.J. Fu, Micro.Eng. 112 (2013) 31.
[8] T. Dietl, H. Ohno, F. Matsukura, J. Cibert, D. Ferrand, Science 287 (2000) 1019.[9] P.V. Radovanovic, D.R. Gamelin, Phys. Rev. Lett. 91 (2003) 157202.[10] D.A. Schwartz, K.R. Kittilstved, D.R. Gamelin, Appl. Phys. Lett. 85 (2004) 1395.[11] C. Cheng, G. Xu, H. Zhang, Y. Luo, Mater. Lett. 62 (2008) 1617.[12] C.J. Cong, J.H. Hong, Q.Y. Liu, L. Liao, K.L. Zhang, Sol. State Comm. 138 (2006)
511.[13] J. Iqbal, B. Wang, X. Liu, D. Yu, B. He, R. Yu, New J. Phys. 11 (2009) 063009.[14] B. Pandey, S. Ghosh, P. Srivastava, D. Kabiraj, T. Shripati, N.P. Lalla, Physica E 41
(2009) 1164.[15] G. Heinike, Tribochemistry, Akademie-Verlag-Berlin, 1984.[16] M. Kakazey, M. Vlasova, M. Dominguez-Patiño, E.A. Juarez-Arellano, A. Bykov,
I. Leon, A. Siqueiros-Diaz, J. Magn. Magn. Mater. 323 (2011) 2429.[17] L.C. Damonte, M. Meyer, L.A. Mendoza-Zélis, Mechanical doping of ZnO
powders, J. Alloys Compd. 536 (2012) S495.[18] P. Scherrer, Gottinger Nachrichten Math. Phys. 2 (1918) 98.[19] W.L. Roth, Phys. Rev. B 110 (1958) 1333.[20] S.A. Gad, M. Boshta, A.M. Aboel-Soud, M.Z. Mostafa, Fizika A 18 (2009) 173.[21] M. Rubinstein, R.H. Kodama, S.A. Makhlouf, J. Magn. Magn. Mater. 234 (2001)
289.
[22] B. Schallenberger, A. Hausmann, Z. Physik B 23 (1976) 177.[23] D. Galland, A. Herve, Solid State Commun. 14 (1974) 953.[24] M. Kakazey, M. Vlasova, M. Dominguez-Patiño, I. Leon, M. Ristic, J. Mater. Sci.
42 (2007) 7116.[25] W.C. Holton, J. Schneider, T.L. Estle, Phys. Rev. 133 (1964) A1638.[26] Y. Liu, W. Ren, L.Y. Zhang, X. Yao, Thin Solid Films 353 (1999) 124.[27] S. Hayashi, N. Nakamori, H. Kanamori, J. Phys. Soc. Jpn. 46 (1979) 176.[28] M.G. Kakazey, V.A. Melnikova, T. Sreckovic, T.V. Tomila, M.M. Ristic, J. Mater.
Sci. 34 (1999) 1691.[29] M. Kakazey, M. Vlasova, M. Dominguez-Patiño, G. Dominguez-Patiño,
Y. Enríquez-Méndez, M.C. Reséndiz-Gonzalez, T. Tomila, M. Ristic, M.V. Nikolic, Powder Tech. 193 (2009) 130.
[30] P. Lorrain, D.P. Corson, F. Lorrain, Electromagnetic Field and Waves, W.N.Freeman & Co., New York, 1988.
[31] C.R. Bamford, Color Generation and Control in Glasses, Elsevier, Amsterdam,1977.
[32] P. Kubelka, F. Monk, Z. Tech. Phys. 12 (1931) 593.[33] V.S. Yalishev, Y.S. Kim, X.L. Deng, B.H. Park, S.h.U. Yuldashev, J. Appl. Phys. 112
(2012) 013528.[34] S.T. Tan, B.J. Chen, X.W. Sun, W.J. Fan, J. Appl. Phys. 98 (2005) 013505.[35] S. Nandy, U.N. Maiti, C.K. Ghosh, K.K. Chattopadhyay, J. Phys. Condens. Matt. 21
(2009) 115804.[36] Y. Wang, C. Ma, X. Sun, H. Li, Microporous Mesoporous Matt. 71 (2004) 99.[37] A.B. Djurišić, W.C.H. Choy, V.A.L. Roy, Y.H. Leung, C.Y. Kwong, K.W. Cheah,
T.K. Gundu Rao, W.K. Chan, H. Fei Lui, C. Surya, Adv. Funct. Mater. 14 (2004)856.
[38] M. Scepanovic, M. Grujic-Brojcin, K. Vojisavljevic, T. Sreckovic, J. Appl. Phys.109 (2011) 034313.
[39] A.A. Kovalenko, A.N. Baranov, G.N. Punin, Russ. J. Inorg. Chem. 55 (2008) 1546.
M. Kakazey et al. / Physica B ∎ (∎∎∎∎) ∎∎∎–∎∎∎ 7
Please cite this article as: M. Kakazey, et al., Physica B (2014), http://dx.doi.org/10.1016/j.physb.2014.03.090i