process wastewater (dp180252l) treatment
TRANSCRIPT
Page 1 of 23
Paul Barrett Hawke’s Bay Regional Council Private Bag 6006 Napier 28 June 2018 Dear Paul,
RE: REQUEST FOR FURTHER INFORMATION DP180250L, DP180249L, DP180251L, DP180252L and
others
This letter responds to Hawke’s Bay Regional Council (HBRC) request for further information dated 6
December 2018 (RFI) on matters relating to the replacement of consents to discharge to land at
Silver Fern Farms Takapau (Takapau).
Silver Fern Farms engaged Pattle Delamore Partners Limited (PDP) to assist with the response. Their
report (PDP 2019) is attached as Appendix 1. Responses and commentary on each matter follow
below.
Process wastewater (DP180252L) – treatment
While the existing DAF system appears to provide good removal, there is no evidence of actual
removal percentages. It is therefore not clear if this system could perform better. There are options
available to improve wastewater parameter removal in DAF systems, as well as further treatment
options should the scale of effects from the discharge require this.
In order to assess the effectiveness of process wastewater treatment stages, please provide the
following:
1. Process flow diagram of the entire wastewater network, including recycled water and non-
potable water.
The updated wastewater process flow diagram is attached in Appendix 2.
It shows that all processing wastewater enters the Rendering sump, undergoes further
screening before the balance tank, and is processed through the DAF before being
discharged to land.
Wastewater generated from the Animal Assembly goes through a rotary screen and then a
static screen. The static screen output flows direct to the final sump and on to the storage
dam bypassing the DAF. Any overflow from the static screen enters the balance tank via a
sump and is directed through the DAF. In the event that wastewater coming from the static
screen overflow exceeds the sump capacity, a float switch diverts flow directly to the final
sump, therefore bypassing the balance tank and DAF.
Page 2 of 23
Recycled / non-potable water is sourced from; low risk stormwater, defrost water, sand filter
backwash and non-potable bore water. Water is used to clean the Animal Assembly, Internal
Products (Green) screen, and to flush the wastewater pipelines to reduce the potential for
solids build-up and odours. All wastewater generated from these processes is directed to the
wastewater system for treatment and disposal.
The recycled / non-potable water is also used for firefighting purposes including training in
all areas.
2. Please provide the following treatment process specifications:
(a) Dissolved Air Flotation unit (DAF): Manufacturer, model, dimensions, recycle flow, design
capacity;
The Dissolved Air Flotation (DAF) Plant was originally designed by Rendertech for use at the
Silver Fern Farms Oringi Plant (Oringi). It was relocated and commissioned at the Takapau
site in 2013/14. The DAF plant at Oringi was utilised primarily for treating wastewater from
the slaughter and processing operation and the rendering plant. The DAF plant was, and still
is, operated as a non-chemical DAF, utilising no acid, coagulant or poly electrolyte for
assisting with solids removal. The DAF does not have chemical dosing equipment (acid or
polymer). However, this could be retrofitted to enable chemical dosing if required.
The specs of the main components of the treatment system are outlined below.
• Balance tank - Consisting of a 316 m3 epoxy coated, bolted, carbon steel tank.
• Rendertech DAF 250
o Dimensions 20m x 3.5m x 1.5m
o Nominal flow capacity 200mз/hr (minimum 70 m³/hr, average 150 m³/hr,
maximum 250 m³/hr)
o Recycle flow unknown, fixed rate, manually set
• Dissolved Air Module DAS80 - The dissolved air concentrator consists of two 18.5 kW
centrifugal pumps which feed a stainless-steel saturation vessel. Air is drawn into
the suction side of the pumps via a rotameter, where it is dissolved under pressure
in the saturation vessel
(b) Storage dam/pond: Dimensions, when constructed, any solids levels measured, when it was
last de-sludged and how much sludge was removed, lining details (if any).
Original drawings of pond are attached as Appendix 3.
The plans indicate that construction was to be completed by June 1981.
The planned dimensions of the storage dam were for a quadrilateral pond of 77m x 50.5m x
59.5m x 71m with a depth of approximately 2.3m from crest to the toe of the batter.
Page 3 of 23
Lining details were for a minimum 100mm of a 50:50 bentonite soil mix.
The pond was last de-sludged in 2016. It is estimated that approximately seven to eight tons
of sludge was removed. Sludge was excavated and placed on the sides of the pond to drain
then removed and spread to land.
3. Process inputs for the DAF. i.e. flow and load (wastewater characterisation) data. This
could be sampling data from the balance tank or upstream of the balance tank but needs
to be representative of all contributing flows. Data required is Flow (m³/hr and m³/d),
COD, BOD, O&G, TN, TKN, NH3-N, TSS, pH, TP & DRP.
Flow input data is not available however was estimated to assist with the commissioning of
the DAF. Calculations projected that processing wastewater made up approximately 70% of
the total daily volume, the remaining 30% from the Animal Assembly. Specifications for the
DAF (see Question 2) indicate that the average flow rate is 150m³/hr.
Process inputs for the DAF were established from sampling the wastewater inputs
immediately prior to entering the DAF Tank, characteristics are shown in Table 1 below.
Table 1: DAF Process Inputs
Sample COD BOD5 TF TN TKN NH3-N TSS pH TP DRP
1/3/19 1,900 833 43 85.6 82.7 7 975 7.3 19.4 11.3
7/3/19 2,620 796 131 85.7 89.1 7.4 945 7.1 22.9 12.9
14/3/19 2,310 789 132 79.6 86.1 11.6 1,420 7.1 15.4 9.4
22/3/19 1,920 764 73 84.8 89.4 40.2 774 7.4 22.2 14.4
29/3/19 1,020 488 45 51.7 55.7 10.9 332 7.1 9.23 6.95
Units g/m³
The Wastewater from the Animal Assembly does not routinely get treated through the DAF,
discharging direct from the static screen to the storage dam. The Animal Assembly waste
stream was characterised separately, after the Static Screen. Results are summarised in
Table 2 below.
Table 2: Static Screen Process Outputs
Sample COD BOD5 TF TN TKN NH3-N TSS pH TP DRP
7/3/19 2,330 586 107 59.4 78 24 1,530 7.8 4.43 1.34
14/3/19 1,640 525 51 59.9 77 22.6 762 8.2 5.29 2.41
Units g/m³
Page 4 of 23
4. Confirmation of any chemicals that are dosed before, into, or after the DAF treatment
stage.
The DAF utilises air only to float solids to the surface, with no chemical addition.
Chemical DAF treatment of meat processing wastewater generally involves the addition of
an acid to lower the pH to precipitate proteins out of solution. A followed poly electrolyte
(polymer) is then added to flocculate the solids which are removed by the scraper system.
Following chemical DAF treatment, the low pH wastewater (~pH 4.5) could not be irrigated
directly to land as it would likely burn the irrigated crop or pasture. The DAF wastewater
would need to either be mixed with an untreated waste stream or mixed with lime to raise
the pH.
5. Process outputs for the DAF. I.e. flow and load data that is representative of the discharge
to land. Data required is Flow (m³/hr and m³/d), COD, BOD, O&G, TN, TKN, NH3-N, TSS, pH,
TP & DRP, E. coli. We understand that these are the consented parameters required for
fortnightly sampling. The summary table, Table 4.2.1.6 Wastewater discharge quality
(2010-2017), provided in the AEE does not provide sufficient detail for assessment of
performance. Please provide the full data set.
Appendix 4 provides the full data set (period 2010 to 2017) of the consented parameters
for the final discharge to land, along with the daily discharge volumes. Fortnightly sampling
was implemented in June 2012.
The final discharge is the combination of process outputs from the DAF and screened
wastewater from the Animal Assembly (providing it hasn’t been re-directed through the
DAF as over flow).
As noted in the AEE S4.2 the DAF was commissioned in 2014 with Rendering and blood
drying operations also ceasing in 2014, both of which contributed to reduction in measured
parameters particularly total fat.
Investigation work, conducted during commissioning of the DAF plant at Takapau, assessed
the anticipated treatment efficiencies based on previous studies / findings at similar sized
sheep and beef plants for Non-chemical and Chemical treatment. These are summarised
below in Table 3 and compare the average removals currently being achieved (non-
chemically) from the limited DAF influent data available.
A comparison of current vs anticipated performance is shown in Table 3
Page 5 of 23
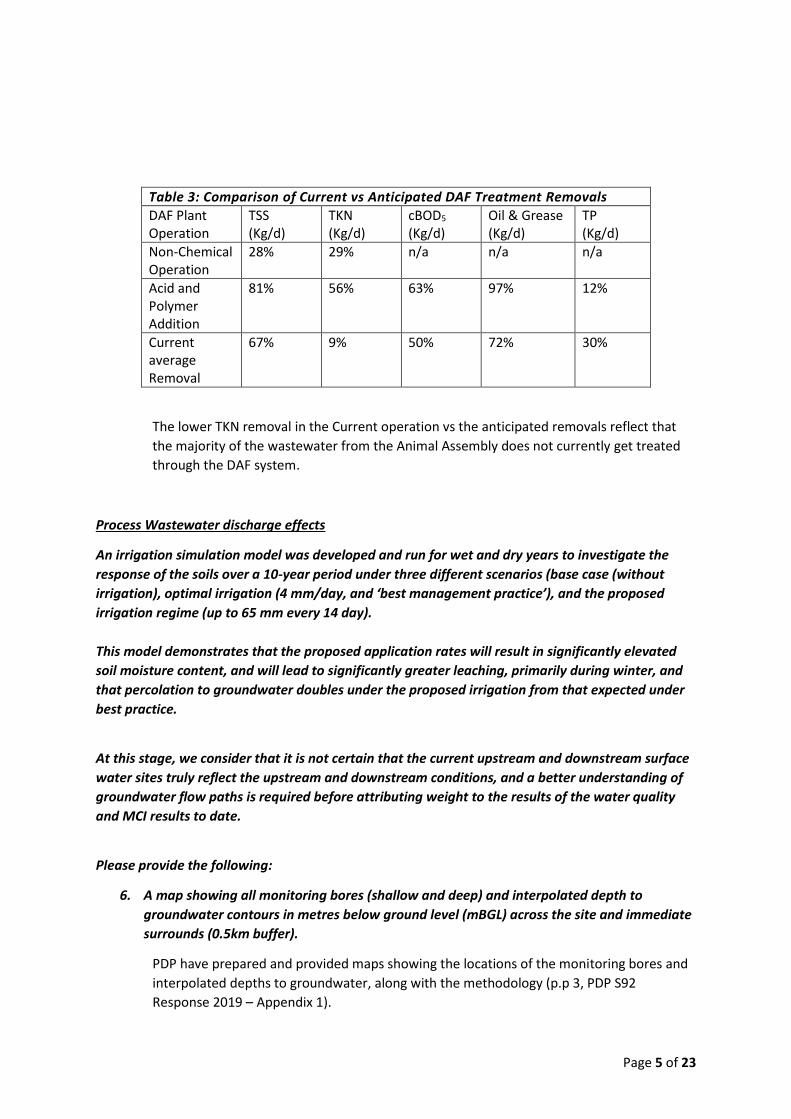
Table 3: Comparison of Current vs Anticipated DAF Treatment Removals
DAF Plant Operation
TSS (Kg/d)
TKN (Kg/d)
cBOD5 (Kg/d)
Oil & Grease (Kg/d)
TP (Kg/d)
Non-Chemical Operation
28% 29% n/a n/a n/a
Acid and Polymer Addition
81% 56% 63% 97% 12%
Current average Removal
67%
9% 50% 72% 30%
The lower TKN removal in the Current operation vs the anticipated removals reflect that
the majority of the wastewater from the Animal Assembly does not currently get treated
through the DAF system.
Process Wastewater discharge effects
An irrigation simulation model was developed and run for wet and dry years to investigate the
response of the soils over a 10-year period under three different scenarios (base case (without
irrigation), optimal irrigation (4 mm/day, and ‘best management practice’), and the proposed
irrigation regime (up to 65 mm every 14 day).
This model demonstrates that the proposed application rates will result in significantly elevated
soil moisture content, and will lead to significantly greater leaching, primarily during winter, and
that percolation to groundwater doubles under the proposed irrigation from that expected under
best practice.
At this stage, we consider that it is not certain that the current upstream and downstream surface
water sites truly reflect the upstream and downstream conditions, and a better understanding of
groundwater flow paths is required before attributing weight to the results of the water quality
and MCI results to date.
Please provide the following:
6. A map showing all monitoring bores (shallow and deep) and interpolated depth to
groundwater contours in metres below ground level (mBGL) across the site and immediate
surrounds (0.5km buffer).
PDP have prepared and provided maps showing the locations of the monitoring bores and
interpolated depths to groundwater, along with the methodology (p.p 3, PDP S92
Response 2019 – Appendix 1).
Page 6 of 23
• Figure 1 appended to the PDP (2019) report, shows monitoring bore locations.
• Figures 2a and 2b of PDP (2019) were prepared to illustrate the seasonal
differences in groundwater levels.
o Figure 2a shows the interpreted depth to groundwater in January 2017 and;
o Figure 2b shows the interpreted depth to groundwater in August 2017.
• Figures 2c and 2d show the corresponding interpolated groundwater elevation
plots for January 2017 and August 2017.
Figures 2a and 2b illustrate the seasonal differences, showing typically low groundwater
levels in summer/autumn and higher levels in winter/spring.
The interpreted depth to groundwater along the length of the Porangahau (in January
2017) was between 4m and 7m, the central part of the stream slightly lower. These levels
would indicate that the stream is likely losing to groundwater. Conditions in August also
indicate losing conditions. However, towards the western boundary the interpreted depth
to groundwater is reasonably shallow and some gaining flows are possible.
PDP commented that:
“… the information suggests that the Porangahau Stream typically loses water to
groundwater beneath the site...” p.p 4, PDP S92 Response 2019 – Appendix 1)
The implications of which are that:
“…nutrients leaching to groundwater as a result of the wastewater irrigation are
unlikely to enter the Porangahau Stream through the site, except during periods of
high groundwater levels…” (p.p 4, PDP S92 Response 2019 – Appendix 1)
7. A map showing interpolated groundwater elevation contours in metres above mean sea
level (mASML) for the shallow and deep aquifers. Provide a piezometric surface plot during
high and low river stage times for the shallow and deep aquifers to assess any changes in
groundwater flow direction under different climatic conditions.
PDP have prepared and provided maps showing the interpolated groundwater elevation
contours to provide piezometric surface plots during high and low river stage times to assess
groundwater flow direction, along with the methodology used (PDP S92 Response 2019 –
Appendix 1)
Figures 3a and 3b show the interpolated elevation contours for shallow and deep monitoring
bores for high and low stage periods.
PDP commented that:
“…the contours suggest that there are no significant changes in the general inferred
groundwater flow patterns with different stream flows/stage…” p.p 5, PDP S92
Response 2019 – Appendix 1)
Page 7 of 23
It would appear that this most recent interpolation is also consistent with previous work
undertaken in this area and it was noted that
“…figures indicate a similar groundwater contour pattern to that presented in Figure
7 in PDP (2010), with a slightly more north-easterly direction inferred for the
groundwater flow direction in the southern parts of the site.” p.p 5, PDP S92
Response 2019 – Appendix 1)
8. A map showing interpolated contours of nitrate nitrogen concentration (mg/L) in the
shallow and deep aquifers.
PDP considered that nitrate nitrogen contours could not be reliably defined given the
variables that dictate nitrate transport. PDP have responded to this request by preparing and
providing maps showing nitrate nitrogen concentrations in the bores with symbols (based on
concentration) to illustrate areas of higher and lower concentration. Maps and commentary
are included (p.p 5 PDP S92 Response 2019 – Appendix 1)
Figures 4a and 4b illustrate locations of higher and lower nitrate concentration.
The maps show a hot spot which has been previously identified by PDP from modelling
undertaken in 2010, as a result of historic border dyke irrigation activities. As outlined in the
modelling, PDP suggested that it could take up to 43 years for the plume of nitrates to fully
pass through the groundwater in the locations of the down gradient monitoring bores.
9. A map showing the extent of the area where an exceedance of the drinking water
standard is likely to occur (in both shallow and deep aquifers) and identify (using
databases of known wells and surveys or other methods) all domestic water supply bores
within this affected area.
PDP considered that it was not possible to reliably define an area where exceedance of the
drinking water standard is likely to occur with the current data available.
A map (Figure 5, PDP S92 Response 2019 – Appendix 1) has been provided showing the
results of the sampling of down-gradient supply bores on neighbouring properties and the
average readings for the 2017 regular monitoring bores.
The map shows:
“…no exceedances of the Maximum acceptable Value of 11.3mg/L in the Drinking
Water Standards for New Zealand in the bores, with the exception of bore 15639.
This is not unexpected given it is upgradient of the Lavers Bore (2898), where high
concentrations are still occurring...” (p.p 6 PDP S92 Response 2019 – Appendix 1)
Bore 15639 is not used for drinking water supply.
Page 8 of 23
10. Based on the interpolated groundwater contour elevations (question 7, above), comment
on the adequacy of coverage of the current array of monitoring bores for nitrate plume
detection and monitoring. Comment on location of upstream and downstream surface
water monitoring sites.
S 4.2 of the 2018 AEE outlines the continuous improvements that have been carried out at
the Takapau site over the term of the consent. Following the 2012 variation an additional
fourteen groundwater monitoring bores were installed, bringing the total number of
monitoring bores for Silver Fern Farms activities to twenty.
PDP have provided commentary on the adequacy of the current array of monitoring bores
(p.p 6, PDP S92 Response 2019 – Appendix 1) and in their view
“…the previously interpolated groundwater contours suggest the array of monitoring
bores is appropriate and this is supported by the more recently generated
contours…”. p.p 6, PDP S92 Response 2019 – Appendix 1)
And that:
” Overall, the groundwater monitoring data in most bores indicates minimal impact
from the plant, with the exception of the southern monitoring bores, which are
expected to reflect the historic border dyke irrigation.” p.p 6, PDP S92 Response 2019
– Appendix 1)
This is discussed further in the response to Question 11.
In regard to surface water monitoring sites, the information provided in Question 6
suggested that the Porangahau Stream typically loses water to groundwater through the
site.
On this basis PDP considered that:
“the upstream site was reasonable” (p.p 6, PDP S92 Response 2019 – Appendix 1).
The current downstream site:
“.. is not expected to typically capture groundwater potentially impacted by the site
activities, it is still considered useful to monitor to capture periods where
groundwater may enter the stream and to demonstrate that the site is being
managed in a way that no direct discharges/runoff occurs with adverse impacts on
the stream.” (p.p 6, PDP S92 Response 2019 – Appendix 1).
However,
“…If water quality were measured in the Porangahau Stream further downstream
where groundwater discharge typically occurs, which could be some distance from
the site, influences from other properties would also be reflected in the data, so this
would not be considered appropriate to isolate Silver Fern Farms’ effects.” (p.p 6,
PDP S92 Response 2019 – Appendix 1).
Page 9 of 23
PDP concluded that:
“…while the operation appears to be having a limited impact on local water courses,
continuing to manage the operations with a view to maximising nutrient uptake via
harvest will limit the site’s contribution to cumulative nutrient effects on down
gradient waterways” (p.p 7, PDP S92 Response 2019 – Appendix 1).
On this basis, it would appear that no change is required to the groundwater monitoring or
surface water monitoring locations.
However, PDP did identify that the eastern edge of Block A or Block G could be suitable
locations for additional monitoring to add to spatial coverage and interpretation should
additional bores be considered.
11. Provide a hydrogeological description of the groundwater recharge, groundwater through-
flow and groundwater mean residence time characteristics using measured or typical
published values to support the description.
A hydrogeological description and methodology have been prepared by PDP and is provided
(p.p 7 & 8 PDP S92 Response 2019 – Appendix 1). Key descriptors are summarised below.
The Ruataniwha Plains contain a number of confined and unconfined aquifers. The aquifers
of the Ruataniwha basin are recharged through
• Rainfall
• River seepage
o from the main Tukituki and Waipawa Rivers
o lesser component from smaller streams
• Local recharge from irrigation (Silver Fern Farms activities and irrigation from other
properties) and run-off from the hills to the south
Groundwater flow direction is generally to the South East but locally tends towards the
north east (supported by groundwater contour maps prepared in response to Question 7)
PDP have previously outlined (2010) groundwater characteristics, these are reproduced
below.
Page 10 of 23
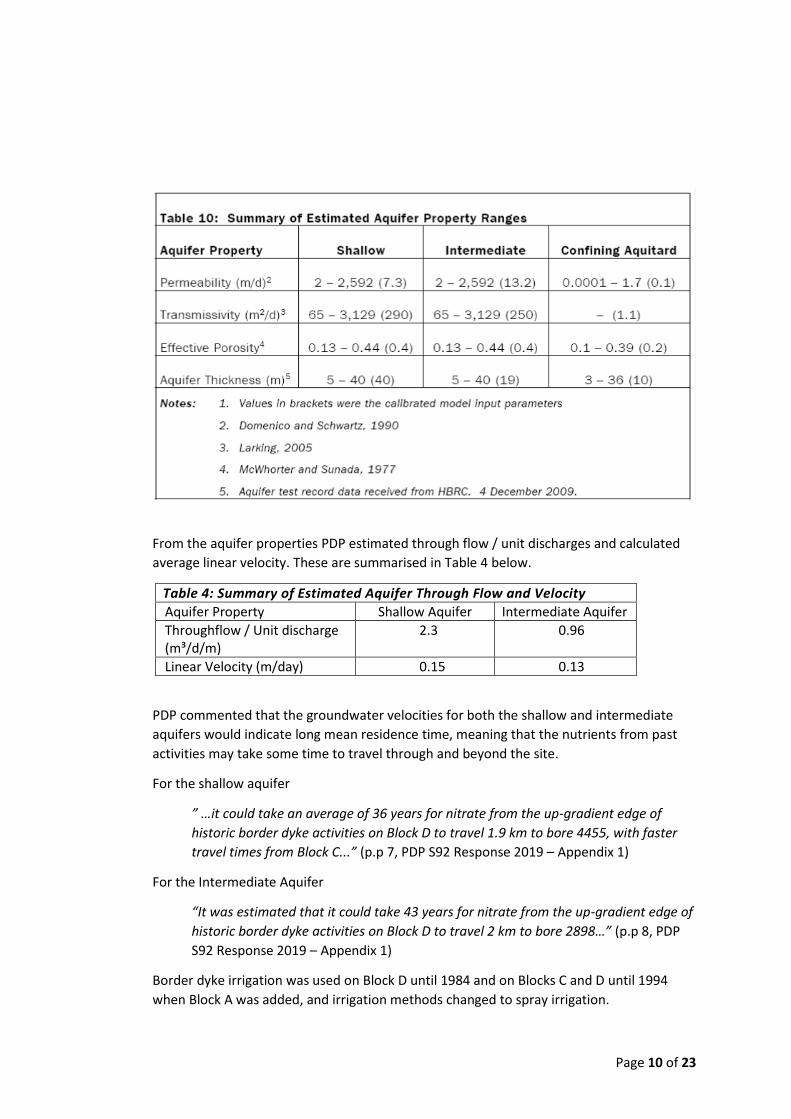
From the aquifer properties PDP estimated through flow / unit discharges and calculated
average linear velocity. These are summarised in Table 4 below.
Table 4: Summary of Estimated Aquifer Through Flow and Velocity
Aquifer Property Shallow Aquifer Intermediate Aquifer
Throughflow / Unit discharge (m³/d/m)
2.3 0.96
Linear Velocity (m/day) 0.15 0.13
PDP commented that the groundwater velocities for both the shallow and intermediate
aquifers would indicate long mean residence time, meaning that the nutrients from past
activities may take some time to travel through and beyond the site.
For the shallow aquifer
” …it could take an average of 36 years for nitrate from the up-gradient edge of
historic border dyke activities on Block D to travel 1.9 km to bore 4455, with faster
travel times from Block C...” (p.p 7, PDP S92 Response 2019 – Appendix 1)
For the Intermediate Aquifer
“It was estimated that it could take 43 years for nitrate from the up-gradient edge of
historic border dyke activities on Block D to travel 2 km to bore 2898…” (p.p 8, PDP
S92 Response 2019 – Appendix 1)
Border dyke irrigation was used on Block D until 1984 and on Blocks C and D until 1994
when Block A was added, and irrigation methods changed to spray irrigation.
Page 11 of 23
The significant reduction of nitrate nitrogen observed in bore 4455 is consistent with
estimated residence and travel times suggested for the shallow aquifer. Concentrations in
bore 2898 have stabilised however have not yet declined, reflecting the longer residence
time in the Intermediate aquifer.
The Aqualinc report raises similar issues with regard to irrigation efficiency and indicates that the
current irrigation system does not meet many of the performance criteria for effective and
efficient irrigation. It also notes that the wastewater storage pond only provides a 1 day of holding
capacity, which means that soils will be irrigated when they are already saturated.
The Aqualinc report notes that the maximum application depth of 65 mm was exceeded 5% of the
time, and that on a number of occasions, the application depth exceeded 100 mm. The latest
compliance report also indicates non-compliance with the 65 mm application depth limit.
12. Outline the steps that have or will be taken to ensure that application depth limits will be
met consistently and provide a timeframe for implementing these actions.
The majority of exceedances resulted from either mechanical issues or telemetry errors.
To manage each incident, repairs were made to the equipment and the corresponding
return period was increased to 21 days, greater than the consented 14-day maximum.
With the introduction of the modified irrigators and maintenance programme the incidents
of over application have been reducing season on season and application rates are now
generally consistent and within consented limits.
In the 2015-2016 reporting period there were 20 occasions where application rates were
over the 65mm application rate limit. In 2016-2017 this was down to 11 occasions. For the
most recent reporting period (2017-2018) all application rates and return periods were
within the consented limits with an annual average application rate of 42.43mm.
13. The Aqualinc report identifies a range of opportunities for improvement (page 57). Confirm
which of these improvements have already been implemented, and /or investigated, and
the outcomes of those investigations.
Silver Fern Farms have an ethic of continuous improvement and are in the process of
undertaking a companywide infrastructure review. The outcomes of this review will assist
in developing a programme of improvements for the Takapau site; including wastewater
storage, reticulation and application.
In the development of the programme for improvements to wastewater treatment and
disposal, Silver Fern Farms would like to work through the programme options in
conjunction with the HBRC. Working with the Council will ensure that Silver Fern Farms
continuous improvement plan aligns with those of other landholders in the catchment, to
Page 12 of 23
ensure the proposed actions are consistent with the desired improvement in water quality.
This is discussed further at the end of this report.
PDP have undertaken and provided soil moisture modelling as part of this response which
will also be used to guide improvements.
Silver Fern Farms have also engaged a consultant to review the Lysimeter data and
configuration to provide interpretation and any subsequent recommendations for
improvements.
14. Provide an analysis of the available soil moisture data for the irrigation blocks (collated
using daily medians) to demonstrate how condition 42 of the existing consent has been
complied with (i.e. irrigation not causing an exceedance of field capacity). Identify all key
parameters including field capacity, wilting point, and irrigation decision points, and
explain how the soil moisture system is used in scheduling and irrigation decision making.
As per the current consent, the site irrigates on a fixed return period basis, and do not fully
utilise the soil moisture system for scheduling and irrigation decision making. In s4.2.1.9 of
the AEE, Silver Fern Farms commented that the current fixed return periods were not
optimal for plant growth and the removal of nutrients. In light of this, Silver Fern Farms
proposed to add the option for a variable return period based on soil moisture levels.
PDP have prepared and provided an analysis of soil moisture data for the irrigation blocks.
The soil moisture model, including key parameters, is attached in Appendix 5.
PDP summarised that:
“Irrigation applications over 2010-2017 generally occurred when the soil is below
field capacity during the October to May period. (p.p 15, PDP Irrigation Soil Water
Balance Model Summary – Appendix 5)
And that:
“The model also showed that irrigation on the poorly draining gley soils prevalent in
E-block is being managed so that irrigation starts when the soil has a deficit;
however, the small profile depth expected to be available means that irrigation
applications are likely to exceed field capacity and sometimes, saturation” (p.p 15,
PDP Irrigation Soil Water Balance Model Summary – Appendix 5)
PDP concluded:
“Overall, the model results show that irrigation events in summer on most areas
(excluding E block gley soil areas) generally are not expected to cause exceedances of
field capacity (p.p 12, PDP S92 Response 2019 – Appendix 1)
However, irrigation of processing wastewater is required throughout the year, albeit at
reduced processing levels during the late autumn / winter, as such:
Page 13 of 23
“…during the May-September period soil moisture levels are constantly elevated due
to low evapotranspiration rates from cooler temperatures and more frequent
rainfall. Irrigation applications in this period will always be expected to cause the
soil to exceed field capacity and result in drainage to groundwater.” (p.p 12, PDP S92
Response 2019 – Appendix 1)
PDP also modelled a higher frequency, lower intensity irrigation system over a 3-day return
period for comparison. The model indicated that:
“…the change would slightly reduce drainage, with annual drainage reducing from
380mm/yr to 365mm/year. This reduction is not hugely significant, as the overall
hydraulic load has not changed significantly.; however, the change results in a
significant reduction in the days irrigation occurs when soil is above field capacity.”
(p.p 14, PDP Irrigation Soil Water Balance Model Summary – Appendix 5)
However, it was also noted that:
“even with this change in irrigation methodology, deficit irrigation is still not
achievable over the colder months (April – September)” (p.p 15, PDP Irrigation Soil
Water Balance Model Summary – Appendix 5)
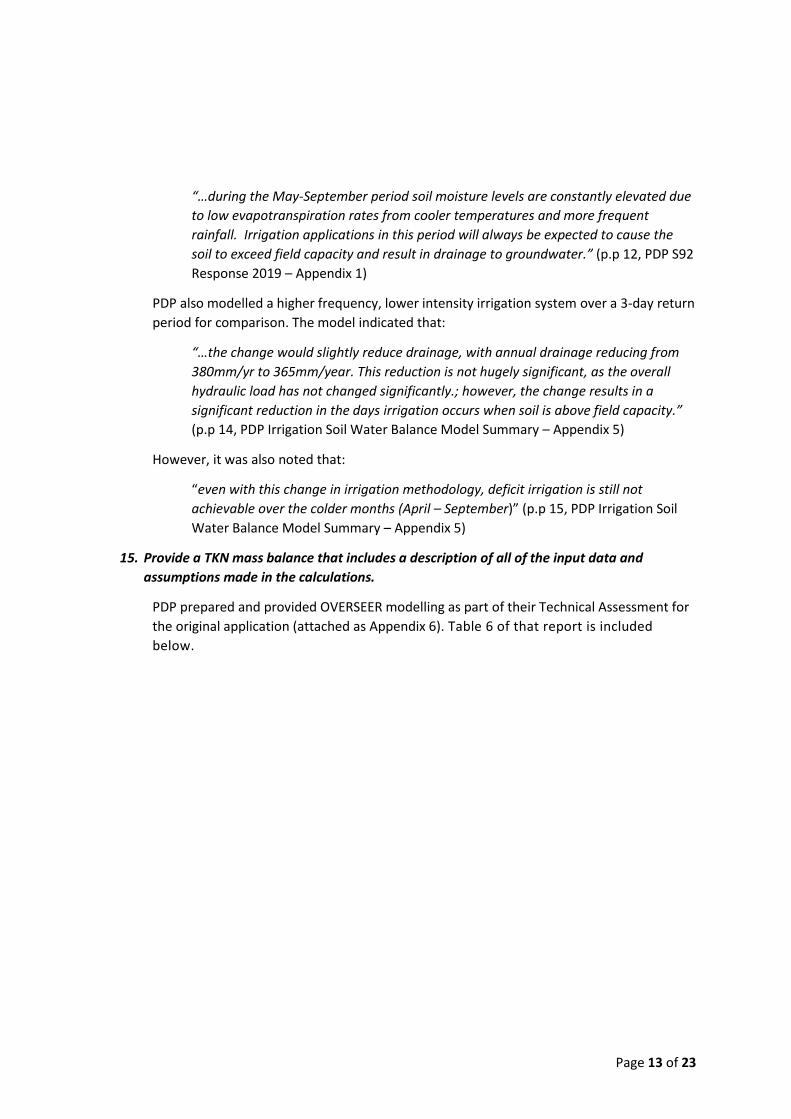
15. Provide a TKN mass balance that includes a description of all of the input data and
assumptions made in the calculations.
PDP prepared and provided OVERSEER modelling as part of their Technical Assessment for
the original application (attached as Appendix 6). Table 6 of that report is included
below.
Page 14 of 23
The Budget indicates that for the whole land holding the average Nitrogen loss to water is
17kg/Ha/Yr. This is considered reasonable when compared to the predominantly sheep
and beef farming land use in the wider area.
16. Provide the collated and plotted lysimeter time series data to show the drainage
concentrations of each lysimeter and to enable comparison between shallow and deep
lysimeters and input loads.
The information has been collated and is provided in Appendix 7.
Domestic wastewater (DP180250L) – treatment
In order to determine if this pond is treating domestic wastewater effectively, or to typical rules of
thumb, it is necessary to understand the load being applied. Little information is provided in this
regard.
In order to assess the effectiveness of the process wastewater treatment stages, please provide
the following:
Page 15 of 23
17. The average occupancy of the meat processing works:
a. During peak season, including timeframe for this season, and shift times.
b. Off-peak season, including timeframe for this season, and shift times.
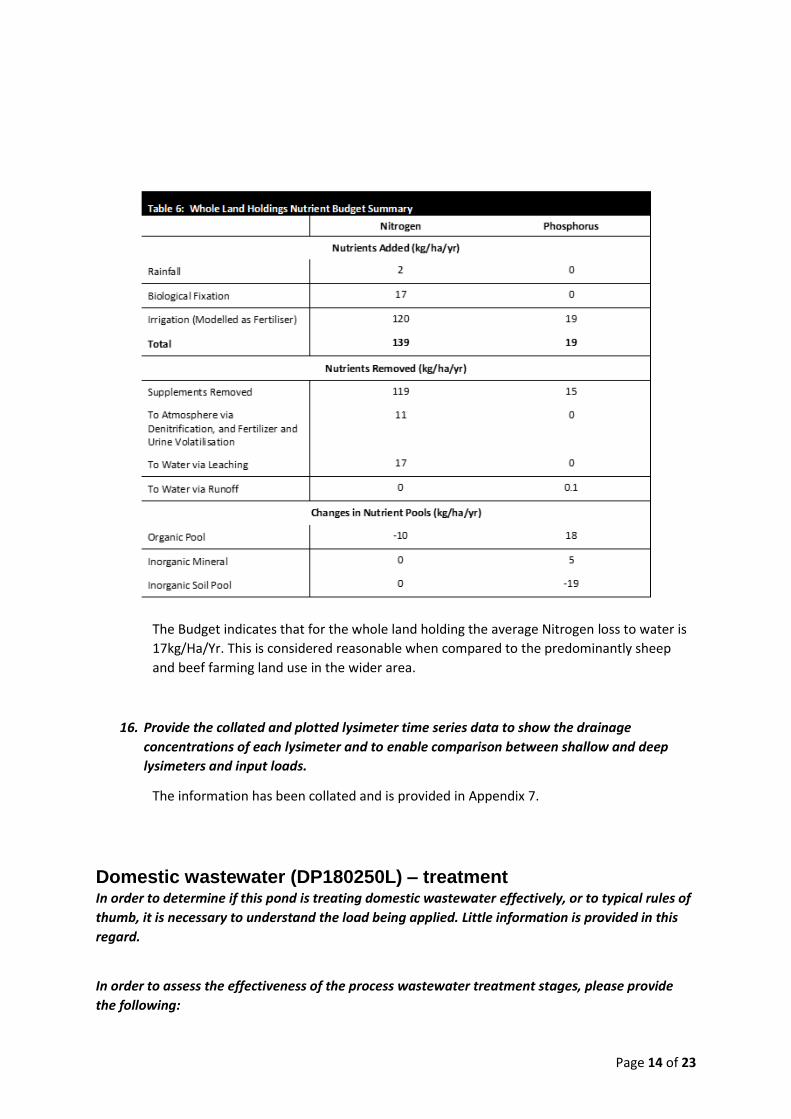
Silver Fern Farms Takapau operates for twelve months of the year, with a typically two-week
maintenance shutdown. One processing chain is operated for the whole year with the
second and third processing chains bought on line to accommodate increased throughput
and peak season processing. Table 5 below summarises the chain configuration, periods of
operation, staffing levels and shift times.
18. Oxidation pond details: Areal dimensions (we note the AEE already provides the area at
2200m² and depth at 1.5m), batter angle, when constructed, any solids levels measured,
when it was last de-sludged and how much sludge was removed, lining and wave band
details.
There is limited information from the construction of the oxidation pond. The nominal
pond dimensions when constructed were 76m long and 52m wide with a depth of 1500mm
(normal operating level of 1200mm).
The pond is lined with bentonite clay, with a concrete mesh reinforced wave band poured
directly onto the bentonite. Drawings of the Inlet and outlet structures and waveband
specifications are attached in Appendix 9.
There are no records of the pond being de-sludged in recent history.
19. Depth change in the pond when a single 750m³ “dose” to the irrigation field occurs (every
21days).
Table 5: Average staffing Levels
Chains Operating
Staffing Levels
Time Operational Over Year
Months Operating Shift times
1 400 12 months Jan to Dec – 2-week maintenance shut down in
generally in May
6:00am – 2:30pm
2 800 8-9 months Depending on Season
Jan to May – Sept/Oct to Dec
2:50pm – 11:30pm
3 1000 2 months Depending on Season
Dec/Jan 2:50pm -11:30pm
Page 16 of 23
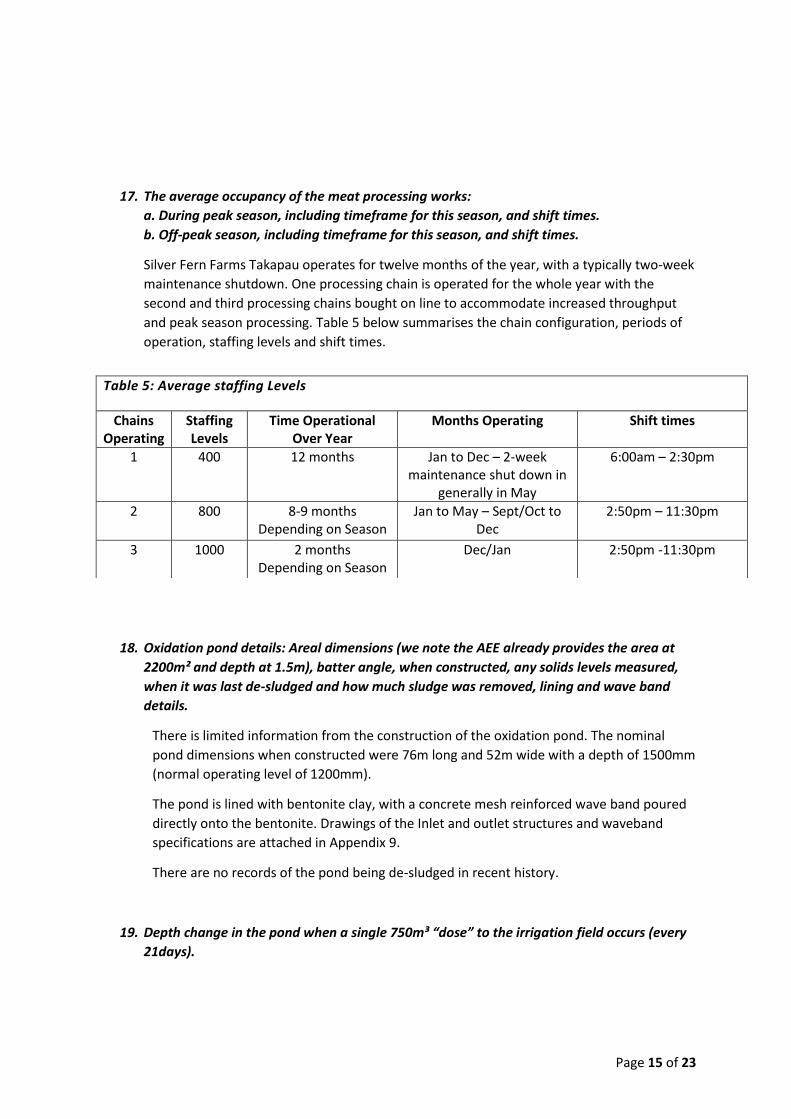
The depth change in the pond when field irrigation occurs has been measured on three
occasions. Table 6 below summarises the volume discharged and the corresponding
change in depth in the pond.
Table 6: Domestic Pond Depth Changes
Date Volume Discharged (m³) Depth Change in Pond (mm)
28/2/2019 746 320
21/03/2019 737 295
23/05/2019 698 305
20. Height of outlet weir above the base of the pond.
From the original plans available attached (Appendix 9). The design spec for the height of
the weir from the bottom of the pond was 1000mm.
21. Process inputs for the Oxidation Pond. I.e. flow and load (wastewater characterisation)
data. Data required is Flow (m³/hr and m³/d), COD, BOD, TN, TKN, NH3-N, TSS, TP.
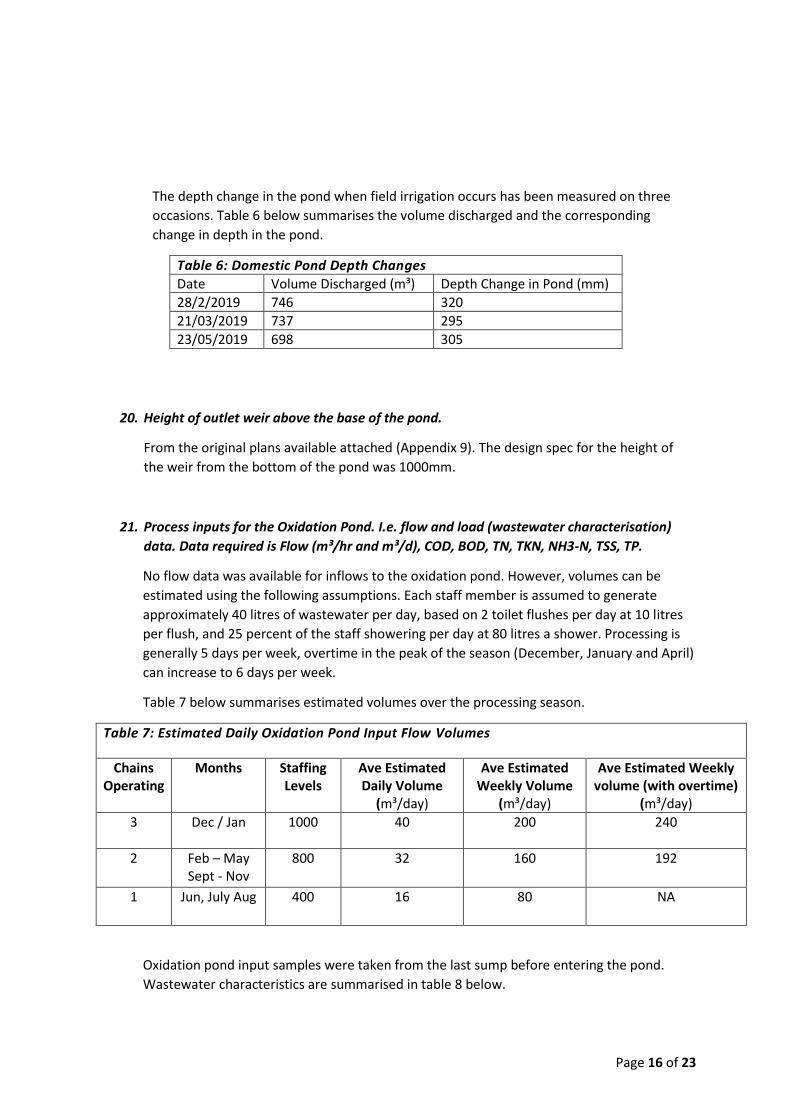
No flow data was available for inflows to the oxidation pond. However, volumes can be
estimated using the following assumptions. Each staff member is assumed to generate
approximately 40 litres of wastewater per day, based on 2 toilet flushes per day at 10 litres
per flush, and 25 percent of the staff showering per day at 80 litres a shower. Processing is
generally 5 days per week, overtime in the peak of the season (December, January and April)
can increase to 6 days per week.
Table 7 below summarises estimated volumes over the processing season.
Table 7: Estimated Daily Oxidation Pond Input Flow Volumes
Chains Operating
Months Staffing Levels
Ave Estimated Daily Volume
(m³/day)
Ave Estimated Weekly Volume
(m³/day)
Ave Estimated Weekly volume (with overtime)
(m³/day)
3 Dec / Jan 1000 40 200 240
2 Feb – May Sept - Nov
800 32 160
192
1 Jun, July Aug 400 16 80
NA
Oxidation pond input samples were taken from the last sump before entering the pond.
Wastewater characteristics are summarised in table 8 below.
Page 17 of 23
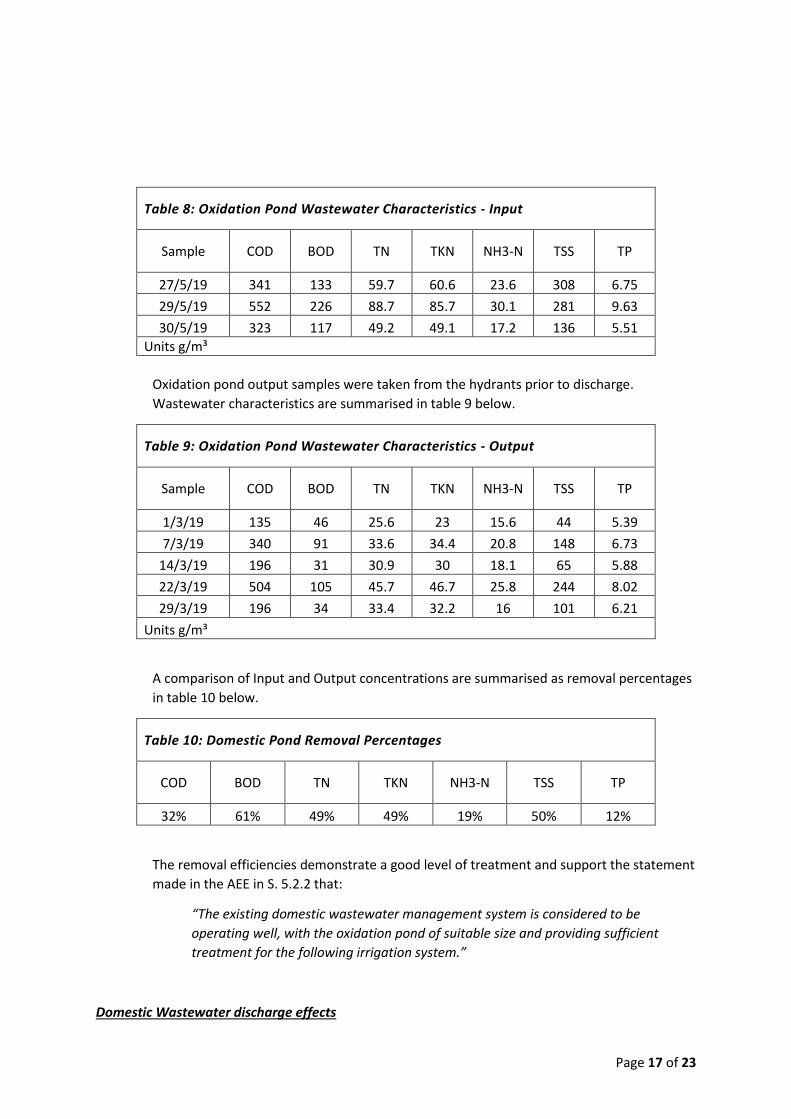
Table 8: Oxidation Pond Wastewater Characteristics - Input
Sample COD BOD TN TKN NH3-N TSS TP
27/5/19 341 133 59.7 60.6 23.6 308 6.75
29/5/19 552 226 88.7 85.7 30.1 281 9.63
30/5/19 323 117 49.2 49.1 17.2 136 5.51
Units g/m³
Oxidation pond output samples were taken from the hydrants prior to discharge.
Wastewater characteristics are summarised in table 9 below.
Table 9: Oxidation Pond Wastewater Characteristics - Output
Sample COD BOD TN TKN NH3-N TSS TP
1/3/19 135 46 25.6 23 15.6 44 5.39
7/3/19 340 91 33.6 34.4 20.8 148 6.73
14/3/19 196 31 30.9 30 18.1 65 5.88
22/3/19 504 105 45.7 46.7 25.8 244 8.02
29/3/19 196 34 33.4 32.2 16 101 6.21
Units g/m³
A comparison of Input and Output concentrations are summarised as removal percentages
in table 10 below.
Table 10: Domestic Pond Removal Percentages
COD BOD TN TKN NH3-N TSS TP
32% 61% 49% 49% 19% 50% 12%
The removal efficiencies demonstrate a good level of treatment and support the statement
made in the AEE in S. 5.2.2 that:
“The existing domestic wastewater management system is considered to be
operating well, with the oxidation pond of suitable size and providing sufficient
treatment for the following irrigation system.”
Domestic Wastewater discharge effects
Page 18 of 23
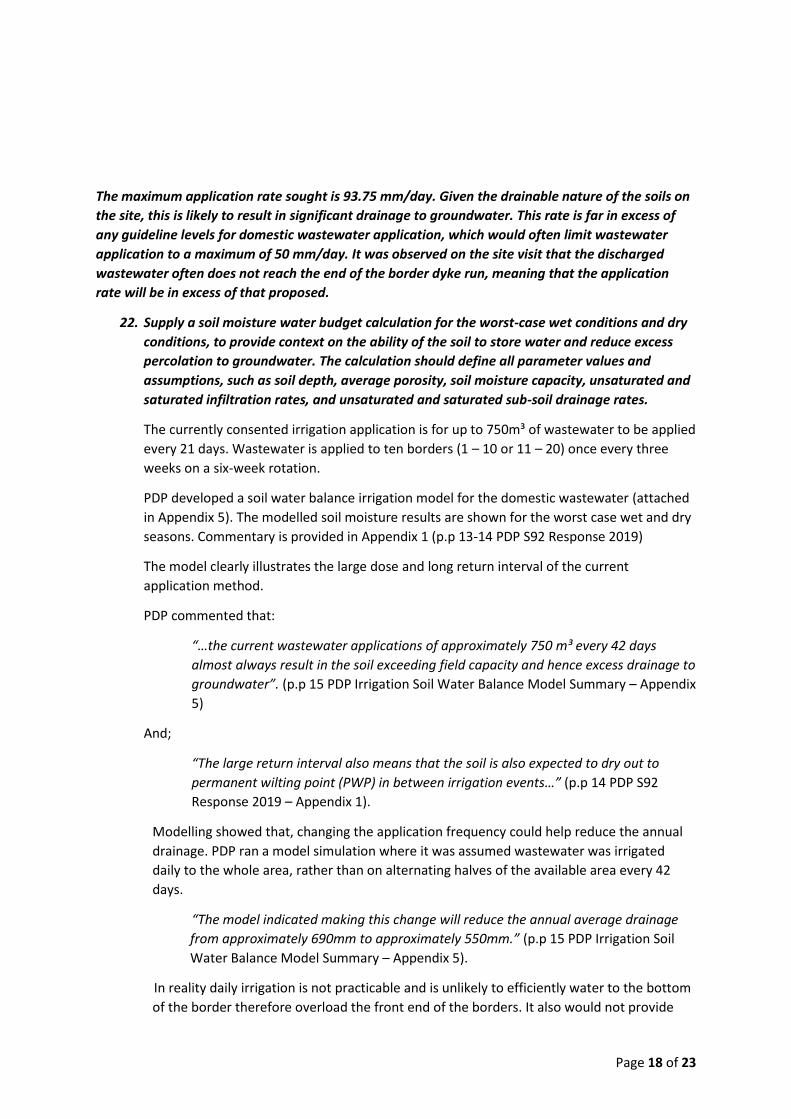
The maximum application rate sought is 93.75 mm/day. Given the drainable nature of the soils on
the site, this is likely to result in significant drainage to groundwater. This rate is far in excess of
any guideline levels for domestic wastewater application, which would often limit wastewater
application to a maximum of 50 mm/day. It was observed on the site visit that the discharged
wastewater often does not reach the end of the border dyke run, meaning that the application
rate will be in excess of that proposed.
22. Supply a soil moisture water budget calculation for the worst-case wet conditions and dry
conditions, to provide context on the ability of the soil to store water and reduce excess
percolation to groundwater. The calculation should define all parameter values and
assumptions, such as soil depth, average porosity, soil moisture capacity, unsaturated and
saturated infiltration rates, and unsaturated and saturated sub-soil drainage rates.
The currently consented irrigation application is for up to 750m³ of wastewater to be applied
every 21 days. Wastewater is applied to ten borders (1 – 10 or 11 – 20) once every three
weeks on a six-week rotation.
PDP developed a soil water balance irrigation model for the domestic wastewater (attached
in Appendix 5). The modelled soil moisture results are shown for the worst case wet and dry
seasons. Commentary is provided in Appendix 1 (p.p 13-14 PDP S92 Response 2019)
The model clearly illustrates the large dose and long return interval of the current
application method.
PDP commented that:
“…the current wastewater applications of approximately 750 m³ every 42 days
almost always result in the soil exceeding field capacity and hence excess drainage to
groundwater”. (p.p 15 PDP Irrigation Soil Water Balance Model Summary – Appendix
5)
And;
“The large return interval also means that the soil is also expected to dry out to
permanent wilting point (PWP) in between irrigation events…” (p.p 14 PDP S92
Response 2019 – Appendix 1).
Modelling showed that, changing the application frequency could help reduce the annual
drainage. PDP ran a model simulation where it was assumed wastewater was irrigated
daily to the whole area, rather than on alternating halves of the available area every 42
days.
“The model indicated making this change will reduce the annual average drainage
from approximately 690mm to approximately 550mm.” (p.p 15 PDP Irrigation Soil
Water Balance Model Summary – Appendix 5).
In reality daily irrigation is not practicable and is unlikely to efficiently water to the bottom
of the border therefore overload the front end of the borders. It also would not provide
Page 19 of 23
adequate stand down periods for grazing management. However, there is scope to
potentially modify irrigation frequency/intensity to optimise watering whilst minimising
leakage.
S5.4.2 of the AEE outlined the potential for nutrient leeching from the Domestic field and
that
“…whilst the modelled leaching loss of 100kg/Ha/Yr was considered relatively high
compared to surrounding land use when the domestic wastewater is looked at as
part of the wider activity for the entire Silver Fern Farms land holding, the combined
wastewater activities was modelled at a leaching loss rate through the soil of 17
kg/ha/yr is considered reasonable when compared to the predominantly sheep and
beef farming land use in the wider area.”
23. Confirm the down-gradient impact on groundwater quality, showing input concentration
and resulting groundwater concentration immediately down-gradient of the irrigation
system.
S. 5.4.3 of the 2018 AEE indicated that there are no monitoring bores located directly down
gradient of the Domestic border dyke system, so it is not possible to confirm downgradient
groundwater quality.
Concentrations from the sampling of domestic wastewater discharges have an average Total
Nitrogen concentration of 35g/m³.
PDP noted that OVERSEER results:
“…specifically for the border dyke system indicated nitrogen drainage concentrations
of 12-13 mg/L. The whole land holdings system modelled with a more recent version
of OVERSEER indicated the concentrations could be higher beneath the border dyke
system (around 23 mg/L). The resulting concentrations in the groundwater
immediately below the irrigation system would be expected to be less following
mixing with the underlying groundwater.” (p.p 16 PDP S92 Response 2019 –
Appendix 1).
Whilst OVERSEER can provide an estimate of the effects of the system, this would need to
be confirmed through monitoring of a down gradient bore as suggested by PDP.
24. Comment on whether it is possible to discharge domestic wastewater over a larger area
using the process wastewater irrigation system.
The cut and carry /removal of crops from the site is integral to the management of nutrients
on the site. The application of treated human waste could impact the ability to cut and carry,
as feed clients would likely be lost if human waste was applied to pastures. It would be Silver
Page 20 of 23
Fern Farms preference to keep the processing wastewater and domestic wastewater
separate. This is to minimise the risk to human health of the irrigation operators and also to
maximise the potential market for the product cut and carried from the site.
Tukituki Catchment Plan
Policy TT2 is specific to managing groundwater quality and is relevant to the proposal, but is not
considered in the application. It states that the adverse effects of activities that are likely to affect
the quality of groundwater located at a depth of 10 m or more should be managed in accordance
with the limits and targets set out in Table 5.9.2.
25. Please provide an assessment of the discharge to land activities proposed against POL TT2
and Table 5.9.2 of the TCP and comment on whether or not the activity is consistent with
this policy.
Commentary on Policy TT2 has been provided by PDP (pp.16-18 PDP S92 Response 2019 –
Appendix 1) and is summarised below.
Table 5.9.2: Groundwater Water Quality Limits and Indicators Applicable 10m or More
Below Ground Level in Productive Aquifer Systems, sets out limits for aesthetic
determinands, E.Coli, nitrate-nitrogen and other determinants. It sets out that:
• aesthetic determinands shall not exceed the relevant guideline value (GV) in the
Drinking-Water Standards for NZ (DWSNZ)
• E. Coli shall not exceed the MAV in the DWSNZ of 1 cfu/100 ml
• the maximum 95th percentile concentration of nitrate-nitrogen, measured over a
five year period, shall not exceed the MAV of 11.3 mg/L
• the maximum annual average of nitrate-nitrogen, measured over a five-year period,
shall not exceed half the MAV of (5.65 mg/L)
• all other inorganic or organic determinands of health significance shall not exceed
the relevant MAV.
Information from Silver Fern Farms monitoring bores has been used to assess against the
limits in Table 5.9.2, where relevant measurements are available, as the bores are generally
deeper than 10 metres.
• Aesthetic determinands monitored in the Silver Fern Farms bores are Sodium,
Chloride and pH.
The GV’s for sodium and chloride are 200mg/L and 250mg/L. The maximum level of
sodium observed in the bores is 64.3g/m³, the maximum level of chloride observed
in the bores is 100g/m³ both well within the respective GV’s.
Page 21 of 23
• The GV range for pH is 7.0-8.5. Observations show pH is generally within the upper
end of the GV range, PDP noted that:
“…although both upstream and downstream bores record values lower than the
lower end. Lower pH values naturally occur in groundwater systems. Values above
the upper end of the GV occur in some downstream deep bores. The process
wastewater quality data provided to us gives a maximum measured value of 8.2, so
it is considered unlikely that the wastewater would be causing the higher values.
Given this, it is not considered that improved management of the effects of Silver
Fern Farm’s activities would result in a significant change in measured pH
concentrations.” PDP (pp.17 PDP S92 Response 2019 – Appendix 1)
• For E. Coli, PDP outlined that:
“…both upstream and downstream bores have E.Coli detections, as expected for
shallow groundwater in a rural area. There is no clear difference in upstream and
downstream bores. Given this, it is not considered that improved management of the
effects of Silver Fern Farm’s activities would result in a significant change in
measured E.Coli concentrations.” (pp.18 PDP S92 Response 2019 – Appendix 1)
• For Nitrate Nitrogen PDP outline that:
“…nitrate Nitrogen exceeds the limits in table 5.9.2 in some bores. This includes two
upstream bores (15957 and 15960), although 15960 is technically a down-
gradient/downstream bore relative to Block D. The downstream bores exceeding the
limit are shallow bores 15958 and 15638, and deep bores 15871 and 2898.” (pp.18
PDP S92 Response 2019 – Appendix 1)
PDP also noted that:
“In general, bores 15960, 15958, 2898 and 15871 appear to be experiencing the on-
going effects of the historic loadings. Overall, the more recent information indicates
that the effects are generally less.” (pp.18 PDP S92 Response 2019 – Appendix 1)
Bore 15638 is the only downstream bore that has had an increasing trend in nitrate-
nitrogen. The bore is located down-gradient of Block A, on neighbouring land. It is
understood that the land has been used to grow potatoes and other crops and that
this land use may be contributing to the change in water quality, which means it is
difficult to isolate any effects due to Silver Fern Farms activities.
As outlined in response to question 15 nutrient modelling undertaken using
OVERSEER, indicated that the nitrogen leaching rate for Silver Fern Farms land
holdings (17 kg/ha/yr for the 2015/2016 season) was low for this type of wastewater
management system.
Page 22 of 23
The majority of the property is located over land mapped as Land use capability
(LUC) 3. This has a nitrogen leaching rate limit of 24.8 kg/ha/yr in Table 5.9.1D.
17 kg/ha/yr is in accordance with the farm/farm enterprise limits provided in Table
5.9.1D of the Tukituki Catchment Plan.
PDP considered overall
“…the discharge to land activities are generally consistent with Policy TT2. E.Coli
concentrations exceed the limit in Table 5.9.2 but there is no clear difference
between both upstream and downstream bores and exceedances of the MAV are
expected for shallow groundwater in rural farming areas. pH values occur outside
the GV range but are within the range naturally expected for groundwater. Nitrate-
nitrogen values exceed the limits in Table 5.9.2, which is predominantly expected to
be due to historic land use activities, but there is an increasing trend in Bore 15638
downstream of Block A.” (pp.19 PDP S92 Response 2019 – Appendix 1)
Notification / Continual improvement
In line with the requirements of the Tukituki catchment plan to improve water quality Silver
Fern Farms understand that all landowners will be required to make improvements to
reduce nutrient loss.
Silver Fern Farms has an ethic of continual improvement. A number of improvements were
made to the wastewater network and its management during the term of the current
consent and were outlined in section 4.2 of the AEE accompanying the original application.
Silver Fern Farms acknowledge that there are further opportunities for improvement to the
infrastructure and management of the wastewater. A companywide infrastructure review is
currently underway, the outcomes of this review will help form the basis and guide the
development of a programme of improvements for the Takapau site.
The preferred approach is to incorporate a mechanism within the consent conditions for a
proposed schedule of improvements, to be developed and refined in conjunction with the
Council. Silver Fern Farms see value in working through the improvement programme
options in conjunction with the HBRC so that the continuous improvement plan aligns with
those of other landholders in the catchment, to ensure the proposed actions are consistent
with the desired improvement in water quality.
In general terms there are three aspects where there are opportunities for improvement of
the management of wastewater:
• Irrigation Infrastructure – Silver Fern Farms currently irrigate wastewater to
approximately 214 Ha with 12 travelling irrigators. Transitioning away from the
current travelling irrigators to a potentially higher frequency, lower intensity
irrigation system could improve application rates and provide for a more uniform
distribution of hydraulic and nutrient loading. It would also help maintain the vigour
Page 23 of 23
of pasture year-round to optimise nutrient take-off. A staged implementation over 5
to 10 years could be used, firstly targeting the larger blocks, receiving higher
percentages of wastewater, and those utilised preferentially in the winter months
where more significant gains / improvements are likely to be seen.
• Wastewater Quality – reducing loadings in the wastewater before it is irrigated to
land is another option to reduce nutrient loading and loss. The current DAF system
is non-chemical. Options could include additional screening and treatment of all
wastewater streams through the existing DAF system or the addition of chemical
treatment to improve wastewater quality. Additional treatment could be year-round
or targeted in months where hydraulic loading is more likely to exceed field capacity
and therefore drainage to groundwater and nutrient loss is more likely. However,
the higher the level of treatment, additional solids disposal will become a factor.
• Wastewater Storage – the ability to hold additional material to reduce potential for
exceeding field capacity, although there is an increased risk in the evolution of
nuisance odour the longer wastewater is stored.
END