process safety metrics · process safety metrics have been separated in to different levels, as...
TRANSCRIPT

Process Safety Metrics
Guide for Selecting Leading and Lagging Indicators
2018
PSE Count PSE Rate PSE Severity Rate
2013 2014 2015 2016 2017
Version 3.1

Process Safety Metrics: Guide for Selecting Leading and Lagging Metrics
www.aiche.org/ccps Page 2 of 63
Table of Contents
Acronyms Preface 1 Introduction
2 Process Safety Indicator Overview
2.1 Process Safety Incident Designation
2.2 Process Safety Indicator Criteria
2.2.1 Process Involvement
2.2.2 Reporting Thresholds
2.2.3 Location
2.2.4 Acute Release
2.3 Process Safety Incident Flowchart
2.4 Exclusions
3 Tier 1 - Process Safety Event Indicators
3.1 Tier 1 Indicator Purpose
3.2 Tier 1 Process Safety Event Thresholds
3.3 Tier 1 Process Safety Event Severity Levels
4 Tier 2 - Process Safety Event Indicators
4.1 Tier 2 Indicator Purpose
4.2 Tier 2 Process Safety Event Thresholds
5 Reporting Process Safety Event Tier 1 and Tier 2 Metrics
5.1 Rate Adjusted Metrics
5.2 Industry Process Safety Metrics
5.3 PSE Metrics Interpretations and Examples
6 Tier 3 - Near Miss Incident Indicators
6.1 Tier 3 Indicator Purpose
6.2 Definition of a Process Safety Near Miss
6.3 Examples of Process Safety Near Miss Incidents
6.3.1 Challenges to Protection Layers
6.3.2 Process Deviations or Excursions
6.4 Management System Near Miss Incidents
6.5 Maximizing the Value of Near Miss Reporting

Process Safety Metrics: Guide for Selecting Leading and Lagging Metrics
www.aiche.org/ccps Page 3 of 63
7 Tier 4 - Operating Discipline and Management System Performance Indicators
7.1 Tier 4 Indicator Purpose
7.2 Incident Causation Models
7.3 Reducing Process Safety Risks
7.3.1 Defining Operational Discipline
7.3.2 The Impact of Operational Discipline on Risk
7.4 The Protection Layer Approach
7.5 The Risk Based Process Safety Approach
7.5.1 Examples from the "Commit to Process Safety" Pillar
7.5.2 Examples from the “Understand Hazards and Risk” Pillar
7.5.3 Examples from the "Manage Risk" Pillar
7.5.4 Examples from the "Learn from Experience" Pillar
7.6 Human Factors
7.6.1 Examples from Process Safety System Audits
7.6.2 Examples from Fatigue Risk Management
8 References
Appendix
A Glossary and Definitions
B Detailed Examples of PSE Indicators

Process Safety Metrics: Guide for Selecting Leading and Lagging Metrics
www.aiche.org/ccps Page 4 of 63
Acronyms
AIChE American Institute of Chemical Engineers
ANSI American National Standards Institute
API American Petroleum Institute
CCPS Center for Chemical Process Safety
COO Conduct of Operations
DGL Dangerous Goods List
DOT U.S. Department of Transportation
EHS Environmental, Health, and Safety
ITPM Inspection, Testing, and Preventive Maintenance Program
LOPC Loss of Primary Containment
MOC Management of Change
OD Operational Discipline
PRD Pressure Relief Device
PSE Process Safety Event
PSE1 Tier 1 Process Safety Event
PSE2 Tier 2 Process Safety Event
PSE1R Process Safety Event Rate – Tier 1 Indicator
PSE1SR Process Safety Event Severity Rate – Tier 1 Indicator
PSE2R Process Safety Event Rate – Tier 2 Indicator
PSI Process Safety Incident
PSIE Process Safety Incident Evaluation tool
RBPS Risk Based Process Safety
SIS Safety Instrumented System
TIH Toxic Inhalation Hazard
TQ Threshold Quantity
U.S. United States
UNDG United Nations Dangerous Goods

Process Safety Metrics: Guide for Selecting Leading and Lagging Metrics
www.aiche.org/ccps Page 5 of 63
Preface
The Center for Chemical Process Safety (CCPS) was established in 1985 by the American Institute of
Chemical Engineers (AIChE) for the express purpose of assisting industry in preventing or mitigating
process incidents and in helping effectively manage process safety risks. More than 200 corporate
members around the world drive the activities of CCPS today.
In 2006, the CCPS Technical Steering Committee authorized the creation of a project committee to
develop a guide for the development and use of leading and lagging process safety metrics. That
committee identified that a key breakthrough opportunity for industry was the development of industry
leading and lagging metrics that could be used to benchmark process safety performance
measurements across the chemical and petroleum industry. To achieve this objective, representatives
and members from major chemical and petroleum trade associations as well as other key global
stakeholders were engaged.
The outcome of the 2006 CCPS effort was published in December 2007. Many companies and
organizations used the definitions established in 2007. These definitions formed the basis and
creation of a new ANSI/API recommended practice, API RP 754: Process Safety Performance
Indicators for the Refining and Petrochemical Industries. This recommended practice was finalized
and released in April 2010. CCPS and several members of the original CCPS Metric committee were
involved in the API standard committee that developed API RP 754.
In 2011, following the release of API RP 754, the CCPS updated its 2007 guide to align the CCPS
guide with API RP 754. The intent was to ensure that a company or organization could use either the
CCPS or API documents for the top tier process safety event definitions and thus consistently classify
incidents.
In April 2016, API released the second edition of API RP 754 that included clarification of previous
definitions, addition of new definitions, incorporation of optional severity weighting guidance, and
revising the Tier 1 and Tier 2 thresholds [1]. Since the ultimate goal of the 2006 CCPS project was to
develop and promote the use of common metrics across the industry and around the world, CCPS is
once again updating this guide to align with API RP 754 so as to continue its support of common
industry performance metrics.
Acknowledging that performance metrics continue to evolve, CCPS has created an evergreen
webpage resource for process safety metrics and many other reports. The CCPS webpage contains
various links to resources, research, announcements, and other publications and will continuously
refresh to provide current information and resources for process safety performance metrics. For
additional information, please consult the CCPS Metrics webpage at: CCPS Metrics.

Process Safety Metrics: Guide for Selecting Leading and Lagging Metrics
www.aiche.org/ccps Page 6 of 63
1
Introduction
CCPS member companies share the vision of industry-wide process safety metrics, including a
common set of definitions and threshold levels that will serve individual companies and industry as a
whole by providing a mechanism to:
• indicate changes in company or industry performance, to be used to drive continuous
improvement in performance
• perform company-to-company or industry segment-to-segment benchmarking, and
• serve as a leading indicator of potential process safety issues which could result in undesirable
events.
This response was, in part, due to the BP U.S. Refineries Independent Safety Review Panel (“Baker
Panel”) and U.S. Chemical Safety Board each recommended for improved industry-wide process
safety metrics in their final reports dealing with the 2005 explosion at the BP Texas City refinery [2, 3].
Process safety metrics have been separated in to different levels, as described in this report, with
each level measured using “indicators” which can be monitored and evaluated. Hence, a company’s
process safety performance can be improved with changes implemented from their process safety
metrics evaluations.
As noted, an essential element of any continuous improvement program is the measurement and
trending of performance data. Therefore, to continuously improve upon process safety performance, it
is essential that companies in the chemical and petroleum industries implement effective leading and
lagging process safety indicators. The characteristics of these metrics are as follows [1]:
Reliable: They are measurable using an objective or unbiased scale. To be measurable, an
indicator needs to be specific and discrete.
Repeatable: Similar conditions will produce similar results and different trained personnel
measuring the same event or data point will obtain the same result.
Consistent: The units and definitions are consistent across the company. This is particularly
important when indicators from one area of the company are compared with those of another.
Independent of Outside Influences: The indicator leads to correct conclusions and is
independent of pressure to achieve a specific outcome.
Relevant: The indicator is relevant to the operating discipline or management system being
measured; they have a purpose and lead to actionable response when outside the desired
range.
Comparable: The indicator is comparable with other similar indicators. Comparability may be
over time, across a company, or across an industry.

Process Safety Metrics: Guide for Selecting Leading and Lagging Metrics
www.aiche.org/ccps Page 7 of 63
This guide describes the recommendations compiled by the CCPS Process Safety Metric committee
for a common set of company and industry leading and lagging metrics. Please refer to additional
CCPS guidance which has been published on selecting and managing process safety metrics [4, 5].
There are three types of metrics:
Lagging Metrics – A retrospective set of metrics based on incidents that meet an established
threshold of severity.
Near Miss Metrics – A set of metrics based on incidents with little or no consequence (i.e.,
retrospective, Lagging Metrics) or from proactive system performance evaluations and
observations (i.e., forward-looking, Leading Metrics).
Leading Metrics – A forward-looking set of metrics that indicate the performance of the key work
processes, operating discipline, or protection layers that help prevent potential incidents.
These three types of metrics can be considered as measurements at different levels of the incident
triangle shown in Figure 1. The triangle is divided into four separate levels based on the severity of the
incident which occurred or could have occurred. These levels correspond to the four Tiers noted in
API RP 754 [1], with the greatest consequence incidents occurring at the Tier 1 level (i.e., lagging
metrics) and the proactive performance evaluations occurring at the Tier 4 level (i.e., the leading
metrics). Please note that there is no defined line separating Tier 3 or Tier 4 level indicators since the
designation separating them as either leading or lagging is indistinct and will depend on the maturity of
the organization’s process safety program [6].
These Tiers and the indicators used to measure and evaluate them are described in greater detail in
this guide. It is strongly recommended that all companies select metrics at each Tier to help them
monitor their process safety performance. By sharing their information through benchmarking,
everyone will help drive continuous process safety performance improvements throughout the
industry. The metrics can be selected for the process safety elements, such as those based on the
twenty Risk Based Process Safety (RBPS) elements [7]. Recommended metrics for each of these
Tiers are described in more detail later in this guide

Process Safety Metrics: Guide for Selecting Leading and Lagging Metrics
www.aiche.org/ccps Page 8 of 63
Notes:
• Tier 3, Challenges to Protection Layers; includes near miss incidents
• Tier 4, Operating Discipline & Management System Performance Indicators; includes proactive evaluations and
continuous improvement efforts, such as operational discipline surveys [8], management reviews [7], process
safety management system audits [9], and field observations (e.g., behavior-based observations).
Figure 1
The Incident Triangle: Tiers and Their Corresponding Metric Types

Process Safety Metrics: Guide for Selecting Leading and Lagging Metrics
www.aiche.org/ccps Page 9 of 63
2
Tier 1 – Process Safety Incident Terminology
This section introduces the terminology used to designate process safety incidents and events,
provides guidance on the criteria for identifying an incident, such as what process is involved, what the
reporting thresholds are, where the incident occurred (its location), and what is considered as an acute
release. This section also provides a flowchart which can be used to help identify an incident based
on the severity of the release. Please note that some incidents are excluded and should not be
addressed when identifying leading and lagging process safety-related metrics.
2.1 Process Safety Incident Designation
The goal of a process safety risk and management system is to improve process safety performance
by identifying the hazardous materials and energies inherent to the process, identifying how to
effectively manage the risks associated with these hazards, and then effectively sustaining an
established process safety program. The program’s main goal is to “keep it in the pipes,” to prevent a
loss of containment of the hazardous material or energy and, thus, to help prevent catastrophic
incidents. The original 2008 CCPS term of Process Safety Incident (PSI):
Process Safety Incident/Event: An event that is potentially catastrophic, i.e., an event involving
the release/loss of containment of hazardous materials that can result in large-scale health and
environmental consequences.
became the basis for the API RP 754 Tier 1 Process Safety Event (PSE) described further in Section 3
of this guide [1, 10].
API RP 754 included three additional tier levels of lesser consequence than the Tier 1 PSE. The
distinction between the original CCPS PSI and the API Tier 1 or Tier 2 PSE designations is the
magnitude of the consequences of the loss of containment event: A Tier 1 PSE exceeds a threshold
level (it is catastrophic), whereas a Tier 2 PSE provides a minimum and upper limit threshold range
(and is used to normalize the industry metrics). The specific guidance on the Tier 1 and Tier 2
thresholds is described in Sections 3 and 4, respectively. It is important to recognize that the Tier 3
and Tier 4 event designations – the non-catastrophic incidents - result from near misses or proactive
evaluations. Tier 3 and Tier 4 events are described in more detail in Sections 6 and 7, respectively.
2.2 Process Safety Indicator Criteria
This section provides the guidance – the criteria – used to help identify what is a Tier 1 or Tier 2
Process Safety Event (PSE).

Process Safety Metrics: Guide for Selecting Leading and Lagging Metrics
www.aiche.org/ccps Page 10 of 63
2.2.1 Process Involvement
A Process Safety Event (PSE) satisfies the chemical or chemical process involvement criteria if the
following is true:
A process must have been directly involved in the damage caused. For this purpose, the term
"process" is used broadly to include the equipment and technology needed for on-site and off-
site facilities including chemical, petrochemical and refining production, reactors, tanks, piping,
boilers, cooling towers, refrigeration systems, etc. [adapted from both 1 and 10]. An incident
with no direct chemical or process involvement, e.g., an office building fire, even if the office
building is on a facility site, is not reportable.
An employee injury that occurs at a process location, but in which the process plays no direct part, is
not reportable as a PSE (though it could be regulatory reportable injury). The intent of this criterion is
to identify those incidents that are related to process safety, as distinguished from personnel safety
incidents that are not process-related. For example, a fall from a ladder resulting in a lost workday
injury is not a reportable PSE simply because it occurred at a process unit. However, if the fall resulted
from a chemical release, then the incident is reportable.
2.2.2 Reporting Thresholds
The reporting thresholds depend on the amount of material released. Loss of Primary Containment
(LOPC) events are defined as [10]:
Loss of Primary Containment (LOPC): An unplanned or uncontrolled release of material from
primary containment, including non-toxic and non-flammable materials (e.g., steam, hot
condensate, nitrogen, compressed CO2 or compressed air).
API RP 754 expands on the CCPS term as follows: {The release} from a process that results in
one or more of the consequences listed below:
Note: Steam, hot condensate, and compressed or liquefied air are only included in this
definition if their release results in one of the consequences other than a threshold quantity
release. However, other nontoxic, nonflammable gases with defined UN Dangerous Goods
(UNDG) Division 2.2 thresholds (such as nitrogen, argon, compressed CO2) are included in all
consequences including, threshold release.
The types of consequences for the Tier 1 and Tier 2 Process Safety Events are shown in Table 1.
Please note that the Tier 1 PSEs have no upper limit, whereas there is a range for the Tier 2 PSEs.

Process Safety Metrics: Guide for Selecting Leading and Lagging Metrics
www.aiche.org/ccps Page 11 of 63
Table 1
The Difference between the Tier 1 Level and Tier 2 Level Consequences
Consequences for a Tier 1
Process Safety Event (PSE1)
(Discussed in Section 3)
Consequences for a Tier 2
Process Safety Event (PSE2)
(Discussed in Section 4)
An employee or contractor day(s) away-from-work injury and/or fatality, or hospital admission and/or fatality of a third party (non-employee /contractor)
An employee, contractor or subcontractor recordable injury
An officially declared community evacuation or community shelter-in-place (including precautionary community evacuation or community shelter-in-place)
Not applicable
A fire or explosion resulting in greater than or equal to $100,000 of direct cost to the company
A fire or explosion resulting in greater than or equal to $2,500 and up to $100,000 of direct cost to the Company
An acute release of flammable, combustible, or toxic chemicals greater than the Threshold Quantities described in Table 2 in any one-hour period
An acute release of flammable, combustible, or toxic chemicals greater than the Threshold Quantities described in Table 4, and less than those described in Table 2, in any one-hour period
A release from pressure relief device (PRD) discharges, whether directly or via a downstream destructive device that results in any one of the following:
A release from pressure relief device (PRD) discharges, whether directly or via a downstream destructive device that results in any one of the following:
Rainout Rainout
Discharge to a potentially unsafe location Discharge to a potentially unsafe location
On-site shelter-in-place or on-site evacuation (excluding precautionary on-site shelter-in-place or on-site evacuation)
On-site shelter-in-place or on-site evacuation (excluding precautionary on-site shelter-in-place or on-site evacuation)
Public protective measures (e.g., road closure) whether actual or precautionary
Public protective measures (e.g., road closure) whether actual or precautionary
Notes:
1) Some non-toxic and non-flammable materials (e.g. steam, hot water, or compressed air) have no threshold quantities
and are only included in this definition because of their potential to result in one of the other consequences. 2) A pressure relief device (PRD), safety instrumented system (SIS), or manually initiated emergency depressure discharge
is a LOPC due to the unplanned nature of the release. The determination of Tier 1 PSE is based upon the criteria described below.
3) An internal fire or explosion that causes a LOPC from a process triggers an evaluation of the Tier 1 consequences. The LOPC does not have to occur first

Process Safety Metrics: Guide for Selecting Leading and Lagging Metrics
www.aiche.org/ccps Page 12 of 63
2.2.3 Location
A Process Safety Event satisfies the location criteria if:
The incident occurs in production, distribution, storage, utilities or pilot plants of a facility
reporting metrics under these definitions. This includes tank farms, ancillary support areas
(e.g., boiler houses and waste water treatment plants), and distribution piping under control of
the site.
All reportable incidents occurring at a location should be reported by the company that is responsible
for operating that location. This applies to incidents that may occur in contractor work areas as well as
other incidents.
At tolling operations and multi-party sites, the company that operates the unit where the incident
initiated should record the incident and count it in their PSE metric. API RP 754 provides more
detailed description of this concept in their definition of “responsible party” and “active warehouses.”
For a full list of materials cross-referenced to the UN Dangerous Goods definitions, see the CCPS
Process Safety Incident (PSI) Evaluation Tool posted on the CCPS Metrics webpage.
2.2.4 Acute Release
A “1-hour” rule applies for the purpose of the reporting Tier 1 or Tier 2 PSEs. Typically, acute releases
occur in 1-hour or less; however, there may be some releases that would be difficult to prove if the
threshold amount release occurred in 1-hour. (Example: A large inventory of flammable liquid is
spilled from a tank or into a dike overnight due to a drain valve being left upon prior to a transfer
operation. It may not be discovered for several hours, so it is difficult to know the exact time when the
threshold quantity was exceeded.) If the duration of the release cannot be determined, the duration
should be assumed to be 1 hour.
For a Tier 1 PSE designation (Section 3), the release of material reaches or exceeds the reporting
Threshold Quantity (TQ) listed in Table 2 in any 1-hour period. If a release does not exceed the TQ
level shown in Table 2 during any 1-hour period, it may be treated as a Tier 2 PSE.
For a Tier 2 PSE designation (Section 4), the release of material falls in the reporting threshold range
shown in Table 4 in any 1-hour period. If a release does not reach or exceed the minimum Threshold
Quantity (TQ) level of this range during any 1-hour period, it would not be treated as a Tier 2 PSE. If
the maximum level in Table 4 is exceeded, the release is considered a Tier 1 PSE.

Process Safety Metrics: Guide for Selecting Leading and Lagging Metrics
www.aiche.org/ccps Page 13 of 63
2.3 Process Safety Event Identification Flowchart
A flowchart that can be used to help identify a process safety incident is illustrated in Figure 2.
Figure 2
Flowchart Used to Determine a Tier 1 Process Safety Event
2.4 Exclusions
It is recommended that companies record and report metrics occurring at Company-owned or
operated facilities. However, the following exceptions may apply:
1. Incidents/Events that originated off Company property only if they are outside the control of the responsible party
2. Marine transport vessel incidents when the vessel is not connected to the facility (i.e., during feed-stock or product transfer)
Was there any unplanned or uncontrolledrelease of any material or energy that resulted in:1) An employee or contractor lost-time injury, fatality, or hospital admission or a third party fatality (non-employee / contractor)?
or 2) A fire or explosion resulting in $100,000 of direct cost to the company?
Did the incident occur in production, distribution, storage, utilities, or pilot plants at the facility reporting the metric?
Was the process directly involved in the damage caused?
Does not meet the criteria for aTier 1 Process Safety Event (PSE)
or 3) An acute release of flammable, combustible, or toxic materials?
or 4) Was there an officially declared community evacuation or community shelter-in-place?
Tier 1 Process Safety Event (PSE)
Yes
No
No
No
Yes
Yes
No
No
Yes
Yes
Yes
No

Process Safety Metrics: Guide for Selecting Leading and Lagging Metrics
www.aiche.org/ccps Page 14 of 63
3. Truck and/or rail incidents when the truck or rail car is not connected to the facility (i.e., during feedstock or product transfer) except when it is in the process of connecting or disconnecting to the process, or when the truck or rail car is being used for on-site storage. Any trucks or rail cars waiting to be unloaded due to limitations in available volume within the process are considered on-site storage
Note: Active staging is not part of connecting or disconnecting to the process; active staging is not considered on-site storage; active staging is part of transportation
4. Vacuum truck operations when not used for on-site truck loading or discharging operations,
or use of the vacuum truck transfer pump 5. Routine permitted or regulated emissions 6. Office, shop, and warehouse building incidents that do not involve process materials 7. Personnel safety "slip/trip/fall" incidents which are not directly associated with evacuating
from, or responding to a loss of containment incident 8. Planned and controlled drainage of a hazardous material to collection or drain system
designed for such service Note: Exclusion does not apply to an unintended and uncontrolled release of material from primary containment that flows to a collection or drain system
9. Quality Assurance (QA), Quality Control (QC) and Research and Development (R&D)
laboratories Note: Exclusion does not apply to pilot plants
10. On-site fueling operations of mobile and stationary equipment (e.g. pick-up trucks, diesel
generators, and heavy equipment)
Process Safety Metrics: Guide for Selecting Leading and Lagging Metrics
www.aiche.org/ccps Page 15 of 63
3
Tier 1 – Process Safety Event Indicators
3.1 Tier 1 Process Safety Event Indicator Purpose
The count of Tier 1 Process Safety Events (PSE1) is the most lagging performance indicator and
represents the Loss of Primary Containment (LOPC) events of greater consequence – designated as
“PSEs of Greatest Consequence” in Figure 1. Tier 1 PSEs, even those that have been contained by
secondary systems, indicate multiple barrier or protection layer system weaknesses. When the PSE1s
are used in conjunction with lower tier indicators, they help provide a company with an assessment of
its overall process safety performance.
3.2 Tier 1 Process Safety Event Threshold Quantities
The criteria for identifying a Tier 1 Process Safety Event (PSE1) were discussed in Section 2.2. These
criteria include the following: what process is involved, what the reporting thresholds are, where the
incident occurred (its location), and what is considered as an acute release.
The PSE1 Severity thresholds are listed in Table 2.
A comparison of the types of consequences for the Tier 1 and Tier 2 Process Safety Events
was shown in Table 1.
3.3 Tier 1 Process Safety Event Severity Levels
A severity level is assigned to each consequence category for Tier 1 PSEs using the criteria shown in
Table 3.

Process Safety Metrics: Guide for Selecting Leading and Lagging Metrics
www.aiche.org/ccps Page 16 of 63
Table 2
Tier 1 Process Safety Event (PSE1) Threshold Quantities
Threshold
Release
Category
Material Hazard
Classification a, c, d
Threshold
Quantity
(TQ)
Recommended
Threshold Quantity
(TQ) for indoorb
releases
1 Toxic Inhalation Hazard (TIH) Zone A Materials 5 kg
(11 lb)
0.5 kg
(1.1 lb)
2 Toxic Inhalation Hazard (TIH) Zone B Materials 25 kg
(55 lb)
2.5 kg
(5.5 lb)
3 Toxic Inhalation Hazard (TIH) Zone C Materials 100 kg
(220 lb)
10 kg
(22 lb)
4 Toxic Inhalation Hazard (TIH) Zone D Materials 200 kg
(440 lb)
20 kg
(44 lb)
5
Flammable Gases
or
Liquids with Initial Boiling Point 35 °C (95 °F) and Flash
Point < 23 °C (73 °F)
or
Other Packing Group I Materials excluding strong acids /
bases
500 kg
(1100 lb)
50 kg
(110 lb)
6
Liquids with Initial Boiling Point > 35 °C (95 °F) and
Flash Point < 23 °C (73°F)
or
Other Packing Group II Materials excluding moderate
acids/bases
1000 kg
(2200 lb)
or 7 bbl
100 kg
(220 lb)
or 0.7 bbl
7
Liquids with Flash Point 23 °C (73 °F) and 60 °C (140 °F)
or
Liquids with Flash Point > 60 °C (140 °F) released at
temperature at or above Flash Point
or
strong acids/ bases or Other Packing Group III Materials
or
Division 2.2 Nonflammable, Nontoxic Gases (excluding
Steam, hot condensate, and compressed or liquefied air)
2000 kg
(4400 lb)
or 14 bbl
200 kg
(440 lb)
or 1.4 bbl
Table 2 Notes continued on next page.

Process Safety Metrics: Guide for Selecting Leading and Lagging Metrics
www.aiche.org/ccps Page 17 of 63
Table 2 – Continued
Tier 1 Process Safety Event (PSE1) Threshold Quantities
Notes:
It is recognized that threshold quantities given in kg and lb. or in lb. and bbl. are not exactly equivalent. Companies
should select one of the pair and use it consistently for all recordkeeping activities.
If these threshold quantities are not exceeded, the release may be considered a Tier 2 Process Safety Event (PSE2).
Please refer to the threshold quantities for PSE2s in Table 4.
For additional references on the classifications used in this report, please refer to [1].
Table column notes [adapted from 1]:
a Many materials exhibit more than one hazard. Correct placement in Hazard Zone or Packing Group follow the rules of U.S. DOT 49 CFR 173.2a [11] or UN Recommendations on the Transportation of Dangerous Goods,
Section 2 [12].
b A structure composed of four complete (floor to ceiling) walls, floor, and roof.
c For solutions not listed on the UNDG, the anhydrous component is used to determine the TIH zone or Packing Group classification. The threshold quantity of the solution should be back-calculated based on the threshold
quantity of the dry component weight.
d For mixtures where the UNDG classification is unknown, the fraction of threshold quantity release for each component may be calculated. If the sum of the fractions is equal to or greater than 100%, the mixture exceeds the
threshold quantity. Where there are clear and independent toxic and flammable consequences associated with the mixture, the toxic and flammable hazards are calculated independently.

Process Safety Metrics: Guide for Selecting Leading and Lagging Metrics
www.aiche.org/ccps Page 18 of 63
Table 3
Tier 1 Process Safety Event (PSE1) Severity Categories
Severity Points
Consequence Categories
Safety/Human Health a
Direct Cost from Fire or Explosion
Material Release Within Any
1-Hour Period a Community Impact
Off-Site Environmental
Impact b, c
1 point
Injury requiring treatment beyond
first aid to an employee, contractor, or
subcontractor.
Resulting in
$100,000 ≤ Direct Cost Damage < $1,000,000.
Release volume 1x
≤Tier 1 TQ < 3x outside of secondary containment.
Officially declared
shelter-in-place or public protective measures (e.g., road
closure) for < 3 hours, or
Officially declared
evacuation <3 hours.
Resulting in
$100,000 ≤ Acute Environmental Cost < $1,000,000.
3 points
Days Away From Work injury to an
employee, contractor, or subcontractor, or
Injury requiring
treatment beyond first aid to a third
party.
Resulting in $1,000,000 ≤ Direct Cost Damage <
$10,000,000.
Release volume 3x ≤ Tier 1 TQ < 9x outside of secondary
containment.
Officially declared shelter-in-place or
public protective measures (e.g., road closure) for > 3 hours, or
Officially declared evacuation > 3
hours < 24 hours.
Resulting in
$1,000,000 ≤ Acute Environmental Cost < $10,000,000, or
Small-scale injury or
death of aquatic or land-based wildlife.
9 points
A fatality of an
employee, contractor, or
subcontractor, or
A hospital admission
of a third party.
Resulting in
$10,000,000 ≤ Direct Cost Damage < $100,000,000.
Release volume 9x
≤ Tier 1 TQ < 27x outside of secondary containment.
Officially declared
evacuation > 24 hours < 48 hours.
Resulting in
$10,000,000 ≤ Acute Environmental Cost < $100,000,000, or
Medium-scale injury or death of aquatic
or land-based wildlife.
27 points
Multiple fatalities of
employees, contractors, or
subcontractors, or
Multiple hospital
admission of third parties, or
A fatality of a third
party.
Resulting in ≥ $100,000,000 of
direct cost damages.
Release volume ≥
27x Tier 1 TQ outside of secondary
containment.
Officially declared evacuation > 48
hours.
Resulting in ≥ $100,000,000 of
Acute Environmental Costs, or
Large-scale injury or
death of aquatic or land-based wildlife
Notes:
a Where there is no secondary containment, the quantity of material released from primary containment is used (LOPC). Where secondary
containment is designed to only contain liquid, the quantity of the gas or vapor being released and any gas or vapor evolving from a liquid is
calculated to determine the amount released outside of secondary containment.
b Judging small, medium or large scale injury or death of aquatic or land-based wildlife should be based on local regulations or company
guideline
c The severity weighting calculation includes a category for “Off-Site Environmental Impact” and injury beyond “first aid” level of Safety/Human
Health impact which are not included in the Tier 1 PSE threshold criteria. However, the purpose of including both of these values is to
achieve greater differentiation of severity points for events that result in any form of injury or environmental impact.
4

Process Safety Metrics: Guide for Selecting Leading and Lagging Metrics
www.aiche.org/ccps Page 19 of 63
Tier 2 – Process Safety Event Indicators
4.1 Tier 2 Process Safety Event (PSE1) Indicator Purpose
The count of Tier 2 process safety events represents LOPC events of lesser consequence –
designated as “PSEs of Lesser Consequence in Figure 1. Tier 2 PSEs, even those that have been
contained by secondary systems, indicate barrier system weaknesses that may be potential
precursors of future, more significant events. In that sense, Tier 2 PSEs act as a leading indicator for
Tier 1 PSEs and can provide a company with opportunities for learning and improvement of its
process safety performance.
4.2 PSE2 Severity Threshold Quantities
The criteria for identifying a Tier 2 Process Safety Event (PSE) were discussed in Section 2.2. These
criteria include the following: what process is involved, what the reporting thresholds are, where the
incident occurred (its location), and what is considered as an acute release. Tier 2 PSEs, even those
that have been contained by secondary systems, indicate barrier or protection layer system
weaknesses that may be potential precursors of future, more significant incidents which could become
a Tier 1 PSE. Additional discussion on barriers – protection layers – and how weaknesses in
them result in incidents is provided in Section 7. Thus, Tier 2 PSEs provide a company with
lesser consequence-related learning opportunities. The Tier 2 PSE Severity threshold ranges are
listed in Table 4. If the maximum value is exceeded, then the incident is considered a Tier 1
PSE (see Table 2).
A comparison of the types of consequences for the Tier 1 and Tier 2 Process Safety Events
was shown in Table 1.

Process Safety Metrics: Guide for Selecting Leading and Lagging Metrics
www.aiche.org/ccps Page 20 of 63
Table 4
Tier 2 Process Safety Event (PSE2) Threshold Quantities
Threshold
Release
Category
Material Hazard Classification a, c, d Threshold
Quantity (TQ)
Recommended
Threshold Quantity
(TQ)
for indoorb releases
1 TIH Zone A Materials 0.5 kg (1.1 lb) 0.25 kg (0.55 lb)
2 TIH Zone B Materials 2.5 kg (5.5 lb) 1.25 kg (2.76 lb)
3 TIH Zone C Materials 10 kg (22 lb) 5 kg (11 lb)
4 TIH Zone D Materials 20 kg (44 lb) 10 kg (22 lb)
5
Flammable Gases
or
Liquids with Initial Boiling Point 35 °C (95 °F) and Flash Point < 23 °C (73 °F)
or
Other Packing Group I Materials excluding
strong acids/bases
50 kg (110 lb) 25 kg (55 lb)
6
Liquids with Initial Boiling Point > 35 °C (95
°F) and Flash Point < 60 °C (140 °F)
or Liquids with Flash Point > 60 °C (140 °F)
released at or above Flash Point
or
Other Packing Group II and III Materials
excluding moderate acids/bases
or
Strong acids and bases
100 kg
(220 lb)
or
0.7 bbl
50 kg
(110 lb)
or
0.35 bbl
7
Liquids with Flash Point ≥23 °C (73 °F) and
≤60 °C (140 °F)
or
Liquids with Flash Point >60 °C (140 °F)
released at a temperature at or above Flash
Point or
Strong acids/bases (see definition 3.1.2)
or
UNDG Class 2, Division 2.2 (non-
flammable, non-toxic gases) excluding air,
or
Other Packing Group III Materials
200 kg (440 lb)
or
1.4 bbl
100 kg (220 lb)
or
0.7 bbl.
8
Liquids with Flash Point > 60 °C (140 °F)
released at a temperature below Flash Point
or
Moderate acids/bases or Division 2.2
1000 kg
(2200 lb)
or
7 bbl
500 kg
(1100 lb)
or
3.5 bbl
Table 4 Notes continued on next page.

Process Safety Metrics: Guide for Selecting Leading and Lagging Metrics
www.aiche.org/ccps Page 21 of 63
Table 4 - Continued
Tier 2 Process Safety Event (PSE2) Threshold Quantities
Notes:
It is recognized that threshold quantities given in kg and lb. or in lb. and bbl. are not exactly equivalent. Companies
should select one of the pair and use it consistently for all recordkeeping activities.
If these threshold quantities exceed the minimum threshold quantities noted in Table 2, the release is considered a
Tier 1 Process Safety Event (PSE1).
For additional references on the classifications used in this report, please refer to [1].
Table column notes [adapted from 1]:
a Many materials exhibit more than one hazard. Correct placement in Hazard Zone or Packing Group follow the
rules of U.S. DOT 49 CFR 173.2a [11] or UN Recommendations on the Transportation of Dangerous Goods,
Section 2 [12].
b A structure composed of four complete (floor to ceiling) walls, floor and roof.
c For solutions not listed on the UNDG, the anhydrous component is used to determine the TIH zone or Packing Group classification. The threshold quantity of the solution should be back-calculated based on the threshold
quantity of the dry component weight.
d For mixtures where the UNDG classification is unknown, the fraction of threshold quantity release for each
component may be calculated. If the sum of the fractions is equal to or greater than 100%, the mixture exceeds the threshold quantity. Where there are clear and independent toxic and flammable consequences associated with the
mixture, the toxic and flammable hazards are calculated independently.

Process Safety Metrics: Guide for Selecting Leading and Lagging Metrics
www.aiche.org/ccps Page 22 of 63
5
Reporting Process Safety Event Metrics
This section provides guidance on common industry-wide process safety metrics which can be used to
indicate changes in company or industry performance and drive continuous improvement in process
safety performance. The rate adjusted metrics and industry process safety metrics described in this
section can be used to help benchmark between companies or industry segments. This section
concludes with a brief set of incident interpretations and examples from the extensive list provided in
Appendix B.
5.1 Rate Adjusted Metrics
Using the definitions provided in Appendix A, there are a variety of rate-based indicators which can be
generated. These include:
Tier 1 Process Safety Event Rate (PSE1R) =
(Total Tier 1 PSE Count / Total Work Hours) × 200,000
Tier 2 Process Safety Event Rate (PSE2R) =
(Total Tier 2 PSE Count / Total Work Hours) × 200,000
Process Safety Event Tier 1 Severity Rate (PSE1SR): =
(Total Tier 1 PSE Severity Count / Total Work Hours) × 200,000
In determining PSE1SR, please refer to Table 3, the listing of the Process Safety Event Severity
Categories. Thus, 1 severity point is assigned for each Level 4 incident consequence, 3 points for
each Level 3 consequence, 9 points for each Level 2 consequence, and 27 points for each Level 1
consequence. Theoretically, a PSE could be assigned a minimum of 1 point (i.e., the incident meets
the attributes of a Level 4 consequence in only one category; 1 x 1 = 1) or a maximum of 135 points
(i.e., the incident meets the consequences of a Level 1 incident in each of the five categories; 27 x 5 =
135).
5.2 Industry Process Safety Metrics
It is recommended that companies implement and publicly report the Tier 1 and Tier 2 Counts and
Rates and Severity Rates noted in Section 5.1.
To assist in benchmarking, it is beneficial when trade associations or consortiums collect and publish
this information for member companies. Please refer to the CCPS Metrics webpage for some
examples.

Process Safety Metrics: Guide for Selecting Leading and Lagging Metrics
www.aiche.org/ccps Page 23 of 63
5.3 PSE Metric Interpretation and Examples
This section provides metric interpretation guidance and examples to help clarify issues which may
arise when evaluating between Tier 1 or Tier 2 Process Safety Events. The current list of metric
interpretation and examples is provided as Appendix B in this guide. However, please note that future
changes to this appendix will be reflected in updates to the electronic version of this appendix located
the CCPS Metrics webpage
Example from “Company Premises”
1. A third-party truck loading a flammable product on Company Premises, experiences a leak and
subsequent fire and property loss damages of $100,000 (direct costs). Although the truck is
"Operated-by-Others", it is connected to the process. The incident is a Tier 1 PSE because direct
costs were equal to or greater than $100K.
Example from “Loss of Containment”
5. Ten barrels of gasoline (1400 kg, 3100 lbs.) leak from piping onto concrete and the gasoline doesn't
reach soil or water. Site personnel estimate that the leak was "acute" (e.g., occurred within a 1-hour
timeframe). This is a Tier 1 PSE because there was an "acute” loss of primary containment (e.g.,
within "1 hour") of 1000 kg (2200 lbs) or more of “Flammable Liquid”.
Example from “Acute Releases”
17. There is a 10 bbl. spill of gasoline (1400 kg, 3100 lbs.) that steadily leaked from piping onto soil over
a two-week time period. Simple calculations show the spill rate was approximately 0.03 bbl. per hour
(9 lbs.hr). This is not a Tier 1 or 2 PSE since the spill event was not an "acute" release (e.g., the
1000 kg (2200 lbs.) threshold exceeded in any 1-hour period), however, a company may choose to
record this event as a Tier 3 Other LOPC.
Example from “Safety Relief Device / System”
26. There is a unit upset and the relief valve opens to an atmospheric vent which has been designed per
API Standard 521 for that scenario, resulting in a gas release to the atmosphere with no adverse
consequences. Per API Standard 521 or equivalent, this event would not be a Tier 1 or 2 PSE since
vapors and gases released to atmosphere from safety valves, high-pressure rupture disks, and
similar safety devices that are properly designed for that event (Note: The release cannot have
resulted in liquid carryover, discharge to a potentially unsafe location, an on-site shelter-in-place, or
public protective measures (e.g. road closure) and a PRD discharge quantity greater than the
threshold quantity [1]). A company may choose to count this as a Tier 3 event since it is an
activation of a PRD that was not counted in Tier 1 or 2.

Process Safety Metrics: Guide for Selecting Leading and Lagging Metrics
www.aiche.org/ccps Page 24 of 63
6
Tier 3 – Near Miss Incident Indicators
Industry guidance, based on experience across many different industries, encourages all companies
to select and monitor more “proactive” indicators, such as near miss incidents (Tier 3) and
management system performance review (Tier 4) metrics. These indicators focus on the more
frequent, less severe incidents, as shown in the lower portions of the incident triangle in Figure 1.
Since a near miss incident typically is an actual incident or discovery of a potentially unsafe situation,
this metric could be defined as a lagging metric.
When an organization monitors their Tier 3 near miss incidents, large numbers of or an increase in the
number of near miss incidents is used as a precursor for a more significant incident potentially
occurring. These have been designated as “warning signs” that a company should recognize and
address before a Tier 2 - or worse, a Tier 1 - incident occurs [13]. Therefore, many companies use
these near miss metrics as a surrogate for a leading metric.
As a side note, once a near miss program has been implemented, companies have discovered that an
increase near miss reports - at least initially - is a positive sign of their improvements in their process
safety culture. The organization is improving its process safety awareness and its operational
discipline at all levels, helping improve its overall process safety performance. Therefore, it is quite
possible that the number of significant Tier 2 and Tier 1 incidents will decrease as the number of Tier 3
near miss incidents increases (Figure 1).
For an effective process safety and risk management program, it is essential that all companies
implement some type of a near miss incident reporting system. The metrics and definitions described
in this section should be considered when reviewing and updating an existing or implementing a new
reporting system. In addition, the data collected in and trended from a near miss program can be used
to help predict and prevent more serious incidents before they happen [1].
6.1 Tier 3 Indicator Purpose
A Tier 3 near miss incident typically represents a challenge to the barrier or protection layer system
that progressed along the path to harm, but is stopped short of a Tier 1 or Tier 2 PSE consequence –
designated as “challenges to protection layers” in Figure 1. Indicators at this level provide an
additional opportunity to identify and correct weaknesses within the barrier system.
Tier 3 indicators are too facility-specific for benchmarking or developing industry applicable criteria.
They are intended for internal company use and can be used for local (facility) public reporting. A
company may use all or some of the example indicators below:
safe operating limit excursions
primary containment inspection or testing results outside acceptable limits
demands on safety systems
other Loss of Primary Containment (LOPC) events, or
identify others that are meaningful to its operations

Process Safety Metrics: Guide for Selecting Leading and Lagging Metrics
www.aiche.org/ccps Page 25 of 63
6.2 Definition of a Process Safety Near Miss Incident
A "near miss" has three essential elements. While various wordings for a near miss definition are used
within industry, the overwhelming majority has these elements:
• An unexpected event occurs or a potentially unsafe situation is discovered
• The event or unsafe situation had reasonable potential to escalate, and
• The potential escalation would have led to significant adverse consequences
In other words, it was only a matter of timing (seconds) or location (distance, such as feet or meters)
which kept the incident from causing a fatality, a severe injury, significant environmental harm, or
significant property damage. For purposes of this report, the following “near miss” definition is used
[10]:
Near Miss: An undesired event that under slightly different circumstances could have resulted
in harm to people, damage to property, equipment or environment or loss of process.
This near miss definition may be applied to any aspect of an Environmental, Health, and Safety (EHS)
management program that is used for reporting environmental, health and personnel safety, or
process safety near misses. Please refer to the literature for an approach on integrating management
systems based on a risk-based process safety approach [5].
In order to specifically focus on process safety-related events in a near miss reporting program, many
companies have also developed a definition for a process safety near miss. Again, for purposes of this
report, the following process safety near miss definition is used:
Process Safety Near Miss:
Any significant release of a hazardous substance that does not meet the minimum
threshold for a Tier 2 Process Safety Event (PSE2) lagging metric (Table 4)
A challenge to a safety system, where challenges to a safety system can be divided into
the following categories:
o Demands on safety systems (pressure relief devices, safety instrumented systems,
mechanical shutdown systems)
o Primary containment inspection or testing results outside acceptable limits, or
o Process deviation or excursion

Process Safety Metrics: Guide for Selecting Leading and Lagging Metrics
www.aiche.org/ccps Page 26 of 63
6.3 Example of Process Safety Near Miss Incidents
6.3.1 Challenges to Safety Systems
Near misses for safety system challenges may fall into two categories:
1) The creation of a demand (a challenge) with successful operation of the safety system, or
2) The creation of a demand (a challenge) with one or more safety system failures, but the event
does not exceed any threshold limits (i.e., is a Tier 2 PSE).
Examples of these demands with successful or inadequate safety system responses:
• Opening of a rupture disc, a pressure control valve to flare or atmospheric release, or a
pressure safety valve when pre-determined trigger point is reached
• Failure to burst a rupture disk, open a relief valve, open a pressure control valve to a flare or
the atmosphere, or open a pressure safety valve when the system conditions reach or exceed
the prescribed trigger point
• Activation of a safety instrumented system when an “out of acceptable range” process variable
is detected, for example:
- activation of high pressure interlock on polyethylene reactor to kill reaction/shut off feed
- compressor shutdown from a high level interlock on the suction knockout drum
• Any time a safety instrumented system fails to operate as designed when a demand is placed
on the system (i.e. unavailability on demand)
• The number of times a mechanical shutdown system is called upon to function by a valid signal
whether or not the device actually responds
Note: Mechanical shutdown systems that are configured for equipment protection with no related
loss of containment protection should be excluded from the process safety near miss count
6.3.2 Process Deviations or Excursions
Near misses for process deviations or excursions include:
• Excursion of parameters such as pressure, temperature, flow outside of the standard operating
limits (the operating “window” for quality control) but remaining within the process safety limits
• Excursions of process parameters beyond pre-established critical control points or those for
which emergency shutdown or intervention is indicated
• Operation outside of equipment design parameters
• Unusual or unexpected runaway reaction whether or not within design parameters

Process Safety Metrics: Guide for Selecting Leading and Lagging Metrics
www.aiche.org/ccps Page 27 of 63
6.4 Management System Near Miss Incidents
Near misses for management system weaknesses and issues include discoveries through:
• The facility’s Inspection, Testing and Preventive Maintenance (ITPM) program
• Errors of omission or commission
• Unexpected or unplanned equipment conditions
• Physical damage to containment envelope
Examples for the ITPM-related near misses include:
• Primary containment inspection or testing results outside acceptable limits
• Primary containment inspection or test findings that detect operation of primary containment
equipment outside acceptable limits
• An ITPM finding that triggers an action, such as equipment or component replacement,
equipment recalibration, repairs to restore the equipment’s fitness-for-service, increasing the
inspection or testing frequency, and/or changing the of process equipment rating
(Note: The changes which trigger implementation through the facility’s Management of Change (MOC)
program [7] are good candidates.)
• An inspection or test finding that indicates vessels, atmospheric tanks, piping, or machinery
have been operating at pressures or levels that exceed the acceptable limits based upon wall
thickness inspection measurements
(Notes:
- A single event is recorded for each pressure vessel or atmospheric tank regardless of the number of
individual test measurements found to be below the required wall thickness.
- A single event is recorded for each pipe circuit regardless of the number of individual test
measurements below its required wall thickness as long as it is the same line, constructed of the
same material, and is in the same service.)
• Discovery of a failed safety system upon testing, such as:
- Relief devices that fail bench tests at set points
- Interlock test failures
- Uninterruptible power supply system malfunctions
- Fire, gas, & toxic gas detectors found to be defective during routine inspection/testing
- During inspection of an emergency vent line header, the header was found to be
completely blocked with iron scale because moisture from the emergency scrubber had
migrated back into the header
- During testing of an emergency shutdown system, a Teflon-lined emergency shutdown
valve was found stuck open because the Teflon had cold flowed and jammed the valve
- During inspection of a conservation vent, found the vent blocked by process material that
had condensed and frozen
• Discovery of a defeated safety system:
- Process upset with interlock in bypass condition
- Defeated critical instrument / device not in accordance with defeat procedure
- Bypasses left on after leaving block valve site

Process Safety Metrics: Guide for Selecting Leading and Lagging Metrics
www.aiche.org/ccps Page 28 of 63
Examples for errors of omission or commission include:
• Failure to remove line blanks in critical piping or failure to introduce the correct batch
ingredients in the proper sequence
• During replacement of a rupture disk, the disk was found with the shipping cover still in place
• Process control engineer accidentally downloaded the wrong configuration to a process unit
DCS
Examples for unexpected or unplanned equipment conditions include:
• Equipment discovered in "unexpected" condition due to damage or premature / unexpected
deterioration
• Wrong fittings used on steam system
• Failure of equipment like heat exchanger tubes leading to mix up and / or contamination of
fluids
Examples of physical damage to containment envelope include:
• Dropping loads / falling objects within range of process equipment
• Truck backed into wellhead
• Snow plow grazed gas line
6.5 Maximizing the Value for Reporting Near Miss Incidents
Near miss reporting provides valuable data for improving the process safety management systems at
a facility. The following processes can maximize the benefits from a process safety near miss
program.
Use the counts of the process safety lagging indicators (Tier 1 and Tier 2 PSEs, Sections 3 and
4, respectively), process safety near miss incidents (Tier 3, this section), and the performance
review indicators (Tier 4, described in Section 7), to verify that the incident reporting trend is
consistent with the process safety performance triangle depicted in Figure 1. (There should be
relatively few, if any, Tier 1 incidents relative to the number of Tier 3 and Tier 4 incidents.)
When evaluating process safety near misses, consider the potential adverse impacts. The
level of response to a near miss (i.e. investigation, analysis, and follow-up) should be
determined using the potential as well as the actual consequences of the event.
Tie the near miss data to the weak management system in order to drive system improvements
from near misses as well as from actual incidents. Example methods using the Bow Tie are
shown in the literature [14, 15, and 16].

Process Safety Metrics: Guide for Selecting Leading and Lagging Metrics
www.aiche.org/ccps Page 29 of 63
7
Tier 4 - Operating Discipline and
Management System Performance Indicators
This section contains a number of potential leading metrics based on proactive performance reviews.
These indicators provide a measure of the “health” of the organizations process safety and risk
management program. If measured and monitored, data collected for leading metrics can give early
indication of deterioration in the effectiveness of these key management systems. This enables
actions to be undertaken that restore the effectiveness of these systems and their corresponding
barriers or protection layers before any loss of containment event takes place.
It is recommended that all companies adopt and implement leading process safety metrics, including a
measurement of process safety culture [17]. However, given that there are many metrics which can be
selected and monitored, it is impractical to collect and report data for each of them. Companies
should identify which of these components are most important for ensuring the safety of their facilities,
and should select the most meaningful leading metrics where significant performance improvements
potentially exist. Additional guidance on selecting process safety metrics – both leading and lagging –
has been provided by the CCPS [4, 5].
The leading process safety metric examples provided in this guide were selected based upon the
experience of many organizations. These metrics include indicators for:
Barriers related to the hazards inherent in operations managing hazardous materials and
energies
Barriers related to the immediate or causal factors resulting in the loss of containment of
hazardous materials and energies which result in incidents with hazardous consequences:
fatalities, injuries, environmental harm, property damage and business interruption
This section sets the stage for how best to select leading indicators, first with a brief introduction to the
Swiss Cheese and Bow Tie incident causation models, then describing an approach used to help
reduce process safety risks (including how poor operational discipline affects the overall risk). The
causation models provide us with a visual tool to help describe weaknesses in the barriers – the
protection layers – which have been designed and implemented to help reduce our process safety
risks. This section concludes with a brief introduction to the CCPS Risk Based Process Safety (RBPS)
approach, providing leading indicator examples in context of the four RBPS pillars [7].

Process Safety Metrics: Guide for Selecting Leading and Lagging Metrics
www.aiche.org/ccps Page 30 of 63
7.1 Tier 4 Indicator Purpose
Tier 4 indicators typically represent performance of individual components of the barrier system and
are comprised of operating discipline and management system performance. Indicators at this level
provide an opportunity to identify and correct system-related weaknesses. Tier 4 indicators are
indicative of process safety system weaknesses that may contribute to future Tier 3 near misses, Tier
2 PSEs, or – most unfortunately – Tier 1 PSEs. In that sense, Tier 4 indicators help identify issues
and opportunities for both learning and process safety system improvements. Tier 4 indicators are too
facility-specific for benchmarking or developing industry applicable criteria. They are intended for
internal company use and for local (facility) reporting.
7.2 Incident Causation Models
Another way to consider metrics is that the incidents at the top of the triangle reflect situations where
failures to the multiple protection layers which are intended to prevent an incident (both physical layers
and work process/operating procedure layers) have failed, while the bottom of the triangle reflects
failures or challenges to one or two of these protection layers – yet other layers continue to function.
The multiple protection layer concept is represented in Figure 3, using the Swiss Cheese incident
causation model [18, 19]. Although this model oversimplifies the complexity inherent when managing
chemical processes, it serves as an excellent visual model for describing the challenges to the
protection layers and the weaknesses in process safety systems which can be effectively monitored
with process safety metrics.
A Bow Tie diagram can also be used to represent both the preventive and mitigative barriers –
protection layers – which represent the pieces of Swiss Cheese in the incident/accident causation
model [16]. These protection layers are shown in Figure 4, reflecting again that weaknesses in these
barriers – once aligned – can lead to an incident. The purpose of this guide is to help identify
indicators which identify preventive barriers (“leading indicators”) and those which identify mitigative
barriers (“lagging indicators”).
7.3 Reducing Process Safety Risks
Process safety programs are designed to lower the process safety risk involved when storing,
handling, and using hazardous materials and energies. The hazardous materials may be toxic,
flammable, explosive, and/or reactive (unstable). Lowering the process safety risks will help reduce
the likelihood of severe process safety events which can result in fatalities, injuries, environmental
damage, property loss, business interruption, and/or fines.

Process Safety Metrics: Guide for Selecting Leading and Lagging Metrics
www.aiche.org/ccps Page 31 of 63
Swiss Cheese Model Assumptions:
• Hazards are contained by multiple protective barriers.
• Barriers may have weaknesses or “holes.”
• When “holes” align, the hazard passes through the barriers resulting in the potential for adverse consequences.
• Barriers may be engineering controls or administrative controls such as procedures that require personnel
response and action.
• Holes can be caused by latent, incipient or degraded engineering designs, or by the incorrect action or inaction of personnel.
Figure 3
The Swiss Cheese Incident Causation Model [Adapted from 20]
HazardousEvent
ProcessHazard
Protection LayerOr the "Piece of Swiss Cheese"
Protection Layer WeaknessOr the "Hole in the Swiss Cheese"
Process Safety Metrics: Guide for Selecting Leading and Lagging Metrics
www.aiche.org/ccps Page 32 of 63
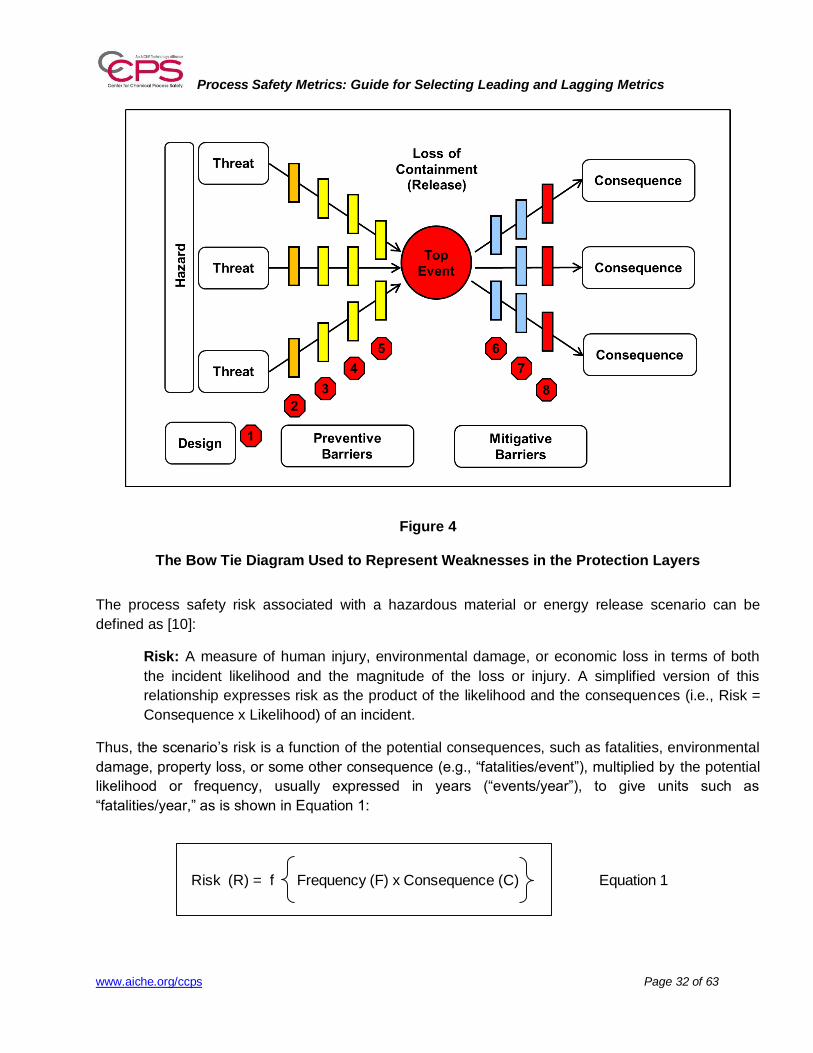
Figure 4
The Bow Tie Diagram Used to Represent Weaknesses in the Protection Layers
The process safety risk associated with a hazardous material or energy release scenario can be
defined as [10]:
Risk: A measure of human injury, environmental damage, or economic loss in terms of both
the incident likelihood and the magnitude of the loss or injury. A simplified version of this
relationship expresses risk as the product of the likelihood and the consequences (i.e., Risk =
Consequence x Likelihood) of an incident.
Thus, the scenario’s risk is a function of the potential consequences, such as fatalities, environmental
damage, property loss, or some other consequence (e.g., “fatalities/event”), multiplied by the potential
likelihood or frequency, usually expressed in years (“events/year”), to give units such as
“fatalities/year,” as is shown in Equation 1:
Risk (R) = f Frequency (F) x Consequence (C) Equation 1
Process Safety Metrics: Guide for Selecting Leading and Lagging Metrics
www.aiche.org/ccps Page 33 of 63
The frequency of a possible hazardous event is often determined by the effectiveness of process
safety systems and multiple protection layers; the potential consequences of the event are often
characterized by the inherent substance and process hazards. The goal is to reduce process safety
risks by evaluating and implementing different risk management strategies to reduce the frequency
and/or the consequences of potentially hazardous events. By measuring and monitoring process
safety leading indicators, an organization can proactively detect trends in their process safety and risk
management program to help prevent more serious incidents from occurring (Figure 1).
7.3.1 Definition of Operational Discipline
Since an organization’s continuous improvement efforts focus on leading indicators, it is useful to
define Operational Discipline, an essential part of the “Operating Discipline” aspects monitored in the
Tier 4 indicators. An “operating discipline” is an essential and distinctly different group inherent in a
manufacturing process, such as management, engineering, operations, maintenance, and purchasing.
Each of these disciplines must have systems in place to effectively manage their work, and each
discipline must be able to effectively interact with the other disciplines to effectively manage a
company’s process safety risks and sustain its process safety performance.
The current definition of “Operational Discipline,” applying to all disciplines, is as follows [10]:
Operational Discipline (OD): The performance of all tasks correctly every time; Good OD
results in performing the task the right way every time. Individuals demonstrate their
commitment to process safety through OD. OD refers to the day-to-day activities carried out by
all personnel. OD is the execution of the Conduction of Operations (COO) system by
individuals within the organization.
As we noted earlier, the organization must have leadership that expects good OD from everyone
managing its corporate process safety systems, policies, standards, guidelines, and facilities. This
leadership must drive the company’s process safety culture, providing adequate resources for its
continuous improvement efforts. Everyone across the organization must develop good habits and
have the regimen to work the right way every time. Additional information on the relationship between
COO and OD is provided in the literature [7, 8, and 20].
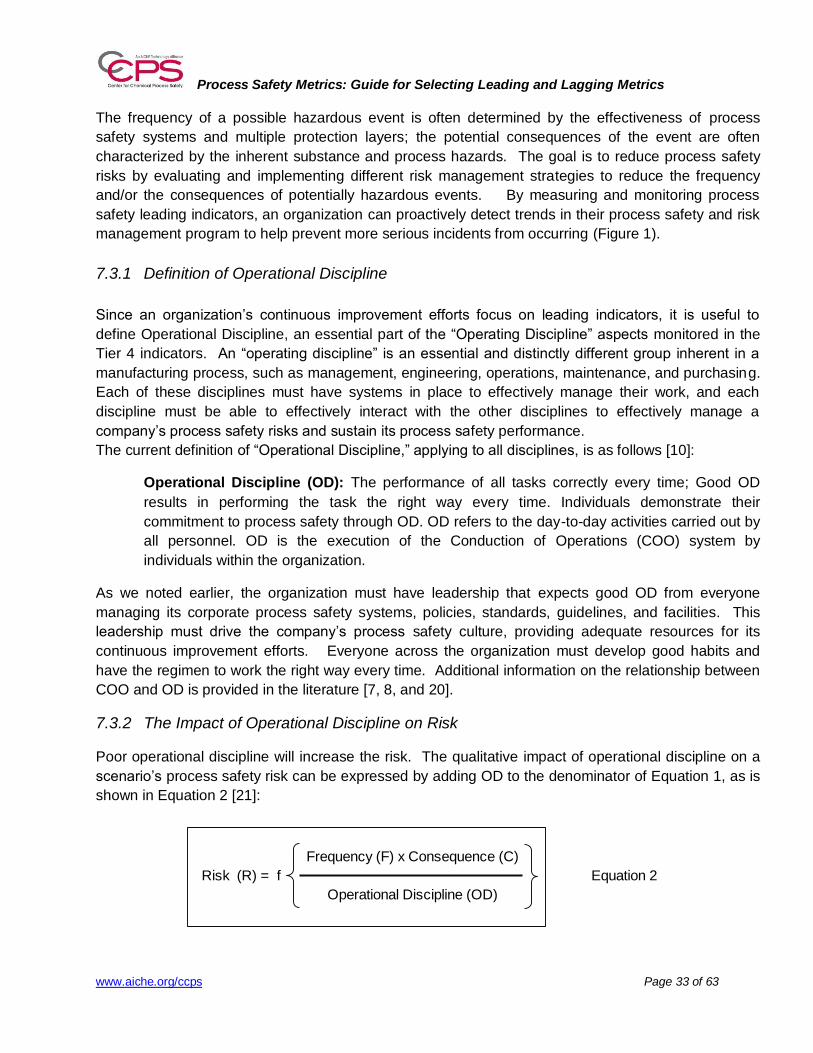
7.3.2 The Impact of Operational Discipline on Risk
Poor operational discipline will increase the risk. The qualitative impact of operational discipline on a
scenario’s process safety risk can be expressed by adding OD to the denominator of Equation 1, as is
shown in Equation 2 [21]:
Frequency (F) x Consequence (C)
Risk (R) = f Equation 2
Operational Discipline (OD)

Process Safety Metrics: Guide for Selecting Leading and Lagging Metrics
www.aiche.org/ccps Page 34 of 63
To help illustrate the impact of OD on the scenario’s risk, OD could be expressed as a simple
fractional form, such as 0.5 to represent 50% OD. For example, if personnel follow procedures only
half of the time, where OD = 0.5, Equation 2 shows that the risk is doubled. The “perceived” risk,
determined without the operational discipline term (Equation 1), does not reflect the “actual” risk,
determined with an operational discipline term (Equation 2) [21].
Please recognize that the relationship between risk, frequency, consequence and operational
discipline is more complex than the simple qualitative approach noted in this section. However, if
everyone works the right way every time, when OD is at 100%, when process safety systems are
followed and the protective layers are well designed and maintained, the overall operational risk
should decrease. As noted at the beginning of this section, poor OD increases the process safety risk.
An increased process safety risk may lead to more severe process safety events, harming an
organization’s process safety performance. For this reason, operational discipline is considered one
of the fundamental process safety foundations essential for an effective process safety program [20].
7.4 The Protection Layer Approach
One way to visualize the management systems as a barrier is by using the illustration representing a
protection layer framework – a series of walls – as is shown in Figure 5 [15, 20, 22, 23, and 24]. This
framework is sometimes noted as an “onion layer” approach. The hierarchy of these engineering and
administrative controls, represented as “Stop” signs for each barrier in Figure 5, is as follows [20]:
1. Design: These engineering controls are based on the basic process chemistry and design.
The process safety information is used to design the protection layers that ensure safe process
operation, including design of the instrumentation to control and monitor the process, helping
minimize the likelihood of an initiating event that could lead to an incident. Inherently safer
design principles are used in this protection layer to help reduce the need for additional
protection layers [25].
Manage Risk with preventive and mitigative barriers:
2. Process Safety Systems: These administrative controls, the process safety and risk
management systems, which have been designed to manage safe operation of facilities
handling hazardous materials and energies. The process safety systems, one of the three
foundations of an effective process safety program, include several elements, such as hazards
identification and risk analyses, equipment and asset integrity, management of change,
training, and auditing [5, 7, and 20].
3. Basic Process Control Systems: These engineering controls are designed and used to
ensure quality products and to operate the processes safely.
4. Instrumentation and Alarms. These engineering controls are designed to detect deviations
from the normal, expected operating parameters. Once deviations are detected, automatic
and/or human responses are required to keep the process operating in a safe state. These
responses may involve emergency or safe process shutdowns.
5. Safety Instrumented Systems (SIS): These independent engineering controls are designed
as the “last line of defense” before a hazardous release - a Loss of Primary Containment
(LOPC). The SIS responses may involve emergency or safe process shutdowns, as well.

Process Safety Metrics: Guide for Selecting Leading and Lagging Metrics
www.aiche.org/ccps Page 35 of 63
6. Active Mitigative Engineering Controls: These engineering controls are designed to reduce
or mitigate the consequences of a hazardous release. They include pressure relief devices,
flares, and scrubbers.
7. Passive Mitigative Engineering Controls: These engineering controls are designed to
reduce or mitigate the consequences of a hazardous release. They include dikes and catch
tanks.
8. Emergency Response: Emergency response systems are the engineering and administrative
controls designed to contain, reduce and mitigate the consequences of the hazardous release.
The engineering controls include foam systems; the administrative controls include emergency
response plans with trained internal and/or emergency responders. There are two aspects to
emergency response which are considered: 1) Internal – facility resources only; and 2) External
– with both internal and external, community resources.
Figure 5
An Example of Protection Layer Hierarchy [Adapted from 20]
Process Safety Metrics: Guide for Selecting Leading and Lagging Metrics
www.aiche.org/ccps Page 36 of 63
If the systems designed and implemented to effectively manage the process safety risks are weak,
then challenges and demands are made on the succeeding protection layers. The Loss of Primary
Containment (LOPC) occurs when the detecting protection layers fail (Barriers 3, 4, and 5; yellow in
Figure 5), resulting in activation of the mitigative layers (Barriers 6, 7, and 8; light blue). In this
context, in order of increasing incident severity, subsequent failures in these protection layers can lead
to the worst case scenario: requiring an emergency response due to fatalities, injuries, environmental
harm, and property damage (Barrier 8; red).
As depicted with the incident triangle in Figure 1 and the Bow Tie Diagram in Figure 4, the sequence
of protection layer failures begins with Tier 4 events (i.e., failures in Barrier 2), leading to Tier 3 near
miss events, Tier 2 PSEs, or Tier 1 PSEs. The emergency response system is activated in all cases if
the incident results in fatalities, injuries, environmental harm, property damage, and business
interruption (Barrier 8). For this reason, the systemic barrier failure approach focuses on effectively
measuring and monitoring the management systems performance and operational discipline-related
indicators for Tier 4 events (Figure 1).
In summary, the incident sequence which begins, in part, with systemic weaknesses (Barrier 2; orange
in Figure 5) is reflected with this combined approach:
1) Holes or gaps – weaknesses – in the engineering and administrative controls can lead to an
incident, as is represented with the Swiss Cheese Model (Figure 3)
2) Multiple hazardous threat scenarios can lead to a “top event” - a LOPC – that need to be
managed with preventive protection layers and mitigative protection layers, as is represented in
the Bow Tie Model (Figure 4), and then
3) The preventive and mitigative barriers – the walls - containing the hazard have failed due, in
part, to the systemic weaknesses from the beginning, as depicted in the Protection Layer
Model (Figure 5).
For this reason, the measuring and monitoring Tier 4 leading indicators help show us potential
systemic weaknesses which can adversely affect the engineering and administrative controls designed
to prevent incidents. As noted earlier, process safety culture and leadership, operational discipline,
and robust process safety systems are required for a company to have an effective process safety
program [20].
7.5 The Risk Based Process Safety Approach
The management systems that leading metrics have been developed for are based on the CCPS Risk
Based Process Safety (RBPS) model shown in Figure 6; there are four pillars with twenty elements as
listed in Table 5 [7, 26]. Please consult with the current CCPS Vision 20/20 efforts designed with five
tenets and four societal themes, shown in Figure 7 and listed in Table 6, to help companies effectively
manage the twenty RBPS elements as a part of its process safety and risk management program [27].
For additional information, please refer to the CCPS RBPS guidelines and CCPS RBPS Resources
webpages.

Process Safety Metrics: Guide for Selecting Leading and Lagging Metrics
www.aiche.org/ccps Page 37 of 63
Courtesy: David Guss, Nexen, Inc.
Figure 6
The CCPS Risk Based Process Safety (RBPS) Model [28]
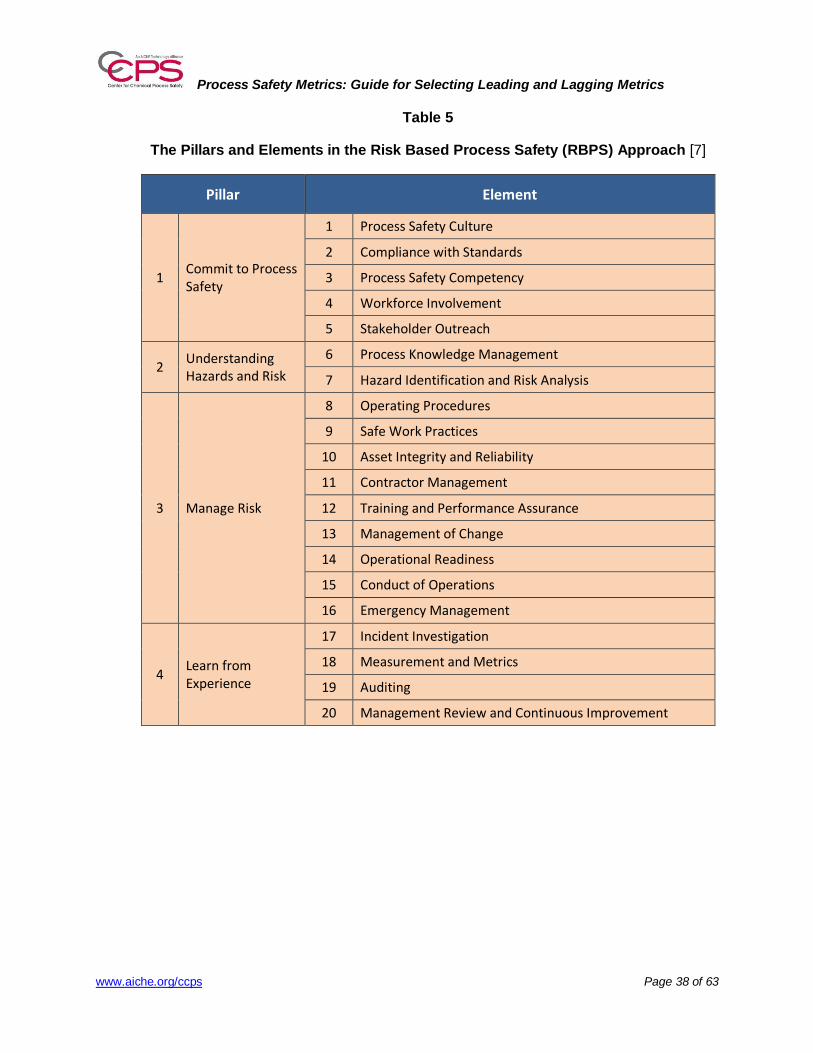
Process Safety Metrics: Guide for Selecting Leading and Lagging Metrics
www.aiche.org/ccps Page 38 of 63
Table 5
The Pillars and Elements in the Risk Based Process Safety (RBPS) Approach [7]
Pillar Element
1 Commit to Process Safety
1 Process Safety Culture
2 Compliance with Standards
3 Process Safety Competency
4 Workforce Involvement
5 Stakeholder Outreach
2 Understanding Hazards and Risk
6 Process Knowledge Management
7 Hazard Identification and Risk Analysis
3 Manage Risk
8 Operating Procedures
9 Safe Work Practices
10 Asset Integrity and Reliability
11 Contractor Management
12 Training and Performance Assurance
13 Management of Change
14 Operational Readiness
15 Conduct of Operations
16 Emergency Management
4 Learn from Experience
17 Incident Investigation
18 Measurement and Metrics
19 Auditing
20 Management Review and Continuous Improvement

Process Safety Metrics: Guide for Selecting Leading and Lagging Metrics
www.aiche.org/ccps Page 39 of 63
Figure 7
The CCPS Vision 20/20 Model [27]
Table 6
The CCPS Vision 20/20 Tenets and Societal Themes [27]
Five Industry Tenets
1 Committed Culture
2 Vibrant Management Systems
3 Disciplined Adherence to Standards
4 Intentional Competency Development
5 Enhanced Application & Sharing of Lessons Learned
Four Societal Themes
1 Enhanced Stakeholder Knowledge
2 Responsible Collaboration
3 Harmonization of Standards
4 Meticulous Verification

Process Safety Metrics: Guide for Selecting Leading and Lagging Metrics
www.aiche.org/ccps Page 40 of 63
7.5.1 Examples from the “Commit to Process Safety” Pillar
7.5.1.1 Process Safety Culture
A mechanism for measuring the effectiveness of process safety culture within chemical
process organizations would be to adopt the use of a cultural survey of the type included as
Appendix G of the Baker Panel report and discussed throughout the report used to determine
the adequacy of the safety culture at BP’s U.S. refineries [2].
The chemical and downstream oil processing sectors should consider use of a conduct of
operations or culture survey [2, 8, and 17]. The best and more likely, honest, results can be
obtained from an anonymous safety culture survey.
Note that a process safety culture survey is specific to the organization with its results not
being easily compared – benchmarked - between organizations. There are many other factors
that can affect the results. However, such surveys can be used to the benefit of the
organization to monitor improvements within an organization over time [17, 27].
7.5.2 Examples from the “Understand Hazards and Risk” Pillar
7.5.2.1 Process Hazards Analysis (PHAs)
(Number of PHAs documenting use of complete Process Safety Information (PSI) during
the PHA / Number of PHAs performed) x 100%
Note: Examples of PSI include documentation of accurate and up-to-date Process and
Instrumentation Diagrams (P&IDs) for Hazards and Operability Studies (HAZOPs).
7.5.2.2 PHA Recommendations
(Number of PHA Recommendations Overdue / Number of Total PHA Recommendations)
x 100%
7.5.2.3 Facility Siting Risk Assessments
(Number of PHAs documenting Facility Siting risk assessments/ Number of Total PHAs)
x 100%
Note: Not all PHAs require a quantitative facility siting risk assessment, however, if
consequences extend beyond the facility fenceline, a siting and layout of facilities study may be
warranted [29].
Process Safety Metrics: Guide for Selecting Leading and Lagging Metrics
www.aiche.org/ccps Page 41 of 63
7.5.3 Examples from the “Manage Risk” Pillar
7.5.3.1 Operating Procedures and Maintenance Procedures
A. Procedures Current & Accurate
(Number of operating or maintenance procedures reviewed/updated per year / Total
number of operating or maintenance procedures required to be reviewed/updated
during the measurement period) x 100%.
This metric measures the progress of the review/update cycle. A downward trend may
indicate that more attention or resources are needed to maintain procedures.
B. Procedures Clear, Concise & Include Required Content
(Number of operating or maintenance procedures reviewed for content / Total
number of operating or maintenance procedures) x 100%.
This metric measures the progress of creating clear, concise, and effective operating and maintenance procedures. A checklist of procedure criteria will need to be developed that addresses:
o Document control o Action steps that are clear and properly ordered
o Cautions, warnings, and notes
o Safe operating limits, consequences of deviations from limits, and steps to take to
maintain the process within the safe operating limits
o Limiting conditions for operation
o Checklists (where appropriate)
C. Confidence in Procedures
(Number of operators or maintenance technicians who believe that procedures are
current, accurate, and effective / Total number of operators or maintenance
technicians affected by the procedures) x 100%.
Results of opinion surveys of operators or maintenance technicians may provide early
indication of changes in the accuracy or effectiveness of procedures. The survey should
identify concerns about time required to update procedures, accuracy, and user
friendliness.
7.5.3.2 Asset Integrity
Please refer to additional guidance for asset integrity management [30, 31].
A. (Number of inspections of safety critical items of plant and equipment due during the
measurement period and completed on time/Total number of inspections of safety
critical items of plant and equipment due during the measurement period) x 100%.

Process Safety Metrics: Guide for Selecting Leading and Lagging Metrics
www.aiche.org/ccps Page 42 of 63
• This metric is one measure of the effectiveness of the process safety management
system to ensure that safety critical plant and equipment is functional
• This involves collecting data on the delivery of planned inspection work on safety critical
plant and equipment
• The calculation of the metric involves:
o Define the measurement period for inspection activity
o Determine the number of inspections of safety critical plant and equipment planned for
the measurement period
o Determine the number of inspections of safety critical plant and equipment completed
during the measurement period
• Inspections not undertaken during the previous measurement period are assumed to be
carried forward into the next measurement period
Definition:
Safety critical plant and equipment: Plant and equipment relied upon to ensure safe
containment of hazardous chemicals and stored energy, and continued safe operation. This
will typically include those items in a plant’s preventive maintenance program, such as:
Pressure vessels
Storage tanks
Piping systems
Relief and vent devices
Pumps
Instruments
Control systems
Interlocks and emergency shutdown systems
Emergency response equipment
B. (Length of time plant is in production with items of safety critical plant or equipment
in a failed state, as identified by inspection or as a result of breakdown/Length of
time plant is in production) x 100%
This is a metric to determine how effectively the safety management system ensures that
identified deficiencies of process safety equipment are fixed in a timely manner.
7.5.3.3 Process Safety Training and Competency Assurance
Please refer to additional guidance for training and competency assurance [32].
A. Training for PSM Critical Positions
(Number of Individuals Who Completed a Planned PSM Training Session On-
time)/(Total Number of Individual PSM Training Sessions Planned)
Process Safety Metrics: Guide for Selecting Leading and Lagging Metrics
www.aiche.org/ccps Page 43 of 63
Definitions:
PSM Critical Position: Any facility position that includes key activities, tasks, supervision,
and/or responsibility for component procedures critical to the prevention of and recovery
from major incidents.
Planned PSM Training Session: A specific exercise designed to enhance an individual’s
knowledge, skill, and/or competency in a PSM critical position for areas that directly
influence the prevention of and recovery from major incidents. A single individual may have
multiple training sessions during a reporting period. A single exercise may involve multiple
individual training sessions (e.g., a training class with multiple individuals).
Please refer to the competency guidelines and a competency survey provided by the CCPS
[5 (in Appendix G: The Process Safety Personnel Competency Survey), 32].
B. Training Competency Assessment
(Number of Individuals Who Successfully Complete a Planned PSM Training Session
on the First Try)/ (Total Number of Individual PSM Training Sessions with
Completion Assessment Planned for that time period)
Definitions:
Successful Completion: A passing grade on an exam or competency assessment for
which there is no requirement to repeat/redo the training, exam, competency assessment
or any part thereof.
Training Session with Completion Assessment: A planned PSM training session for
which there is a required demonstration of knowledge or skill through an examination or
competency assessment.
C. Failure to follow procedures/safe working practices
(Number of safety critical tasks observed where all steps of the relevant safe
working procedure were not followed/Total number of safety critical tasks observed)
x 100%
This metric is used to determine work place observation of tasks identified as being safety
critical that have a relevant safe operating procedure, whether all of the relevant steps are
followed.

Process Safety Metrics: Guide for Selecting Leading and Lagging Metrics
www.aiche.org/ccps Page 44 of 63
7.5.3.4 Management of Change
Please refer to additional guidance for management of change [33, 34].
A. Percentage of sampled MOCs that satisfied all aspects of the site’s MOC procedure.
• This metric measures how closely the site’s MOC procedure is being followed
• Involves a periodic audit of completed MOC documentation. Steps in conducting the
audit:
- Define the scope of the audit: time frame, frequency, and operating department(s)
- Determine the desired and statistically-significant sample size. This can be done
using widely-available tables, based on the total number of MOC documents in the
population
- Review the completed MOC documentation, including backup documentation such
as the hazard review and updated Process Safety Information such as operating
instructions and P&IDs
Calculate the metric:
% of MOCs properly executed =
100 x (# of properly executed MOCs) / (total # of MOCs)
B. Percentage of identified changes that used the site’s MOC procedure prior to making
the change.
• This metric measures how well a department/site (i) recognizes changes that require
use of the site’s MOC procedure and (ii) actually makes use of the procedure prior to
implementing changes
• Involves a periodic audit of the changes made in a department/site and a determination
of which changes required use of MOC; steps in conducting the audit:
- Define the scope of the audit: time frame and operating department(s)
- Identify the types of changes that may have bypassed the site’s MOC procedure,
based on how the site’s MOC procedure defines changes (see definition below)
- Identify changes that bypassed the MOC procedure; this can be done by:
o Reviewing maintenance work orders o Reviewing documentation from capital and maintenance projects o Reviewing Distributed Control System programming changes, and/or o Interviewing department personnel
Calculate the metric:
% of changes using MOC =
100 x (# of MOCs) / (# of MOCs + # of changes that bypassed MOC)

Process Safety Metrics: Guide for Selecting Leading and Lagging Metrics
www.aiche.org/ccps Page 45 of 63
C. Other Ideas
The two MOC metrics above provide a means by which companies can readily measure
how well they are identifying changes that need to be evaluated by MOC and how well they
are executing the MOCs they do identify.
One idea for enhancing the metric for how well a company is executing their MOC
procedure is to include a grading system for how well a given MOC followed the procedure,
rather than the yes/no ranking provided above. For example, if the company identified 25
key aspects to a properly completed MOC and a given MOC satisfied 20 of these aspects,
then the MOC would receive a grade of 0.8. An audit of multiple MOCs could generate an
overall average grade for the audit sample. An even more sophisticated approach could
include a relative weighting of the criticality of the, say, 25 aspects to a properly completed
MOC.
Another idea which could be considered is to measure how effective the site’s MOC
procedure is at identifying and resolving hazards related to changes. If so, the following
may be considered:
Percentage of start-ups following plant changes where no safety problems related to
the changes were encountered during re-commissioning or start-up.
• Involves real-time logging of start-ups, including safety problems encountered during
recommissioning and start- up, followed by a determination of which problems had a
root cause related to a change that was made
• Involves a periodic audit of completed MOCs that involved a shut-down and restart of a
unit or portion of a unit; steps in conducting the audit:
- Define the scope of the audit: time frame and operating department(s)
- Determine the number of start-ups of the unit(s) or portions of the unit(s)
following the implementation of changes
- Determine the number of these start-ups where a change-related safety problem
was encountered after checkout, during the recommissioning or start-up phases
Calculate the metric:
% of safe start-ups following changes = 100 x (# of start-ups following changes
without change - related safety problems during recommissioning and start-up) /
(total # of start-ups following changes)
A complicating factor that must be considered is the fact that problems from the change
may not show up until a long time after start-up.

Process Safety Metrics: Guide for Selecting Leading and Lagging Metrics
www.aiche.org/ccps Page 46 of 63
Definitions:
Changes requiring MOC review: The types of changes requiring use of the site’s
MOC procedure should be defined by the procedure. Normally this will include:
- Changes to equipment, facilities and operating parameters outside the limits defined
in the unit’s process safety information
- Process control modifications
- Introduction of new chemicals
- Changes to chemical specifications or suppliers
- Building locations and occupancy patterns
- Organizational issues such as staffing levels and job assignments
Checkout: The phase after a change is made and before the introduction of chemicals
and other hazardous materials when system integrity is confirmed. Potentially
hazardous conditions can be identified and corrected during checkout without resulting
in an incident.
Recommissioning: The phase after checkout and before start-up when chemicals are
introduced to the system and pressures/ temperatures may be increased. Potentially
hazardous conditions identified during recommissioning may result in a safety and/ or
environmental incident.
Start-up: The phase after recommissioning when production operations are initiated.
Potentially hazardous conditions identified during start-up may result in a safety and/or
environmental incident.
7.5.4 Examples from the “Learn from Experience” Pillar
7.5.4.1 Action Item Follow-up
(Number of past due of process safety action items / Total number of action items
currently due) x 100%.
This metric may be configured as one aggregate metric or several individual metrics of specific
past due items, such as:
• (Number of past due audit action items / total number of audit action items currently
due) x 100%
• (Number of past due PHA action items / total number of PHA action items currently
due) x 100%
• (Number of past due incident investigation action items / total number of incident
investigation action items currently due) x 100%
• (Number of past due PHA action items / total number of PHA action items active or
open) x 100%

Process Safety Metrics: Guide for Selecting Leading and Lagging Metrics
www.aiche.org/ccps Page 47 of 63
Definitions:
Currently Due: Actions with a due date less than or equal to the current date.
Past Due: Actions that are active or open and past their assigned completion date.
7.6 Human Factors
Human Factors considerations are an essential aspect when designing and managing the equipment
and systems to manage the process risks [35, 36]. Human factors studies are primarily concerned
with the interactions between people and the equipment, systems, and information in their work
environment. Human factors analysis focuses on the identification and avoidance of potential error-
likely situations in the operation of the process and in the maintenance of the associated equipment
and systems. A definition of Human Factors is as follows [10]:
A discipline concerned with designing machines, operations, and work environments so that
they match human capabilities, limitations, and needs. Includes any technical work
(engineering, procedure writing, worker training, worker selection, etc.) related to the human
factor in operator-machine systems.
Some potential metrics are provided in this section.
7.6.1 Examples from Process Safety System Audits
Process safety systems can be audited for their effectiveness and for finding gaps before issues arise
[37]. Some potential human factors auditing-related findings could be used as potential metrics are
provided in this section.
7.6.1.1 Hazards Identification and Risk Assessments (HIRA)
(Number of HIRAs that address Human Factors / Total number of HIRAs) x 100%.
7.6.1.2 Process Hazards Analysis (PHAs)
(Number of PHAs that address Human Factors / Total number of PHAs) x 100%.

Process Safety Metrics: Guide for Selecting Leading and Lagging Metrics
www.aiche.org/ccps Page 48 of 63
7.6.2 Examples from Fatigue Risk Management
One aspect of human factors studies is fatigue risk management, which is described in greater detail
in the literature [38]. Some potential metrics are provided in this section.
7.6.2.1 Fatigue Risk Education
(Number of affected employees educated on the causes, risk and potential
consequences of fatigue / Total number of affected employees) x 100%.
Fatigue risk education should acquaint all affected employees with the basic scientific
principles of sleep, sleep disorders, alertness, circadian, and fatigue physiology. This
information will help them identify and reduce fatigue risk - to themselves, their
colleagues, and the people they may supervise or manage. This education should also
provide awareness information which can be shared with family members.
7.6.2.2 Percentage Overtime (median, mean, top 10 %)
(Number of overtime hours / Total number of standard work hours during the
measurement period per person) x 100%.
7.6.2.3 Number of Extended Shifts
Number of extended shifts per person during the measurement period
Extended shifts are time an employee is assigned to work that extends outside their
regularly scheduled shift hours and into other shifts. Extended shifts include holdovers
to participate in training, safety meetings, and the like. It does not include time needed
for normal shift handoff.

Process Safety Metrics: Guide for Selecting Leading and Lagging Metrics
www.aiche.org/ccps Page 49 of 63
8
References
[1] American Petroleum Institute (API), API RP 754, Process Safety Performance Indicators for the Refining and Petrochemical Industries, 2nd Edition, April 2016. www.api.org
[2] The Report of the BP U.S. Refineries Independent Safety Review Panel (The "Baker Report"), January 2007.
[3] United States Chemical Safety and Hazard Investigation Board, Investigation Report, “Refinery Explosion and Fire, BP Texas City, Texas, March 23, 2005,” Report No. 2005-04-I-TX, issued March 2007.
[4] The Center for Chemical Process Safety (CCPS), Guidelines for Process Safety Metrics, John Wiley & Sons, Hoboken, NJ (2009).
[5] The Center for Chemical Process Safety (CCPS), Guidelines for Integrating Management Systems and Metrics to Improve Process Safety Performance, John Wiley & Sons, Hoboken, NJ (2016).
[6] Hopkins, A., “Thinking About Process Safety Indicators,” Safety Science, Vol. 47, No. 4, 2009.
[7] The Center for Chemical Process Safety (CCPS), Guidelines for Risk Based Process Safety (RBPS), John Wiley & Sons, Inc., Hoboken, New Jersey (2007).
[8] The Center for Chemical Process Safety (CCPS), Conduct of Operations and Operational Discipline, John Wiley & Sons, Hoboken, NJ (2011).
[9] The Center for Chemical Process Safety (CCPS), Guidelines for Auditing Process Safety Management Systems, 2nd Edition, John Wiley & Sons, Hoboken, NJ (2011).
[10] The Center for Chemical Process Safety (CCPS), CCPS Process Safety Glossary. www.aiche.org/ccps
[11] U.S. Department of Transportation (DOT), 49 CFR 173.2a—Classification of a Material Having More Than One Hazard.
[12] United Nations Economic Commission for Europe (UNECE), ECE/TRANS/202, Vol. I and II (“ADR 2009”), European Agreement Concerning the International Carriage of Dangerous Goods by Road (ADR), 2009.
[13] The Center for Chemical Process Safety (CCPS), Recognizing Catastrophic Incident Warning Signs in the Process Industries, John Wiley & Sons, Hoboken, NJ (2012).
[14] Klein, J. A., “The ChE as Sherlock Holmes: Investigating Process Incidents,” Chemical Engineering Progress, 2016, 112(10):28-34.
[15] Vaughen, B. K., and K. Bloch, “Use the Bow Tie Diagram to Help Reduce Process Safety Risks,” Chemical Engineering Progress, 2016, 112(12):30-36.
[16] The Center for Chemical Process Safety (CCPS) and the Energy Institute (EI), Bow Ties in Risk Management: A Concept Book for Process Safety, American Institute of Chemical Engineers, John Wiley & Sons, Hoboken, NJ (Expected 2018).
[17] The Center for Chemical Process Safety (CCPS), Essential Practices for Creating, Strengthening and Sustaining Process Safety Culture, American Institute of Chemical Engineers, John Wiley & Sons, Hoboken, NJ (Expected 2018).
[18] Reason, J., Human Error, Cambridge University Press, Cambridge, U.K. (1990).
[19] Reason, J., Managing the Risks of Organizational Accidents, Ashgate Publishing (1997).
[20] Klein, J. A., and B. K. Vaughen, Process Safety: Key Concepts and Practical Approaches, CRCPress (2017). www.crcpress.com
[21] Klein, J. A., and B. K. Vaughen, “A Revised Program for Operational Discipline,” Process Safety Progress, 27:58-65 (2008).
Process Safety Metrics: Guide for Selecting Leading and Lagging Metrics
www.aiche.org/ccps Page 50 of 63
[22] Blanco, R. F., "Understanding Hazards, Consequences, LOPA, SILs, PFD, and RRFs as Related to Risk and Hazard Management," Process Safety Progress, Vol. 33, No. 3, pp. 208-216 (2014).
[23] The Center for Chemical Process Safety (CCPS), Guidelines for Safe Automation of Chemical Processes, Second Edition, John Wiley & Sons, Hoboken, NJ (2017).
[24] Wasileski, R. F., "Think Facility, Act on Integrity," Process Safety Progress, 36:264-272 (2017).
[25] The Center for Chemical Process Safety (CCPS), Inherently Safer Chemical Processes: A Life Cycle Approach, Second Edition, John Wiley & Sons, Hoboken, NJ (2009).
[26] The Center for Chemical Process Safety (CCPS), Guidelines for Implementing Process Safety Management, Second Edition, John Wiley & Sons, Hoboken, NJ (2016).
[27] The Center for Chemical Process Safety (CCPS), CCPS Vision 20/20. www.aiche.org/ccps
[28] Sepeda, A. L., “Understanding Process Safety Management,” Chemical Engineering Progress, pp. 26-33, August 2010.
[29] The Center for Chemical Process Safety (CCPS), Guidelines for Siting and Layout of Facilities, Second Edition, John Wiley & Sons, Hoboken, NJ (2018).
[30] The Center for Chemical Process Safety (CCPS), Guidelines for Asset Integrity Management, John Wiley & Sons, Hoboken, NJ (2017).
[31] The Center for Chemical Process Safety (CCPS), Dealing with Aging Process Facilities And Infrastructure, American Institute of Chemical Engineers, John Wiley & Sons, Hoboken, NJ (2018).
[32] The Center for Chemical Process Safety (CCPS), Guidelines for Defining Process Safety Competency Requirements, John Wiley & Sons, Hoboken, NJ (2015).
[33] The Center for Chemical Process Safety (CCPS), Guidelines for Managing Process Safety Risks During Organizational Change, John Wiley & Sons, Hoboken, NJ (2013).
[34] The Center for Chemical Process Safety (CCPS), Guidelines for the Management of Change for Process Safety, John Wiley & Sons, Hoboken, NJ (2008).
[35] The Center for Chemical Process Safety (CCPS), Guidelines for Preventing Human Error in Process Safety, John Wiley & Sons, Hoboken, NJ (2004).
[36] The Center for Chemical Process Safety (CCPS), Human Factors Methods for Improving Performance in the Process Industries, John Wiley & Sons, Hoboken, NJ (2006).
[37] The Center for Chemical Process Safety (CCPS), Guidelines for Auditing Process Safety Management Systems, Second Edition, John Wiley & Sons, Hoboken, NJ (2017).
[38] American Petroleum Institute (API), API RP 755, Fatigue Risk Management Systems for Personnel in the Refining and Petrochemical Industries, First Edition, April 2010. www.api.org

Process Safety Metrics: Guide for Selecting Leading and Lagging Metrics
www.aiche.org/ccps Page 51 of 63
Appendix A
Glossary and Definitions
Note: The terms defined in this appendix represent the results from a collaborative effort between different industrial members of both the CCPS and API. Please recognize that these terms specifically apply to this guide for consistency within this guide. Thus, these definitions represent process safety-related terms from different sources. These terms are current at the time of publication. Please refer to the CCPS Process Safety Glossary for potential updates to them [10].
Accident An unplanned event or sequence of events that results in an undesirable consequence.
Active Staging
Truck or rail cars waiting to be unloaded where the only delay to unloading is associated with physical limitations with the unloading process (e.g., number of unloading stations) or the reasonable availability of manpower (e.g., unloading on daylight hours only, unloading Monday - Friday only), and not with any limitations in available volume within the process. Active staging is part of transportation. Any truck or rail cars waiting to be unloaded due to limitations in available volume within the process are considered on-site storage.
Active Warehouse
An on-site warehouse that stores raw materials, intermediates, or finished products used or produced by a process. From a process perspective, an active warehouse is equivalent to a bulk storage tank. Rather than being stored in a single large container, the raw materials, intermediates, or finished products are stored in smaller containers (e.g., totes, barrels, pails, etc.).
Barrier Anything used to control, prevent, or impede energy flows. Includes engineering (physical, equipment design) and administrative (procedures and work processes).
Bow Tie Model
A risk diagram showing how various threats can lead to a loss of control of a hazard and allow the unsafe condition to develop into a number of undesired consequences. The diagram can show all the barriers and degradation controls deployed.
Consequence The direct, undesirable result of an accident sequence usually involving a fire, explosion, or release of toxic material. Consequence descriptions may be qualitative or quantitative estimates of the effects of an accident.
Containment A system condition in which under no condition reactants or products are exchanged between the chemical system and its environment.
Equipment A piece of hardware which can be defined in terms of mechanical, electrical or instrumentation components contained within its boundaries.
Process Safety Metrics: Guide for Selecting Leading and Lagging Metrics
www.aiche.org/ccps Page 52 of 63
Equipment Reliability
The probability that, when operating under stated environment conditions, process equipment will perform its intended function adequately for a specified exposure period.
Event An occurrence involving a process that is caused by equipment performance or human action or by an occurrence external to the process.
Explosion A release of energy that causes a pressure discontinuity or blast wave.
Explosive A chemical that causes a sudden, almost instantaneous release of pressure, gas, and heat when subjected to sudden shock, pressure, or high temperature.
Failure An unacceptable difference between expected and observed performance.
Fire A combustion reaction accompanied by the evolution of heat, light and flame.
Flammable A gas that can burn with a flame if mixed with a gaseous oxidizer such as air or chlorine and then ignited. The term “flammable gas” includes vapors from flammable or combustible liquids above their flash points.
Frequency Number of occurrences of an event per unit time (e.g., 1 event in 1000 yrs. = 1 x 10⁻³ events/yr.).
Hazard
An inherent chemical or physical characteristic that has the potential for causing damage to people, property, or the environment. In this guide it is the combination of a hazardous material, an operating environment, and certain unplanned events that could result in an accident.
Hazardous Material
In a broad sense, any substance or mixture of substances having properties capable of producing adverse effects to the health or safety of human beings or the environment. Material presenting dangers beyond the fire problems relating to flash point and boiling point. These dangers may arise from, but are not limited to, toxicity, reactivity, instability, or corrosivity.
Incident An event or series of events, resulting in one or more undesirable consequences, such as harm to people, damage to the environment, or asset/business losses
Indicator A measurement, especially a trend or fact, which provides information on the state or level of something.
Lagging Indicator
An outcome-oriented, retrospective indicator measuring that describe events that have already occurred and may indicate potential recurring issues.
Lagging Metric A retrospective set of metrics based on incidents that meet an established threshold of severity.
Leading Indicator
A forward-looking indicator measuring the performance of the key work processes, operating discipline, or protection layers that prevent incidents.
Process Safety Metrics: Guide for Selecting Leading and Lagging Metrics
www.aiche.org/ccps Page 53 of 63
Leading Metric A forward-looking set of metrics that indicate the performance of the key work processes, operating discipline, or protection layers that prevent incidents.
Likelihood
A measure of the expected probability or frequency of occurrence of an event. This may be expressed as an event frequency (e.g., events per year), a probability of occurrence during a time interval (e.g., annual probability) or a conditional probability (e.g., probability of occurrence, given that a precursor event has occurred).
Metric A method of measuring something, or the results obtained from the measurements.
Mitigation
Lessening the risk of an accident event sequence by acting on the source in a preventive way by reducing the likelihood of occurrence of the event, or in a protective way by reducing the magnitude of the event and/or the exposure of local persons or property.
Near Miss Incident
An undesired event that under slightly different circumstances could have resulted in harm to people, damage to property, equipment or environment or loss of process. A challenge to a safety system, where challenges to a safety system can be divided into the following categories: ● Demands on safety systems (pressure relief devices, safety instrumented systems, mechanical shutdown systems) ● Primary containment inspection or testing results outside acceptable limits, or ● Process deviation or excursion
Prevention The process of eliminating or preventing the hazards or risks associated with a particular activity. Prevention is sometimes used to describe actions taken in advance to reduce the likelihood of an undesired event.
Process Safety
A disciplined framework for managing the integrity of operating systems and processes handling hazardous substances by applying good design principles, engineering, and operating practices. It deals with the prevention and control of incidents that have the potential to release hazardous materials or energy. Such incidents can cause toxic effects, fire, or explosion and could ultimately result in serious injuries, property damage, lost production, and environmental impact.
Process Safety and Risk Management
A management system that is focused on prevention of, preparedness for, mitigation of, response to, and restoration from releases of hazardous materials and energies.
Process Safety Event
An event that is potentially catastrophic, i.e., an event involving the release/loss of containment of hazardous materials that can result in large-scale health and environmental consequences. Equivalent to a Process Safety Incident, noting PSE distinguishes between a Tier 1 and Tier 2 consequence level as described in this guide (See Figure 1).

Process Safety Metrics: Guide for Selecting Leading and Lagging Metrics
www.aiche.org/ccps Page 54 of 63
Process Safety Incident
An event that is potentially catastrophic, i.e., an event involving the release/loss of containment of hazardous materials that can result in large-scale health and environmental consequences.
Process Safety Indicator
A specific process safety-related measurement, especially a trend or fact, which provides information on the state or level of a process safety event, near miss incident, challenge to protection layer, operating discipline, and management system in a process safety program
Process Safety Metric
The method for measuring or the analysis of results from a process safety program efficiency or performance indicator
Process Safety System
A process safety system comprises the design, procedures, and hardware intended to operate and maintain the process safely.
Reliability The probability that an item is able to perform a required function under stated conditions for a stated period of time or for a stated demand.
Responsible Party
The party charged with operating the facility in a safe, compliant, and reliable manner is the responsible party. In some countries or jurisdictions, the responsible party may be called the ‘duty holder’ or the party with regulatory reporting responsibility. As used in this RP, the terms “Responsible Party” and “Company” are synonymous.
Note: The responsible party is determined prior to any process safety event. The responsible party could be the facility owner or the facility operator depending upon the relationship between the two. Is the owner or the operator responsible for the performance of the facility? Who is responsible for developing and implementing prevention programs? Who is responsible for performing the investigation and identifying and implementing corrective action following a process safety event?.
Risk
A measure of human injury, environmental damage, or economic loss in terms of both the incident likelihood and the magnitude of the loss or injury. A simplified version of this relationship expresses risk as the product of the likelihood and the consequences of an incident. (i.e., Risk = Consequence × Likelihood)
Risk Based Process Safety (RBPS)
The Center for Chemical Process Safety’s process safety management system approach that uses risk-based strategies and implementation tactics that are commensurate with the risk-based need for process safety activities, availability of resources, and existing process safety culture to design, correct, and improve process safety management activities.
Safeguards or Protective Features
Design features, equipment, procedures, etc. in place to decrease the probability or mitigate the severity of a cause-consequence scenario.
Safety System Equipment and/or procedures designed to limit or terminate an incident sequence, thus avoiding a loss event or mitigating its consequences.
Shutdown A process by which operations are brought to a safe and non-operating condition.
System A collection of people, equipment and methods organized to accomplish a set of specific functions.

Process Safety Metrics: Guide for Selecting Leading and Lagging Metrics
www.aiche.org/ccps Page 55 of 63
Appendix B
Detailed Examples of PSE Indicators
These illustrations and examples are for illustrative purposes only and are current at the time of
publication. Please consult the CCPS Metrics webpage for the latest list.
The following areas are addressed in this list:
➢ Company Premises
➢ PSEs With Multiple Outcomes
➢ Loss Of Containment
➢ Acute Releases
➢ Flares & Emission Control Devices
➢ Safety Relief Device/System
➢ Toxic Gas, Vapor or Aerosol
➢ Lost Time Incidents
➢ Pipelines
➢ Fires Not Associated with Chemical Release
➢ Marine Vessels
➢ Truck and Rail
➢ Office Building
➢ Man-Machine Interface Incidents
➢ Mixtures
➢ Vacuum Truck Operations
➢ Direct Costs
➢ Officially Declared Evacuation or Shelter-in -Place
COMPANY PREMISES
1. A third-party truck loading a flammable product on Company Premises, experiences a leak and subsequent fire and
property loss damages of $100,000 (direct costs). Although the truck is "Operated-by-Others", it is connected to the
process. The incident is a Tier 1 PSE because direct costs were equal to or greater than $100K.
2. Similar example as #1. The truck loaded with flammable product overturns in route out of the plant, resulting in a fire
and loss of the truck. This would not be reported as a PSE since the truck is no longer connected to the plant.
3. A pipeline leaks and releases 2000 lb. of flammable vapor above ground within 1 hour. A public road bisects the main
facility and its marine docks. This pipeline originates in the facility and goes to the docks. The leak site happens to be
off the site’s property in the short segment of piping that runs over the public road. Although the leak technically
occurs off-site, this is a Tier 1 PSE since the facility owns and operates the entire segment of pipeline.
Process Safety Metrics: Guide for Selecting Leading and Lagging Metrics
www.aiche.org/ccps Page 56 of 63
PSEs WITH MULTIPLE OUTCOMES
4. There is a 200 bbl. spill of flammable liquid that results in significant flammable vapor being released, ignited and
causing a fire. The fire damages other equipment resulting in a toxic gas release above the reporting threshold, along
with multiple lost time injuries, including a fatality. This event should be reported as a single Tier 1 PSE, but with
multiple outcomes. When applying the severity metric, the appropriate severity point assignment (1, 3, 9, or 27 points
each) would be selected from Table 3 for the fire damage, the chemical release potential impact, the human health
impact, and the community/environmental impact. The sum of these individual severity points will be used in
calculating the overall severity rate metric.
LOSS OF CONTAINMENT
5. Ten barrels of gasoline (1400 kg, 3100 lbs.) leak from piping onto concrete and the gasoline doesn't reach soil or
water. Site personnel estimate that the leak was "acute" (e.g., occurred within a 1-hour timeframe). This is a Tier 1
PSE because there was an "acute” loss of primary containment (e.g., within "1 hour") of 1000 kg (2200 lbs) or more
of ”Flammable Liquid”.
6. A faulty tank gauge results in the overfilling of a product tank containing “flammable liquids”. Approximately 7000 kg
(15500 lbs) of liquid overflows into the tank's diked area. This incident is a Tier 1 PSE since it is an "acute" spill
greater than 2200 lbs, regardless of secondary containment.
7. A maintenance contractor opens a process valve and gets sprayed with sulfuric acid resulting in a severe burn and
lost time injury. This is a Tier 1 PSE. It is an unintended event involving a material and a loss of containment. For
fatalities and days away from work injuries and illnesses, there is no release threshold amount.
8. An operator opens a quality control sample point to collect a routine sample of product and receives a bad hand
laceration requiring stitches due to a broken glass bottle and misses the next day of work. This is not a Tier 1 PSE
because it is not related to a loss of containment.
9. A bleeder valve is left open after a plant turnaround. On startup, an estimated 10 bbl. of fuel oil (1700 kg, 3750 lbs.) is
released, at 100°F, onto the ground and into the plant’s drainage system before the bleeder is found and closed. This
is a Tier 2 PSE because it is more than the release criteria of 440 lbs of a Packing Group III (Hazard Class 3 –
Flammable Liquid.
10. Operations is draining water off of a crude oil tank (operated at 120°F) into a drainage system designed for that
purpose. The operator leaves the site and forgets to close the valve. 20 bbl. of crude oil is released into the drain-
age system. This is a Tier 1 PSE because the release of crude oil, a “Combustible Liquid”, is unintended and it is
greater than the release criteria of 2000 kg or 4400 lbs.
11. A pipe corrodes and leaks 10 bbl. (1700 kg, 3750 lbs.) of Heavy Cycle Oil (HCO) at the operations temperature of
550°F to the ground. The HCO has a flash point of 300°F. This is a Tier 2 PSE because HCO was released above its
flash point above the Tier 2 threshold quantity of 200 kg (440 lbs) or 1.4 bbl.
12. An operator purposely drains 20 bbl. of combustible material into an oily water collection system within one hour as
part of a vessel cleaning operation. The drainage is planned and controlled and the collection system is designed for
such service. This is not a reportable PSE since it is consistent with a specific exclusion. If the material had been
unintentionally released or it had become uncontrolled and flowed to an open drain, sewer or other collection system,
it would be a PSE.
13. Hydrocarbon fumes migrate into the QA/QC laboratory located within the facility and results in a fire with $1500
damage. The source of the hydrocarbon fumes is the oily water sewer system. Although the fire was the result of an
unplanned or uncontrolled loss of primary containment, this incident is not a Tier 2 PSE since the damage threshold
of $2,500 was not exceeded.

Process Safety Metrics: Guide for Selecting Leading and Lagging Metrics
www.aiche.org/ccps Page 57 of 63
14. A forklift truck delivering materials inside a process unit knocks off a bleeder valve leading to the release of
isopentane and a subsequent vapor cloud explosion with asset damage greater than $100,000. This is a Tier 1 PSE
since an unplanned or uncontrolled LOPC resulted in a fire or explosion causing greater than $100,000 damage.
15. There is a loss of burner flame in a fired heater resulting in a fuel rich environment and subsequent explosion in the
fire box with greater than $100,000 in damages to the internals of the heater. There was no release outside of the fire
box. This would be a Tier 1 PSE since after the flameout the continuing flow of fuel gas is now an uncontrolled
release. The intent is for combustion of the fuel gas at the burner and not for fuel gas to be contained in the fire box.
16. There is a tube rupture in a fired heater causing a fire (contained in the heater) resulting in greater than $100,000 in
damages to the heater internals (beyond that of replacing the failed tube). The tube failure is a loss of primary
containment of the process fluid and combined with the additional damages greater than $100,000 makes this a Tier
1 PSE.
ACUTE RELEASES
17. There is a 10 bbl. spill of gasoline (1400 kg, 3100 lbs.) that steadily leaked from piping onto soil over a two-week time
period. Simple calculations show the spill rate was approximately 0.03 bbl. per hour (9 lbs.hr). This is not a Tier 1 or 2
PSE since the spill event was not an "acute" release (e.g., the 1000 kg (2200 lbs.) threshold exceeded in any 1-hour
period), however, a company may choose to record this event as a Tier 3 Other LOPC.
18. Same example as above, except that the 10 bbl. leak was estimated to have spilled at a steady rate over a period of
1 hour and 30 minutes. Simple calculations show that the spill rate was 6.7 bbl. (933 kg or 2060 lbs.) per hour. The
spill rate was slightly less that the Tier 1 reporting threshold of 1000 kg (2200 lbs.) within any "1 hour" period, but
above the Tier 2 reporting threshold of 100 kg (220 lbs) and therefore is a Tier 2 PSE.
19. While troubleshooting a higher-than-expected natural gas flow rate, operating personnel find a safety valve on the
natural gas line that did not reseat properly and was relieving to the atmospheric vent stack through a knock- out
drum. Upon further investigation, it is determined that a total of 1 Million lbs of natural gas was relieved at a steady
rate over a 6-month period. This is not a Tier 1 PSE because the release rate (~100 kg per hour) does not exceed the
500 kg Tier 1 TQ for flammable vapors in any 1-hour time period), however, it is a Tier 2 PSE because the Tier 2
acute release threshold of 50 kg (per hour) is exceeded.
20. An operator discovers an approximate 10 bbl. liquid spill of aromatic solvent (e.g. benzene, toluene) near a process
exchanger that was not there during his last inspection round two hours earlier. Since the actual release duration is
unknown, a best estimate should be used to determine if the TQ rate has been exceeded (it is preferred to err on the
side of inclusion rather than exclusion). This incident is a Tier 1 PSE because the solvents involved are Packing
Group II materials and the threshold quantity of 7 bbl. is exceeded if the time period is estimated to be less than one
hour.
DOWNSTREAM DESTRUCTIVE DEVICES (e.g., flares, scrubbers, incinerators, quench drums)
21. The flare system is not functioning properly due to inactive pilots on the flare tip. During this time, a vapor load is sent
to the flare due to an overpressure in a process unit. The volume of the vapor through the pressure relief device is
greater than the threshold and it results in the formation of a flammable mixture at grade. This would be classified as
a PSE since the relief valve discharge is greater than the threshold quantity and resulted in an unsafe release.
22. 100 bbl. of naphtha liquid are inadvertently routed to the flare system through a pressure relief device. The flare
knockout drum contains most of the release; however, there is minimal naphtha rainout from the flare. This is a Tier 1
PSE since the volume released from the pressure relief device to a downstream destructive device does exceed the
threshold quantity and resulted in one of the four listed consequences (i.e. liquid carryover).
Process Safety Metrics: Guide for Selecting Leading and Lagging Metrics
www.aiche.org/ccps Page 58 of 63
23. A pressure relief device release less than threshold quantity is routed to a scrubber which is overwhelmed by a flow
rate greater than design and exposes personnel to toxic vapors resulting in a day away from work injury. This is a
Tier 1 PSE since a loss of primary containment resulted in a day away from work injury. The rules for pressure relief
device discharges are superseded by the actual harm caused.
24. A propane tank over-pressures through a pressure relief device to the flare system. The pilots on the flare system are
not working properly, and the flare does not combust the vapors. The event transpires over a period of 45 minutes.
The volume of propane release was estimated to be 1300 pounds and the release dissipated into the atmosphere
above grade and above any working platforms. Even though the release exceeded the threshold quantity, this is not a
PSE since the discharge was routed to a downstream destructive device with none of the listed consequences. A
company may choose to record this event as a Tier 3 Other LOPC and a Tier 3 Demand on Safety Systems.
25. An upset causes a pressure relief device to open and release fuel gas to the facility flare system. The flare system
works properly and combusts the vapor release which came from the pressure relief device. This is not a PSE since
the pressure relief device release was routed to a downstream destructive device that functioned as intended (i.e. did
not cause one of the four listed consequences). A company may choose to record this event as a Tier 3 Other LOPC
and a Tier 3 Demand on Safety Systems.
SAFETY RELIEF DEVICE / SYSTEM
26. There is a unit upset and the relief valve opens to an atmospheric vent which has been designed per API Standard
521 for that scenario, resulting in a gas release to the atmosphere with no adverse consequences. Per API Standard
521 or equivalent, this event would not be a Tier 1 or 2 PSE since vapors and gases released to atmosphere from
safety valves, high-pressure rupture disks, and similar safety devices that are properly designed for that event (Note:
The release cannot have resulted in liquid carryover, discharge to a potentially unsafe location, an on-site shelter-in-
place, or public protective measures (e.g. road closure) and a PRD discharge quantity greater than the threshold
quantity [1]). A company may choose to count this as a Tier 3 event since it is an activation of a PRD that was not
counted in Tier 1 or 2.
27. A chlorine vessel has a Pressure Relief Device (PRD) that was identified in a recent PHA to be undersized. In the
process of making a transfer, the vessel overpressures. A release of 60 pounds of chlorine gas (TIH Zone B material)
occurs through this PRD to a safe location over a period of 25 minutes. This would not be a Tier 1 or Tier 2 PSE,
regardless of the HAZOP finding, so long as it did not result in a liquid carryover, on-site shelter-in-place, public
protective measure or other indication of discharge to an unsafe location. However, a company may choose to record
this event as a Tier 3 Demand on Safety Systems.
28. There is a unit upset and the relief valve fails to open, resulting in overpressure of the equipment and an "acute"
release of flammable gas from a leaking flange. The amount released is above the 500 kg (within 1 hour) threshold.
This is a Tier 1 PSE. Releases from flanges are not excluded from PSE reporting.
TOXIC GAS, VAPOR OR AEROSOL
29. A leak on a high pressure hydrochloric acid line results in a spill of 1900 lbs of hydrochloric acid. Flash calculations
indicate that greater than 220 lbs. of hydrogen chloride would be released as a vapor. The 1900 lbs release of hydro-
chloric acid is a Tier 2 PSE since this liquid is categorized as a strong acid, with a 440 lbs reporting threshold.
However, since the liquid flashed or was sprayed out as an aerosol, producing more than 220 lbs of hydrogen
chloride as vapor the event would be Tier 1 PSE due to exceeding the 100 kg (~220 lbs) or more of Toxic Inhalation
Hazard Zone C material within 1 hour.
30. A pipe containing CO2 and 10,000 vppm (1% by volume) H2S leaks and 7,000 kg (15,400 lbs) of the gas is released
within a short time period (e.g., less than one hour). Calculations show that the release involved about 55 kg (120 lbs)
of H2S. The release is a Tier 1 PSE since the reporting threshold for Toxic Inhalation Hazard Zone B chemicals is
any amount greater than 25 kg (55 lbs) of the toxic chemical (e.g., H2S).

Process Safety Metrics: Guide for Selecting Leading and Lagging Metrics
www.aiche.org/ccps Page 59 of 63
31. Same as above, except that the H2S concentration in the pipe is 50 vppm, rather than 10,000 vppm. The incident
would still be a Tier 1 PSE since the release of CO2 is greater than the 2000 kg (4400 lb.) threshold.
DAYS AWAY FROM WORK INCIDENTS
A “days away from work” incident (or fatality) inclusion as a reportable Process Safety Event depends upon it being
caused by the loss of containment of a material or is directly related to evacuating from or responding to the loss of
containment.
32. An operator is walking, then slips and falls to the floor and suffers a lost time injury. The slip/fall is due to weather
conditions, "chronic" oily floors and slippery shoes. This is not a reportable PSE. Personnel safety "slip/trip/fall"
incidents that are not directly associated with evacuating from or responding to a loss of containment incident are
specifically excluded from PSE reporting.
33. Same as above, except that the operator slipped and fell while responding to a small flammable liquid spill (e.g., less
than 50 kg in 1 hour). This would be PSE reportable since the operator was responding to a loss of containment
incident. A Tier 1 PSE occurs when the loss of primary containment occurs on Company Premises and results in a
lost time incident or fatality. For fatalities and lost time incidents, there is no release threshold quantity requirement.
34. Same as above, except that the operator slipped and fell several hours after the incident had concluded. This would
not be PSE reportable. The terms "evacuating from" and "responding to" in the reporting exclusion mean that the loss
of containment and associated emergency response activities are on-going. Slips/trip/falls after the event have
concluded (such as "after-the-fact" clean-up and remediation) are excluded from PSE reporting.
35. A scaffold builder suffers a lost time injury after falling from a scaffold ladder while evacuating from a loss of
containment incident on nearby equipment. This is a Tier 1 PSE.
36. An operator walks past an improperly designed steam trap. The steam trap releases and the operator's ankle is
burned by the steam, resulting in a lost time injury. This is a Tier 1 PSE because even though the loss of containment
was steam (vs. hydrocarbon or chemical), the physical state of the material was such that it caused a lost time injury.
Non-toxic and non-flammable materials are excluded from the threshold quantity criteria, but are subject to the other
consequence criteria.
37. An enclosure has been intentionally purged with nitrogen. A contractor bypasses safety controls, enters the enclosure
and dies. This is a reportable fatality, but not a Tier 1 PSE since there was no unplanned or uncontrolled loss of
primary containment.
Note: This fatality may be reportable under safety regulations and may need to be recorded on a company’s injury
and illness log.
38. Same as above, except that nitrogen inadvertently leaked into the enclosure. This would be a Tier 1 PSE (and
fatality) since there was a fatality associated with an unplanned loss of primary containment.
39. An operator responding to an H2S alarm collapses and has a “days away from work” injury. If the alarm was triggered
by an actual unplanned or uncontrolled H2S LOPC, the event would be a Tier 1 PSE. If the alarm was a false alarm,
the event would not be a Tier 1 PSE because there was no actual release.
PIPELINES
40. An underground pipeline leaks and releases 100 bbl. of diesel (combustible material) over 3 days (1.39 bbl./ hr.). The
spill results in contaminated soil that is subsequently remediated. This is not a Tier 1 or 2 PSE since there were no
safety consequences and the quantity did not exceed the "acute" threshold of 1.4 bbl. or greater. However, a
company may choose to record this event as a Tier 3 Other LOPC.
Process Safety Metrics: Guide for Selecting Leading and Lagging Metrics
www.aiche.org/ccps Page 60 of 63
41. A pipeline leaks and releases 2000 lbs. of flammable vapor above ground within 1 hour. However, the release
occurred in a remote location within the site. The release is a Tier 1 PSE since "remoteness" is not a consideration
and it release exceeds the threshold quantity.
42. A DOT covered pipeline that is owned, operated, and maintained by Company A crosses through Company B’s
property. The DOT covered line has a 1500 lb. release within an hour from primary containment of flammable gas
and causes a fire resulting in greater than $100,000 damage to Company A’s equipment. This is not a Tier 1 PSE for
Company B since the pipeline is not owned, operated or maintained by Company B. However, this would be a
transportation incident for Company A.
FIRES or ENERGY RELEASES NOT ASSOCIATED WITH LOSS OF PRIMARY CONTAINMENT
As a general rule, a fire or energy release is reported as a PSE only if caused by a loss of primary containment or
results in a chemical release in excess of the reporting quantities. Examples include:
43. An electrical fire impacts the operation of the process resulting in the release of 4000 lbs. of toluene. This event
would be a Tier 1 PSE since the loss of primary containment exceeds the 2200 lb. reporting threshold for toluene.
44. An electrical fire, loss of electricity, or any other loss of utility that causes a plant shutdown and possibly incidental
equipment damage greater than $100,000 (e.g., damage to reactors or equipment due to inadequate shutdown) but
does not cause a loss of primary containment that results in one of the identified consequences would not be
reported as a PSE. To be a reportable PSE, there must be a loss of primary containment.
45. A bearing fire, electric motor failure, or similar fire occurs which damages the equipment (> $100,000) but does not
cause a loss of primary containment that results in one of the identified consequences would not be reported as a
PSE since no process chemical release greater than the threshold quantity or injuries occurred.
46. If in the examples #44 or #45, if either an injury or chemical release exceeding the threshold quantity had occurred
these would have been reportable PSE events.
47. An internal deflagration in a vessel causes equipment damage > $2,500, but there was no loss of containment. While
this is a serious process event and should be investigated as such, it does not meet the definition of a reportable PSE
since there was no loss of primary containment.
48. The vent on a storage tank containing chemicals becomes plugged and vacuum caused by routine pump out
collapses the tank resulting in equipment damages >$100,000. This event would not be PSE since there was no
loss of primary containment.
49. If in the example #48, if a tank seam failed resulting in a spill of contents in excess of the TQ quantity for that
material, it would have been reported as a PSE (even if the contents were captured in secondary containment dikes).
50. A scaffold board is placed near a high pressure steam pipe and subsequently begins to burn, but is quickly
extinguished with no further damage. The investigation finds that the board had been contaminated by some oil, but
there is no indication of an oil leak in the area. This is not a reportable PSE since there was no unplanned or
uncontrolled LOPC.
MARINE TRANSPORT VESSELS
51. A company operated Marine Transport Vessel has an onboard "acute" spill of combustible material greater than 14
bbl. The event is not PSE reportable since Marine Transport Vessel incidents are specifically excluded, except when
the vessel is connected to the process for the purposes of feedstock or product transfer.
52. A third-party barge is being pushed by a tug and hits the company dock. A barge compartment is breached and
releases 50 bbl. of diesel to the water. The event is not a PSE since the marine vessel was not connected to the
process for the purposes of feedstock or product transfer.

Process Safety Metrics: Guide for Selecting Leading and Lagging Metrics
www.aiche.org/ccps Page 61 of 63
TRUCK AND RAIL
53. A company railcar derails and spills more than 7 bbl. of gasoline while in transit outside the facility. The incident is not
a PSE since railcar was not connected to the process for the purposes of feedstock or product transfer or being used
for onsite storage.
54. A third-party truck/trailer overturns while in the Company Premises, resulting in an "acute" spill of gasoline greater
than 7 bbl. The incident is not reported as a PSE if the truck is no longer connected to the loading/unloading facilities.
However, companies may choose to have transportation incident metrics, which would capture this event.
55. A contract truck hauler is unloading caustic and the hose separates and generates an airborne aerosol and/or liquid
caustic spill of 2500 kg. The event is a Tier 1 PSE since the caustic TQ of 1000 kg was exceeded and the truck was
still connected to the loading/unloading facility immediately prior to the incident.
56. Two chlorine railcars have been delivered to the facility, both of which are needed to fill the onsite storage tank. One
is connected to the process and the other is staged while the first railcar is unloading. While staged and waiting for
the first car to unload, the second railcar develops a leak and 6 lb. is released in less than an hour. This is not a
reportable PSE since truck and railcars are expressly excluded unless connected to the process or being used for on-
site storage. Staging while waiting to unload is not considered storage if there are no limitations in available volume
within the process.
OFFICE BUILDING
57. There is a boiler fire at the Main Office complex, and direct cost damages totaled $100,000. The incident is not PSE
reportable since non-process related Office Building incidents are specifically excluded.
MAN-MACHINE INTERFACE INCIDENTS
58. An operations technician is injured while working around the finishing equipment in a polymers plant. The injury is
caused by the mechanical, man-machine interface with the equipment. This would not be a PSE because there was
no unplanned or uncontrolled loss of containment.
MIXTURES
59. A chemical manufacturer spills 10,000 lbs of a formulated product containing multiple chemicals downstream of a
mixing operation. This material is marketed as specific product (e.g., a heating fluid, brake fluid, etc.). Since this
material is shipped in this formulation, the company has previously evaluated the mixture per all of the UN Dangerous
Goods definitions (or DOT regulations in the USA) and classified the mixture as a “Packing Group III” material. Since
the spill exceeded the 2000 kg (4400 lb.) threshold quantity of a Packing Group III material, this spill would be
reported as a Tier 1 PSE.
60. A pipe fitting in a specialty chemicals plant fails, releasing 4000 lb. of a mixture of 30% formaldehyde, 45% methanol,
and 25% water in less than one hour. This mixture is not classified by the UN Dangerous Goods/U.S. DOT protocols;
therefore, the threshold quantity mixture calculation is applied. The pure component reporting threshold of
formaldehyde is 4400 lb. and methanol is 2200 lb.
Component wt.%
(lb.) Release Qty
(lb.) PSE TQ % of TQ
Formaldehyde 30% 1200 4400 27.30%
Methanol 45% 1800 2200 81.80%
Water 25% 1000 n/a 0%
109.10%

Process Safety Metrics: Guide for Selecting Leading and Lagging Metrics
www.aiche.org/ccps Page 62 of 63
This release is a Tier 1 PSE since the cumulative percentage exceeds 100% even though the individual components
do not exceed their individual threshold quantities.
Note: This is an alternative shortcut approach and can give more or less conservative results. A more precise
approach is to use the rules of DOT 49 CFR 173.2a [11] or UN Recommendations on the Transportation of
Dangerous Goods, Section 2.
VACUUM TRUCK OPERATIONS
61. After collecting a load from an adjacent unit, a vacuum truck is parked at the wastewater treatment facility awaiting
operator approval to discharge. While waiting the vacuum truck malfunctions and vents process material to the
atmosphere. This is not a PSE since vacuum truck operations are excluded unless loading, discharging, or using the
truck’s transfer pump.
62. A vacuum truck outfitted with a carbon canister on the vent is loading a spill of hydrocarbons. The carbon canister
catches fire which escalates to the point of creating more than $45,000 in damage to the vacuum truck. This is a Tier
2 PSE since the original spill of hydrocarbons constitutes the LOPC and the results of the LOPC led to fire damage
greater than $2,500 for a Tier 2 but less than $100,000 for a Tier 1.
DIRECT COSTS
63. A pump seal fails and the resultant loss of containment catches on fire. The fire is put out quickly with no personnel
injuries. The fire resulted in the need to repair some damaged instrumentation and replace some insulation. The cost
of the repairs, replacement, cleanup, and emergency response totaled $120,000; however, excluding the cost of the
failed pump seal, the cost is $20,000. This is not a Tier 2 PSE because the cost of replacing the seal is not included
in the direct cost calculation—only the costs for repair and replacement of the equipment damaged by the fire, not the
cost to repair the equipment failure that led to the fire.
OFFICIALLY DECLARED EVACUATION OR SHELTER-IN-PLACE
64. A small quantity of very odorous material enters a cooling water system via tube leak. The material is dispersed into
the atmosphere at the cooling tower. An elementary school teacher decides not to conduct recess outside due to a
noticeable odor even though officials deemed no shelter-in-place was necessary; therefore, this is not a PSE.
65. Less than 1 pound of Hydrogen Fluoride gas is released while unloading a truck at a refinery. The release is detected
by a local analyzer and triggers a unit response alarm. An off-duty police officer living in a nearby home advises his
neighbors to evacuate because “an alarm like that means there’s a problem at the refinery.” This is not a PSE
because the police officer is acting as a private citizen suggesting a precautionary measure and not as a community
official declaring an evacuation or shelter-in-place because.
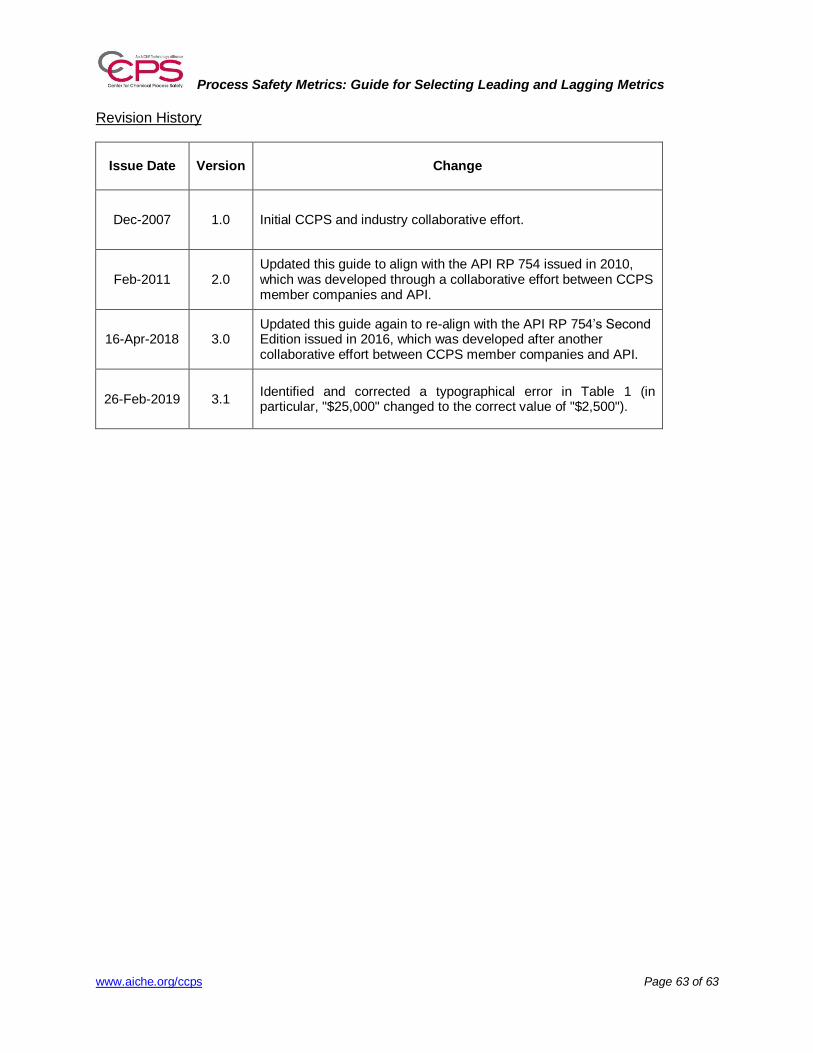
Process Safety Metrics: Guide for Selecting Leading and Lagging Metrics
www.aiche.org/ccps Page 63 of 63
Revision History
Issue Date Version Change
Dec-2007 1.0 Initial CCPS and industry collaborative effort.
Feb-2011 2.0 Updated this guide to align with the API RP 754 issued in 2010, which was developed through a collaborative effort between CCPS member companies and API.
16-Apr-2018 3.0 Updated this guide again to re-align with the API RP 754’s Second Edition issued in 2016, which was developed after another collaborative effort between CCPS member companies and API.
26-Feb-2019 3.1 Identified and corrected a typographical error in Table 1 (in particular, "$25,000" changed to the correct value of "$2,500").