process parameters for chironji nut (buchanania lanzan.) …. dange, et al.pdf · density of...
TRANSCRIPT
Int.J.Curr.Microbiol.App.Sci (2019) 8(1): 1848-1862
1848
Original Research Article https://doi.org/10.20546/ijcmas.2019.801.195
Process Parameters for Chironji Nut (Buchanania lanzan.) Decortication
M.M. Dange1*
, P.S. Champawat1, P.H. Bakane
2, S.D. Deshmukh
2,
S.K. Jain1 and P.A. Borkar
2
1Department of Processing and Food Engineering, CTAE, M.P.U.A.T.,
Udaipur-313001, Rajasthan, India 2Department of Agriculture Process Engineering, Dr. PDKV, Akola-444001, M.S., India
*Corresponding author
A B S T R A C T
Introduction
The level of agricultural products goes on
increasing with mechanization of different
post-harvest operations, which aims at
achieving timeliness of operations, efficient
use of inputs, improvement in quality of
produce, safety and comfort of labours,
reduction in loss of produces and drudgery of
labours.
International Journal of Current Microbiology and Applied Sciences ISSN: 2319-7706 Volume 8 Number 01 (2019) Journal homepage: http://www.ijcmas.com
Buchanania lanzan (Chironji) a member of family Anacardiaceae consist of a hard nut
that on decortication yields kernel containing 52% of oil and this oil is used as a substitute
for olive and almond oil. Also, kernel is used for sweet meals, medicinal purpose,
cosmetics etc. By manual decortication the capacity was observed to be minimum and
recovery of whole kernel was nearly 12% only. This manual method is time consuming,
laborious, inefficient and there is fear of injury to fingers. Decortication of chironji nut is a
major problem and hence this valuable chironji kernel is to be procured at high price i.e.
Approx. Rs.700-1000, whereas the chironji nut could be purchased at the rate of Rs. 100 to
150/kg. As the kernel is valuable, it was necessary to get maximum recovery during
decortication so as to reduce the cost. Thus, considering all the facts related to the valuable
kernel, decortication followed by drying of nut has been studied in detailed to obtain
maximum recovery of good quality kernels. The RSM technology is applied for
optimization of process parameters. Optimization of process parameters using response
surface methodology (RSM) greatly overcomes the numbers of experimental trials
generally undertaken for decorticating study of chironji nuts apart from maximizing the
output of the system. The independent parameters for chironji nut decortication viz.,
drying temperature, drying time and clearance between discs were optimized using RSM.
The drying temperature of 69.610 °C, drying time 163.87 min and clearance between disc
12 mm were found optimal. The whole kernel recovery, decorticating efficiency, unshelled
nut, broken kernel and capacity of machine at optimized independent parameters were
27.72% (fraction of chironji kernel to shell 30.01% to 69.99%), 85.299 %, 11.50 %, 3.687
% and 6.232 kg/h respectively. The investigation is most useful to the small farmers, small
entrepreneurs, Self-help group, Organic farming groups, Tribal group, A rural youth,
Ladies bachat group who are involved in decortication of chironji nut.
K e y w o r d s
Chironji nut,
Decortication
efficiency, Whole
kernel recovery,
Capacity of
machine, Response
surface
methodology
Accepted:
12 December 2018
Available Online: 10 January 2019
Article Info
Int.J.Curr.Microbiol.App.Sci (2019) 8(1): 1848-1862
1849
Buchanania lanzan commonly known as
„Charoli‟ or „Chironji‟, Chawar, Achar,
Cuddapah almond, Piyal etc. is a valuable
species belonging to family Anacardiaceae.
Chironji is not cultivated as
regular plantation. It is found growing as stray
plantation in natural habitat. Exact statistics as
regard to area is not available. However,
density of population across various forest
range, gives an idea as regard to plant stand
and the production. The yield of chironji is
from 1 to 5 kg/ tree with an average weight of
0.27 g (Chandhar, 1997; Rai, Y.C, 1982).
According to market information system non
timber forest product, the annual national
production of chironji is 97,500 quintal/year.
Chironji has great medicinal value. All the
parts of the chironji tree are used in traditional
Indian medicine. Kernel is rich in protein
content (20-30%). The oil extracted from
kernels is used for treating skin diseases and it
is considered as a substitute for almond oil in
traditional medicinal preparations. The
chironji nut has very good demand in India as
well as in foreign markets and thus, has
become an important crop. Therefore, to earn
foreign exchange the government and private
agencies have evinced keen interest in
developing this industry, both by increasing
its production and processing capacity.
At times in order to get more benefit from the
existing machinery/mechanism with a slight
modification or slight change can make the
machine versatile. At present shelling of
Chironji nut is done manually and sometime
by traditional grinder which is time
consuming operation. Traditional method of
decortication i.e. manual decortication is
shown in Plate 1.1.
It was observed that the expertise male labour
was able to crack/shell 85 g/h of chironji nut
with the help of two flat stone. Also, the
quality of the kernel depends upon an
efficient nut decorticating which helps to
enhancing effective separation of the kernel
from shell. It was observed that manual
method is time consuming, laborious,
inefficient and also there is fear of injury to
fingers. Therefore, it becomes difficult to get
labour for this operation. Decortication is the
most important operation of post-harvest
handling of nuts. Only a research work was
carried out on Chironji nut by Kumar et. al in
2009, for decortication of chironji nut, where
they used horizontal disc for shelling of
chironji nuts. At present, loss of about 15-17
% (as broken kernel) due to improper shelling
practices, uncontrolled operational
parameters, and lack of knowledge about
decortication. Such factor has made
agriculture products less profitable and more
risky. Keeping the above point in view the
present investigation was undertaken with
objective to optimize the process parameters
for chironji nut decortication by using RSM
technology. Some work has been done in
identification of emery grade and few for
milling studies (Sahay et.al., 1988; Mungraj
et.al., 2005). Other researchers have worked
on the optimization of process parameter for
milling of various pulses. Response surface
methodology has been successfully employed
for the optimization of pulse milling operation
Therefore, the machine and process
parameters of existing burr mill at AICRP on
PHET. Dr. PDKV Akola was optimized using
response surface methodology for
decortication of chironji nuts.
Materials and Methods
Raw Material Chironji nuts (Buchanania
Lanzan) with moisture content 7-8 (% db)
were obtained from farmers of Patur Tehsil of
Akola district.
Manual decortication of chironji nuts
The chironji nuts having moisture content of
7.01(% db) was used for manual

Int.J.Curr.Microbiol.App.Sci (2019) 8(1): 1848-1862
1850
decortication. A labour carried out the
decortication process using two stone slabs.
One slab was used for resting the nut and the
other was used for breaking/cracking the
chironji nut. The total time required by the
labour to decorticate 200 g sample of chironji
nut was nearly 3 h. During this process each
nut was decorticated and the various fractions
of nut were obtained as given below
Variables Manual
decortication
Decortication efficiency
(%).
100
Unshelled nut (%). 0
Whole kernel (%). 12.375
Broken kernel (%). 17.629
Capacity of decortication
(kg/h).
0.066
Decortication of chironji nuts with existing
burr mill/chironji nut decorticator along
with drying
Machine: The existing burr mill (Plate 2) at
AICRP on PHET, Dr. PDKV Akola with
overall dimensions of 600×290×25 mm,
power unit 1 hp electric motor, labour
requirement one (to operate machine) was
used for all the decorticating studies. It
consists of a feed hopper, inlet chute,
adjustable nob, outlet casing, delivery chute,
emery disc, motor, shaft, pulley and frame.
The emery disc rotated inside the casing.
Decortication took place due to friction
between nuts and abrasive surface.
Method: The decorticating method was used
for the study with details are given in Figure
1.
Design of experiment
The Box- Behnken design of three variables
and three levels including 17 trials formed by
5 central points was used with three
independent process parameters viz., drying
temperature (T), drying time (t) and clearance
between discs (C) was considered for
optimization. Experimental plan for
optimization constituted five responses viz.,
whole kernel recovery (%), decortication
efficiency (%), capacity of machine (kg/h),
broken kernel (%) and unshelled nut (%). For
this purpose, response surface methodology
(RSM) was employed to fit a second-order
polynomial equation for decorticating chironji
nut. Value of T varies from 50 to 70°C, t
between 120 and 240 min, and C between 8 to
12 mm. The process parameters were
optimized for maximizing the decortication
efficiency, whole kernel recovery and
capacity of machine using the package,
Design- Expert version 9.0.5.1 (Stat Ease Inc,
Minneapolis, MA Trial version, 2015).
Second order polynomial equation of the
following form was assumed to relate the
response, Yk and the factors, as
….(1)
Where, Yk is response (i.e. decortication
efficiency, un-shelled nut, whole kernel
recovery, broken kernel and Capacity of
machine) βko, βki, βkii and βkij are constant
coefficients and xi and xj are the coded
independent variables that are linearly related
to X1, X2 and X3. A total number of 17
experiments were carried out as evident from
Table 1. The experiments were conducted in
random order. Five repeated experiments
were conducted at the central points of the
coded variables to calculate the error sum of
squares and the lack of fit of the developed
regression equation between the responses
and independent variables (Mayers et al.,
2002).
The experiments were conducted and samples
of decorticated product were taken for
determination of whole kernel recovery,
decorticating efficiency, capacity of machine
3
1
3
1
2
1
2
3
1
i
i
j
ij
jikij
i
i
ikii
i
i
ikikokxxxxY
Int.J.Curr.Microbiol.App.Sci (2019) 8(1): 1848-1862
1851
(kg/h), unshelled nut and broken kernel. This
was calculated as per the following formula
1. Decortication efficiency (%):
Decortication efficiency (%) = 100 –
uncracked nuts (% unshelled)
2. Un-cracked/unshelled nuts (%):
Un-cracked nuts = C/D x100
Where,
C = Weight of un-cracked nuts, g.
D = Weight of total nuts, g.
3. Whole kernel (%):
Whole kernel (%) = G/D x 100
Where,
G = Weight of whole kernels, g.
4. Broken kernels (%):
Broken kernels (%) = E/D x100
Where,
E = Weight of split kernels, g.
5. Output/ capacity of machine:
Output/ capacity of machine = W/T
Where,
W= Weight of chironji nut, kg.
T = Time required for decortication, h.
Results and Discussion
Response surface analysis was applied to the
experimental data (Table 1), and the second-
order polynomial response surface model (Eq.
1) was fitted to each of the response variables.
Regression analysis and analysis of variance
(ANOVA) were conducted for fitting the
model and to examine the statistical
significance of the model terms. The
estimated regression coefficients of the
quadratic polynomial models for the response
variables, along with the corresponding R2
and coefficient of variation (CV) values, are
given in Table 2. Analysis of variance showed
that all the models were significant (p<0.01
and p<0.05) for all the responses (Table 2).
The lack of fit (Table 2), which measures the
fitness of the model, did not result in a
significant F value for whole kernel recovery,
decorticating efficiencies, capacity of
machine, unshelled nut and broken kernel
indicating that these models are sufficiently
accurate for predicting those responses.
Whole kernel recovery
The effect of clearance between pair of disc,
drying temperature and drying time on whole
kernel recovery was determined by keeping
one variable constant with respect to others
shown in Figure 2. It could be evident that
percentage of whole kernel increase with
increase in clearance between pair of discs as
well as with increase in drying temperature.
This both parameters had shown a highly
significant effect on whole kernel recovery. It
also confirms the findings that percent whole
kernels first increases with drying time and
then slight decreases. Clearance between pair
of disc was showing significant difference as
compared to drying temperature and drying
time. This may be due to the fact that chironji
nut is having varying size.
The equation in terms of actual factors which
described the effect on whole kernel is given
as
Whole kernel= -7.76292+
0.066625*T+0.12546*t+1.59688*C-
3.37731E-004*t2
...(2)
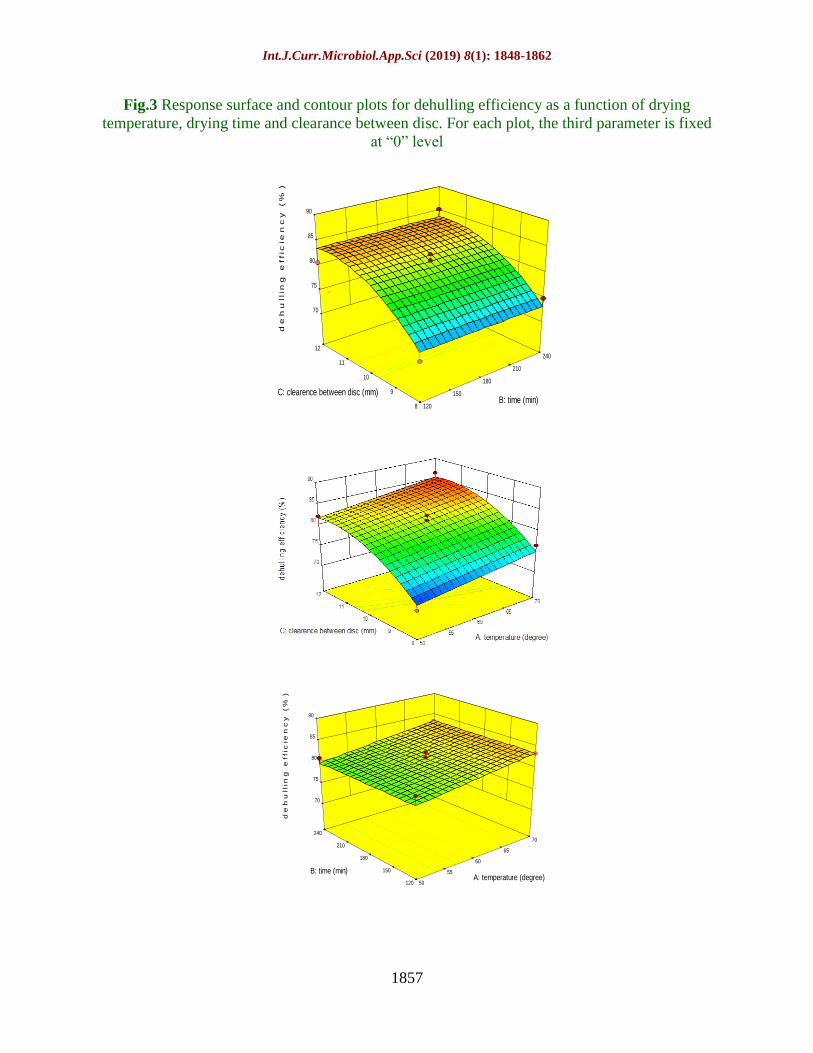
Decortication efficiency
The decortication efficiency was observed to
be ranging from 70.12 to 86.34 % depending
upon various treatments. The minimum
decortication efficiency was found for
treatment having the combination of drying
temperature 50 oC, 180 min. drying time and 8
mm clearance between pair of disc. The
maximum decortication efficiency was
observed in case of treatment having the
combination drying temperature of 70 o
C, 180
min drying time and 12 mm clearance
between pair of disc. It was observed that
clearance between pair of disc was showing
Int.J.Curr.Microbiol.App.Sci (2019) 8(1): 1848-1862
1852
significant difference as compared to drying
time and drying temperature (Fig. 3). It
revealed that decortication efficiency
increased with increase in clearance between
discs and shows slight increase with the
increasing drying time. The drying
temperature helps to make the chironji nut
brittle. Cracking of nut becomes easy when it
is fed to the burr mill thus giving maximum
decortication efficiency.The regression
equation describing the effect of process
variables on decortication efficiency are given
as
Decortication efficiency= -
35.99667+0.18200* T+18.74556* C-
0.80778* C2
…(2)
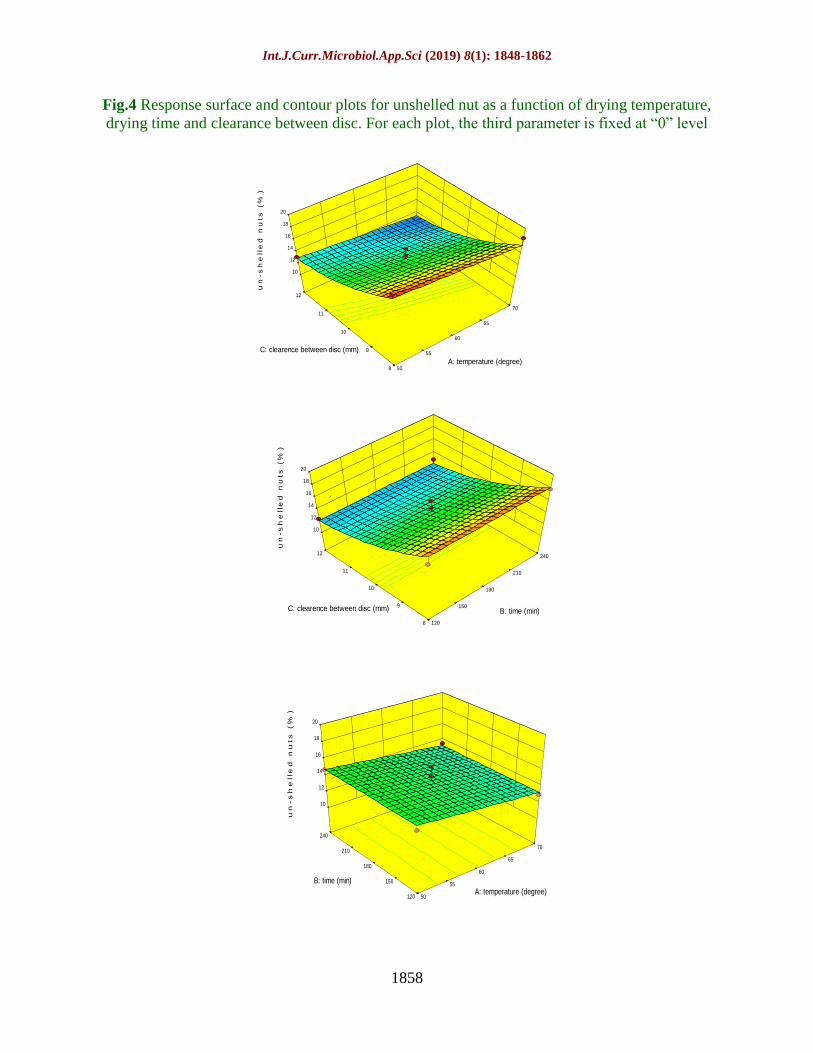
Unshelled Nut
The minimum unshelled nut were found for
treatment having the combination of drying
temperature 70 o
C, drying time 180 min and
clearance between pair of disc 12mm. The
maximum unshelled nut were observed in
case of treatment having the combination of
drying temperature 50oC, drying time 180 min
and clearance between pair of disc 8mm.
Effect of independent variables on unshelled
nut shows (Fig. 4) that percentage of
unshelled nut decreases with increase in
clearance between discs and slight decrease
with increase in drying temperature. It was
observed that there is no significant effect of
drying time on percent unshelled nut.
The response surface equation was obtained
for the model of second degree is as under.
Un-shelled nuts = +62.23167-0.075625* T-
7.25681* C+0.28903* C2 …
(3)
Broken kernel
The broken kernel was observed to be ranging
from 3.03 to 10.24 % depending upon various
treatments. The minimum broken kernel were
found for treatment having the combination of
drying temperature 60 o
C, drying time 120
min. and clearance between pair of disc 12
mm. The maximum broken kernel was
observed in case of treatment having the
combination of drying temperature 50oC,
drying time 180 min. and clearance between
pair of disc 8 mm. The broken kernels
decrease with increase in clearance between
disc and shown slight decrease with the
increasing drying temperature (Fig. 5). The
response of broken kernel was observed to be
significant with independent parameters viz.
clearance between disc and drying
temperature.
The response surface equation was obtained
for the model of second degree in terms of
actual factors is given as,
Broken kernel= +5.47-0.26*T-
3.02*C+0.56*TC+0.95*C2 …(4)
Capacity of machine
The capacity of machine was observed to be
ranging from 3.8 to 6.69 % depending upon
various parameters. The minimum machine
capacity was found for treatment having the
combination of drying temperature 50oC,
drying time 180 min. and clearance between
pair of disc 8 mm. The maximum machine
capacity was observed in case of treatment
having the combination of drying temperature
60oC, drying time 120 min and clearance
between pair of disc 12 mm. Capacity of
machine increases with increase in clearance
between discs. Again, it was observed that
capacity of machine increased with increase
in drying temperature (Fig. 6). This both
parameters had shown a significant effect on
capacity of machines.
The equation in terms of actual factors which
described the effect on capacity of machine is
given as,
Int.J.Curr.Microbiol.App.Sci (2019) 8(1): 1848-1862
1853
Capacity of Machine = -
23.08053+0.51380*T-3.97917E-
003*t+2.22668*C- 4.11711E-003*T2
-
0.087303*C2 …
(5)
Optimization of process parameters for
appropriate decortication of chironji nuts
The whole kernel recovery (%), decorticating
efficiency (%), unshelled nut (%), broken
kernel (%) and capacity of machine (kg/h)
were taken as responses in order to optimize
the machine parameters. The optimization
was carried out using response surface
methodology (Design Expert 9.0.5.1). The
optimized values of drying temperature,
drying time and clearance between pair of
disc were taken for further study. Numerical
(Table 3) and graphical optimizations (Fig. 7)
were carried out for obtaining the appropriate
design parameter for obtaining optimum
whole kernel recovery (%), decorticating
efficiency (%), unshelled nut (%), broken
kernel (%) and capacity of machine (kg/h).
Design expert program of the STATEASE
software was utilized (Design Expert 9.0.5.1)
for simultaneous optimization of the multiple
regressions, and responses were chosen and
different weights assigned to each goal to
adjust the shape of its particular desirability
function.
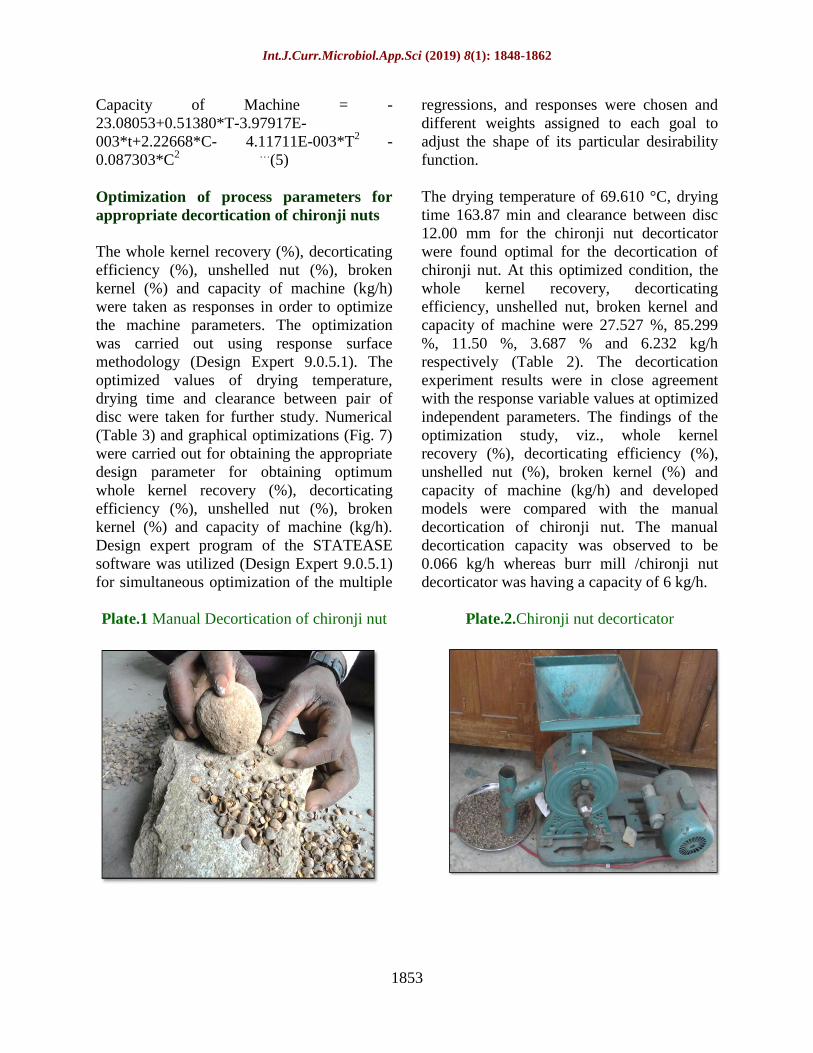
The drying temperature of 69.610 °C, drying
time 163.87 min and clearance between disc
12.00 mm for the chironji nut decorticator
were found optimal for the decortication of
chironji nut. At this optimized condition, the
whole kernel recovery, decorticating
efficiency, unshelled nut, broken kernel and
capacity of machine were 27.527 %, 85.299
%, 11.50 %, 3.687 % and 6.232 kg/h
respectively (Table 2). The decortication
experiment results were in close agreement
with the response variable values at optimized
independent parameters. The findings of the
optimization study, viz., whole kernel
recovery (%), decorticating efficiency (%),
unshelled nut (%), broken kernel (%) and
capacity of machine (kg/h) and developed
models were compared with the manual
decortication of chironji nut. The manual
decortication capacity was observed to be
0.066 kg/h whereas burr mill /chironji nut
decorticator was having a capacity of 6 kg/h.
Plate.1 Manual Decortication of chironji nut
Plate.2.Chironji nut decorticator
Int.J.Curr.Microbiol.App.Sci (2019) 8(1): 1848-1862
1854
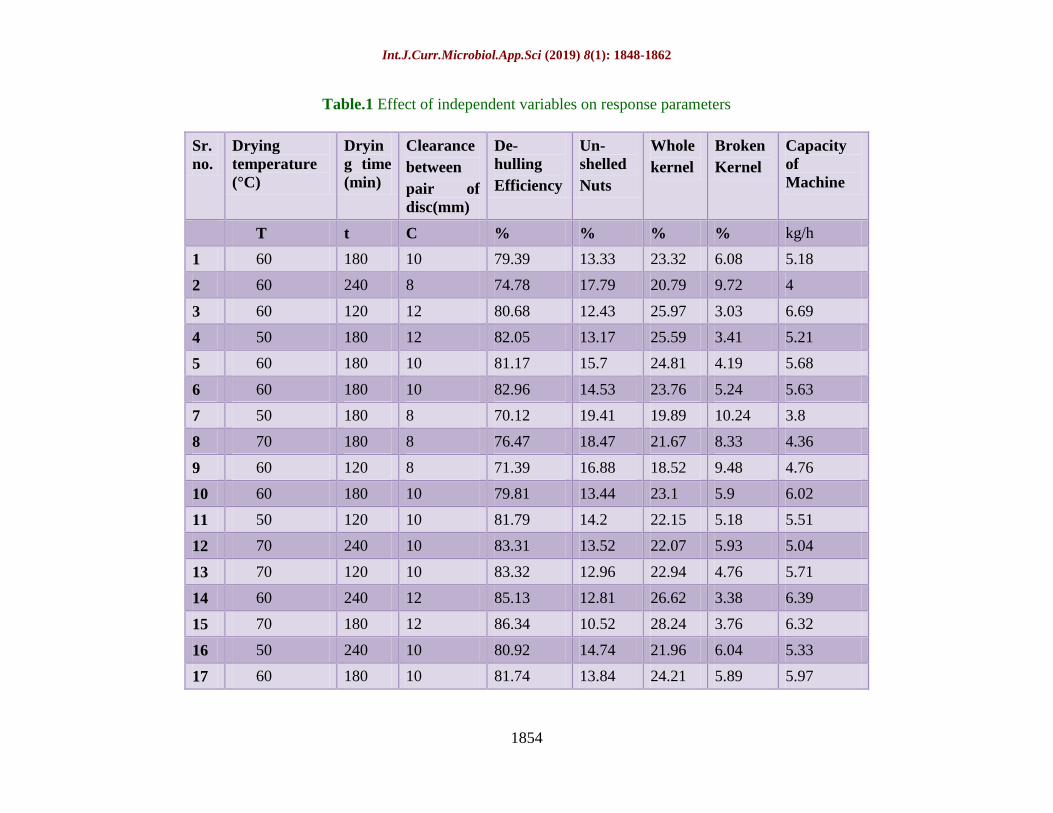
Table.1 Effect of independent variables on response parameters
Sr.
no.
Drying
temperature
(°C)
Dryin
g time
(min)
Clearance
between
pair of
disc(mm)
De-
hulling
Efficiency
Un-
shelled
Nuts
Whole
kernel
Broken
Kernel
Capacity
of
Machine
T t C % % % % kg/h
1 60 180 10 79.39 13.33 23.32 6.08 5.18
2 60 240 8 74.78 17.79 20.79 9.72 4
3 60 120 12 80.68 12.43 25.97 3.03 6.69
4 50 180 12 82.05 13.17 25.59 3.41 5.21
5 60 180 10 81.17 15.7 24.81 4.19 5.68
6 60 180 10 82.96 14.53 23.76 5.24 5.63
7 50 180 8 70.12 19.41 19.89 10.24 3.8
8 70 180 8 76.47 18.47 21.67 8.33 4.36
9 60 120 8 71.39 16.88 18.52 9.48 4.76
10 60 180 10 79.81 13.44 23.1 5.9 6.02
11 50 120 10 81.79 14.2 22.15 5.18 5.51
12 70 240 10 83.31 13.52 22.07 5.93 5.04
13 70 120 10 83.32 12.96 22.94 4.76 5.71
14 60 240 12 85.13 12.81 26.62 3.38 6.39
15 70 180 12 86.34 10.52 28.24 3.76 6.32
16 50 240 10 80.92 14.74 21.96 6.04 5.33
17 60 180 10 81.74 13.84 24.21 5.89 5.97
Int.J.Curr.Microbiol.App.Sci (2019) 8(1): 1848-1862
1855
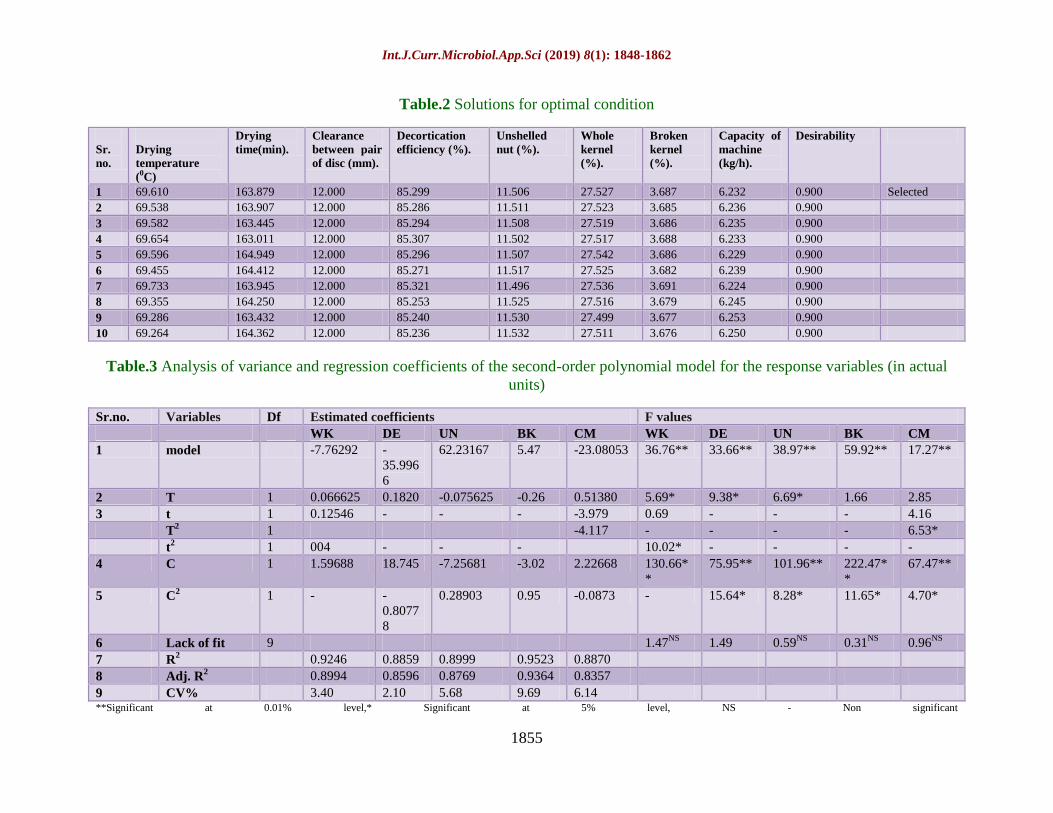
Table.2 Solutions for optimal condition
Sr.
no.
Drying
temperature
(0C)
Drying
time(min).
Clearance
between pair
of disc (mm).
Decortication
efficiency (%).
Unshelled
nut (%).
Whole
kernel
(%).
Broken
kernel
(%).
Capacity of
machine
(kg/h).
Desirability
1 69.610 163.879 12.000 85.299 11.506 27.527 3.687 6.232 0.900 Selected
2 69.538 163.907 12.000 85.286 11.511 27.523 3.685 6.236 0.900
3 69.582 163.445 12.000 85.294 11.508 27.519 3.686 6.235 0.900
4 69.654 163.011 12.000 85.307 11.502 27.517 3.688 6.233 0.900
5 69.596 164.949 12.000 85.296 11.507 27.542 3.686 6.229 0.900
6 69.455 164.412 12.000 85.271 11.517 27.525 3.682 6.239 0.900
7 69.733 163.945 12.000 85.321 11.496 27.536 3.691 6.224 0.900
8 69.355 164.250 12.000 85.253 11.525 27.516 3.679 6.245 0.900
9 69.286 163.432 12.000 85.240 11.530 27.499 3.677 6.253 0.900
10 69.264 164.362 12.000 85.236 11.532 27.511 3.676 6.250 0.900
Table.3 Analysis of variance and regression coefficients of the second-order polynomial model for the response variables (in actual
units)
Sr.no. Variables Df Estimated coefficients F values
WK DE UN BK CM WK DE UN BK CM
1 model -7.76292 -
35.996
6
62.23167 5.47 -23.08053 36.76** 33.66** 38.97** 59.92** 17.27**
2 T 1 0.066625 0.1820 -0.075625 -0.26 0.51380 5.69* 9.38* 6.69* 1.66 2.85
3 t 1 0.12546 - - - -3.979 0.69 - - - 4.16
T2 1 -4.117 - - - - 6.53*
t2 1 004 - - - 10.02* - - - -
4 C 1 1.59688 18.745 -7.25681 -3.02 2.22668 130.66*
*
75.95** 101.96** 222.47*
*
67.47**
5 C2 1 - -
0.8077
8
0.28903 0.95 -0.0873 - 15.64* 8.28* 11.65* 4.70*
6 Lack of fit 9 1.47NS
1.49 0.59NS
0.31NS
0.96NS
7 R2 0.9246 0.8859 0.8999 0.9523 0.8870
8 Adj. R2 0.8994 0.8596 0.8769 0.9364 0.8357
9 CV% 3.40 2.10 5.68 9.69 6.14 **Significant at 0.01% level,* Significant at 5% level, NS - Non significant

Int.J.Curr.Microbiol.App.Sci (2019) 8(1): 1848-1862
1856
Design-Expert® SoftwareFactor Coding: Actualwhole kernel (%)
Design points above predicted valueDesign points below predicted value28.24
18.52
X1 = A: temperatureX2 = C: clearence between disc
Actual FactorB: time = 180
8
9
10
11
12
50
55
60
65
70
18
20
22
24
26
28
30
wh
ole
ke
rn
el
(%
)
A: temperature (degree)
C: clearence between disc (mm)
Design-Expert® SoftwareFactor Coding: Actualwhole kernel (%)
Design points above predicted valueDesign points below predicted value28.24
18.52
X1 = B: timeX2 = C: clearence between disc
Actual FactorA: temperature = 60
8
9
10
11
12
120
150
180
210
240
18
20
22
24
26
28
30
wh
ole
ke
rne
l (%
)
B: time (min)
C: clearence between disc (mm)
Design-Expert® SoftwareFactor Coding: Actualwhole kernel (%)
Design points above predicted valueDesign points below predicted value28.24
18.52
X1 = A: temperatureX2 = B: time
Actual FactorC: clearence between disc = 10
120
150
180
210
240
50
55
60
65
70
18
20
22
24
26
28
30
wh
ole
ke
rne
l (%
)
A: temperature (degree)
B: time (min)
Fig.1 Process flow chart for chironji nut decortication
Fig.2 Response surface and contour plots for whole kernel recovery of chironji nut as a function
of drying temperature, drying time and clearance between disc. For each plot, the third parameter
is fixed at “0” level
Int.J.Curr.Microbiol.App.Sci (2019) 8(1): 1848-1862
1857
Design-Expert® SoftwareFactor Coding: Actualdehulling efficiency (%)
Design points above predicted valueDesign points below predicted value86.34
70.12
X1 = B: timeX2 = C: clearence between disc
Actual FactorA: temperature = 60
8
9
10
11
12
120
150
180
210
240
70
75
80
85
90
de
hu
llin
g e
ffic
ie
nc
y (%
)
B: time (min)C: clearence between disc (mm)
Design-Expert® SoftwareFactor Coding: Actualdehulling efficiency (%)
Design points above predicted valueDesign points below predicted value86.34
70.12
X1 = A: temperatureX2 = B: time
Actual FactorC: clearence between disc = 10
120
150
180
210
240
50
55
60
65
70
70
75
80
85
90
de
hu
llin
g e
ffic
ien
cy
(%
)
A: temperature (degree)B: time (min)
Fig.3 Response surface and contour plots for dehulling efficiency as a function of drying
temperature, drying time and clearance between disc. For each plot, the third parameter is fixed
at “0” level
Int.J.Curr.Microbiol.App.Sci (2019) 8(1): 1848-1862
1858
Design-Expert® SoftwareFactor Coding: Actualun-shelled nuts (%)
Design points above predicted valueDesign points below predicted value19.41
10.52
X1 = B: timeX2 = C: clearence between disc
Actual FactorA: temperature = 60
8
9
10
11
12
120
150
180
210
240
10
12
14
16
18
20
un
-s
he
lle
d n
uts
(%
)
B: time (min)C: clearence between disc (mm)
Design-Expert® SoftwareFactor Coding: Actualun-shelled nuts (%)
Design points above predicted valueDesign points below predicted value19.41
10.52
X1 = A: temperatureX2 = C: clearence between disc
Actual FactorB: time = 180
8
9
10
11
12
50
55
60
65
70
10
12
14
16
18
20
un
-s
he
lle
d n
uts
(%
)
A: temperature (degree)
C: clearence between disc (mm)
Design-Expert® SoftwareFactor Coding: Actualun-shelled nuts (%)
Design points above predicted valueDesign points below predicted value19.41
10.52
X1 = A: temperatureX2 = B: time
Actual FactorC: clearence between disc = 10
120
150
180
210
240
50
55
60
65
70
10
12
14
16
18
20
un
-s
he
lle
d n
uts
(%
)
A: temperature (degree)
B: time (min)
Fig.4 Response surface and contour plots for unshelled nut as a function of drying temperature,
drying time and clearance between disc. For each plot, the third parameter is fixed at “0” level

Int.J.Curr.Microbiol.App.Sci (2019) 8(1): 1848-1862
1859
Design-Expert® SoftwareFactor Coding: ActualBroken kernel (%)
Design points above predicted valueDesign points below predicted value10.24
3.03
X1 = B: timeX2 = C: clearence between disc
Actual FactorA: temperature = 60
8
9
10
11
12
120
150
180
210
2402
4
6
8
10
12
Bro
ke
n k
ern
el
(%
)
B: time (min)
C: clearence between disc (mm)
Design-Expert® SoftwareFactor Coding: ActualBroken kernel (%)
Design points above predicted valueDesign points below predicted value10.24
3.03
X1 = A: temperatureX2 = C: clearence between disc
Actual FactorB: time = 180
8
9
10
11
12
50
55
60
65
70
2
4
6
8
10
12
Bro
ke
n k
ern
el
(%
)
A: temperature (degree)C: clearence between disc (mm)
Design-Expert® SoftwareFactor Coding: ActualBroken kernel (%)
Design points above predicted valueDesign points below predicted value10.24
3.03
X1 = B: timeX2 = A: temperature
Actual FactorC: clearence between disc = 10
50
55
60
65
70
120
150
180
210
240
2
4
6
8
10
12
Bro
ke
n k
ern
el (%
)
B: time (min)A: temperature (degree)
Fig.5 Response surface and contour plots for broken kernel as a function of drying temperature,
drying time and clearance between disc. For each plot, the third parameter is fixed at “0” level

Int.J.Curr.Microbiol.App.Sci (2019) 8(1): 1848-1862
1860
Design-Expert® SoftwareFactor Coding: ActualCapacity of Machine (kg/h)
Design points above predicted valueDesign points below predicted value6.69
3.8
X1 = A: temperatureX2 = C: clearence between disc
Actual FactorB: time = 180
8
9
10
11
12
50
55
60
65
70
3
4
5
6
7
Ca
pa
cit
y o
f M
ac
hin
e (k
g/h
)
A: temperature (degree)C: clearence between disc (mm)
Design-Expert® SoftwareFactor Coding: ActualCapacity of Machine (kg/h)
Design points above predicted valueDesign points below predicted value6.69
3.8
X1 = B: timeX2 = C: clearence between disc
Actual FactorA: temperature = 60
8
9
10
11
12
120
150
180
210
240
3
4
5
6
7
Ca
pa
cit
y o
f M
ac
hin
e (k
g/h
)
B: time (min)C: clearence between disc (mm)
Design-Expert® SoftwareFactor Coding: ActualCapacity of Machine (kg/h)
Design points above predicted valueDesign points below predicted value6.69
3.8
X1 = A: temperatureX2 = B: time
Actual FactorC: clearence between disc = 10
120
150
180
210
240
50
55
60
65
70
3
4
5
6
7
Ca
pa
cit
y o
f M
ac
hin
e (k
g/h
)
A: temperature (degree)B: time (min)
Fig.6 Response surface and contour plots for capacity of machine as a function of drying
temperature, drying time and clearance between disc. For each plot, the third parameter is fixed
at “0” level

Int.J.Curr.Microbiol.App.Sci (2019) 8(1): 1848-1862
1861
Design-Expert® SoftwareFactor Coding: ActualOverlay Plot
dehulling efficiencyun-shelled nutswhole kernelBroken kernelCapacity of Machine
Design Points
X1 = B: timeX2 = A: temperature
Actual FactorC: clearence between disc = 12
120 150 180 210 240
50
55
60
65
70Overlay Plot
X1: B: time (min)X2: A: temperature (degree)
dehulling efficiency: 83.6291
un-shelled nuts: 12.3606
whole kernel: 26.8577
whole kernel: 27.5526
Broken kernel: 3.46645
Capacity of Machine: 6.22338
Capacity of Machine: 6.46875
dehulling efficie 85.2594un-shelled nuts: 11.5222whole kernel: 27.5123Broken kernel: 3.68028Capacity of Mac 6.24491X1 163.858X2 69.3949
Design-Expert® SoftwareFactor Coding: ActualOverlay Plot
dehulling efficiencyun-shelled nutswhole kernelBroken kernelCapacity of Machine
X1 = C: clearence between discX2 = A: temperature
Actual FactorB: time = 163.879
10 10.5 11 11.5 12
50
55
60
65
70Overlay Plot
X1: C: clearence between disc (mm)X2: A: temperature (degree)
dehulling efficiency: 83.2325
un-shelled nuts: 12.3606
whole kernel: 26.0309
Broken kernel: 3.64608
Broken kernel: 4.37756
Capacity of Machine: 6.04467
dehulling efficie 85.3948un-shelled nuts: 11.6771whole kernel: 26.9233Broken kernel: 3.82364Capacity of Mac 6.18126X1 11.629X2 69.4432
Design-Expert® SoftwareFactor Coding: ActualOverlay Plot
dehulling efficiencyun-shelled nutswhole kernelBroken kernelCapacity of Machine
X1 = B: timeX2 = C: clearence between disc
Actual FactorA: temperature = 69.5785
120 150 180 210 240
8
9
10
11
12Overlay Plot
X1: B: time (min)X2: C: clearence between disc (mm)
dehulling efficiency: 81.3131
dehulling efficiency: 85.419dehulling efficiency: 85.419
un-shelled nuts: 11.5924
un-shelled nuts: 15.5418
whole kernel: 24.9339
whole kernel: 27.0186
Broken kernel: 3.84806
Broken kernel: 5.68997
Capacity of Machine: 5.93035
Capacity of Machine: 6.17165
dehulling efficie 85.2937un-shelled nuts: 11.5083whole kernel: 27.5243Broken kernel: 3.68611Capacity of Mac 6.23382X1 163.892X2 12
Fig.7 Optimization of independent parameters
In conclusion the superimposed contours
showed the optimized result, where the
independent parameters were drying
temperature of 69.610 °C, drying time 163.87
min and clearance between disc 12.00 mm thus
the responses showing predicted value as
85.299 % for decorticating efficiency, 27.527%
for whole kernel recovery, 11.506% for
unshelled nut, 3.687% for broken kernel and
6.232 Kg/h for capacity of machine were
Int.J.Curr.Microbiol.App.Sci (2019) 8(1): 1848-1862
1862
obtained. The calculated F value for lack of fit
for all responses was found to be less than
tabular values, which indicates that the
regression equation obtained though RSM are in
close agreement with the experimental values.
The investigation proves that the slight change
in the clearance between the pair of discs of
burr mill (machine) along with drying
temperature and drying time helped in saving
labour, saving cost of operation, reduction in
drudgery and time and improving quality of
kernel. Thus the burr mill could be used as
chironji nut decorticator.
List of Symbols and Abbreviations
Yk Predicted value of the responses
from the developed models
T Drying temperature
t Drying time
C Clearance between disc
WK Whole kernel
DE De-hulling efficiency
UN Unshelled nut
BK Broken kernel
CM Capacity of machine
RSM Response surface methodology
x1, x2,
and x3
Coded values of the independent
variables X1, X2, and X3
References
Bashiri, I.M., Zubairu, M. and Olorunaye, E. S.
(2013). Design and construction of a
machine for decorticating bambara nut. J.
Rind 11(2): 355-360.
Chandhar, S.K. and Sharma, M.C. (1997).
Trends in fruit production in Buchanania
lazan trees. Vaniki Sandesh 21, 1-3
Davies, R. and Mohammed, U.S. (2013).
Engineering properties of bitter kola nuts
and shell as potentials for development
processing machines. IJSRES.1(11):337-
343.
Gabadam, E.K., Anthony, S. and Asiam, E.K.
(2009). The determination of some design
parameters for palm nut crackers. European
J. of scientific research, 38(2): 315-325.
Jose Dalton Cruz Pessoa and Johannes Van
Leeuwen (2006). Development of a
shelling method to recover whole kernels
of the cutia nut (Couepia edulis). Rev.
Bras. Frutic., Jaboticabal – SP- 28(2): 236-
239
Kumar Jitendra; Prabhakar, P.K., Srivastav, P.P.
and Bhowmick, P.K. (2014). Physical
characterization of chironji (Buchanania
lanzan) nut and kernels. Food Sci. Res. J.,
5(2): 148-153
Mangaraj, S., and Kapur, T. (2005). Milling
studies of pulses using different pre milling
treatment and abrasive roller assembly.
Agricultural Engineering Today, 29(5–6),
64–70.
Myers, R.H. and Montgomery, D.C. (2002).
Response Surface Methodology. Process
and Product Optimization using Designed
Experiments. Wiley, New York
Rai, Y.C. (1982), Buchanania lazan, Spreng. –
studies on methods of propagation and
estimation of fruit yield. Indian Forester
108, 501 -511.
Sahay, K. M., and Bisht, B. S. (1988).
Development of a small abrasive
cylindrical mill for milling pulses
International Journal of Food Science &
Technology, 23(1), 17–22.
How to cite this article:
Dange, M.M., P.S. Champawat, P.H. Bakane, S.D. Deshmukh, S.K. Jain and Borkar, P.A. 2019.
Process Parameters for Chironji Nut (Buchanania lanzan.) Decortication.
Int.J.Curr.Microbiol.App.Sci. 8(01): 1848-1862. doi: https://doi.org/10.20546/ijcmas.2019.801.195