proceedings - website personalpersonal.its.ac.id/...silvianita-oe-09-icssbe2012_proceedings.pdf ·...
TRANSCRIPT
ProceedingsINTERNATIONAL CONFERENCE ON STATISTICS IN SCIENCE, BUSINESS ANDENGINEERING 2012
Hosted by:Faculty of Computer and Mathematical Sciences,University Teknologi MARA, MalaysiaAwana Porto Malai Hotel, Langkawi, Kedah, Malaysia10 – 12 September 2012
IEEE Catalog Number: CFP1272S-CDRISBN: 978-1-4673-1580-7

©2012 IEEE. Personal use of this material is permitted. However, permission toreprint/publish this material for advertising or promotional purpose or for creating newcollective works for resale or redistribution or serves or lists or to reuse any copyrightcomponent of this work in other works must be obtained from IEEE.
Copyright and Reprint PermissionAbstracting is permitted with credit to the source. Libraries are permitted to photocopybeyond the limits of U.S copyright law for private use of patrons those articles in thisvolume that carry a code at the bottom of the first page, provided the per-copy feeindicated in the code is paid through Copyright Clearance Center, 222 Rosewood Drives,Danvers, MA 01923.
For other copying, reprint or republication permission, write to IEEE CopyrightsManager, IEEE Operations Center, 455 Hoes Lane, P.O Box 1331, Piscataway, NJ08855-1331. All right reserved. Copyright© 2012 by the Institute of Electrical andElectronics Engineers.
IEEE Catalog Number: CFP1272S-CDRISBN: 978-1-4673-1580-7
ProceedingsInternational Conference on Statistics in Science, Business and Engineering 2012Copyright© 2012 by the Institute of Electrical and Electronics Engineers. Inc. All rightsreserved
Copyright and Reprint PermissionAbstracting is permitted with credit to the source. Libraries are permitted to photocopybeyond the limit of U.S copyright law for private use of patrons those articles in thisvolume that carry a code at the bottom of the first page, provided the per-copy feeindicated in the code is paid through Copyright Clearance Center, 222 Rosewood Drive,Danvers, MA 01923.
For other copying, reprint or republication permission, write to IEEE CopyrightsManager, IEEE Operations Center, 455 Hoes Lane, P.O Box 1331, Piscataway, NJ08855-1331. All right reserved. Copyright© 2012 by the Institute of Electrical andElectronics Engineers.
IEEE Catalog Number: CFP1272S-CDRISBN: 978-1-4673-1580-7
International Conference on Statistics in Science, Business and Engineering 2012 (ICSSBE2012) 10-12 Septermber 2012, Langkawi, Malaysia
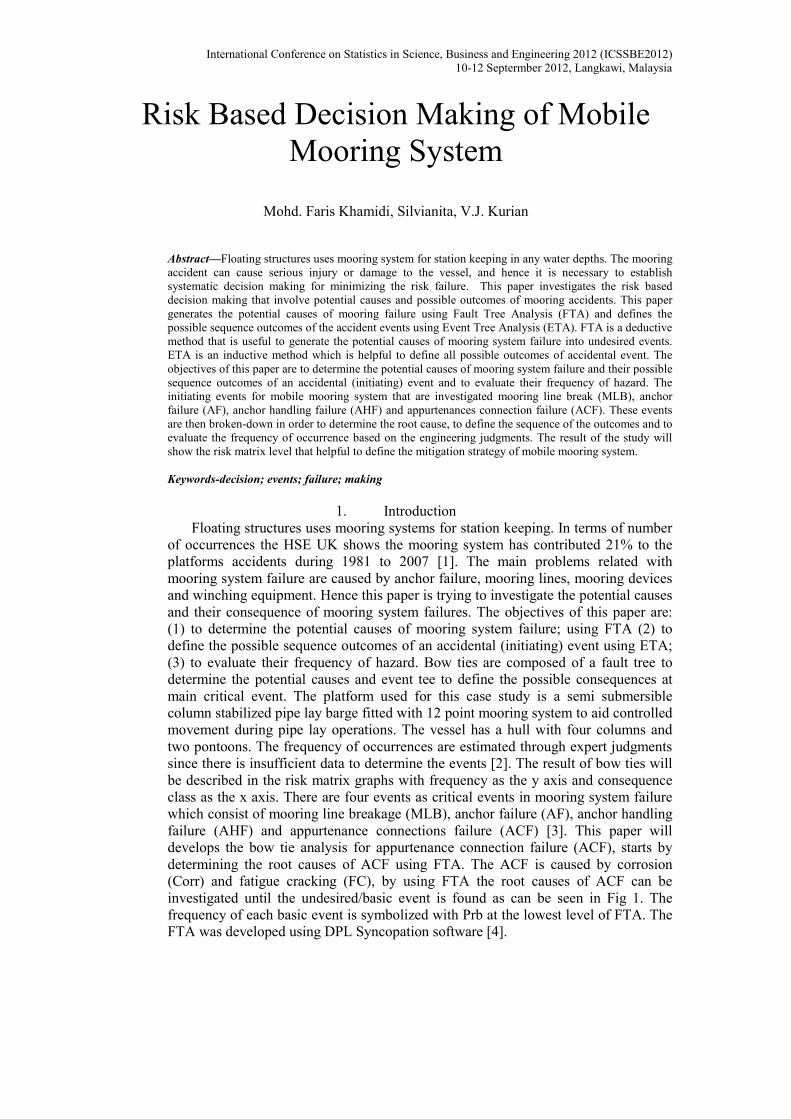
Risk Based Decision Making of Mobile Mooring System
Mohd. Faris Khamidi, Silvianita, V.J. Kurian
Abstract—Floating structures uses mooring system for station keeping in any water depths. The mooring accident can cause serious injury or damage to the vessel, and hence it is necessary to establish systematic decision making for minimizing the risk failure. This paper investigates the risk based decision making that involve potential causes and possible outcomes of mooring accidents. This paper generates the potential causes of mooring failure using Fault Tree Analysis (FTA) and defines the possible sequence outcomes of the accident events using Event Tree Analysis (ETA). FTA is a deductive method that is useful to generate the potential causes of mooring system failure into undesired events. ETA is an inductive method which is helpful to define all possible outcomes of accidental event. The objectives of this paper are to determine the potential causes of mooring system failure and their possible sequence outcomes of an accidental (initiating) event and to evaluate their frequency of hazard. The initiating events for mobile mooring system that are investigated mooring line break (MLB), anchor failure (AF), anchor handling failure (AHF) and appurtenances connection failure (ACF). These events are then broken-down in order to determine the root cause, to define the sequence of the outcomes and to evaluate the frequency of occurrence based on the engineering judgments. The result of the study will show the risk matrix level that helpful to define the mitigation strategy of mobile mooring system.
Keywords-decision; events; failure; making
1. Introduction
Floating structures uses mooring systems for station keeping. In terms of number of occurrences the HSE UK shows the mooring system has contributed 21% to the platforms accidents during 1981 to 2007 [1]. The main problems related with mooring system failure are caused by anchor failure, mooring lines, mooring devices and winching equipment. Hence this paper is trying to investigate the potential causes and their consequence of mooring system failures. The objectives of this paper are: (1) to determine the potential causes of mooring system failure; using FTA (2) to define the possible sequence outcomes of an accidental (initiating) event using ETA; (3) to evaluate their frequency of hazard. Bow ties are composed of a fault tree to determine the potential causes and event tee to define the possible consequences at main critical event. The platform used for this case study is a semi submersible column stabilized pipe lay barge fitted with 12 point mooring system to aid controlled movement during pipe lay operations. The vessel has a hull with four columns and two pontoons. The frequency of occurrences are estimated through expert judgments since there is insufficient data to determine the events [2]. The result of bow ties will be described in the risk matrix graphs with frequency as the y axis and consequence class as the x axis. There are four events as critical events in mooring system failure which consist of mooring line breakage (MLB), anchor failure (AF), anchor handling failure (AHF) and appurtenance connections failure (ACF) [3]. This paper will develops the bow tie analysis for appurtenance connection failure (ACF), starts by determining the root causes of ACF using FTA. The ACF is caused by corrosion (Corr) and fatigue cracking (FC), by using FTA the root causes of ACF can be investigated until the undesired/basic event is found as can be seen in Fig 1. The frequency of each basic event is symbolized with Prb at the lowest level of FTA. The FTA was developed using DPL Syncopation software [4].

International Conference on Statistics in Science, Business and Engineering 2012 (ICSSBE2012) 10-12 Septermber 2012, Langkawi, Malaysia
Fig. 1. Appurtenances Connections Failure (ACF)

International Conference on Statistics in Science, Business and Engineering 2012 (ICSSBE2012) 10-12 Septermber 2012, Langkawi, Malaysia
2. Fault Tree Analysis (FTA)
FTA is a deductive approach that consists of symbols and gate in order to describe the process of system failure. This paper develops FTA in four major failure of mooring system which composed MLB, AF, AHF and ACF. In order to analyze the fault tree, the evaluations uses the rules of Boolean Algebra [5]. First step to evaluate the fault tree is to determine the cut set and minimal cut set. Cut set (CS) is a group of failure events that if they all occur cause the top event to occur. Minimal cut set (MCS) is a minimal group of failure events that can still cause the top event to occur [6]. The expert evaluate the frequency of occurrence using IMO standards as shown in Table 1[7].
Table 1. Frequency Index FI Frequency Definition F (per ship year) 7 Frequent Likely to occur once per month on one ship 10 5 Reasonably
probable Likely to occur once per year in a fleet of ships, i.e. likely to occur several times during a ships life
10-1
3 Remote Likely to occur once per year in a fleet of 1000 of ships, i.e. 10% chance of occurring in the life of 4 similar ships
10-3
1 Extremely remote
Likely to occur once in 100 years in a fleet of 1000 ships, i.e.1% chance of occurring in the life of 40 similar ships
10-5
In order to quantify the frequency of failure, the basic event in a system failure
need to be found. Since it is very difficult to collect the past record data for FTA, hence it is need to collect the expert judgments. The experts evaluate all the basic causes in the fault tree diagram and give their judgments based on their experience using Table 1 as the guidance. Table 2 is the minimal cut set of ACF based on the DPL software output. The result shows that the frequency of occurrence of ACF is 0.0438 per unit year which classified as occasional.
Table 2. Cut Set of ACF Rank Cut Set Code Order Importance Level
1 Excessive Waves, Winds, Current EWa, EWi, ECu 3rd 0.037 2 Adverse Environmental Condition AEC 1st 0.003 3 Human Error HE 1st 0.0009 4 Incomprehensive Data Collection IDC 1st 0.0007 5 Inadequate Maintenance Schedule IMS 1st 0.0005 6 Uncertified Crews UC 1st 0.0004 7 Uncertified Equipment UE 1st 0.0004 8 Incompetence Crews IC 1st 0.0004 9 Wrong Material WM 1st 0.0003
10 Manufacturing Error ME 1st 0.0002 Probability of ACF 0.0438
3. Event Tree Analysis (ETA)
ETA is an inductive methods that define all potential consequence resulting from an accidental (initiating) event, those potential consequences is called consequence spectrum [8]. Generally the pivotal event splits in event tree are binary, it can be success or fail, yes or no condition. A list of the outcomes can be determined and evaluated by multiplying the event frequency in the path events. Event tree as an graphical model of an accident scenario that illustrated the multiple outcomes and their frequency is based on the following definitions [9]: - IE (Initiating Event) are failure or undesired event which initiates the beginning
of an accident sequence. The IE can result in an accident, depend on successful operation of the hazard corrective techniques of the system.
- PE (Pivotal Event) are mediator events between the IE and the final accident. - Accident scenarios are list of events that eventually come up with an accident.
Event tree diagram of ACF is shown in Fig. 2. The diagram shows the sequence of ACF consequence completed with the frequency of occurrence based on the expert judgments. The frequency of ACF in the first path is derived from the result of FTA which is 0.0438 per unit year.
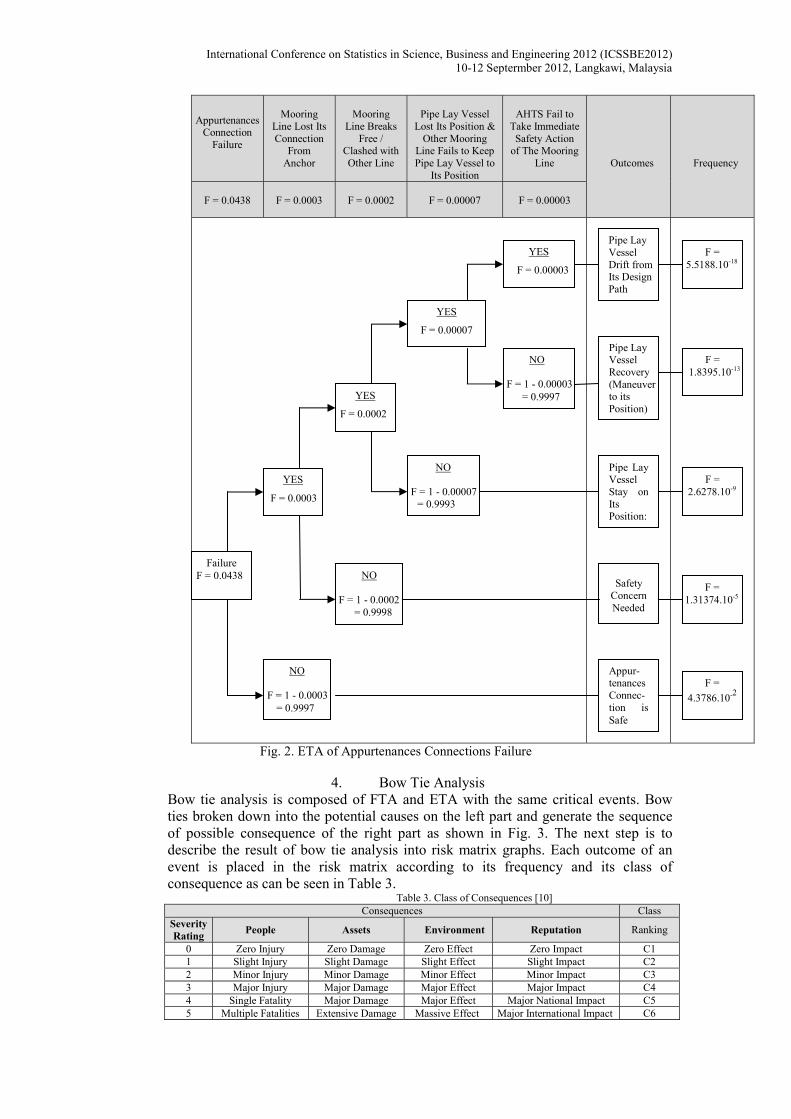
International Conference on Statistics in Science, Business and Engineering 2012 (ICSSBE2012) 10-12 Septermber 2012, Langkawi, Malaysia
Fig. 2. ETA of Appurtenances Connections Failure
4. Bow Tie Analysis Bow tie analysis is composed of FTA and ETA with the same critical events. Bow ties broken down into the potential causes on the left part and generate the sequence of possible consequence of the right part as shown in Fig. 3. The next step is to describe the result of bow tie analysis into risk matrix graphs. Each outcome of an event is placed in the risk matrix according to its frequency and its class of consequence as can be seen in Table 3.
Table 3. Class of Consequences [10] Consequences Class
Severity Rating People Assets Environment Reputation Ranking
0 Zero Injury Zero Damage Zero Effect Zero Impact C1 1 Slight Injury Slight Damage Slight Effect Slight Impact C2 2 Minor Injury Minor Damage Minor Effect Minor Impact C3 3 Major Injury Major Damage Major Effect Major Impact C4 4 Single Fatality Major Damage Major Effect Major National Impact C5 5 Multiple Fatalities Extensive Damage Massive Effect Major International Impact C6
Appurtenances
Connection Failure
Mooring Line Lost Its Connection
From Anchor
Mooring Line Breaks
Free / Clashed with Other Line
Pipe Lay Vessel
Lost Its Position & Other Mooring
Line Fails to Keep Pipe Lay Vessel to
Its Position
AHTS Fail to Take Immediate Safety Action
of The Mooring Line
Outcomes
Frequency
F = 0.0438
F = 0.0003
F = 0.0002
F = 0.00007
F = 0.00003
Failure F = 0.0438
Pipe Lay Vessel Drift from Its Design Path
Pipe Lay Vessel Recovery (Maneuver to its Position)
Pipe Lay Vessel Stay on Its Position:
Safety Concern Needed
Appur-tenances Connec-tion is Safe
YES
F = 0.0003
YES
F = 0.0002
YES
F = 0.00007
YES
F = 0.00003
NO
F = 1 - 0.0003 = 0.9997
NO
F = 1 - 0.0002 = 0.9998
NO F = 1 - 0.00007
= 0.9993
NO
F = 1 - 0.00003 = 0.9997
F = 5.5188.10-18
F = 1.8395.10-13
F = 2.6278.10-9
F = 1.31374.10-5
F = 4.3786.10-2
International Conference on Statistics in Science, Business and Engineering 2012 (ICSSBE2012) 10-12 Septermber 2012, Langkawi, Malaysia
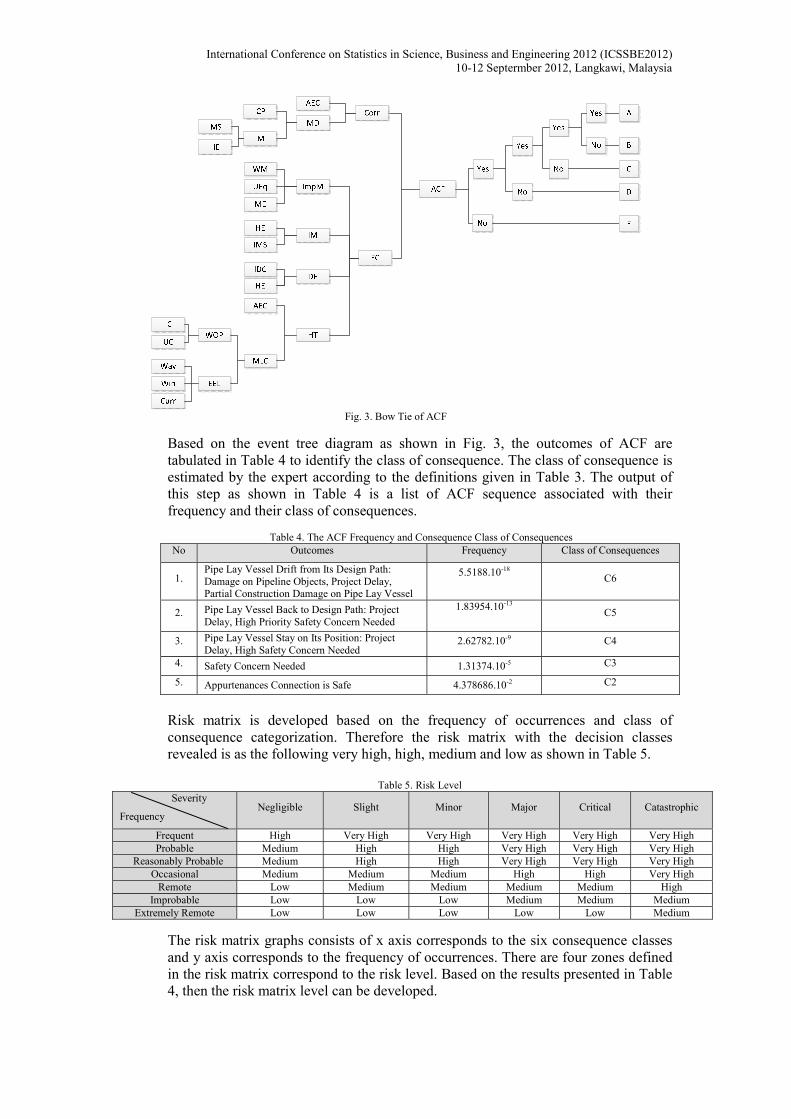
Fig. 3. Bow Tie of ACF
Based on the event tree diagram as shown in Fig. 3, the outcomes of ACF are tabulated in Table 4 to identify the class of consequence. The class of consequence is estimated by the expert according to the definitions given in Table 3. The output of this step as shown in Table 4 is a list of ACF sequence associated with their frequency and their class of consequences.
Table 4. The ACF Frequency and Consequence Class of Consequences
No Outcomes Frequency Class of Consequences
1. Pipe Lay Vessel Drift from Its Design Path: Damage on Pipeline Objects, Project Delay, Partial Construction Damage on Pipe Lay Vessel
5.5188.10-18 C6
2. Pipe Lay Vessel Back to Design Path: Project Delay, High Priority Safety Concern Needed
1.83954.10-13 C5
3. Pipe Lay Vessel Stay on Its Position: Project Delay, High Safety Concern Needed
2.62782.10-9 C4
4. Safety Concern Needed 1.31374.10-5 C3
5. Appurtenances Connection is Safe 4.378686.10-2 C2
Risk matrix is developed based on the frequency of occurrences and class of consequence categorization. Therefore the risk matrix with the decision classes revealed is as the following very high, high, medium and low as shown in Table 5.
Table 5. Risk Level Severity
Frequency Negligible Slight Minor Major Critical Catastrophic
Frequent High Very High Very High Very High Very High Very High Probable Medium High High Very High Very High Very High
Reasonably Probable Medium High High Very High Very High Very High Occasional Medium Medium Medium High High Very High
Remote Low Medium Medium Medium Medium High Improbable Low Low Low Medium Medium Medium
Extremely Remote Low Low Low Low Low Medium
The risk matrix graphs consists of x axis corresponds to the six consequence classes and y axis corresponds to the frequency of occurrences. There are four zones defined in the risk matrix correspond to the risk level. Based on the results presented in Table 4, then the risk matrix level can be developed.
International Conference on Statistics in Science, Business and Engineering 2012 (ICSSBE2012) 10-12 Septermber 2012, Langkawi, Malaysia
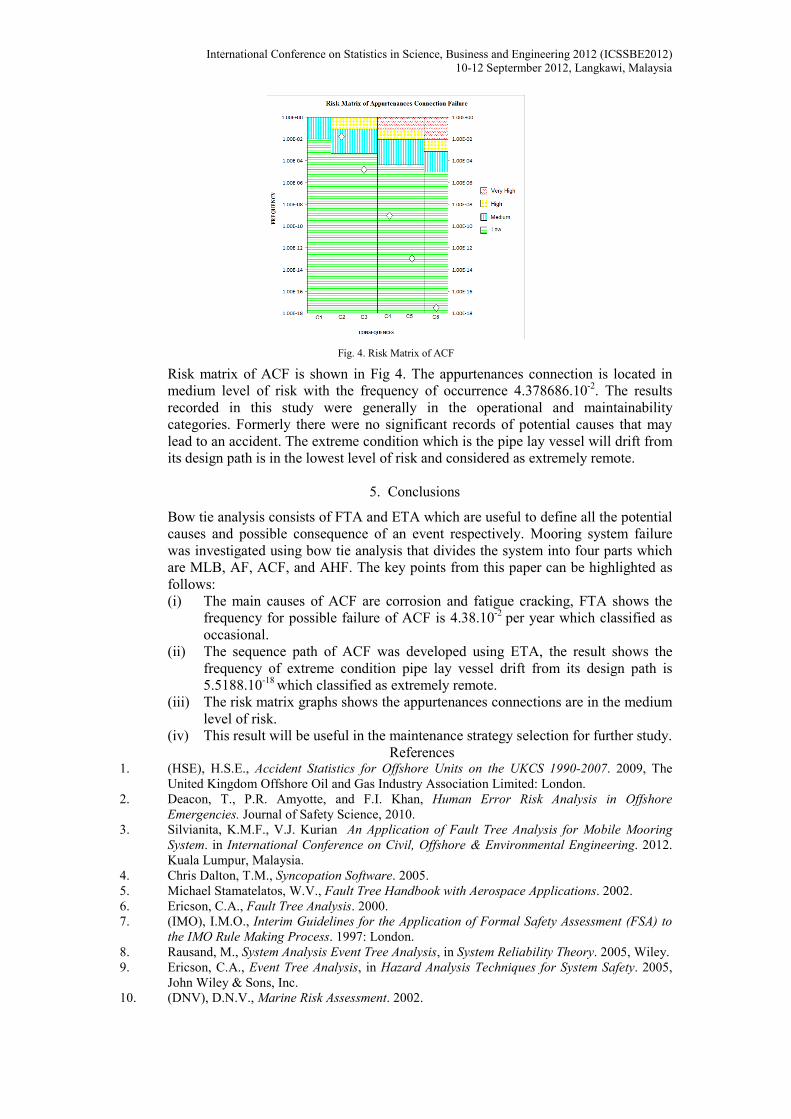
Fig. 4. Risk Matrix of ACF
Risk matrix of ACF is shown in Fig 4. The appurtenances connection is located in medium level of risk with the frequency of occurrence 4.378686.10-2. The results recorded in this study were generally in the operational and maintainability categories. Formerly there were no significant records of potential causes that may lead to an accident. The extreme condition which is the pipe lay vessel will drift from its design path is in the lowest level of risk and considered as extremely remote.
5. Conclusions
Bow tie analysis consists of FTA and ETA which are useful to define all the potential causes and possible consequence of an event respectively. Mooring system failure was investigated using bow tie analysis that divides the system into four parts which are MLB, AF, ACF, and AHF. The key points from this paper can be highlighted as follows: (i) The main causes of ACF are corrosion and fatigue cracking, FTA shows the
frequency for possible failure of ACF is 4.38.10-2 per year which classified as occasional.
(ii) The sequence path of ACF was developed using ETA, the result shows the frequency of extreme condition pipe lay vessel drift from its design path is 5.5188.10-18 which classified as extremely remote.
(iii) The risk matrix graphs shows the appurtenances connections are in the medium level of risk.
(iv) This result will be useful in the maintenance strategy selection for further study. References
1. (HSE), H.S.E., Accident Statistics for Offshore Units on the UKCS 1990-2007. 2009, The United Kingdom Offshore Oil and Gas Industry Association Limited: London.
2. Deacon, T., P.R. Amyotte, and F.I. Khan, Human Error Risk Analysis in Offshore Emergencies. Journal of Safety Science, 2010.
3. Silvianita, K.M.F., V.J. Kurian An Application of Fault Tree Analysis for Mobile Mooring System. in International Conference on Civil, Offshore & Environmental Engineering. 2012. Kuala Lumpur, Malaysia.
4. Chris Dalton, T.M., Syncopation Software. 2005. 5. Michael Stamatelatos, W.V., Fault Tree Handbook with Aerospace Applications. 2002. 6. Ericson, C.A., Fault Tree Analysis. 2000. 7. (IMO), I.M.O., Interim Guidelines for the Application of Formal Safety Assessment (FSA) to
the IMO Rule Making Process. 1997: London. 8. Rausand, M., System Analysis Event Tree Analysis, in System Reliability Theory. 2005, Wiley. 9. Ericson, C.A., Event Tree Analysis, in Hazard Analysis Techniques for System Safety. 2005,
John Wiley & Sons, Inc. 10. (DNV), D.N.V., Marine Risk Assessment. 2002.