proceedings of the second international workshop on coal ... · information circular 9448...
TRANSCRIPT

Information Circular 9448
Proceedings of the Second International Workshopon Coal Pillar Mechanics and Design
Edited by Christopher Mark, Ph.D., Keith A. Heasley, Ph.D.,Anthony T. Iannacchione, Ph.D., and Robert J. Tuchman
U.S. DEPARTMENT OF HEALTH AND HUMAN SERVICESPublic Health Service
Centers for Disease Control and PreventionNational Institute for Occupational Safety and Health
Pittsburgh Research LaboratoryPittsburgh, PA
June 1999

International Standard Serial NumberISSN 1066-5552
CONTENTSPage
Abstract . . . . . . . . . . . . . . . . . . . . . . . . . . . . . . . . . . . . . . . . . . . . . . . . . . . . . . . . . . . . . . . . . . . . . . . . . . . . . . . . . . . . . . 1Introduction . . . . . . . . . . . . . . . . . . . . . . . . . . . . . . . . . . . . . . . . . . . . . . . . . . . . . . . . . . . . . . . . . . . . . . . . . . . . . . . . . . . 2A unique approach to determining the time-dependent in situ strength of coal pillars, by K. Biswas, Ph.D.
(University of Ballarat), Australia, C. Mark, Ph.D. (National Institute for Occupational Safety and Health),and S. S. Peng, Ph.D. (West Virginia University), U.S.A . . . . . . . . . . . . . . . . . . . . . . . . . . . . . . . . . . . . . . . . . . . . . . 5
Developments in coal pillar design at Smoky River Coal Ltd., Alberta, Canada, by P. Cain, Ph.D., P.Eng.(Smoky River Coal Ltd.), Canada . . . . . . . . . . . . . . . . . . . . . . . . . . . . . . . . . . . . . . . . . . . . . . . . . . . . . . . . . . . . . . . . . 15
Coal pillar design for longwall gate entries, by J. W. Cassie, P. F. R. Altounyan, Ph.D., and P. B. Cartwright(Rock Mechanics Technology Ltd.), United Kingdom . . . . . . . . . . . . . . . . . . . . . . . . . . . . . . . . . . . . . . . . . . . . . . . . . 23
Analysis of longwall tailgate serviceability (ALTS): a chain pillar design methodology for Australian conditions,by M. Colwell (Colwell Geotechnical Services), R. Frith, Ph.D. (Strata Engineering), Australia, and C. Mark,Ph.D. (National Institute for Occupational Safety and Health), U.S.A. . . . . . . . . . . . . . . . . . . . . . . . . . . . . . . . . . . . . 33
Experience of field measurement and computer simulation methods for pillar design, by W. J. Gale, Ph.D. (StrataControl Technology), Australia . . . . . . . . . . . . . . . . . . . . . . . . . . . . . . . . . . . . . . . . . . . . . . . . . . . . . . . . . . . . . . . . . . . 49
University of New South Wales coal pillar strength determinations for Australian and South African miningconditions, by J. M. Galvin, Ph.D., B. K. Hebblewhite, Ph.D. (University of New South Wales), Australia,and M. D. G. Salamon, Ph.D. (Colorado School of Mines), U.S.A. . . . . . . . . . . . . . . . . . . . . . . . . . . . . . . . . . . . . . . . 63
Practical boundary-element modeling for mine planning, by K. A. Heasley, Ph.D., and G. J. Chekan (NationalInstitute for Occupational Safety and Health), U.S.A . . . . . . . . . . . . . . . . . . . . . . . . . . . . . . . . . . . . . . . . . . . . . . . . . . 73
Experience with the boundary-element method of numerical modeling to resolve complex ground controlproblems, by G. J. Karabin, P.E., and M. A. Evanto, P.G. (Mine Safety and Health Administration), U.S.A. . . . . . . 89
The fracture mechanics approach to understanding supports in underground coal mines, by J. M. Kramer, Ph.D.,G. J. Karabin, P.E., and M. T. Hoch (Mine Safety and Health Administration), U.S.A. . . . . . . . . . . . . . . . . . . . . . . . 115
A hybrid statistical-analytical method for assessing violent failure in U.S. coal mines, by H. Maleki, Ph.D.(Maleki Technologies, Inc.), E. G. Zahl, and J. P. Dunford (National Institute for Occupational Safety andHealth), U.S.A. . . . . . . . . . . . . . . . . . . . . . . . . . . . . . . . . . . . . . . . . . . . . . . . . . . . . . . . . . . . . . . . . . . . . . . . . . . . . . . . 139
Empirical methods for coal pillar design, by C. Mark, Ph.D. (National Institute for Occupational Safety andHealth), U.S.A. . . . . . . . . . . . . . . . . . . . . . . . . . . . . . . . . . . . . . . . . . . . . . . . . . . . . . . . . . . . . . . . . . . . . . . . . . . . . . . . 145
Coal pillar strength and practical coal pillar design considerations, by D. W. H. Su, Ph.D., and G. J. Hasenfus(CONSOL, Inc.), U.S.A. . . . . . . . . . . . . . . . . . . . . . . . . . . . . . . . . . . . . . . . . . . . . . . . . . . . . . . . . . . . . . . . . . . . . . . . . 155
New strength formula for coal pillars in South Africa, by J. N. van der Merwe, Ph.D. (Itasca Africa (Pty.) Ltd.),Republic of South Africa . . . . . . . . . . . . . . . . . . . . . . . . . . . . . . . . . . . . . . . . . . . . . . . . . . . . . . . . . . . . . . . . . . . . . . . . 163
The role of overburden integrity in pillar failure, by J. N. van der Merwe, Ph.D. (Itasca Africa (Pty.) Ltd.),Republic of South Africa . . . . . . . . . . . . . . . . . . . . . . . . . . . . . . . . . . . . . . . . . . . . . . . . . . . . . . . . . . . . . . . . . . . . . . . . 173
Using a postfailure stability criterion in pillar design, by R. K. Zipf, Jr., Ph.D. (University of Missouri-Rolla),U.S.A . . . . . . . . . . . . . . . . . . . . . . . . . . . . . . . . . . . . . . . . . . . . . . . . . . . . . . . . . . . . . . . . . . . . . . . . . . . . . . . . . . . . . . . 181

UNIT OF MEASURE ABBREVIATIONS USED IN THIS REPORT
ft foot (feet) kPa/m kilopascal per meter
GPa gigapascal m meter
ha hectare mm millimeter
hr hour MN/m meganewton per meter
in inch MN/m3 meganewton per cubic meter
in/in inch per inch MPa megapascal
kg/cm2 kilogram per square centimeter psi pound (force) per square inch
kg/m3 kilogram per cubic meter psi/ft pound (force) per square inch per foot
km kilometer sec second
km2 square kilometer % percent
kN/m3 kilonewton per cubic meter ° degree
The views expressed by non-NIOSH authors in these proceedings are not necessarily those of the National Institute forOccupational Safety and Health.
Mention of any company name or product does not constitute endorsement by the National Institute for Occupational Safety andHealth.
To receive other information about occupational safety and health problems, call 1-800-35-NIOSH (1-800-356-4674), or visitthe NIOSH Home Page on the World Wide Web at http://www.cdc.gov/niosh
PROCEEDINGS OF THE SECOND INTERNATIONAL WORKSHOPON COAL PILLAR MECHANICS AND DESIGN
Edited by Christopher Mark, Ph.D.,1 Keith A. Heasley, Ph.D.,1
Anthony T. Iannacchione, Ph.D.,2 and Robert J. Tuchman3
ABSTRACT
Pillar design is the first line of defense against rock falls—the greatest single safety hazard faced byunderground coal miners in the United States and abroad. To help advance the state of the art in thisfundamental mining science, the National Institute for Occupational Safety and Health organized the SecondInternational Workshop on Coal Pillar Mechanics and Design. The workshop was held in Vail, CO, on June 6,1999, in association with the 37th U.S. Rock Mechanics Symposium. The proceedings include 15 papers fromleading ground control specialists in the United States, Canada, Australia, the United Kingdom, and theRepublic of South Africa. The papers address the entire range of issues associated with coal pillars and havea decidedly practical flavor. Topics include numerical modeling, empirical design formulas based on casehistories, field measurements, and postfailure mechanics.
1Supervisory physical scientist.2Deputy director.3Technical writer-editor. Pittsburgh Research Laboratory, National Institute for Occupational Safety and Health, Pittsburgh, PA.
2
INTRODUCTION
By Christopher Mark, Ph.D.1
Pillar design is one of the oldest and most fundamental of themining sciences. Without pillars to support the great weight ofthe overburden, underground coal mining would be practicallyimpossible. Coal pillars are employed in a wide variety of min-ing operations, from shallow room-and-pillar mines to deeplongwall mines. Yet despite more than 100 years of researchand experience, pillar failures continue to occur, placing miners'lives at risk. Some recent examples are [Mark et al. 1998]:
Massive collapses: In 1992, miners were splitting pillars ata mine in southern West Virginia when the fenders in a 2.3-haarea suddenly collapsed. The miners were knocked to floor bythe resulting airblast; 103 ventilation stoppings were destroyed.At least 12 similar events have occurred in recent years in theUnited States and 15 others in Australia, fortuitously without afatality.
Pillar squeezes: At a coal mine in Kentucky, pillars werebeing extracted in the main entries under 270 m of cover. Thepillars began to crush in response to the vertical load, resultingin a roof fall that killed two miners. This incident is an extremeexample of hazardous conditions that can be associated withslow pillar failure. At least 45 recent instances of pillarsqueezes in room-and-pillar mines have been identified.
Longwall tailgate blockages: In 1984, 26 miners at theWilberg Mine in Utah could not escape a deadly fire because ofa tailgate roof fall. Similar blockages were common in the1980s, and 50 cases have been documented.
Pillar bumps: Extracting the initial lift from a standing pillar ata deep operation in eastern Kentucky resulted in a bump that killedtwo miners. However, bumps are not confined to pillars; anotherfatal bump occurred at a longwall face in Utah just days later.
Multiple-seam interactions: Some studies indicate that mostremaining coal reserves will experience multiple-seam inter-actions. At a mine in West Virginia where four seams had beenpreviously extracted, one fatality occurred when the roof col-lapsed without warning beneath a remnant barrier pillar.
Abandoned mine subsidence: As suburban developmentexpands into historic coal mining areas, unplanned subsidencehas become an important issue. In one case, residents above50-year-old workings were disturbed by seismicity emanatingfrom collapsing pillars. In the Republic of South Africa, col-lapsing pillars in the Vaal Basin are creating large sinkholesthat threaten many homes.
To help reduce the safety hazards of pillar failures, thisSecond International Workshop on Coal Pillar Mechanics and
1Supervisory physical scientist, Pittsburgh Research Laboratory, NationalInstitute for Occupational Safety and Health, Pittsburgh, PA.
Design was organized. (The first workshop was held in SantaFe, NM, in 1992.) The proceedings of the second workshopfeature 15 invited papers from leading rock mechanics expertsin the United States, Australia, the Republic of South Africa,the United Kingdom, and Canada. Mines in these five countriesemploy increasingly similar methods, including:
• Retreat longwall mining, usually using large chain pillars;• Room-and-pillar mining with continuous mining machines;
and• Roof bolts for primary roof support.
The similarity of mining methods means that it is easier andmore valuable to transfer safety technologies like pillar designfrom one country to another. Indeed, one of the striking fea-tures of these proceedings is the convergence of research resultsacross international borders.
Other trends affecting the mining industries of the fivecountries are also reflected in these proceedings, some of whichhave been less positive. In the 7 years since the first workshop,underground production has risen in Australia and the Republicof South Africa, declined in the United Kingdom and Canada,and remained steady in the United States. However, greatemployment losses have occurred in all five countries becauseof technological advances and dramatic productivity increases.
One consequence has been a significant decline in insti-tutional support for mining research. Since 1992, the U.S. Bu-reau of Mines (USBM), the Canada Centre for Mineral andEnergy Technology's (CANMET) Coal Research Laboratory,British Coal's Headquarters Technical Division, and the SouthAfrican Chamber of Mines research department have all closedtheir doors. Government funding for mining research is nowindirect and open for competition everywhere, except in theUnited States. In the United States, the National Institute forOccupational Safety and Health (NIOSH) has taken up theUSBM's traditional mine safety research role, although at areduced level, and continues to receive direct funding from theU.S. Congress.
University mining departments have also been under pres-sure due to fluctuating student enrollments, reduced researchfunding, and a shortage of qualified junior faculty. Lower prof-it margins and a renewed emphasis on the bottom line hasmeant that few mining companies now maintain any in-houseresearch capability. As the traditional sources of mining re-search have faltered, in many cases private consulting firmshave taken up the challenge. Often staffed by former govern-ment researchers and sometimes supported in part by govern-ment contracts, consultants are now often on the cutting edge ofresearch.

3
Figure 1.CCEmpirical pillar strength formulas derived fromcase histories by Mark (U.S.A.), Galvin (Australia), and van derMerwe (Republic of South Africa).
In comparing the proceedings of the second workshop withthose of the first [Iannacchione et al. 1992], the most obviousdifference is that the current collection of papers is a slimmervolume. There are 15 papers in these proceedings, comparedwith 23 in 1992. Australia, which in many ways has thehealthiest mining research community, is the only country tosee its representation increase (see table 1). Although thenumber of papers from industry, government, and academia alldecreased by at least 50%, the number of papers from privateconsultants more than doubled.
Another consequence of the changed research environmentis reflected in the proceedings' pervasive emphasis on practicalproblem-solving. Although about one-half of the papers at thefirst workshop addressed issues of a more theoretical nature,nearly every paper in the current collection uses case histories,field measurements, and/or practical experience to developtechniques for solving real-world pillar design problems.
The papers divide almost evenly between those that focusprimarily on the application of numerical modeling and thosethat discuss empirical formulas derived from statistical analysisof case histories (table 1). Of the numerical modelers, two usedfinite-difference methods (Gale, Cassie et al.), four usedboundary elements (Heasley-Chekan, Maleki et al., Zipf,Karabin-Evanto), and one used finite elements (Su-Hasenfus).Field measurements feature prominently in six papers, withCassie et al., Colwell et al., and Gale monitoring stress anddeformation, Heasley-Chekan and Karabin-Evanto mappingunderground conditions, and Biswas et al. measuring changesin rock strength.
In general, however, the similarities between the papers aremore striking than their dissimilarities despite the variety ofcountries, author affiliations, and research methods. Forexample, new empirical formulas are presented for the Republicof South Africa (van der Merwe), the United States (Mark), andAustralia (Galvin et al.). Derived independently from differentsets of case histories from around the world, the three formulasare within 15% of each other (see figure 1).
Five papers (Su-Hasenfus, Gale, Cassie et al., Mark, andColwell et al.) explicitly address the design of squat (largewidth-to-height (w/h) ratio) pillars, primarily for protection oflongwall gate entries. All agree that the strength of these pillarscan vary widely depending on the roof, floor, and seam partingcharacteristics. Moreover, the strength of the roof is often justas important to the design process as the strength of the pillaritself. The degree of consensus that has been achieved on thiscomplex topic is an important advance. At the other end of thew/h scale, van der Merwe, Zipf, and Mark address slenderpillars and their potential for sudden collapse. Again, all threereach similar conclusions regarding the importance of pillargeometry and postfailure pillar stiffness.
The beginnings of a consensus are also evident in one of theoldest pillar design controversies—the value of compressive
strength tests on coal specimens. Only two papers (Karabin-Evanto and Maleki et al.) make use of laboratory tests toevaluate seam strength. On the other hand, van der Merwe, Su-Hasenfus, Cassie et al., Galvin et al., Gale, and Mark allconclude that variations in the uniaxial compressive strengthhave little effect on the in situ pillar strength.
With the focus on pillar strength, it is important not tooverlook the other half of the design equation—the load. Galeand Colwell et al. describe field measurements that shed newlight on the loads that occur during longwall mining. Heasley-Chekan and van der Merwe address the effect of overburdenbehavior on the pillar loading. Kramer et al. have extendedtheir fracture mechanics approach for estimating loaddistribution to consider the effects of other kinds of supports.
Other special topics that are discussed in these proceedingsinclude the effect of weathering on long-term pillar strength(Biswas et al.), the geologic and geotechnical factors that affectthe potential for coal bumps (Maleki et al.), thick-seam room-and-pillar mining (Cain), multiple-seam mine design (Heasley-Chekan), and the strength of rectangular pillars (Galvin et al.and Mark).
One final comparison between the first and secondworkshops is perhaps in order. The proceedings of the firstworkshop [Iannacchione et al. 1992] included papers from anumber of now retired individuals whose names have beensynonymous with pillar design for nearly 3 decades: Salamon,Bieniawski, Wagner, Barron, and Carr. In many ways, theircontributions laid the foundation upon which rests much of ourcurrent understanding of coal pillars. Their retirement has lefta large gap that cannot be filled (although it is hoped that theywill continue to contribute to the profession!). To paraphraseSir Isaac Newton, it is only by standing on the shoulders ofsuch giants that we can hope to achieve further progress.

4
Table 1.CCSummary of papers for the Second International Workshopon Coal Pillar Mechanics and Design
Primary author Country Affiliation MethodBiswas . . . . . . . Australia . . . . University . . . . . . . Empirical.Cain . . . . . . . . . Canada . . . . . Mining company . . Empirical.Cassie . . . . . . . . U.K. . . . . . . . . Consultant . . . . . . . Numerical.Colwell . . . . . . . Australia . . . . Consultant . . . . . . . Empirical.Gale . . . . . . . . . Australia . . . . Consultant . . . . . . . Numerical.Galvin . . . . . . . . Australia . . . . University . . . . . . . Empirical.Heasley . . . . . . . U.S.A. . . . . . . Government . . . . . Numerical.Karabin . . . . . . . U.S.A. . . . . . . Government . . . . . Numerical.Kramer . . . . . . . U.S.A. . . . . . . Government . . . . . Numerical.Maleki . . . . . . . . U.S.A. . . . . . . Consultant . . . . . . . Empirical/numerical.Mark . . . . . . . . . U.S.A. . . . . . . Government . . . . . Empirical.Su . . . . . . . . . . . U.S.A. . . . . . . Mining company . . Numerical.van der Merwe . South Africa . Consultant . . . . . . . Empirical.Zipf . . . . . . . . . . U.S.A. . . . . . . University . . . . . . . Numerical.
REFERENCES
Iannacchione AT, Mark C, Repsher RC, Tuchman RJ, Jones CC, eds.[1992]. Proceedings of the Workshop on Coal Pillar Mechanics and Design.Pittsburgh, PA: U.S. Department of the Interior, Bureau of Mines, IC 9315.
Mark C, Su D, Heasley KA [1998]. Recent developments in coal pillardesign in the United States. In: Aziz NI, Indraratna B, eds. Proceedings of the
International Conference on Geomechanics/Ground Control in Mining andUnderground Construction. Wollongong, New South Wales, Australia:University of Wollongong, Vol. 2, pp. 309-324.
5
A UNIQUE APPROACH TO DETERMINING THE TIME-DEPENDENTIN SITU STRENGTH OF COAL PILLARS
By Kousick Biswas, Ph.D.,1 Christopher Mark, Ph.D.,2
and Syd S. Peng, Ph.D.3
ABSTRACT
In general, it cannot be assumed that the strength of coal pillars remains constant over long periods of time.Field observations indicate that a coal seam, especially when it contains a parting layer, deteriorates over time,reducing the load-bearing capacity of the pillars. This paper discusses a unique approach to determining thetime-dependent strength of coal pillars in the field. Three coal pillars that were developed 5, 15, and 50 yearsago were chosen for the study. Holes were drilled in coal and parting layers in each pillar, and the strengthprofiles were determined for each hole using a borehole penetrometer. The strength data were treatedstatistically to establish time-dependent strength equations for different layers. The results can be used to helpestimate the loss of pillar capacity over time.
1Lecturer, School of Engineering, University of Ballarat, Victoria, Australia.2Supervisory physical scientist, Pittsburgh Research Laboratory, National Institute for Occupational Safety and Health, Pittsburgh, PA.3Chairman and Charles T. Holland professor, Department of Mining Engineering, West Virginia University, Morgantown, WV.
6
Sv '(H(W%We ) (L%We )
(WL), (1)
Sp ' S1 0.64 % 0.36 Wh
, (2)
SF 'Pillar strengthPillar stress
'Sp
Sv
. (3)
INTRODUCTION
All manmade structures deteriorate over time; pillars inunderground coal mines are no exception. There are numerousexamples of coal pillars failing many years after they weredeveloped. Scrutiny of existing pillar design theories indicatesthat few make any attempt to consider the effect of time.Similarly, there is rarely an attempt to consider theinhomogeneous nature of most coal seams. For example, theclassic pillar design methodology involves the following threesteps:
1. Calculate the vertical stress on the pillar:
where Sv ' vertical stress,
( ' unit weight of the overburden,
H ' depth of the seam,
W ' pillar width (minimum pillar dimension),
L ' pillar length (maximum pillar dimension),
and We ' entry width.
2. Calculate the pillar strength using Bieniawski's formula[Bieniawski 1992]:
where Sp ' pillar strength,
S1 ' in situ seam strength,
and h ' seam height.
3. Calculate the stability factor (SF) as
The stability factor that is calculated using equations 1-3assumes that—
• The coal strength is constant and does not deteriorate over time; and
• Coal seams are homogenous.
Back-analyses of subsidence above abandoned mines usingthe classic methodology have found that pillar failures haveoccurred over a broad range of stability factors [Marino andBauer 1989; Craft and Crandall 1988]. The implication is thatover time the standard pillar design methodology loses itsability to accurately predict the strength of coal pillars.
One recent South African study focused on the phenomenonof pillar scaling over time [van der Merwe 1998]. Twenty-seven case histories of pillar failure, occurring as long as15 years after mining, were included in the database. Threeparameters were found to be statistically significant: coal seam,pillar height, and time to failure. The study concluded that thescaling rate decreases exponentially over time and furtherhypothesized that "the inner portions of the pillar, beingprotected from the atmosphere, would then weather at a lowerrate."
This paper describes a detailed study of the time-dependentstructural deterioration of coal pillars and proposes a means toestimate the strength reduction of the coal seam in situ bytaking into account the seam heterogeneity.
FIELD OBSERVATIONS
A survey conducted by West Virginia University, Depart-ment of Mining Engineering, of room-and-pillar mines in theeastern Appalachian region found that some of the coal seamscontain one or more mudstone or claystone layers with variablethicknesses [Tsang et al. 1996]. For example, the Pittsburghand Twin Freeport Seams contain parting layers in the coalseam. During field visits to several coal mines developed inthese seams, the conditions of many pillars in worked-out
districts, some as much as 100 years old, were visuallyinspected. Most of the pillars did not show any apparent signof instability because of their large size compared to their depth(stability factors ranged from 2 to 12).
A more detailed inspection revealed several kinds ofweathering actions on the different layers of the coal seam withvarying degrees of severity. The following structural dete-riorations were noticed on older pillars:

7
Figure 1.CCPeeling of weathered parting in coal seam.
Figure 2.CCConceptualization for strength deterioration forparting. (Note: time1 < time2 < time3.)
Figure 3.CCConceptualization for strength deterioration forcoal. (Note: time1 < time2 < time3.)
• Conversion of mudstone/claystone layer to clay due toprolonged exposure to the mine moisture;
• Squeezing of the softer parting layer by the top and bottomportion of the coal;
• Major peeling of the parting layer;• Separation of the parting from the host coal along the slick
interfaces (perhaps the result of differential slippage); and• Minor peeling of the top and bottom portion of the coal.
Figure 1 illustrates this deterioration in the structure of a pillar.From the field observations, it was concluded that the
structural deteriorations in both coal and parting are dependenton time. From these observations, aided by some laboratorystudies and finite-element modeling [Biswas 1997], it waspossible to postulate a conceptual model of the time-dependentstrength profiles in the coal and parting layers (figures 2 and 3).Its assumptions are that—
• The pillars are not affected by any mining activity in theirvicinity; and
• The majority of the yield zones depicted in figures 2 and3 are the result of the weathering action on the different layersin the pillar.
IN SITU DETERMINATION OF TIME-DEPENDENT STRENGTH
The goal of this study was to determine one set of time-dependent strength profiles under in situ conditions. A detailedtesting program was designed to establish the strength reductionin various layers of a pillar in situ over time.
THE STUDY SITE
The study was conducted at the Safety Research Coal Mineat the National Institute for Occupational Safety and Health's(NIOSH) Pittsburgh Research Laboratory. The Safety Re-search Coal Mine was selected for the following reasons:
• The overburden depth is very shallow, ranging from 15 to18 m (50 to 60 ft); thus, any deterioration of the pillars isattributable to the effect of weathering rather than stress.
• The mine is developed in the Pittsburgh Seam, and itcontains a parting of varying thickness (from 0.15 to 0.3 m (6to 12 in)).
• The mine has accessible pillars developed as recently as1991 and as long ago as the 1940s.
• The mine remains more or less inactive in terms of miningactivities.
8
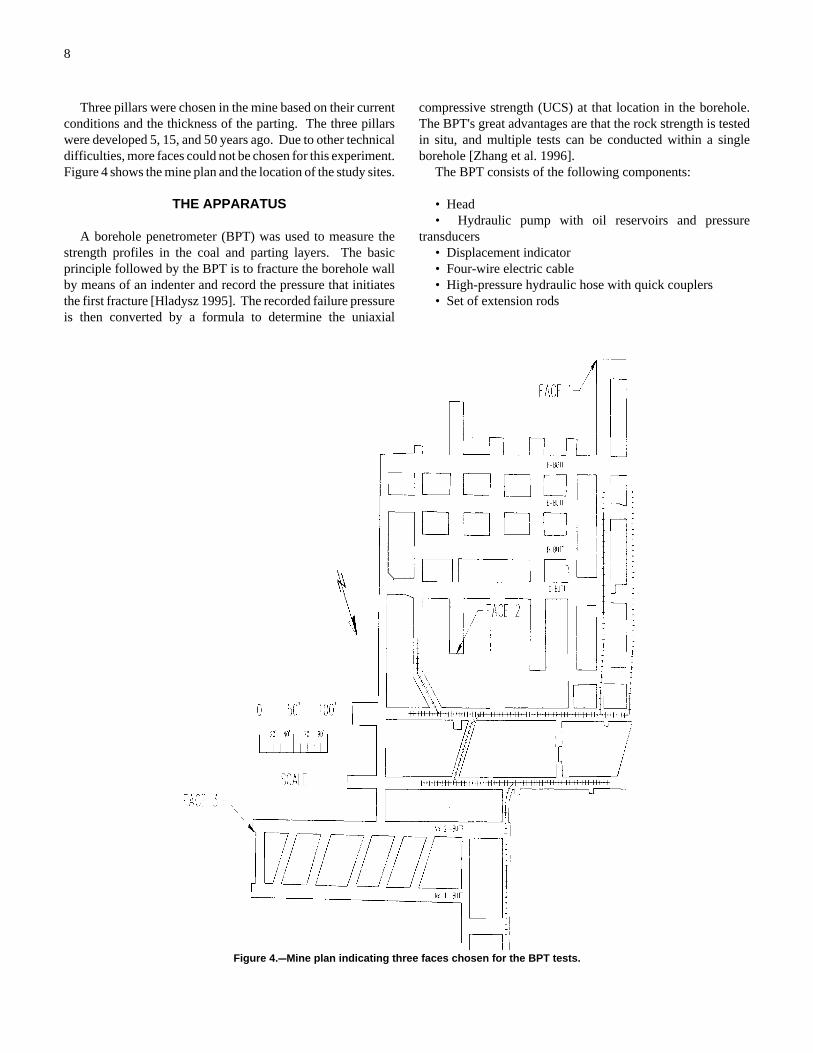
Figure 4.CCMine plan indicating three faces chosen for the BPT tests.
Three pillars were chosen in the mine based on their currentconditions and the thickness of the parting. The three pillarswere developed 5, 15, and 50 years ago. Due to other technicaldifficulties, more faces could not be chosen for this experiment.Figure 4 shows the mine plan and the location of the study sites.
THE APPARATUS
A borehole penetrometer (BPT) was used to measure thestrength profiles in the coal and parting layers. The basicprinciple followed by the BPT is to fracture the borehole wallby means of an indenter and record the pressure that initiatesthe first fracture [Hladysz 1995]. The recorded failure pressureis then converted by a formula to determine the uniaxial
compressive strength (UCS) at that location in the borehole.The BPT's great advantages are that the rock strength is testedin situ, and multiple tests can be conducted within a singleborehole [Zhang et al. 1996].
The BPT consists of the following components:
• Head• Hydraulic pump with oil reservoirs and pressure
transducers• Displacement indicator• Four-wire electric cable• High-pressure hydraulic hose with quick couplers• Set of extension rods
9
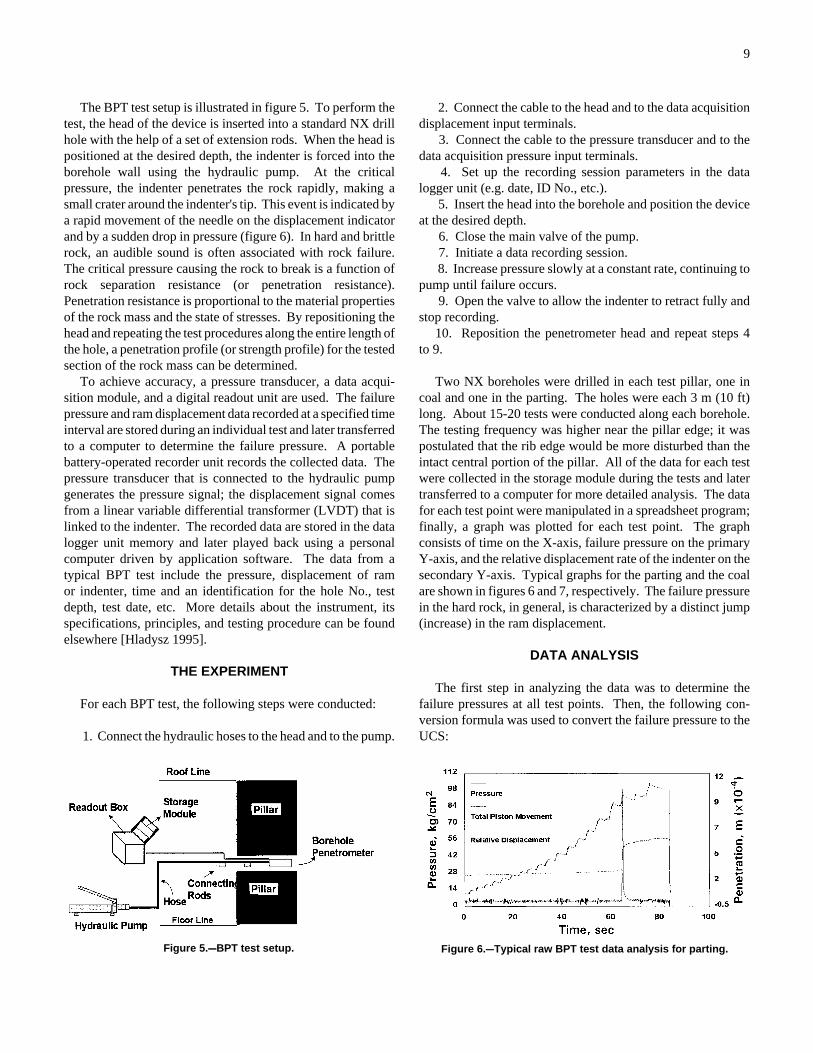
Figure 5.CCBPT test setup. Figure 6.CCTypical raw BPT test data analysis for parting.
The BPT test setup is illustrated in figure 5. To perform thetest, the head of the device is inserted into a standard NX drillhole with the help of a set of extension rods. When the head ispositioned at the desired depth, the indenter is forced into theborehole wall using the hydraulic pump. At the criticalpressure, the indenter penetrates the rock rapidly, making asmall crater around the indenter's tip. This event is indicated bya rapid movement of the needle on the displacement indicatorand by a sudden drop in pressure (figure 6). In hard and brittlerock, an audible sound is often associated with rock failure.The critical pressure causing the rock to break is a function ofrock separation resistance (or penetration resistance).Penetration resistance is proportional to the material propertiesof the rock mass and the state of stresses. By repositioning thehead and repeating the test procedures along the entire length ofthe hole, a penetration profile (or strength profile) for the testedsection of the rock mass can be determined.
To achieve accuracy, a pressure transducer, a data acqui-sition module, and a digital readout unit are used. The failurepressure and ram displacement data recorded at a specified timeinterval are stored during an individual test and later transferredto a computer to determine the failure pressure. A portablebattery-operated recorder unit records the collected data. Thepressure transducer that is connected to the hydraulic pumpgenerates the pressure signal; the displacement signal comesfrom a linear variable differential transformer (LVDT) that islinked to the indenter. The recorded data are stored in the datalogger unit memory and later played back using a personalcomputer driven by application software. The data from atypical BPT test include the pressure, displacement of ramor indenter, time and an identification for the hole No., testdepth, test date, etc. More details about the instrument, itsspecifications, principles, and testing procedure can be foundelsewhere [Hladysz 1995].
THE EXPERIMENT
For each BPT test, the following steps were conducted:
1. Connect the hydraulic hoses to the head and to the pump.
2. Connect the cable to the head and to the data acquisitiondisplacement input terminals.
3. Connect the cable to the pressure transducer and to thedata acquisition pressure input terminals.
4. Set up the recording session parameters in the datalogger unit (e.g. date, ID No., etc.).
5. Insert the head into the borehole and position the deviceat the desired depth.
6. Close the main valve of the pump. 7. Initiate a data recording session. 8. Increase pressure slowly at a constant rate, continuing to
pump until failure occurs. 9. Open the valve to allow the indenter to retract fully and
stop recording.10. Reposition the penetrometer head and repeat steps 4
to 9.
Two NX boreholes were drilled in each test pillar, one incoal and one in the parting. The holes were each 3 m (10 ft)long. About 15-20 tests were conducted along each borehole.The testing frequency was higher near the pillar edge; it waspostulated that the rib edge would be more disturbed than theintact central portion of the pillar. All of the data for each testwere collected in the storage module during the tests and latertransferred to a computer for more detailed analysis. The datafor each test point were manipulated in a spreadsheet program;finally, a graph was plotted for each test point. The graphconsists of time on the X-axis, failure pressure on the primaryY-axis, and the relative displacement rate of the indenter on thesecondary Y-axis. Typical graphs for the parting and the coalare shown in figures 6 and 7, respectively. The failure pressurein the hard rock, in general, is characterized by a distinct jump(increase) in the ram displacement.
DATA ANALYSIS
The first step in analyzing the data was to determine thefailure pressures at all test points. Then, the following con-version formula was used to convert the failure pressure to theUCS:
10
UCS ' (Fs )Pf , (4) y ' a(1.01 & e &bx) , (5)
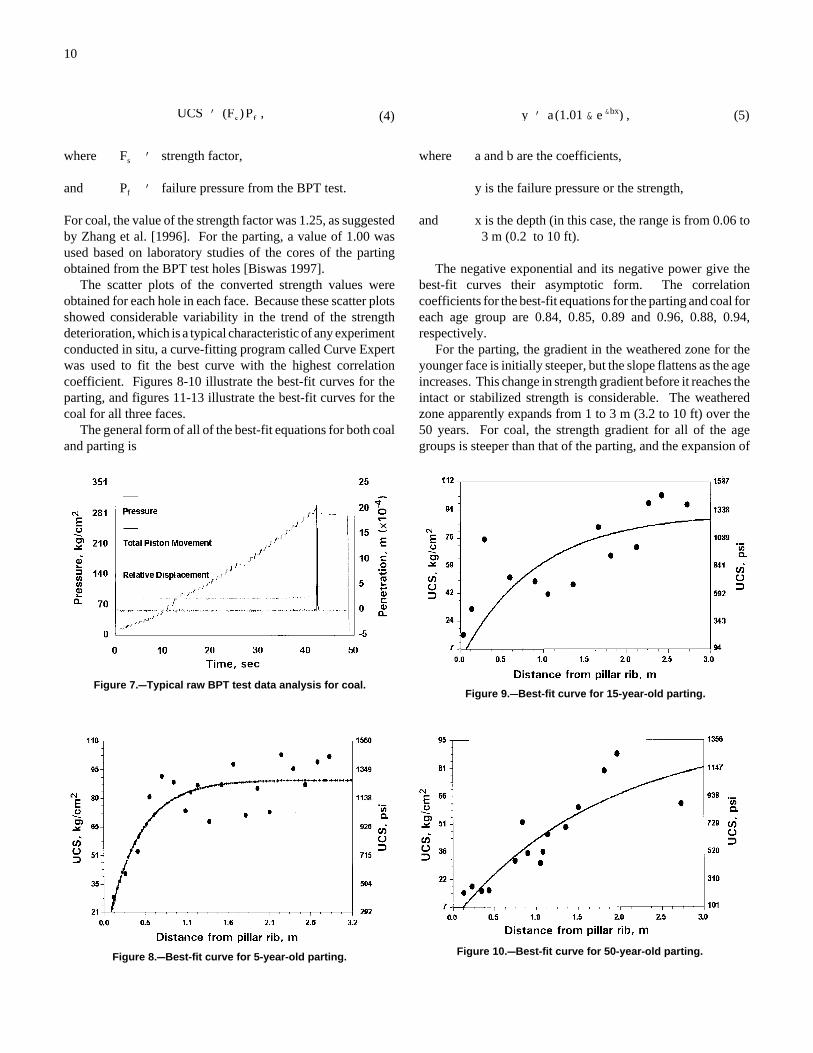
Figure 7.CCTypical raw BPT test data analysis for coal.
Figure 8.CCBest-fit curve for 5-year-old parting.
Figure 9.CCBest-fit curve for 15-year-old parting.
Figure 10.CCBest-fit curve for 50-year-old parting.
where Fs ' strength factor,
and Pf ' failure pressure from the BPT test.
For coal, the value of the strength factor was 1.25, as suggestedby Zhang et al. [1996]. For the parting, a value of 1.00 wasused based on laboratory studies of the cores of the partingobtained from the BPT test holes [Biswas 1997].
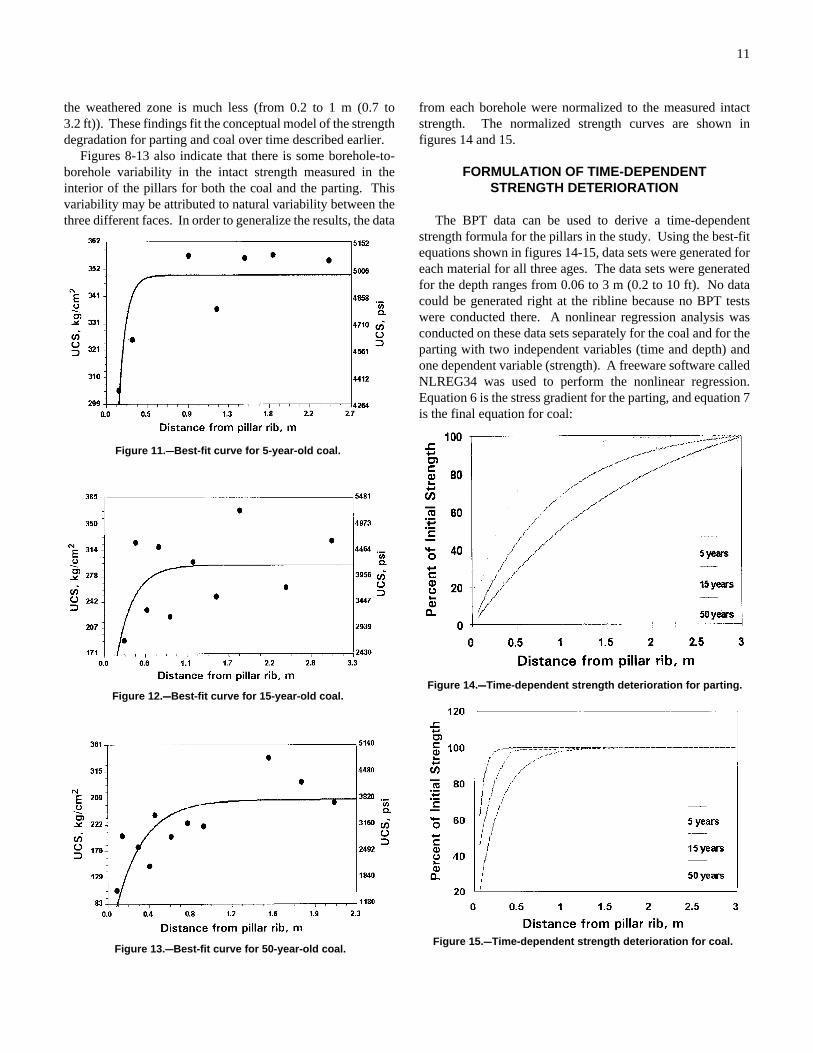
The scatter plots of the converted strength values wereobtained for each hole in each face. Because these scatter plotsshowed considerable variability in the trend of the strengthdeterioration, which is a typical characteristic of any experimentconducted in situ, a curve-fitting program called Curve Expertwas used to fit the best curve with the highest correlationcoefficient. Figures 8-10 illustrate the best-fit curves for theparting, and figures 11-13 illustrate the best-fit curves for thecoal for all three faces.
The general form of all of the best-fit equations for both coaland parting is
where a and b are the coefficients,
y is the failure pressure or the strength,
and x is the depth (in this case, the range is from 0.06 to 3 m (0.2 to 10 ft).
The negative exponential and its negative power give thebest-fit curves their asymptotic form. The correlationcoefficients for the best-fit equations for the parting and coal foreach age group are 0.84, 0.85, 0.89 and 0.96, 0.88, 0.94,respectively.
For the parting, the gradient in the weathered zone for theyounger face is initially steeper, but the slope flattens as the ageincreases. This change in strength gradient before it reaches theintact or stabilized strength is considerable. The weatheredzone apparently expands from 1 to 3 m (3.2 to 10 ft) over the50 years. For coal, the strength gradient for all of the agegroups is steeper than that of the parting, and the expansion of
11
Figure 11.CCBest-fit curve for 5-year-old coal.
Figure 12.CCBest-fit curve for 15-year-old coal.
Figure 13.CCBest-fit curve for 50-year-old coal.
Figure 14.CCTime-dependent strength deterioration for parting.
Figure 15.CCTime-dependent strength deterioration for coal.
the weathered zone is much less (from 0.2 to 1 m (0.7 to3.2 ft)). These findings fit the conceptual model of the strengthdegradation for parting and coal over time described earlier.
Figures 8-13 also indicate that there is some borehole-to-borehole variability in the intact strength measured in theinterior of the pillars for both the coal and the parting. Thisvariability may be attributed to natural variability between thethree different faces. In order to generalize the results, the data
from each borehole were normalized to the measured intactstrength. The normalized strength curves are shown infigures 14 and 15.
FORMULATION OF TIME-DEPENDENTSTRENGTH DETERIORATION
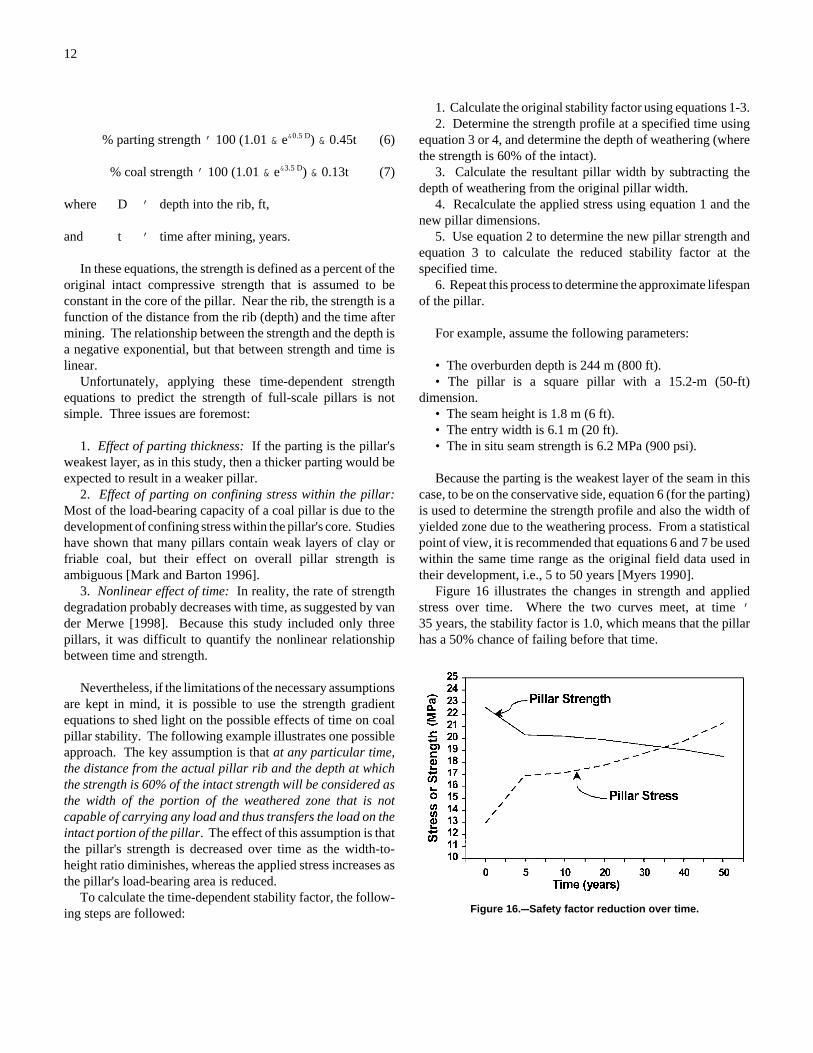
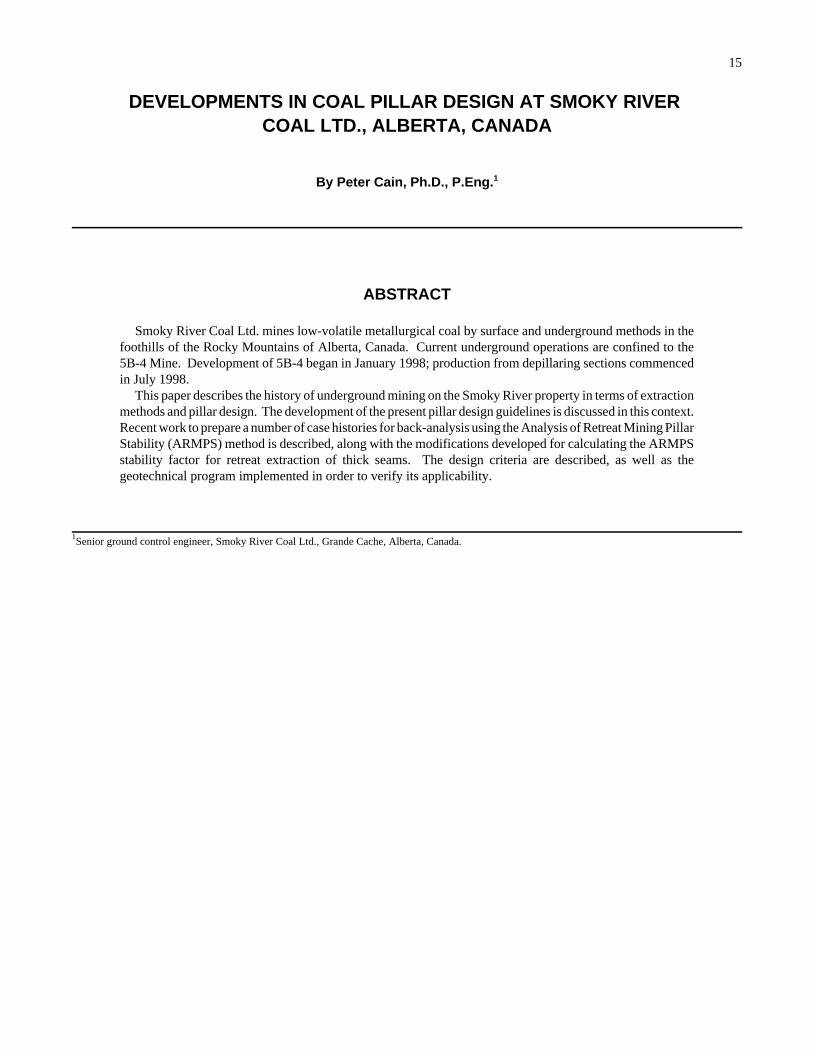
The BPT data can be used to derive a time-dependentstrength formula for the pillars in the study. Using the best-fitequations shown in figures 14-15, data sets were generated foreach material for all three ages. The data sets were generatedfor the depth ranges from 0.06 to 3 m (0.2 to 10 ft). No datacould be generated right at the ribline because no BPT testswere conducted there. A nonlinear regression analysis wasconducted on these data sets separately for the coal and for theparting with two independent variables (time and depth) andone dependent variable (strength). A freeware software calledNLREG34 was used to perform the nonlinear regression.Equation 6 is the stress gradient for the parting, and equation 7is the final equation for coal:
12
Figure 16.CCSafety factor reduction over time.
% parting strength ' 100 (1.01 & e&0.5 D) & 0.45t (6)
% coal strength ' 100 (1.01 & e&3.5 D) & 0.13t (7)
where D ' depth into the rib, ft,
and t ' time after mining, years.
In these equations, the strength is defined as a percent of theoriginal intact compressive strength that is assumed to beconstant in the core of the pillar. Near the rib, the strength is afunction of the distance from the rib (depth) and the time aftermining. The relationship between the strength and the depth isa negative exponential, but that between strength and time islinear.
Unfortunately, applying these time-dependent strengthequations to predict the strength of full-scale pillars is notsimple. Three issues are foremost:
1. Effect of parting thickness: If the parting is the pillar'sweakest layer, as in this study, then a thicker parting would beexpected to result in a weaker pillar.
2. Effect of parting on confining stress within the pillar:Most of the load-bearing capacity of a coal pillar is due to thedevelopment of confining stress within the pillar's core. Studieshave shown that many pillars contain weak layers of clay orfriable coal, but their effect on overall pillar strength isambiguous [Mark and Barton 1996].
3. Nonlinear effect of time: In reality, the rate of strengthdegradation probably decreases with time, as suggested by vander Merwe [1998]. Because this study included only threepillars, it was difficult to quantify the nonlinear relationshipbetween time and strength.
Nevertheless, if the limitations of the necessary assumptionsare kept in mind, it is possible to use the strength gradientequations to shed light on the possible effects of time on coalpillar stability. The following example illustrates one possibleapproach. The key assumption is that at any particular time,the distance from the actual pillar rib and the depth at whichthe strength is 60% of the intact strength will be considered asthe width of the portion of the weathered zone that is notcapable of carrying any load and thus transfers the load on theintact portion of the pillar. The effect of this assumption is thatthe pillar's strength is decreased over time as the width-to-height ratio diminishes, whereas the applied stress increases asthe pillar's load-bearing area is reduced.
To calculate the time-dependent stability factor, the follow-ing steps are followed:
1. Calculate the original stability factor using equations 1-3.2. Determine the strength profile at a specified time using
equation 3 or 4, and determine the depth of weathering (wherethe strength is 60% of the intact).
3. Calculate the resultant pillar width by subtracting thedepth of weathering from the original pillar width.
4. Recalculate the applied stress using equation 1 and thenew pillar dimensions.
5. Use equation 2 to determine the new pillar strength andequation 3 to calculate the reduced stability factor at thespecified time.
6. Repeat this process to determine the approximate lifespanof the pillar.
For example, assume the following parameters:
• The overburden depth is 244 m (800 ft).• The pillar is a square pillar with a 15.2-m (50-ft)
dimension.• The seam height is 1.8 m (6 ft).• The entry width is 6.1 m (20 ft).• The in situ seam strength is 6.2 MPa (900 psi).
Because the parting is the weakest layer of the seam in thiscase, to be on the conservative side, equation 6 (for the parting)is used to determine the strength profile and also the width ofyielded zone due to the weathering process. From a statisticalpoint of view, it is recommended that equations 6 and 7 be usedwithin the same time range as the original field data used intheir development, i.e., 5 to 50 years [Myers 1990].
Figure 16 illustrates the changes in strength and appliedstress over time. Where the two curves meet, at time '35 years, the stability factor is 1.0, which means that the pillarhas a 50% chance of failing before that time.

13
CONCLUSIONS
The use of the BPT to measure the in situ time-dependentstrength is the unique feature of this study. It generated a set ofin situ strength data in a relatively simple field-testing program.The in situ data were used to develop time-dependent strengthequations for coal and parting layers. An example case wasused to demonstrate the use of these equations in predicting thechange of stability factor over the years.
The parting material weathered much more rapidly than thecoal. This implies that much of the observed between-seamvariability in long-term pillar strength may be due to thepresence or absence of partings in the coal. However, thisstudy only addressed a single type of parting material within asingle coal seam. Much work remains before the effect of timeon coal pillar strength is fully understood.
ACKNOWLEDGMENTS
The authors are grateful for the opportunity to use the SafetyResearch Coal Mine at NIOSH's Pittsburgh ResearchLaboratory (PRL) for the in-mine studies. The expertise and
assistance of PRL employees David C. Oyler, mechanicalengineer, and Craig S. Compton, engineering technician, werealso invaluable.
REFERENCES
Bieniawski ZT [1992]. A method revisited: coal pillar strength formulabased on field investigations. In: Proceedings of the Workshop on Coal PillarMechanics and Design. Pittsburgh, PA: U.S. Department of the Interior,Bureau of Mines, IC 9315, pp. 158-165.
Biswas K [1997]. Study of weathering actions on partings and their effectson long-term stability of coal pillar [Dissertation]. Morgantown, WV: WestVirginia University, Department of Mining Engineering.
Craft JL, Crandall TM [1988]. Mine configuration and its relationship tosurface subsidence. Paper in Proceedings, Mine Drainage and Surface MineReclamation, USBM IC 9184, Vol. 3, pp. 373-382.
Hladysz Z [1995]. Borehole rock strength tester manual. Rapid City, SD:Hladysz Rock Testers and Consulting.
Marino GG, Bauer RA [1989]. Behavior of abandoned room-and-pillarmines in Illinois. SME preprint 89-3. Littleton, CO: Society for Mining,Metallurgy, and Exploration, Inc.
Mark C, Barton TM [1996]. The uniaxial compressive strength of coal:should it be used to design pillars? In: Ozdemir L, Hanna K, Haramy KY,Peng S, eds. Proceedings of the 15th International Conference on GroundControl in Mining. Golden, CO: Colorado School of Mines, pp. 61-78.
Myers RH [1990]. Classical and modern regression with applications.Boston, MA: PWS-KENT Publishing Co., pp. 424-449.
Tsang P, Peng SS, Biswas K [1996]. Current practice of pillar design inU.S. coal mines. Min Eng 48(12):55-60.
van der Merwe JN [1998]. Practical coal mining strata control.Johannesburg, Republic of South Africa: Itasca Africa (Pty.) Ltd., 2nd ed.,appendix B.
Zhang YJ, Unrug KF, Thompson ED [1996]. New approach to determinethe in-situ strength of coal in mine pillars. Min Eng 48(10):49-53.
15
DEVELOPMENTS IN COAL PILLAR DESIGN AT SMOKY RIVER COAL LTD., ALBERTA, CANADA
By Peter Cain, Ph.D., P.Eng.1
ABSTRACT
Smoky River Coal Ltd. mines low-volatile metallurgical coal by surface and underground methods in thefoothills of the Rocky Mountains of Alberta, Canada. Current underground operations are confined to the5B-4 Mine. Development of 5B-4 began in January 1998; production from depillaring sections commencedin July 1998.
This paper describes the history of underground mining on the Smoky River property in terms of extractionmethods and pillar design. The development of the present pillar design guidelines is discussed in this context.Recent work to prepare a number of case histories for back-analysis using the Analysis of Retreat Mining PillarStability (ARMPS) method is described, along with the modifications developed for calculating the ARMPSstability factor for retreat extraction of thick seams. The design criteria are described, as well as thegeotechnical program implemented in order to verify its applicability.
1Senior ground control engineer, Smoky River Coal Ltd., Grande Cache, Alberta, Canada.
16
Figure 1.—Location of Smoky River Coal Ltd.
Figure 2.—Site layout.
Figure 3.—Generalized stratigraphic column, Smoky RiverCoalfield.
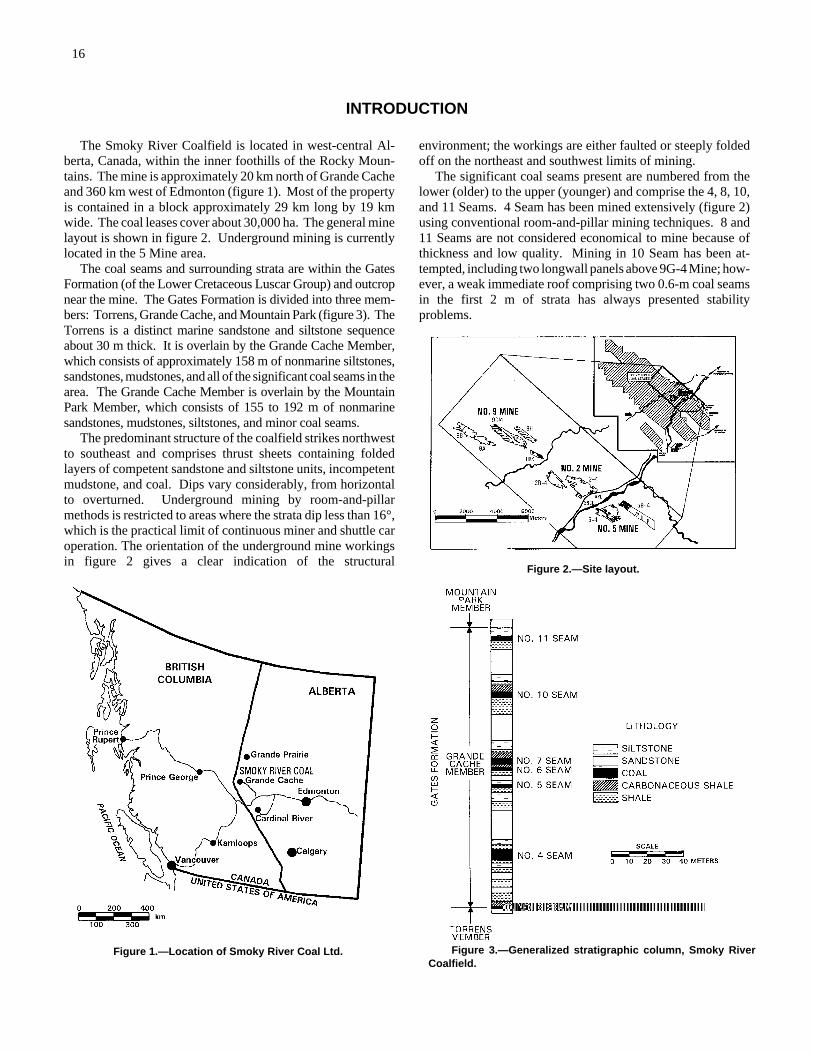
INTRODUCTION
The Smoky River Coalfield is located in west-central Al-berta, Canada, within the inner foothills of the Rocky Moun-tains. The mine is approximately 20 km north of Grande Cacheand 360 km west of Edmonton (figure 1). Most of the propertyis contained in a block approximately 29 km long by 19 kmwide. The coal leases cover about 30,000 ha. The general minelayout is shown in figure 2. Underground mining is currentlylocated in the 5 Mine area.
The coal seams and surrounding strata are within the GatesFormation (of the Lower Cretaceous Luscar Group) and outcropnear the mine. The Gates Formation is divided into three mem-bers: Torrens, Grande Cache, and Mountain Park (figure 3). TheTorrens is a distinct marine sandstone and siltstone sequenceabout 30 m thick. It is overlain by the Grande Cache Member,which consists of approximately 158 m of nonmarine siltstones,sandstones, mudstones, and all of the significant coal seams in thearea. The Grande Cache Member is overlain by the MountainPark Member, which consists of 155 to 192 m of nonmarinesandstones, mudstones, siltstones, and minor coal seams.
The predominant structure of the coalfield strikes northwestto southeast and comprises thrust sheets containing foldedlayers of competent sandstone and siltstone units, incompetentmudstone, and coal. Dips vary considerably, from horizontalto overturned. Underground mining by room-and-pillarmethods is restricted to areas where the strata dip less than 16°,which is the practical limit of continuous miner and shuttle caroperation. The orientation of the underground mine workingsin figure 2 gives a clear indication of the structural
environment; the workings are either faulted or steeply foldedoff on the northeast and southwest limits of mining.
The significant coal seams present are numbered from thelower (older) to the upper (younger) and comprise the 4, 8, 10,and 11 Seams. 4 Seam has been mined extensively (figure 2)using conventional room-and-pillar mining techniques. 8 and11 Seams are not considered economical to mine because ofthickness and low quality. Mining in 10 Seam has been at-tempted, including two longwall panels above 9G-4 Mine; how-ever, a weak immediate roof comprising two 0.6-m coal seamsin the first 2 m of strata has always presented stabilityproblems.
17
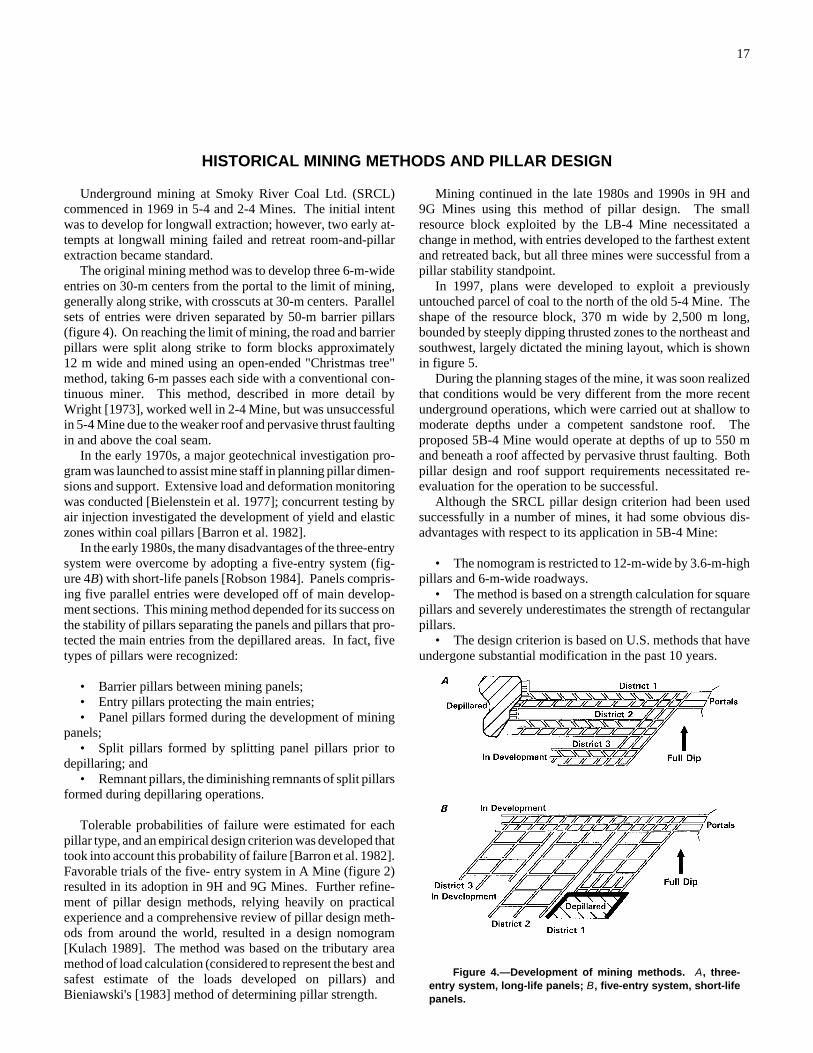
Figure 4.—Development of mining methods. A, three-entry system, long-life panels; B, five-entry system, short-lifepanels.
HISTORICAL MINING METHODS AND PILLAR DESIGN
Underground mining at Smoky River Coal Ltd. (SRCL)commenced in 1969 in 5-4 and 2-4 Mines. The initial intentwas to develop for longwall extraction; however, two early at-tempts at longwall mining failed and retreat room-and-pillarextraction became standard.
The original mining method was to develop three 6-m-wideentries on 30-m centers from the portal to the limit of mining,generally along strike, with crosscuts at 30-m centers. Parallelsets of entries were driven separated by 50-m barrier pillars(figure 4). On reaching the limit of mining, the road and barrierpillars were split along strike to form blocks approximately12 m wide and mined using an open-ended "Christmas tree"method, taking 6-m passes each side with a conventional con-tinuous miner. This method, described in more detail byWright [1973], worked well in 2-4 Mine, but was unsuccessfulin 5-4 Mine due to the weaker roof and pervasive thrust faultingin and above the coal seam.
In the early 1970s, a major geotechnical investigation pro-gram was launched to assist mine staff in planning pillar dimen-sions and support. Extensive load and deformation monitoringwas conducted [Bielenstein et al. 1977]; concurrent testing byair injection investigated the development of yield and elasticzones within coal pillars [Barron et al. 1982].
In the early 1980s, the many disadvantages of the three-entrysystem were overcome by adopting a five-entry system (fig-ure 4B) with short-life panels [Robson 1984]. Panels compris-ing five parallel entries were developed off of main develop-ment sections. This mining method depended for its success onthe stability of pillars separating the panels and pillars that pro-tected the main entries from the depillared areas. In fact, fivetypes of pillars were recognized:
• Barrier pillars between mining panels;• Entry pillars protecting the main entries;• Panel pillars formed during the development of mining
panels;• Split pillars formed by splitting panel pillars prior to
depillaring; and• Remnant pillars, the diminishing remnants of split pillars
formed during depillaring operations.
Tolerable probabilities of failure were estimated for eachpillar type, and an empirical design criterion was developed thattook into account this probability of failure [Barron et al. 1982].Favorable trials of the five- entry system in A Mine (figure 2)resulted in its adoption in 9H and 9G Mines. Further refine-ment of pillar design methods, relying heavily on practicalexperience and a comprehensive review of pillar design meth-ods from around the world, resulted in a design nomogram[Kulach 1989]. The method was based on the tributary areamethod of load calculation (considered to represent the best andsafest estimate of the loads developed on pillars) andBieniawski's [1983] method of determining pillar strength.
Mining continued in the late 1980s and 1990s in 9H and9G Mines using this method of pillar design. The smallresource block exploited by the LB-4 Mine necessitated achange in method, with entries developed to the farthest extentand retreated back, but all three mines were successful from apillar stability standpoint.
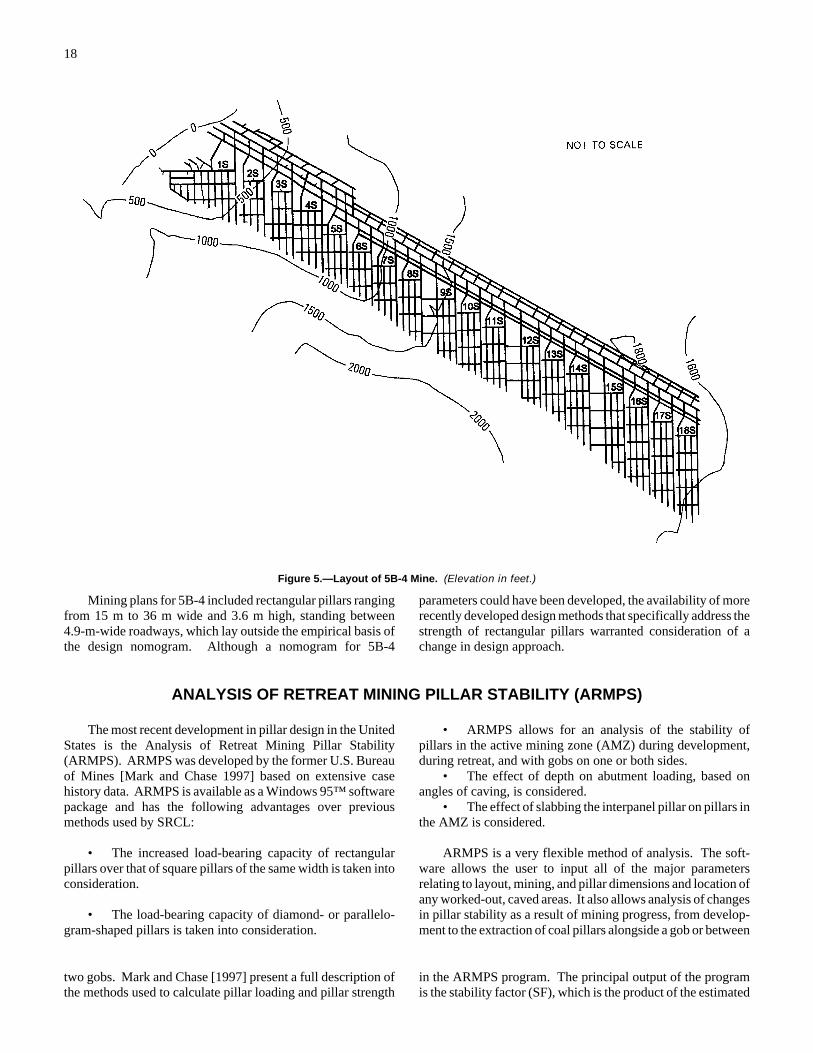
In 1997, plans were developed to exploit a previouslyuntouched parcel of coal to the north of the old 5-4 Mine. Theshape of the resource block, 370 m wide by 2,500 m long,bounded by steeply dipping thrusted zones to the northeast andsouthwest, largely dictated the mining layout, which is shownin figure 5.
During the planning stages of the mine, it was soon realizedthat conditions would be very different from the more recentunderground operations, which were carried out at shallow tomoderate depths under a competent sandstone roof. Theproposed 5B-4 Mine would operate at depths of up to 550 mand beneath a roof affected by pervasive thrust faulting. Bothpillar design and roof support requirements necessitated re-evaluation for the operation to be successful.
Although the SRCL pillar design criterion had been usedsuccessfully in a number of mines, it had some obvious dis-advantages with respect to its application in 5B-4 Mine:
• The nomogram is restricted to 12-m-wide by 3.6-m-highpillars and 6-m-wide roadways.
• The method is based on a strength calculation for squarepillars and severely underestimates the strength of rectangularpillars.
• The design criterion is based on U.S. methods that haveundergone substantial modification in the past 10 years.
18
Figure 5.—Layout of 5B-4 Mine. (Elevation in feet.)
Mining plans for 5B-4 included rectangular pillars rangingfrom 15 m to 36 m wide and 3.6 m high, standing between4.9-m-wide roadways, which lay outside the empirical basis ofthe design nomogram. Although a nomogram for 5B-4
parameters could have been developed, the availability of morerecently developed design methods that specifically address thestrength of rectangular pillars warranted consideration of achange in design approach.
ANALYSIS OF RETREAT MINING PILLAR STABILITY (ARMPS)
The most recent development in pillar design in the UnitedStates is the Analysis of Retreat Mining Pillar Stability(ARMPS). ARMPS was developed by the former U.S. Bureauof Mines [Mark and Chase 1997] based on extensive casehistory data. ARMPS is available as a Windows 95™ softwarepackage and has the following advantages over previousmethods used by SRCL:
• The increased load-bearing capacity of rectangularpillars over that of square pillars of the same width is taken intoconsideration.
• The load-bearing capacity of diamond- or parallelo-gram-shaped pillars is taken into consideration.
• ARMPS allows for an analysis of the stability ofpillars in the active mining zone (AMZ) during development,during retreat, and with gobs on one or both sides.
• The effect of depth on abutment loading, based onangles of caving, is considered.
• The effect of slabbing the interpanel pillar on pillars inthe AMZ is considered.
ARMPS is a very flexible method of analysis. The soft-ware allows the user to input all of the major parametersrelating to layout, mining, and pillar dimensions and location ofany worked-out, caved areas. It also allows analysis of changesin pillar stability as a result of mining progress, from develop-ment to the extraction of coal pillars alongside a gob or between
two gobs. Mark and Chase [1997] present a full description ofthe methods used to calculate pillar loading and pillar strength
in the ARMPS program. The principal output of the programis the stability factor (SF), which is the product of the estimated

19
load-bearing capacity of pillars in the AMZ divided by theestimated load on those pillars.
The concept of the AMZ follows from a hypothesis by Markand Chase [1997] that pillars close to the retreat extraction linebehave together as a system, i.e., if an individual pillar is over-loaded, load is transferred to adjacent pillars. If these are of ade-quate size, the system remains stable, otherwise the pillars fail inturn, resulting in a domino-type transfer of load and pillar failure.
The size of the AMZ is a function of depth, H, based onmeasurements of abutment zone widths conducted by Mark[1990], which showed that 90% of abutment loads fall withina distance 2.8/H from the gob edge.
U.S. case history data indicate that where the ARMPS SFis <0.75, nearly all of the designs were unsatisfactory; wherethe SF is >1.5, nearly all of the designs were satisfactory. Forthe deeper case histories, there was some evidence that stabilityfactors can be lower and still ensure overall pillar stability. In
addition, case histories with less competent roof rock weremore stable than those with stronger roof strata, as thispromoted pillar squeeze or burst activity.
Despite its utility and comprehensive analytical method,ARMPS has several drawbacks when applied to SRCLconditions:
• Case histories were confined to U.S. mines. As withany empirically based design method, this presents problems inapplication outside the case history environment.
• The case history database extends only to depths ofabout 1,100 ft, and only a few case histories were obtained atthis depth of cover.
• None of the case histories matched the seam thick-nesses mined at SRCL (up to 6 m).
After discussions with the developers of ARMPS [Mark1998], it was decided that in order to confirm the applicabilityof ARMPS to SRCL operations, a series of calibration analysesbased on depillaring operations in the coalfield was required.
BACK-ANALYSIS OF CASE HISTORIES
Mine plans from 9G, 9H, and LB-4 Mines (figure 2) werereviewed, and relevant mining data were extracted to developa series of case histories. Each case history was then analyzedusing the ARMPS method, and safety factors were recordedand compared to the existing U.S. case history database.
In order to consider the extraction of thick seams as prac-ticed at SRCL, the calculation of the SF was modified.ARMPS allows input of a single working thickness; in mostSRCL depillaring operations, however, there are two miningheights. During development, the mining height is 3.7 m;during depillaring, the mining height is 6.1 m. This variation inmining height has a marked effect on pillar stability through theheight/width ratio of the pillars. Rationally, load shed to theAMZ from the 6.1-m-high pillars in the mined-out area is moreeffectively controlled by the pillars of 3.7-m height in the AMZ.
In order to take into account this variation in mining height,ARMPS stability factors and details of pillar loading werecalculated for extraction heights of both 3.7 m and 6.1 m. TheSRCL stability factor was derived as follows:
(a) The pillar load transferred to pillars in the AMZ for amining height of 6.1 m was determined using ARMPS.
(b) The load-bearing capacity of pillars in the AMZ for amining height of 3.7 m was determined using ARMPS.
A stability factor was calculated as: (b) divided by (a).
Table 1 presents details of the mining parameters for eachof the case histories considered, as well as the stability factorsobtained. Figure 6 compares the SRCL stability factors withthose obtained from the published U.S. database [Mark andChase 1997] and indicates that SRCL stability factors repre-senting satisfactory conditions range from 0.47 to 1.74, with themajority (66%) in the range of 0.5 to 1.0.
Local mining conditions provided some assurance that thelow SF values were valid. Firstly, the lowest values occurredat the greatest depth; it has been recognized that acceptablestability factors appear to be lower at depth, perhaps due to theinfluence of horizontal stresses in reducing the pillar loading.Secondly, the SRCL case histories are characterized by astrong, competent roof; under such conditions in the UnitedStates, acceptable pillar stability was obtained at lower valuesof the calculated SF.

20
Figure 6.—Comparison of U.S. and SRCL stability factors.
Table 1.—Summary of SRCL case histories analyzed using the ARMPS method
Mine DistrictDepth,
ft
ARMPSSF
(6.1 m)
Load shedto AMZ,
tons
ARMPSSF
(3.7 m)
Capacity of AMZ,
tons
SRCLSF
Loadcondition
LB-4 . . . . . Mine 580 1.35 5.83E+6 1.99 1.16E+7 1.56 2
9H-4 . . . . . SW2 390 1.23 1.18E+6 1.80 2.05E+6 1.74 3
9H-4 . . . . . SW3 485 1.35 1.69E+6 0.92 1.63E+6 0.96 3
9H-4 . . . . . SW4 575 0.73 2.44E+6 1.12 2.49E+6 1.02 3
9H-4 . . . . . SW5 660 0.56 3.43E+6 0.89 2.69E+6 0.78 3
9H-4 . . . . . SW6 715 0.49 4.05E+6 0.77 2.77E+6 0.68 3
9H-4 . . . . . SW7 755 0.61 4.71E+6 1.04 4.14E+6 0.87 3
9H-4 . . . . . SW8 832 0.50 6.11E+6 0.79 4.35E+6 0.71 3
9H-4 . . . . . SW9 932 0.35 4.60E+6 0.53 2.30E+6 0.50 3
9G-4 . . . . . SW2 560 0.85 2.05E+6 1.27 2.46E+6 1.20 3
9G-4 . . . . . SW3 650 0.58 3.26E+6 0.94 2.65E+6 0.81 3
9G-4 . . . . . SW4 730 0.49 4.10E+6 0.80 2.83E+6 0.69 3
9G-4 . . . . . SW5 745 0.51 3.98E+6 0.85 2.83E+6 0.71 3
9G-4 . . . . . SW6 780 0.51 4.01E+6 0.88 2.90E+6 0.72 3
9G-4 . . . . . SW7 840 0.41 5.21E+6 0.69 2.97E+6 0.57 3
9G-4 . . . . . SW8 885 0.37 5.84E+6 0.62 3.05E+6 0.52 3
9G-4 . . . . . SW9 920 0.34 6.56E+6 0.51 3.11E+6 0.47 3
9G-4 . . . . . SW10 915 0.34 6.49E+6 0.53 3.10E+6 0.47 3
21
DEVELOPMENT OF A DESIGN CRITERION
After considering the results of the case history analysis,it was decided to use the ARMPS method to assist in pillar designat 5B-4 Mine. Appropriate engineering practice in such cases isto design to the minimum SF that resulted in stable conditions.Evidence suggests that a pillar design resulting in an ARMPS SFof $0.5 would be stable in Smoky River Coalfield conditions.A more conservative SF of 0.7 was established.
A further limitation was imposed after an analysis of thepillar stresses on the gob corner pillar. This pillar, located ad-jacent to both the active retreat section gob and the barrier pillarbetween the active panel and the old gob, is subjected to thehighest stresses and is therefore more prone to failure. Theprimary concern in this case is the threat of coal bumps or pillarburst, resulting in the transference of loads to adjacent pillars inthe AMZ and possibly massive failure.
ARMPS analyses of SRCL case histories revealed that themaximum stress experienced on any gob corner pillar wasabout 41 MPa. At this stress level, the pillar proved to bestable.
A third criterion was adopted based on the size of pillarsanalyzed from the case histories. The minimum pillar size anal-yzed was 12 m wide between 6-m roadways. Maintaining thisextraction ratio for the 4.9-m-wide roadways employed at5B-4 Mine precluded the use of ARMPS for pillars <9.7 m wide.
Based on the ARMPS output from the case history datacompiled from previous pillar retreat mining in the Smoky RiverCoalfield, the following design criterion for pillars is suggested:
• The ARMPS SF should be maintained above 0.7.• The maximum stress on the corner pillar should not
exceed 41 MPa (6,000 psi).• Pillar widths must not be <9.7 m.
It was realized that the ARMPS-derived design criterionwas also limited in application, specifically to the depths en-countered in the case history analysis. With depths of coverprojected to exceed those of the case histories by 50%, therewas an element of uncertainty with respect to the applicabilityof the design criterion. This is currently being addressed by ageotechnical program that includes pillar stress monitoring,numerical modeling, and continuing assessment of the designcriterion.
Vibrating wire stress cells, electronic convergence meters,and an I. S. Campbell data logger have already been deployedat three monitoring sites to collect data on the effects of miningon pillar stability. Two of the sites monitored stress changeswhile the site was being "mined by" during the developmentphase. It is hoped that these two sites will provide valuable in-formation on the strength of the coal pillars monitored.
Results are still being evaluated; however, indications arethat the design criterion is applicable. Further sites will be es-tablished as mining progresses, and the results will be in-corporated into the design criterion.
SUMMARY
Development of pillar design methods at SRCL's undergroundoperation has proceeded with developments in the mining method.The extension of mine workings to previously unencountereddepths at the new 5B-4 Mine has resulted in a requirement to devel-op pillar design methods to match the new mining environment.
Pillar designs are currently being based on the results ofa back-analysis of case histories using the recently developed
ARMPS method. As with any empirical method of design,prudent engineering practice dictates the collection and analysisof pillar behavior information for design verification. Mon-itoring results already obtained are being analyzed to improvethe design criteria. Future sites will collect data from greaterdepth and adjacent to more extensive workings.
REFERENCES
Barron K, Wright PL, Smales T [1982]. Guidelines for the design of coalpillars in the No. 4 seam at McIntyre Mines Ltd., Grande Cache, Alberta.Paper presented at the First International Conference on Stability inUnderground Mining (Vancouver, British Columbia, Canada).
Bielenstein HU, Wright PL, Mikalson D [1977]. Multi-seam mining atSmoky River. Paper presented at the Sixth International Strata ControlConference (Banff, Alberta, Canada).
Bieniawski ZT [1983]. New design approach for room-and-pillar coalmines in the U.S.A. In: Proceedings of the Fifth ISRM Congress on RockMechanics. Balkema, pp. E27-E36.
Kulach J [1989]. Smoky River Coal Ltd. pillar design criteria. SRCLinternal report, May.
Mark C [1990]. Pillar design methods for longwall mining. Pittsburgh,PA: U.S. Department of the Interior, Bureau of Mines, IC 9247.
Mark C [1998]. Personal communication between C. Mark, PittsburghResearch Laboratory, National Institute for Occupational Safety and Health,and P. Cain, Smoky River Coal Ltd.
Mark C, Chase FE [1997]. Analysis of retreat mining pillar stability(ARMPS). In: Proceedings - New Technology for Ground Control in RetreatMining. Pittsburgh, PA: U.S. Department of Health and Human Services,Public Health Service, Centers for Disease Control and Prevention, NationalInstitute for Occupational Safety and Health, DHHS (NIOSH) PublicationNo. 97-122, IC 9446, pp. 17-34.
Robson TA [1984]. The application of improved room-and-pillartechniques at Smoky River Coal's underground operations. SRCL internalreport, August.
Wright PL [1973]. Layout of continuous mining operations in the SmokyRiver Mines. CIM Bulletin, March.
23
COAL PILLAR DESIGN FOR LONGWALL GATE ENTRIES
By John W. Cassie,1 Peter F. R. Altounyan, Ph.D.,2 and Paul B. Cartwright3
ABSTRACT
This paper describes measured data on strata behavior obtained in recent years from sites in the UnitedKingdom and the implications for pillar design. The data include results from overcoring stress measurementsadjacent to coal mine roadways and deformation monitoring related to longwall extraction. The stressesadjacent to mine roadways or entries have been measured at a number of coal mine sites in the UnitedKingdom. The results are analyzed with regard to the information they provide on pillar behavior and strengthestimates.
A reduction in stress consistent with yielding of the strata adjacent to the roadways is evident. This isconsistent with the confined core model for pillar behavior. The pillar strength is dependent on the rate atwhich vertical stress can increase with distance from the pillar edge and hence the confinement provided tothe yielded material.
The measured data indicate a wide range in pillar strengths. Two groups of results are identified that showsignificantly different behavior corresponding to differing effective pillar strengths. Estimates of pillarstrengths derived from the measured data for these two groups are compared with established equations usedfor pillar design.
The differing behaviors and strengths are attributed to variations in the amount of yielding and deformationin roof and floor strata and hence in the amount of confinement they provide to the coal seam. Numericalmodeling is used to provide a comparison with the measured data and to indicate that this provides a feasiblemechanism to account for the measured data.
As the depth of mining increases, pillars tend to become increasingly wide and squat. In such cases, it ispossible for the surrounding roadways to become badly deformed and damaged while the pillars remain stable.The criteria of comparing pillar strengths and loads to establish pillar stability become less applicable in thesecircumstances; rather, considerations of roadway stability may be the limiting factor in determining suitablepillar dimensions.
This is the case for pillar dimensions typically employed around longwall panels in the United Kingdom.Depending on the properties of the site and what are deemed to be satisfactory roadway conditions, this canlead to wide variations in required pillar dimensions. Measured data for deformations in roadways influencedby adjoining longwall workings are presented. These show that in some circumstances the influence oflongwall extraction can be transmitted over large distances and confirm the variability in required pillar sizesdepending on site properties.
1Senior engineer.2General manager.3Engineer.Rock Mechanics Technology Ltd., Burton-on-Trent, United Kingdom.
24
INTRODUCTION
There are many equations and methods for designing coalpillars; these include back-analyses of failed and successfulcase histories, extrapolation from strength tests on small-scalecoal samples to full-size pillars, and analytical consideration ofthe limiting stress distribution across the pillar. The latterapproach would nowadays normally involve the use ofnumerical modeling. In many instances, a combination of theseapproaches is adopted.
The range of methods developed can be accounted for bythe wide range of geological conditions encountered under-ground and the different functions that coal pillars must fulfillin different mining methods. It would be remarkable if a singledesign equation were applicable to the entire range of coal pillartypes and conditions. The design approach employed should berelevant to both the geological conditions at the site and thefunction of the coal pillar being considered.
Stress measurements provide a tool that can assist in thestudy of pillars. Comparison of the results from different sitesshows a wide range of potential strata conditions and resultingpillar characteristics. For pillars of moderate widths sufficientto allow the development of confinement within the coal, thestress measurements can be used to obtain estimates of theavailable pillar strengths or load-bearing capacities.
For wider pillars employed in deeper mines and with long-wall layouts, characterizing pillars simply by their strength isless applicable. Such pillars are unlikely to fail in the sense ofcollapsing. However, the size of pillar employed can have amajor influence on conditions in the surrounding entries. Inthis case, the distribution of stress within the pillars becomesmore relevant, and the performance of pillars can be assessedby its impact on deformations and support requirements in thesurrounding entries.
STRESS MEASUREMENT DATA
Measurement of stresses provides another tool for studyingpillar behavior. During recent years, the stresses adjacent tomine roadways or entries have been measured at a number ofcoal mine sites in the United Kingdom. The results have beenanalyzed, and estimates of pillar strengths derived from themwere compared with established pillar design equations [Cassieet al., in press]. The data and main points of the analysis arediscussed here.
The general form of the results obtained was consistentwith the confined core concept—the stresses are reducedimmediately adjacent to the ribside and increase deeper into thestrata. They provide a measure of the rate of increase ofvertical stress actually obtained underground and can be studiedwith regard to their implications for the potential strength andbehavior of pillars at sites where the confined core concept isconsidered valid.
Twenty sites have been included in this analysis wherethere were sufficient reliable results to allow the stresses to becharacterized. At these sites, 63 stress measurements were
available; they were carried out by overcoring hollow inclusionstress cells. Relevant data on the 20 sites are presented intable 1; individual test results are listed in table 2. Althoughonly the vertical stress component has been used in this analysisand listed in the table, the measurement technique employedprovides all six stress components. Knowledge of these can beinvaluable in assessing the reliability of individual tests andinterpreting overall behavior at a site.
The results were collated from several field investigationsthat have been previously reported and analyzed on a site-by-site basis [Hendon et al. 1995; ECSC 1997a, 1997b, 1998]. Inseveral instances, the primary objective of the measurementswas to investigate mine entry, rather than pillar behavior. Theextraction geometries varied widely, including individualentries unaffected by other mine openings, twin-entrydevelopments, room-and-pillar panels, and yield pillars.Working depths at the sites ranged from <200 m to >1,000 m.Site T was located at Jim Walter Resources, Inc.'s No. 7 Minein Alabama; all other sites were in the United Kingdom.
25
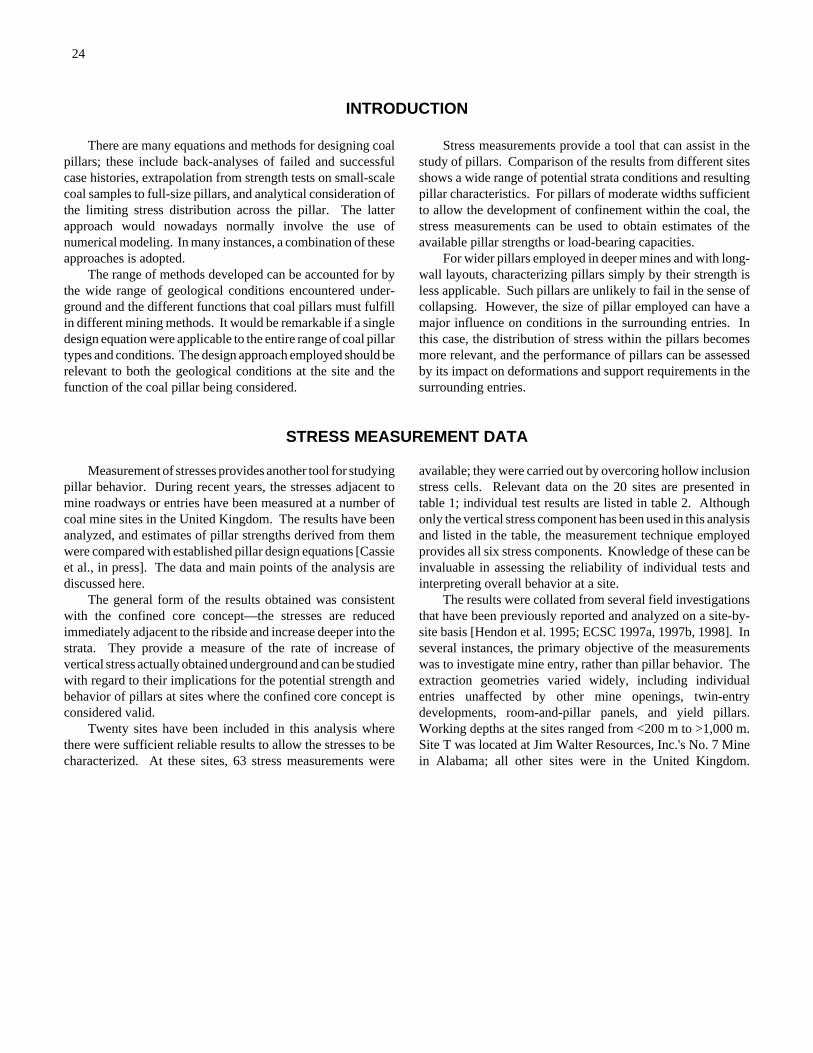
Table 1.CCMeasurement sites
SiteDepth,
m
Seamheight,
m
Roadwayheight,
mMining geometry Deformation level
A . . . . 620 7.5 3.5 Single-entry gate road . . . . . High.B . . . . 500 3.0 2.9 20-m pillar . . . . . . . . . . . . . . High.C . . . . 500 3.0 2.9 30-m pillar . . . . . . . . . . . . . . High.D . . . . 480 2.5 2.7 30-m pillar . . . . . . . . . . . . . . High.E . . . . 950 2.2 2.8 20-m pillar . . . . . . . . . . . . . . High.F . . . . 950 2.2 2.8 Single-entry gate road . . . . . High.G . . . . 900 2.2 3.0 Single-entry gate road . . . . . High.H . . . . 800 1.5 3.0 Irregular pillar . . . . . . . . . . . High.I . . . . . 950 2.4 3.0 60-m pillar . . . . . . . . . . . . . . High.J . . . . 840 2.2 2.8 Single-entry gate road . . . . . Low.K . . . . 840 2.2 2.8 Yield pillar trial . . . . . . . . . . . Low.L . . . . 320 2.8 2.9 Single-entry gate road . . . . . Low.M . . . . 400 3.0 3.7 Trunk roadway . . . . . . . . . . Low.N . . . . 480 2.7 2.6 Single-entry gate road . . . . . Low.O . . . . 560 2.5 2.9 Single-entry gate road . . . . . Low.P . . . . 700 2.0 4.0 Trunk roadway . . . . . . . . . . Low.R . . . . 1,060 2.6 3.0 Trunk roadway . . . . . . . . . . Low.S . . . . 1,085 2.6 4.1 40-m pillar . . . . . . . . . . . . . . Low.T . . . . 560 2.5 2.5 Multientry gate road . . . . . . Low.U . . . . 180 1.2 1.2 11-m pillar . . . . . . . . . . . . . . Low.
Table 2.CCMeasurement data
SiteHeightaboveroof, m
Distanceinto
ribside, m
Verticalstress,MPa
SiteHeightaboveroof, m
Distanceinto
ribside, m
Verticalstress,MPa
A . . . 3.2 4.0 5.9 L . . . . 1.8 1.7 6.3A . . . 4.5 5.7 8.2 L . . . . 1.6 3.4 17.6A . . . 5.0 9.4 14.1 L . . . . 2.1 6.4 17.8B . . . 4.6 3.9 7.4 L . . . . 2.0 10.0 18.0B . . . 4.6 6.2 10.5 M . . . . 3.1 1.1 10.0B . . . 4.6 6.4 15.2 M . . . . 3.2 2.6 14.8B . . . 4.6 8.1 17.5 M . . . . 3.0 4.3 115.5C . . . 4.6 4.2 9.0 M . . . . 6.6 10.7 113.8C . . . 4.6 6.9 8.7 N . . . . 3.5 1.5 9.0C . . . 4.6 8.6 15.0 N . . . . 3.5 3.0 16.9C . . . 4.6 11.7 115.7 N . . . . 3.6 7.0 111.4D . . . 1.4 2.5 6.0 N . . . . 3.6 7.5 110.8D . . . 1.2 4.1 10.3 O . . . . 4.8 2.9 13.3E . . . 4.8 4.6 8.8 O . . . . 5.0 5.4 119.8E . . . 5.2 7.2 10.6 O . . . . 5.0 7.4 115.6E . . . 3.9 9.6 20.0 P . . . . 3.8 1.9 10.0F . . . 1.5 2.2 4.6 P . . . . 3.6 3.0 14.7F . . . 2.9 4.2 11.3 P . . . . 3.3 4.8 19.5F . . . 4.0 5.9 13.7 P . . . . 6.5 8.1 118.5G . . . 5.3 2.8 5.0 R . . . . 0.6 0.8 2.6G . . . 4.2 3.7 9.5 R . . . . 1.7 2.4 12.0G . . . 6.3 6.1 15.2 R . . . . 1.8 3.2 17.1G . . . 6.8 10.9 24.5 R . . . . 3.5 4.7 21.6H . . . 3.0 3.0 5.5 S . . . . 1.7 1.1 15.4H . . . 5.9 5.2 8.9 S . . . . 1.5 3.0 26.7H . . . 4.2 7.3 14.1 S . . . . 1.5 6.1 30.0I . . . . 1.0 1.5 1.1 T . . . . 1.0 2.5 16.5I . . . . 2.2 3.0 8.5 T . . . . 1.0 5.0 19.4I . . . . 3.5 3.9 18.2 T . . . . 1.0 10.0 121.0J . . . 2.2 5.6 26.0 U . . . . 1.6 1.0 8.4K . . . 2.6 4.1 11.7 U . . . . 1.8 3.3 22.3
U . . . . 1.7 5.2 123.51Postpeak.
26
Figure 1.CCTypical measurement site.
Figure 2.CCInterpretation of test results.
Figure 3.CCMeasured data from high and low deformation sites.
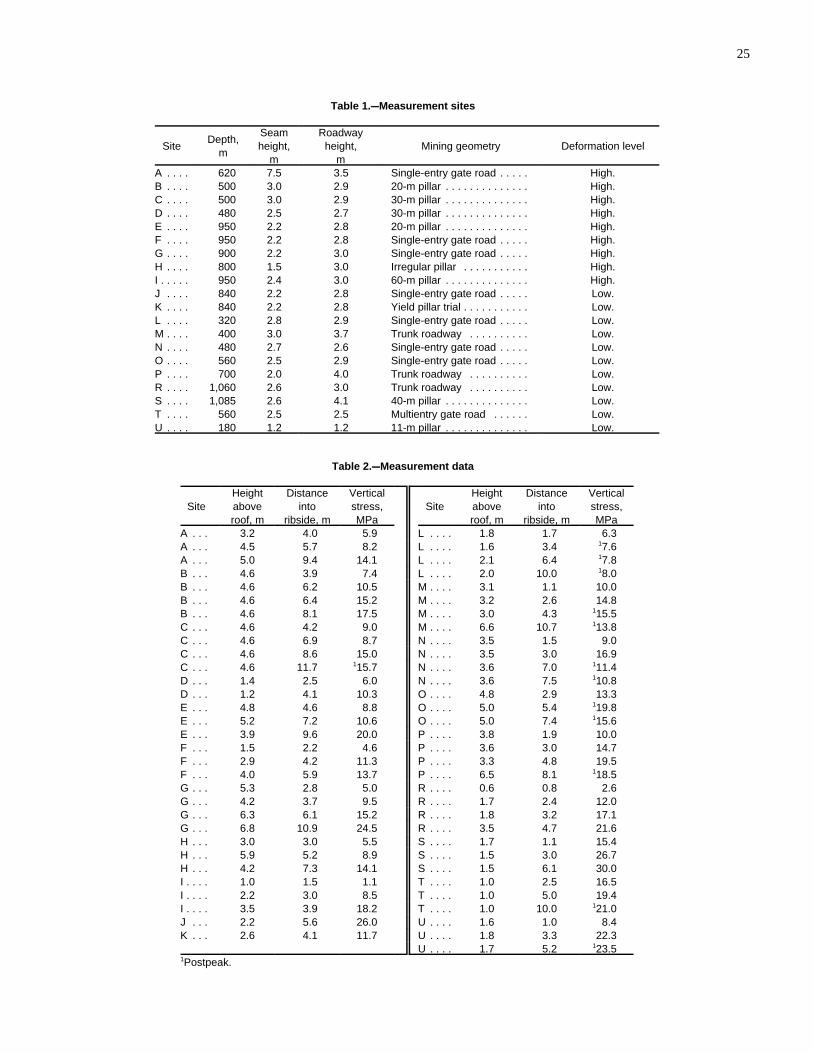
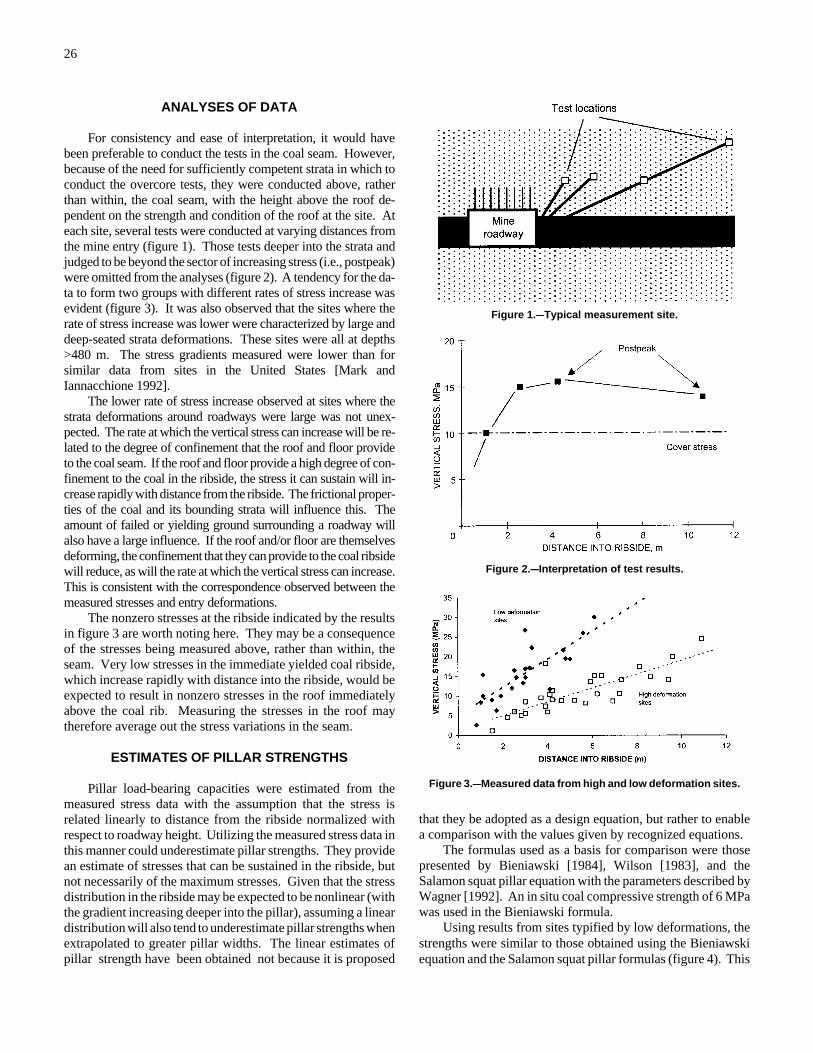
ANALYSES OF DATA
For consistency and ease of interpretation, it would havebeen preferable to conduct the tests in the coal seam. However,because of the need for sufficiently competent strata in which toconduct the overcore tests, they were conducted above, ratherthan within, the coal seam, with the height above the roof de-pendent on the strength and condition of the roof at the site. Ateach site, several tests were conducted at varying distances fromthe mine entry (figure 1). Those tests deeper into the strata andjudged to be beyond the sector of increasing stress (i.e., postpeak)were omitted from the analyses (figure 2). A tendency for the da-ta to form two groups with different rates of stress increase wasevident (figure 3). It was also observed that the sites where therate of stress increase was lower were characterized by large anddeep-seated strata deformations. These sites were all at depths>480 m. The stress gradients measured were lower than forsimilar data from sites in the United States [Mark andIannacchione 1992].
The lower rate of stress increase observed at sites where thestrata deformations around roadways were large was not unex-pected. The rate at which the vertical stress can increase will be re-lated to the degree of confinement that the roof and floor provideto the coal seam. If the roof and floor provide a high degree of con-finement to the coal in the ribside, the stress it can sustain will in-crease rapidly with distance from the ribside. The frictional proper-ties of the coal and its bounding strata will influence this. Theamount of failed or yielding ground surrounding a roadway willalso have a large influence. If the roof and/or floor are themselvesdeforming, the confinement that they can provide to the coal ribsidewill reduce, as will the rate at which the vertical stress can increase.This is consistent with the correspondence observed between themeasured stresses and entry deformations.
The nonzero stresses at the ribside indicated by the resultsin figure 3 are worth noting here. They may be a consequenceof the stresses being measured above, rather than within, theseam. Very low stresses in the immediate yielded coal ribside,which increase rapidly with distance into the ribside, would beexpected to result in nonzero stresses in the roof immediatelyabove the coal rib. Measuring the stresses in the roof maytherefore average out the stress variations in the seam.
ESTIMATES OF PILLAR STRENGTHS
Pillar load-bearing capacities were estimated from themeasured stress data with the assumption that the stress isrelated linearly to distance from the ribside normalized withrespect to roadway height. Utilizing the measured stress data inthis manner could underestimate pillar strengths. They providean estimate of stresses that can be sustained in the ribside, butnot necessarily of the maximum stresses. Given that the stressdistribution in the ribside may be expected to be nonlinear (withthe gradient increasing deeper into the pillar), assuming a lineardistribution will also tend to underestimate pillar strengths whenextrapolated to greater pillar widths. The linear estimates ofpillar strength have been obtained not because it is proposed
that they be adopted as a design equation, but rather to enablea comparison with the values given by recognized equations.
The formulas used as a basis for comparison were thosepresented by Bieniawski [1984], Wilson [1983], and theSalamon squat pillar equation with the parameters described byWagner [1992]. An in situ coal compressive strength of 6 MPawas used in the Bieniawski formula.
Using results from sites typified by low deformations, thestrengths were similar to those obtained using the Bieniawskiequation and the Salamon squat pillar formulas (figure 4). This

27
Figure 4.CCComparison of pillar strength estimates.
was making use of the average or regressed stress distribution.Estimates obtained for single sites within this group wouldimply strengths significantly in excess of or below these values.The Bieniawski and Salamon formulas were derived from back-analysis of failed and unfailed pillars or from testing of rockand coal specimens with different sizes and shapes; they havebeen widely recognized and applied to room-and-pillar layouts.In the case of the formulas, the strength at low width-to-height(w/h) ratios is associated with the in situ coal strength. For theestimates derived from the stress measurements, it is associatedwith the nonzero intercept obtained from linear regressions ofthe data. Despite this conceptual difference, the correspond-ence with the strength estimates for the low deformation sites isstriking.
The pillar strengths implied using results from sites typifiedby high deformations were considerably lower. They indicatethat, in these cases, strengths obtained using the same formulasand parameters could represent an overestimate. Significantlylower in situ coal strengths would be required to obtain a matchwith the measured data. Given that these equations are rootedin experience and the degree of acceptance that they have
gained, in the mining environments where they are applied thestrata conditions giving rise to the lower pillar strengths cannotbe widely encountered. This could largely be accounted for bythe observation that all of the stress measurement sites cate-gorized as high deformation were at depths of 480 m or more;room-and-pillar mining operations are mostly at depths less thanthis. Not all of the deeper sites fell into the category of highdeformation with weaker pillars. At one of the deepest sites(>1,000 m), analysis of the measured results and experienceindicated pillar strengths significantly greater than the estimatesprovided by the equations used in figure 4. The weaker pillarstrengths are in closer agreement with those estimated usingWilson's equations.
The measured stress data imply a wide range of possiblepillar strengths depending on whether a site falls into the highor low deformation categories used here. Using a set of casehistories that includes some of the sites listed here, two types ofbehavior were similarly identified by Gale [1996]. He notedthat the identification of two groups is somewhat arbitrary andit may be expected that the full range of behaviors betweenthese extremes could be encountered.
It is possible that part of the apparent variation in pillarstrength inferred from the measured stresses was associatedwith variations in the in situ uniaxial compressive strength(UCS) of the coal. However, the form of behavior assumed ininterpreting the measured stress data implies that the coal in theribside had already yielded (with a reduction in cohesion) andthat its strength was due to its frictional properties and con-finement rather than cohesion. This would suggest that varia-tions in the coal's UCS were unlikely to have a major influence.A study by Mark and Barton [1996] suggested that variations inlaboratory test values for coal UCS were poorly correlated withpillar strengths determined by back-analyses of failed and un-failed cases.
It appears that for the sites considered here the degree ofconfinement provided to the coal seam was a major factor indetermining the pillar strength. If the roof and/or floor arethemselves yielding and deforming, the confinement that theycan provide to the coal ribside will reduce, as will the rate atwhich the vertical stress can increase, thus leading to a weakerpillar. This is consistent with the marked correlation betweenthe measured stresses and roadway deformations and is largelyequivalent to the distinction between the cases of rigid oryielding roof and floor made by Wilson.
COMPARISON WITH NUMERICAL MODELING
Computer modeling has been used to investigate pillar orentry behavior at the various sites in conjunction with the fieldmeasurements. The model parameters used and results pre-sented here were not intended to represent any individual site;
rather, they illustrate the strata behavior and properties that mayexplain the measured data, in particular, the influence of thestrata bounding the coal pillar.
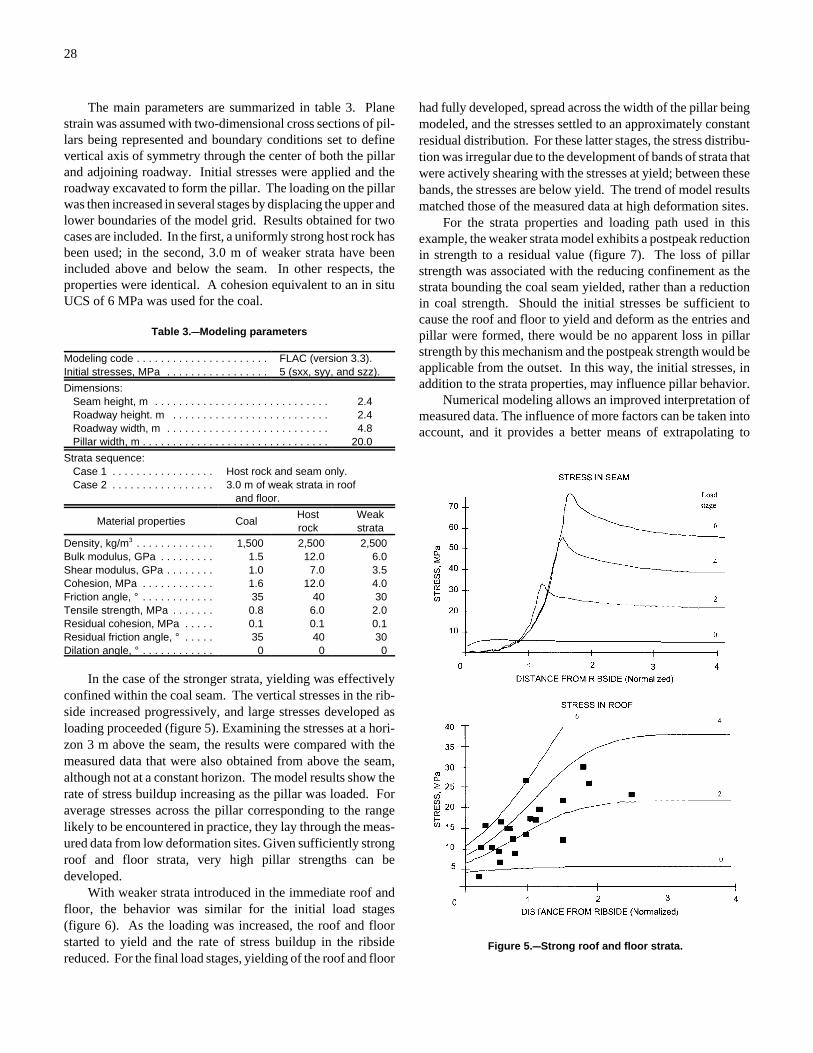
28
Figure 5.CCStrong roof and floor strata.
The main parameters are summarized in table 3. Planestrain was assumed with two-dimensional cross sections of pil-lars being represented and boundary conditions set to definevertical axis of symmetry through the center of both the pillarand adjoining roadway. Initial stresses were applied and theroadway excavated to form the pillar. The loading on the pillarwas then increased in several stages by displacing the upper andlower boundaries of the model grid. Results obtained for twocases are included. In the first, a uniformly strong host rock hasbeen used; in the second, 3.0 m of weaker strata have beenincluded above and below the seam. In other respects, theproperties were identical. A cohesion equivalent to an in situUCS of 6 MPa was used for the coal.
Table 3.CCModeling parameters
Modeling code . . . . . . . . . . . . . . . . . . . . . . FLAC (version 3.3).Initial stresses, MPa . . . . . . . . . . . . . . . . . 5 (sxx, syy, and szz).
Dimensions: Seam height, m . . . . . . . . . . . . . . . . . . . . . . . . . . . . . 2.4 Roadway height. m . . . . . . . . . . . . . . . . . . . . . . . . . . 2.4 Roadway width, m . . . . . . . . . . . . . . . . . . . . . . . . . . . 4.8 Pillar width, m . . . . . . . . . . . . . . . . . . . . . . . . . . . . . . . 20.0
Strata sequence: Case 1 . . . . . . . . . . . . . . . . . Host rock and seam only. Case 2 . . . . . . . . . . . . . . . . . 3.0 m of weak strata in roof
and floor.
Material properties Coal Host rock
Weak strata
Density, kg/m3 . . . . . . . . . . . . . 1,500 2,500 2,500Bulk modulus, GPa . . . . . . . . . 1.5 12.0 6.0Shear modulus, GPa . . . . . . . . 1.0 7.0 3.5Cohesion, MPa . . . . . . . . . . . . 1.6 12.0 4.0Friction angle, ° . . . . . . . . . . . . 35 40 30Tensile strength, MPa . . . . . . . 0.8 6.0 2.0Residual cohesion, MPa . . . . . 0.1 0.1 0.1Residual friction angle, ° . . . . . 35 40 30Dilation angle, ° . . . . . . . . . . . . 0 0 0
In the case of the stronger strata, yielding was effectivelyconfined within the coal seam. The vertical stresses in the rib-side increased progressively, and large stresses developed asloading proceeded (figure 5). Examining the stresses at a hori-zon 3 m above the seam, the results were compared with themeasured data that were also obtained from above the seam,although not at a constant horizon. The model results show therate of stress buildup increasing as the pillar was loaded. Foraverage stresses across the pillar corresponding to the rangelikely to be encountered in practice, they lay through the meas-ured data from low deformation sites. Given sufficiently strongroof and floor strata, very high pillar strengths can bedeveloped.
With weaker strata introduced in the immediate roof andfloor, the behavior was similar for the initial load stages(figure 6). As the loading was increased, the roof and floorstarted to yield and the rate of stress buildup in the ribsidereduced. For the final load stages, yielding of the roof and floor
had fully developed, spread across the width of the pillar beingmodeled, and the stresses settled to an approximately constantresidual distribution. For these latter stages, the stress distribu-tion was irregular due to the development of bands of strata thatwere actively shearing with the stresses at yield; between thesebands, the stresses are below yield. The trend of model resultsmatched those of the measured data at high deformation sites.
For the strata properties and loading path used in thisexample, the weaker strata model exhibits a postpeak reductionin strength to a residual value (figure 7). The loss of pillarstrength was associated with the reducing confinement as thestrata bounding the coal seam yielded, rather than a reductionin coal strength. Should the initial stresses be sufficient tocause the roof and floor to yield and deform as the entries andpillar were formed, there would be no apparent loss in pillarstrength by this mechanism and the postpeak strength would beapplicable from the outset. In this way, the initial stresses, inaddition to the strata properties, may influence pillar behavior.
Numerical modeling allows an improved interpretation ofmeasured data. The influence of more factors can be taken intoaccount, and it provides a better means of extrapolating to
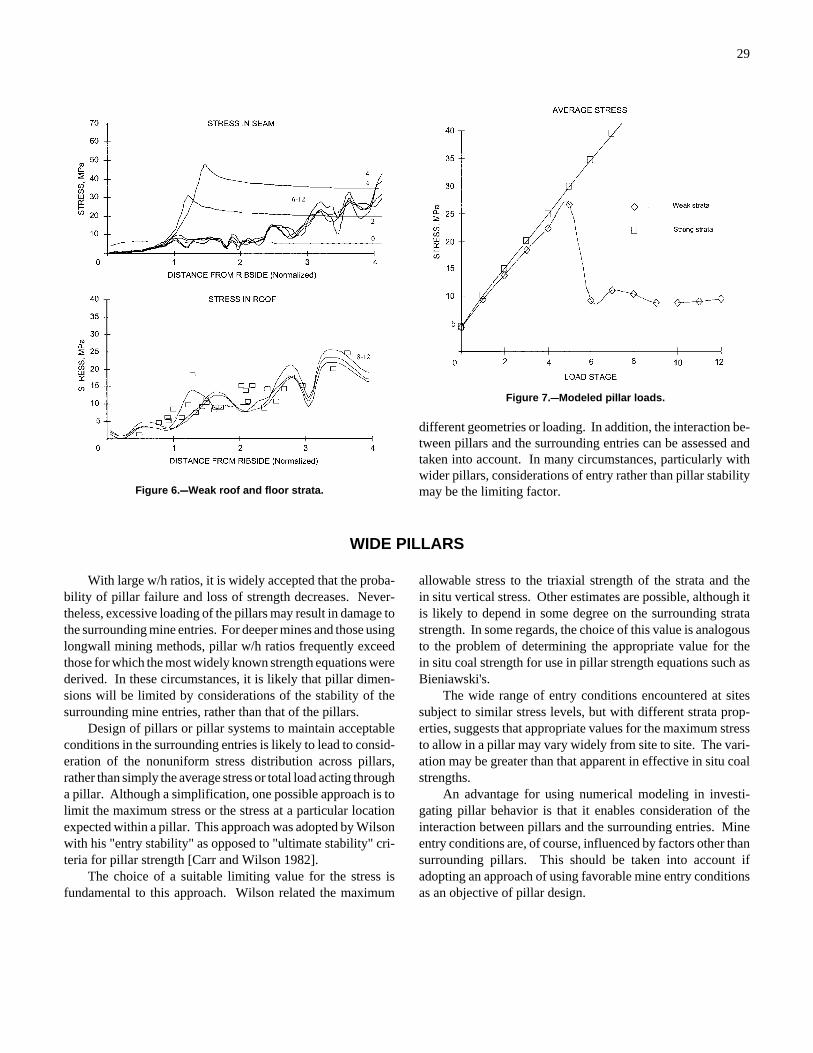
29
Figure 6.CCWeak roof and floor strata.
Figure 7.CCModeled pillar loads.
different geometries or loading. In addition, the interaction be-tween pillars and the surrounding entries can be assessed andtaken into account. In many circumstances, particularly withwider pillars, considerations of entry rather than pillar stabilitymay be the limiting factor.
WIDE PILLARS
With large w/h ratios, it is widely accepted that the proba-bility of pillar failure and loss of strength decreases. Never-theless, excessive loading of the pillars may result in damage tothe surrounding mine entries. For deeper mines and those usinglongwall mining methods, pillar w/h ratios frequently exceedthose for which the most widely known strength equations werederived. In these circumstances, it is likely that pillar dimen-sions will be limited by considerations of the stability of thesurrounding mine entries, rather than that of the pillars.
Design of pillars or pillar systems to maintain acceptableconditions in the surrounding entries is likely to lead to consid-eration of the nonuniform stress distribution across pillars,rather than simply the average stress or total load acting througha pillar. Although a simplification, one possible approach is tolimit the maximum stress or the stress at a particular locationexpected within a pillar. This approach was adopted by Wilsonwith his "entry stability" as opposed to "ultimate stability" cri-teria for pillar strength [Carr and Wilson 1982].
The choice of a suitable limiting value for the stress isfundamental to this approach. Wilson related the maximum
allowable stress to the triaxial strength of the strata and thein situ vertical stress. Other estimates are possible, although itis likely to depend in some degree on the surrounding stratastrength. In some regards, the choice of this value is analogousto the problem of determining the appropriate value for thein situ coal strength for use in pillar strength equations such asBieniawski's.
The wide range of entry conditions encountered at sitessubject to similar stress levels, but with different strata prop-erties, suggests that appropriate values for the maximum stressto allow in a pillar may vary widely from site to site. The vari-ation may be greater than that apparent in effective in situ coalstrengths.
An advantage for using numerical modeling in investi-gating pillar behavior is that it enables consideration of theinteraction between pillars and the surrounding entries. Mineentry conditions are, of course, influenced by factors other thansurrounding pillars. This should be taken into account ifadopting an approach of using favorable mine entry conditionsas an objective of pillar design.
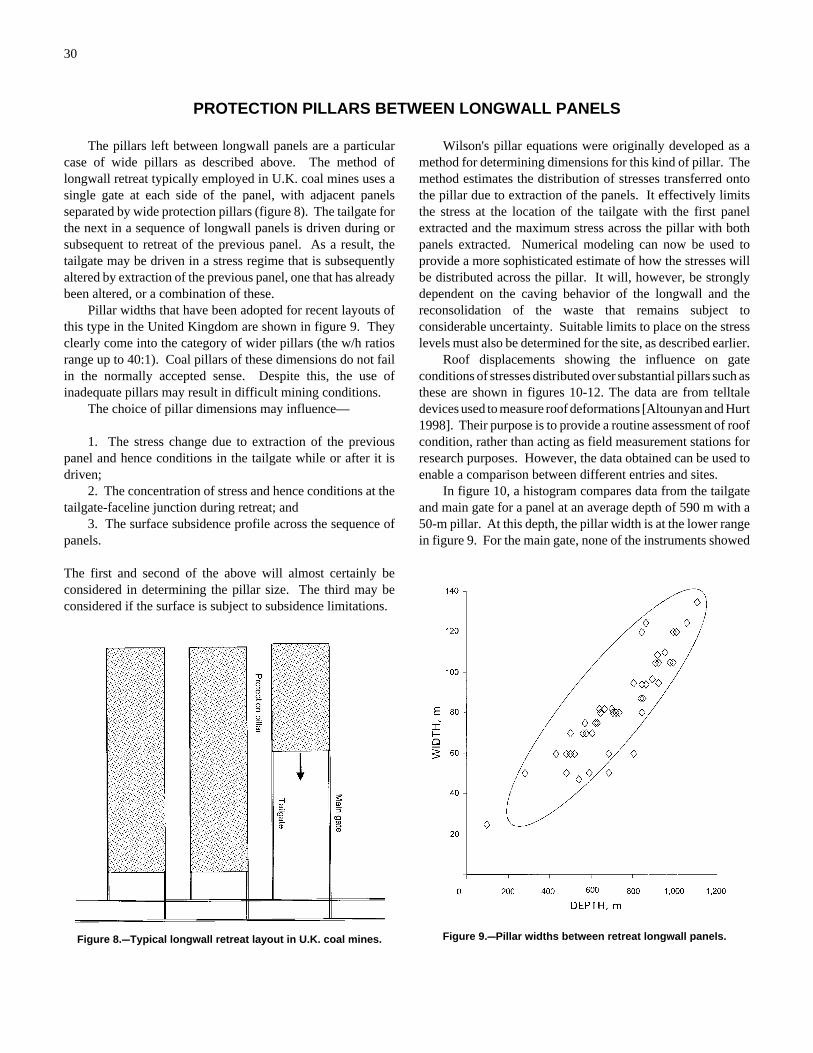
30
Figure 8.CCTypical longwall retreat layout in U.K. coal mines. Figure 9.CCPillar widths between retreat longwall panels.
PROTECTION PILLARS BETWEEN LONGWALL PANELS
The pillars left between longwall panels are a particularcase of wide pillars as described above. The method oflongwall retreat typically employed in U.K. coal mines uses asingle gate at each side of the panel, with adjacent panelsseparated by wide protection pillars (figure 8). The tailgate forthe next in a sequence of longwall panels is driven during orsubsequent to retreat of the previous panel. As a result, thetailgate may be driven in a stress regime that is subsequentlyaltered by extraction of the previous panel, one that has alreadybeen altered, or a combination of these.
Pillar widths that have been adopted for recent layouts ofthis type in the United Kingdom are shown in figure 9. Theyclearly come into the category of wider pillars (the w/h ratiosrange up to 40:1). Coal pillars of these dimensions do not failin the normally accepted sense. Despite this, the use ofinadequate pillars may result in difficult mining conditions.
The choice of pillar dimensions may influence—
1. The stress change due to extraction of the previouspanel and hence conditions in the tailgate while or after it isdriven;
2. The concentration of stress and hence conditions at thetailgate-faceline junction during retreat; and
3. The surface subsidence profile across the sequence ofpanels.
The first and second of the above will almost certainly beconsidered in determining the pillar size. The third may beconsidered if the surface is subject to subsidence limitations.
Wilson's pillar equations were originally developed as amethod for determining dimensions for this kind of pillar. Themethod estimates the distribution of stresses transferred ontothe pillar due to extraction of the panels. It effectively limitsthe stress at the location of the tailgate with the first panelextracted and the maximum stress across the pillar with bothpanels extracted. Numerical modeling can now be used toprovide a more sophisticated estimate of how the stresses willbe distributed across the pillar. It will, however, be stronglydependent on the caving behavior of the longwall and thereconsolidation of the waste that remains subject toconsiderable uncertainty. Suitable limits to place on the stresslevels must also be determined for the site, as described earlier.
Roof displacements showing the influence on gateconditions of stresses distributed over substantial pillars such asthese are shown in figures 10-12. The data are from telltaledevices used to measure roof deformations [Altounyan and Hurt1998]. Their purpose is to provide a routine assessment of roofcondition, rather than acting as field measurement stations forresearch purposes. However, the data obtained can be used toenable a comparison between different entries and sites.
In figure 10, a histogram compares data from the tailgateand main gate for a panel at an average depth of 590 m with a50-m pillar. At this depth, the pillar width is at the lower rangein figure 9. For the main gate, none of the instruments showed
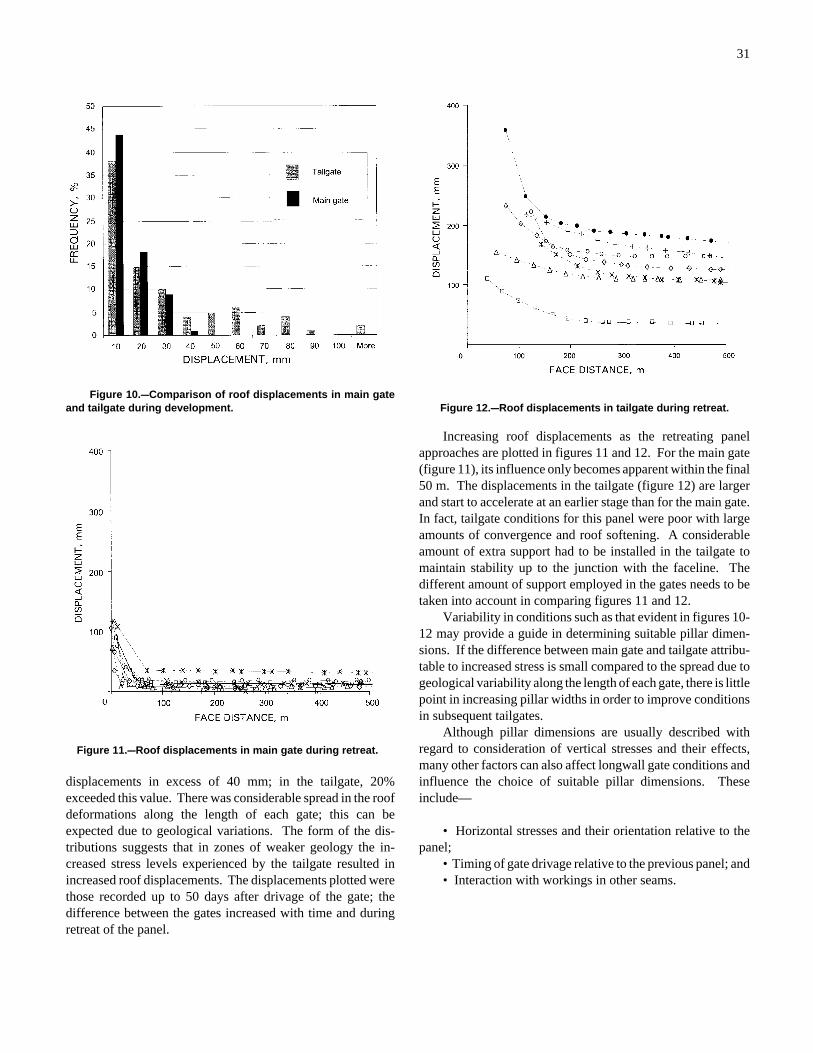
31
Figure 10.CCComparison of roof displacements in main gateand tailgate during development.
Figure 11.CCRoof displacements in main gate during retreat.
Figure 12.CCRoof displacements in tailgate during retreat.
displacements in excess of 40 mm; in the tailgate, 20%exceeded this value. There was considerable spread in the roofdeformations along the length of each gate; this can beexpected due to geological variations. The form of the dis-tributions suggests that in zones of weaker geology the in-creased stress levels experienced by the tailgate resulted inincreased roof displacements. The displacements plotted werethose recorded up to 50 days after drivage of the gate; thedifference between the gates increased with time and duringretreat of the panel.
Increasing roof displacements as the retreating panelapproaches are plotted in figures 11 and 12. For the main gate(figure 11), its influence only becomes apparent within the final50 m. The displacements in the tailgate (figure 12) are largerand start to accelerate at an earlier stage than for the main gate.In fact, tailgate conditions for this panel were poor with largeamounts of convergence and roof softening. A considerableamount of extra support had to be installed in the tailgate tomaintain stability up to the junction with the faceline. Thedifferent amount of support employed in the gates needs to betaken into account in comparing figures 11 and 12.
Variability in conditions such as that evident in figures 10-12 may provide a guide in determining suitable pillar dimen-sions. If the difference between main gate and tailgate attribu-table to increased stress is small compared to the spread due togeological variability along the length of each gate, there is littlepoint in increasing pillar widths in order to improve conditionsin subsequent tailgates.
Although pillar dimensions are usually described withregard to consideration of vertical stresses and their effects,many other factors can also affect longwall gate conditions andinfluence the choice of suitable pillar dimensions. Theseinclude—
• Horizontal stresses and their orientation relative to thepanel;
• Timing of gate drivage relative to the previous panel; and• Interaction with workings in other seams.
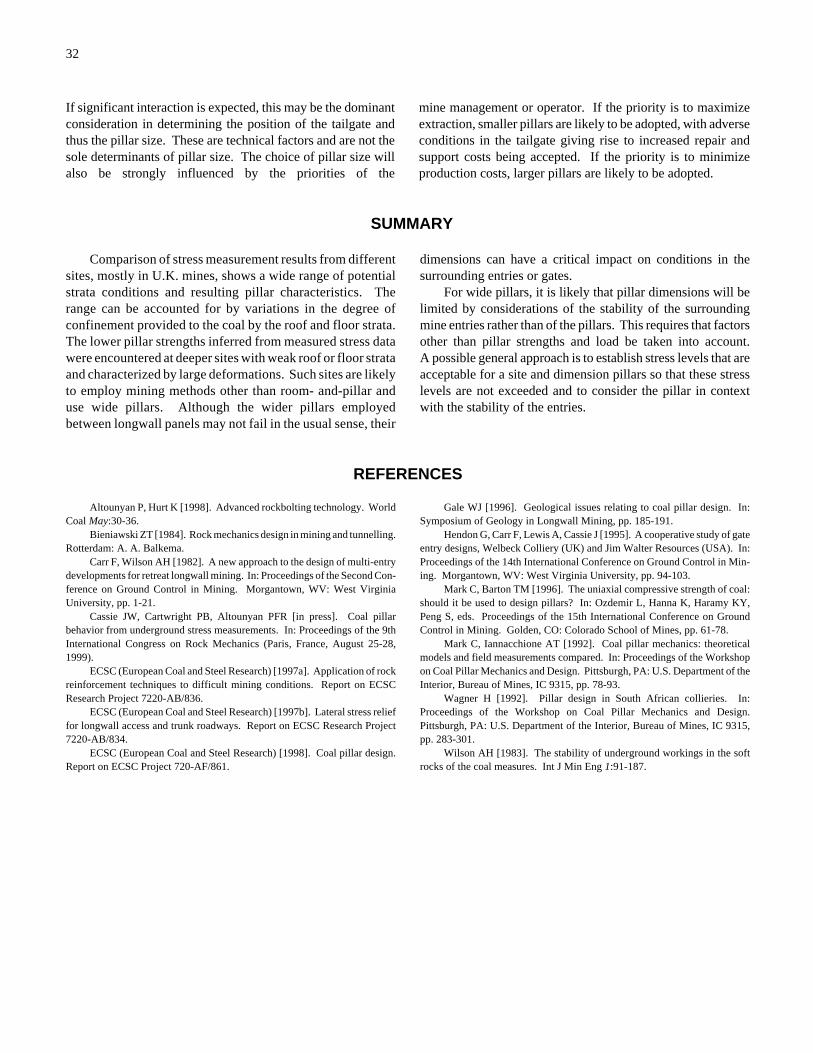
32
If significant interaction is expected, this may be the dominantconsideration in determining the position of the tailgate andthus the pillar size. These are technical factors and are not thesole determinants of pillar size. The choice of pillar size willalso be strongly influenced by the priorities of the
mine management or operator. If the priority is to maximizeextraction, smaller pillars are likely to be adopted, with adverseconditions in the tailgate giving rise to increased repair andsupport costs being accepted. If the priority is to minimizeproduction costs, larger pillars are likely to be adopted.
SUMMARY
Comparison of stress measurement results from differentsites, mostly in U.K. mines, shows a wide range of potentialstrata conditions and resulting pillar characteristics. Therange can be accounted for by variations in the degree ofconfinement provided to the coal by the roof and floor strata.The lower pillar strengths inferred from measured stress datawere encountered at deeper sites with weak roof or floor strataand characterized by large deformations. Such sites are likelyto employ mining methods other than room- and-pillar anduse wide pillars. Although the wider pillars employedbetween longwall panels may not fail in the usual sense, their
dimensions can have a critical impact on conditions in thesurrounding entries or gates.
For wide pillars, it is likely that pillar dimensions will belimited by considerations of the stability of the surroundingmine entries rather than of the pillars. This requires that factorsother than pillar strengths and load be taken into account.A possible general approach is to establish stress levels that areacceptable for a site and dimension pillars so that these stresslevels are not exceeded and to consider the pillar in contextwith the stability of the entries.
REFERENCES
Altounyan P, Hurt K [1998]. Advanced rockbolting technology. WorldCoal May:30-36.
Bieniawski ZT [1984]. Rock mechanics design in mining and tunnelling.Rotterdam: A. A. Balkema.
Carr F, Wilson AH [1982]. A new approach to the design of multi-entrydevelopments for retreat longwall mining. In: Proceedings of the Second Con-ference on Ground Control in Mining. Morgantown, WV: West VirginiaUniversity, pp. 1-21.
Cassie JW, Cartwright PB, Altounyan PFR [in press]. Coal pillarbehavior from underground stress measurements. In: Proceedings of the 9thInternational Congress on Rock Mechanics (Paris, France, August 25-28,1999).
ECSC (European Coal and Steel Research) [1997a]. Application of rockreinforcement techniques to difficult mining conditions. Report on ECSCResearch Project 7220-AB/836.
ECSC (European Coal and Steel Research) [1997b]. Lateral stress relieffor longwall access and trunk roadways. Report on ECSC Research Project7220-AB/834.
ECSC (European Coal and Steel Research) [1998]. Coal pillar design.Report on ECSC Project 720-AF/861.
Gale WJ [1996]. Geological issues relating to coal pillar design. In:Symposium of Geology in Longwall Mining, pp. 185-191.
Hendon G, Carr F, Lewis A, Cassie J [1995]. A cooperative study of gateentry designs, Welbeck Colliery (UK) and Jim Walter Resources (USA). In:Proceedings of the 14th International Conference on Ground Control in Min-ing. Morgantown, WV: West Virginia University, pp. 94-103.
Mark C, Barton TM [1996]. The uniaxial compressive strength of coal:should it be used to design pillars? In: Ozdemir L, Hanna K, Haramy KY,Peng S, eds. Proceedings of the 15th International Conference on GroundControl in Mining. Golden, CO: Colorado School of Mines, pp. 61-78.
Mark C, Iannacchione AT [1992]. Coal pillar mechanics: theoreticalmodels and field measurements compared. In: Proceedings of the Workshopon Coal Pillar Mechanics and Design. Pittsburgh, PA: U.S. Department of theInterior, Bureau of Mines, IC 9315, pp. 78-93.
Wagner H [1992]. Pillar design in South African collieries. In:Proceedings of the Workshop on Coal Pillar Mechanics and Design.Pittsburgh, PA: U.S. Department of the Interior, Bureau of Mines, IC 9315,pp. 283-301.
Wilson AH [1983]. The stability of underground workings in the softrocks of the coal measures. Int J Min Eng 1:91-187.
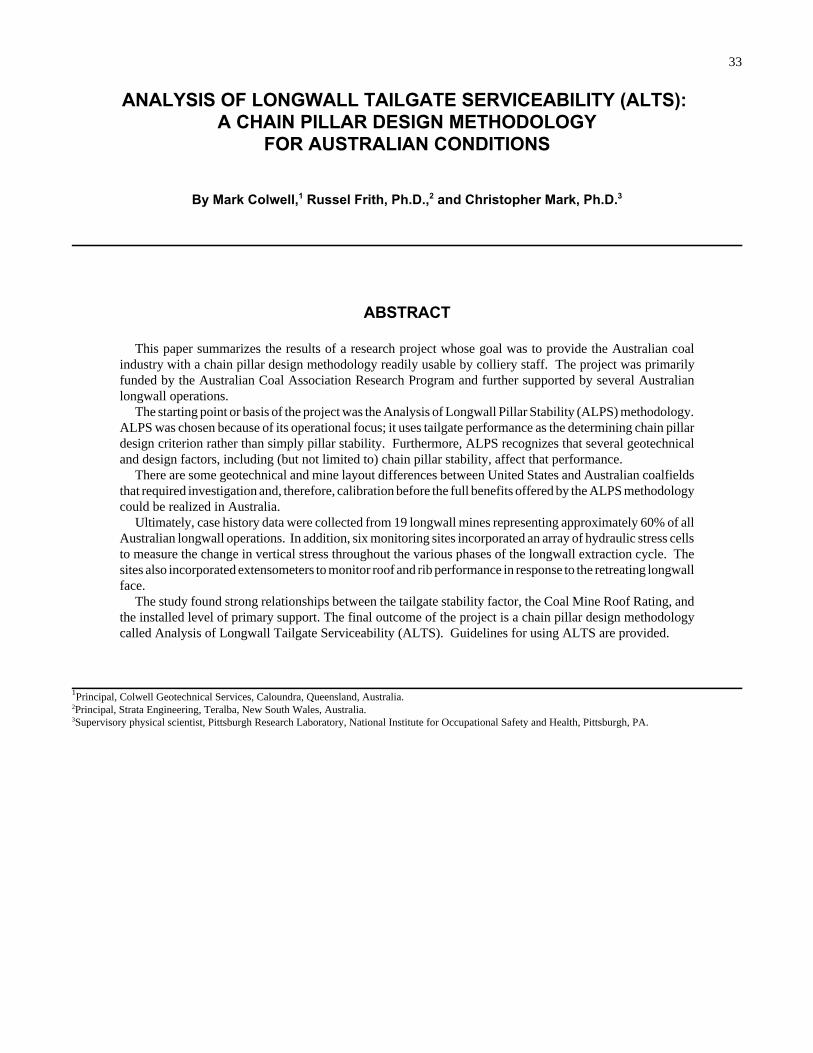
33
ANALYSIS OF LONGWALL TAILGATE SERVICEABILITY (ALTS): A CHAIN PILLAR DESIGN METHODOLOGY
FOR AUSTRALIAN CONDITIONS
By Mark Colwell,1 Russel Frith, Ph.D.,2 and Christopher Mark, Ph.D.3
ABSTRACT
This paper summarizes the results of a research project whose goal was to provide the Australian coalindustry with a chain pillar design methodology readily usable by colliery staff. The project was primarilyfunded by the Australian Coal Association Research Program and further supported by several Australianlongwall operations.
The starting point or basis of the project was the Analysis of Longwall Pillar Stability (ALPS) methodology.ALPS was chosen because of its operational focus; it uses tailgate performance as the determining chain pillardesign criterion rather than simply pillar stability. Furthermore, ALPS recognizes that several geotechnicaland design factors, including (but not limited to) chain pillar stability, affect that performance.
There are some geotechnical and mine layout differences between United States and Australian coalfieldsthat required investigation and, therefore, calibration before the full benefits offered by the ALPS methodologycould be realized in Australia.
Ultimately, case history data were collected from 19 longwall mines representing approximately 60% of allAustralian longwall operations. In addition, six monitoring sites incorporated an array of hydraulic stress cellsto measure the change in vertical stress throughout the various phases of the longwall extraction cycle. Thesites also incorporated extensometers to monitor roof and rib performance in response to the retreating longwallface.
The study found strong relationships between the tailgate stability factor, the Coal Mine Roof Rating, andthe installed level of primary support. The final outcome of the project is a chain pillar design methodologycalled Analysis of Longwall Tailgate Serviceability (ALTS). Guidelines for using ALTS are provided.
1Principal, Colwell Geotechnical Services, Caloundra, Queensland, Australia.2Principal, Strata Engineering, Teralba, New South Wales, Australia.3Supervisory physical scientist, Pittsburgh Research Laboratory, National Institute for Occupational Safety and Health, Pittsburgh, PA.
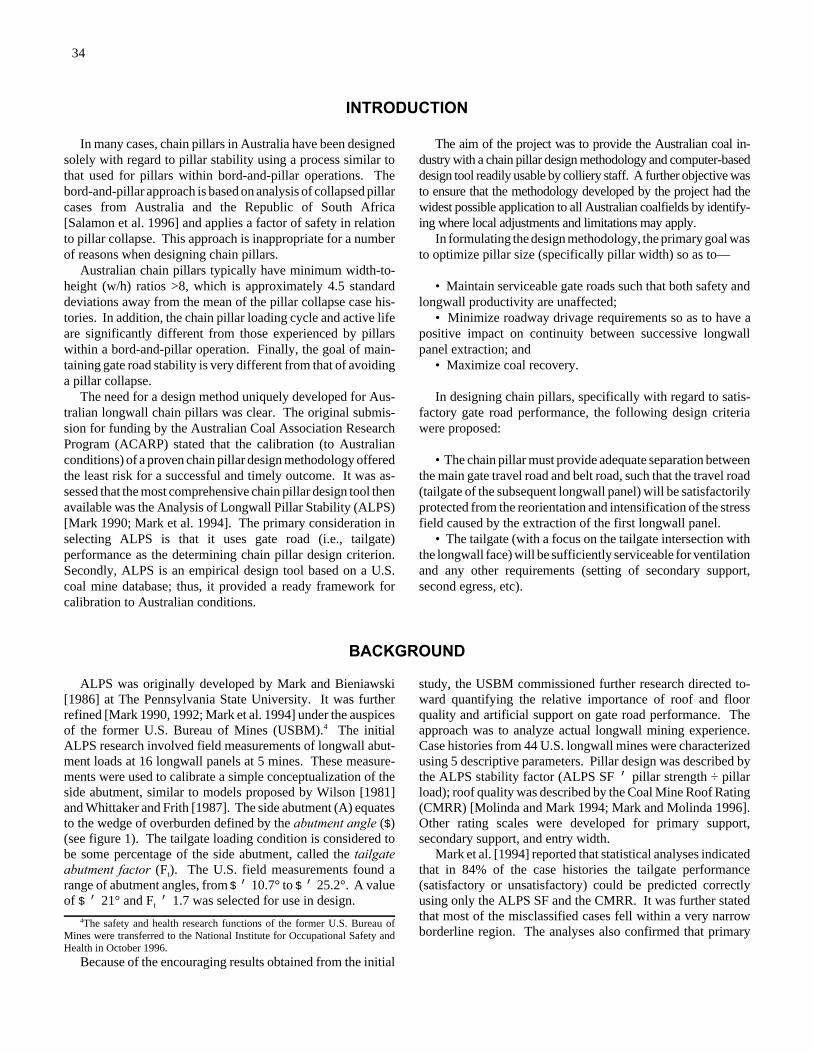
34
INTRODUCTION
In many cases, chain pillars in Australia have been designedsolely with regard to pillar stability using a process similar tothat used for pillars within bord-and-pillar operations. Thebord-and-pillar approach is based on analysis of collapsed pillarcases from Australia and the Republic of South Africa[Salamon et al. 1996] and applies a factor of safety in relationto pillar collapse. This approach is inappropriate for a numberof reasons when designing chain pillars.
Australian chain pillars typically have minimum width-to-height (w/h) ratios >8, which is approximately 4.5 standarddeviations away from the mean of the pillar collapse case his-tories. In addition, the chain pillar loading cycle and active lifeare significantly different from those experienced by pillarswithin a bord-and-pillar operation. Finally, the goal of main-taining gate road stability is very different from that of avoidinga pillar collapse.
The need for a design method uniquely developed for Aus-tralian longwall chain pillars was clear. The original submis-sion for funding by the Australian Coal Association ResearchProgram (ACARP) stated that the calibration (to Australianconditions) of a proven chain pillar design methodology offeredthe least risk for a successful and timely outcome. It was as-sessed that the most comprehensive chain pillar design tool thenavailable was the Analysis of Longwall Pillar Stability (ALPS)[Mark 1990; Mark et al. 1994]. The primary consideration inselecting ALPS is that it uses gate road (i.e., tailgate)performance as the determining chain pillar design criterion.Secondly, ALPS is an empirical design tool based on a U.S.coal mine database; thus, it provided a ready framework forcalibration to Australian conditions.
The aim of the project was to provide the Australian coal in-dustry with a chain pillar design methodology and computer-baseddesign tool readily usable by colliery staff. A further objective wasto ensure that the methodology developed by the project had thewidest possible application to all Australian coalfields by identify-ing where local adjustments and limitations may apply.
In formulating the design methodology, the primary goal wasto optimize pillar size (specifically pillar width) so as to—
• Maintain serviceable gate roads such that both safety andlongwall productivity are unaffected;
• Minimize roadway drivage requirements so as to have apositive impact on continuity between successive longwallpanel extraction; and
• Maximize coal recovery.
In designing chain pillars, specifically with regard to satis-factory gate road performance, the following design criteriawere proposed:
• The chain pillar must provide adequate separation betweenthe main gate travel road and belt road, such that the travel road(tailgate of the subsequent longwall panel) will be satisfactorilyprotected from the reorientation and intensification of the stressfield caused by the extraction of the first longwall panel.
• The tailgate (with a focus on the tailgate intersection withthe longwall face) will be sufficiently serviceable for ventilationand any other requirements (setting of secondary support,second egress, etc).
BACKGROUND
ALPS was originally developed by Mark and Bieniawski[1986] at The Pennsylvania State University. It was furtherrefined [Mark 1990, 1992; Mark et al. 1994] under the auspicesof the former U.S. Bureau of Mines (USBM).4 The initialALPS research involved field measurements of longwall abut-ment loads at 16 longwall panels at 5 mines. These measure-ments were used to calibrate a simple conceptualization of theside abutment, similar to models proposed by Wilson [1981]and Whittaker and Frith [1987]. The side abutment (A) equatesto the wedge of overburden defined by the abutment angle ($)(see figure 1). The tailgate loading condition is considered tobe some percentage of the side abutment, called the tailgateabutment factor (Ft). The U.S. field measurements found arange of abutment angles, from $ ' 10.7° to $ ' 25.2°. A valueof $ ' 21° and Ft ' 1.7 was selected for use in design.
4The safety and health research functions of the former U.S. Bureau ofMines were transferred to the National Institute for Occupational Safety andHealth in October 1996.
Because of the encouraging results obtained from the initial
study, the USBM commissioned further research directed to-ward quantifying the relative importance of roof and floorquality and artificial support on gate road performance. Theapproach was to analyze actual longwall mining experience.Case histories from 44 U.S. longwall mines were characterizedusing 5 descriptive parameters. Pillar design was described bythe ALPS stability factor (ALPS SF ' pillar strength ÷ pillarload); roof quality was described by the Coal Mine Roof Rating(CMRR) [Molinda and Mark 1994; Mark and Molinda 1996].Other rating scales were developed for primary support,secondary support, and entry width.
Mark et al. [1994] reported that statistical analyses indicatedthat in 84% of the case histories the tailgate performance(satisfactory or unsatisfactory) could be predicted correctlyusing only the ALPS SF and the CMRR. It was further statedthat most of the misclassified cases fell within a very narrowborderline region. The analyses also confirmed that primary
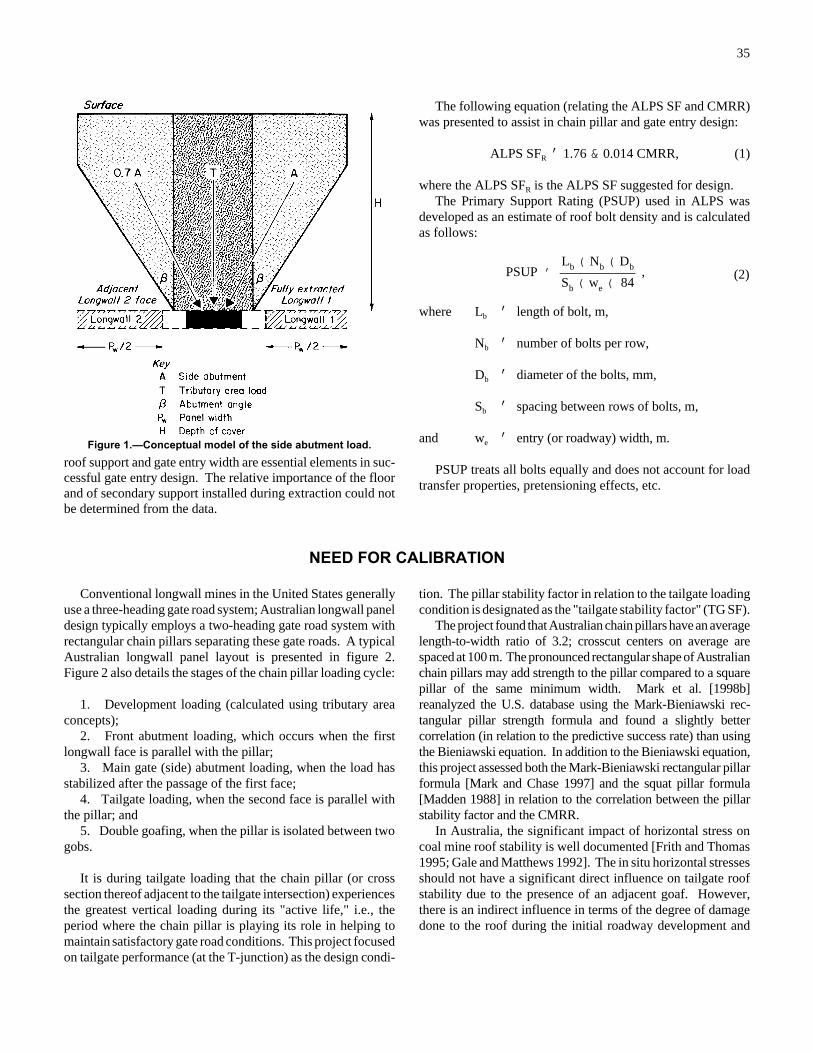
35
PSUP 'Lb ( Nb ( Db
Sb ( we ( 84, (2)
Figure 1.—Conceptual model of the side abutment load.
roof support and gate entry width are essential elements in suc-cessful gate entry design. The relative importance of the floorand of secondary support installed during extraction could notbe determined from the data.
The following equation (relating the ALPS SF and CMRR)was presented to assist in chain pillar and gate entry design:
ALPS SFR ' 1.76 & 0.014 CMRR, (1)
where the ALPS SFR is the ALPS SF suggested for design.The Primary Support Rating (PSUP) used in ALPS was
developed as an estimate of roof bolt density and is calculatedas follows:
where Lb ' length of bolt, m,
Nb ' number of bolts per row,
Db ' diameter of the bolts, mm,
Sb ' spacing between rows of bolts, m,
and we ' entry (or roadway) width, m.
PSUP treats all bolts equally and does not account for loadtransfer properties, pretensioning effects, etc.
NEED FOR CALIBRATION
Conventional longwall mines in the United States generallyuse a three-heading gate road system; Australian longwall paneldesign typically employs a two-heading gate road system withrectangular chain pillars separating these gate roads. A typicalAustralian longwall panel layout is presented in figure 2.Figure 2 also details the stages of the chain pillar loading cycle:
1. Development loading (calculated using tributary areaconcepts);
2. Front abutment loading, which occurs when the firstlongwall face is parallel with the pillar;
3. Main gate (side) abutment loading, when the load hasstabilized after the passage of the first face;
4. Tailgate loading, when the second face is parallel withthe pillar; and
5. Double goafing, when the pillar is isolated between twogobs.
It is during tailgate loading that the chain pillar (or crosssection thereof adjacent to the tailgate intersection) experiencesthe greatest vertical loading during its "active life," i.e., theperiod where the chain pillar is playing its role in helping tomaintain satisfactory gate road conditions. This project focusedon tailgate performance (at the T-junction) as the design condi-
tion. The pillar stability factor in relation to the tailgate loadingcondition is designated as the "tailgate stability factor" (TG SF).
The project found that Australian chain pillars have an averagelength-to-width ratio of 3.2; crosscut centers on average arespaced at 100 m. The pronounced rectangular shape of Australianchain pillars may add strength to the pillar compared to a squarepillar of the same minimum width. Mark et al. [1998b]reanalyzed the U.S. database using the Mark-Bieniawski rec-tangular pillar strength formula and found a slightly bettercorrelation (in relation to the predictive success rate) than usingthe Bieniawski equation. In addition to the Bieniawski equation,this project assessed both the Mark-Bieniawski rectangular pillarformula [Mark and Chase 1997] and the squat pillar formula[Madden 1988] in relation to the correlation between the pillarstability factor and the CMRR.
In Australia, the significant impact of horizontal stress oncoal mine roof stability is well documented [Frith and Thomas1995; Gale and Matthews 1992]. The in situ horizontal stressesshould not have a significant direct influence on tailgate roofstability due to the presence of an adjacent goaf. However,there is an indirect influence in terms of the degree of damagedone to the roof during the initial roadway development and
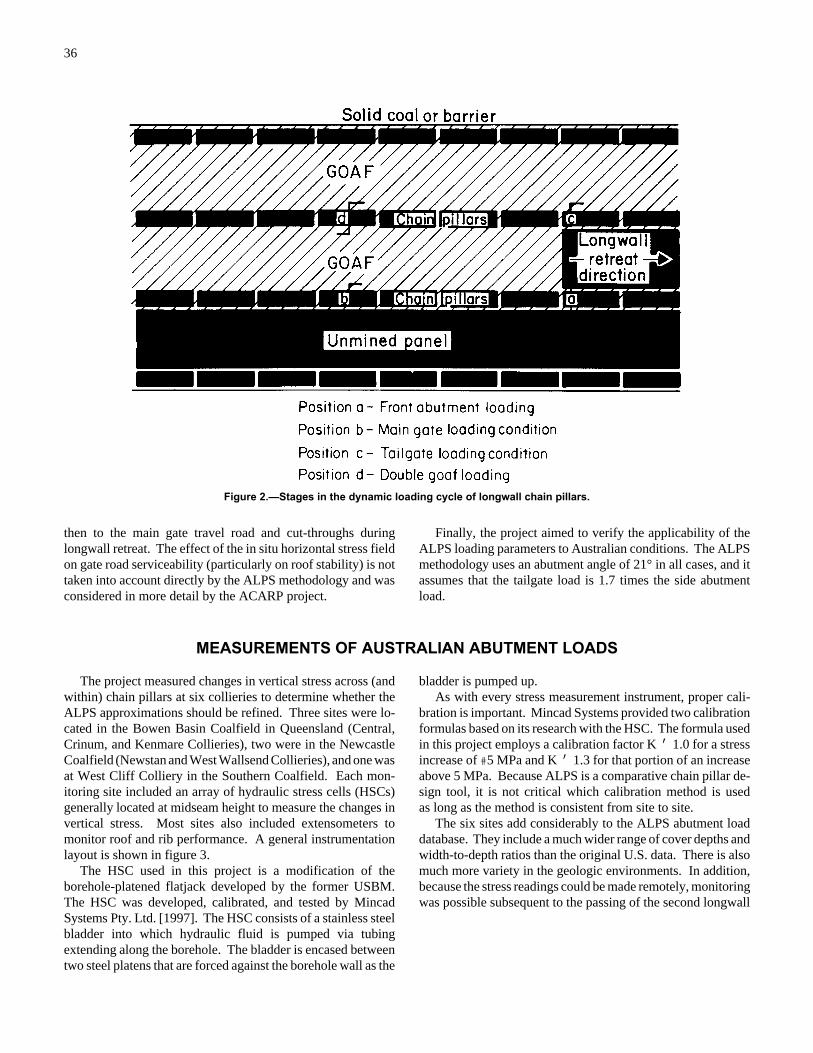
36
Figure 2.—Stages in the dynamic loading cycle of longwall chain pillars.
then to the main gate travel road and cut-throughs duringlongwall retreat. The effect of the in situ horizontal stress fieldon gate road serviceability (particularly on roof stability) is nottaken into account directly by the ALPS methodology and wasconsidered in more detail by the ACARP project.
Finally, the project aimed to verify the applicability of theALPS loading parameters to Australian conditions. The ALPSmethodology uses an abutment angle of 21° in all cases, and itassumes that the tailgate load is 1.7 times the side abutmentload.
MEASUREMENTS OF AUSTRALIAN ABUTMENT LOADS
The project measured changes in vertical stress across (andwithin) chain pillars at six collieries to determine whether theALPS approximations should be refined. Three sites were lo-cated in the Bowen Basin Coalfield in Queensland (Central,Crinum, and Kenmare Collieries), two were in the NewcastleCoalfield (Newstan and West Wallsend Collieries), and one wasat West Cliff Colliery in the Southern Coalfield. Each mon-itoring site included an array of hydraulic stress cells (HSCs)generally located at midseam height to measure the changes invertical stress. Most sites also included extensometers tomonitor roof and rib performance. A general instrumentationlayout is shown in figure 3.
The HSC used in this project is a modification of theborehole-platened flatjack developed by the former USBM.The HSC was developed, calibrated, and tested by MincadSystems Pty. Ltd. [1997]. The HSC consists of a stainless steelbladder into which hydraulic fluid is pumped via tubingextending along the borehole. The bladder is encased betweentwo steel platens that are forced against the borehole wall as the
bladder is pumped up.As with every stress measurement instrument, proper cali-
bration is important. Mincad Systems provided two calibrationformulas based on its research with the HSC. The formula usedin this project employs a calibration factor K ' 1.0 for a stressincrease of #5 MPa and K ' 1.3 for that portion of an increaseabove 5 MPa. Because ALPS is a comparative chain pillar de-sign tool, it is not critical which calibration method is usedas long as the method is consistent from site to site.
The six sites add considerably to the ALPS abutment loaddatabase. They include a much wider range of cover depths andwidth-to-depth ratios than the original U.S. data. There is alsomuch more variety in the geologic environments. In addition,because the stress readings could be made remotely, monitoringwas possible subsequent to the passing of the second longwall

37
Figure 3.—Instrumentation layout at a typical stress measure-ment site.
face. Of the 16 original U.S. panels, there were sufficient datato characterize the side abutment load in only 6, and only onepanel provided data on the tailgate abutment factor. In contrast,data on both the side and tailgate loads were obtained from allsix Australian monitoring sites.
At the Australian sites, entry width and height ranged from4.8 to 5.2 m and 2.5 to 3.6 m, respectively. Pillar width andlength (rib to rib) ranged from 26 to 40 m and 95 to 125 m,respectively; cover depths varied from 130 to 475 m. Due tothe relatively high length-to-width ratio of Australian chainpillars (i.e., extracted crosscut coal <5%), a plane strain or two-dimensional loading analysis is common in Australia and wasconsidered appropriate by the Australian researchers. Further-more, the Australian researchers recognized that the location ofthe stress cells within the pillar would in all probability affectthe measured vertical stress changes. In placing the cells neara cut-through rather than across the longitudinal center of thechain pillar, the monitoring exercises were viewed as recordingthe loading behavior of a thin, two-dimensional slice of thepillar near a critical location during its "active life."
The ALPS loading parameters account for the extracted coalwithin the cut-throughs. Therefore, the abutment angles re-ported by the ACARP project [Colwell 1998] would be slightlydifferent if the load had been addressed in the same manner asthe U.S. field measurements in back-calculating the abutmentangles. However, the end effect on the design chain pillarwidth is negligible.
Measurements of the main gate side abutment loading areused to calculate the abutment angle; measurements of thetailgate abutment (when longwall 2 is parallel with the instru-ments) are used to calculate the tailgate abutment factors.Examples of the data obtained from two of the sites are shown
in figure 4. The results from all six monitoring sites are sum-marized in table 1 and figure 5 (along with the U.S. data).
The measurements of the abutment angle from the threeQueensland mines and from Newstan Colliery clearly fall with-in the range of the U.S. data. However, the abutment anglescalculated for the two deepest mines, West Wallsend and WestCliff, are the smallest of any in the database. The overburdenat these two mines (and at Newstan Colliery) also contains themassive sandstone and sandstone/conglomerate strata com-monly associated with the Newcastle and Southern Coalfields.The low width-to-depth ratio, along with the strong overburden,may be affecting the caving characteristics of the gob.
Table 1 also shows two sets of tailgate abutment factors.The first set was obtained by dividing the measured tailgateloading by the measured main gate (side abutment) loading.The second set, which is the one used in the U.S. version ofALPS, is obtained by dividing the measured tailgate load (ad-jacent to the T-junction) by the calculated side abutment loadusing an abutment angle of $ ' 21°. The one U.S. measurementfound this second tailgate abutment factor to be 1.7. TheAustralian data in table 1 show a high variability, with the meanat 1.3 in relation to an ALPS-style analysis.
Figure 6 plots the development of the change in load duringtailgate loading (as a multiple of the side abutment) against faceposition. It clearly indicates that the nature of the loading be-havior at Central, Crinum, and Kenmare Collieries closely ap-proximates that proposed by ALPS. However, the tailgateloading behavior at Newstan Colliery and particularly at WestWallsend Colliery reveals that the double goaf load is sig-nificantly greater than twice the measured main gate side abut-ment load. It is likely that West Cliff would have behaved in amanner similar to Newstan if the cabling and/or cells had notbecome inoperable with the second longwall face only 5 m pastthe instrumentation site.
The field data associated with Newstan, West Wallsend, andWest Cliff Collieries clearly suggest that a much greater portionof the main gate abutment load is distributed onto the adjacentunmined longwall panel than calculated on theoretical grounds(see figure 2).
Although the double goaf loading condition could not bemeasured at West Wallsend Colliery, it would seem that thebulk of the tailgate load manifests itself within that distance100 m outby of the face. There are distinct increases in the rateof loading at approximately 70 m and again at 20 m outby of theface. This correlates well with the observed tailgate conditionand strata behavior.
In contrast to West Wallsend Colliery, the bulk of the tail-gate load at Newstan Colliery manifests itself after the passageof the longwall face. Both Newstan and West Wallsend Col-lieries have experienced greater difficulties with regard to bothgate road and face control issues when massive sandstone/conglomerate channels are within 0 to 30 m of the mining hor-izon. Face width optimization has played a critical role inalleviating the face control difficulties.
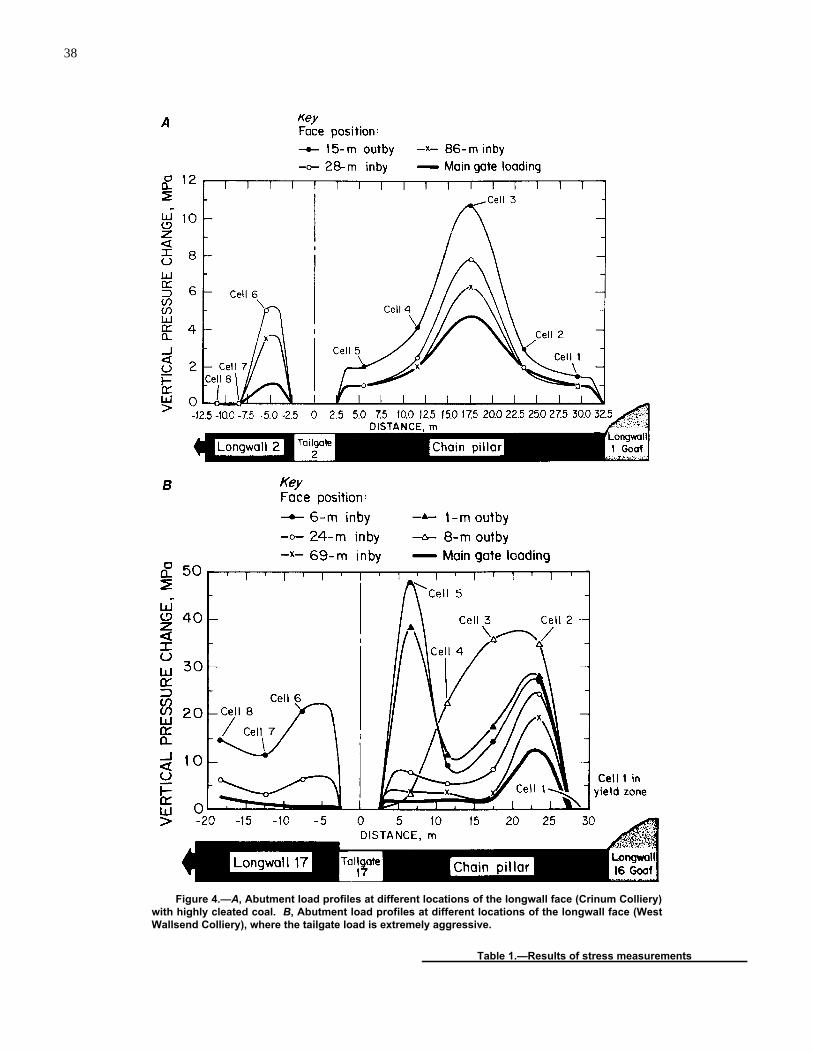
38
Figure 4.—A, Abutment load profiles at different locations of the longwall face (Crinum Colliery)with highly cleated coal. B, Abutment load profiles at different locations of the longwall face (WestWallsend Colliery), where the tailgate load is extremely aggressive.
Table 1.—Results of stress measurements
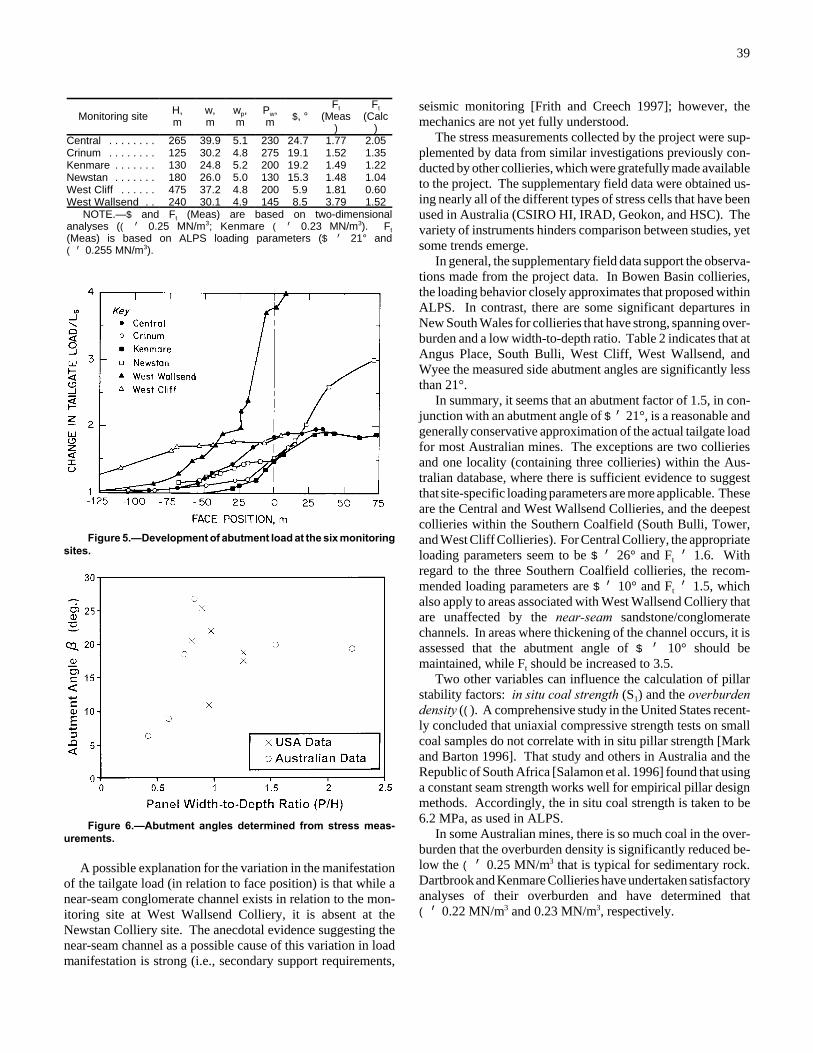
39
Figure 5.—Development of abutment load at the six monitoringsites.
Figure 6.—Abutment angles determined from stress meas-urements.
Monitoring siteH,m
w,m
wp,m
Pw,m $, °
Ft
(Meas)
Ft
(Calc)
Central . . . . . . . . 265 39.9 5.1 230 24.7 1.77 2.05Crinum . . . . . . . . 125 30.2 4.8 275 19.1 1.52 1.35Kenmare . . . . . . . 130 24.8 5.2 200 19.2 1.49 1.22Newstan . . . . . . . 180 26.0 5.0 130 15.3 1.48 1.04West Cliff . . . . . . 475 37.2 4.8 200 5.9 1.81 0.60West Wallsend . . 240 30.1 4.9 145 8.5 3.79 1.52
NOTE.—$ and Ft (Meas) are based on two-dimensionalanalyses (( ' 0.25 MN/m3; Kenmare ( ' 0.23 MN/m3). Ft
(Meas) is based on ALPS loading parameters ($ ' 21° and( ' 0.255 MN/m3).
A possible explanation for the variation in the manifestationof the tailgate load (in relation to face position) is that while anear-seam conglomerate channel exists in relation to the mon-itoring site at West Wallsend Colliery, it is absent at theNewstan Colliery site. The anecdotal evidence suggesting thenear-seam channel as a possible cause of this variation in loadmanifestation is strong (i.e., secondary support requirements,
seismic monitoring [Frith and Creech 1997]; however, themechanics are not yet fully understood.
The stress measurements collected by the project were sup-plemented by data from similar investigations previously con-ducted by other collieries, which were gratefully made availableto the project. The supplementary field data were obtained us-ing nearly all of the different types of stress cells that have beenused in Australia (CSIRO HI, IRAD, Geokon, and HSC). Thevariety of instruments hinders comparison between studies, yetsome trends emerge.
In general, the supplementary field data support the observa-tions made from the project data. In Bowen Basin collieries,the loading behavior closely approximates that proposed withinALPS. In contrast, there are some significant departures inNew South Wales for collieries that have strong, spanning over-burden and a low width-to-depth ratio. Table 2 indicates that atAngus Place, South Bulli, West Cliff, West Wallsend, andWyee the measured side abutment angles are significantly lessthan 21°.
In summary, it seems that an abutment factor of 1.5, in con-junction with an abutment angle of $ ' 21°, is a reasonable andgenerally conservative approximation of the actual tailgate loadfor most Australian mines. The exceptions are two collieriesand one locality (containing three collieries) within the Aus-tralian database, where there is sufficient evidence to suggestthat site-specific loading parameters are more applicable. Theseare the Central and West Wallsend Collieries, and the deepestcollieries within the Southern Coalfield (South Bulli, Tower,and West Cliff Collieries). For Central Colliery, the appropriateloading parameters seem to be $ ' 26° and Ft ' 1.6. Withregard to the three Southern Coalfield collieries, the recom-mended loading parameters are $ ' 10° and Ft ' 1.5, whichalso apply to areas associated with West Wallsend Colliery thatare unaffected by the near-seam sandstone/conglomeratechannels. In areas where thickening of the channel occurs, it isassessed that the abutment angle of $ ' 10° should bemaintained, while Ft should be increased to 3.5.
Two other variables can influence the calculation of pillarstability factors: in situ coal strength (S1) and the overburdendensity ((). A comprehensive study in the United States recent-ly concluded that uniaxial compressive strength tests on smallcoal samples do not correlate with in situ pillar strength [Markand Barton 1996]. That study and others in Australia and theRepublic of South Africa [Salamon et al. 1996] found that usinga constant seam strength works well for empirical pillar designmethods. Accordingly, the in situ coal strength is taken to be6.2 MPa, as used in ALPS.
In some Australian mines, there is so much coal in the over-burden that the overburden density is significantly reduced be-low the ( ' 0.25 MN/m3 that is typical for sedimentary rock.Dartbrook and Kenmare Collieries have undertaken satisfactoryanalyses of their overburden and have determined that( ' 0.22 MN/m3 and 0.23 MN/m3, respectively.

40
Table 2.—Supplemental stress measurements from other Australian mines
Site details Reference Cell type Cell position Remarks N, ° Ft
(Meas)Angus Place longwall 12 . . . . . . Clough [1989] . . . . . . . . . . . . . . CSIRO HI . . In roof . . . . . . Author indicates vertical stress increase small; may be
affected by clay bands within roof strata.5.5 —
Central longwalls 301-302 . . . . . Wardle and Klenowski [1988] . . IRAD . . . . . . In seam . . . . . Satisfactory results from which to interpret main gate and tailgate loading.
26.8 1.48
Cook longwalls 5-6 . . . . . . . . . . Gale and Matthews [1992] . . . . CSIRO HI . . In roof . . . . . . Satisfactory results from which to interpret main gate and tailgate loading.
38.0 1.31
Ellalong longwall 1 . . . . . . . . . . Wold and Pala [1986] . . . . . . . . IRAD . . . . . . In seam . . . . . Satisfactory results from which to interpret main gate loading for barrier and adjacent development pillars.
17.2 —
Ellalong longwall 1 . . . . . . . . . . Wold and Pala [1986] . . . . . . . . IRAD . . . . . . In seam . . . . . Satisfactory results so as to interpret main gate loading for chain pillar.
9.8 —
Kenmare longwall 1B1 . . . . . . . . Gordon [1998] . . . . . . . . . . . . . . CSIRO HI . . In roof . . . . . . Satisfactory results from which to interpret main gate loading condition.
54.2 —
North Goonyella longwalls 3-4 . . Nemcik and Fabjanczyk [1997] . CSIRO HI . . In roof . . . . . . Only 2 of 4 cells functioned reliably such that a subjective assessment of the stress profiles was required.
31.5 1.2
South Bulli longwalls 504-505 . . Mincad Systems Pty. Ltd. [1997] IRAD and hydraulic.
In seam . . . . . Satisfactory results from which to interpret main gate and tailgate loading.
8.8 1.47
Ulan longwalls A and B . . . . . . . Mills [1993] . . . . . . . . . . . . . . . . CSIRO HI . . In roof . . . . . . Satisfactory results from which to interpret main gate and tailgate loading.
35.3 1.09
West Cliff longwall 1 . . . . . . . . . Skybey [1984] . . . . . . . . . . . . . . IRAD . . . . . . In seam . . . . . 3-heading with large/small pillar combination; subjective assessment of main gate stress profile was required.
4.9 —
West Cliff longwalls 12-13 . . . . . Gale and Matthews [1992] . . . . CSIRO HI . . In roof . . . . . . 3-heading with large/small pillar combination, interpretation of main gate and tailgate loading.
0.9 1.52
West Wallsend longwall 12 . . . . Stewart [1996] . . . . . . . . . . . . . . Hydraulic . . . In seam . . . . . Satisfactory results from which to interpret main gate loading condition.
5.2
Wyee longwall 5 . . . . . . . . . . . . Seedsman and Gordon [1991] . Geokon . . . . In seam . . . . . Satisfactory results from which to interpret main gate loading condition.
6.2-8.8
1SCT operations stress monitoring exercise with HI Cells located in roof above this project's hydraulic stress cell site.
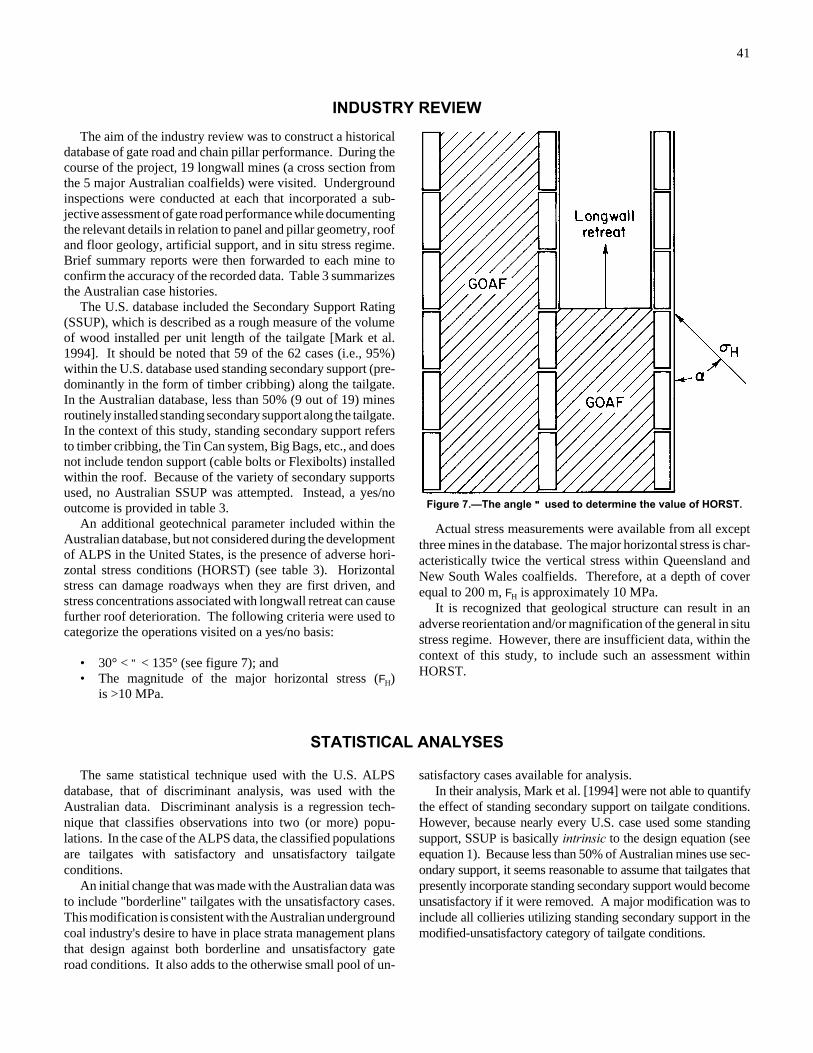
41
Figure 7.—The angle "" used to determine the value of HORST.
INDUSTRY REVIEW
The aim of the industry review was to construct a historicaldatabase of gate road and chain pillar performance. During thecourse of the project, 19 longwall mines (a cross section fromthe 5 major Australian coalfields) were visited. Undergroundinspections were conducted at each that incorporated a sub-jective assessment of gate road performance while documentingthe relevant details in relation to panel and pillar geometry, roofand floor geology, artificial support, and in situ stress regime.Brief summary reports were then forwarded to each mine toconfirm the accuracy of the recorded data. Table 3 summarizesthe Australian case histories.
The U.S. database included the Secondary Support Rating(SSUP), which is described as a rough measure of the volumeof wood installed per unit length of the tailgate [Mark et al.1994]. It should be noted that 59 of the 62 cases (i.e., 95%)within the U.S. database used standing secondary support (pre-dominantly in the form of timber cribbing) along the tailgate.In the Australian database, less than 50% (9 out of 19) minesroutinely installed standing secondary support along the tailgate.In the context of this study, standing secondary support refersto timber cribbing, the Tin Can system, Big Bags, etc., and doesnot include tendon support (cable bolts or Flexibolts) installedwithin the roof. Because of the variety of secondary supportsused, no Australian SSUP was attempted. Instead, a yes/nooutcome is provided in table 3.
An additional geotechnical parameter included within theAustralian database, but not considered during the developmentof ALPS in the United States, is the presence of adverse hori-zontal stress conditions (HORST) (see table 3). Horizontalstress can damage roadways when they are first driven, andstress concentrations associated with longwall retreat can causefurther roof deterioration. The following criteria were used tocategorize the operations visited on a yes/no basis:
• 30° < " < 135° (see figure 7); and• The magnitude of the major horizontal stress (FH)
is >10 MPa.
Actual stress measurements were available from all exceptthree mines in the database. The major horizontal stress is char-acteristically twice the vertical stress within Queensland andNew South Wales coalfields. Therefore, at a depth of coverequal to 200 m, FH is approximately 10 MPa.
It is recognized that geological structure can result in anadverse reorientation and/or magnification of the general in situstress regime. However, there are insufficient data, within thecontext of this study, to include such an assessment withinHORST.
STATISTICAL ANALYSES
The same statistical technique used with the U.S. ALPSdatabase, that of discriminant analysis, was used with theAustralian data. Discriminant analysis is a regression tech-nique that classifies observations into two (or more) popu-lations. In the case of the ALPS data, the classified populationsare tailgates with satisfactory and unsatisfactory tailgateconditions.
An initial change that was made with the Australian data wasto include "borderline" tailgates with the unsatisfactory cases.This modification is consistent with the Australian undergroundcoal industry's desire to have in place strata management plansthat design against both borderline and unsatisfactory gateroad conditions. It also adds to the otherwise small pool of un-
satisfactory cases available for analysis.In their analysis, Mark et al. [1994] were not able to quantify
the effect of standing secondary support on tailgate conditions.However, because nearly every U.S. case used some standingsupport, SSUP is basically intrinsic to the design equation (seeequation 1). Because less than 50% of Australian mines use sec-ondary support, it seems reasonable to assume that tailgates thatpresently incorporate standing secondary support would becomeunsatisfactory if it were removed. A major modification was toinclude all collieries utilizing standing secondary support in themodified-unsatisfactory category of tailgate conditions.
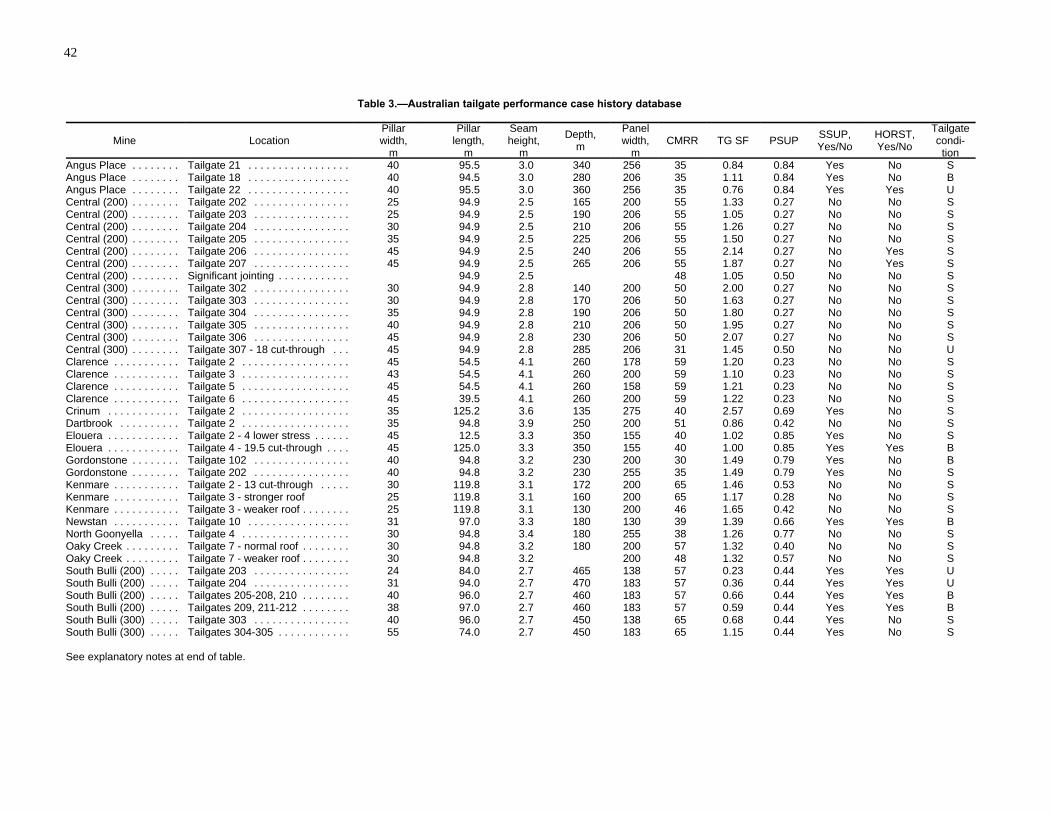
42
Table 3.—Australian tailgate performance case history database
Mine Location Pillar width,
m
Pillar length,
m
Seam height,
m
Depth, m
Panelwidth,
mCMRR TG SF PSUP
SSUP,Yes/No
HORST,Yes/No
Tailgatecondi-tion
Angus Place . . . . . . . . Tailgate 21 . . . . . . . . . . . . . . . . . 40 95.5 3.0 340 256 35 0.84 0.84 Yes No SAngus Place . . . . . . . . Tailgate 18 . . . . . . . . . . . . . . . . . 40 94.5 3.0 280 206 35 1.11 0.84 Yes No BAngus Place . . . . . . . . Tailgate 22 . . . . . . . . . . . . . . . . . 40 95.5 3.0 360 256 35 0.76 0.84 Yes Yes UCentral (200) . . . . . . . . Tailgate 202 . . . . . . . . . . . . . . . . 25 94.9 2.5 165 200 55 1.33 0.27 No No SCentral (200) . . . . . . . . Tailgate 203 . . . . . . . . . . . . . . . . 25 94.9 2.5 190 206 55 1.05 0.27 No No SCentral (200) . . . . . . . . Tailgate 204 . . . . . . . . . . . . . . . . 30 94.9 2.5 210 206 55 1.26 0.27 No No SCentral (200) . . . . . . . . Tailgate 205 . . . . . . . . . . . . . . . . 35 94.9 2.5 225 206 55 1.50 0.27 No No SCentral (200) . . . . . . . . Tailgate 206 . . . . . . . . . . . . . . . . 45 94.9 2.5 240 206 55 2.14 0.27 No Yes SCentral (200) . . . . . . . . Tailgate 207 . . . . . . . . . . . . . . . . 45 94.9 2.5 265 206 55 1.87 0.27 No Yes SCentral (200) . . . . . . . . Significant jointing . . . . . . . . . . . . 94.9 2.5 48 1.05 0.50 No No SCentral (300) . . . . . . . . Tailgate 302 . . . . . . . . . . . . . . . . 30 94.9 2.8 140 200 50 2.00 0.27 No No SCentral (300) . . . . . . . . Tailgate 303 . . . . . . . . . . . . . . . . 30 94.9 2.8 170 206 50 1.63 0.27 No No SCentral (300) . . . . . . . . Tailgate 304 . . . . . . . . . . . . . . . . 35 94.9 2.8 190 206 50 1.80 0.27 No No SCentral (300) . . . . . . . . Tailgate 305 . . . . . . . . . . . . . . . . 40 94.9 2.8 210 206 50 1.95 0.27 No No SCentral (300) . . . . . . . . Tailgate 306 . . . . . . . . . . . . . . . . 45 94.9 2.8 230 206 50 2.07 0.27 No No SCentral (300) . . . . . . . . Tailgate 307 - 18 cut-through . . . 45 94.9 2.8 285 206 31 1.45 0.50 No No UClarence . . . . . . . . . . . Tailgate 2 . . . . . . . . . . . . . . . . . . 45 54.5 4.1 260 178 59 1.20 0.23 No No SClarence . . . . . . . . . . . Tailgate 3 . . . . . . . . . . . . . . . . . . 43 54.5 4.1 260 200 59 1.10 0.23 No No SClarence . . . . . . . . . . . Tailgate 5 . . . . . . . . . . . . . . . . . . 45 54.5 4.1 260 158 59 1.21 0.23 No No SClarence . . . . . . . . . . . Tailgate 6 . . . . . . . . . . . . . . . . . . 45 39.5 4.1 260 200 59 1.22 0.23 No No SCrinum . . . . . . . . . . . . Tailgate 2 . . . . . . . . . . . . . . . . . . 35 125.2 3.6 135 275 40 2.57 0.69 Yes No SDartbrook . . . . . . . . . . Tailgate 2 . . . . . . . . . . . . . . . . . . 35 94.8 3.9 250 200 51 0.86 0.42 No No SElouera . . . . . . . . . . . . Tailgate 2 - 4 lower stress . . . . . . 45 12.5 3.3 350 155 40 1.02 0.85 Yes No SElouera . . . . . . . . . . . . Tailgate 4 - 19.5 cut-through . . . . 45 125.0 3.3 350 155 40 1.00 0.85 Yes Yes BGordonstone . . . . . . . . Tailgate 102 . . . . . . . . . . . . . . . . 40 94.8 3.2 230 200 30 1.49 0.79 Yes No BGordonstone . . . . . . . . Tailgate 202 . . . . . . . . . . . . . . . . 40 94.8 3.2 230 255 35 1.49 0.79 Yes No SKenmare . . . . . . . . . . . Tailgate 2 - 13 cut-through . . . . . 30 119.8 3.1 172 200 65 1.46 0.53 No No SKenmare . . . . . . . . . . . Tailgate 3 - stronger roof 25 119.8 3.1 160 200 65 1.17 0.28 No No SKenmare . . . . . . . . . . . Tailgate 3 - weaker roof . . . . . . . . 25 119.8 3.1 130 200 46 1.65 0.42 No No SNewstan . . . . . . . . . . . Tailgate 10 . . . . . . . . . . . . . . . . . 31 97.0 3.3 180 130 39 1.39 0.66 Yes Yes BNorth Goonyella . . . . . Tailgate 4 . . . . . . . . . . . . . . . . . . 30 94.8 3.4 180 255 38 1.26 0.77 No No SOaky Creek . . . . . . . . . Tailgate 7 - normal roof . . . . . . . . 30 94.8 3.2 180 200 57 1.32 0.40 No No SOaky Creek . . . . . . . . . Tailgate 7 - weaker roof . . . . . . . . 30 94.8 3.2 200 48 1.32 0.57 No No SSouth Bulli (200) . . . . . Tailgate 203 . . . . . . . . . . . . . . . . 24 84.0 2.7 465 138 57 0.23 0.44 Yes Yes USouth Bulli (200) . . . . . Tailgate 204 . . . . . . . . . . . . . . . . 31 94.0 2.7 470 183 57 0.36 0.44 Yes Yes USouth Bulli (200) . . . . . Tailgates 205-208, 210 . . . . . . . . 40 96.0 2.7 460 183 57 0.66 0.44 Yes Yes BSouth Bulli (200) . . . . . Tailgates 209, 211-212 . . . . . . . . 38 97.0 2.7 460 183 57 0.59 0.44 Yes Yes BSouth Bulli (300) . . . . . Tailgate 303 . . . . . . . . . . . . . . . . 40 96.0 2.7 450 138 65 0.68 0.44 Yes No SSouth Bulli (300) . . . . . Tailgates 304-305 . . . . . . . . . . . . 55 74.0 2.7 450 183 65 1.15 0.44 Yes No S
See explanatory notes at end of table.

43
Table 3.—Australian tailgate performance case history database—Continued
Mine Location Pillar width,
m
Pillar length,
m
Seam height,
m
Depth, m
Panelwidth,
mCMRR TG SF PSUP
SSUP,Yes/No
HORST,Yes/No
Tailgatecondi-tion
South Bulli (300) . . . . . Tailgates 308-309 . . . . . . . . . . . . 38 97.0 2.7 410 185 65 0.68 0.44 Yes No SSouthern (600) . . . . . . Tailgate 606 . . . . . . . . . . . . . . . . 30 94.8 2.8 170 200 60 1.62 0.26 No No SSouthern (600) . . . . . . Tailgates 607-608 . . . . . . . . . . . . 35 94.8 2.8 190 200 60 1.79 0.26 No No SSouthern (700) . . . . . . Tailgate 702 . . . . . . . . . . . . . . . . 30 94.8 2.8 160 250 60 1.79 0.26 No No SSpringvale . . . . . . . . . . Tailgate 402 . . . . . . . . . . . . . . . . 45 95.2 2.7 325 250 35 1.22 0.63 Yes Yes BTower . . . . . . . . . . . . . Tailgate 14 . . . . . . . . . . . . . . . . . 45 66.0 3.2 500 203 40 0.59 1.26 No No SUlan . . . . . . . . . . . . . . Tailgate 11 . . . . . . . . . . . . . . . . . 30 94.8 3.1 145 255 50 1.65 0.28 No No SWest Cliff . . . . . . . . . . Tailgate 22 . . . . . . . . . . . . . . . . . 42 97.2 2.5 480 200 48 0.69 0.49 Yes No SWest Wallsend . . . . . . Tailgate 13 - 4.5 cut-through . . . . 35 97.1 2.9 240 145 40 1.24 0.75 Yes Yes UWest Wallsend . . . . . . Tailgate 13 - 7 cut-through . . . . . 35 97.1 2.9 255 233 40 1.11 0.75 No Yes SWest Wallsend . . . . . . Tailgates 14-16 . . . . . . . . . . . . . . 32 110.1 2.9 250 145 40 0.99 0.75 Yes Yes UWest Wallsend . . . . . . Tailgate 17 - 6 cut-through . . . . . 35 110.1 3.2 250 145 40 1.08 0.75 Yes Yes BWyee . . . . . . . . . . . . . Tailgate 13 . . . . . . . . . . . . . . . . . 35 102.0 2.8 220 163 45 1.43 0.52 No Yes B
Mean . . . . . . . . . . . . . . . . . . . . . . . . . . . . . . . . . . . . . . . . 31.2 94.5 3.0 266 200 49.52 1.27 0.49 Standard deviation . . . . . . . . . . . . . . . . . . . . . . . . . . . . . . 7.2 16.9 0.4 106 33 10.04 0.47 0.24S Satisfactory. B Borderline. U Unsatisfactory.

44
Figure 8.—The final design equation relating the CMRR to the TG SF.
Two cases posed additional complications. Tower Collierydoes not incorporate standing secondary support, yet itsPSUP (1.26) is 3.2 standard deviations above the Australianmean. Therefore, Tower Colliery was also included within themodified-unsatisfactory tailgate category. Crinum uses standingsecondary support, but it is a relatively new operation, and itseems that there has been an understandable, but nonethelesshighly conservative approach to its geotechnical design. Toinclude Crinum within the modified-unsatisfactory group wouldhave been overly conservative, so it was excluded from thedatabase entirely.
Therefore, the final database includes 50 case histories with29 modified satisfactory and 21 modified-unsatisfactory cases.Numerous analyses were conducted to determine the best designequation. Ultimately, the most successful design equationrelates the required TG SF to the CMRR, as shown in figure 8:
TG SF ' 2.67 & 0.029 CMRR (3)
Equation 3 correctly predicted the outcome of all exceptseven case histories, for a success rate of 86%. Comparingequation 3 to the U.S. design equation (equation 1), it may beseen that the TG SF is generally more conservative than theALPS SF for weaker roof, but the TG SF decreases more rapid-ly than the ALPS SF as the roof becomes stronger.
Another strong relationship that was evident in the casehistories was between the primary support and the roof quality.Figure 9 plots the PSUP against the CMRR, and the best-fitregression is of the following form:
PSUP ' 1.35 & 0.0175 CMRR (4a)
It seems that Australian mine operators have intrinsicallyadapted their primary support patterns to the roof conditionsand operational requirements. Mark et al. [1994] reached asimilar conclusion for the United States.
Upper- and lower-boundary equations (4b and 4c, respec-tively) relating CMRR to PSUP have also been proposed andare illustrated in figure 8:
PSUPU ' 1.45 & 0.0175 CMRR (4b)
PSUPL ' 1.24 & 0.0175 CMRR (4c)
Equation 4c may be applicable, for example, when the mininglayout is not subject to adverse horizontal stress conditionsand/or standing secondary support is planned as part of thecolliery's strata management plan.
Mark et al. [1994] also found a strong correlation betweenthe CMRR and the entry width. No such correlation was seenhere.
It is interesting to note some similarities and differences be-tween the U.S. and Australian databases. For example, overallroof quality seems to be reasonably similar in the two countries.The mean CMRR in the United States is 53.7 with a standarddeviation (SD) of 13.9; this compares with an Australian meanof 49.5 and SD ' 10.0. However, the mean Australian PSUPis 0.49 (SD ' 0.23), which is approximately twice that of theU.S. database.
Studies by Mark [1998] and Mark et al. [1998a] suggestthat the horizontal stress levels in the two countries are com-parable. It seems that philosophical differences are more likelyresponsible for the different levels of primary support. Most
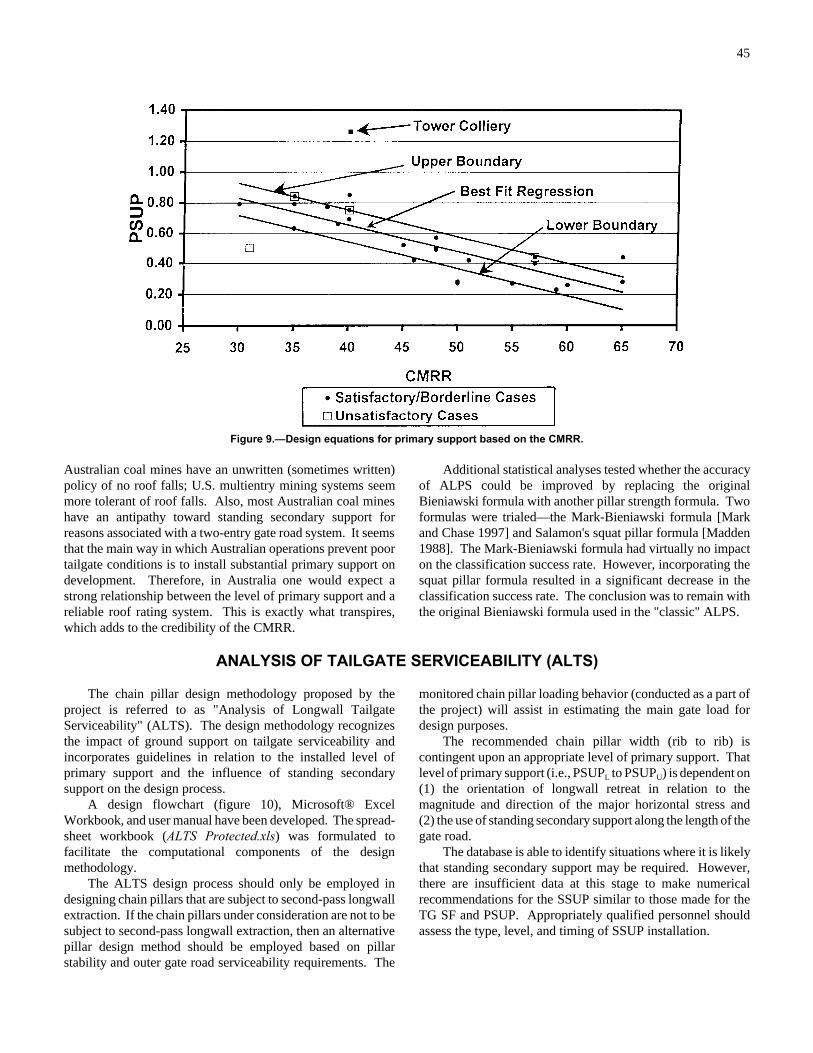
45
Figure 9.—Design equations for primary support based on the CMRR.
Australian coal mines have an unwritten (sometimes written)policy of no roof falls; U.S. multientry mining systems seemmore tolerant of roof falls. Also, most Australian coal mineshave an antipathy toward standing secondary support forreasons associated with a two-entry gate road system. It seemsthat the main way in which Australian operations prevent poortailgate conditions is to install substantial primary support ondevelopment. Therefore, in Australia one would expect astrong relationship between the level of primary support and areliable roof rating system. This is exactly what transpires,which adds to the credibility of the CMRR.
Additional statistical analyses tested whether the accuracyof ALPS could be improved by replacing the originalBieniawski formula with another pillar strength formula. Twoformulas were trialed—the Mark-Bieniawski formula [Markand Chase 1997] and Salamon's squat pillar formula [Madden1988]. The Mark-Bieniawski formula had virtually no impacton the classification success rate. However, incorporating thesquat pillar formula resulted in a significant decrease in theclassification success rate. The conclusion was to remain withthe original Bieniawski formula used in the "classic" ALPS.
ANALYSIS OF TAILGATE SERVICEABILITY (ALTS)
The chain pillar design methodology proposed by theproject is referred to as "Analysis of Longwall TailgateServiceability" (ALTS). The design methodology recognizesthe impact of ground support on tailgate serviceability andincorporates guidelines in relation to the installed level ofprimary support and the influence of standing secondarysupport on the design process.
A design flowchart (figure 10), Microsoft® ExcelWorkbook, and user manual have been developed. The spread-sheet workbook (ALTS Protected.xls) was formulated tofacilitate the computational components of the designmethodology.
The ALTS design process should only be employed indesigning chain pillars that are subject to second-pass longwallextraction. If the chain pillars under consideration are not to besubject to second-pass longwall extraction, then an alternativepillar design method should be employed based on pillarstability and outer gate road serviceability requirements. The
monitored chain pillar loading behavior (conducted as a part ofthe project) will assist in estimating the main gate load fordesign purposes.
The recommended chain pillar width (rib to rib) iscontingent upon an appropriate level of primary support. Thatlevel of primary support (i.e., PSUPL to PSUPU) is dependent on(1) the orientation of longwall retreat in relation to themagnitude and direction of the major horizontal stress and(2) the use of standing secondary support along the length of thegate road.
The database is able to identify situations where it is likelythat standing secondary support may be required. However,there are insufficient data at this stage to make numericalrecommendations for the SSUP similar to those made for theTG SF and PSUP. Appropriately qualified personnel shouldassess the type, level, and timing of SSUP installation.
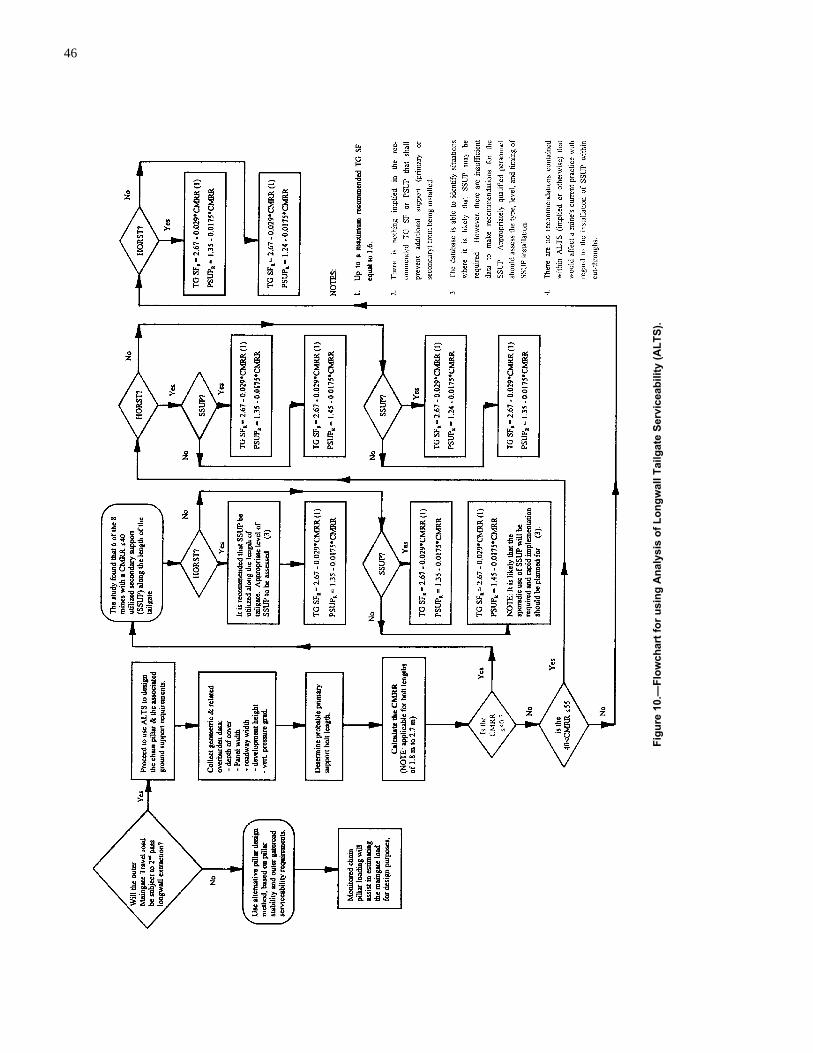
46
Fig
ure
10.
—F
low
char
t fo
r u
sin
g A
nal
ysis
of
Lo
ng
wal
l Tai
lgat
e S
ervi
ceab
ility
(A
LT
S).
47
CONCLUSIONS
The following main goals of the project were achieved:
• To establish a chain pillar design methodology that haswidespread application to Australian longwall operations; and
• To quantify the probable variance in the chain pillarloading environment between collieries and mining localitiesand to incorporate this variance within the design methodology.
In addition, the study has been able to propose definitiveguidelines with regard to the installed level of primary supportand to conduct a subjective analysis regarding the impact ofstanding secondary support on the design process. This pro-vides the Australian coal industry with a truly integrated designmethodology with regard to tailgate serviceability that has beenable to address the main factors controlled by the mine operator.
The initial benefit from this project is that mine managersand strata control engineers will be able to identify where chainpillars can be reduced in size and where increases may benecessary. They can make these decisions with the confidencethat a credible Australian database is the foundation for the de-sign methodology.
This project has identified that there is an opportunity forsome mines that do not currently incorporate the routine in-stallation of secondary support along their tailgate to makesignificant reductions in chain pillar width. It is an operationaldecision whether a reduction in pillar width is more or lessbeneficial to production output and costs than the introductionof secondary support along the length of the tailgate. Thisproject simply highlighted that the opportunity exists.
The chain pillar monitoring exercises conducted at col-lieries under deep cover or with strong roof have found that theabutment load may be overestimated by using a genericabutment angle of $ ' 21°. However, the aggressive tailgateloading behavior monitored at West Wallsend Colliery (seefigure 5) provided a warning, which emphasized the need to usegreat caution before making any sweeping changes to a provenchain pillar design tool. Although the way in which the loadmanifested itself at West Wallsend was significantly differentfrom that proposed by ALPS, the resultant tailgate load wasquite similar.
REFERENCES
Clough AJ [1989]. Monitoring of chain pillar behavior at Angus PlaceColliery. Strata Control Technology Pty. Ltd. report No. SCT9005 to NewcomCollieries Pty. Ltd, November.
Colwell MG [1998]. Chain pillar design - calibration of ALPS. Aus-tralian Coal Association Research Program, final report—ACARP projectC6036.
Frith RC, Creech M [1997]. Face width optimization in both longwalland shortwall caving environments. Australian Coal Association ResearchProgram, final report–ACARP project C5015.
Frith RC, Thomas RG [1995]. Roadway roof stability and its attainmentthrough pretensioned bolting. Australian Coal Association Research Program,ACARP project report 3032.
Gale WJ, Matthews SM [1992]. Stress control methods for optimizeddevelopment and extraction methods. National Energy Research, Developmentand Demonstration Program, final report C1301.
Gordon N [1998]. Geological and geotechnical aspects of the develop-ment and extraction of Aries Seam Longwalls 1A and 1B, Kenmare Colliery.Internal report for South Blackwater Coal Ltd.
Madden BJ [1988]. Squat pillar design. Coal Int Jan:6-9.Mark C [1990]. Pillar design methods for longwall mining. Pittsburgh,
PA: U.S. Department of the Interior, Bureau of Mines, IC 9247.Mark C [1992]. Analysis of longwall pillar stability (ALPS): an update.
In: Proceedings of the Workshop on Coal Pillar Mechanics and Design. Pitts-burgh, PA: U.S. Department of the Interior, Bureau of Mines, IC 9315, pp. 238-249.
Mark C [1998]. Comparison of ground conditions and ground controlpractices in the United States and Australia. In: Peng SS, ed. Proceedings ofthe 17th International Conference on Ground Control in Mining. Morgantown,WV: University of West Virginia, pp. 63-71.
Mark C, Barton TM [1996]. The uniaxial compressive strength of coal:should it be used to design pillars? In: Ozdemir L, Hanna K, Haramy KY,
Peng S, eds. Proceedings of the 15th International Conference on Ground Con-trol in Mining. Golden, CO: Colorado School of Mines, pp. 61-78.
Mark C, Bieniawski ZT [1986]. An empirical method for the design ofchain pillars in longwall mining. In: Proceedings of the 27th U.S. Symposiumon Rock Mechanics. New York, NY: American Institute of Mining, Metal-lurgical, and Petroleum Engineers, pp. 415-422.
Mark C, Chase FE [1997]. Analysis of retreat mining pillar stability(ARMPS). In: Proceedings - New Technology for Ground Control in RetreatMining. Pittsburgh, PA: U.S. Department of Health and Human Services, Pub-lic Health Service, Centers for Disease Control and Prevention, NationalInstitute for Occupational Safety and Health, DHHS (NIOSH) PublicationNo. 97-122, IC 9446, pp. 17-34.
Mark C, Molinda GM [1996]. Rating coal mine roof strength from ex-ploratory drill core. In: Ozdemir L, Hanna K, Haramy KY, Peng S, eds.Proceedings of the 15th International Conference on Ground Control in Mining.Golden, CO: Colorado School of Mines, pp. 415-428.
Mark C, Chase FE, Molinda GM [1994]. Design of longwall gate entrysystems using roof classification. In: New Technology for Longwall GroundControl - Proceedings: U.S. Bureau of Mines Technology Transfer Seminar.Pittsburgh, PA: U.S. Department of the Interior, Bureau of Mines, SP 01-94,pp. 5-17.
Mark C, Mucho TP, Dolinar D [1998a]. Horizontal stress and longwallheadgate ground control. Min Eng 50(1):61-68.
Mark C, Su D, Heasley KA [1998b]. Recent developments in coal pillardesign in the United States. In: Aziz NI, Indraratna B, eds. Proceedings of theInternational Conference on Geomechanics/Ground Control in Mining and Un-derground Construction. Wollongong, New South Wales, Australia: Universityof Wollongong, Vol. 2, pp. 309-324.
Mills KW [1993]. AMIRA pillar strength measurements. Strata ControlTechnology Pty. Ltd. report No. ULA0290B to Ulan Coal Mines, October.
Mincad Systems Pty. Ltd. [1997]. AMIRA Project P396 - Hydraulicstressmeter, final report.
Molinda GM, Mark C [1994]. Coal mine roof rating (CMRR): a practicalrock mass classification for coal mines. Pittsburgh, PA: U.S. Department of the

48
Interior, Bureau of Mines, IC 9387.Nemcik J, Fabjanczyk M [1997]. Virgin stress and stress change
measurements in maingate 3, North Goonyella underground mine. StrataControl Technology Pty. Ltd. report No. NGY1069 to White Mining Ltd.,January.
Salamon MDG, Galvin J, Hocking G, Anderson I [1996]. Coal pillarstrength from back-calculation. Part of a New South Wales Joint Coal BoardResearch Project - Strata Control for Coal Mine Design. Sydney, Australia:University of New South Wales, School of Mines.
Seedsman RW, Gordon N [1991]. Methods to optimise mining operationsaffected by weak claystone materials. NERDCC end-of-grant report - projectNo. 1336.
Skybey G [1984]. Evaluation of the stability of longwall chain pillars atWest Cliff Colliery. Australian Coal Association Research Program, publishedreport 84-19.
Stewart A [1996]. Chain pillar monitoring - West Wallsend Colliery,LW 12 cut-through 11. Coffey Partners International Pty. Ltd. reportNo. Z267/4-AB to Oceanic Coal Australia Ltd., November.
Wardle LJ, Klenowski G [1988]. Rational longwall layout design basedon numerical stress analysis. In: Proceedings of AusIMM - 21st Century HigherProduction Coal Mining Systems—Their Implications, pp. 115-121.
Whittaker B, Frith RC [1987]. Aspects of chain pillar design in relationto longwall mining. Proceedings of the Sixth International Conference onGround Control in Mining. Morgantown, WV: West Virginia University,pp. 172-182.
Wilson AH [1981]. Stress and stability in coal ribsides and pillars. In:Peng SS, ed. Proceedings of the First International Conference on GroundControl in Mining. Morgantown, WV: West Virginia University, pp. 1-12.
Wold MB, Pala J [1986]. Three-dimensional stress changes in pillarsduring longwall retreat at Ellalong Colliery. Commonwealth Scientific andIndustrial Research Organisation (CSIRO) Australia, Division ofGeomechanics, coal mining report No. 65.
EXPERIENCE OF FIELD MEASUREMENT AND COMPUTERSIMULATION METHODS FOR PILLAR DESIGN
By Winton J. Gale, Ph.D.1
49
ABSTRACT
Coal pillar design has been based on generalized formulas of the strength of the coal in a pillar andexperience in localized situations. Stress measurements above and in coal pillars indicate that the actualstrength and deformation of pillars vary much more than predicted by formulas. This variation is due to failureof strata surrounding coal. The pillar strength and deformation of the adjacent roadways is a function of failurein the coal and the strata about the coal. When the pillar is viewed as a system in which failure also occurs inthe strata rather than the coal only, the wide range of pillar strength characteristics found in the UnitedKingdom, United States, Republic of South Africa, Australia, People's Republic of China, Japan, and othercountries are simply variations due to different strata-coal combinations, not different coal strengths.
This paper presents the measured range of pillar strength characteristics and explains the reasons. Methodsto design pillar layouts with regard to the potential strength variations due to the strata strength characteristicssurrounding the seam are also presented.
1Managing director, Strata Control Technology, Wollongong East, New South Wales, Australia.
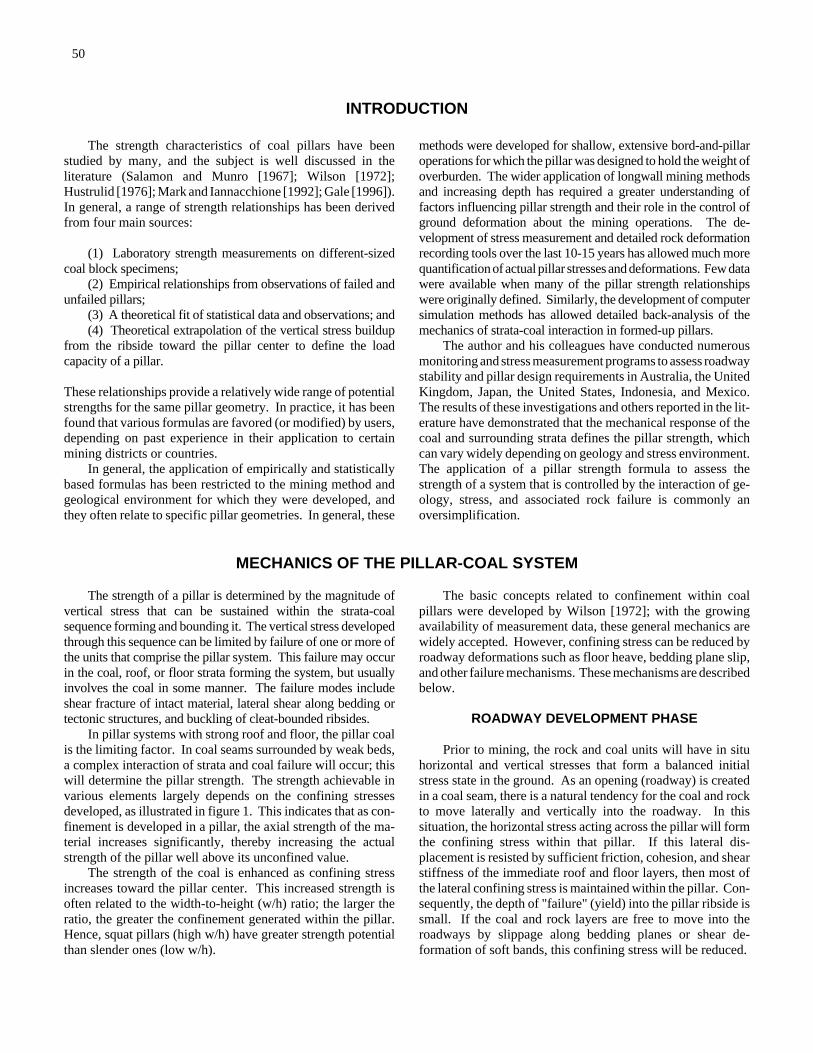
50
INTRODUCTION
The strength characteristics of coal pillars have beenstudied by many, and the subject is well discussed in theliterature (Salamon and Munro [1967]; Wilson [1972];Hustrulid [1976]; Mark and Iannacchione [1992]; Gale [1996]).In general, a range of strength relationships has been derivedfrom four main sources:
(1) Laboratory strength measurements on different-sizedcoal block specimens;
(2) Empirical relationships from observations of failed andunfailed pillars;
(3) A theoretical fit of statistical data and observations; and(4) Theoretical extrapolation of the vertical stress buildup
from the ribside toward the pillar center to define the loadcapacity of a pillar.
These relationships provide a relatively wide range of potentialstrengths for the same pillar geometry. In practice, it has beenfound that various formulas are favored (or modified) by users,depending on past experience in their application to certainmining districts or countries.
In general, the application of empirically and statisticallybased formulas has been restricted to the mining method andgeological environment for which they were developed, andthey often relate to specific pillar geometries. In general, these
methods were developed for shallow, extensive bord-and-pillaroperations for which the pillar was designed to hold the weight ofoverburden. The wider application of longwall mining methodsand increasing depth has required a greater understanding offactors influencing pillar strength and their role in the control ofground deformation about the mining operations. The de-velopment of stress measurement and detailed rock deformationrecording tools over the last 10-15 years has allowed much morequantification of actual pillar stresses and deformations. Few datawere available when many of the pillar strength relationshipswere originally defined. Similarly, the development of computersimulation methods has allowed detailed back-analysis of themechanics of strata-coal interaction in formed-up pillars.
The author and his colleagues have conducted numerousmonitoring and stress measurement programs to assess roadwaystability and pillar design requirements in Australia, the UnitedKingdom, Japan, the United States, Indonesia, and Mexico.The results of these investigations and others reported in the lit-erature have demonstrated that the mechanical response of thecoal and surrounding strata defines the pillar strength, whichcan vary widely depending on geology and stress environment.The application of a pillar strength formula to assess thestrength of a system that is controlled by the interaction of ge-ology, stress, and associated rock failure is commonly anoversimplification.
MECHANICS OF THE PILLAR-COAL SYSTEM
The strength of a pillar is determined by the magnitude ofvertical stress that can be sustained within the strata-coalsequence forming and bounding it. The vertical stress developedthrough this sequence can be limited by failure of one or more ofthe units that comprise the pillar system. This failure may occurin the coal, roof, or floor strata forming the system, but usuallyinvolves the coal in some manner. The failure modes includeshear fracture of intact material, lateral shear along bedding ortectonic structures, and buckling of cleat-bounded ribsides.
In pillar systems with strong roof and floor, the pillar coalis the limiting factor. In coal seams surrounded by weak beds,a complex interaction of strata and coal failure will occur; thiswill determine the pillar strength. The strength achievable invarious elements largely depends on the confining stressesdeveloped, as illustrated in figure 1. This indicates that as con-finement is developed in a pillar, the axial strength of the ma-terial increases significantly, thereby increasing the actualstrength of the pillar well above its unconfined value.
The strength of the coal is enhanced as confining stressincreases toward the pillar center. This increased strength isoften related to the width-to-height (w/h) ratio; the larger theratio, the greater the confinement generated within the pillar.Hence, squat pillars (high w/h) have greater strength potentialthan slender ones (low w/h).
The basic concepts related to confinement within coalpillars were developed by Wilson [1972]; with the growingavailability of measurement data, these general mechanics arewidely accepted. However, confining stress can be reduced byroadway deformations such as floor heave, bedding plane slip,and other failure mechanisms. These mechanisms are describedbelow.
ROADWAY DEVELOPMENT PHASE
Prior to mining, the rock and coal units will have in situhorizontal and vertical stresses that form a balanced initialstress state in the ground. As an opening (roadway) is createdin a coal seam, there is a natural tendency for the coal and rockto move laterally and vertically into the roadway. In thissituation, the horizontal stress acting across the pillar will formthe confining stress within that pillar. If this lateral dis-placement is resisted by sufficient friction, cohesion, and shearstiffness of the immediate roof and floor layers, then most ofthe lateral confining stress is maintained within the pillar. Con-sequently, the depth of "failure" (yield) into the pillar ribside issmall. If the coal and rock layers are free to move into theroadways by slippage along bedding planes or shear de-formation of soft bands, this confining stress will be reduced.

51
Figure 1.CCEffect of confining stress on compressivestrengths of intact and fractured rocks.
Figure 2.CCRapid buildup of vertical stress into the pillarwhere high confining stresses are maintained..
Hence, the depth of failure into the pillar ribside may besignificantly greater.
The geometry of failure in the system and the residualstrength properties of the failure planes will therefore determinethe nature of confining stress adjacent to the ribsides and ex-tending across the pillars. This mechanism determines thedepth of failure into the pillar and the extent of ribside dis-placement during roadway drivage.
PILLAR LOADING BY ABUTMENT STRESSES
Roadways are subjected to an additional phase of loadingduring longwall panel extraction, as front and then side abut-ment pressures are added to the previous (and generally muchsmaller) stress changes induced by roadway excavation. Theseabutment stresses typically considered are predominantly ver-tical in orientation, but can generate additional horizontal (con-fining) stresses (by the Poisson's ratio effect) if there is suf-ficient lateral restraint from the surrounding roof and floor.Conversely, if the ground is free to move into the roadway, thisincreased horizontal stress is not well developed and increasedrib squeeze is manifest instead.
This concept is presented in figure 2; with strong cohesivecoal-rock interfaces the confining stress in the pillar increasesrapidly inward from the ribsides, allowing high vertical stressesto be sustained by the pillar. The opposite case of low shearstrength coal-rock contact surfaces is presented in figure 3. Inthis situation, confinement cannot be maintained sufficiently;hence, the allowable vertical stress would be significantly lessthan that in figure 2. The diagram shows that the pillar hasfailed because of its inability to sustain the imposed verticalabutment stresses. In addition, lateral movement has causedfloor heave and severe immediate roof shearing.
The implications of this for the strength of an isolated pillarare presented in figure 4, where the load carried by the pillar isthe mean of the vertical stress across it. If this mean stress isequal to the average "applied load" to be carried by the pillar,then the pillar is stable (figure 4A). If the applied load is great-er, then the pillar is said to fail (figure 4B) and the deficit stressmust be redistributed onto nearby pillars.
Conceptually, pillar strength behavior should fall betweenthe two end members of:
(1) Lateral slip occurring totally unresisted, so that pillarstrength is limited to the unconfined value of the coal; and
(2) Lateral slip being resisted by system cohesion andstiffness, such that pillar strength is significantly above itsunconfined value due to confinement.
A range of potential pillar strengths associated with thesetwo end members relative to the w/h ratio is presented afterGale [1996] in figure 5. It is assumed that the rock massstrength of the coal is 6.5 MPa and that the coal is significantlyinvolved in the failure process. This range of pillar strengths isrepresentative of most rock failure combinations, except in rarecases where small stiff pillars may punch into soft clay-rich
strata at loading levels below the field uniaxial compressivestrength of the coal. In the punching situations, pillar strengthmay be lower than that depicted, but the variation would gen-erally be confined to pillars having small w/h ratios.
A comparison of these "end member" situations with arange of pillar strengths determined from actual measurementprograms conducted in Australia and the United Kingdom byStrata Control Technology and from the United States [Mark
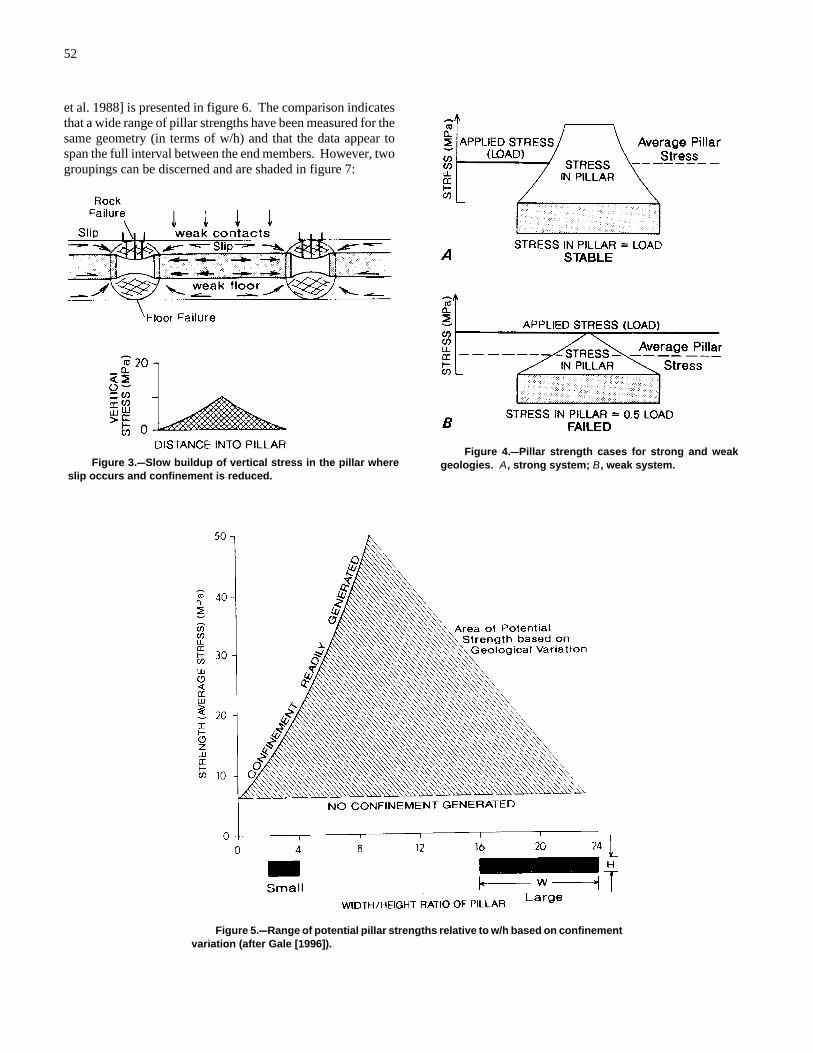
52
Figure 3.CCSlow buildup of vertical stress in the pillar whereslip occurs and confinement is reduced.
Figure 4.CCPillar strength cases for strong and weakgeologies. A, strong system; B, weak system.
Figure 5.CCRange of potential pillar strengths relative to w/h based on confinementvariation (after Gale [1996]).
et al. 1988] is presented in figure 6. The comparison indicatesthat a wide range of pillar strengths have been measured for thesame geometry (in terms of w/h) and that the data appear tospan the full interval between the end members. However, twogroupings can be discerned and are shaded in figure 7:
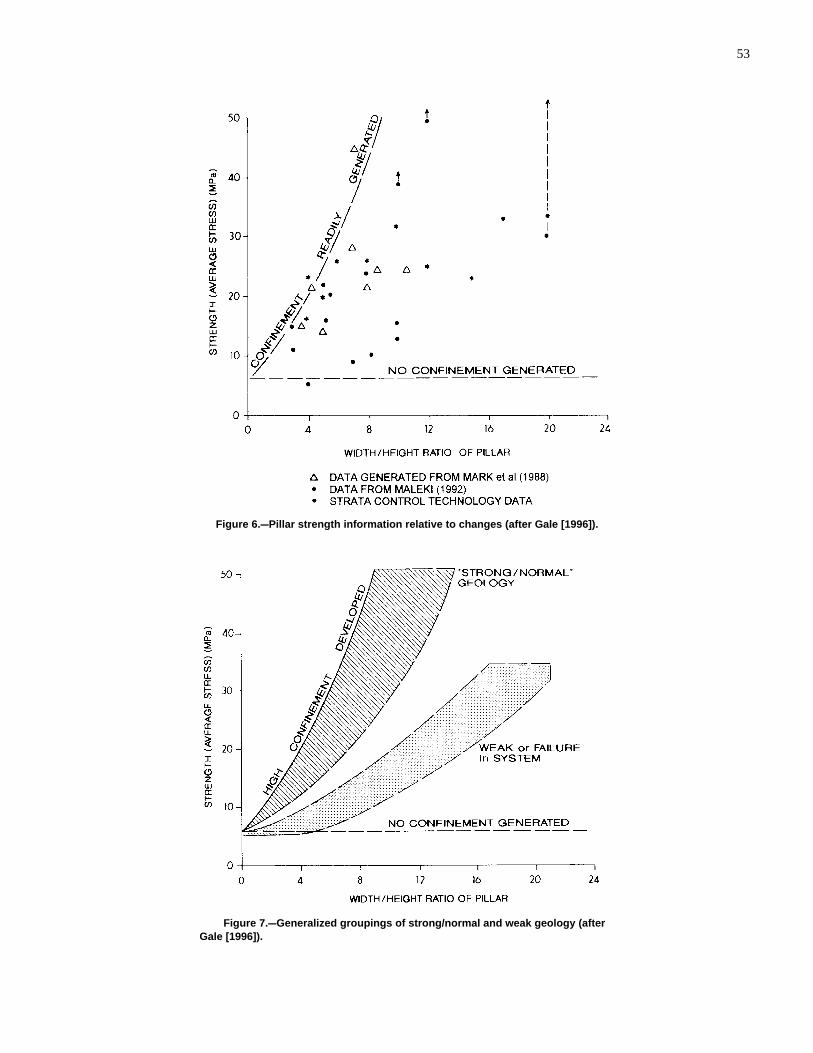
53
Figure 6.CCPillar strength information relative to changes (after Gale [1996]).
Figure 7.CCGeneralized groupings of strong/normal and weak geology (afterGale [1996]).
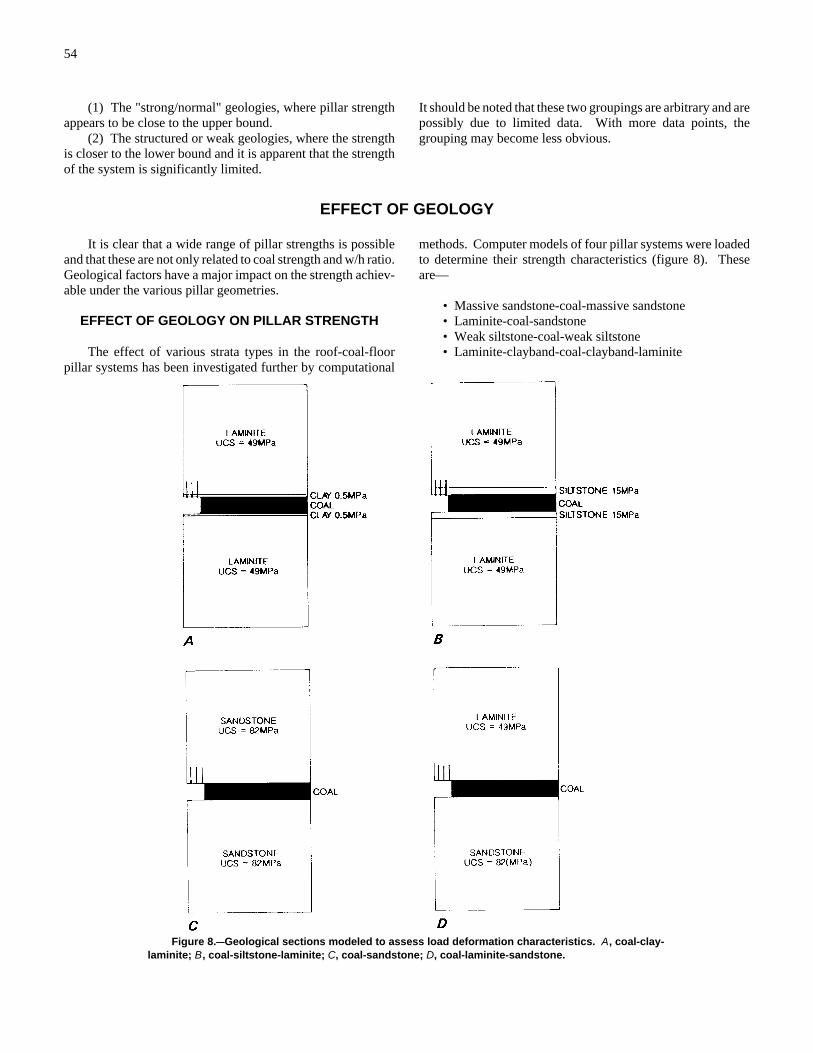
54
Figure 8.CCGeological sections modeled to assess load deformation characteristics. A, coal-clay-laminite; B, coal-siltstone-laminite; C, coal-sandstone; D, coal-laminite-sandstone.
(1) The "strong/normal" geologies, where pillar strengthappears to be close to the upper bound.
(2) The structured or weak geologies, where the strengthis closer to the lower bound and it is apparent that the strengthof the system is significantly limited.
It should be noted that these two groupings are arbitrary and arepossibly due to limited data. With more data points, thegrouping may become less obvious.
EFFECT OF GEOLOGY
It is clear that a wide range of pillar strengths is possibleand that these are not only related to coal strength and w/h ratio.Geological factors have a major impact on the strength achiev-able under the various pillar geometries.
EFFECT OF GEOLOGY ON PILLAR STRENGTH
The effect of various strata types in the roof-coal-floorpillar systems has been investigated further by computational
methods. Computer models of four pillar systems were loadedto determine their strength characteristics (figure 8). Theseare—
• Massive sandstone-coal-massive sandstone• Laminite-coal-sandstone• Weak siltstone-coal-weak siltstone• Laminite-clayband-coal-clayband-laminite

55
Figure 9.CCStrength and w/h for models.
The results of the pillar strength characteristics relative tow/h are presented in figure 9. The results closely relate to thefield measurement data and confirm that the strata typessurrounding the coal have a major impact on strength and alsoprovide insight into the geological factors affecting strength.The results indicate that—
(1) Strong immediate roof and floor layers and goodcoal-to-rock contacts provide a general relationship similar tothe upper bound pillar strength in figure 5.
(2) Weak, clay-rich, and sheared contacts adjacent to themining section reduce pillar strength to the lower bound areas.
(3) Soft strata in the immediate roof and floor, which failunder the mining-induced stresses, will weaken pillars to thelower bound areas.
(4) Tectonic deformation of coal in disturbed geologicalenvironments will reduce pillar strength, although the extentdepends on geometry and strength of the discontinuities.
Obviously, combinations of these various factors will havea compounding effect. For example, structurally disturbed,weak, and wet roof strata may greatly reduce pillar confinementand, consequently, pillar-bearing capacity.
EFFECT OF GEOLOGY ON POSTPEAK PILLARSTRENGTH
The postpeak pillar strength characteristics for some of thepillars modeled are presented in figure 10. The pillar strengthis presented as a stress/strain plot for various width/heightpillars. The results presented in figure 10A show that in strongsandstone geology, high strengths are achievable in small pillars(w/h ' 5) and the pillar maintains a high load-carryingcapability. In the example modeled, "short-term" load losseswere noted to occur in association with sudden rib failure.These instances are present in figure 10A as "rib bumps." Insections of laminite roof, these pillars may lose strength if thelaminite fails at a very high load above the pillar. For pillarswith a w/h less than 4/5, a loss in strength is expected at a highload due to failure of the coal.
In pillar systems with weak strata surrounding the coal, thepillars typically exhibit a strength loss after peak load isachieved. Large width/height pillars are required to develop ahigh load-carrying capacity after failure in the weak pillarsystems modeled. Two examples are presented in figure 10B,which shows the postpeak strength characteristics of pillarswith weak mudstone or clay surrounding the coal. In these
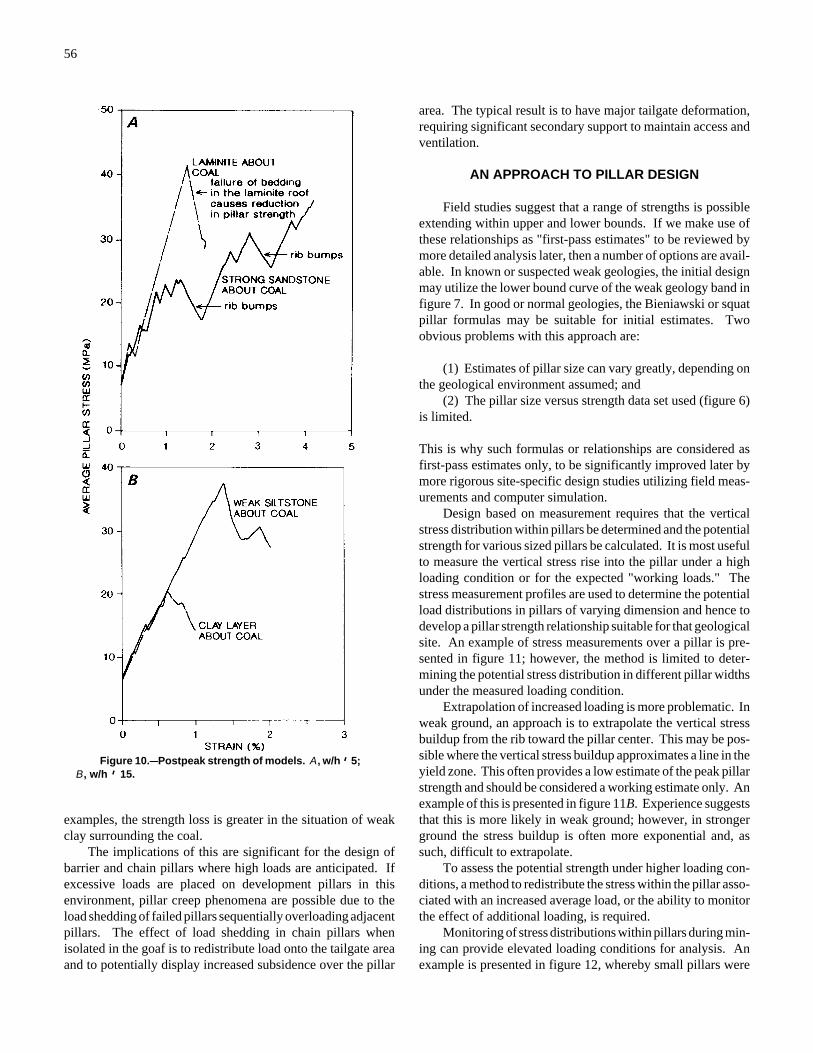
56
Figure 10.CCPostpeak strength of models. A, w/h '' 5;B, w/h '' 15.
examples, the strength loss is greater in the situation of weakclay surrounding the coal.
The implications of this are significant for the design ofbarrier and chain pillars where high loads are anticipated. Ifexcessive loads are placed on development pillars in thisenvironment, pillar creep phenomena are possible due to theload shedding of failed pillars sequentially overloading adjacentpillars. The effect of load shedding in chain pillars whenisolated in the goaf is to redistribute load onto the tailgate areaand to potentially display increased subsidence over the pillar
area. The typical result is to have major tailgate deformation,requiring significant secondary support to maintain access andventilation.
AN APPROACH TO PILLAR DESIGN
Field studies suggest that a range of strengths is possibleextending within upper and lower bounds. If we make use ofthese relationships as "first-pass estimates" to be reviewed bymore detailed analysis later, then a number of options are avail-able. In known or suspected weak geologies, the initial designmay utilize the lower bound curve of the weak geology band infigure 7. In good or normal geologies, the Bieniawski or squatpillar formulas may be suitable for initial estimates. Twoobvious problems with this approach are:
(1) Estimates of pillar size can vary greatly, depending onthe geological environment assumed; and
(2) The pillar size versus strength data set used (figure 6)is limited.
This is why such formulas or relationships are considered asfirst-pass estimates only, to be significantly improved later bymore rigorous site-specific design studies utilizing field meas-urements and computer simulation.
Design based on measurement requires that the verticalstress distribution within pillars be determined and the potentialstrength for various sized pillars be calculated. It is most usefulto measure the vertical stress rise into the pillar under a highloading condition or for the expected "working loads." Thestress measurement profiles are used to determine the potentialload distributions in pillars of varying dimension and hence todevelop a pillar strength relationship suitable for that geologicalsite. An example of stress measurements over a pillar is pre-sented in figure 11; however, the method is limited to deter-mining the potential stress distribution in different pillar widthsunder the measured loading condition.
Extrapolation of increased loading is more problematic. Inweak ground, an approach is to extrapolate the vertical stressbuildup from the rib toward the pillar center. This may be pos-sible where the vertical stress buildup approximates a line in theyield zone. This often provides a low estimate of the peak pillarstrength and should be considered a working estimate only. Anexample of this is presented in figure 11B. Experience suggeststhat this is more likely in weak ground; however, in strongerground the stress buildup is often more exponential and, assuch, difficult to extrapolate.
To assess the potential strength under higher loading con-ditions, a method to redistribute the stress within the pillar asso-ciated with an increased average load, or the ability to monitorthe effect of additional loading, is required.
Monitoring of stress distributions within pillars during min-ing can provide elevated loading conditions for analysis. Anexample is presented in figure 12, whereby small pillars were
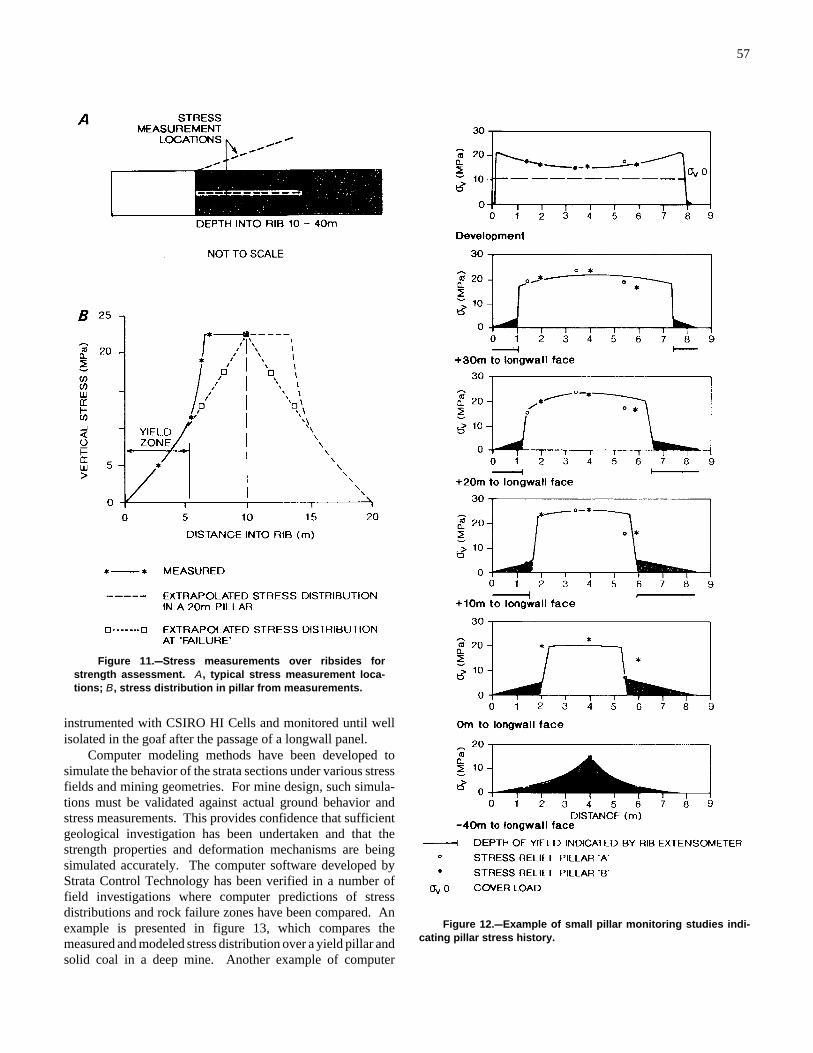
57
Figure 11.CCStress measurements over ribsides forstrength assessment. A, typical stress measurement loca-tions; B, stress distribution in pillar from measurements.
Figure 12.CCExample of small pillar monitoring studies indi-cating pillar stress history.
instrumented with CSIRO HI Cells and monitored until wellisolated in the goaf after the passage of a longwall panel.
Computer modeling methods have been developed tosimulate the behavior of the strata sections under various stressfields and mining geometries. For mine design, such simula-tions must be validated against actual ground behavior andstress measurements. This provides confidence that sufficientgeological investigation has been undertaken and that thestrength properties and deformation mechanisms are beingsimulated accurately. The computer software developed byStrata Control Technology has been verified in a number offield investigations where computer predictions of stressdistributions and rock failure zones have been compared. Anexample is presented in figure 13, which compares themeasured and modeled stress distribution over a yield pillar andsolid coal in a deep mine. Another example of computer
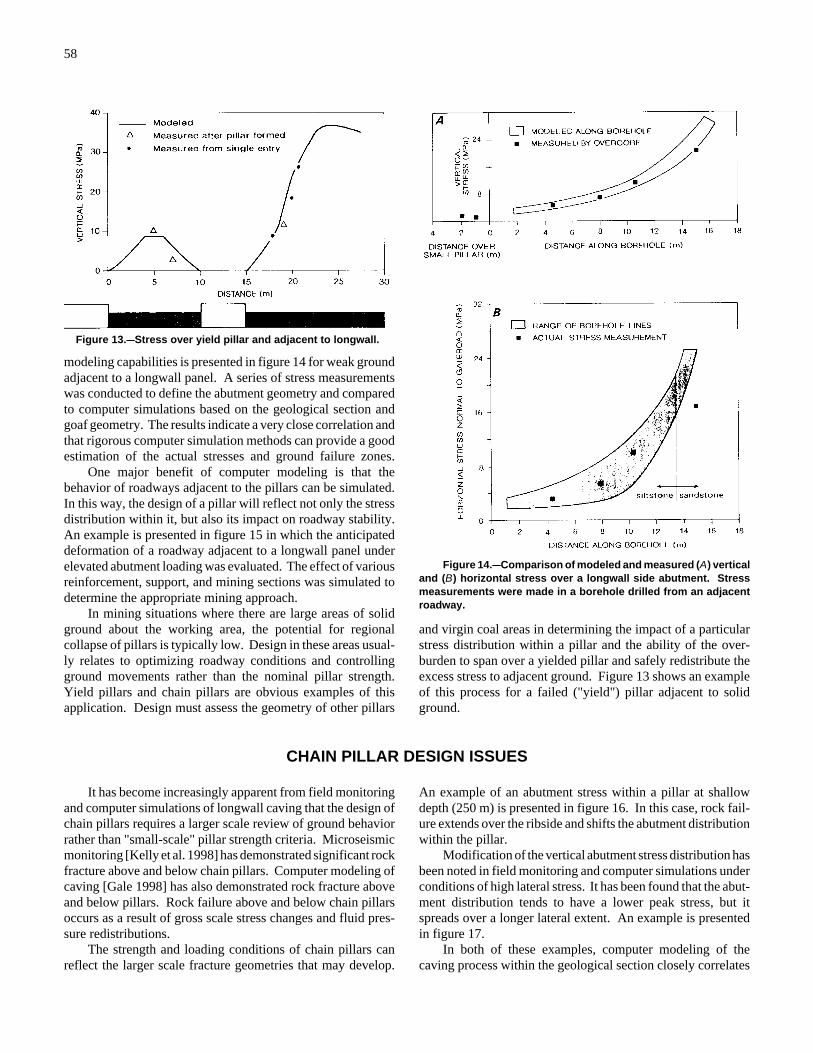
58
Figure 13.CCStress over yield pillar and adjacent to longwall.
Figure 14.CCComparison of modeled and measured (A) verticaland (B) horizontal stress over a longwall side abutment. Stressmeasurements were made in a borehole drilled from an adjacentroadway.
modeling capabilities is presented in figure 14 for weak groundadjacent to a longwall panel. A series of stress measurementswas conducted to define the abutment geometry and comparedto computer simulations based on the geological section andgoaf geometry. The results indicate a very close correlation andthat rigorous computer simulation methods can provide a goodestimation of the actual stresses and ground failure zones.
One major benefit of computer modeling is that thebehavior of roadways adjacent to the pillars can be simulated.In this way, the design of a pillar will reflect not only the stressdistribution within it, but also its impact on roadway stability.An example is presented in figure 15 in which the anticipateddeformation of a roadway adjacent to a longwall panel underelevated abutment loading was evaluated. The effect of variousreinforcement, support, and mining sections was simulated todetermine the appropriate mining approach.
In mining situations where there are large areas of solidground about the working area, the potential for regionalcollapse of pillars is typically low. Design in these areas usual-ly relates to optimizing roadway conditions and controllingground movements rather than the nominal pillar strength.Yield pillars and chain pillars are obvious examples of thisapplication. Design must assess the geometry of other pillars
and virgin coal areas in determining the impact of a particularstress distribution within a pillar and the ability of the over-burden to span over a yielded pillar and safely redistribute theexcess stress to adjacent ground. Figure 13 shows an exampleof this process for a failed ("yield") pillar adjacent to solidground.
CHAIN PILLAR DESIGN ISSUES
It has become increasingly apparent from field monitoringand computer simulations of longwall caving that the design ofchain pillars requires a larger scale review of ground behaviorrather than "small-scale" pillar strength criteria. Microseismicmonitoring [Kelly et al. 1998] has demonstrated significant rockfracture above and below chain pillars. Computer modeling ofcaving [Gale 1998] has also demonstrated rock fracture aboveand below pillars. Rock failure above and below chain pillarsoccurs as a result of gross scale stress changes and fluid pres-sure redistributions.
The strength and loading conditions of chain pillars canreflect the larger scale fracture geometries that may develop.
An example of an abutment stress within a pillar at shallowdepth (250 m) is presented in figure 16. In this case, rock fail-ure extends over the ribside and shifts the abutment distributionwithin the pillar.
Modification of the vertical abutment stress distribution hasbeen noted in field monitoring and computer simulations underconditions of high lateral stress. It has been found that the abut-ment distribution tends to have a lower peak stress, but itspreads over a longer lateral extent. An example is presentedin figure 17.
In both of these examples, computer modeling of thecaving process within the geological section closely correlates
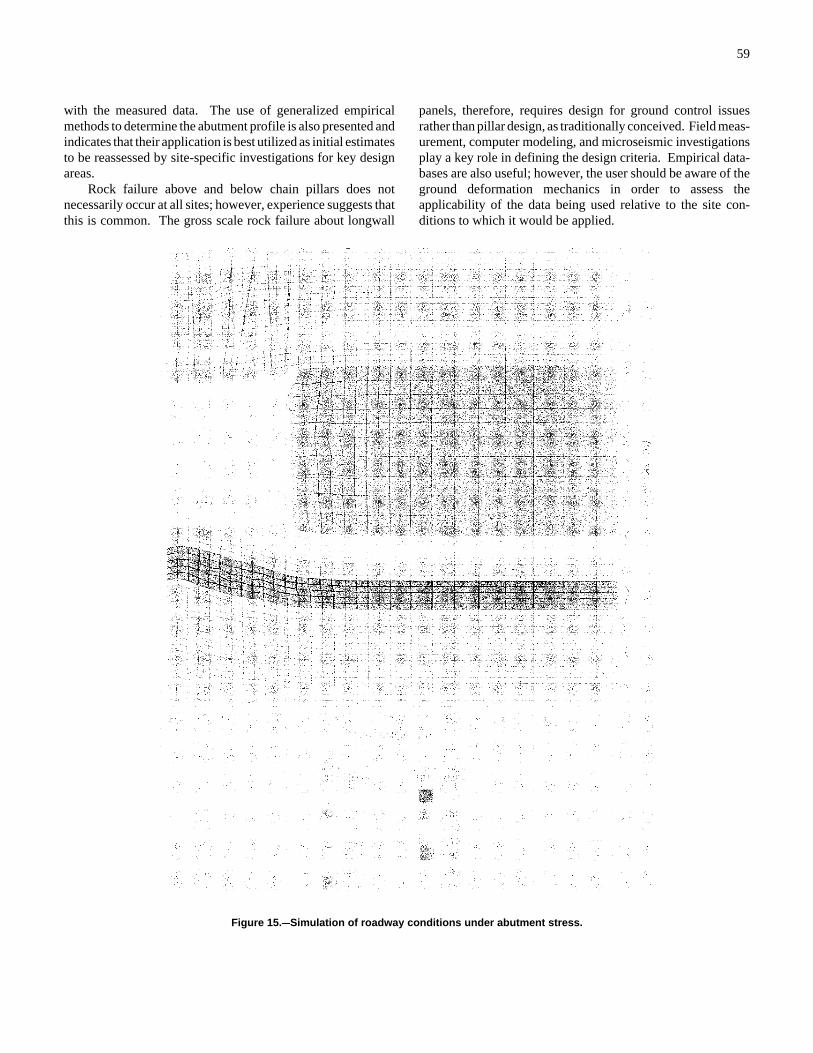
59
Figure 15.CCSimulation of roadway conditions under abutment stress.
with the measured data. The use of generalized empiricalmethods to determine the abutment profile is also presented andindicates that their application is best utilized as initial estimatesto be reassessed by site-specific investigations for key designareas.
Rock failure above and below chain pillars does notnecessarily occur at all sites; however, experience suggests thatthis is common. The gross scale rock failure about longwall
panels, therefore, requires design for ground control issuesrather than pillar design, as traditionally conceived. Field meas-urement, computer modeling, and microseismic investigationsplay a key role in defining the design criteria. Empirical data-bases are also useful; however, the user should be aware of theground deformation mechanics in order to assess theapplicability of the data being used relative to the site con-ditions to which it would be applied.
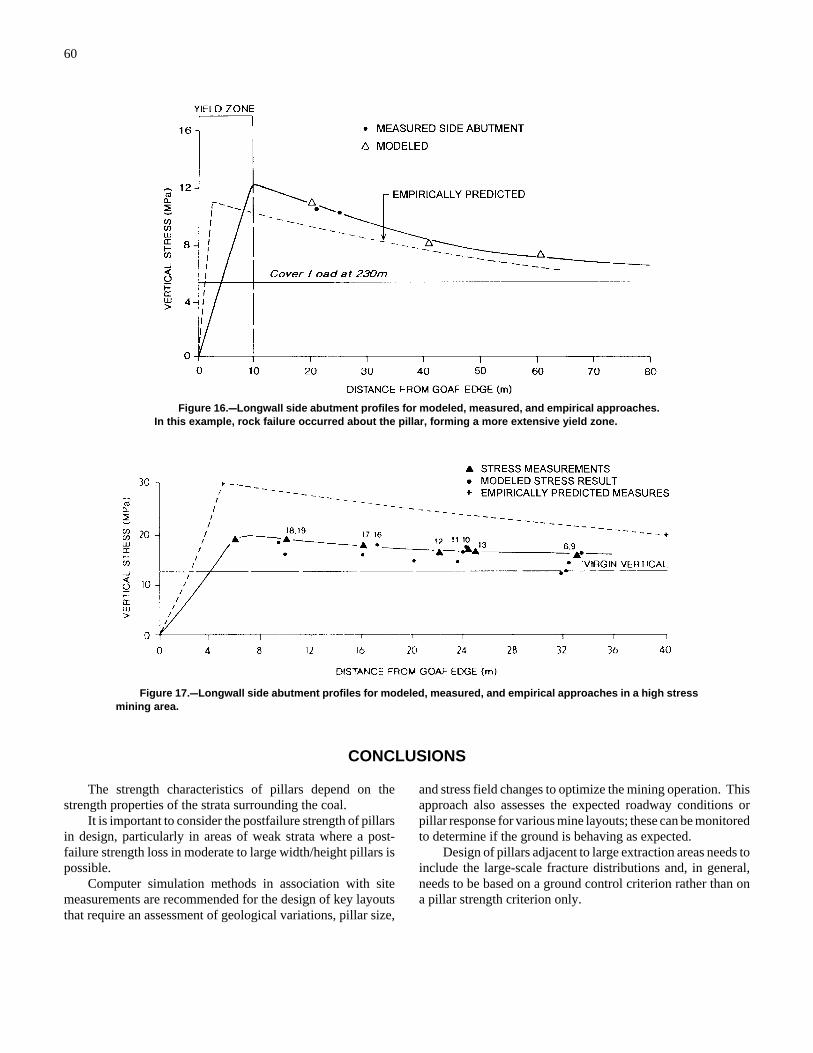
60
Figure 16.CCLongwall side abutment profiles for modeled, measured, and empirical approaches.In this example, rock failure occurred about the pillar, forming a more extensive yield zone.
Figure 17.CCLongwall side abutment profiles for modeled, measured, and empirical approaches in a high stressmining area.
CONCLUSIONS
The strength characteristics of pillars depend on thestrength properties of the strata surrounding the coal.
It is important to consider the postfailure strength of pillarsin design, particularly in areas of weak strata where a post-failure strength loss in moderate to large width/height pillars ispossible.
Computer simulation methods in association with sitemeasurements are recommended for the design of key layoutsthat require an assessment of geological variations, pillar size,
and stress field changes to optimize the mining operation. Thisapproach also assesses the expected roadway conditions orpillar response for various mine layouts; these can be monitoredto determine if the ground is behaving as expected.
Design of pillars adjacent to large extraction areas needs toinclude the large-scale fracture distributions and, in general,needs to be based on a ground control criterion rather than ona pillar strength criterion only.
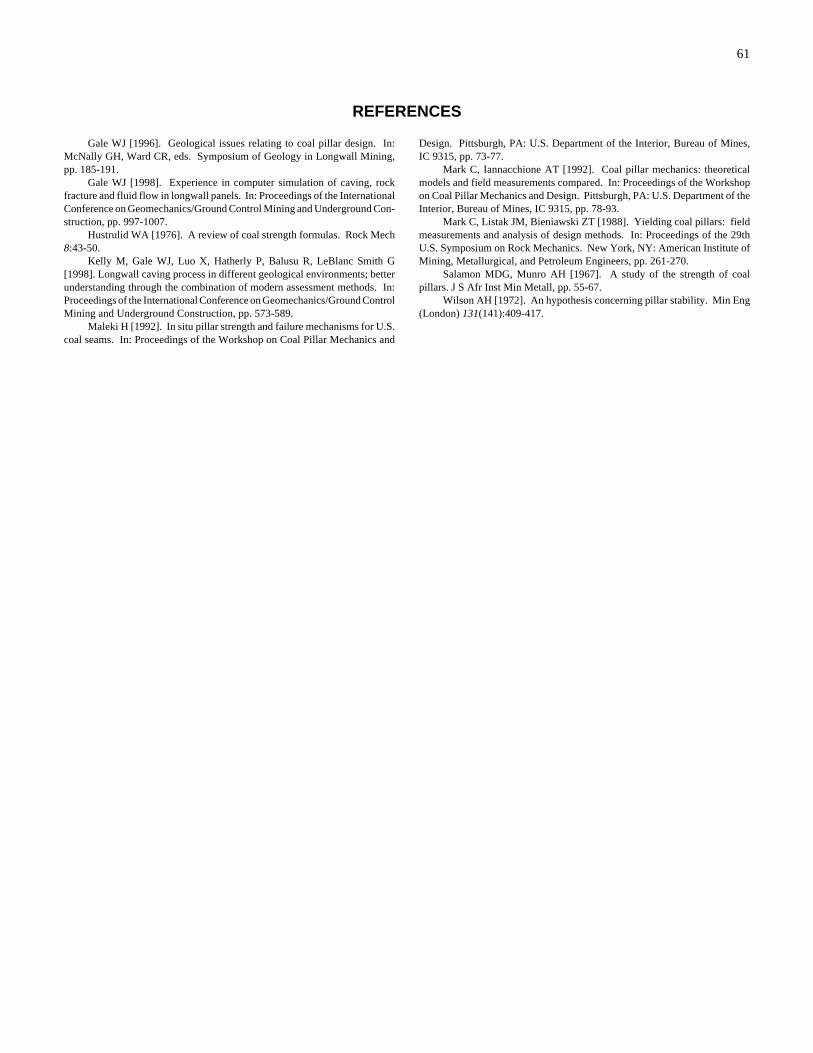
61
REFERENCES
Gale WJ [1996]. Geological issues relating to coal pillar design. In:McNally GH, Ward CR, eds. Symposium of Geology in Longwall Mining,pp. 185-191.
Gale WJ [1998]. Experience in computer simulation of caving, rockfracture and fluid flow in longwall panels. In: Proceedings of the InternationalConference on Geomechanics/Ground Control Mining and Underground Con-struction, pp. 997-1007.
Hustrulid WA [1976]. A review of coal strength formulas. Rock Mech8:43-50.
Kelly M, Gale WJ, Luo X, Hatherly P, Balusu R, LeBlanc Smith G[1998]. Longwall caving process in different geological environments; betterunderstanding through the combination of modern assessment methods. In:Proceedings of the International Conference on Geomechanics/Ground ControlMining and Underground Construction, pp. 573-589.
Maleki H [1992]. In situ pillar strength and failure mechanisms for U.S.coal seams. In: Proceedings of the Workshop on Coal Pillar Mechanics and
Design. Pittsburgh, PA: U.S. Department of the Interior, Bureau of Mines,IC 9315, pp. 73-77.
Mark C, Iannacchione AT [1992]. Coal pillar mechanics: theoreticalmodels and field measurements compared. In: Proceedings of the Workshopon Coal Pillar Mechanics and Design. Pittsburgh, PA: U.S. Department of theInterior, Bureau of Mines, IC 9315, pp. 78-93.
Mark C, Listak JM, Bieniawski ZT [1988]. Yielding coal pillars: fieldmeasurements and analysis of design methods. In: Proceedings of the 29thU.S. Symposium on Rock Mechanics. New York, NY: American Institute ofMining, Metallurgical, and Petroleum Engineers, pp. 261-270.
Salamon MDG, Munro AH [1967]. A study of the strength of coalpillars. J S Afr Inst Min Metall, pp. 55-67.
Wilson AH [1972]. An hypothesis concerning pillar stability. Min Eng(London) 131(141):409-417.
63
UNIVERSITY OF NEW SOUTH WALES COAL PILLAR STRENGTHDETERMINATIONS FOR AUSTRALIAN AND SOUTH
AFRICAN MINING CONDITIONS
By Jim M. Galvin, Ph.D.,1 Bruce K. Hebblewhite, Ph.D.,2
and Miklos D. G. Salamon, Ph.D.3
ABSTRACT
A series of mine design accidents in the late 1980s resulted in a major research program at the Universityof New South Wales, Australia, aimed at developing pillar and mine design guidelines. A database of bothfailed and unfailed Australian underground coal mine pillar case studies was compiled. A procedure wasdeveloped to enable the effective width of rectangular pillars to be taken into account. The database wasanalyzed statistically using the maximum likelihood method, both independently and as a combined data setwith the more extensive South African database. Probabilities of failure were correlated to factors of safety.It was found that there was less than a 4% variance in pillar design extraction ratios resulting from each ofthese approaches. There is a remarkable consistency between the design formulas developed from back-analysis of the two separate national pillar databases containing many different coal seams and geologicalenvironments.
1Professor and Head, School of Mining Engineering, University of New South Wales, Sydney, Australia.2Professor, School of Mining Engineering, University of New South Wales, Sydney, Australia.3Distinguished professor, School of Mining Engineering, Colorado School of Mines, Golden, CO.
64
Fs1 ' K1 r % (1& r) wh
, (1)
INTRODUCTION
In the 3-year period to 1992, 60 continuous miners weretrapped by falls of strata for more than 7 hr in collieries in NewSouth Wales, Australia. In the preceding 2 years, eight coalminers were killed in pillar extraction operations in New SouthWales. In the New South Wales and Queensland coalfields,at least 15 extensive collapses of bord-and-pillar workings oc-curred unexpectedly in the 15-year period to 1992. Six of thesecollapses occurred in working panels; fortuitously, five oc-curred during shutdown periods and the sixth occurred whilethe continuous miner was being flitted to the surface for repairs.
One contributor to these events was the lack of a compre-hensive pillar design procedure. Legislation in New South
Wales at the time simply required coal pillars to have aminimum width of one-tenth depth or 10 m, whichever wasgreater. The influence of pillar height on strength received norecognition.
This set of circumstances led to funding by the New SouthWales Joint Coal Board of a major research project on pillar de-sign and behavior. The research was undertaken by the School ofMining Engineering at the University of New South Wales(UNSW). The primary objectives of the research were to improvethe understanding of coal pillars and associated floor and roofstrata behavior under various loading conditions and to incorporatethese outcomes into the mine design knowledge base.
RESEARCH METHODOLOGY
The approach adopted to pillar design was based on thatdeveloped for square pillars by Salamon and Munro [1966,1967]. However, the extensive use of rectangular and diamond-shaped pillars in Australia required more detailed considerationof the effective width of parallelepiped pillars and the effect ofthis width on pillar strength.
Firstly, an adequate Australian database of failed andunfailed pillar case histories was established. A relationshipwas then developed to factor in the influence of rectangular anddiamond-shaped pillars, which comprised just over 50% of thedatabase. This database was then subjected to rigorous statisti-cal analysis using a range of techniques in order to quantify
parameters associated with each of two generally acceptedempirical formulas for describing pillar strength. This facilitatedthe establishment of correlation, for all strength expressions,between the probability that a formula would yield a successfuldesign versus the respective design factor of safety.
The Australian database was also combined with the muchlarger and long-established South African database, and theanalysis was repeated to determine if the two population basescould be considered as one. A close correlation was obtained,leading to an increased level of confidence in this methodologyand to a number of more universal conclusions concerning pillardesign.
EMPIRICAL COAL PILLAR STRENGTH ESTIMATIONS
The development of computer and numerical technologiesin recent decades has facilitated, at least in principle, the analy-sis of stresses in pillars and their foundations, i.e., the roof andfloor strata. Unfortunately, physical experimentation has notadvanced equally rapidly. Hence, the understanding of theintrinsic constitutive laws controlling the behavior of yieldingrocks is still unsatisfactory. More immediate problems includethe significant discrepancies between the physical properties ex-hibited by rocks in situ and those measured in the laboratory bytesting small specimens. These problems relate to the effects ofsize and shape on rock strength.
Many investigators have proposed simple empirical formu-las to describe the strength of coal pillars. The most commonfeature of most of these empirical relationships is that they de-fine strength ostensively only in terms of the linear dimensionsof the pillars and a multiplying constant, representing the
strength of the unit volume of coal. Investigators over the yearshave proposed formulas that belong to one of two types. Onetype defines pillar strength simply as a linear function of thewidth-to-height (w/h) ratio:
where K1 is the compressive strength of a cube and r is a dimen-sionless constant. The quantities of w and h are the width andheight of the pillar, respectively.
If the notation
R ' w/h (2)
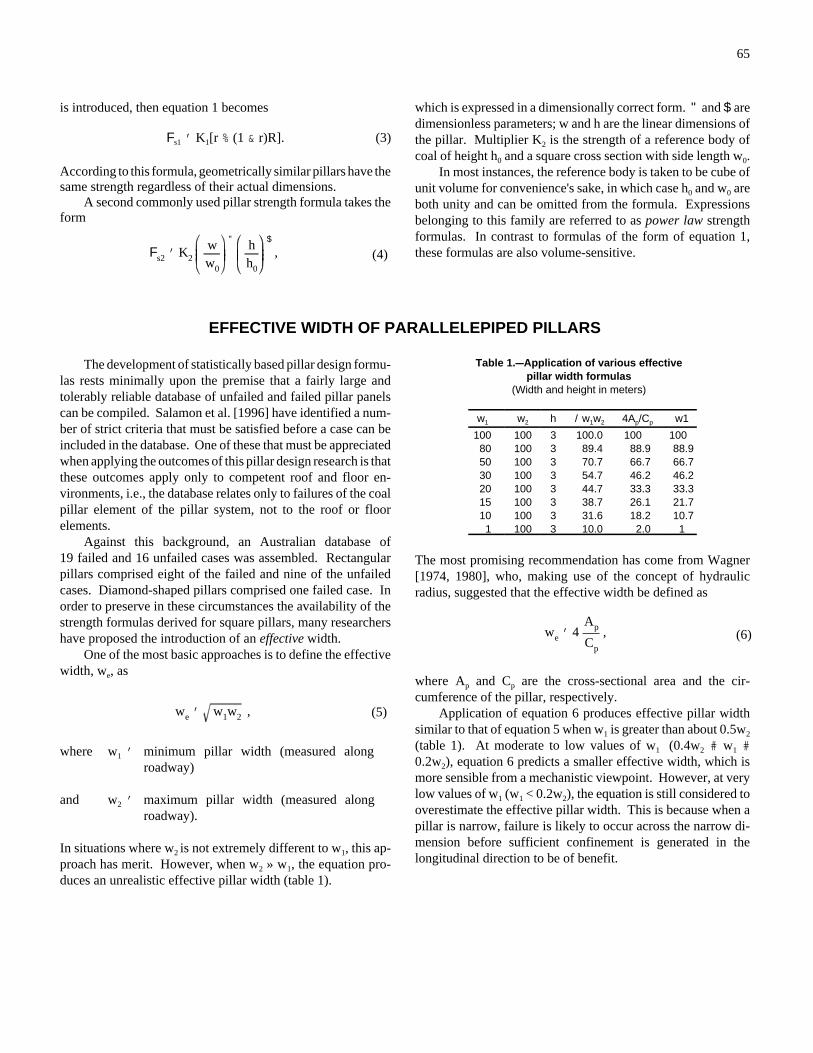
65
Fs2 ' K2ww0
" hh0
$
, (4)
we ' w1w2 , (5)
we ' 4Ap
Cp
, (6)
is introduced, then equation 1 becomes
Fs1 ' K1[r % (1 & r)R]. (3)
According to this formula, geometrically similar pillars have thesame strength regardless of their actual dimensions.
A second commonly used pillar strength formula takes theform
which is expressed in a dimensionally correct form. " and $ aredimensionless parameters; w and h are the linear dimensions ofthe pillar. Multiplier K2 is the strength of a reference body ofcoal of height h0 and a square cross section with side length w0.
In most instances, the reference body is taken to be cube ofunit volume for convenience's sake, in which case h0 and w0 areboth unity and can be omitted from the formula. Expressionsbelonging to this family are referred to as power law strengthformulas. In contrast to formulas of the form of equation 1,these formulas are also volume-sensitive.
EFFECTIVE WIDTH OF PARALLELEPIPED PILLARS
The development of statistically based pillar design formu-las rests minimally upon the premise that a fairly large andtolerably reliable database of unfailed and failed pillar panelscan be compiled. Salamon et al. [1996] have identified a num-ber of strict criteria that must be satisfied before a case can beincluded in the database. One of these that must be appreciatedwhen applying the outcomes of this pillar design research is thatthese outcomes apply only to competent roof and floor en-vironments, i.e., the database relates only to failures of the coalpillar element of the pillar system, not to the roof or floorelements.
Against this background, an Australian database of19 failed and 16 unfailed cases was assembled. Rectangularpillars comprised eight of the failed and nine of the unfailedcases. Diamond-shaped pillars comprised one failed case. Inorder to preserve in these circumstances the availability of thestrength formulas derived for square pillars, many researchershave proposed the introduction of an effective width.
One of the most basic approaches is to define the effectivewidth, we, as
where w1 ' minimum pillar width (measured along roadway)
and w2 ' maximum pillar width (measured along roadway).
In situations where w2 is not extremely different to w1, this ap-proach has merit. However, when w2 » w1, the equation pro-duces an unrealistic effective pillar width (table 1).
Table 1.CCApplication of various effectivepillar width formulas
(Width and height in meters)
w1 w2 h /w1w2 4Ap/Cp w1
100 100 3 100.0 100 10080 100 3 89.4 88.9 88.950 100 3 70.7 66.7 66.730 100 3 54.7 46.2 46.220 100 3 44.7 33.3 33.315 100 3 38.7 26.1 21.710 100 3 31.6 18.2 10.71 100 3 10.0 2.0 1
The most promising recommendation has come from Wagner[1974, 1980], who, making use of the concept of hydraulicradius, suggested that the effective width be defined as
where Ap and Cp are the cross-sectional area and the cir-cumference of the pillar, respectively.
Application of equation 6 produces effective pillar widthsimilar to that of equation 5 when w1 is greater than about 0.5w2
(table 1). At moderate to low values of w1 (0.4w2 # w1 #0.2w2), equation 6 predicts a smaller effective width, which ismore sensible from a mechanistic viewpoint. However, at verylow values of w1 (w1 < 0.2w2), the equation is still considered tooverestimate the effective pillar width. This is because when apillar is narrow, failure is likely to occur across the narrow di-mension before sufficient confinement is generated in thelongitudinal direction to be of benefit.
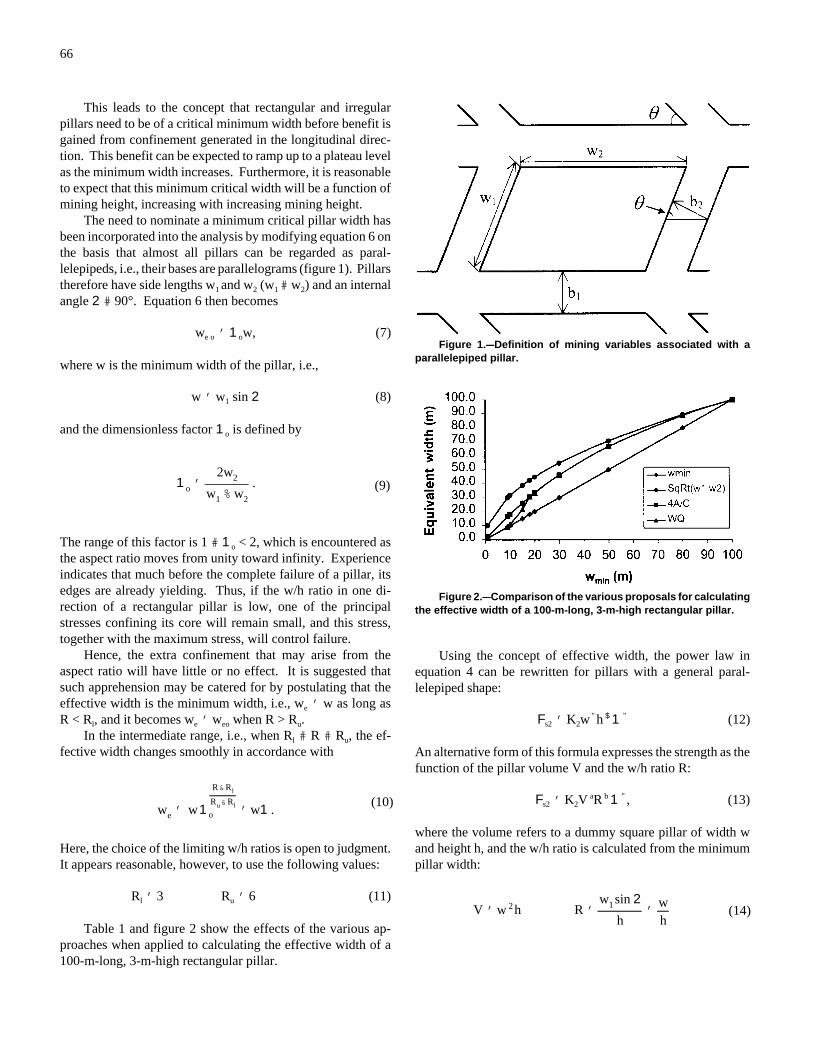
66
1o '2w2
w1 % w2
. (9)
we ' w1
R&Rl
Ru&Rl
o ' w1 .(10)
V ' w 2 h R 'w1 sin 2
h'
wh
(14)
Figure 1.CCDefinition of mining variables associated with aparallelepiped pillar.
Figure 2.CCComparison of the various proposals for calculatingthe effective width of a 100-m-long, 3-m-high rectangular pillar.
This leads to the concept that rectangular and irregularpillars need to be of a critical minimum width before benefit isgained from confinement generated in the longitudinal direc-tion. This benefit can be expected to ramp up to a plateau levelas the minimum width increases. Furthermore, it is reasonableto expect that this minimum critical width will be a function ofmining height, increasing with increasing mining height.
The need to nominate a minimum critical pillar width hasbeen incorporated into the analysis by modifying equation 6 onthe basis that almost all pillars can be regarded as paral-lelepipeds, i.e., their bases are parallelograms (figure 1). Pillarstherefore have side lengths w1 and w2 (w1 # w2) and an internalangle 2 # 90°. Equation 6 then becomes
we o ' 1ow, (7)
where w is the minimum width of the pillar, i.e.,
w ' w1 sin 2 (8)
and the dimensionless factor 1o is defined by
The range of this factor is 1 # 1o < 2, which is encountered asthe aspect ratio moves from unity toward infinity. Experienceindicates that much before the complete failure of a pillar, itsedges are already yielding. Thus, if the w/h ratio in one di-rection of a rectangular pillar is low, one of the principalstresses confining its core will remain small, and this stress,together with the maximum stress, will control failure.
Hence, the extra confinement that may arise from theaspect ratio will have little or no effect. It is suggested thatsuch apprehension may be catered for by postulating that theeffective width is the minimum width, i.e., we ' w as long asR < Rl, and it becomes we ' weo when R > Ru.
In the intermediate range, i.e., when Rl # R # Ru, the ef-fective width changes smoothly in accordance with
Here, the choice of the limiting w/h ratios is open to judgment.It appears reasonable, however, to use the following values:
Rl ' 3 Ru ' 6 (11)
Table 1 and figure 2 show the effects of the various ap-proaches when applied to calculating the effective width of a100-m-long, 3-m-high rectangular pillar.
Using the concept of effective width, the power law inequation 4 can be rewritten for pillars with a general paral-lelepiped shape:
Fs2 ' K2w "h $ 1 " (12)
An alternative form of this formula expresses the strength as thefunction of the pillar volume V and the w/h ratio R:
Fs2 ' K2V aR b 1 ", (13)
where the volume refers to a dummy square pillar of width wand height h, and the w/h ratio is calculated from the minimumpillar width:

67
a ' 13
(" % $) b '13
(" & 2$) (15)
Fs2 ' K2 V a R bo 1" b
gRRo
g
&1 %1 , (16)qm ' (H*
(w%b1 ) (w2% b2 / sin 2)
ww2(18)
Fs2 ' 7.4 w 0.46
h 0.66(MPa) (19a)
Fs2 '19.24
w 0.133 h 0.0670.237 w
5h
2.5
&1 %1 (MPa) (19b)
The new constants a and b can be defined in terms of constants" and $:
Experience has shown that the original power law formula(equation 4) tends to underestimate the strength of squat pillars,i.e., pillars with a w/h ratio in excess of about 5. To cater forthis problem, Salamon and Wagner [1985] suggested anextension of equation 4 into the range of higher w/h ratios.This extension, after adaptation to pillars of parallelepipedshape, is
which is valid if R > Ro and where 1 is defined in equation 10.This particular form was chosen to ensure that there is a smoothtransition between this and equation 13 at R ' Ro [Salamon andWagner 1985]. Here, Ro and g are appropriately chosen con-stants. The expression is often referred to as the squat pillarstrength formula. Since its inception, it has been applied
widely in the Republic of South Africa using the following pairof constants:
Ro ' 5 g ' 2.5 (17)
In critical situations, the judgment exercised in deriving theeffective pillar width relationship may be regarded as too spec-ulative. This concern can be addressed by either choosing anelevated design factor of safety to account for this level of un-certainty or reverting to the use of the minimum pillar width inpillar strength calculations.
Another aspect to the use of rectangular pillars is the cal-culation of pillar load. In calculating the tributary load, the truedimensions need to be employed. Thus, the pillar load assumesthe following form:
In this relationship, * is a modifier. It is unity in all cases wherethe pillar burden is the conventional tributary load. If, however,due to secondary extraction the pillar load is believed to differfrom this value, the load can be adjusted by applying this factor.Moreover, to remain consistent with earlier calculations, ( istaken to be: ( ' 1.1 psi/ft ' 24.8827 kN/m3 ' 24.8827 kPa/m.
UNSW INITIAL DESIGN FORMULAS
In 1992, following a number of serious incidents related tothe lack of restriction on pillar height, the Chief Inspector ofCoal Mines in New South Wales required operators to obtainapproval to mine at heights exceeding 4 m. To address the needfor a pillar design methodology, the UNSW research teamundertook in 1995 a preliminary analysis of its database[Hocking et al. 1995]. At the time, the database comprised14 collapsed cases and 16 stable cases that satisfied theselection criteria. The database was analyzed statistically usingthe full maximum likelihood method. Galvin and Hebblewhite[1995] subsequently published the following pillar designformulas, which find current application in Australia:
and its squat pillar version (R > 5):
A conservative approach was adopted, and the minimumpillar width was proposed as the effective width. It follows,therefore, that 1 ' 1 in these expressions. There was littledifference in the pillar strength obtained by allowing allparameters to float in the statistical analysis as opposed to allow-ing only the K values to float and fixing the other parameters tobe the same as those used for many years in the Republic ofSouth Africa. To avoid confusion and to facilitate the intro-duction of the formulas, therefore, only those formulas derivedby allowing the K values to float were presented to operators.The formula for strength based on the linear relationship tookthe following form:
Fs1 ' 5.36(0.64 % 0.36R) (MPa) (20)
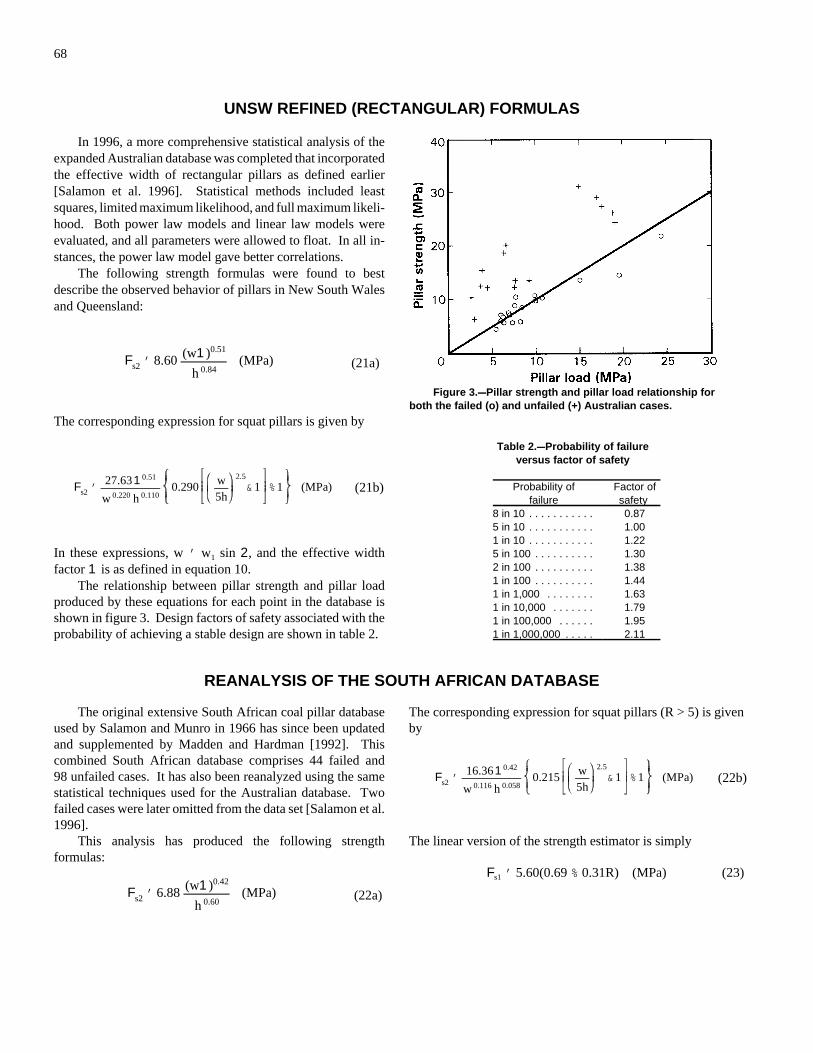
68
Fs2 ' 8.60 (w1)0.51
h 0.84(MPa) (21a)
Fs2 '27.6310.51
w 0.220 h 0.1100.290 w
5h
2.5
&1 %1 (MPa) (21b)
Fs2 ' 6.88 (w1)0.42
h 0.60(MPa) (22a)
Fs2 '16.3610.42
w 0.116 h 0.0580.215 w
5h
2.5
&1 %1 (MPa) (22b)
Figure 3.CCPillar strength and pillar load relationship forboth the failed (o) and unfailed (+) Australian cases.
UNSW REFINED (RECTANGULAR) FORMULAS
In 1996, a more comprehensive statistical analysis of theexpanded Australian database was completed that incorporatedthe effective width of rectangular pillars as defined earlier[Salamon et al. 1996]. Statistical methods included leastsquares, limited maximum likelihood, and full maximum likeli-hood. Both power law models and linear law models wereevaluated, and all parameters were allowed to float. In all in-stances, the power law model gave better correlations.
The following strength formulas were found to bestdescribe the observed behavior of pillars in New South Walesand Queensland:
The corresponding expression for squat pillars is given by
In these expressions, w ' w1 sin 2, and the effective widthfactor 1 is as defined in equation 10.
The relationship between pillar strength and pillar loadproduced by these equations for each point in the database isshown in figure 3. Design factors of safety associated with theprobability of achieving a stable design are shown in table 2.
Table 2.CCProbability of failureversus factor of safety
Probability offailure
Factor ofsafety
8 in 10 . . . . . . . . . . . 0.875 in 10 . . . . . . . . . . . 1.001 in 10 . . . . . . . . . . . 1.225 in 100 . . . . . . . . . . 1.302 in 100 . . . . . . . . . . 1.381 in 100 . . . . . . . . . . 1.441 in 1,000 . . . . . . . . 1.631 in 10,000 . . . . . . . 1.791 in 100,000 . . . . . . 1.951 in 1,000,000 . . . . . 2.11
REANALYSIS OF THE SOUTH AFRICAN DATABASE
The original extensive South African coal pillar databaseused by Salamon and Munro in 1966 has since been updatedand supplemented by Madden and Hardman [1992]. Thiscombined South African database comprises 44 failed and98 unfailed cases. It has also been reanalyzed using the samestatistical techniques used for the Australian database. Twofailed cases were later omitted from the data set [Salamon et al.1996].
This analysis has produced the following strengthformulas:
The corresponding expression for squat pillars (R > 5) is givenby
The linear version of the strength estimator is simply
Fs1 ' 5.60(0.69 % 0.31R) (MPa) (23)
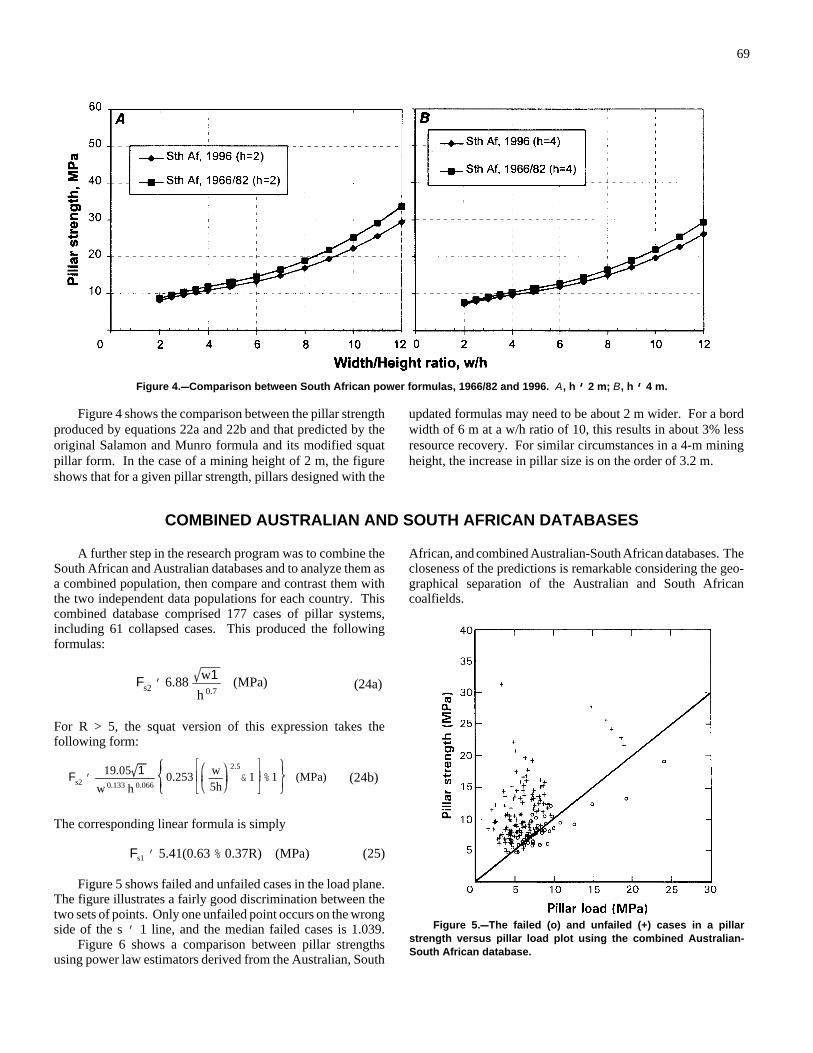
69
Fs2 ' 6.88 w1
h 0.7(MPa) (24a)
Fs2 '19.05 1
w 0.133 h 0.0660.253 w
5h
2.5
&1 %1 (MPa) (24b)
Figure 4.CCComparison between South African power formulas, 1966/82 and 1996. A, h '' 2 m; B, h '' 4 m.
Figure 5.CCThe failed (o) and unfailed (+) cases in a pillarstrength versus pillar load plot using the combined Australian-South African database.
Figure 4 shows the comparison between the pillar strengthproduced by equations 22a and 22b and that predicted by theoriginal Salamon and Munro formula and its modified squatpillar form. In the case of a mining height of 2 m, the figureshows that for a given pillar strength, pillars designed with the
updated formulas may need to be about 2 m wider. For a bordwidth of 6 m at a w/h ratio of 10, this results in about 3% lessresource recovery. For similar circumstances in a 4-m miningheight, the increase in pillar size is on the order of 3.2 m.
COMBINED AUSTRALIAN AND SOUTH AFRICAN DATABASES
A further step in the research program was to combine theSouth African and Australian databases and to analyze them asa combined population, then compare and contrast them withthe two independent data populations for each country. Thiscombined database comprised 177 cases of pillar systems,including 61 collapsed cases. This produced the followingformulas:
For R > 5, the squat version of this expression takes thefollowing form:
The corresponding linear formula is simply
Fs1 ' 5.41(0.63 % 0.37R) (MPa) (25)
Figure 5 shows failed and unfailed cases in the load plane.The figure illustrates a fairly good discrimination between thetwo sets of points. Only one unfailed point occurs on the wrongside of the s ' 1 line, and the median failed cases is 1.039.
Figure 6 shows a comparison between pillar strengthsusing power law estimators derived from the Australian, South
African, and combined Australian-South African databases. Thecloseness of the predictions is remarkable considering the geo-graphical separation of the Australian and South Africancoalfields.
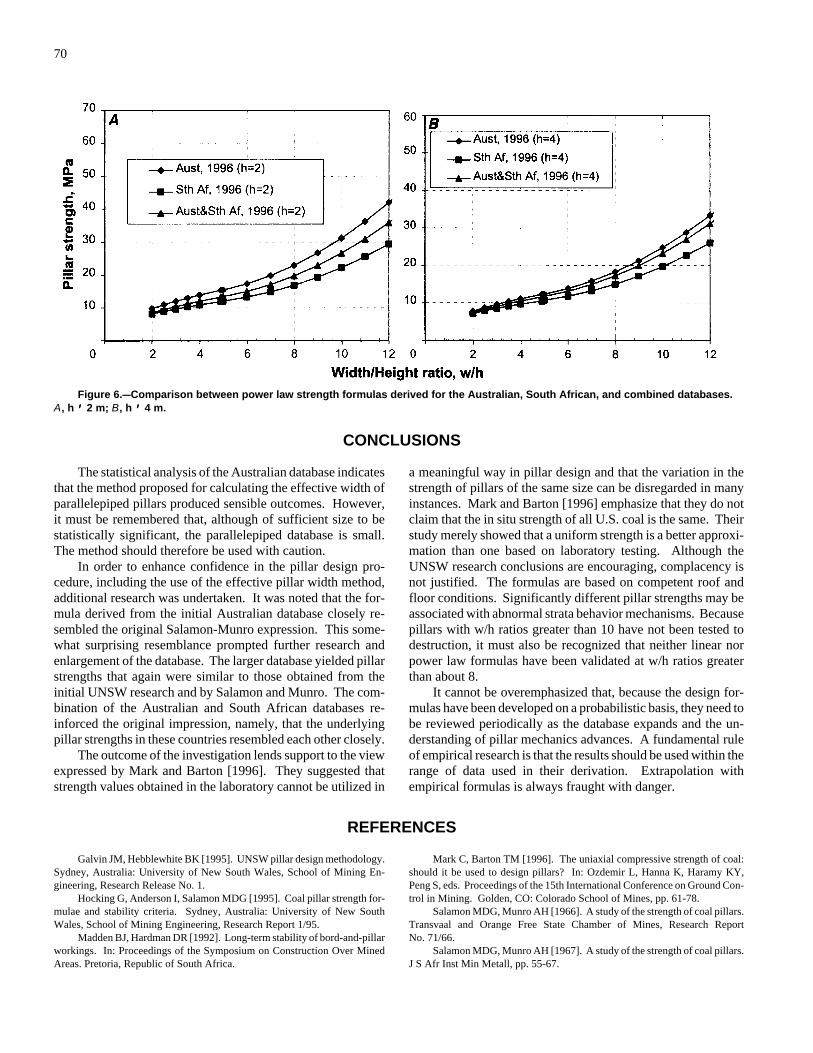
70
Figure 6.CCComparison between power law strength formulas derived for the Australian, South African, and combined databases. A, h '' 2 m; B, h '' 4 m.
CONCLUSIONS
The statistical analysis of the Australian database indicatesthat the method proposed for calculating the effective width ofparallelepiped pillars produced sensible outcomes. However,it must be remembered that, although of sufficient size to bestatistically significant, the parallelepiped database is small.The method should therefore be used with caution.
In order to enhance confidence in the pillar design pro-cedure, including the use of the effective pillar width method,additional research was undertaken. It was noted that the for-mula derived from the initial Australian database closely re-sembled the original Salamon-Munro expression. This some-what surprising resemblance prompted further research andenlargement of the database. The larger database yielded pillarstrengths that again were similar to those obtained from theinitial UNSW research and by Salamon and Munro. The com-bination of the Australian and South African databases re-inforced the original impression, namely, that the underlyingpillar strengths in these countries resembled each other closely.
The outcome of the investigation lends support to the viewexpressed by Mark and Barton [1996]. They suggested thatstrength values obtained in the laboratory cannot be utilized in
a meaningful way in pillar design and that the variation in thestrength of pillars of the same size can be disregarded in manyinstances. Mark and Barton [1996] emphasize that they do notclaim that the in situ strength of all U.S. coal is the same. Theirstudy merely showed that a uniform strength is a better approxi-mation than one based on laboratory testing. Although theUNSW research conclusions are encouraging, complacency isnot justified. The formulas are based on competent roof andfloor conditions. Significantly different pillar strengths may beassociated with abnormal strata behavior mechanisms. Becausepillars with w/h ratios greater than 10 have not been tested todestruction, it must also be recognized that neither linear norpower law formulas have been validated at w/h ratios greaterthan about 8.
It cannot be overemphasized that, because the design for-mulas have been developed on a probabilistic basis, they need tobe reviewed periodically as the database expands and the un-derstanding of pillar mechanics advances. A fundamental ruleof empirical research is that the results should be used within therange of data used in their derivation. Extrapolation withempirical formulas is always fraught with danger.
REFERENCES
Galvin JM, Hebblewhite BK [1995]. UNSW pillar design methodology.Sydney, Australia: University of New South Wales, School of Mining En-gineering, Research Release No. 1.
Hocking G, Anderson I, Salamon MDG [1995]. Coal pillar strength for-mulae and stability criteria. Sydney, Australia: University of New SouthWales, School of Mining Engineering, Research Report 1/95.
Madden BJ, Hardman DR [1992]. Long-term stability of bord-and-pillarworkings. In: Proceedings of the Symposium on Construction Over MinedAreas. Pretoria, Republic of South Africa.
Mark C, Barton TM [1996]. The uniaxial compressive strength of coal:should it be used to design pillars? In: Ozdemir L, Hanna K, Haramy KY,Peng S, eds. Proceedings of the 15th International Conference on Ground Con-trol in Mining. Golden, CO: Colorado School of Mines, pp. 61-78.
Salamon MDG, Munro AH [1966]. A study of the strength of coal pillars.Transvaal and Orange Free State Chamber of Mines, Research ReportNo. 71/66.
Salamon MDG, Munro AH [1967]. A study of the strength of coal pillars.J S Afr Inst Min Metall, pp. 55-67.

71
Salamon MDG, Wagner H [1985]. Practical experiences in the design ofcoal pillars. In: Green AR, ed. Proceedings of the 21st InternationalConference of Safety in Mines Research Institutes (Sydney, Australia).Balkema, pp. 3-9.
Salamon MDG, Galvin JM, Hocking G, Anderson I [1996]. Coal pillarstrength from back calculation. Sydney, Australia: University of New SouthWales, School of Mining Engineering, Research Report 1/96.
Wagner H [1974]. Determination of the complete load deformationcharacteristics of coal pillars. In: Proceedings of the Third InternationalCongress on Rock Mechanics. International Society for Rock Mechanics,pp. 1076-81.
Wagner H [1980]. Pillar design in coal mines. J S Afr Inst Min Metall,pp. 37-45.

72

73
PRACTICAL BOUNDARY-ELEMENT MODELING FOR MINE PLANNING
By Keith A. Heasley, Ph.D.,1 and Gregory J. Chekan2
ABSTRACT
As part of the initial investigation and validation of a new boundary-element formulation for stressmodeling in coal mines, the underground stresses and displacements at two multiple-seam coal mines withunique stress problems were modeled and predicted. The new program, LAMODEL, calculates stresses anddisplacements at the seam level and at requested locations in the overburden or at the surface. Both linearelastic and nonlinear seam materials can be used, and surface effects, multiple seams, and multiple miningsteps can be simulated. In order to most efficiently use LAMODEL for accurate stress prediction, the programis first calibrated to the site-specific geomechanics based on previously observed stress conditions at the mine.For this calibration process, a previously mined area is "stress mapped" by quantifying the observed pillar andstrata behavior using a numerical rating system. Then, the site-specific mechanical properties in the modelare adjusted to provide the best correlation between the predicted stresses and the observed underground stressrating. Once calibrated, the model is then used to predict future stress problems ahead of mining. At the twocase study mines, the calibrated models showed good correlation with the observed stresses and also accuratelypredicted upcoming high stress areas for preventive action by the mines.
1Supervisory physical scientist.2Mining engineer.Pittsburgh Research Laboratory, National Institute for Occupational Safety and Health, Pittsburgh, PA.
74
INTRODUCTION
Mine planners have a variety of modeling methods, bothempirical and numerical, for analyzing pillar stresses anddetermining safe pillar sizes for various mine geometries andgeologic structures. Empirical methods emphasize thecollection and interpretation of case histories of pillarperformance. The Analysis of Longwall Pillar Stability (ALPS)and Analysis of Retreat Mining Pillar Stability (ARMPS)programs are two such empirical programs that are derivedfrom large databases of real-world pillar studies and can beused for determining pillar sizes for single-seam longwall andretreat room-and-pillar mining, respectively [Mark 1992; Markand Chase 1997]. The Virginia Polytechnic Institute and StateUniversity, Blacksburg, VA, recently developed a comparableempirical program called Multi-Seam Analysis Package(MSAP) for sizing pillars for multiple-seam situations[Kanniganti 1993]. These empirical programs are closelylinked to reality and very user-friendly; for many typical mininggeometries, they work extremely well.
However, it is difficult to apply these empirical programs tomining situations beyond the scope of the original empiricaldatabase. Therefore, when complicated stress conditions arisefrom complex single- or multiple-seam mining geometries,numerical modeling techniques such as finite-element,boundary-element, discrete-element, or finite-difference areusually applied. In general, these numerical, or analytical,design methods are derived from the fundamental laws of force,stress, and elasticity. Their primary advantage is that they arevery flexible and can quickly analyze the effect of numerousgeometric and geologic variables on mine design. Theirprimary disadvantage is that they require difficult-to-obtainand/or controversial information about material properties,failure criteria, and postfailure mechanics. In this paper, thesolid foundation of empirical pillar design and in-mineobservation is combined with the flexibility of numericalmodeling to provide a practical technique for mine planning indifficult situations.
LAMODEL
In order to analyze the displacements and stresses associatedwith the extraction of large tabular deposits such as coal,potash, and other thin vein-type deposits, the displacement-discontinuity variation of the boundary-element technique isfrequently the method of choice. In the displacement-discontinuity approach, the mining horizon is treatedmathematically as a discontinuity in the displacement of thesurrounding media. Using this technique, only the planar areaof the seam needs to be discretized, or gridded, in order toobtain the stress and displacement solution on the seam. Often,this limited analysis is sufficient, because in many applicationsonly the distributions of stress and convergence on the seamhorizon are of interest. Also, by limiting the detailed analysisto only the seam, the displacement-discontinuity methodprovides considerable computational savings over othertechniques that discretize the entire body (such as finite-element, discrete-element, or finite-difference). It is a directresult of this computational efficiency that the displacement-discontinuity method is able to handle large areas of tabularexcavations, which is needed in many practical coal miningproblems.
A displacement-discontinuity program incorporating alaminated medium was recently developed by the NationalInstitute for Occupational Safety and Health, Pittsburgh
Research Laboratory; this new program is called LAMODEL.Traditional displacement-discontinuity programs use ahomogeneous isotropic elastic formulation that simulates theoverburden as one solid material. In contrast, the LAMODELprogram simulates the geologic overburden stratifications as astack of layers with frictionless interfaces. Specifically, eachlayer is homogeneous isotropic elastic and has the same elasticmodulus, Poisson's ratio, and thickness. This "homogeneouslayering" formulation does not require specifying the materialproperties for each individual layer, yet it still provides arealistic suppleness to the mining overburden that is notpossible with the classic homogeneous isotropic elasticoverburden model. From our experience, this supplenessprovides a more accurate strata response for modeling localdeformations, interseam interactions, and/or surface subsidence.The LAMODEL program calculates stresses and displacementsat the seam level and at requested locations in the overburdenor at the surface. Both linear elastic and nonlinear seammaterials can be used. The program also has the ability toanalyze (1) the interseam stresses resulting from multiple-seammining, (2) the effects of topographic relief on pillar stress andgob loading, (3) the stress changes during mining throughmultiple mining steps, and (4) the surface subsidence.
INITIAL MATERIAL PROPERTY GENERATION
As mentioned earlier, one of the most difficult aspects ofusing a numerical model is determining the correct (mostaccurate) material properties for input. After developingnumerous displacement-discontinuity models and then
comparing their results with field measurements andobservations, a fairly streamlined, systematic technique fordeveloping initial material properties was developed. Initially,the critical material properties (coal, gob, and rock mass) are
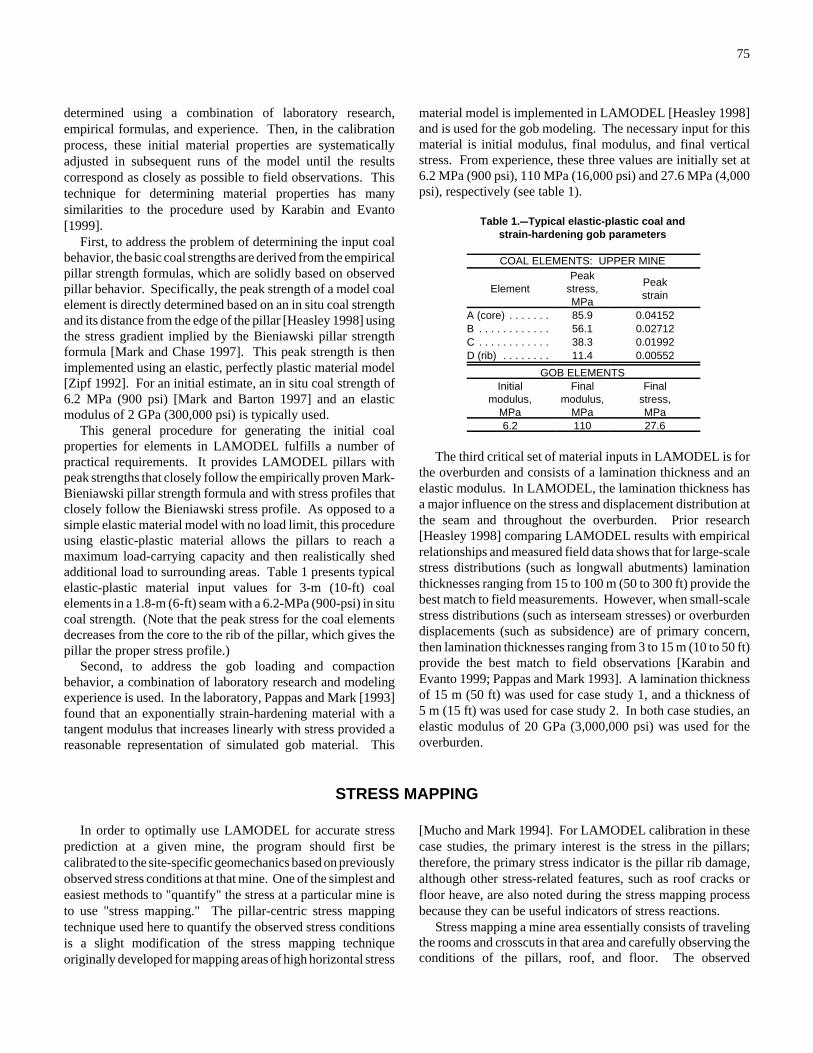
75
determined using a combination of laboratory research,empirical formulas, and experience. Then, in the calibrationprocess, these initial material properties are systematicallyadjusted in subsequent runs of the model until the resultscorrespond as closely as possible to field observations. Thistechnique for determining material properties has manysimilarities to the procedure used by Karabin and Evanto[1999].
First, to address the problem of determining the input coalbehavior, the basic coal strengths are derived from the empiricalpillar strength formulas, which are solidly based on observedpillar behavior. Specifically, the peak strength of a model coalelement is directly determined based on an in situ coal strengthand its distance from the edge of the pillar [Heasley 1998] usingthe stress gradient implied by the Bieniawski pillar strengthformula [Mark and Chase 1997]. This peak strength is thenimplemented using an elastic, perfectly plastic material model[Zipf 1992]. For an initial estimate, an in situ coal strength of6.2 MPa (900 psi) [Mark and Barton 1997] and an elasticmodulus of 2 GPa (300,000 psi) is typically used.
This general procedure for generating the initial coalproperties for elements in LAMODEL fulfills a number ofpractical requirements. It provides LAMODEL pillars withpeak strengths that closely follow the empirically proven Mark-Bieniawski pillar strength formula and with stress profiles thatclosely follow the Bieniawski stress profile. As opposed to asimple elastic material model with no load limit, this procedureusing elastic-plastic material allows the pillars to reach amaximum load-carrying capacity and then realistically shedadditional load to surrounding areas. Table 1 presents typicalelastic-plastic material input values for 3-m (10-ft) coalelements in a 1.8-m (6-ft) seam with a 6.2-MPa (900-psi) in situcoal strength. (Note that the peak stress for the coal elementsdecreases from the core to the rib of the pillar, which gives thepillar the proper stress profile.)
Second, to address the gob loading and compactionbehavior, a combination of laboratory research and modelingexperience is used. In the laboratory, Pappas and Mark [1993]found that an exponentially strain-hardening material with atangent modulus that increases linearly with stress provided areasonable representation of simulated gob material. This
material model is implemented in LAMODEL [Heasley 1998]and is used for the gob modeling. The necessary input for thismaterial is initial modulus, final modulus, and final verticalstress. From experience, these three values are initially set at6.2 MPa (900 psi), 110 MPa (16,000 psi) and 27.6 MPa (4,000psi), respectively (see table 1).
Table 1.CCTypical elastic-plastic coal andstrain-hardening gob parameters
COAL ELEMENTS: UPPER MINE
ElementPeak
stress,MPa
Peakstrain
A (core) . . . . . . . 85.9 0.04152B . . . . . . . . . . . . 56.1 0.02712C . . . . . . . . . . . . 38.3 0.01992D (rib) . . . . . . . . 11.4 0.00552
GOB ELEMENTSInitial
modulus,MPa
Finalmodulus,
MPa
Finalstress,MPa
6.2 110 27.6
The third critical set of material inputs in LAMODEL is forthe overburden and consists of a lamination thickness and anelastic modulus. In LAMODEL, the lamination thickness hasa major influence on the stress and displacement distribution atthe seam and throughout the overburden. Prior research[Heasley 1998] comparing LAMODEL results with empiricalrelationships and measured field data shows that for large-scalestress distributions (such as longwall abutments) laminationthicknesses ranging from 15 to 100 m (50 to 300 ft) provide thebest match to field measurements. However, when small-scalestress distributions (such as interseam stresses) or overburdendisplacements (such as subsidence) are of primary concern,then lamination thicknesses ranging from 3 to 15 m (10 to 50 ft)provide the best match to field observations [Karabin andEvanto 1999; Pappas and Mark 1993]. A lamination thicknessof 15 m (50 ft) was used for case study 1, and a thickness of5 m (15 ft) was used for case study 2. In both case studies, anelastic modulus of 20 GPa (3,000,000 psi) was used for theoverburden.
STRESS MAPPING
In order to optimally use LAMODEL for accurate stressprediction at a given mine, the program should first becalibrated to the site-specific geomechanics based on previouslyobserved stress conditions at that mine. One of the simplest andeasiest methods to "quantify" the stress at a particular mine isto use "stress mapping." The pillar-centric stress mappingtechnique used here to quantify the observed stress conditionsis a slight modification of the stress mapping techniqueoriginally developed for mapping areas of high horizontal stress
[Mucho and Mark 1994]. For LAMODEL calibration in thesecase studies, the primary interest is the stress in the pillars;therefore, the primary stress indicator is the pillar rib damage,although other stress-related features, such as roof cracks orfloor heave, are also noted during the stress mapping processbecause they can be useful indicators of stress reactions.
Stress mapping a mine area essentially consists of travelingthe rooms and crosscuts in that area and carefully observing theconditions of the pillars, roof, and floor. The observed
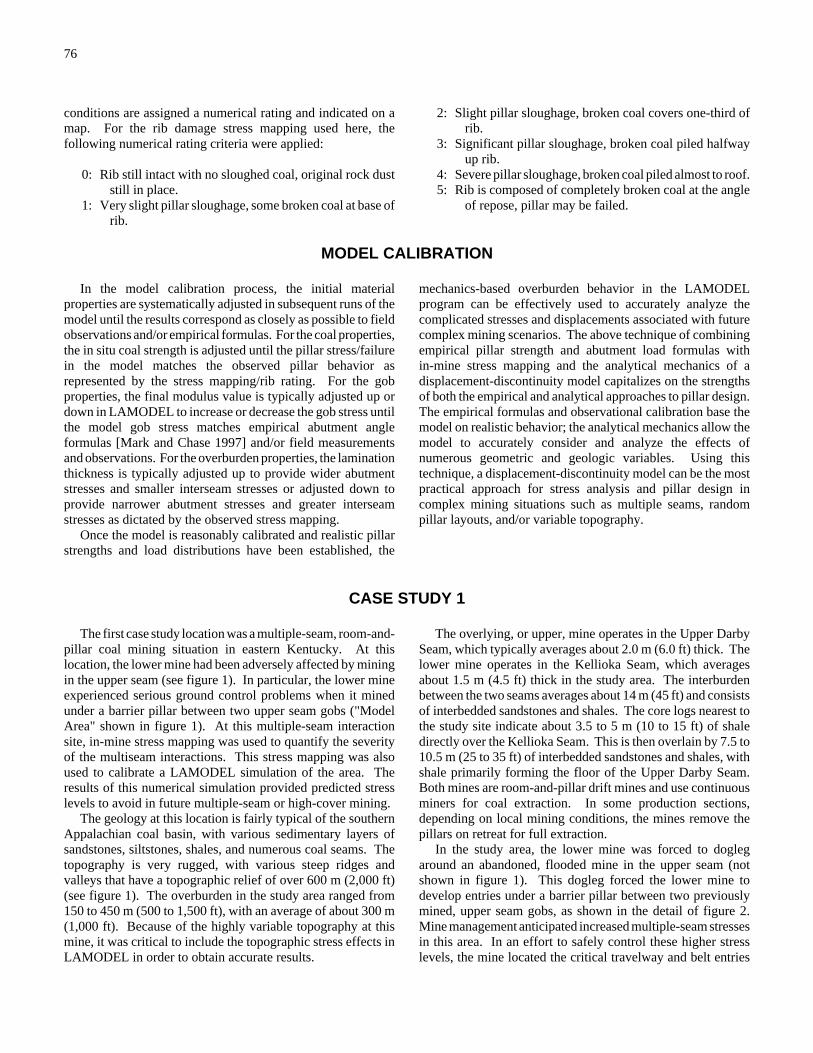
76
conditions are assigned a numerical rating and indicated on amap. For the rib damage stress mapping used here, thefollowing numerical rating criteria were applied:
0: Rib still intact with no sloughed coal, original rock dust still in place.
1: Very slight pillar sloughage, some broken coal at base of rib.
2: Slight pillar sloughage, broken coal covers one-third of rib.
3: Significant pillar sloughage, broken coal piled halfway up rib.
4: Severe pillar sloughage, broken coal piled almost to roof.5: Rib is composed of completely broken coal at the angle
of repose, pillar may be failed.
MODEL CALIBRATION
In the model calibration process, the initial materialproperties are systematically adjusted in subsequent runs of themodel until the results correspond as closely as possible to fieldobservations and/or empirical formulas. For the coal properties,the in situ coal strength is adjusted until the pillar stress/failurein the model matches the observed pillar behavior asrepresented by the stress mapping/rib rating. For the gobproperties, the final modulus value is typically adjusted up ordown in LAMODEL to increase or decrease the gob stress untilthe model gob stress matches empirical abutment angleformulas [Mark and Chase 1997] and/or field measurementsand observations. For the overburden properties, the laminationthickness is typically adjusted up to provide wider abutmentstresses and smaller interseam stresses or adjusted down toprovide narrower abutment stresses and greater interseamstresses as dictated by the observed stress mapping.
Once the model is reasonably calibrated and realistic pillarstrengths and load distributions have been established, the
mechanics-based overburden behavior in the LAMODELprogram can be effectively used to accurately analyze thecomplicated stresses and displacements associated with futurecomplex mining scenarios. The above technique of combiningempirical pillar strength and abutment load formulas within-mine stress mapping and the analytical mechanics of adisplacement-discontinuity model capitalizes on the strengthsof both the empirical and analytical approaches to pillar design.The empirical formulas and observational calibration base themodel on realistic behavior; the analytical mechanics allow themodel to accurately consider and analyze the effects ofnumerous geometric and geologic variables. Using thistechnique, a displacement-discontinuity model can be the mostpractical approach for stress analysis and pillar design incomplex mining situations such as multiple seams, randompillar layouts, and/or variable topography.
CASE STUDY 1
The first case study location was a multiple-seam, room-and-pillar coal mining situation in eastern Kentucky. At thislocation, the lower mine had been adversely affected by miningin the upper seam (see figure 1). In particular, the lower mineexperienced serious ground control problems when it minedunder a barrier pillar between two upper seam gobs ("ModelArea" shown in figure 1). At this multiple-seam interactionsite, in-mine stress mapping was used to quantify the severityof the multiseam interactions. This stress mapping was alsoused to calibrate a LAMODEL simulation of the area. Theresults of this numerical simulation provided predicted stresslevels to avoid in future multiple-seam or high-cover mining.
The geology at this location is fairly typical of the southernAppalachian coal basin, with various sedimentary layers ofsandstones, siltstones, shales, and numerous coal seams. Thetopography is very rugged, with various steep ridges andvalleys that have a topographic relief of over 600 m (2,000 ft)(see figure 1). The overburden in the study area ranged from150 to 450 m (500 to 1,500 ft), with an average of about 300 m(1,000 ft). Because of the highly variable topography at thismine, it was critical to include the topographic stress effects inLAMODEL in order to obtain accurate results.
The overlying, or upper, mine operates in the Upper DarbySeam, which typically averages about 2.0 m (6.0 ft) thick. Thelower mine operates in the Kellioka Seam, which averagesabout 1.5 m (4.5 ft) thick in the study area. The interburdenbetween the two seams averages about 14 m (45 ft) and consistsof interbedded sandstones and shales. The core logs nearest tothe study site indicate about 3.5 to 5 m (10 to 15 ft) of shaledirectly over the Kellioka Seam. This is then overlain by 7.5 to10.5 m (25 to 35 ft) of interbedded sandstones and shales, withshale primarily forming the floor of the Upper Darby Seam.Both mines are room-and-pillar drift mines and use continuousminers for coal extraction. In some production sections,depending on local mining conditions, the mines remove thepillars on retreat for full extraction.
In the study area, the lower mine was forced to doglegaround an abandoned, flooded mine in the upper seam (notshown in figure 1). This dogleg forced the lower mine todevelop entries under a barrier pillar between two previouslymined, upper seam gobs, as shown in the detail of figure 2.Mine management anticipated increased multiple-seam stressesin this area. In an effort to safely control these higher stresslevels, the mine located the critical travelway and belt entries
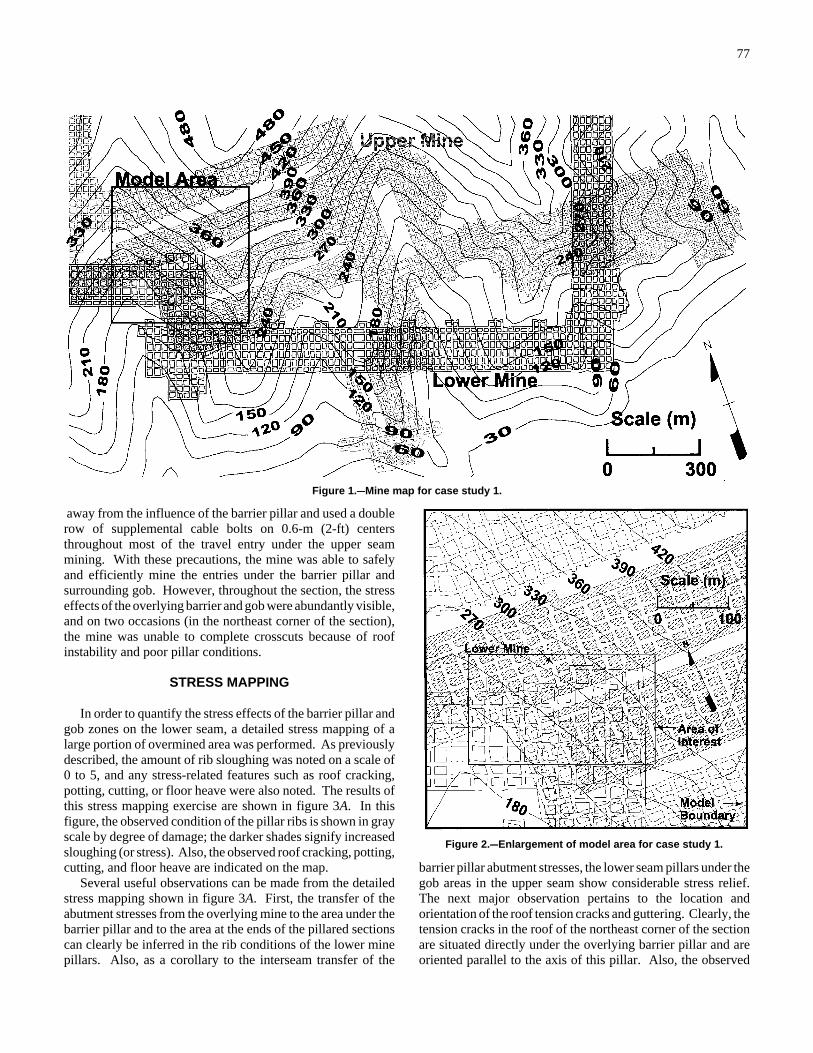
77
Figure 1.CCMine map for case study 1.
Figure 2.CCEnlargement of model area for case study 1.
away from the influence of the barrier pillar and used a doublerow of supplemental cable bolts on 0.6-m (2-ft) centersthroughout most of the travel entry under the upper seammining. With these precautions, the mine was able to safelyand efficiently mine the entries under the barrier pillar andsurrounding gob. However, throughout the section, the stresseffects of the overlying barrier and gob were abundantly visible,and on two occasions (in the northeast corner of the section),the mine was unable to complete crosscuts because of roofinstability and poor pillar conditions.
STRESS MAPPING
In order to quantify the stress effects of the barrier pillar andgob zones on the lower seam, a detailed stress mapping of alarge portion of overmined area was performed. As previouslydescribed, the amount of rib sloughing was noted on a scale of0 to 5, and any stress-related features such as roof cracking,potting, cutting, or floor heave were also noted. The results ofthis stress mapping exercise are shown in figure 3A. In thisfigure, the observed condition of the pillar ribs is shown in grayscale by degree of damage; the darker shades signify increasedsloughing (or stress). Also, the observed roof cracking, potting,cutting, and floor heave are indicated on the map.
Several useful observations can be made from the detailedstress mapping shown in figure 3A. First, the transfer of theabutment stresses from the overlying mine to the area under thebarrier pillar and to the area at the ends of the pillared sectionscan clearly be inferred in the rib conditions of the lower minepillars. Also, as a corollary to the interseam transfer of the
barrier pillar abutment stresses, the lower seam pillars under thegob areas in the upper seam show considerable stress relief.The next major observation pertains to the location andorientation of the roof tension cracks and guttering. Clearly, thetension cracks in the roof of the northeast corner of the sectionare situated directly under the overlying barrier pillar and areoriented parallel to the axis of this pillar. Also, the observed
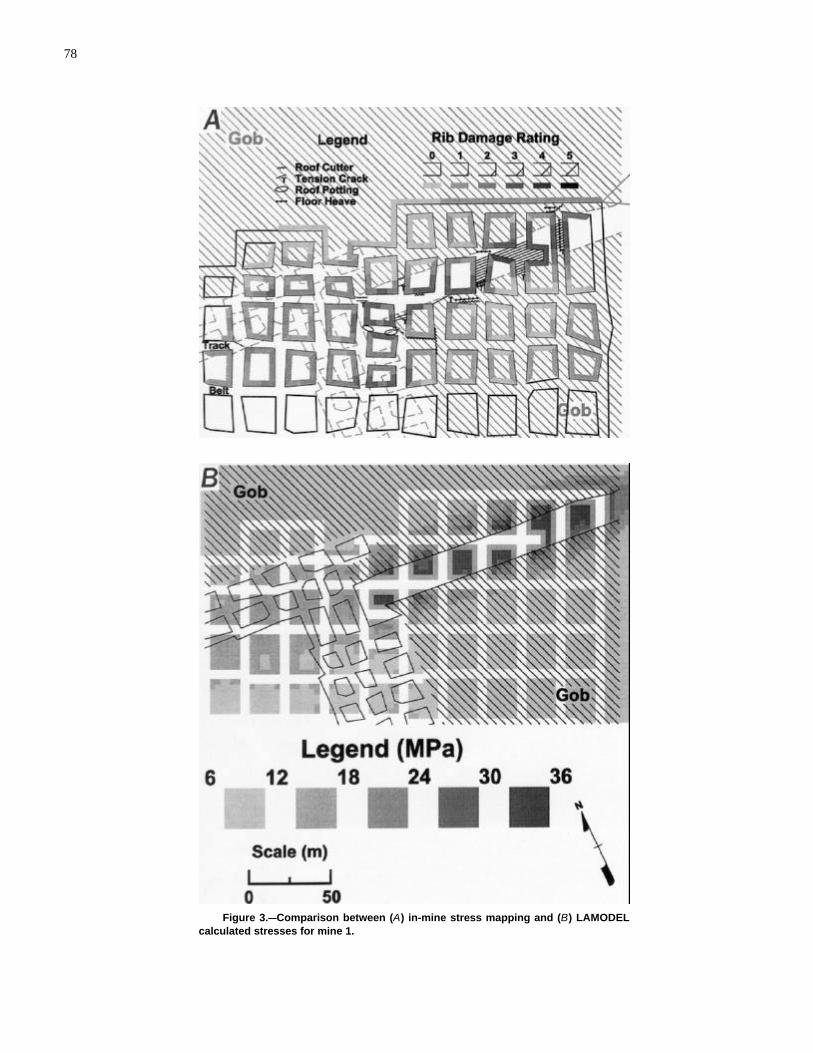
78
Figure 3.CCComparison between (A) in-mine stress mapping and (B) LAMODELcalculated stresses for mine 1.
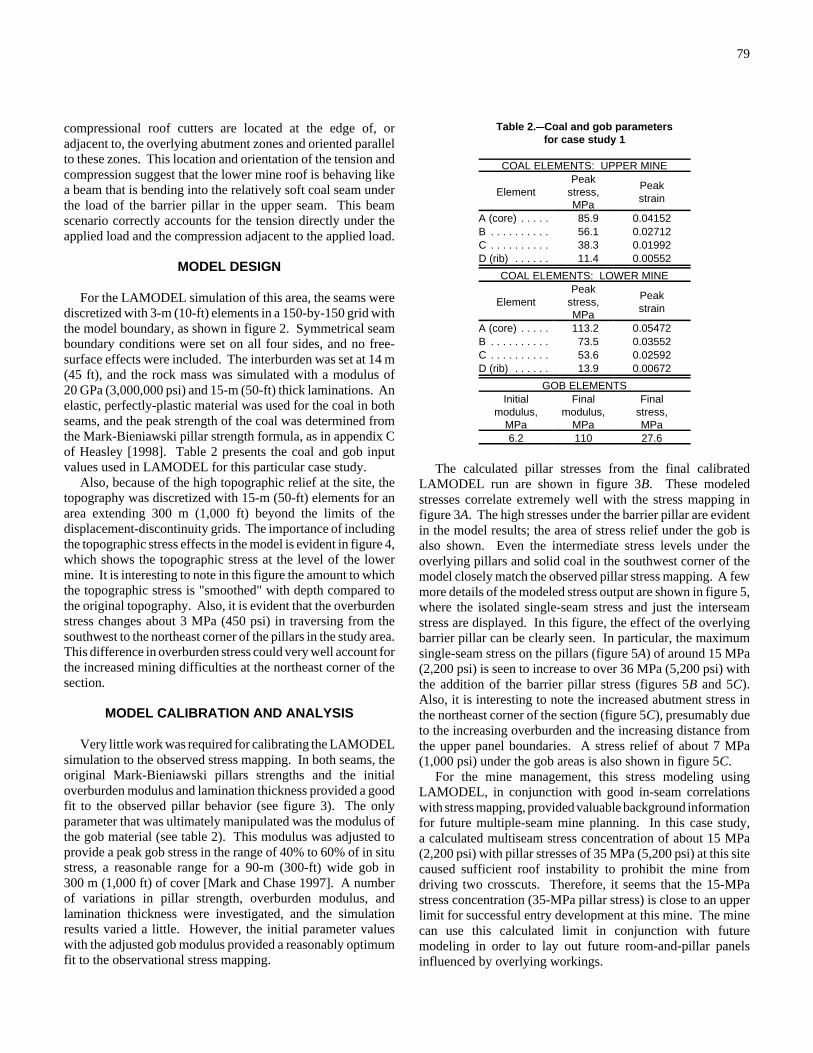
79
compressional roof cutters are located at the edge of, oradjacent to, the overlying abutment zones and oriented parallelto these zones. This location and orientation of the tension andcompression suggest that the lower mine roof is behaving likea beam that is bending into the relatively soft coal seam underthe load of the barrier pillar in the upper seam. This beamscenario correctly accounts for the tension directly under theapplied load and the compression adjacent to the applied load.
MODEL DESIGN
For the LAMODEL simulation of this area, the seams werediscretized with 3-m (10-ft) elements in a 150-by-150 grid withthe model boundary, as shown in figure 2. Symmetrical seamboundary conditions were set on all four sides, and no free-surface effects were included. The interburden was set at 14 m(45 ft), and the rock mass was simulated with a modulus of20 GPa (3,000,000 psi) and 15-m (50-ft) thick laminations. Anelastic, perfectly-plastic material was used for the coal in bothseams, and the peak strength of the coal was determined fromthe Mark-Bieniawski pillar strength formula, as in appendix Cof Heasley [1998]. Table 2 presents the coal and gob inputvalues used in LAMODEL for this particular case study.
Also, because of the high topographic relief at the site, thetopography was discretized with 15-m (50-ft) elements for anarea extending 300 m (1,000 ft) beyond the limits of thedisplacement-discontinuity grids. The importance of includingthe topographic stress effects in the model is evident in figure 4,which shows the topographic stress at the level of the lowermine. It is interesting to note in this figure the amount to whichthe topographic stress is "smoothed" with depth compared tothe original topography. Also, it is evident that the overburdenstress changes about 3 MPa (450 psi) in traversing from thesouthwest to the northeast corner of the pillars in the study area.This difference in overburden stress could very well account forthe increased mining difficulties at the northeast corner of thesection.
MODEL CALIBRATION AND ANALYSIS
Very little work was required for calibrating the LAMODELsimulation to the observed stress mapping. In both seams, theoriginal Mark-Bieniawski pillars strengths and the initialoverburden modulus and lamination thickness provided a goodfit to the observed pillar behavior (see figure 3). The onlyparameter that was ultimately manipulated was the modulus ofthe gob material (see table 2). This modulus was adjusted toprovide a peak gob stress in the range of 40% to 60% of in situstress, a reasonable range for a 90-m (300-ft) wide gob in300 m (1,000 ft) of cover [Mark and Chase 1997]. A numberof variations in pillar strength, overburden modulus, andlamination thickness were investigated, and the simulationresults varied a little. However, the initial parameter valueswith the adjusted gob modulus provided a reasonably optimumfit to the observational stress mapping.
Table 2.CCCoal and gob parametersfor case study 1
COAL ELEMENTS: UPPER MINE
ElementPeak
stress,MPa
Peakstrain
A (core) . . . . . 85.9 0.04152B . . . . . . . . . . 56.1 0.02712C . . . . . . . . . . 38.3 0.01992D (rib) . . . . . . 11.4 0.00552
COAL ELEMENTS: LOWER MINE
ElementPeak
stress,MPa
Peakstrain
A (core) . . . . . 113.2 0.05472B . . . . . . . . . . 73.5 0.03552C . . . . . . . . . . 53.6 0.02592D (rib) . . . . . . 13.9 0.00672
GOB ELEMENTSInitial
modulus,MPa
Finalmodulus,
MPa
Finalstress,MPa
6.2 110 27.6
The calculated pillar stresses from the final calibratedLAMODEL run are shown in figure 3B. These modeledstresses correlate extremely well with the stress mapping infigure 3A. The high stresses under the barrier pillar are evidentin the model results; the area of stress relief under the gob isalso shown. Even the intermediate stress levels under theoverlying pillars and solid coal in the southwest corner of themodel closely match the observed pillar stress mapping. A fewmore details of the modeled stress output are shown in figure 5,where the isolated single-seam stress and just the interseamstress are displayed. In this figure, the effect of the overlyingbarrier pillar can be clearly seen. In particular, the maximumsingle-seam stress on the pillars (figure 5A) of around 15 MPa(2,200 psi) is seen to increase to over 36 MPa (5,200 psi) withthe addition of the barrier pillar stress (figures 5B and 5C).Also, it is interesting to note the increased abutment stress inthe northeast corner of the section (figure 5C), presumably dueto the increasing overburden and the increasing distance fromthe upper panel boundaries. A stress relief of about 7 MPa(1,000 psi) under the gob areas is also shown in figure 5C.
For the mine management, this stress modeling usingLAMODEL, in conjunction with good in-seam correlationswith stress mapping, provided valuable background informationfor future multiple-seam mine planning. In this case study,a calculated multiseam stress concentration of about 15 MPa(2,200 psi) with pillar stresses of 35 MPa (5,200 psi) at this sitecaused sufficient roof instability to prohibit the mine fromdriving two crosscuts. Therefore, it seems that the 15-MPastress concentration (35-MPa pillar stress) is close to an upperlimit for successful entry development at this mine. The minecan use this calculated limit in conjunction with futuremodeling in order to lay out future room-and-pillar panelsinfluenced by overlying workings.
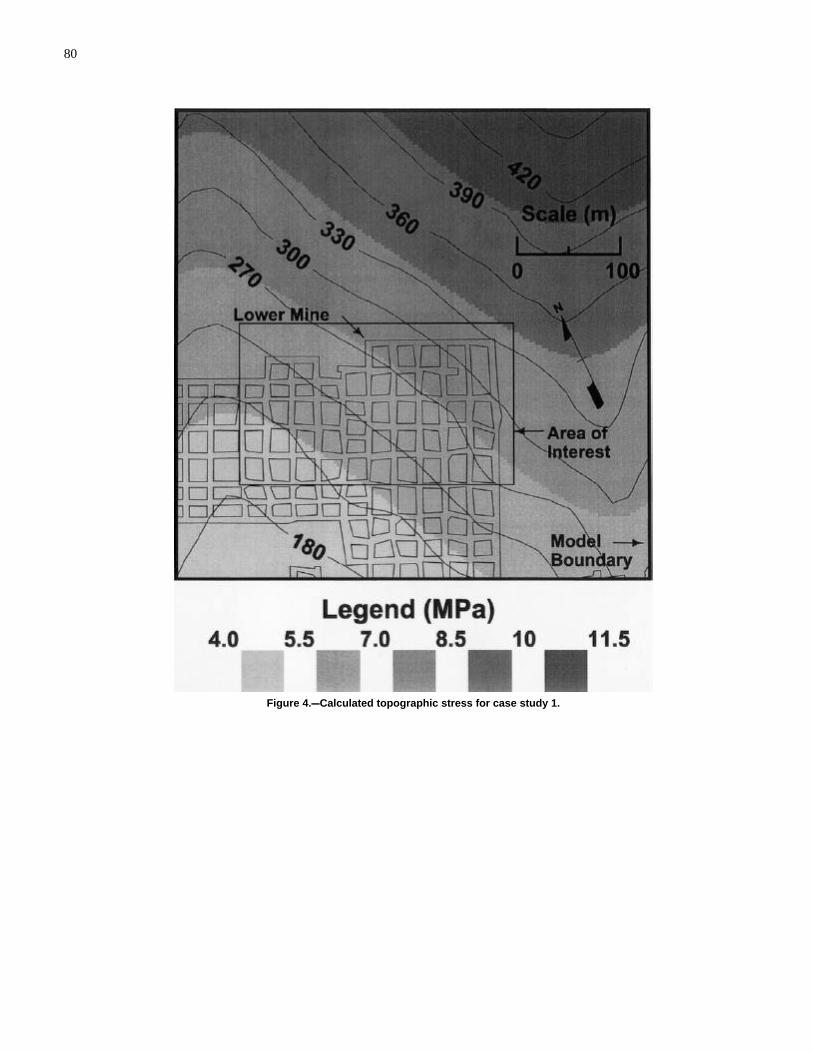
80
Figure 4.CCCalculated topographic stress for case study 1.
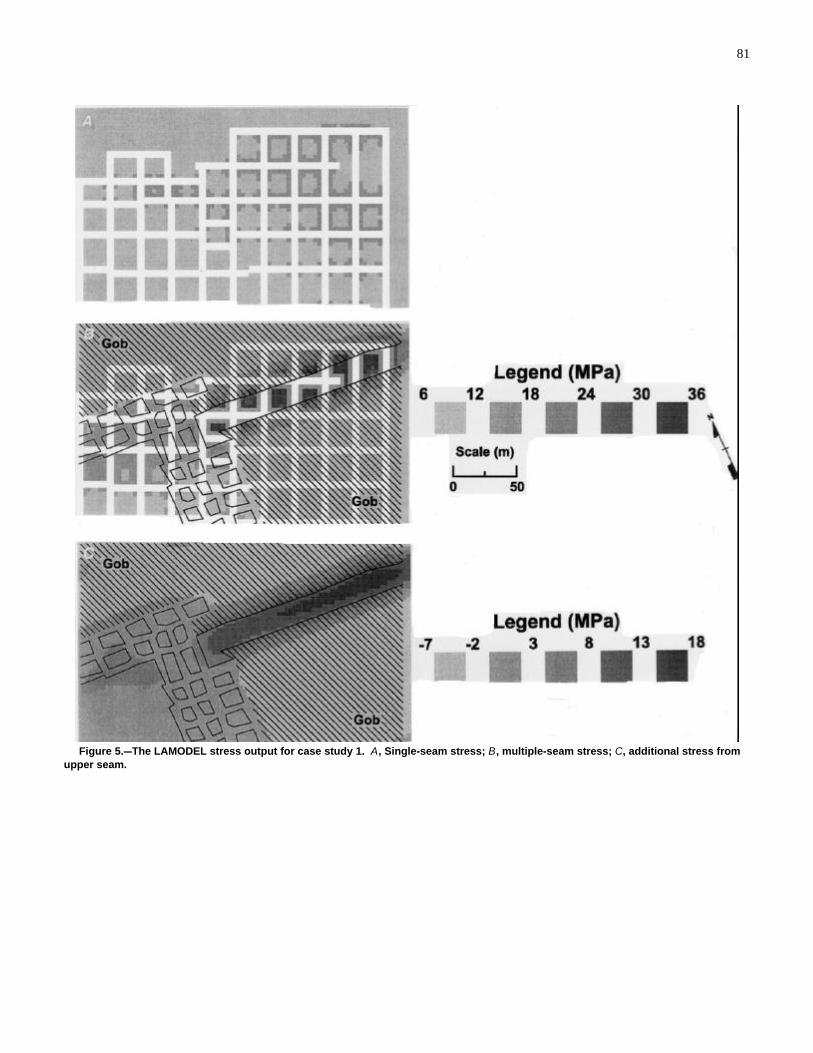
81
Figure 5.CCThe LAMODEL stress output for case study 1. A, Single-seam stress; B, multiple-seam stress; C, additional stress fromupper seam.
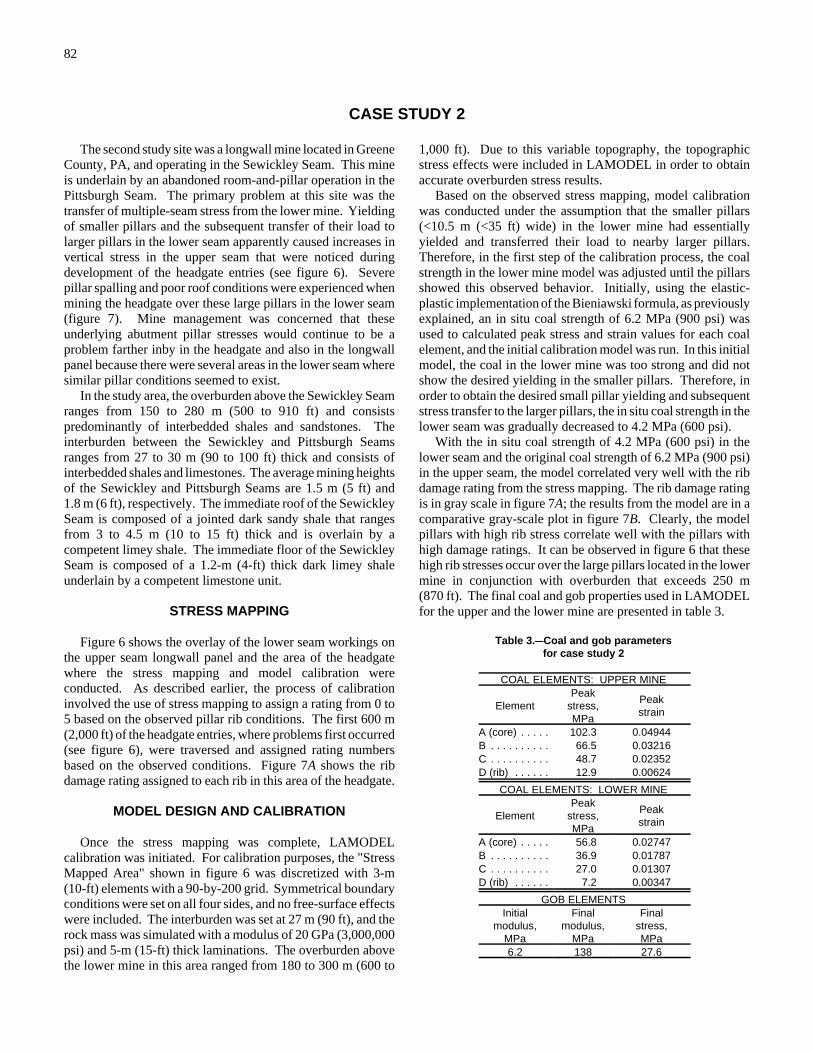
82
CASE STUDY 2
The second study site was a longwall mine located in GreeneCounty, PA, and operating in the Sewickley Seam. This mineis underlain by an abandoned room-and-pillar operation in thePittsburgh Seam. The primary problem at this site was thetransfer of multiple-seam stress from the lower mine. Yieldingof smaller pillars and the subsequent transfer of their load tolarger pillars in the lower seam apparently caused increases invertical stress in the upper seam that were noticed duringdevelopment of the headgate entries (see figure 6). Severepillar spalling and poor roof conditions were experienced whenmining the headgate over these large pillars in the lower seam(figure 7). Mine management was concerned that theseunderlying abutment pillar stresses would continue to be aproblem farther inby in the headgate and also in the longwallpanel because there were several areas in the lower seam wheresimilar pillar conditions seemed to exist.
In the study area, the overburden above the Sewickley Seamranges from 150 to 280 m (500 to 910 ft) and consistspredominantly of interbedded shales and sandstones. Theinterburden between the Sewickley and Pittsburgh Seamsranges from 27 to 30 m (90 to 100 ft) thick and consists ofinterbedded shales and limestones. The average mining heightsof the Sewickley and Pittsburgh Seams are 1.5 m (5 ft) and1.8 m (6 ft), respectively. The immediate roof of the SewickleySeam is composed of a jointed dark sandy shale that rangesfrom 3 to 4.5 m (10 to 15 ft) thick and is overlain by acompetent limey shale. The immediate floor of the SewickleySeam is composed of a 1.2-m (4-ft) thick dark limey shaleunderlain by a competent limestone unit.
STRESS MAPPING
Figure 6 shows the overlay of the lower seam workings onthe upper seam longwall panel and the area of the headgatewhere the stress mapping and model calibration wereconducted. As described earlier, the process of calibrationinvolved the use of stress mapping to assign a rating from 0 to5 based on the observed pillar rib conditions. The first 600 m(2,000 ft) of the headgate entries, where problems first occurred(see figure 6), were traversed and assigned rating numbersbased on the observed conditions. Figure 7A shows the ribdamage rating assigned to each rib in this area of the headgate.
MODEL DESIGN AND CALIBRATION
Once the stress mapping was complete, LAMODELcalibration was initiated. For calibration purposes, the "StressMapped Area" shown in figure 6 was discretized with 3-m(10-ft) elements with a 90-by-200 grid. Symmetrical boundaryconditions were set on all four sides, and no free-surface effectswere included. The interburden was set at 27 m (90 ft), and therock mass was simulated with a modulus of 20 GPa (3,000,000psi) and 5-m (15-ft) thick laminations. The overburden abovethe lower mine in this area ranged from 180 to 300 m (600 to
1,000 ft). Due to this variable topography, the topographicstress effects were included in LAMODEL in order to obtainaccurate overburden stress results.
Based on the observed stress mapping, model calibrationwas conducted under the assumption that the smaller pillars(<10.5 m (<35 ft) wide) in the lower mine had essentiallyyielded and transferred their load to nearby larger pillars.Therefore, in the first step of the calibration process, the coalstrength in the lower mine model was adjusted until the pillarsshowed this observed behavior. Initially, using the elastic-plastic implementation of the Bieniawski formula, as previouslyexplained, an in situ coal strength of 6.2 MPa (900 psi) wasused to calculated peak stress and strain values for each coalelement, and the initial calibration model was run. In this initialmodel, the coal in the lower mine was too strong and did notshow the desired yielding in the smaller pillars. Therefore, inorder to obtain the desired small pillar yielding and subsequentstress transfer to the larger pillars, the in situ coal strength in thelower seam was gradually decreased to 4.2 MPa (600 psi).
With the in situ coal strength of 4.2 MPa (600 psi) in thelower seam and the original coal strength of 6.2 MPa (900 psi)in the upper seam, the model correlated very well with the ribdamage rating from the stress mapping. The rib damage ratingis in gray scale in figure 7A; the results from the model are in acomparative gray-scale plot in figure 7B. Clearly, the modelpillars with high rib stress correlate well with the pillars withhigh damage ratings. It can be observed in figure 6 that thesehigh rib stresses occur over the large pillars located in the lowermine in conjunction with overburden that exceeds 250 m(870 ft). The final coal and gob properties used in LAMODELfor the upper and the lower mine are presented in table 3.
Table 3.CCCoal and gob parametersfor case study 2
COAL ELEMENTS: UPPER MINE
ElementPeak
stress,MPa
Peakstrain
A (core) . . . . . 102.3 0.04944B . . . . . . . . . . 66.5 0.03216C . . . . . . . . . . 48.7 0.02352D (rib) . . . . . . 12.9 0.00624
COAL ELEMENTS: LOWER MINE
ElementPeak
stress,MPa
Peakstrain
A (core) . . . . . 56.8 0.02747B . . . . . . . . . . 36.9 0.01787C . . . . . . . . . . 27.0 0.01307D (rib) . . . . . . 7.2 0.00347
GOB ELEMENTSInitial
modulus,MPa
Finalmodulus,
MPa
Finalstress,MPa
6.2 138 27.6
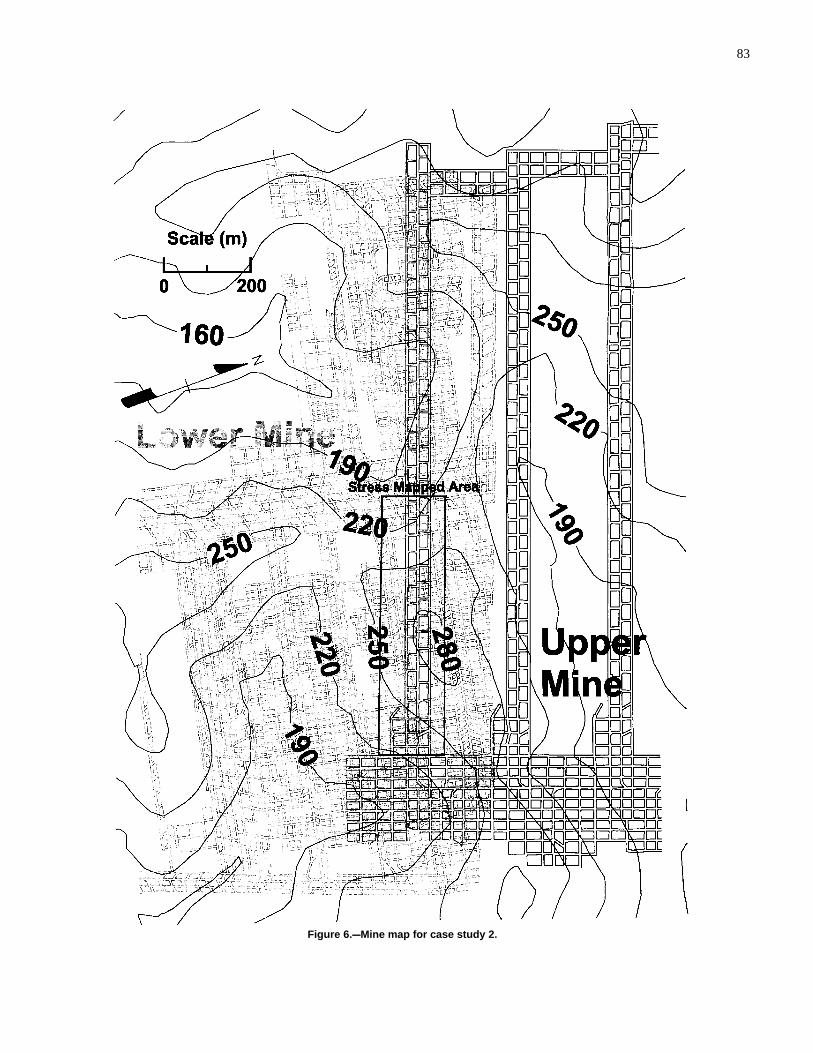
83
Figure 6.CCMine map for case study 2.
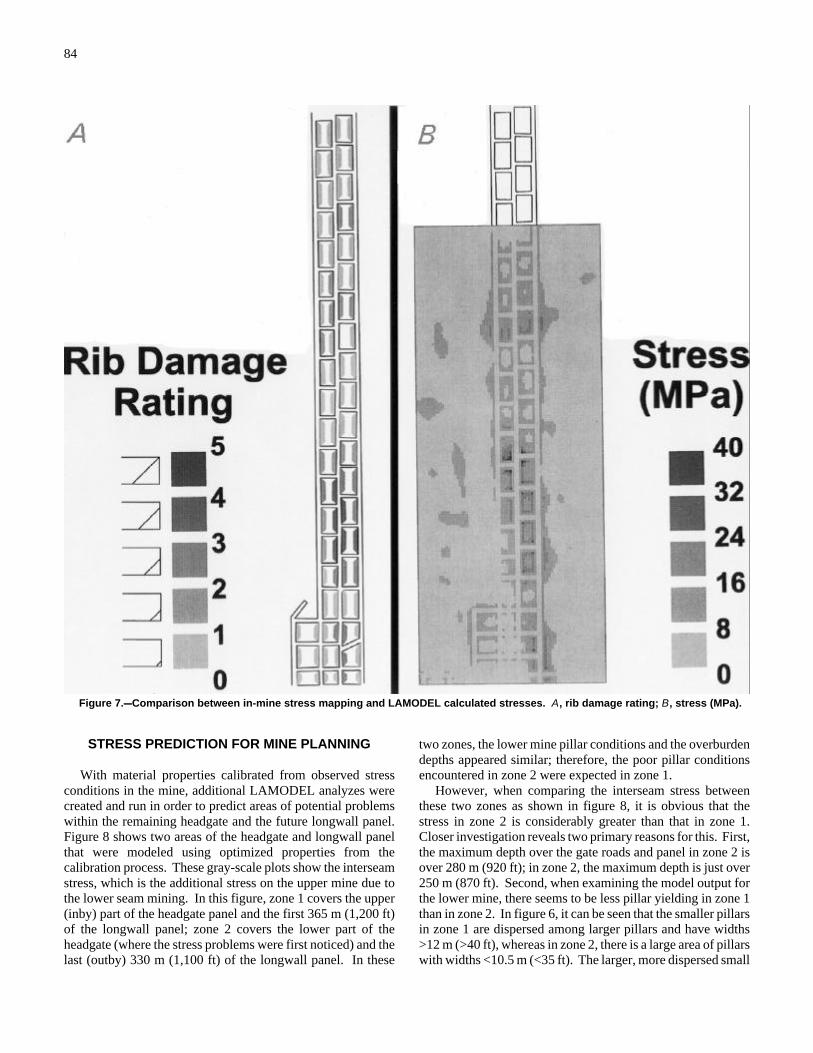
84
Figure 7.CCComparison between in-mine stress mapping and LAMODEL calculated stresses. A, rib damage rating; B, stress (MPa).
STRESS PREDICTION FOR MINE PLANNING
With material properties calibrated from observed stressconditions in the mine, additional LAMODEL analyzes werecreated and run in order to predict areas of potential problemswithin the remaining headgate and the future longwall panel.Figure 8 shows two areas of the headgate and longwall panelthat were modeled using optimized properties from thecalibration process. These gray-scale plots show the interseamstress, which is the additional stress on the upper mine due tothe lower seam mining. In this figure, zone 1 covers the upper(inby) part of the headgate panel and the first 365 m (1,200 ft)of the longwall panel; zone 2 covers the lower part of theheadgate (where the stress problems were first noticed) and thelast (outby) 330 m (1,100 ft) of the longwall panel. In these
two zones, the lower mine pillar conditions and the overburdendepths appeared similar; therefore, the poor pillar conditionsencountered in zone 2 were expected in zone 1.
However, when comparing the interseam stress betweenthese two zones as shown in figure 8, it is obvious that thestress in zone 2 is considerably greater than that in zone 1.Closer investigation reveals two primary reasons for this. First,the maximum depth over the gate roads and panel in zone 2 isover 280 m (920 ft); in zone 2, the maximum depth is just over250 m (870 ft). Second, when examining the model output forthe lower mine, there seems to be less pillar yielding in zone 1than in zone 2. In figure 6, it can be seen that the smaller pillarsin zone 1 are dispersed among larger pillars and have widths>12 m (>40 ft), whereas in zone 2, there is a large area of pillarswith widths <10.5 m (<35 ft). The larger, more dispersed small
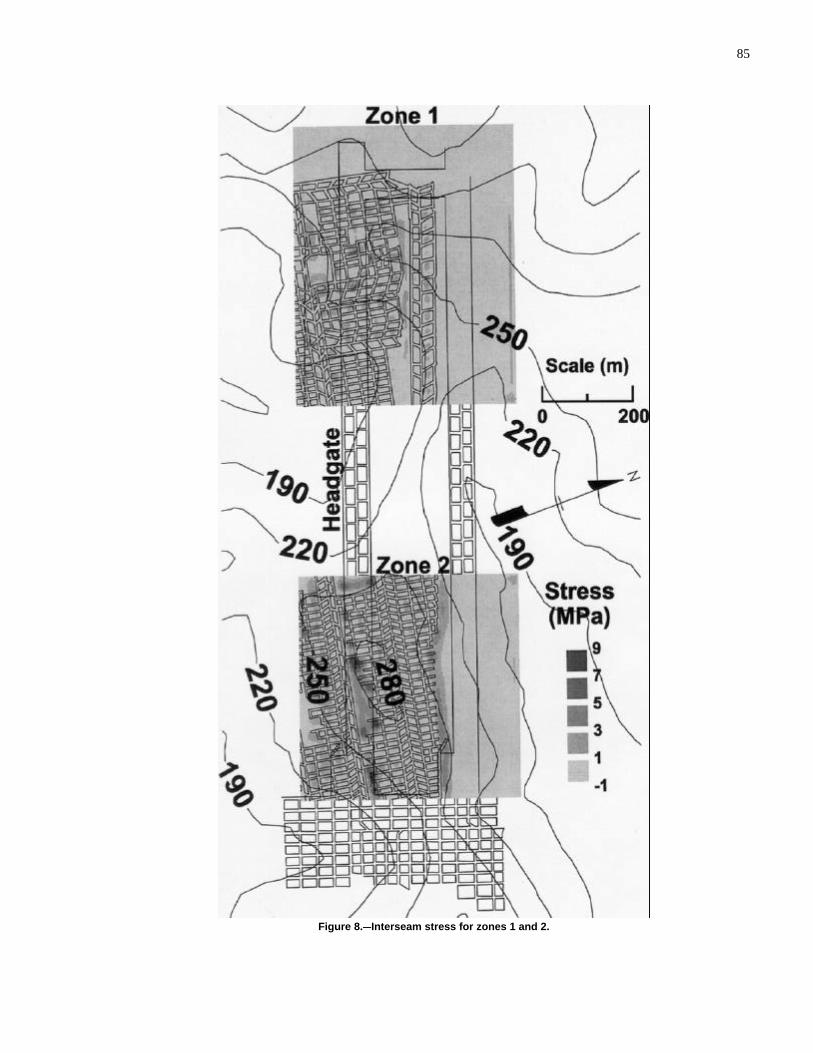
85
Figure 8.CCInterseam stress for zones 1 and 2.
86
pillars in zone 1 suffer less pillar yielding and therefore causeless load transfer (or interseam stress) on the upper mine (seefigure 8). During headgate development in zone 1, no pillarproblems were encountered. Thus, the calibrated modelsuccessfully predicted the reduced stress conditions in theheadgate of zone 1.
The mine management was also concerned about themultiple-seam stresses adversely affecting the retreatinglongwall panel. In particular, a large, irregularly shaped barrierpillar in the lower mine is superimposed under the center lineof the initial half of the longwall panel in zone 1 (see figure 8).However, the interseam stress calculated by the model from thisbarrier pillar reaches only about 3 MPa (450 psi). When thepanel was mined, this slightly increased face stress presentedvery little problem. Some slight spalling was present on theface during the extraction, but overall face conditions weregenerally good and no severe ground control problems wereevident.
However, in the lower part of the panel near the headgatelocation where poor ground conditions were first encountered(see zone 2, figure 8), an area of interseam stress up to 9 MPa(1,300 psi) is evident in the panel. Because of the underlyingbarrier pillar, the mine anticipated difficult face conditions in
this area. Indeed, when the longwall face reached this area,ground control problems that included severe face spalling andpoor roof condition in the headgate entries were encountered.In fact, the stress interaction with the lower seam was severeenough to stop the longwall face about 15 m (50 ft) short of thelongwall recovery chute and make recovery of the supportsdifficult.
When comparing conditions in zone 1 with those of zone 2,there seems to be a very fine line in the occurrence of groundcontrol problems in the upper seam depending on theoverburden depth and the pillar size in the lower seam.Problems were more likely to occur when the depth of coverover the Sewickley Seam exceeded 250 m (820 ft) and whenlarge areas of narrow pillars (<10.5 m (<35 ft) wide) in thelower seam were located adjacent to a larger barrier pillar.These conditions caused yielding of the narrow pillars and theshedding of their load to the adjacent larger pillar. Thisconcentrated abutment stress was then transferred to the uppermine, resulting in poor ground conditions in areas of theheadgate entry and longwall panel. Throughout this case study,the calibrated LAMODEL program successfully predicted thehigh stress areas in advance of mining.
CONCLUSIONS
The primary purpose of the case studies presented in thispaper was to validate the new LAMODEL boundary-elementprogram and investigate its utility for stress modeling in mineplanning. Based on the comparisons between the stressmapping and the model results for the two case studies, it seemsthat the LAMODEL program can be calibrated to produce goodcorrelations with the observed stresses. In addition, oncerealistic pillar strengths and load distributions were establishedby calibration, the mechanics-based overburden behavior inLAMODEL effectively analyzed the complicated stresses anddisplacements associated with the complex multiple-seammining scenarios and successfully predicted upcoming highstress conditions in advance of mining for preventive action bymine management. In case study 1, a calculated multiseamstress concentration of around 15 MPa (2,200 psi) with pillarstresses of 35 MPa (5,200 psi) seemed to be an upper limit forsuccessful entry development at this mine. Similarly, in casestudy 2, a calculated multiple-seam stress concentration of9 MPa (1,300 psi) produced severe face spalling and poor roofconditions in the headgate entries, whereas a 3-MPa (450-psi)stress concentration was barely noticeable.
A secondary goal was to present a fairly streamlined,systematic methodology for developing initial materialproperties and then calibrating these properties to fieldobservations. Initially, the critical material properties (coal,gob, and rock mass) are developed using a combination oflaboratory research, empirical formulas, and experience. Then,in the calibration process, a previously mined area is "stressmapped" by quantifying the observed pillar and strata behaviorusing a simple numerical rating system. Finally, the initialmaterial properties are systematically adjusted in subsequentruns of the model until the results provide the best correlationbetween the predicted stresses and the observed undergroundstress rating. This methodology of combining empirical pillarstrength and abutment load formulas with in-mine stressmapping and the analytical mechanics of a displacement-discontinuity model capitalizes on the strengths of both theempirical and analytical approaches to pillar design to providea practical technique for mine planning in difficult situations.

87
REFERENCES
Heasley KA [1998]. Numerical modeling of coal mines with a laminateddisplacement-discontinuity code [Dissertation]. Golden, CO: Colorado Schoolof Mines, Department of Mining and Earth Systems Engineering.
Kanniganti RS [1993]. Interactive prediction software for underlyingmulti-seam design [Thesis]. Blacksburg, VA: Virginia Polytechnic Instituteand State University, Department of Mining and Minerals Engineering.
Karabin GJ, Evanto MA [1999]. Experience with the boundary-elementmethod of numerical modeling to resolve complex ground control problems.In: Proceedings of the Second International Workshop on Coal PillarMechanics and Design. Pittsburgh, PA: U.S. Department of Health and HumanServices, Public Health Service, Centers for Disease Control and Prevention,National Institute for Occupational Safety and Health, DHHS (NIOSH)Publication No. 99-114, IC 9448.
Mark C [1992]. Analysis of longwall pillar stability (ALPS): an update.In: Proceedings of the Workshop on Coal Pillar Mechanics and Design.Pittsburgh, PA: U.S. Department of the Interior, Bureau of Mines, IC 9315,pp. 238-249.
Mark C, Barton TM [1997]. Pillar design and coal strength. In:Proceedings - New Technology for Ground Control in Retreat Mining.
Pittsburgh, PA: U.S. Department of Health and Human Services, Public HealthService, Centers for Disease Control and Prevention, National Institute forOccupational Safety and Health, DHHS (NIOSH) Publication No. 97-122,IC 9446, pp. 49-59.
Mark C, Chase FE [1997]. Analysis of retreat mining pillar stability(ARMPS). In: Proceedings - New Technology for Ground Control in RetreatMining. Pittsburgh, PA: U.S. Department of Health and Human Services,Public Health Service, Centers for Disease Control and Prevention, NationalInstitute for Occupational Safety and Health, DHHS (NIOSH) PublicationNo. 97-122, IC 9446, pp. 17-34.
Mucho TP, Mark C [1994]. Determining horizontal stress direction usingthe stress mapping technique. In: Peng SS, ed. Proceedings of the 13thInternational Conference on Ground Control in Mining. Morgantown, WV:West Virginia University, pp. 277-289.
Pappas DM, Mark C [1993]. Behavior of simulated longwall gob material.Pittsburgh, PA: U.S. Department of the Interior, Bureau of Mines, RI 9458.
Zipf RK Jr. [1992]. MULSIM/NL theoretical and programmer's manual.Pittsburgh, PA: U.S. Department of the Interior, Bureau of Mines, IC 9321.
89
EXPERIENCE WITH THE BOUNDARY-ELEMENT METHODOF NUMERICAL MODELING TO RESOLVE COMPLEX
GROUND CONTROL PROBLEMS
By George J. Karabin, P.E.,1 and Michael A. Evanto, P.G.2
ABSTRACT
The Mine Safety and Health Administration, Pittsburgh Safety and Health Technology Center, Roof ControlDivision, is routinely involved in the evaluation of ground conditions in underground coal mines. Assessingthe stability of mined areas and the compatibility of mining plans with existing conditions is essential toensuring a safe working environment for mine workers at a given site. Since 1985, the Roof Control Divisionhas successfully used the boundary-element method of numerical modeling to aid in the resolution of complexground control problems. This paper presents an overview of the modeling methodology and details oftechniques currently used to generate coal seam, rock mass, and gob backfill input data. A summary of coaland rock properties used in numerous successful evaluations throughout the United States is included, and aset of deterioration indices that can aid in the quantification of in-mine ground conditions and verification ofmodel accuracy is introduced. Finally, a case study is detailed that typifies the complexity of mining situationsanalyzed and illustrates various techniques that can be used to evaluate prospective design alternatives.
1Supervisory civil engineer.2Geologist.Mine Safety and Health Administration, Pittsburgh Safety and Health Technology Center, Roof Control Division, Pittsburgh, PA.

90
INTRODUCTION
Effective mine design has long been recognized as anessential element in establishing safe and productive miningoperations. Numerous investigators have developed techniquesto analyze pillar stability and maximize mining efficiency. Thework of Holland and Gaddy [1964], Obert and Duvall [1967],and Bieniawski [1984], to name a few, served as a staple formining engineers for many years. With the advent of longwallmining, new techniques were developed by Carr and Wilson[1982], Hsuing and Peng [1985], Choi and McCain [1980], andMark [1990] to address design considerations for thattechnology. Most recently, the development of the Analysis ofRetreat Mining Pillar Stability (ARMPS) methodology [Markand Chase 1997] for the evaluation of retreat mining operationsadded an additional tool for engineers to design and evaluatefull pillaring techniques.
Each of these methods can provide a reasonable estimate ofpillar strength and stability under specific conditions andrelatively simple mining geometries. In practice, however,situations often arise where areas of concern contain a numberof pillar configurations with varying entry and crosscut widths,spacings, and orientations. Additional factors, such as non-uniform pillar lines, remanent stumps scattered throughoutirregularly shaped gobs, and multiple-seam mining, can furthercomplicate an analysis. In such instances, application of thepreviously mentioned empirical and analytical methods toaccurately evaluate ground stability is difficult, if not totallyimpossible.
A primary function of the Roof Control Division, PittsburghSafety and Health Technology Center, is to provide technicalassistance to the Mine Safety and Health Administration(MSHA) and the mining industry in the resolution of complex
roof control problems. In order to evaluate mining systems noteasily treated by simplified empirical or analytical methods,boundary-element numerical modeling was initiated in 1984and expanded in 1987 with acquisition of the BESOL systemfrom Crouch Research, Inc., St. Paul, MN. The ability of thethree-dimensional (3-D) boundary-element method to modellarge mine areas with complex geometries has enabled the RoofControl Division to successfully simulate conditions andidentify potential solutions to ground control problems in minesthroughout the United States. The technique has been appliedto a variety of mining scenarios, including longwall and room-and-pillar operations using both conventional and yield pillarconfigurations. The influence of vertical and horizontal stresshas been modeled to simulate underground conditions rangingfrom deteriorating roof and persistent falls to areas of squeezingground and complete pillar failure.
In the process of developing numerical models for thevarious mining operations analyzed during the last 10 years,a systematic simulation methodology has evolved. Techniquesto estimate the necessary coal, rock, and gob backfill propertieshave been established, and a deterioration index was developedto quantify in-mine roof, floor, and pillar behavior to assist incalibrating model parameters and evaluating potential minedesign alternatives. This paper presents a brief description ofthe BESOL system, an overview of the simulation process used,and details of methods used to construct models and estimaterock mechanics parameters. A discussion of the deteriorationindex system and details of a case study typifying an actualmine simulation and techniques used to evaluate conditions andproposed mining options is also included.
BESOL SYSTEM DESCRIPTION
BESOL is a system of computer programs for solving rockmechanics problems based on the boundary-element dis-placement discontinuity method of analysis. The 3-D MS221version (yielding and multiple-seam capability) was acquiredfrom Crouch Research, Inc., and has been used by the RoofControl Division to evaluate complex mining systems since1987. The BESOL system is complete with graphic pre- andpostprocessors that greatly simplify model construction andoutput data interpretation.
Figure 1 presents a generalized BESOL boundary-elementmodel that illustrates a tabular seam or ore body surrounded by
a homogenous, isotropic, linearly elastic rock mass. Input datainclude elastic rock mass properties and rock strength criteria,seam properties, and backfill or artificial support characteristics.A definition of the seam plane(s), detailed geometry of theexcavation, mining depth, seam height, and a complete 3-Din situ stress state of the model are also required. Outputcapabilities include stress, strain, and displacement calculationswithin user-selected areas (both on and off the seam plane),failure index (Mohr-Coulomb or Hoek-Brown roof and floorsafety factors) calculations at variable locations in the rockmass, and energy release estimates in yielding areas.
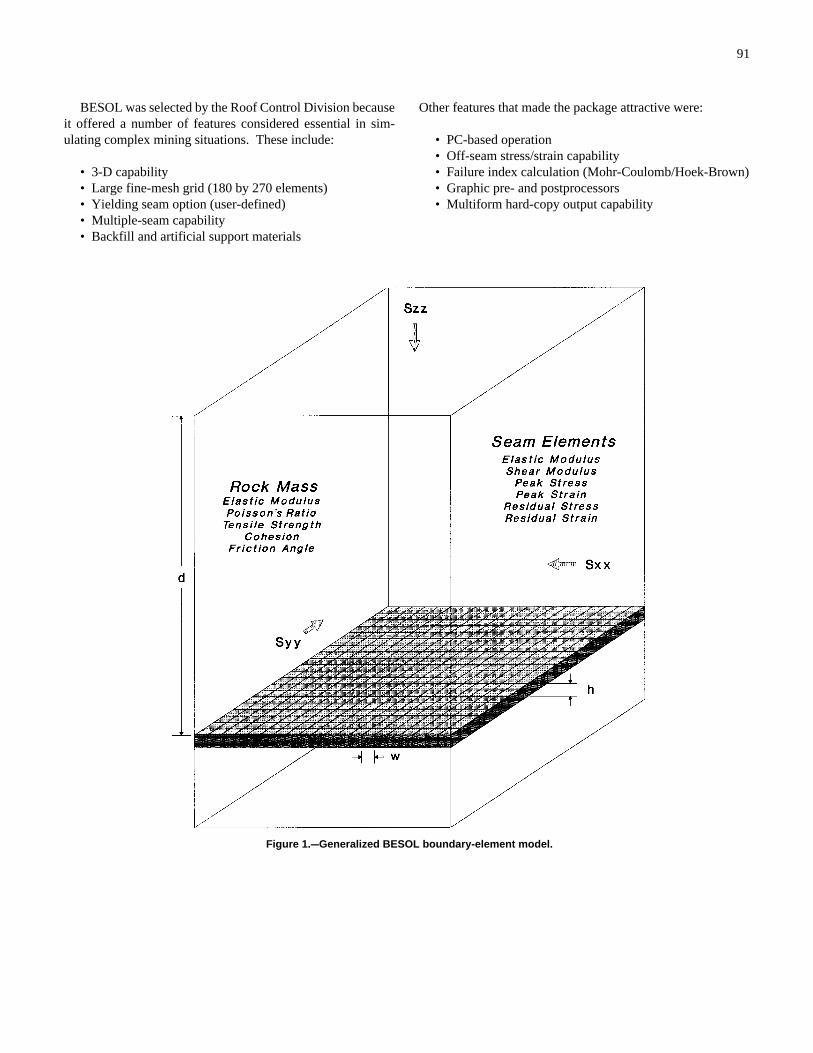
91
Figure 1.CCGeneralized BESOL boundary-element model.
BESOL was selected by the Roof Control Division becauseit offered a number of features considered essential in sim-ulating complex mining situations. These include:
• 3-D capability• Large fine-mesh grid (180 by 270 elements)• Yielding seam option (user-defined)• Multiple-seam capability• Backfill and artificial support materials
Other features that made the package attractive were:
• PC-based operation• Off-seam stress/strain capability• Failure index calculation (Mohr-Coulomb/Hoek-Brown)• Graphic pre- and postprocessors• Multiform hard-copy output capability
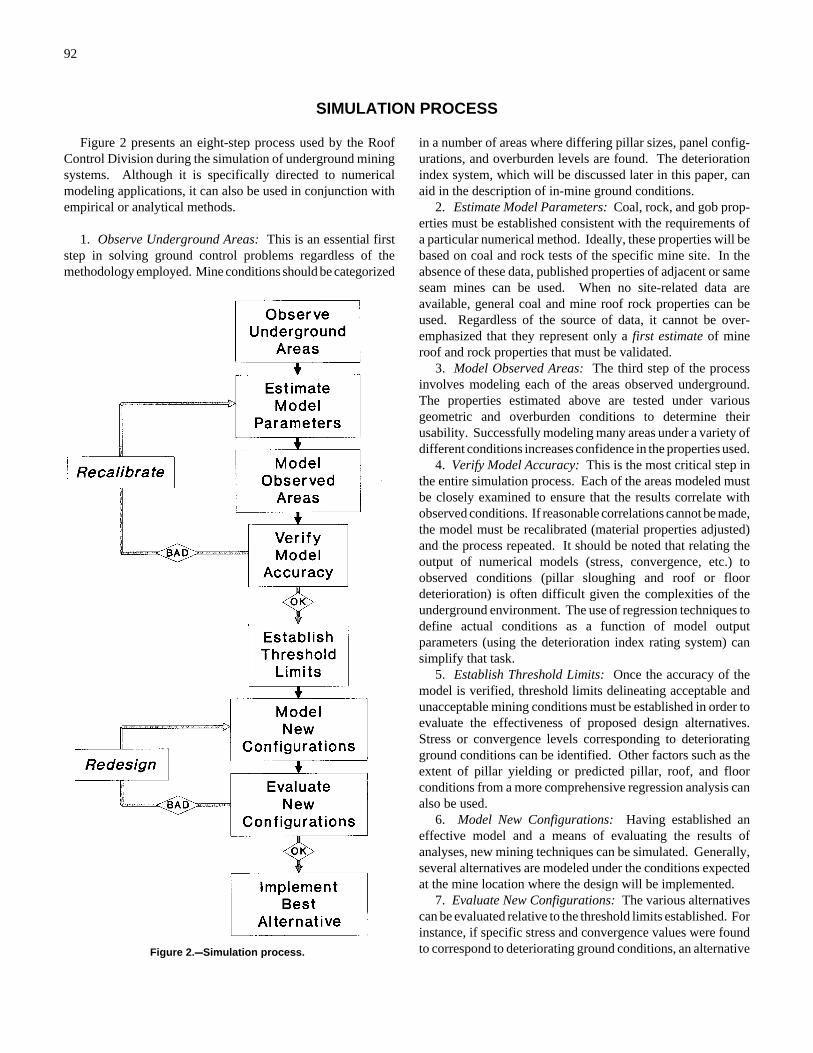
92
Figure 2.CCSimulation process.
SIMULATION PROCESS
Figure 2 presents an eight-step process used by the RoofControl Division during the simulation of underground miningsystems. Although it is specifically directed to numericalmodeling applications, it can also be used in conjunction withempirical or analytical methods.
1. Observe Underground Areas: This is an essential firststep in solving ground control problems regardless of themethodology employed. Mine conditions should be categorized
in a number of areas where differing pillar sizes, panel config-urations, and overburden levels are found. The deteriorationindex system, which will be discussed later in this paper, canaid in the description of in-mine ground conditions.
2. Estimate Model Parameters: Coal, rock, and gob prop-erties must be established consistent with the requirements ofa particular numerical method. Ideally, these properties will bebased on coal and rock tests of the specific mine site. In theabsence of these data, published properties of adjacent or sameseam mines can be used. When no site-related data areavailable, general coal and mine roof rock properties can beused. Regardless of the source of data, it cannot be over-emphasized that they represent only a first estimate of mineroof and rock properties that must be validated.
3. Model Observed Areas: The third step of the processinvolves modeling each of the areas observed underground.The properties estimated above are tested under variousgeometric and overburden conditions to determine theirusability. Successfully modeling many areas under a variety ofdifferent conditions increases confidence in the properties used.
4. Verify Model Accuracy: This is the most critical step inthe entire simulation process. Each of the areas modeled mustbe closely examined to ensure that the results correlate withobserved conditions. If reasonable correlations cannot be made,the model must be recalibrated (material properties adjusted)and the process repeated. It should be noted that relating theoutput of numerical models (stress, convergence, etc.) toobserved conditions (pillar sloughing and roof or floordeterioration) is often difficult given the complexities of theunderground environment. The use of regression techniques todefine actual conditions as a function of model outputparameters (using the deterioration index rating system) cansimplify that task.
5. Establish Threshold Limits: Once the accuracy of themodel is verified, threshold limits delineating acceptable andunacceptable mining conditions must be established in order toevaluate the effectiveness of proposed design alternatives.Stress or convergence levels corresponding to deterioratingground conditions can be identified. Other factors such as theextent of pillar yielding or predicted pillar, roof, and floorconditions from a more comprehensive regression analysis canalso be used.
6. Model New Configurations: Having established aneffective model and a means of evaluating the results ofanalyses, new mining techniques can be simulated. Generally,several alternatives are modeled under the conditions expectedat the mine location where the design will be implemented.
7. Evaluate New Configurations: The various alternativescan be evaluated relative to the threshold limits established. Forinstance, if specific stress and convergence values were foundto correspond to deteriorating ground conditions, an alternative
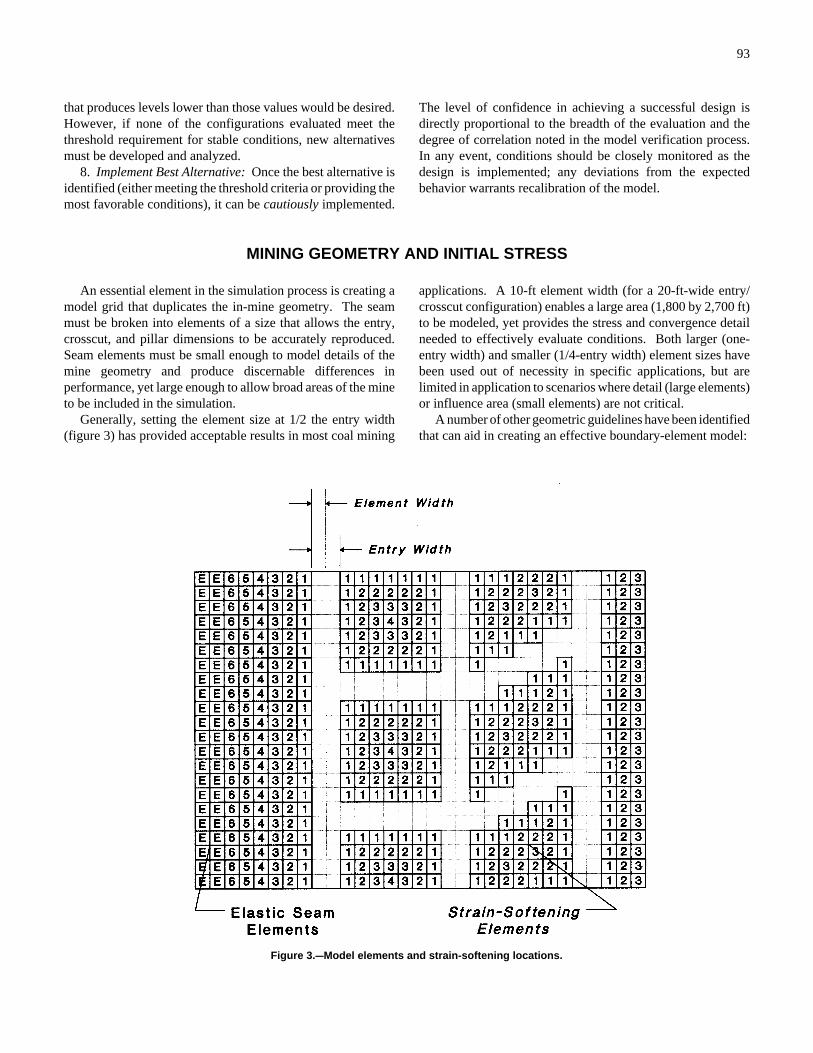
93
Figure 3.CCModel elements and strain-softening locations.
that produces levels lower than those values would be desired.However, if none of the configurations evaluated meet thethreshold requirement for stable conditions, new alternativesmust be developed and analyzed.
8. Implement Best Alternative: Once the best alternative isidentified (either meeting the threshold criteria or providing themost favorable conditions), it can be cautiously implemented.
The level of confidence in achieving a successful design isdirectly proportional to the breadth of the evaluation and thedegree of correlation noted in the model verification process.In any event, conditions should be closely monitored as thedesign is implemented; any deviations from the expectedbehavior warrants recalibration of the model.
MINING GEOMETRY AND INITIAL STRESS
An essential element in the simulation process is creating amodel grid that duplicates the in-mine geometry. The seammust be broken into elements of a size that allows the entry,crosscut, and pillar dimensions to be accurately reproduced.Seam elements must be small enough to model details of themine geometry and produce discernable differences inperformance, yet large enough to allow broad areas of the mineto be included in the simulation.
Generally, setting the element size at 1/2 the entry width(figure 3) has provided acceptable results in most coal mining
applications. A 10-ft element width (for a 20-ft-wide entry/crosscut configuration) enables a large area (1,800 by 2,700 ft)to be modeled, yet provides the stress and convergence detailneeded to effectively evaluate conditions. Both larger (one-entry width) and smaller (1/4-entry width) element sizes havebeen used out of necessity in specific applications, but arelimited in application to scenarios where detail (large elements)or influence area (small elements) are not critical.
A number of other geometric guidelines have been identifiedthat can aid in creating an effective boundary-element model:
94
• To the extent possible, locate model boundaries over solidcoal or known stable areas to reduce the likelihood of erroneousloading conditions (resulting from the exclusion of transferredstress from adjacent yielded areas in the zone of interest).
• Orient the model such that the primary areas of interest arepositioned away from the boundaries to minimize end effects.
• Known or potential yielding pillars should not containlinear-elastic elements that could erroneously affect the stresstransfer to adjacent areas.
• Known or potential yielding pillars should contain an oddnumber of elements across the minimum dimension to ensureaccurate pillar strength and peak core stress calculations.
• Care should be taken when entries or crosscuts are notoriented at 90° angles (see figure 3) to ensure that the effectivewidths and percent extraction match the actual mine geometry.
Initial stress conditions on the rock mass, in the absence ofknown high horizontal stress fields, have generally been asfollows:
Szz (vertical) ' 1.1 psi per foot of depth
Sxx (x-horizontal) ' 50% of the vertical stress
Syy (y-horizontal) ' 50% of the vertical stress
These values have resulted in effective simulations of in-mineconditions in the vast majority of cases modeled, even when theinfluence of horizontal stress was suspected. High horizontalstress was rarely found to actually control mine conditions, andhigh horizontal stress values are only used when clear evidenceof their existence and magnitude is available.
ROCK PROPERTIES
The rock mass properties needed for boundary-elementmodels are minimal because the assumption of a linearly elasticmaterial is inherent. The BESOL system requires onlyestimates of the modulus of elasticity and Poisson's ratio of therock mass. Initially, it may seem that treating a complex rockstructure in such a simplistic manner is not appropriate. How-ever, considering that seam stresses are generated throughmassive main roof loading (generally remaining in elasticcompression), it is not unreasonable to expect that an effectiverepresentation of pillar loading (the crux of a boundary-elementmodel) would result.
The Roof Control Division uses a weighted-averagetechnique to calculate the rock mass modulus of elasticity. Asmany borehole logs as possible located over areas to bemodeled are examined, and the percentages of the various rocktypes (e.g., shale, sandstone, coal) in each core are identified(table 1). These values are averaged, multiplied by the modulusof elasticity of each rock type to calculate composite portions,
then summed to estimate the rock mass modulus of elasticity.Ideally, individual strata moduli are established by site-specifictests. If those data are not available, then published data forlocal mine roof strata or typical rock properties must be used.It should be noted that published data for particular rock typesvary widely, and some judgment is needed in selectingappropriate values. The specific rock moduli listed in table 1have been used successfully in a number of instances when on-site data were not available.
A similar weighted-average process is recommended for thecalculation of Poisson's ratio. Again, the use of site-specificdata would be ideal, but estimates based on published data aregenerally used. Poisson's ratios ranging from 0.20 to 0.25 havebeen acceptable in the analyses made to date.
The properties used to define the rock mass can have asignificant effect on the accuracy of a simulation. Over-estimating the rock modulus results in lower pillar stresseswithin a panel or mined area (gob) and higher loads over the
Table 1.CCComposite rock modulus calculation
Rock typePercent in borehole
Rockmodulus, psi
Composite portion, psi
HoleNo. 1
HoleNo. 2
HoleNo. 3
HoleNo. 4
Average
Dirt . . . . . . . . . . 10.84 8.07 11.51 15.64 11.52 50,000 5,750Coal . . . . . . . . . 1.52 1.60 1.34 0.96 1.36 473,000 6,409Shale . . . . . . . . . 51.15 26.86 21.79 48.22 37.01 900,000 333,090Slate . . . . . . . . . 1.18 0.78 2.54 0 1.13 1,250,000 14,125Sandstone . . . . . 22.28 28.63 23.70 26.31 25.23 2,200,000 555,060Limestone . . . . . 0 0 0 0 0 3,200,000 0Sandy shale . . . 11.47 31.70 36.01 7.78 21.74 1,500,000 326,100Fireclay . . . . . . . 1.57 2.35 3.11 1.08 2.03 900,000 18,270 TOTAL . . . . . . . . . . . . . . . . . . . . . . . . . . . . . . . . . . . . . . . . . . . . . . . . . . . . . . . . . . . . . 1,258,804_E ' 1,260,000 psi
adjacent abutments due to the enhanced bridging action (less deformation) of the rock strata. Conversely, underestimating
95
the rock modulus leads to higher panel pillar stress or gobloading in mined areas and lower stresses on the adjacentabutments.
As noted previously, the BESOL system contains a failureindex (safety factor) calculation to evaluate the rock strength/stress ratios using either a Mohr-Coulomb or Hoek-Brownfailure criterion. Essentially, the state of stress of a point in therock mass is calculated in terms of 3-D principal stresses, andthe "available strength" of the rock (as influenced byconfinement) is compared to the existing stress level. To date,only the Mohr-Coulomb technique has been used, whichrequires input of cohesion, friction angle, and tensile strength ofthe rock (roof or floor) material. Because the analysis of therock structure is completely elastic, exact properties (althoughdesirable) are not required. The failure index analysis is treated
in a relative manner (higher failure indices indicate a morestable condition), and the following parameters have providedreasonable results:
Tensile strength - 1,000 psiCohesion - 800 psiFriction angle - 25°
The failure index has been successfully used to indicate highstress locations and the effect of mining changes to relieve thosestresses. Although they can be calculated anywhere in the rockmass, failure index calculations made at the immediate roof orfloor lines have been most useful. Coupling them with stressand convergence data provides a more complete picture of minestability that can be correlated to observed or expectedconditions.
COAL PROPERTIES
Establishing representative coal properties for a boundary-element analysis is the most critical step in model formulation.The need for yielding seam capability is clear to accuratelysimulate the complex underground environment where localizedcoal failure results in the redistribution and concentration ofstress in adjacent areas. The strain-softening approach [Crouchand Fairhurst 1973] has been identified as a reasonable methodof describing coal seam behavior. Although that concept hasbeen widely discussed, little specific information is availableconcerning the actual construction of a strain-softening model.
The Roof Control Division has established a technique tomake a first approximation of the stress and strain valuesneeded to describe the strain-softening characteristics of aspecific coal seam. As generalized in figure 4, peak andresidual (postpeak) stress and strain levels are required for seamelements located at various distances from a mined area.BESOL allows up to six user-defined elements (each char-acterized by three stress-strain values), and model elementslocated farther away from a free face are treated as linearlyelastic (figure 3).
Peak coal strength values are estimated at the center of eachof the six yielding seam elements by the following equation:
Sp(i) ' S1 ( (0.78 % 1.74 x/h), (1)
where Sp(i) ' peak strength of element (i), psi,
S1 ' in situ coal strength, psi,
x ' distance from element (i) center to free face, ft,
and h ' seam height, ft.
Equation 1 was based on the derivations of Mark and
Iannacchione [1992] for estimating the stress gradient in theyield zone of several empirical pillar design formulas andrepresents an average of the Bieniawski and Obert-Duvallmethods. The in situ coal strength is usually based on uniaxialcompression tests of samples acquired from the mine, althoughpublished data have also been used when site-specific data werenot available. Strength reduction factors of 1/5 for 2-in cubesand 1/4 for 3-in cubes have been used to estimate in situstrength from test data and have generally provided acceptableresults. Figure 5 presents a summary of peak strengths meas-ured (with borehole pressure cells) at various depths into coalpillars at three mines where pillar yielding was evident. Dataare shown as a ratio of the measured peak stress to thatestimated by equation 1; the majority fall within 10% of thepredicted stress level. Because the seam is considered to behaveelastically until peak stress is reached, the total strain at thatlevel is simply
ep(i) ' Sp(i)/E, (2)
where ep(i) ' strain at peak strength of element (i), in/in,
Sp(i) ' peak strength of element (i), psi,
and E ' coal seam modulus of elasticity, psi.
Residual (postpeak) seam stress and strain values are ap-proximated by the following relationship:
SR1(i) ' (0.1385 ( ln (x) % 0.413) ( Sp(i) (3)

96
Figure 4.CCGeneral strain-softening element characteristics.
eR1(i) ' 2 ( ep(i) (4)
SR2(i) ' (0.2254 ( ln (x)) ( Sp(i) (5)
eR2(i) ' 4 ( ep(i) (6)
where SR1(I) ' first residual stress level of element (i), psi,
eR1(I) ' strain of element (i) at first residual stress level, in/in,
SR2(I) ' second residual stress level of element (i), psi,
eR2(I) ' strain of element (i) at second residual stresslevel, in/in,
and x ' distance from element (i) center to free face,ft.
These relationships were patterned after the load/deflectionresponse of coal samples under uniaxial testing, yield pillarstress and entry convergence measurements made at one minesite, and the assumption that at increasing depth into the pillarcore a higher residual strength would be maintained.
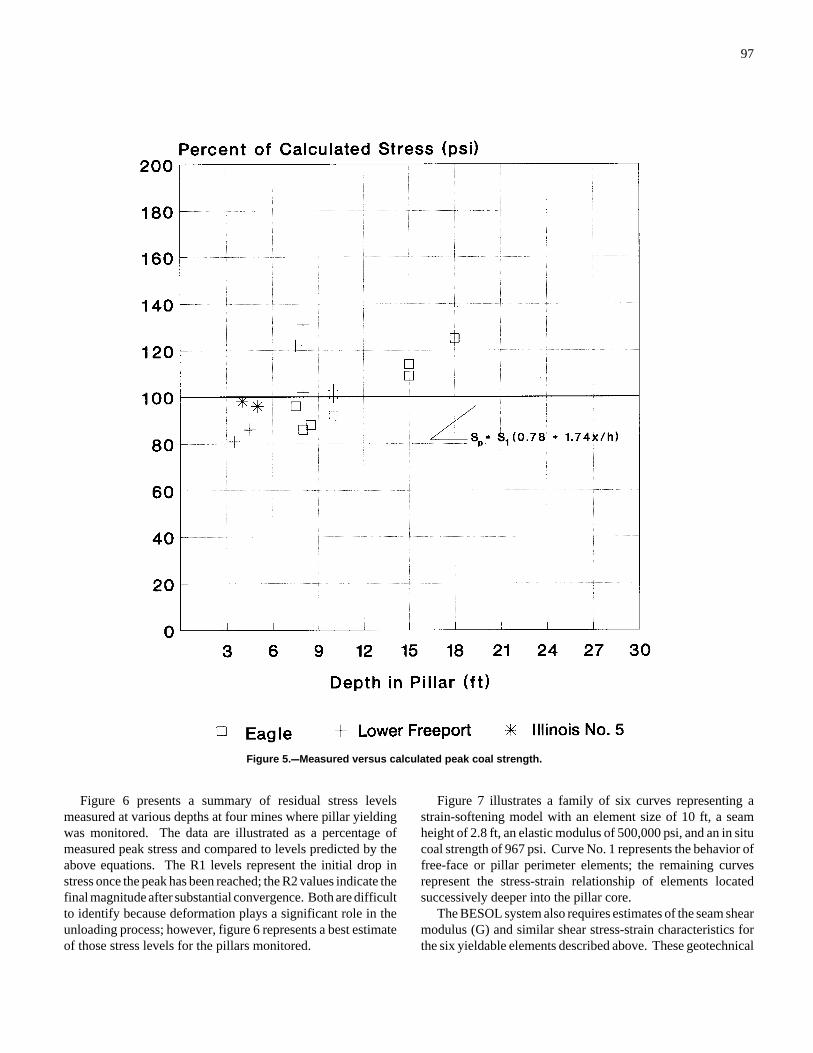
97
Figure 5.CCMeasured versus calculated peak coal strength.
Figure 6 presents a summary of residual stress levelsmeasured at various depths at four mines where pillar yieldingwas monitored. The data are illustrated as a percentage ofmeasured peak stress and compared to levels predicted by theabove equations. The R1 levels represent the initial drop instress once the peak has been reached; the R2 values indicate thefinal magnitude after substantial convergence. Both are difficultto identify because deformation plays a significant role in theunloading process; however, figure 6 represents a best estimateof those stress levels for the pillars monitored.
Figure 7 illustrates a family of six curves representing astrain-softening model with an element size of 10 ft, a seamheight of 2.8 ft, an elastic modulus of 500,000 psi, and an in situcoal strength of 967 psi. Curve No. 1 represents the behavior offree-face or pillar perimeter elements; the remaining curvesrepresent the stress-strain relationship of elements locatedsuccessively deeper into the pillar core.
The BESOL system also requires estimates of the seam shearmodulus (G) and similar shear stress-strain characteristics forthe six yieldable elements described above. These geotechnical
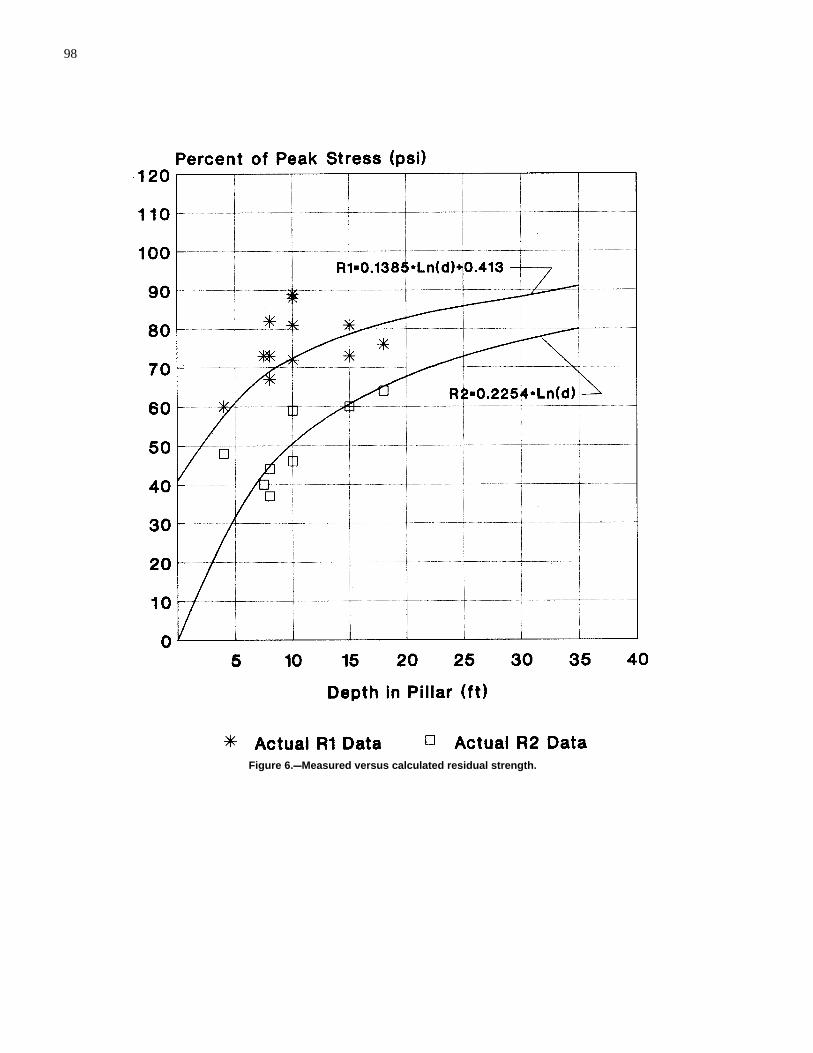
98
Figure 6.CCMeasured versus calculated residual strength.
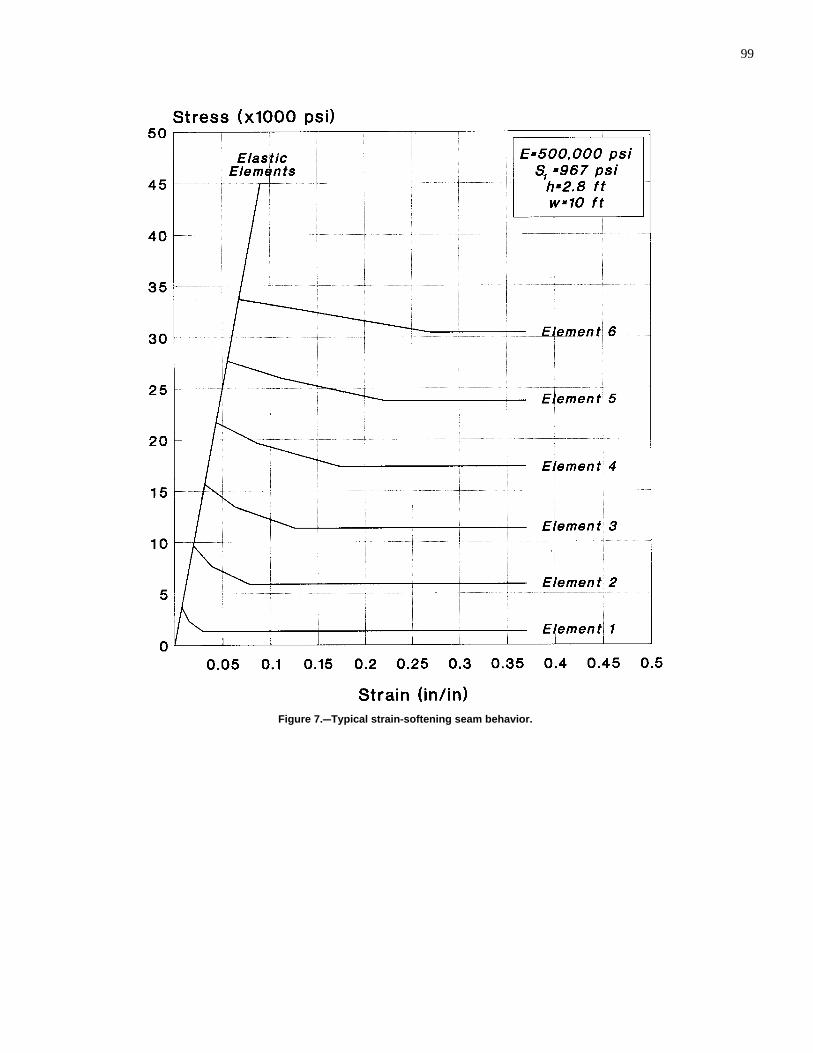
99
Figure 7.CCTypical strain-softening seam behavior.
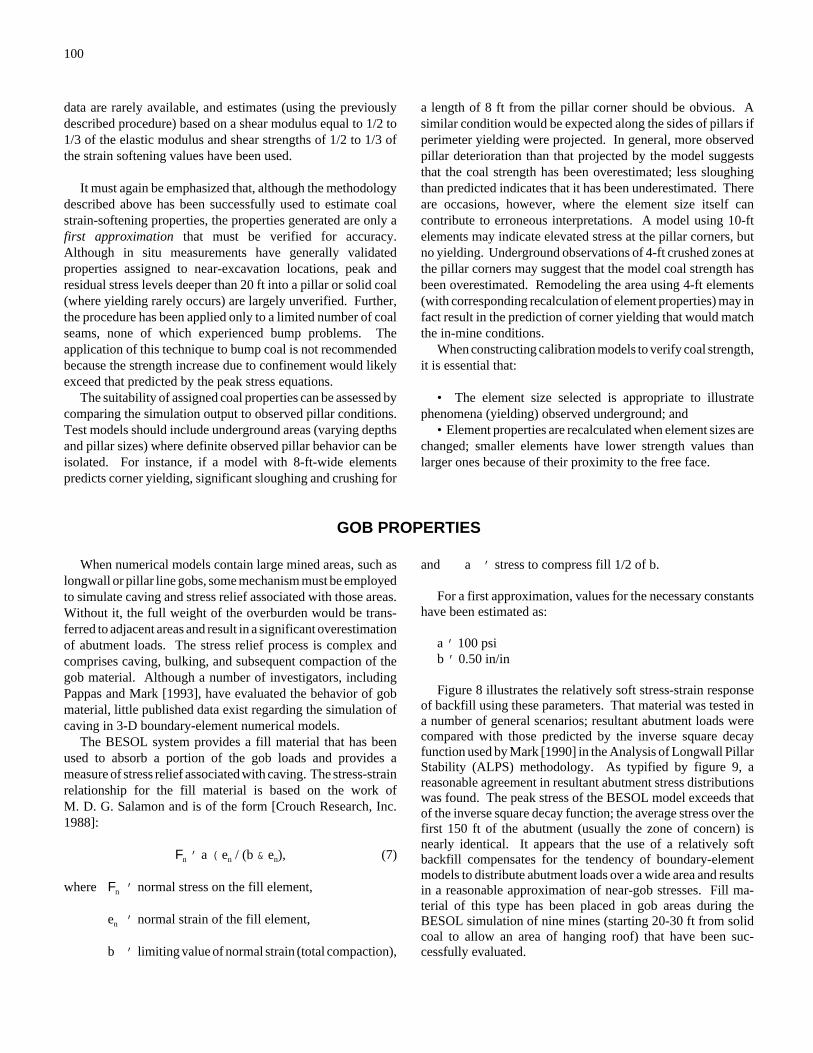
100
data are rarely available, and estimates (using the previouslydescribed procedure) based on a shear modulus equal to 1/2 to1/3 of the elastic modulus and shear strengths of 1/2 to 1/3 ofthe strain softening values have been used.
It must again be emphasized that, although the methodologydescribed above has been successfully used to estimate coalstrain-softening properties, the properties generated are only afirst approximation that must be verified for accuracy.Although in situ measurements have generally validatedproperties assigned to near-excavation locations, peak andresidual stress levels deeper than 20 ft into a pillar or solid coal(where yielding rarely occurs) are largely unverified. Further,the procedure has been applied only to a limited number of coalseams, none of which experienced bump problems. Theapplication of this technique to bump coal is not recommendedbecause the strength increase due to confinement would likelyexceed that predicted by the peak stress equations.
The suitability of assigned coal properties can be assessed bycomparing the simulation output to observed pillar conditions.Test models should include underground areas (varying depthsand pillar sizes) where definite observed pillar behavior can beisolated. For instance, if a model with 8-ft-wide elementspredicts corner yielding, significant sloughing and crushing for
a length of 8 ft from the pillar corner should be obvious. Asimilar condition would be expected along the sides of pillars ifperimeter yielding were projected. In general, more observedpillar deterioration than that projected by the model suggeststhat the coal strength has been overestimated; less sloughingthan predicted indicates that it has been underestimated. Thereare occasions, however, where the element size itself cancontribute to erroneous interpretations. A model using 10-ftelements may indicate elevated stress at the pillar corners, butno yielding. Underground observations of 4-ft crushed zones atthe pillar corners may suggest that the model coal strength hasbeen overestimated. Remodeling the area using 4-ft elements(with corresponding recalculation of element properties) may infact result in the prediction of corner yielding that would matchthe in-mine conditions.
When constructing calibration models to verify coal strength,it is essential that:
• The element size selected is appropriate to illustratephenomena (yielding) observed underground; and
• Element properties are recalculated when element sizes arechanged; smaller elements have lower strength values thanlarger ones because of their proximity to the free face.
GOB PROPERTIES
When numerical models contain large mined areas, such aslongwall or pillar line gobs, some mechanism must be employedto simulate caving and stress relief associated with those areas.Without it, the full weight of the overburden would be trans-ferred to adjacent areas and result in a significant overestimationof abutment loads. The stress relief process is complex andcomprises caving, bulking, and subsequent compaction of thegob material. Although a number of investigators, includingPappas and Mark [1993], have evaluated the behavior of gobmaterial, little published data exist regarding the simulation ofcaving in 3-D boundary-element numerical models.
The BESOL system provides a fill material that has beenused to absorb a portion of the gob loads and provides ameasure of stress relief associated with caving. The stress-strainrelationship for the fill material is based on the work ofM. D. G. Salamon and is of the form [Crouch Research, Inc.1988]:
Fn ' a ( en / (b & en), (7)
where Fn ' normal stress on the fill element,
en ' normal strain of the fill element,
b ' limiting value of normal strain (total compaction),
and a ' stress to compress fill 1/2 of b.
For a first approximation, values for the necessary constantshave been estimated as:
a ' 100 psib ' 0.50 in/in
Figure 8 illustrates the relatively soft stress-strain responseof backfill using these parameters. That material was tested ina number of general scenarios; resultant abutment loads werecompared with those predicted by the inverse square decayfunction used by Mark [1990] in the Analysis of Longwall PillarStability (ALPS) methodology. As typified by figure 9, areasonable agreement in resultant abutment stress distributionswas found. The peak stress of the BESOL model exceeds thatof the inverse square decay function; the average stress over thefirst 150 ft of the abutment (usually the zone of concern) isnearly identical. It appears that the use of a relatively softbackfill compensates for the tendency of boundary-elementmodels to distribute abutment loads over a wide area and resultsin a reasonable approximation of near-gob stresses. Fill ma-terial of this type has been placed in gob areas during theBESOL simulation of nine mines (starting 20-30 ft from solidcoal to allow an area of hanging roof) that have been suc-cessfully evaluated.
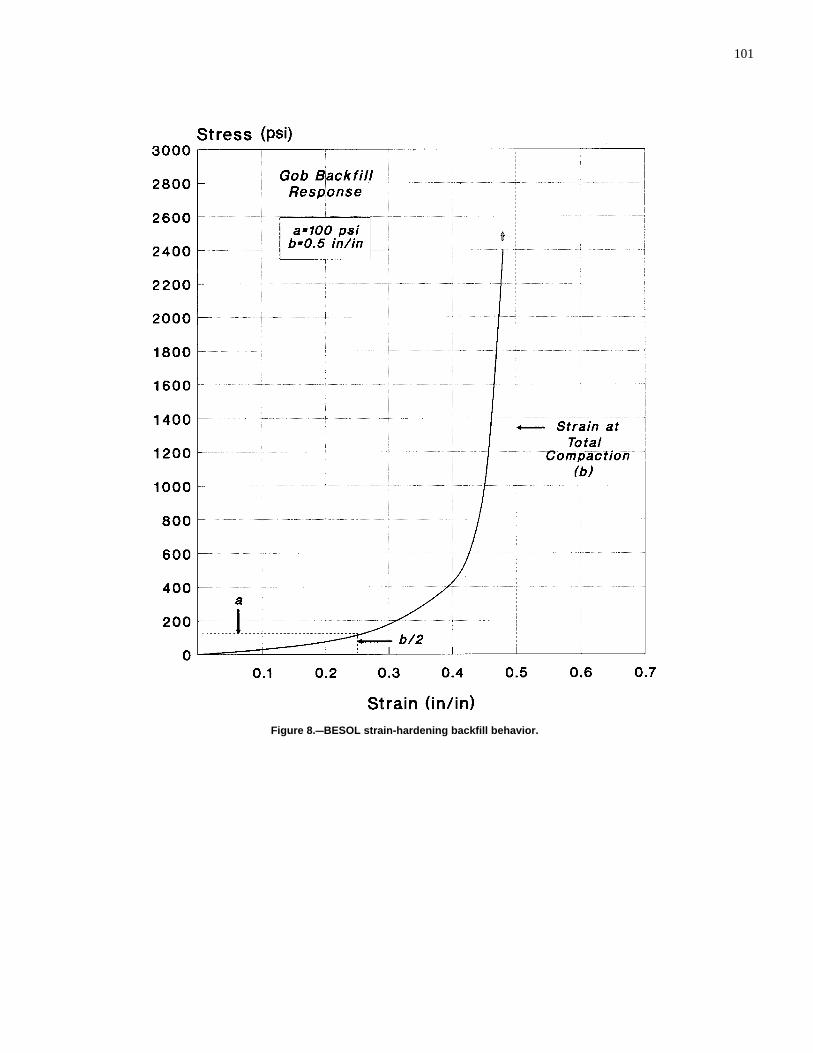
101
Figure 8.CCBESOL strain-hardening backfill behavior.

102
Figure 9.CCBESOL versus inverse square decay function.
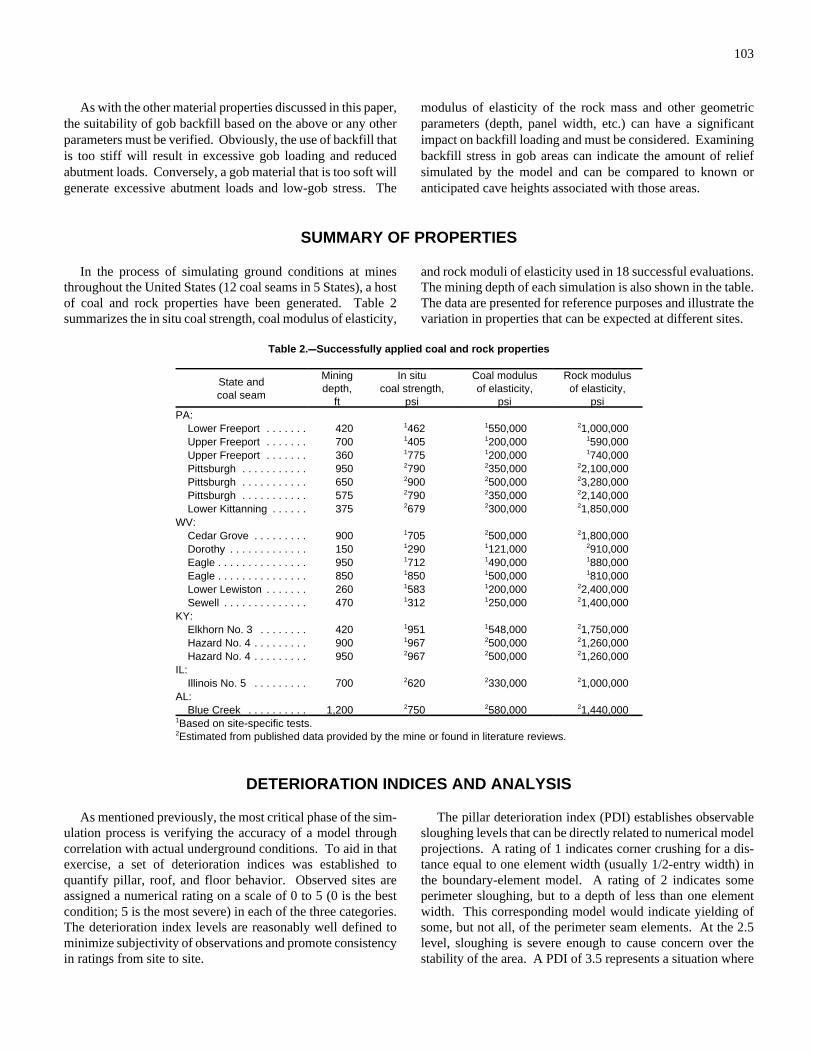
103
As with the other material properties discussed in this paper,the suitability of gob backfill based on the above or any otherparameters must be verified. Obviously, the use of backfill thatis too stiff will result in excessive gob loading and reducedabutment loads. Conversely, a gob material that is too soft willgenerate excessive abutment loads and low-gob stress. The
modulus of elasticity of the rock mass and other geometricparameters (depth, panel width, etc.) can have a significantimpact on backfill loading and must be considered. Examiningbackfill stress in gob areas can indicate the amount of reliefsimulated by the model and can be compared to known oranticipated cave heights associated with those areas.
SUMMARY OF PROPERTIES
In the process of simulating ground conditions at minesthroughout the United States (12 coal seams in 5 States), a hostof coal and rock properties have been generated. Table 2summarizes the in situ coal strength, coal modulus of elasticity,
and rock moduli of elasticity used in 18 successful evaluations.The mining depth of each simulation is also shown in the table.The data are presented for reference purposes and illustrate thevariation in properties that can be expected at different sites.
Table 2.CCSuccessfully applied coal and rock properties
State andcoal seam
Miningdepth,
ft
In situcoal strength,
psi
Coal modulusof elasticity,
psi
Rock modulusof elasticity,
psiPA: Lower Freeport . . . . . . . 420 1462 1550,000 21,000,000 Upper Freeport . . . . . . . 700 1405 1200,000 1590,000 Upper Freeport . . . . . . . 360 1775 1200,000 1740,000 Pittsburgh . . . . . . . . . . . 950 2790 2350,000 22,100,000 Pittsburgh . . . . . . . . . . . 650 2900 2500,000 23,280,000 Pittsburgh . . . . . . . . . . . 575 2790 2350,000 22,140,000 Lower Kittanning . . . . . . 375 2679 2300,000 21,850,000WV: Cedar Grove . . . . . . . . . 900 1705 2500,000 21,800,000 Dorothy . . . . . . . . . . . . . 150 1290 1121,000 2910,000 Eagle . . . . . . . . . . . . . . . 950 1712 1490,000 1880,000 Eagle . . . . . . . . . . . . . . . 850 1850 1500,000 1810,000 Lower Lewiston . . . . . . . 260 1583 1200,000 22,400,000 Sewell . . . . . . . . . . . . . . 470 1312 1250,000 21,400,000KY: Elkhorn No. 3 . . . . . . . . 420 1951 1548,000 21,750,000 Hazard No. 4 . . . . . . . . . 900 1967 2500,000 21,260,000 Hazard No. 4 . . . . . . . . . 950 2967 2500,000 21,260,000IL: Illinois No. 5 . . . . . . . . . 700 2620 2330,000 21,000,000AL: Blue Creek . . . . . . . . . . 1,200 2750 2580,000 21,440,0001Based on site-specific tests.2Estimated from published data provided by the mine or found in literature reviews.
DETERIORATION INDICES AND ANALYSIS
As mentioned previously, the most critical phase of the sim-ulation process is verifying the accuracy of a model throughcorrelation with actual underground conditions. To aid in thatexercise, a set of deterioration indices was established toquantify pillar, roof, and floor behavior. Observed sites areassigned a numerical rating on a scale of 0 to 5 (0 is the bestcondition; 5 is the most severe) in each of the three categories.The deterioration index levels are reasonably well defined tominimize subjectivity of observations and promote consistencyin ratings from site to site.
The pillar deterioration index (PDI) establishes observablesloughing levels that can be directly related to numerical modelprojections. A rating of 1 indicates corner crushing for a dis-tance equal to one element width (usually 1/2-entry width) inthe boundary-element model. A rating of 2 indicates someperimeter sloughing, but to a depth of less than one elementwidth. This corresponding model would indicate yielding ofsome, but not all, of the perimeter seam elements. At the 2.5level, sloughing is severe enough to cause concern over thestability of the area. A PDI of 3.5 represents a situation where
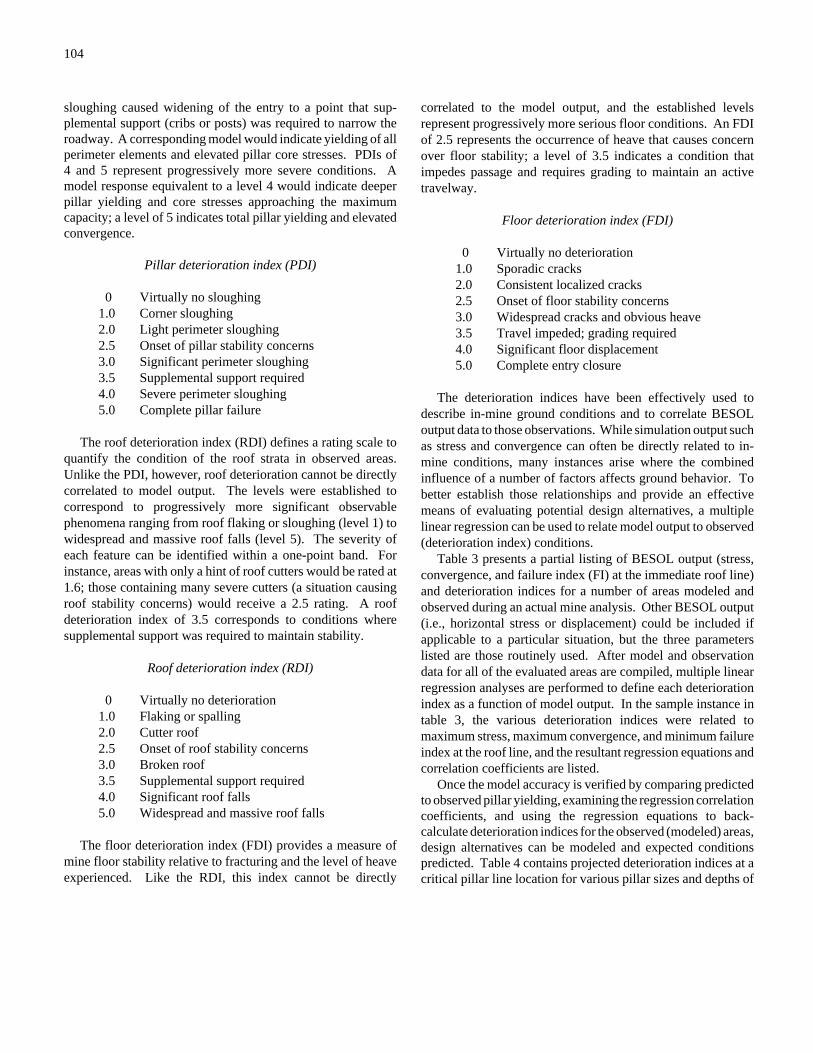
104
sloughing caused widening of the entry to a point that sup-plemental support (cribs or posts) was required to narrow theroadway. A corresponding model would indicate yielding of allperimeter elements and elevated pillar core stresses. PDIs of4 and 5 represent progressively more severe conditions. Amodel response equivalent to a level 4 would indicate deeperpillar yielding and core stresses approaching the maximumcapacity; a level of 5 indicates total pillar yielding and elevatedconvergence.
Pillar deterioration index (PDI)
0 Virtually no sloughing1.0 Corner sloughing2.0 Light perimeter sloughing2.5 Onset of pillar stability concerns3.0 Significant perimeter sloughing3.5 Supplemental support required4.0 Severe perimeter sloughing5.0 Complete pillar failure
The roof deterioration index (RDI) defines a rating scale toquantify the condition of the roof strata in observed areas.Unlike the PDI, however, roof deterioration cannot be directlycorrelated to model output. The levels were established tocorrespond to progressively more significant observablephenomena ranging from roof flaking or sloughing (level 1) towidespread and massive roof falls (level 5). The severity ofeach feature can be identified within a one-point band. Forinstance, areas with only a hint of roof cutters would be rated at1.6; those containing many severe cutters (a situation causingroof stability concerns) would receive a 2.5 rating. A roofdeterioration index of 3.5 corresponds to conditions wheresupplemental support was required to maintain stability.
Roof deterioration index (RDI)
0 Virtually no deterioration1.0 Flaking or spalling2.0 Cutter roof2.5 Onset of roof stability concerns3.0 Broken roof3.5 Supplemental support required4.0 Significant roof falls5.0 Widespread and massive roof falls
The floor deterioration index (FDI) provides a measure ofmine floor stability relative to fracturing and the level of heaveexperienced. Like the RDI, this index cannot be directly
correlated to the model output, and the established levelsrepresent progressively more serious floor conditions. An FDIof 2.5 represents the occurrence of heave that causes concernover floor stability; a level of 3.5 indicates a condition thatimpedes passage and requires grading to maintain an activetravelway.
Floor deterioration index (FDI)
0 Virtually no deterioration1.0 Sporadic cracks2.0 Consistent localized cracks2.5 Onset of floor stability concerns3.0 Widespread cracks and obvious heave3.5 Travel impeded; grading required4.0 Significant floor displacement5.0 Complete entry closure
The deterioration indices have been effectively used todescribe in-mine ground conditions and to correlate BESOLoutput data to those observations. While simulation output suchas stress and convergence can often be directly related to in-mine conditions, many instances arise where the combinedinfluence of a number of factors affects ground behavior. Tobetter establish those relationships and provide an effectivemeans of evaluating potential design alternatives, a multiplelinear regression can be used to relate model output to observed(deterioration index) conditions.
Table 3 presents a partial listing of BESOL output (stress,convergence, and failure index (FI) at the immediate roof line)and deterioration indices for a number of areas modeled andobserved during an actual mine analysis. Other BESOL output(i.e., horizontal stress or displacement) could be included ifapplicable to a particular situation, but the three parameterslisted are those routinely used. After model and observationdata for all of the evaluated areas are compiled, multiple linearregression analyses are performed to define each deteriorationindex as a function of model output. In the sample instance intable 3, the various deterioration indices were related tomaximum stress, maximum convergence, and minimum failureindex at the roof line, and the resultant regression equations andcorrelation coefficients are listed.
Once the model accuracy is verified by comparing predictedto observed pillar yielding, examining the regression correlationcoefficients, and using the regression equations to back-calculate deterioration indices for the observed (modeled) areas,design alternatives can be modeled and expected conditionspredicted. Table 4 contains projected deterioration indices at acritical pillar line location for various pillar sizes and depths of
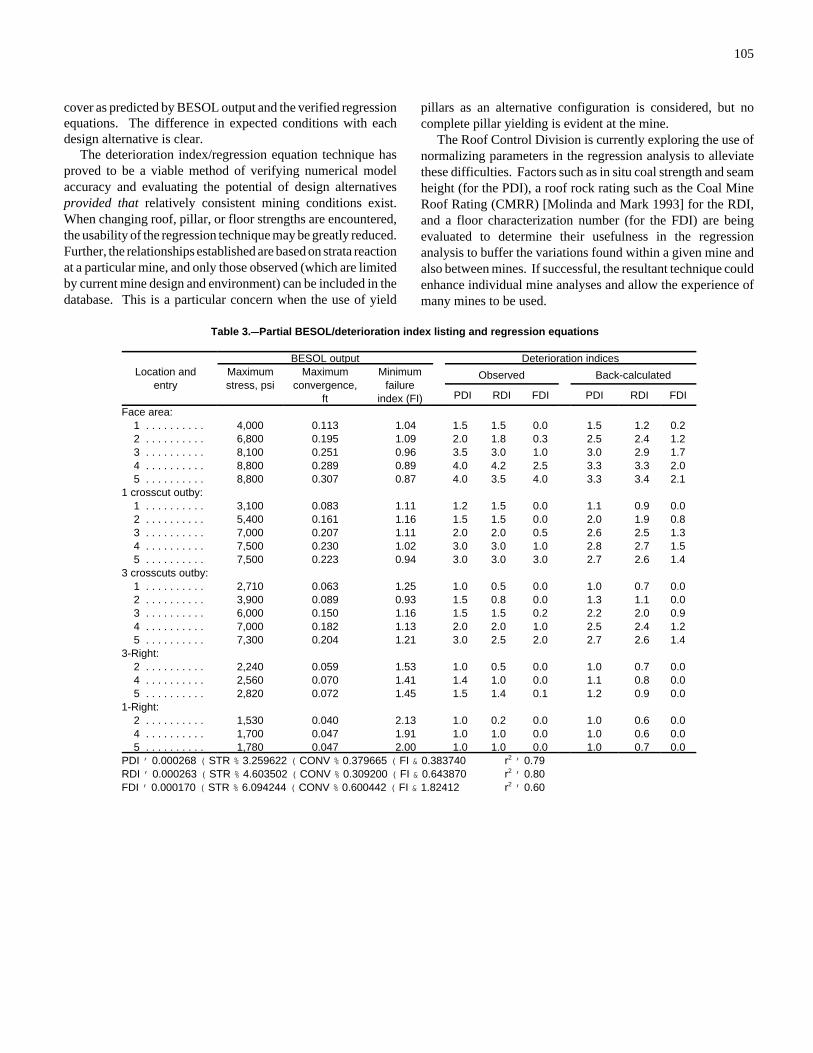
105
cover as predicted by BESOL output and the verified regressionequations. The difference in expected conditions with eachdesign alternative is clear.
The deterioration index/regression equation technique hasproved to be a viable method of verifying numerical modelaccuracy and evaluating the potential of design alternativesprovided that relatively consistent mining conditions exist.When changing roof, pillar, or floor strengths are encountered,the usability of the regression technique may be greatly reduced.Further, the relationships established are based on strata reactionat a particular mine, and only those observed (which are limitedby current mine design and environment) can be included in thedatabase. This is a particular concern when the use of yield
pillars as an alternative configuration is considered, but nocomplete pillar yielding is evident at the mine.
The Roof Control Division is currently exploring the use ofnormalizing parameters in the regression analysis to alleviatethese difficulties. Factors such as in situ coal strength and seamheight (for the PDI), a roof rock rating such as the Coal MineRoof Rating (CMRR) [Molinda and Mark 1993] for the RDI,and a floor characterization number (for the FDI) are beingevaluated to determine their usefulness in the regressionanalysis to buffer the variations found within a given mine andalso between mines. If successful, the resultant technique couldenhance individual mine analyses and allow the experience ofmany mines to be used.
Table 3.CCPartial BESOL/deterioration index listing and regression equations
Location andentry
BESOL output Deterioration indicesMaximumstress, psi
Maximumconvergence,
ft
Minimumfailure
index (FI)
Observed Back-calculated
PDI RDI FDI PDI RDI FDI
Face area: 1 . . . . . . . . . . 4,000 0.113 1.04 1.5 1.5 0.0 1.5 1.2 0.2 2 . . . . . . . . . . 6,800 0.195 1.09 2.0 1.8 0.3 2.5 2.4 1.2 3 . . . . . . . . . . 8,100 0.251 0.96 3.5 3.0 1.0 3.0 2.9 1.7 4 . . . . . . . . . . 8,800 0.289 0.89 4.0 4.2 2.5 3.3 3.3 2.0 5 . . . . . . . . . . 8,800 0.307 0.87 4.0 3.5 4.0 3.3 3.4 2.11 crosscut outby: 1 . . . . . . . . . . 3,100 0.083 1.11 1.2 1.5 0.0 1.1 0.9 0.0 2 . . . . . . . . . . 5,400 0.161 1.16 1.5 1.5 0.0 2.0 1.9 0.8 3 . . . . . . . . . . 7,000 0.207 1.11 2.0 2.0 0.5 2.6 2.5 1.3 4 . . . . . . . . . . 7,500 0.230 1.02 3.0 3.0 1.0 2.8 2.7 1.5 5 . . . . . . . . . . 7,500 0.223 0.94 3.0 3.0 3.0 2.7 2.6 1.43 crosscuts outby: 1 . . . . . . . . . . 2,710 0.063 1.25 1.0 0.5 0.0 1.0 0.7 0.0 2 . . . . . . . . . . 3,900 0.089 0.93 1.5 0.8 0.0 1.3 1.1 0.0 3 . . . . . . . . . . 6,000 0.150 1.16 1.5 1.5 0.2 2.2 2.0 0.9 4 . . . . . . . . . . 7,000 0.182 1.13 2.0 2.0 1.0 2.5 2.4 1.2 5 . . . . . . . . . . 7,300 0.204 1.21 3.0 2.5 2.0 2.7 2.6 1.43-Right: 2 . . . . . . . . . . 2,240 0.059 1.53 1.0 0.5 0.0 1.0 0.7 0.0 4 . . . . . . . . . . 2,560 0.070 1.41 1.4 1.0 0.0 1.1 0.8 0.0 5 . . . . . . . . . . 2,820 0.072 1.45 1.5 1.4 0.1 1.2 0.9 0.01-Right: 2 . . . . . . . . . . 1,530 0.040 2.13 1.0 0.2 0.0 1.0 0.6 0.0 4 . . . . . . . . . . 1,700 0.047 1.91 1.0 1.0 0.0 1.0 0.6 0.0 5 . . . . . . . . . . 1,780 0.047 2.00 1.0 1.0 0.0 1.0 0.7 0.0PDI ' 0.000268 ( STR % 3.259622 ( CONV % 0.379665 ( FI & 0.383740 r2 ' 0.79RDI ' 0.000263 ( STR % 4.603502 ( CONV % 0.309200 ( FI & 0.643870 r2 ' 0.80FDI ' 0.000170 ( STR % 6.094244 ( CONV % 0.600442 ( FI & 1.82412 r2 ' 0.60
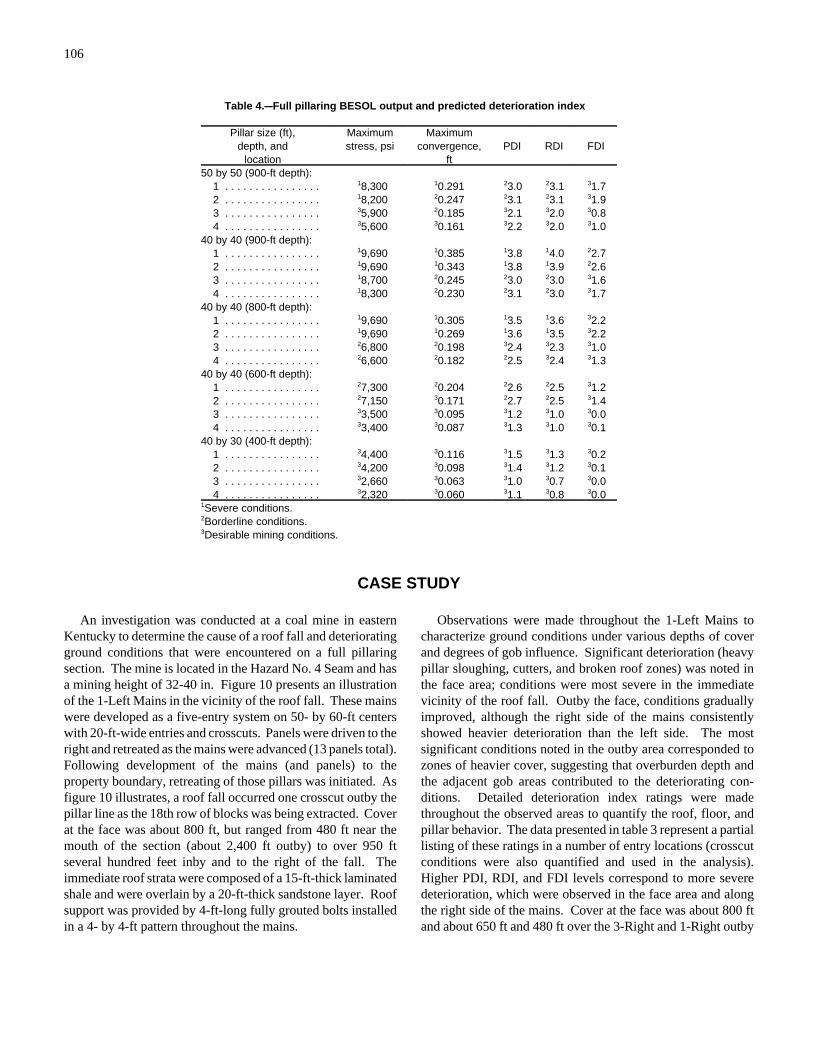
106
Table 4.CCFull pillaring BESOL output and predicted deterioration index
Pillar size (ft),depth, and
location
Maximumstress, psi
Maximumconvergence,
ftPDI RDI FDI
50 by 50 (900-ft depth): 1 . . . . . . . . . . . . . . . . 18,300 10.291 23.0 23.1 31.7 2 . . . . . . . . . . . . . . . . 18,200 20.247 23.1 23.1 31.9 3 . . . . . . . . . . . . . . . . 35,900 20.185 32.1 32.0 30.8 4 . . . . . . . . . . . . . . . . 35,600 30.161 32.2 32.0 31.040 by 40 (900-ft depth): 1 . . . . . . . . . . . . . . . . 19,690 10.385 13.8 14.0 22.7 2 . . . . . . . . . . . . . . . . 19,690 10.343 13.8 13.9 22.6 3 . . . . . . . . . . . . . . . . 18,700 20.245 23.0 23.0 31.6 4 . . . . . . . . . . . . . . . . 18,300 20.230 23.1 23.0 31.740 by 40 (800-ft depth): 1 . . . . . . . . . . . . . . . . 19,690 10.305 13.5 13.6 32.2 2 . . . . . . . . . . . . . . . . 19,690 10.269 13.6 13.5 32.2 3 . . . . . . . . . . . . . . . . 26,800 20.198 32.4 32.3 31.0 4 . . . . . . . . . . . . . . . . 26,600 20.182 22.5 32.4 31.340 by 40 (600-ft depth): 1 . . . . . . . . . . . . . . . . 27,300 20.204 22.6 22.5 31.2 2 . . . . . . . . . . . . . . . . 27,150 30.171 22.7 22.5 31.4 3 . . . . . . . . . . . . . . . . 33,500 30.095 31.2 31.0 30.0 4 . . . . . . . . . . . . . . . . 33,400 30.087 31.3 31.0 30.140 by 30 (400-ft depth): 1 . . . . . . . . . . . . . . . . 34,400 30.116 31.5 31.3 30.2 2 . . . . . . . . . . . . . . . . 34,200 30.098 31.4 31.2 30.1 3 . . . . . . . . . . . . . . . . 32,660 30.063 31.0 30.7 30.0 4 . . . . . . . . . . . . . . . . 32,320 30.060 31.1 30.8 30.01Severe conditions.2Borderline conditions.3Desirable mining conditions.
CASE STUDY
An investigation was conducted at a coal mine in easternKentucky to determine the cause of a roof fall and deterioratingground conditions that were encountered on a full pillaringsection. The mine is located in the Hazard No. 4 Seam and hasa mining height of 32-40 in. Figure 10 presents an illustrationof the 1-Left Mains in the vicinity of the roof fall. These mainswere developed as a five-entry system on 50- by 60-ft centerswith 20-ft-wide entries and crosscuts. Panels were driven to theright and retreated as the mains were advanced (13 panels total).Following development of the mains (and panels) to theproperty boundary, retreating of those pillars was initiated. Asfigure 10 illustrates, a roof fall occurred one crosscut outby thepillar line as the 18th row of blocks was being extracted. Coverat the face was about 800 ft, but ranged from 480 ft near themouth of the section (about 2,400 ft outby) to over 950 ftseveral hundred feet inby and to the right of the fall. Theimmediate roof strata were composed of a 15-ft-thick laminatedshale and were overlain by a 20-ft-thick sandstone layer. Roofsupport was provided by 4-ft-long fully grouted bolts installedin a 4- by 4-ft pattern throughout the mains.
Observations were made throughout the 1-Left Mains tocharacterize ground conditions under various depths of coverand degrees of gob influence. Significant deterioration (heavypillar sloughing, cutters, and broken roof zones) was noted inthe face area; conditions were most severe in the immediatevicinity of the roof fall. Outby the face, conditions graduallyimproved, although the right side of the mains consistentlyshowed heavier deterioration than the left side. The mostsignificant conditions noted in the outby area corresponded tozones of heavier cover, suggesting that overburden depth andthe adjacent gob areas contributed to the deteriorating con-ditions. Detailed deterioration index ratings were madethroughout the observed areas to quantify the roof, floor, andpillar behavior. The data presented in table 3 represent a partiallisting of these ratings in a number of entry locations (crosscutconditions were also quantified and used in the analysis).Higher PDI, RDI, and FDI levels correspond to more severedeterioration, which were observed in the face area and alongthe right side of the mains. Cover at the face was about 800 ftand about 650 ft and 480 ft over the 3-Right and 1-Right outby
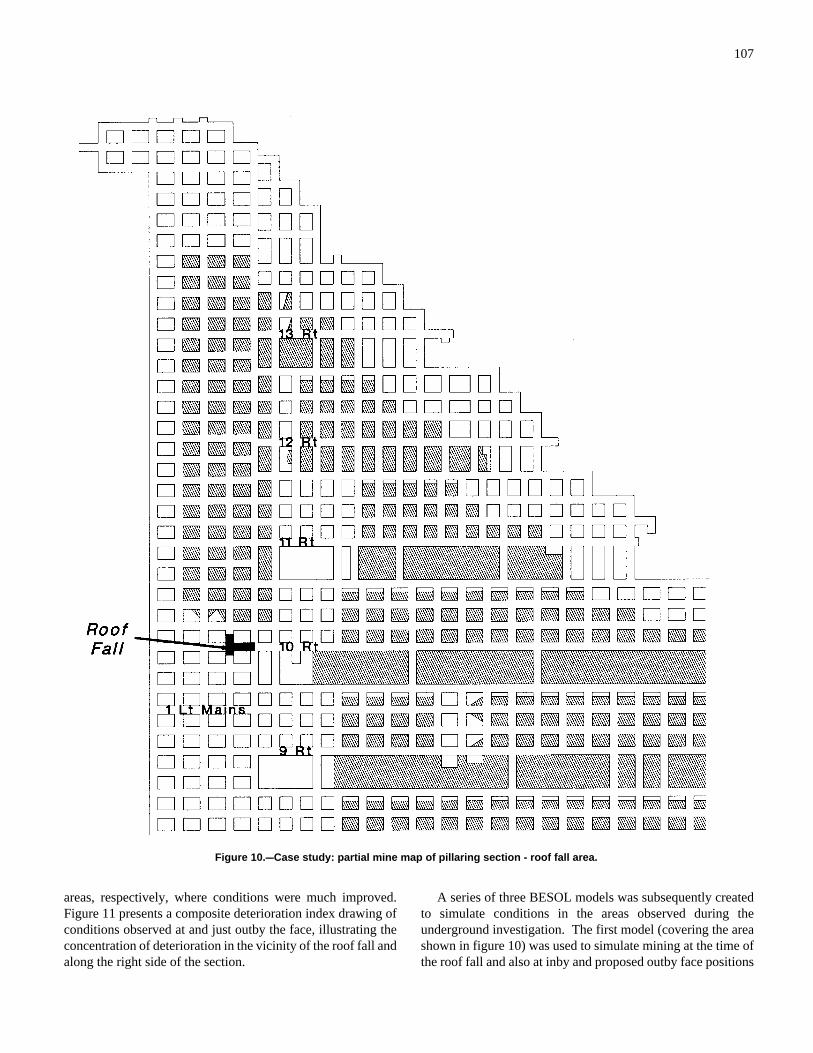
107
Figure 10.CCCase study: partial mine map of pillaring section - roof fall area.
areas, respectively, where conditions were much improved.Figure 11 presents a composite deterioration index drawing ofconditions observed at and just outby the face, illustrating theconcentration of deterioration in the vicinity of the roof fall andalong the right side of the section.
A series of three BESOL models was subsequently createdto simulate conditions in the areas observed during theunderground investigation. The first model (covering the areashown in figure 10) was used to simulate mining at the time ofthe roof fall and also at inby and proposed outby face positions
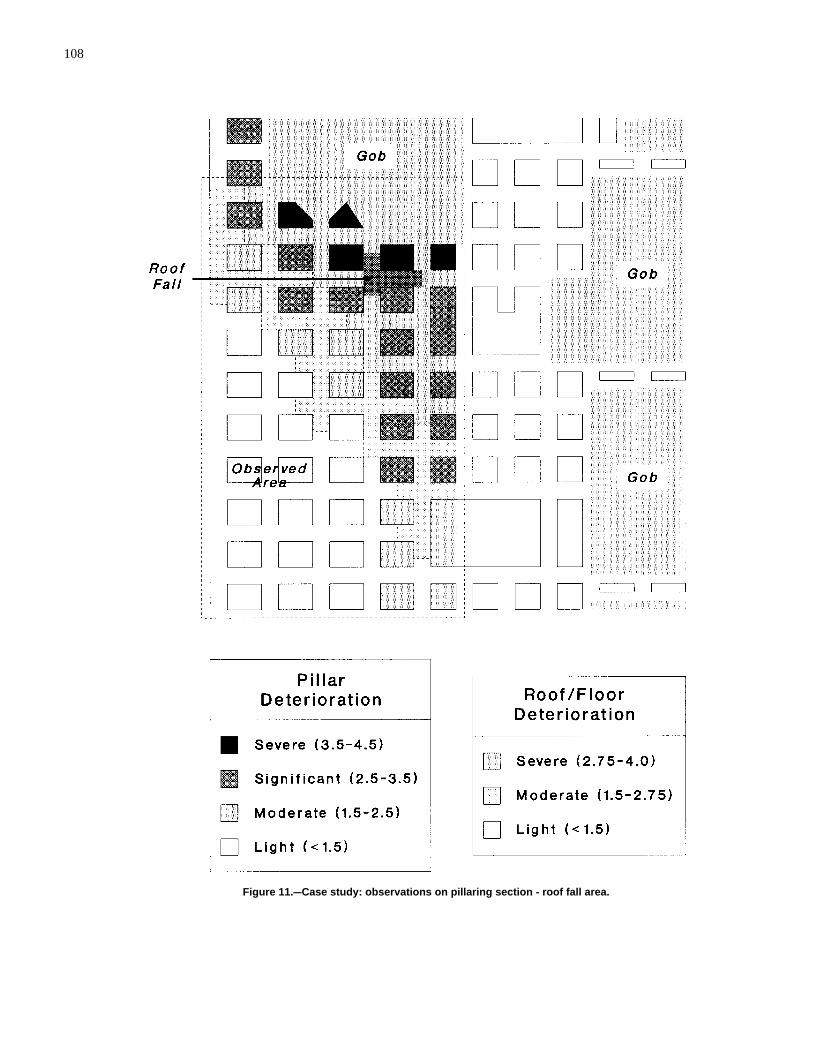
108
Figure 11.CCCase study: observations on pillaring section - roof fall area.

109
where cover was approximately 800 ft. Additional modelswere constructed of the outby areas (3-Right (650-ft cover) and1-Right (480-ft cover)) to provide model verification undersignificantly differing conditions. Vertical stress applied to themodels equaled 1.1 psi per foot of depth, and a horizontal stressof 1/2 the vertical stress was assumed in both the x and ydirections. The element size used in the simulations was 10 ft,or 1/2 the 20-ft-entry width.
A composite rock modulus of 1,260,000 psi was based ondata obtained from four boreholes in the vicinity, as shown intable 1. The individual rock moduli were estimated frompublished data for the specific strata contained in each borehole.A Poisson's ratio of 0.21 and the default Mohr-Coulombproperties (cohesion ' 800 psi, friction angle ' 25°, and tensilestrength ' 1,000 psi) were used because no site-specific datawere available.
Coal properties were based on an in situ strength of 967 psi(site-specific coal strength data were provided by the mine); thepeak and residual strength levels were calculated as outlinedpreviously in this paper. A seam height of 2.8 ft was used, anda coal modulus of elasticity of 500,000 psi was assumed. Thestress-strain curves of figure 7 represent the strain-softeningmodel used in the analysis. Shear stress-strain properties werebased on a shear modulus of 200,000 psi (0.4E).
Gob caving was simulated using the Salamon backfilldiscussed earlier with the constants a ' 100 psi and b ' 0.50.The comparison of abutment loading between BESOL and theinverse square decay function of figure 9 was based on the rockmechanics parameters used in this simulation.
Maximum pillar stress, maximum roof/floor convergence,and minimum failure index values were determined from the3 models for 37 locations (entries and crosscuts) correspondingto the observed areas. The stress and convergence data com-piled indicate the highest levels found in or adjacent to the 37locations; the failure index values represent the lowest levelsdetected at the roof line in each area. A portion of these data(entry locations) is listed in table 3. A series of multiple linearregression analyses was made to relate the deterioration indicesobserved to the BESOL data and resulted in the equations alsolisted in table 3. The R-squared values for the PDI (0.79) andthe RDI (0.80) were very good, but marginal for the FDI (0.60).It should be noted that the characterization of floor conditionswas not a primary concern during the investigation, but sketchydata acquired were used to illustrate the process. The BESOLoutput was then inputted into the regression equations to predict(back-calculate) deterioration indices for the observed locations;these values describing entry conditions are also listed in ta-ble 3. Most of the predicted PDI and RDI levels match theobserved data fairly well, and the trend of higher deteriorationindices in areas of more severe conditions was evident, evenwith the FDI.
Figure 12 presents a composite of maximum pillar stress andconvergence levels predicted by the BESOL model of the rooffall site. Note the correlation of BESOL stress and convergence
with the degree of deterioration observed underground. Thezone of high convergence (>0.25 ft) and stress (>9,500 psi)encompasses the area of deteriorating conditions at the pillarline, including the roof fall. Lower stress and convergencelevels also correspond to zones of lesser deterioration, and themore severe conditions predicted on the right side of the mains(indicating the influence of the adjacent gob) also match theconditions observed underground. These correlations, coupledwith the good fit of the regression analysis (deteriorationindices), confirmed the accuracy of the model (and propertiesused) to simulate conditions at the mine. Confidence wasfurther enhanced by an evaluation of the BESOL model with aface position several crosscuts inby the roof fall. The resultsshowed significantly lower stress and convergence levels in theface area that correlated to the better mining conditions actuallyencountered.
It was concluded that the roof fall (and deteriorating con-ditions) resulted from a combination of stresses from the activeand adjacent gobs overriding the pillar line (yielding) andfocusing outby the face. The small pillar size employed (30 by40 ft) on the mains, the lack of protection provided by thecombination of chain and barrier pillars from the adjacent gob,and the depth of cover (>800 ft) contributed to the problemsencountered.
A series of additional models was created to evaluate theperformance of various pillar sizes at different mining depthsthat would be encountered. Figure 13 illustrates the pillaringplan to be implemented using a 200-ft barrier between adjacentpanels that would be roomed and retreated along with the panelbeing extracted. Stresses and convergences were examined atfour entry locations near the face (during retreat of the secondpanel), as illustrated in figure 14. Threshold levels delineatingexpected conditions (from the 1-Left models) were establishedas follows:
Severe conditions:
Stress > 8,000 psi; convergence > 0.25 ftPDI $ 3.5; RDI $ 3.5; FDI $ 3.5
Borderline conditions:
Stress ' 6,500 to 8,000 psi; convergence ' 0.18 to 0.25 ftPDI ' 2.5 to 3.4; RDI ' 2.5 to 3.4; FDI ' 2.5 to 3.4
Desirable mining conditions:
Stress < 6,500 psi; convergence < 0.18 ftPDI < 2.5; RDI < 2.5; FDI < 2.5
It was predetermined that good (desirable) mining conditionsshould exist at locations 3 and 4 since no supplemental supports(posts) would be installed in those areas. Borderline conditionscould be tolerated at locations 1 and 2 (posts are set in this area),
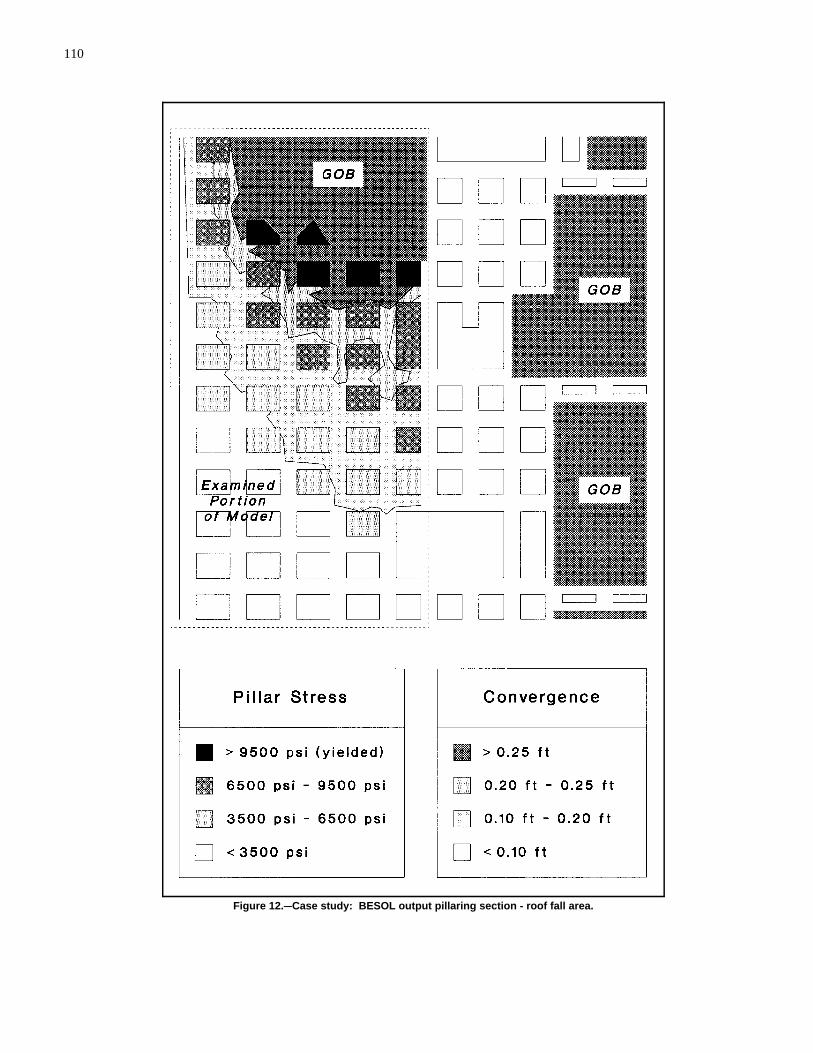
110
Figure 12.CCCase study: BESOL output pillaring section - roof fall area.
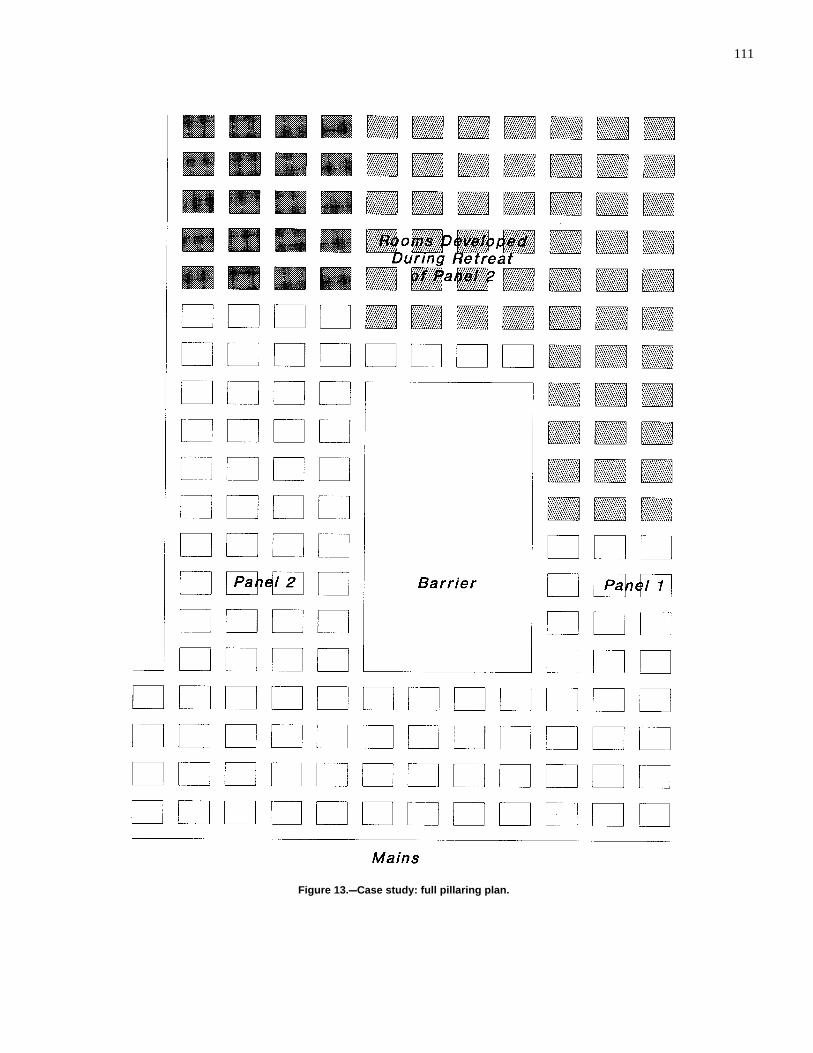
111
Figure 13.CCCase study: full pillaring plan.
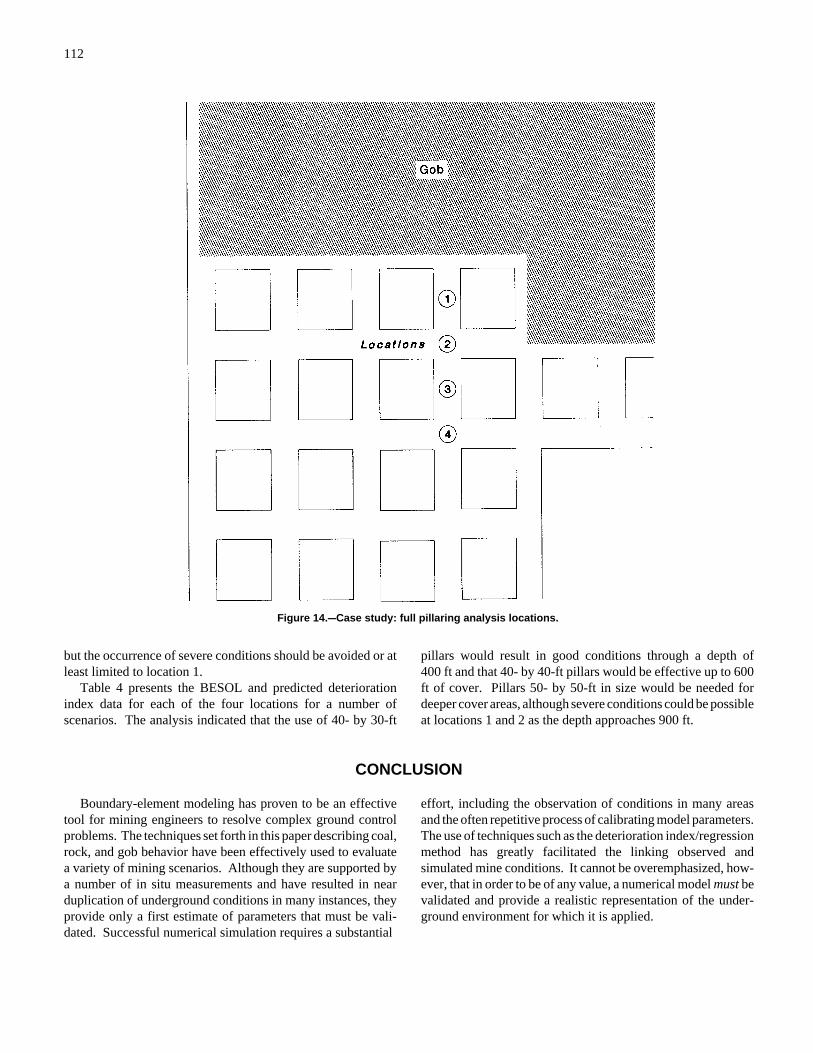
112
Figure 14.CCCase study: full pillaring analysis locations.
but the occurrence of severe conditions should be avoided or atleast limited to location 1.
Table 4 presents the BESOL and predicted deteriorationindex data for each of the four locations for a number ofscenarios. The analysis indicated that the use of 40- by 30-ft
pillars would result in good conditions through a depth of400 ft and that 40- by 40-ft pillars would be effective up to 600ft of cover. Pillars 50- by 50-ft in size would be needed fordeeper cover areas, although severe conditions could be possibleat locations 1 and 2 as the depth approaches 900 ft.
CONCLUSION
Boundary-element modeling has proven to be an effectivetool for mining engineers to resolve complex ground controlproblems. The techniques set forth in this paper describing coal,rock, and gob behavior have been effectively used to evaluatea variety of mining scenarios. Although they are supported bya number of in situ measurements and have resulted in nearduplication of underground conditions in many instances, theyprovide only a first estimate of parameters that must be vali-dated. Successful numerical simulation requires a substantial
effort, including the observation of conditions in many areasand the often repetitive process of calibrating model parameters.The use of techniques such as the deterioration index/regressionmethod has greatly facilitated the linking observed andsimulated mine conditions. It cannot be overemphasized, how-ever, that in order to be of any value, a numerical model must bevalidated and provide a realistic representation of the under-ground environment for which it is applied.
113
REFERENCES
Bieniawski ZT [1984]. Rock mechanics design in mining and tunneling.A. A. Balkema, 272 pp.
Carr F, Wilson AH [1982]. A new approach to the design of multi-entrydevelopments for retreat longwall mining. In: Proceedings of the SecondConference on Ground Control in Mining. Morgantown, WV: West VirginiaUniversity, pp. 1-21.
Choi DS, McCain DL [1980]. Design of longwall systems. Trans Soc MinEng AIME, Vol. 268, pp. 1761-1764.
Crouch SL, Fairhurst C [1973]. The mechanics of coal mine bumps and theinteraction between coal pillars, mine roof, and floor. U.S. Department of theInterior, Bureau of Mines, OFR 53-73, pp. 23-27.
Crouch Research, Inc. [1988]. The BESOL system: boundary elementsolutions for rock mechanics problems: user's guide, version 2.01. St. Paul,MN: Crouch Research, Inc., pp. 5-19.
Holland CT, Gaddy FL [1964]. The strength of coal in mine pillars. In:Proceedings of the 6th U.S. Symposium on Rock Mechanics. Rolla, MO:University of Missouri, pp. 450-466.
Hsuing SM, Peng SS [1985]. Chain pillar design for U.S. longwall panels.Min Sci and Technol, Vol. 2, pp. 279-305.
Mark C [1990]. Pillar design methods for longwall mining. Pittsburgh, PA:U.S. Department of the Interior, Bureau of Mines, IC 9247.
Mark C, Chase FE [1997]. Analysis of retreat mining pillar stability(ARMPS). In: Proceedings - New Technology for Ground Control in RetreatMining. Pittsburgh, PA: U.S. Department of Health and Human Services,Public Health Service, Centers for Disease Control and Prevention, NationalInstitute for Occupational Safety and Health, DHHS (NIOSH) PublicationNo. 97-122, IC 9446, pp. 17-34.
Mark C, Iannacchione AT [1992]. Coal pillar mechanics: theoreticalmodels and field measurements compared. In: Proceedings of the Workshopon Coal Pillar Mechanics and Design. Pittsburgh, PA: U.S. Department of theInterior, Bureau of Mines, IC 9315, pp. 78-93.
Molinda GM, Mark C [1993]. The coal mine roof rating (CMRR):a practical rock mass classification for coal mines. In: Proceedings of the 12thInternational Conference on Ground Control in Mining. Morgantown, WV:West Virginia University, pp. 92-103.
Obert L, Duvall WI [1967]. Rock mechanics and the design of structuresin rock. New York, NY: Wiley, pp. 542-545.
Pappas DM, Mark C [1993]. Load deformation behavior of simulatedlongwall gob material. In: Proceedings of the 12th International Conference onGround Control in Mining. Morgantown, WV: West Virginia University,pp. 184-193.
115
THE FRACTURE MECHANICS APPROACH TO UNDERSTANDING SUPPORTS IN UNDERGROUND COAL MINES
By James M. Kramer, Ph.D.,1 George J. Karabin, P.E.,2 and M. Terry Hoch3
ABSTRACT
This paper introduces the fracture mechanics approach—a unique way to predict the stability of a coal minepanel. The technique uses analytic equations to calculate the stress, strain, and yield characteristics of coalsupport systems. It uses fracture mechanics to model almost every type of mine support structure. Anotherfeature is a method that incorporates field-tested knowledge into the analytical analysis. For example, thistechnique can model the yield characteristics of a coal seam by combining empirical pillar strength equationsinto the analytic analysis. It may be possible to simulate multiple-seam mining by incorporating subsidencemethods into the analysis. The method is simple and quick, which makes it attractive for stress analysissoftware. It should be more accessible to those in the mining industry who do not have expertise in rockmechanics or numerical modeling. Although the purpose of this research is for modeling coal mines, it shouldbe adaptable to any mine in a tabular deposit.
1Mining engineer.2Supervisory civil engineer.3Chief.Roof Control Division, Pittsburgh Safety and Health Technology Center, Mine Safety and Health Administration, Pittsburgh, PA.
116
Fy(x) ' Fx
x 2&a 2, (1)
INTRODUCTION
This paper presents a new way to analyze the mechanicalbehavior of underground coal mine supports. Included areanalytic expressions describing the stress, strain, and yieldingcharacteristics of a coal seam. The fracture mechanics approach(FMA) provides the capability to model almost every type ofmine structure, including pillars, yield pillars, longwall gob,chocks, cribs, posts, and hydrostatic loads. In addition, it predictspillar stability by combining empirical pillar strength equationsinto the analytic analysis. This makes the procedure useful forunderstanding how various support structures affect themechanical performance of a mine panel.
Although the method is not as sophisticated as numericalanalysis, it offers several advantages. The analytic equation
makes it is as accurate as numerical modeling, but quicker andeasier to use. Because of the few equations involved, it is easyto incorporate the process into a computer spreadsheet orprogrammable calculator. Real-time design analysis is possibleby incorporating the technique into computer code. For ex-ample, one can change a design structure (e.g., add a crib) andsee instantly the resultant stress effect. The coal yielding proc-ess uses empirical pillar strength equations derived from yearsof field measurements. Combining these equations into theanalytic analysis provides insight into pillar stability. Thesystem presented in this paper offers a unique perspective fromwhich to study mine panel stability.
DESIGNING SUPPORT STRUCTURES FOR COAL MINES
There are several ways to analyze the stability of a minelayout. The easiest and, in some cases, most reliable is to usepillar strength equations. These equations are developed fromextensive knowledge of coal seam behavior [Mark and Iannac-chione 1992]. Most are based on physical stress measurements;however, some come from numerical studies or analyticequations. All of these methods use the pillar width-to-heightratio as the controlling factor. These strength equations can beaccurate; however, they assume that the coal pillar is the singlemeans of support. It is not possible to study the effects of cribs,posts, longwall gob, chocks, etc. Also, these equations do notpredict the stress distribution through the panel, nor do theypredict the extent of the yield zone in the coal.
There are other, more accurate, ways to analyze stability.Numerical modeling, if used properly, can be very accurate. It
can predict the stress distribution throughout the entire mineenvironment, including the coal seam, surrounding strata, slips,faults, and all types of supports. However, this method is time-consuming and requires a certain amount of technical skill. Forexample, using finite elements, it would take a skilled engineera day or more to analyze the yield zone in a coal pillar based ondata derived from field measurements.
This paper discusses a simple, quick, and accurate solutionfor predicting the stress distribution in coal pillars and otherstructures. It uses a combination of fracture mechanics and em-pirically derived techniques to predict the extent of the yieldzone in a coal pillar. It can model nearly every structure usedfor mine support. Numerical modeling will validate the ac-curacy of the technique.
THE FRACTURE MECHANICS APPROACH
Understanding the FMA requires visualizing a coal seamas an extremely thin layer in the stratum of the Earth. A tunnelor opening in the coal would appear as a thin crack in aninfinite mass.4 It should then make sense that it is possible touse the mechanics of cracks to analyze the stresses surroundingopenings in coal seams.
Visualizing a mine opening as a crack is not new; othersapplied it to their research [Barenblatt 1962; Hacket 1959;Crouch and Fairhurst 1973; Berry 1960, 1963]. However, thispaper describes a way to use the fracture mechanics directly topredict pillar stress. Combined with a superpositioning
4In this paper, the term “crack” infers a mine opening and vice versa.
Therefore, crack-tip stress is the same as rib or pillar stress.
technique, it is possible to obtain the complete stress distributionthroughout the mine panel. A yielding technique completes theanalysis by offering realistic characteristics to the coal pillars.
Westergaard's equation is fundamental to fracture me-chanics theory and is also the basic equation for the FMA[Westergaard 1939]. The stress distribution at the crack tip isidentical to the distribution adjacent to a mine opening.Westergaard describes the stress at the tip of a crack as
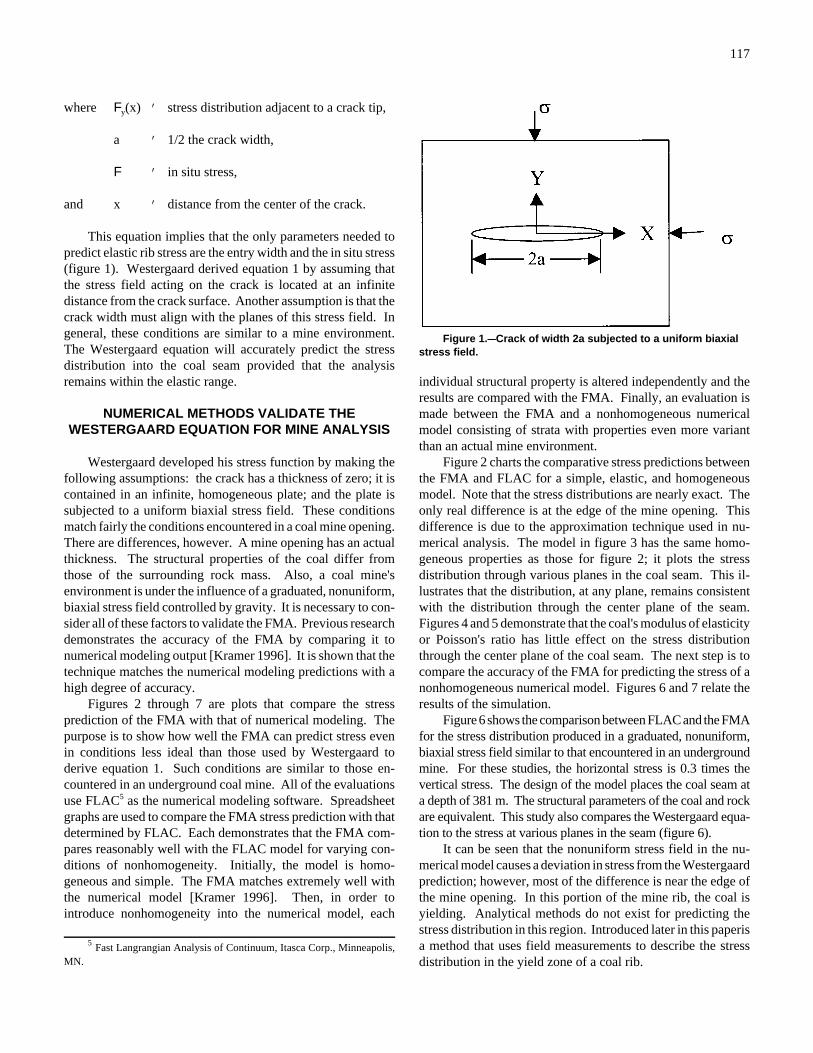
117
Figure 1.CCCrack of width 2a subjected to a uniform biaxialstress field.
where Fy(x) ' stress distribution adjacent to a crack tip,
a ' 1/2 the crack width,
F ' in situ stress,
and x ' distance from the center of the crack.
This equation implies that the only parameters needed topredict elastic rib stress are the entry width and the in situ stress(figure 1). Westergaard derived equation 1 by assuming thatthe stress field acting on the crack is located at an infinitedistance from the crack surface. Another assumption is that thecrack width must align with the planes of this stress field. Ingeneral, these conditions are similar to a mine environment.The Westergaard equation will accurately predict the stressdistribution into the coal seam provided that the analysisremains within the elastic range.
NUMERICAL METHODS VALIDATE THEWESTERGAARD EQUATION FOR MINE ANALYSIS
Westergaard developed his stress function by making thefollowing assumptions: the crack has a thickness of zero; it iscontained in an infinite, homogeneous plate; and the plate issubjected to a uniform biaxial stress field. These conditionsmatch fairly the conditions encountered in a coal mine opening.There are differences, however. A mine opening has an actualthickness. The structural properties of the coal differ fromthose of the surrounding rock mass. Also, a coal mine'senvironment is under the influence of a graduated, nonuniform,biaxial stress field controlled by gravity. It is necessary to con-sider all of these factors to validate the FMA. Previous researchdemonstrates the accuracy of the FMA by comparing it tonumerical modeling output [Kramer 1996]. It is shown that thetechnique matches the numerical modeling predictions with ahigh degree of accuracy.
Figures 2 through 7 are plots that compare the stressprediction of the FMA with that of numerical modeling. Thepurpose is to show how well the FMA can predict stress evenin conditions less ideal than those used by Westergaard toderive equation 1. Such conditions are similar to those en-countered in an underground coal mine. All of the evaluationsuse FLAC5 as the numerical modeling software. Spreadsheetgraphs are used to compare the FMA stress prediction with thatdetermined by FLAC. Each demonstrates that the FMA com-pares reasonably well with the FLAC model for varying con-ditions of nonhomogeneity. Initially, the model is homo-geneous and simple. The FMA matches extremely well withthe numerical model [Kramer 1996]. Then, in order tointroduce nonhomogeneity into the numerical model, each
5 Fast Langrangian Analysis of Continuum, Itasca Corp., Minneapolis,MN.
individual structural property is altered independently and theresults are compared with the FMA. Finally, an evaluation ismade between the FMA and a nonhomogeneous numericalmodel consisting of strata with properties even more variantthan an actual mine environment.
Figure 2 charts the comparative stress predictions betweenthe FMA and FLAC for a simple, elastic, and homogeneousmodel. Note that the stress distributions are nearly exact. Theonly real difference is at the edge of the mine opening. Thisdifference is due to the approximation technique used in nu-merical analysis. The model in figure 3 has the same homo-geneous properties as those for figure 2; it plots the stressdistribution through various planes in the coal seam. This il-lustrates that the distribution, at any plane, remains consistentwith the distribution through the center plane of the seam.Figures 4 and 5 demonstrate that the coal's modulus of elasticityor Poisson's ratio has little effect on the stress distributionthrough the center plane of the coal seam. The next step is tocompare the accuracy of the FMA for predicting the stress of anonhomogeneous numerical model. Figures 6 and 7 relate theresults of the simulation.
Figure 6 shows the comparison between FLAC and the FMAfor the stress distribution produced in a graduated, nonuniform,biaxial stress field similar to that encountered in an undergroundmine. For these studies, the horizontal stress is 0.3 times thevertical stress. The design of the model places the coal seam ata depth of 381 m. The structural parameters of the coal and rockare equivalent. This study also compares the Westergaard equa-tion to the stress at various planes in the seam (figure 6).
It can be seen that the nonuniform stress field in the nu-merical model causes a deviation in stress from the Westergaardprediction; however, most of the difference is near the edge ofthe mine opening. In this portion of the mine rib, the coal isyielding. Analytical methods do not exist for predicting thestress distribution in this region. Introduced later in this paperisa method that uses field measurements to describe the stressdistribution in the yield zone of a coal rib.

118
Figure 2.CCStress distribution in a coal seam next to a mine opening: comparison between numericalanalysis and the Westergaard equation. Homogeneous model.
Figure 3.CCStress distribution at various levels in the coal seam. Properties similar to the modelin figure 2.
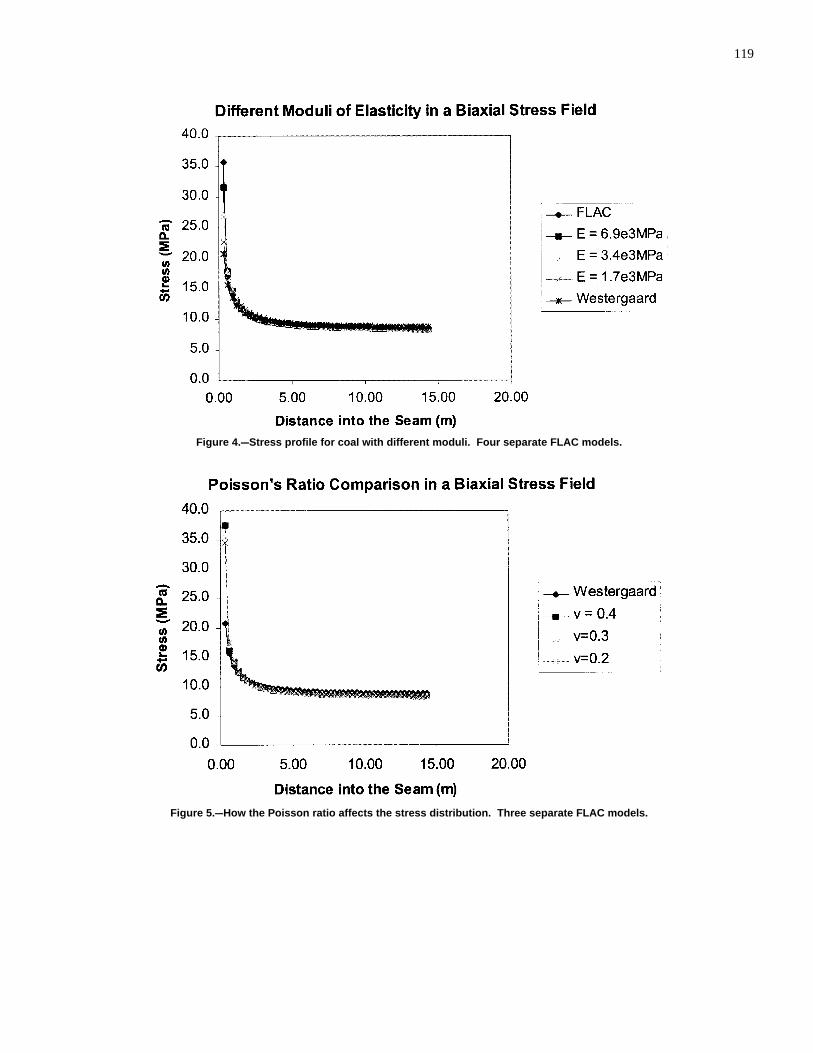
119
Figure 4.CCStress profile for coal with different moduli. Four separate FLAC models.
Figure 5.CCHow the Poisson ratio affects the stress distribution. Three separate FLAC models.
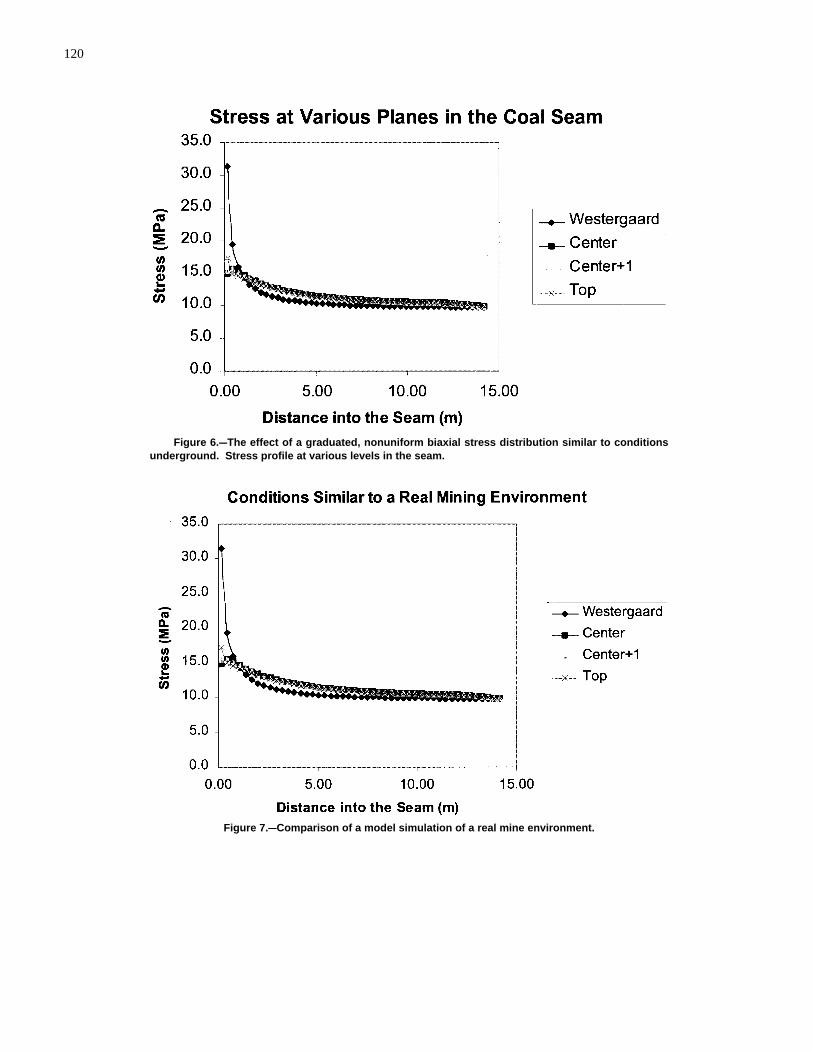
120
Figure 6.CCThe effect of a graduated, nonuniform biaxial stress distribution similar to conditionsunderground. Stress profile at various levels in the seam.
Figure 7.CCComparison of a model simulation of a real mine environment.
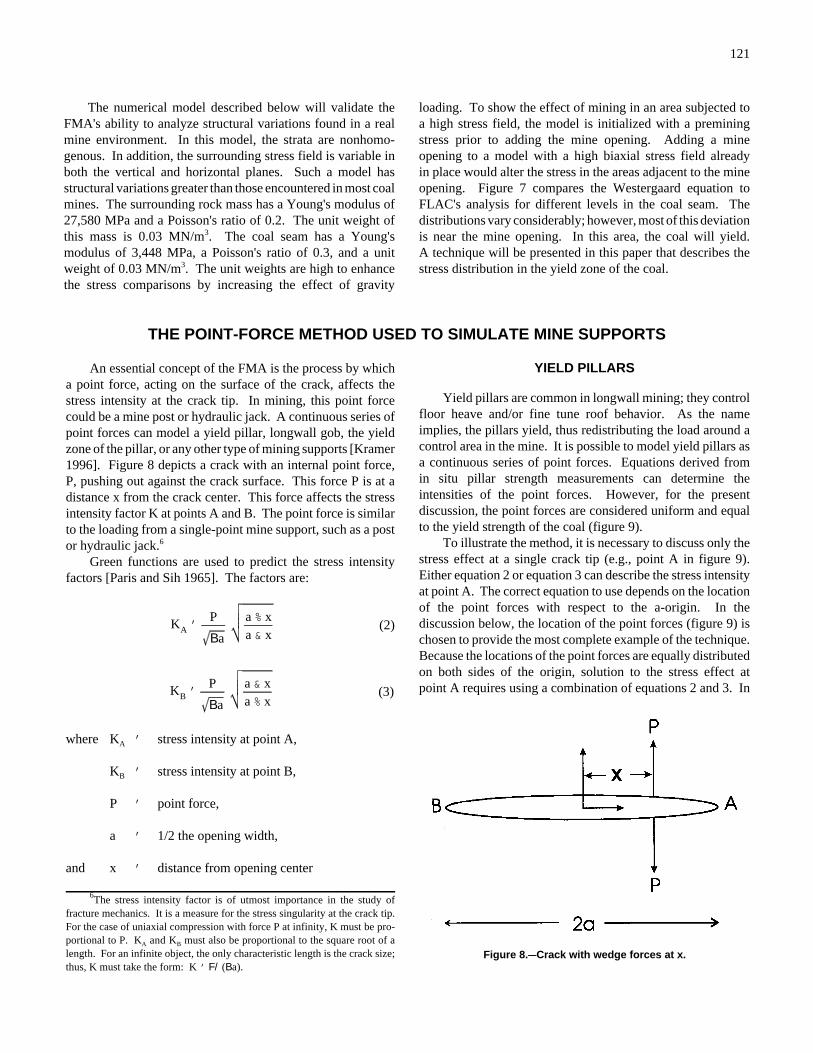
121
KA 'P
Ba
a % xa & x
(2)
KB 'P
Ba
a & xa % x
(3)
Figure 8.CCCrack with wedge forces at x.
The numerical model described below will validate theFMA's ability to analyze structural variations found in a realmine environment. In this model, the strata are nonhomo-genous. In addition, the surrounding stress field is variable inboth the vertical and horizontal planes. Such a model hasstructural variations greater than those encountered in most coalmines. The surrounding rock mass has a Young's modulus of27,580 MPa and a Poisson's ratio of 0.2. The unit weight ofthis mass is 0.03 MN/m3. The coal seam has a Young'smodulus of 3,448 MPa, a Poisson's ratio of 0.3, and a unitweight of 0.03 MN/m3. The unit weights are high to enhancethe stress comparisons by increasing the effect of gravity
loading. To show the effect of mining in an area subjected toa high stress field, the model is initialized with a preminingstress prior to adding the mine opening. Adding a mineopening to a model with a high biaxial stress field alreadyin place would alter the stress in the areas adjacent to the mineopening. Figure 7 compares the Westergaard equation toFLAC's analysis for different levels in the coal seam. Thedistributions vary considerably; however, most of this deviationis near the mine opening. In this area, the coal will yield.A technique will be presented in this paper that describes thestress distribution in the yield zone of the coal.
THE POINT-FORCE METHOD USED TO SIMULATE MINE SUPPORTS
An essential concept of the FMA is the process by whicha point force, acting on the surface of the crack, affects thestress intensity at the crack tip. In mining, this point forcecould be a mine post or hydraulic jack. A continuous series ofpoint forces can model a yield pillar, longwall gob, the yieldzone of the pillar, or any other type of mining supports [Kramer1996]. Figure 8 depicts a crack with an internal point force,P, pushing out against the crack surface. This force P is at adistance x from the crack center. This force affects the stressintensity factor K at points A and B. The point force is similarto the loading from a single-point mine support, such as a postor hydraulic jack.6
Green functions are used to predict the stress intensityfactors [Paris and Sih 1965]. The factors are:
where KA ' stress intensity at point A,
KB ' stress intensity at point B,
P ' point force,
a ' 1/2 the opening width,
and x ' distance from opening center
6The stress intensity factor is of utmost importance in the study offracture mechanics. It is a measure for the stress singularity at the crack tip.For the case of uniaxial compression with force P at infinity, K must be pro-portional to P. KA and KB must also be proportional to the square root of alength. For an infinite object, the only characteristic length is the crack size;thus, K must take the form: K ' F/(Ba).
YIELD PILLARS
Yield pillars are common in longwall mining; they controlfloor heave and/or fine tune roof behavior. As the nameimplies, the pillars yield, thus redistributing the load around acontrol area in the mine. It is possible to model yield pillars asa continuous series of point forces. Equations derived fromin situ pillar strength measurements can determine theintensities of the point forces. However, for the presentdiscussion, the point forces are considered uniform and equalto the yield strength of the coal (figure 9).
To illustrate the method, it is necessary to discuss only thestress effect at a single crack tip (e.g., point A in figure 9).Either equation 2 or equation 3 can describe the stress intensityat point A. The correct equation to use depends on the locationof the point forces with respect to the a-origin. In thediscussion below, the location of the point forces (figure 9) ischosen to provide the most complete example of the technique.Because the locations of the point forces are equally distributedon both sides of the origin, solution to the stress effect atpoint A requires using a combination of equations 2 and 3. In
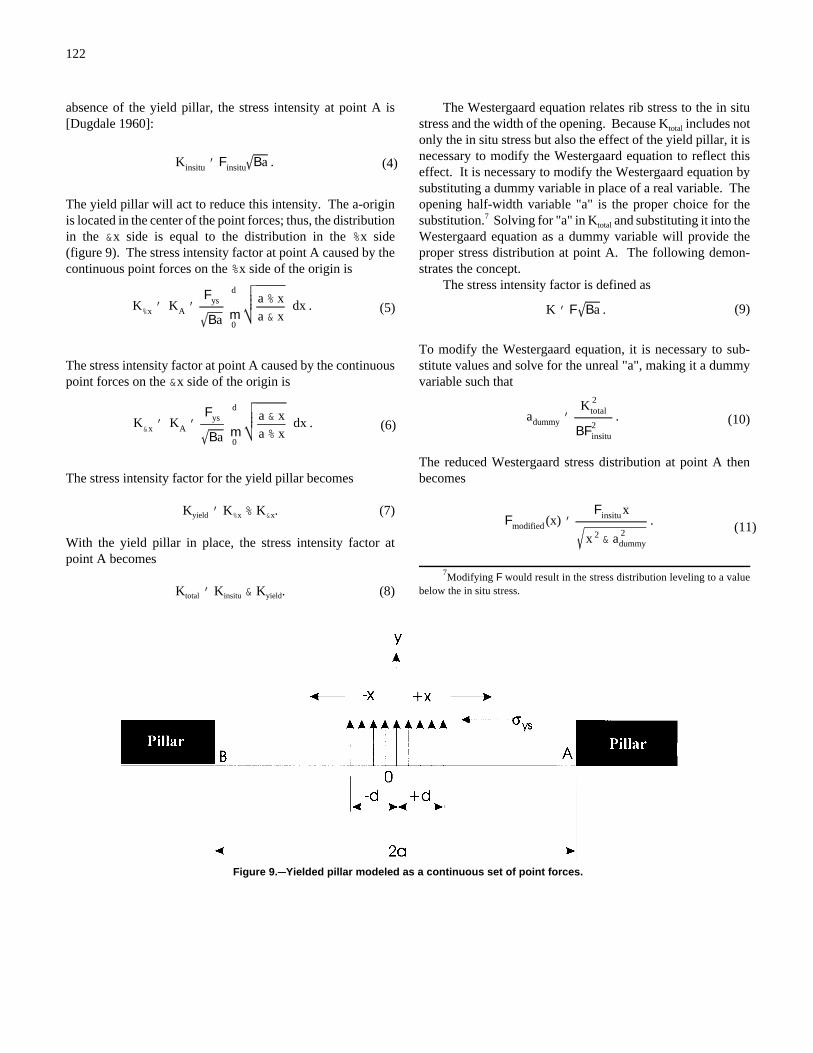
122
Kinsitu ' Finsitu Ba . (4)
K%x ' KA '
Fys
Ba md
0
a % xa & x
dx . (5)
K&x ' KA '
Fys
Ba md
0
a & xa % x
dx . (6)
K ' F Ba . (9)
adummy 'K 2
total
BF2insitu
. (10)
Fmodified (x) 'Finsitu x
x 2 & a 2dummy
. (11)
Figure 9.CCYielded pillar modeled as a continuous set of point forces.
absence of the yield pillar, the stress intensity at point A is[Dugdale 1960]:
The yield pillar will act to reduce this intensity. The a-originis located in the center of the point forces; thus, the distributionin the &x side is equal to the distribution in the %x side(figure 9). The stress intensity factor at point A caused by thecontinuous point forces on the %x side of the origin is
The stress intensity factor at point A caused by the continuouspoint forces on the &x side of the origin is
The stress intensity factor for the yield pillar becomes
Kyield ' K%x % K&x. (7)
With the yield pillar in place, the stress intensity factor atpoint A becomes
Ktotal ' Kinsitu & Kyield. (8)
The Westergaard equation relates rib stress to the in situstress and the width of the opening. Because Ktotal includes notonly the in situ stress but also the effect of the yield pillar, it isnecessary to modify the Westergaard equation to reflect thiseffect. It is necessary to modify the Westergaard equation bysubstituting a dummy variable in place of a real variable. Theopening half-width variable "a" is the proper choice for thesubstitution.7 Solving for "a" in Ktotal and substituting it into theWestergaard equation as a dummy variable will provide theproper stress distribution at point A. The following demon-strates the concept.
The stress intensity factor is defined as
To modify the Westergaard equation, it is necessary to sub-stitute values and solve for the unreal "a", making it a dummyvariable such that
The reduced Westergaard stress distribution at point A thenbecomes
7Modifying F would result in the stress distribution leveling to a valuebelow the in situ stress.
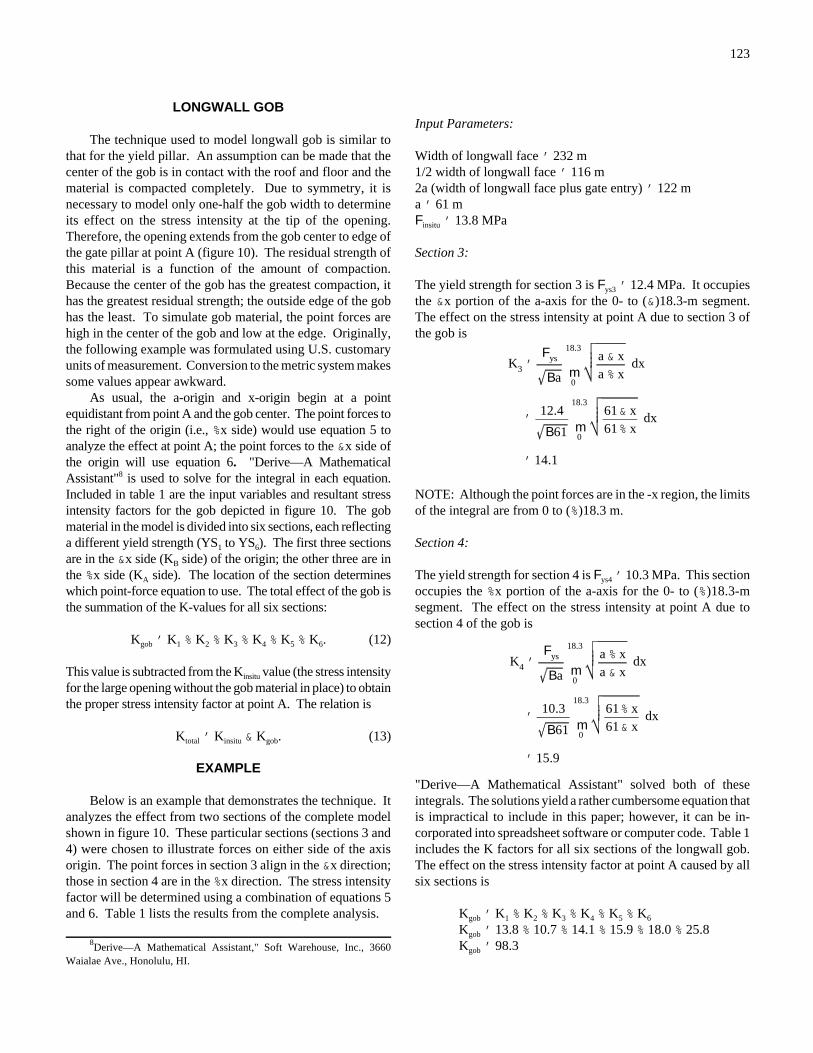
123
K3 'Fys
Ba m18.3
0
a & xa % x
dx
'12.4
B61 m18.3
0
61& x61% x
dx
' 14.1
K4 'Fys
Ba m18.3
0
a % xa & x
dx
'10.3
B61 m18.3
0
61% x61& x
dx
' 15.9
LONGWALL GOB
The technique used to model longwall gob is similar tothat for the yield pillar. An assumption can be made that thecenter of the gob is in contact with the roof and floor and thematerial is compacted completely. Due to symmetry, it isnecessary to model only one-half the gob width to determineits effect on the stress intensity at the tip of the opening.Therefore, the opening extends from the gob center to edge ofthe gate pillar at point A (figure 10). The residual strength ofthis material is a function of the amount of compaction.Because the center of the gob has the greatest compaction, ithas the greatest residual strength; the outside edge of the gobhas the least. To simulate gob material, the point forces arehigh in the center of the gob and low at the edge. Originally,the following example was formulated using U.S. customaryunits of measurement. Conversion to the metric system makessome values appear awkward.
As usual, the a-origin and x-origin begin at a pointequidistant from point A and the gob center. The point forces tothe right of the origin (i.e., %x side) would use equation 5 toanalyze the effect at point A; the point forces to the &x side ofthe origin will use equation 6. "Derive—A MathematicalAssistant"8 is used to solve for the integral in each equation.Included in table 1 are the input variables and resultant stressintensity factors for the gob depicted in figure 10. The gobmaterial in the model is divided into six sections, each reflectinga different yield strength (YS1 to YS6). The first three sectionsare in the &x side (KB side) of the origin; the other three are inthe %x side (KA side). The location of the section determineswhich point-force equation to use. The total effect of the gob isthe summation of the K-values for all six sections:
Kgob ' K1 % K2 % K3 % K4 % K5 % K6. (12)
This value is subtracted from the Kinsitu value (the stress intensityfor the large opening without the gob material in place) to obtainthe proper stress intensity factor at point A. The relation is
Ktotal ' Kinsitu & Kgob. (13)
EXAMPLE
Below is an example that demonstrates the technique. Itanalyzes the effect from two sections of the complete modelshown in figure 10. These particular sections (sections 3 and4) were chosen to illustrate forces on either side of the axisorigin. The point forces in section 3 align in the &x direction;those in section 4 are in the %x direction. The stress intensityfactor will be determined using a combination of equations 5and 6. Table 1 lists the results from the complete analysis.
8Derive—A Mathematical Assistant," Soft Warehouse, Inc., 3660Waialae Ave., Honolulu, HI.
Input Parameters:
Width of longwall face ' 232 m1/2 width of longwall face ' 116 m2a (width of longwall face plus gate entry) ' 122 ma ' 61 mFinsitu ' 13.8 MPa
Section 3:
The yield strength for section 3 is Fys3 ' 12.4 MPa. It occupiesthe &x portion of the a-axis for the 0- to (&)18.3-m segment.The effect on the stress intensity at point A due to section 3 ofthe gob is
NOTE: Although the point forces are in the -x region, the limitsof the integral are from 0 to (%)18.3 m.
Section 4:
The yield strength for section 4 is Fys4 ' 10.3 MPa. This sectionoccupies the %x portion of the a-axis for the 0- to (%)18.3-msegment. The effect on the stress intensity at point A due tosection 4 of the gob is
"Derive—A Mathematical Assistant" solved both of theseintegrals. The solutions yield a rather cumbersome equation thatis impractical to include in this paper; however, it can be in-corporated into spreadsheet software or computer code. Table 1includes the K factors for all six sections of the longwall gob.The effect on the stress intensity factor at point A caused by allsix sections is
Kgob ' K1 % K2 % K3 % K4 % K5 % K6
Kgob ' 13.8 % 10.7 % 14.1 % 15.9 % 18.0 % 25.8Kgob ' 98.3
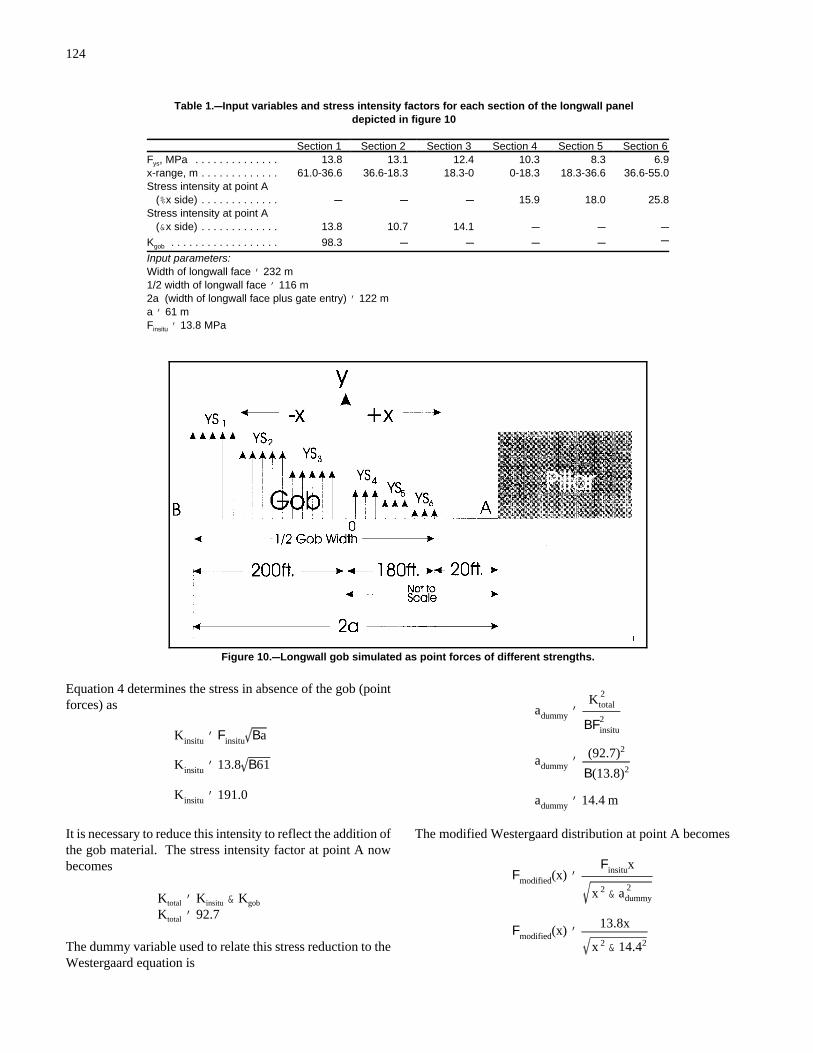
124
Kinsitu ' Finsitu Ba
Kinsitu ' 13.8 B61
Kinsitu ' 191.0
adummy 'K 2
total
BF2insitu
adummy '(92.7)2
B(13.8)2
adummy ' 14.4 m
Fmodified(x) 'Finsitux
x 2 & a 2dummy
Fmodified(x) ' 13.8x
x 2 & 14.42
Figure 10.CCLongwall gob simulated as point forces of different strengths.
Table 1.CCInput variables and stress intensity factors for each section of the longwall paneldepicted in figure 10
Section 1 Section 2 Section 3 Section 4 Section 5 Section 6Fys, MPa . . . . . . . . . . . . . . 13.8 13.1 12.4 10.3 8.3 6.9x-range, m . . . . . . . . . . . . . 61.0-36.6 36.6-18.3 18.3-0 0-18.3 18.3-36.6 36.6-55.0Stress intensity at point A (%x side) . . . . . . . . . . . . . C C C 15.9 18.0 25.8Stress intensity at point A (&x side) . . . . . . . . . . . . . 13.8 10.7 14.1 C C C
Kgob . . . . . . . . . . . . . . . . . . 98.3 C C C C C
Input parameters:Width of longwall face ' 232 m1/2 width of longwall face ' 116 m2a (width of longwall face plus gate entry) ' 122 ma ' 61 mFinsitu ' 13.8 MPa
Equation 4 determines the stress in absence of the gob (pointforces) as
It is necessary to reduce this intensity to reflect the addition ofthe gob material. The stress intensity factor at point A nowbecomes
Ktotal ' Kinsitu & Kgob
Ktotal ' 92.7
The dummy variable used to relate this stress reduction to theWestergaard equation is
The modified Westergaard distribution at point A becomes
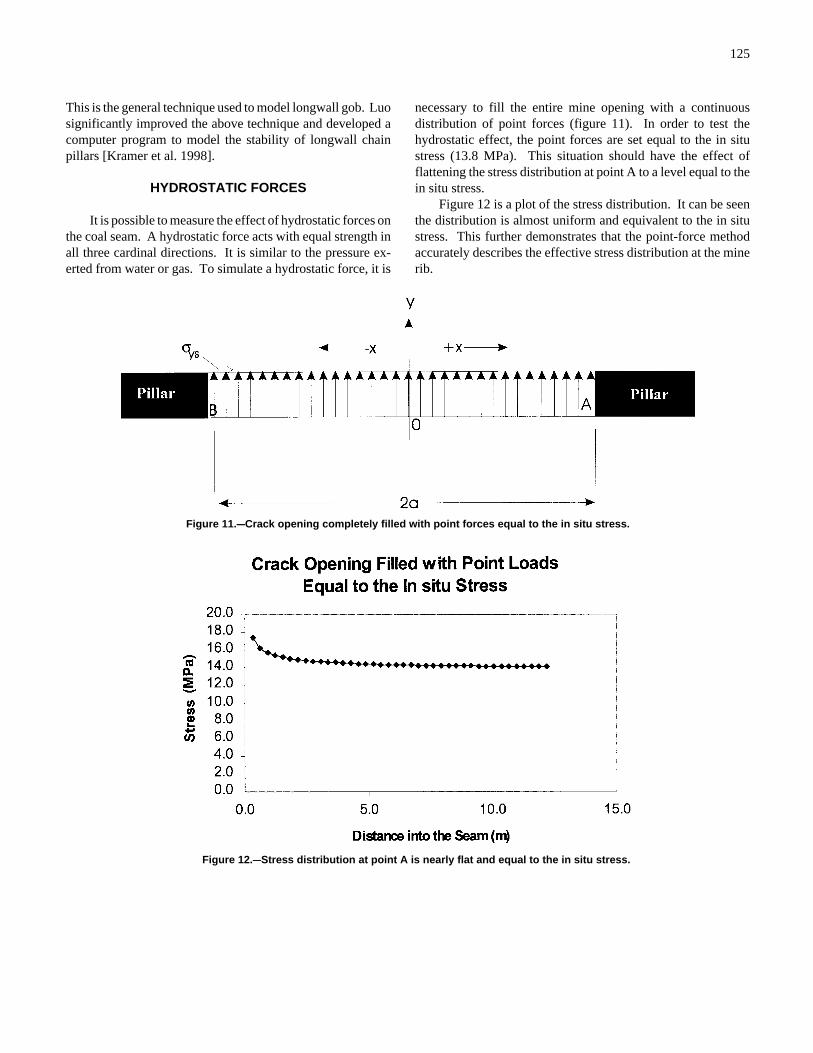
125
Figure 11.CCCrack opening completely filled with point forces equal to the in situ stress.
Figure 12.CCStress distribution at point A is nearly flat and equal to the in situ stress.
This is the general technique used to model longwall gob. Luosignificantly improved the above technique and developed acomputer program to model the stability of longwall chainpillars [Kramer et al. 1998].
HYDROSTATIC FORCES
It is possible to measure the effect of hydrostatic forces onthe coal seam. A hydrostatic force acts with equal strength inall three cardinal directions. It is similar to the pressure ex-erted from water or gas. To simulate a hydrostatic force, it is
necessary to fill the entire mine opening with a continuousdistribution of point forces (figure 11). In order to test thehydrostatic effect, the point forces are set equal to the in situstress (13.8 MPa). This situation should have the effect offlattening the stress distribution at point A to a level equal to thein situ stress.
Figure 12 is a plot of the stress distribution. It can be seenthe distribution is almost uniform and equivalent to the in situstress. This further demonstrates that the point-force methodaccurately describes the effective stress distribution at the minerib.
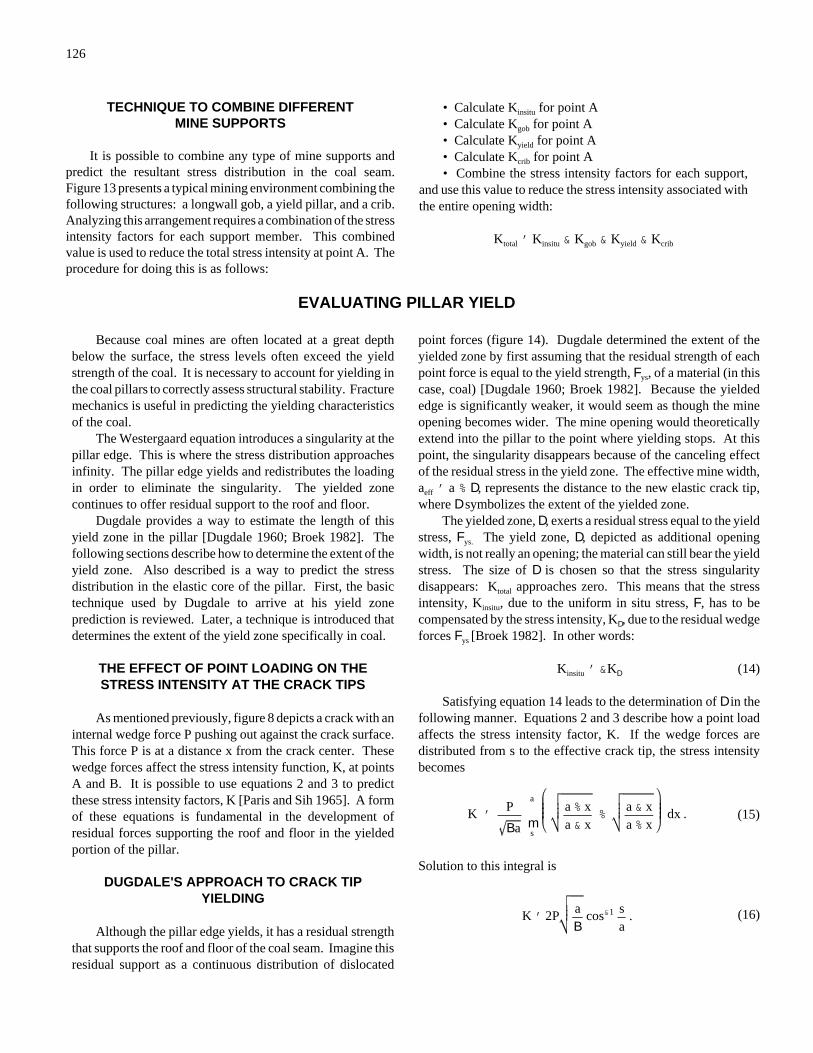
126
K 'P
Ba ma
s
a % xa & x
%a & xa % x
dx . (15)
K ' 2P aB
cos&1 sa
. (16)
TECHNIQUE TO COMBINE DIFFERENTMINE SUPPORTS
It is possible to combine any type of mine supports andpredict the resultant stress distribution in the coal seam.Figure 13 presents a typical mining environment combining thefollowing structures: a longwall gob, a yield pillar, and a crib.Analyzing this arrangement requires a combination of the stressintensity factors for each support member. This combinedvalue is used to reduce the total stress intensity at point A. Theprocedure for doing this is as follows:
• Calculate Kinsitu for point A• Calculate Kgob for point A• Calculate Kyield for point A• Calculate Kcrib for point A• Combine the stress intensity factors for each support,
and use this value to reduce the stress intensity associated withthe entire opening width:
Ktotal ' Kinsitu & Kgob & Kyield & Kcrib
EVALUATING PILLAR YIELD
Because coal mines are often located at a great depthbelow the surface, the stress levels often exceed the yieldstrength of the coal. It is necessary to account for yielding inthe coal pillars to correctly assess structural stability. Fracturemechanics is useful in predicting the yielding characteristicsof the coal.
The Westergaard equation introduces a singularity at thepillar edge. This is where the stress distribution approachesinfinity. The pillar edge yields and redistributes the loadingin order to eliminate the singularity. The yielded zonecontinues to offer residual support to the roof and floor.
Dugdale provides a way to estimate the length of thisyield zone in the pillar [Dugdale 1960; Broek 1982]. Thefollowing sections describe how to determine the extent of theyield zone. Also described is a way to predict the stressdistribution in the elastic core of the pillar. First, the basictechnique used by Dugdale to arrive at his yield zoneprediction is reviewed. Later, a technique is introduced thatdetermines the extent of the yield zone specifically in coal.
THE EFFECT OF POINT LOADING ON THESTRESS INTENSITY AT THE CRACK TIPS
As mentioned previously, figure 8 depicts a crack with aninternal wedge force P pushing out against the crack surface.This force P is at a distance x from the crack center. Thesewedge forces affect the stress intensity function, K, at pointsA and B. It is possible to use equations 2 and 3 to predictthese stress intensity factors, K [Paris and Sih 1965]. A formof these equations is fundamental in the development ofresidual forces supporting the roof and floor in the yieldedportion of the pillar.
DUGDALE'S APPROACH TO CRACK TIPYIELDING
Although the pillar edge yields, it has a residual strengththat supports the roof and floor of the coal seam. Imagine thisresidual support as a continuous distribution of dislocated
point forces (figure 14). Dugdale determined the extent of theyielded zone by first assuming that the residual strength of eachpoint force is equal to the yield strength, Fys, of a material (in thiscase, coal) [Dugdale 1960; Broek 1982]. Because the yieldededge is significantly weaker, it would seem as though the mineopening becomes wider. The mine opening would theoreticallyextend into the pillar to the point where yielding stops. At thispoint, the singularity disappears because of the canceling effectof the residual stress in the yield zone. The effective mine width,aeff ' a % D, represents the distance to the new elastic crack tip,where D symbolizes the extent of the yielded zone.
The yielded zone, D, exerts a residual stress equal to the yieldstress, Fys. The yield zone, D, depicted as additional openingwidth, is not really an opening; the material can still bear the yieldstress. The size of D is chosen so that the stress singularitydisappears: Ktotal approaches zero. This means that the stressintensity, Kinsitu, due to the uniform in situ stress, F, has to becompensated by the stress intensity, KD, due to the residual wedgeforces Fys [Broek 1982]. In other words:
Kinsitu ' &KD (14)
Satisfying equation 14 leads to the determination of D in thefollowing manner. Equations 2 and 3 describe how a point loadaffects the stress intensity factor, K. If the wedge forces aredistributed from s to the effective crack tip, the stress intensitybecomes
Solution to this integral is
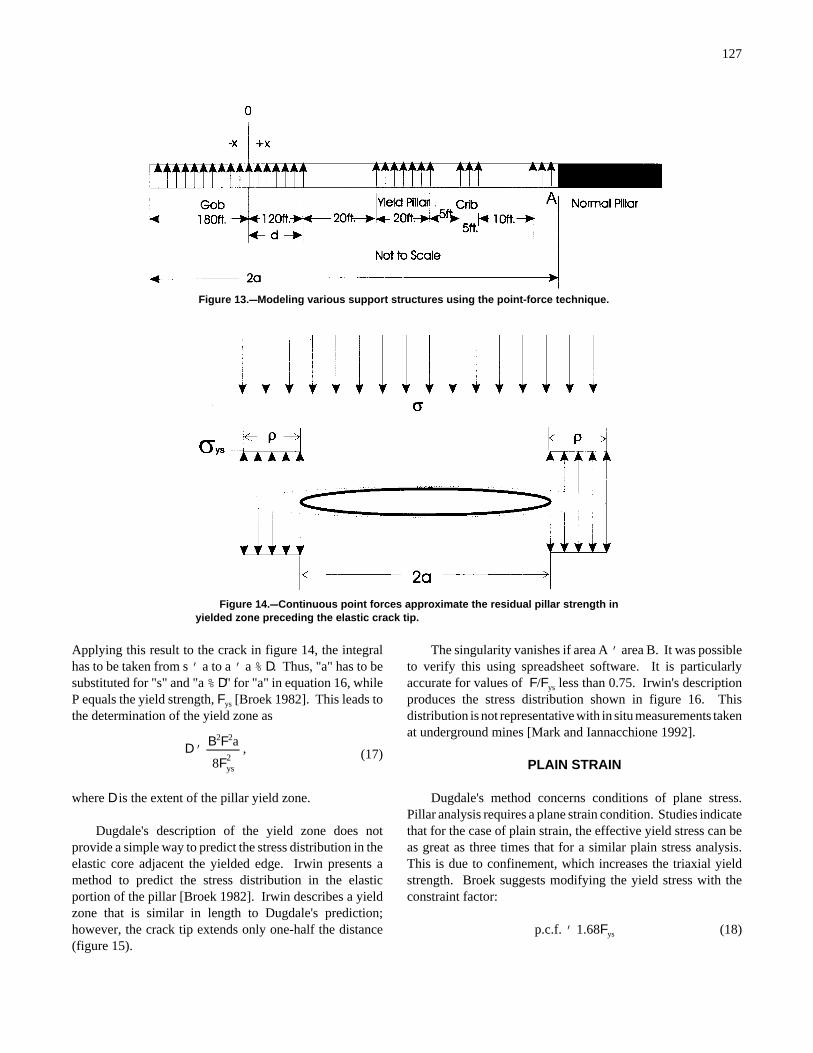
127
D 'B2F2a
8F2ys
, (17)
Figure 13.CCModeling various support structures using the point-force technique.
Figure 14.CCContinuous point forces approximate the residual pillar strength inyielded zone preceding the elastic crack tip.
Applying this result to the crack in figure 14, the integralhas to be taken from s ' a to a ' a % D. Thus, "a" has to besubstituted for "s" and "a % D" for "a" in equation 16, whileP equals the yield strength, Fys [Broek 1982]. This leads tothe determination of the yield zone as
where D is the extent of the pillar yield zone.
Dugdale's description of the yield zone does notprovide a simple way to predict the stress distribution in theelastic core adjacent the yielded edge. Irwin presents amethod to predict the stress distribution in the elasticportion of the pillar [Broek 1982]. Irwin describes a yieldzone that is similar in length to Dugdale's prediction;however, the crack tip extends only one-half the distance(figure 15).
The singularity vanishes if area A ' area B. It was possibleto verify this using spreadsheet software. It is particularlyaccurate for values of F/Fys less than 0.75. Irwin's descriptionproduces the stress distribution shown in figure 16. Thisdistribution is not representative with in situ measurements takenat underground mines [Mark and Iannacchione 1992].
PLAIN STRAIN
Dugdale's method concerns conditions of plane stress.Pillar analysis requires a plane strain condition. Studies indicatethat for the case of plain strain, the effective yield stress can beas great as three times that for a similar plain stress analysis.This is due to confinement, which increases the triaxial yieldstrength. Broek suggests modifying the yield stress with theconstraint factor:
p.c.f. ' 1.68Fys (18)
128
Figure 15.CCThe Westergaard distribution originates at the beginning of the Irwin zone, but does not takeeffect until the beginning of the elastic zone.
Figure 16.CCPillar stress distribution as predicted by the Dugdale-Irwin method.
THE DUGDALE-IRWIN METHOD AS IT RELATES TOA MINE ENVIRONMENT
Previous research indicates that confinement increases theyield strength of a pillar core [Crouch and Fairhurst 1973;Karabin and Evanto 1999; Sih 1966; Salamon and Munro1967]. However, the measured pillar stress distribution doesnot resemble the distribution predicted by Dugdale-Irwin shownin figure 16. Underground measurements show the residual
strength should be low at the wall of the mine opening, butincrease proportionally with the distance into the pillarcore.
The mathematical model predicted by Dugdale-Irwin isaccurate; only the visual perception is misleading. Theresidual stress distribution in the yielded area can take onany shape as long as area A equals area B (figure 17).A more realistic stress distribution such as that in figure 18should then be possible.
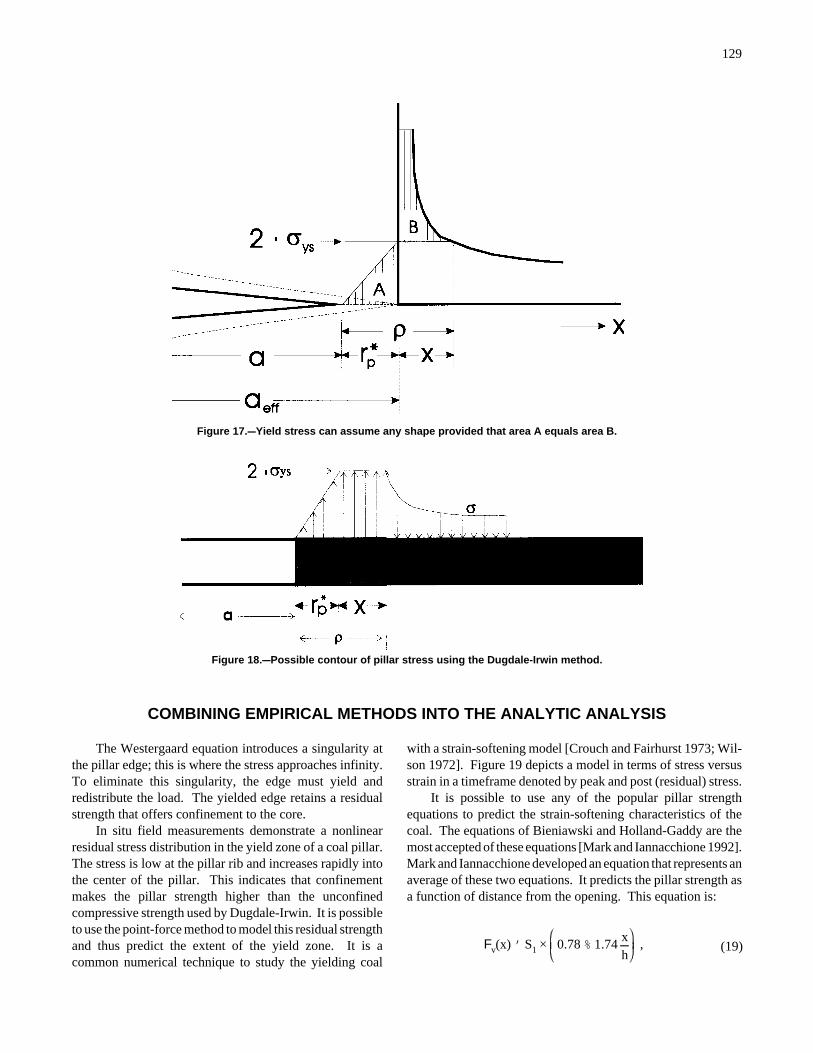
129
Fv(x) ' S1 × 0.78 % 1.74 xh
, (19)
Figure 17.CCYield stress can assume any shape provided that area A equals area B.
Figure 18.CCPossible contour of pillar stress using the Dugdale-Irwin method.
COMBINING EMPIRICAL METHODS INTO THE ANALYTIC ANALYSIS
The Westergaard equation introduces a singularity atthe pillar edge; this is where the stress approaches infinity.To eliminate this singularity, the edge must yield andredistribute the load. The yielded edge retains a residualstrength that offers confinement to the core.
In situ field measurements demonstrate a nonlinearresidual stress distribution in the yield zone of a coal pillar.The stress is low at the pillar rib and increases rapidly intothe center of the pillar. This indicates that confinementmakes the pillar strength higher than the unconfinedcompressive strength used by Dugdale-Irwin. It is possibleto use the point-force method to model this residual strengthand thus predict the extent of the yield zone. It is acommon numerical technique to study the yielding coal
with a strain-softening model [Crouch and Fairhurst 1973; Wil-son 1972]. Figure 19 depicts a model in terms of stress versusstrain in a timeframe denoted by peak and post (residual) stress.
It is possible to use any of the popular pillar strengthequations to predict the strain-softening characteristics of thecoal. The equations of Bieniawski and Holland-Gaddy are themost accepted of these equations [Mark and Iannacchione 1992].Mark and Iannacchione developed an equation that represents anaverage of these two equations. It predicts the pillar strength asa function of distance from the opening. This equation is:
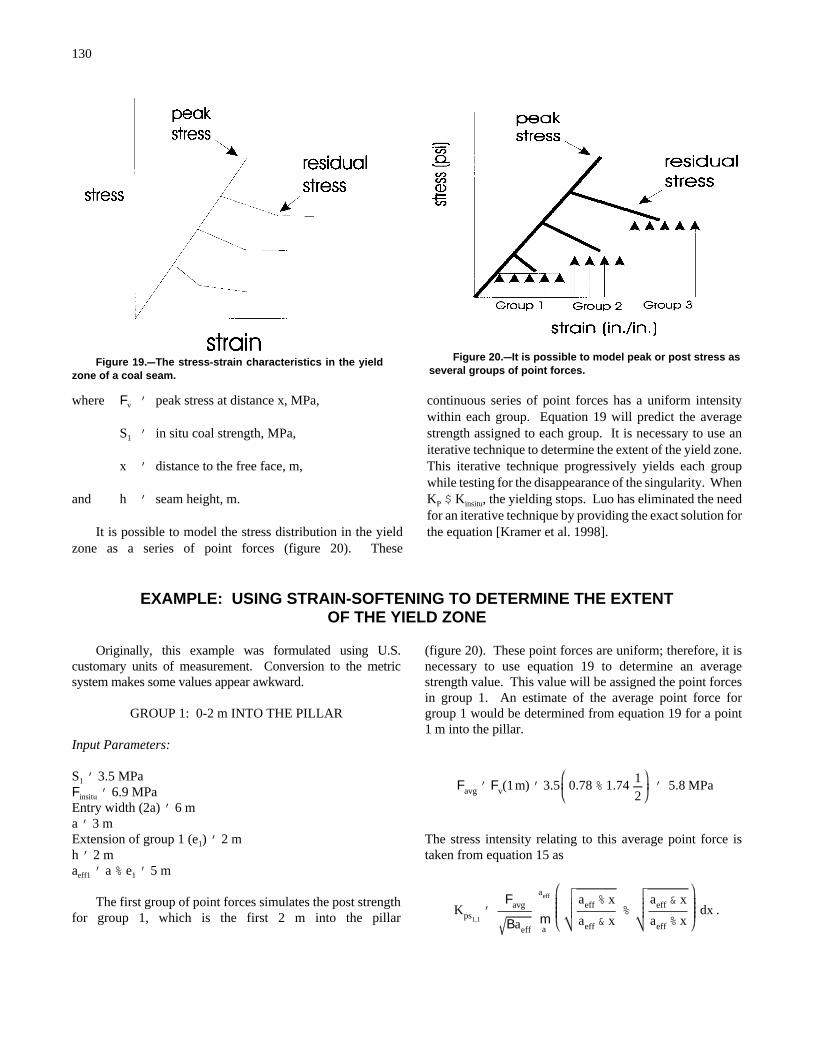
130
Favg ' Fv(1m) ' 3.5 0.78 % 1.74 12
' 5.8 MPa
Kps1,1'
Favg
Baeffmaeff
a
aeff % x
aeff & x%
aeff & x
aeff % xdx .
Figure 19.CCThe stress-strain characteristics in the yieldzone of a coal seam.
Figure 20.CCIt is possible to model peak or post stress asseveral groups of point forces.
where Fv ' peak stress at distance x, MPa,
S1 ' in situ coal strength, MPa,
x ' distance to the free face, m,
and h ' seam height, m.
It is possible to model the stress distribution in the yieldzone as a series of point forces (figure 20). These
continuous series of point forces has a uniform intensitywithin each group. Equation 19 will predict the averagestrength assigned to each group. It is necessary to use aniterative technique to determine the extent of the yield zone.This iterative technique progressively yields each groupwhile testing for the disappearance of the singularity. WhenKP $ Kinsitu, the yielding stops. Luo has eliminated the needfor an iterative technique by providing the exact solution forthe equation [Kramer et al. 1998].
EXAMPLE: USING STRAIN-SOFTENING TO DETERMINE THE EXTENTOF THE YIELD ZONE
Originally, this example was formulated using U.S.customary units of measurement. Conversion to the metricsystem makes some values appear awkward.
GROUP 1: 0-2 m INTO THE PILLAR
Input Parameters:
S1 ' 3.5 MPaFinsitu ' 6.9 MPaEntry width (2a) ' 6 ma ' 3 mExtension of group 1 (e1) ' 2 mh ' 2 maeff1 ' a % e1 ' 5 m
The first group of point forces simulates the post strengthfor group 1, which is the first 2 m into the pillar
(figure 20). These point forces are uniform; therefore, it isnecessary to use equation 19 to determine an averagestrength value. This value will be assigned the point forcesin group 1. An estimate of the average point force forgroup 1 would be determined from equation 19 for a point1 m into the pillar.
The stress intensity relating to this average point force istaken from equation 15 as
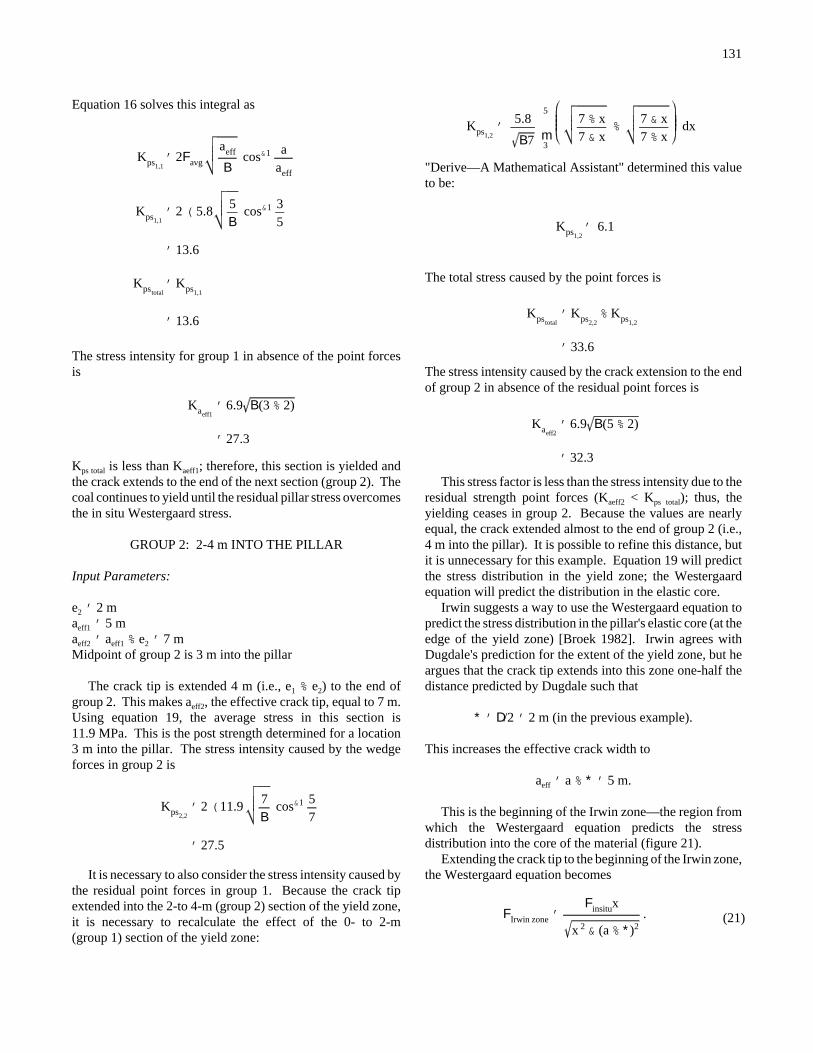
131
Kps1,1' 2Favg
aeff
Bcos&1 a
aeff
Kps1,1' 2 ( 5.8 5
Bcos&1 3
5
' 13.6
Kpstotal' Kps1,1
' 13.6
Kaeff1' 6.9 B(3 % 2)
' 27.3
Kps2,2' 2 (11.9 7
Bcos&1 5
7
' 27.5
Kps1,2'
5.8
B7 m5
3
7 % x7 & x
%7 & x7 % x
dx
Kps1,2' 6.1
Kpstotal' Kps2,2
% Kps1,2
' 33.6
Kaeff2' 6.9 B(5 % 2)
' 32.3
FIrwin zone 'Finsitux
x 2 & (a % *)2. (21)
Equation 16 solves this integral as
The stress intensity for group 1 in absence of the point forcesis
Kps total is less than Kaeff1; therefore, this section is yielded andthe crack extends to the end of the next section (group 2). Thecoal continues to yield until the residual pillar stress overcomesthe in situ Westergaard stress.
GROUP 2: 2-4 m INTO THE PILLAR
Input Parameters:
e2 ' 2 maeff1 ' 5 maeff2 ' aeff1 % e2 ' 7 mMidpoint of group 2 is 3 m into the pillar
The crack tip is extended 4 m (i.e., e1 % e2) to the end ofgroup 2. This makes aeff2, the effective crack tip, equal to 7 m.Using equation 19, the average stress in this section is11.9 MPa. This is the post strength determined for a location3 m into the pillar. The stress intensity caused by the wedgeforces in group 2 is
It is necessary to also consider the stress intensity caused bythe residual point forces in group 1. Because the crack tipextended into the 2-to 4-m (group 2) section of the yield zone,it is necessary to recalculate the effect of the 0- to 2-m(group 1) section of the yield zone:
"Derive—A Mathematical Assistant" determined this valueto be:
The total stress caused by the point forces is
The stress intensity caused by the crack extension to the endof group 2 in absence of the residual point forces is
This stress factor is less than the stress intensity due to theresidual strength point forces (Kaeff2 < Kps total); thus, theyielding ceases in group 2. Because the values are nearlyequal, the crack extended almost to the end of group 2 (i.e.,4 m into the pillar). It is possible to refine this distance, butit is unnecessary for this example. Equation 19 will predictthe stress distribution in the yield zone; the Westergaardequation will predict the distribution in the elastic core.
Irwin suggests a way to use the Westergaard equation topredict the stress distribution in the pillar's elastic core (at theedge of the yield zone) [Broek 1982]. Irwin agrees withDugdale's prediction for the extent of the yield zone, but heargues that the crack tip extends into this zone one-half thedistance predicted by Dugdale such that
* ' D/2 ' 2 m (in the previous example).
This increases the effective crack width to
aeff ' a % * ' 5 m.
This is the beginning of the Irwin zone—the region fromwhich the Westergaard equation predicts the stressdistribution into the core of the material (figure 21).
Extending the crack tip to the beginning of the Irwin zone,the Westergaard equation becomes
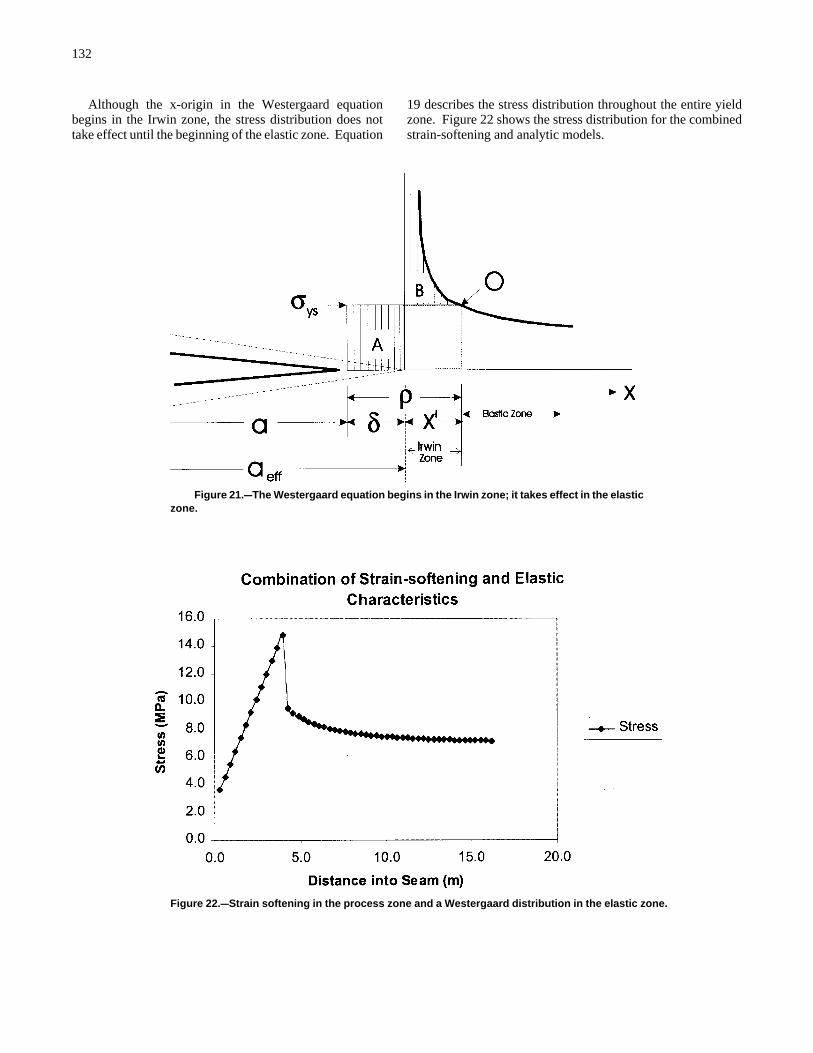
132
Figure 21.CCThe Westergaard equation begins in the Irwin zone; it takes effect in the elasticzone.
Figure 22.CCStrain softening in the process zone and a Westergaard distribution in the elastic zone.
Although the x-origin in the Westergaard equationbegins in the Irwin zone, the stress distribution does nottake effect until the beginning of the elastic zone. Equation
19 describes the stress distribution throughout the entire yieldzone. Figure 22 shows the stress distribution for the combinedstrain-softening and analytic models.
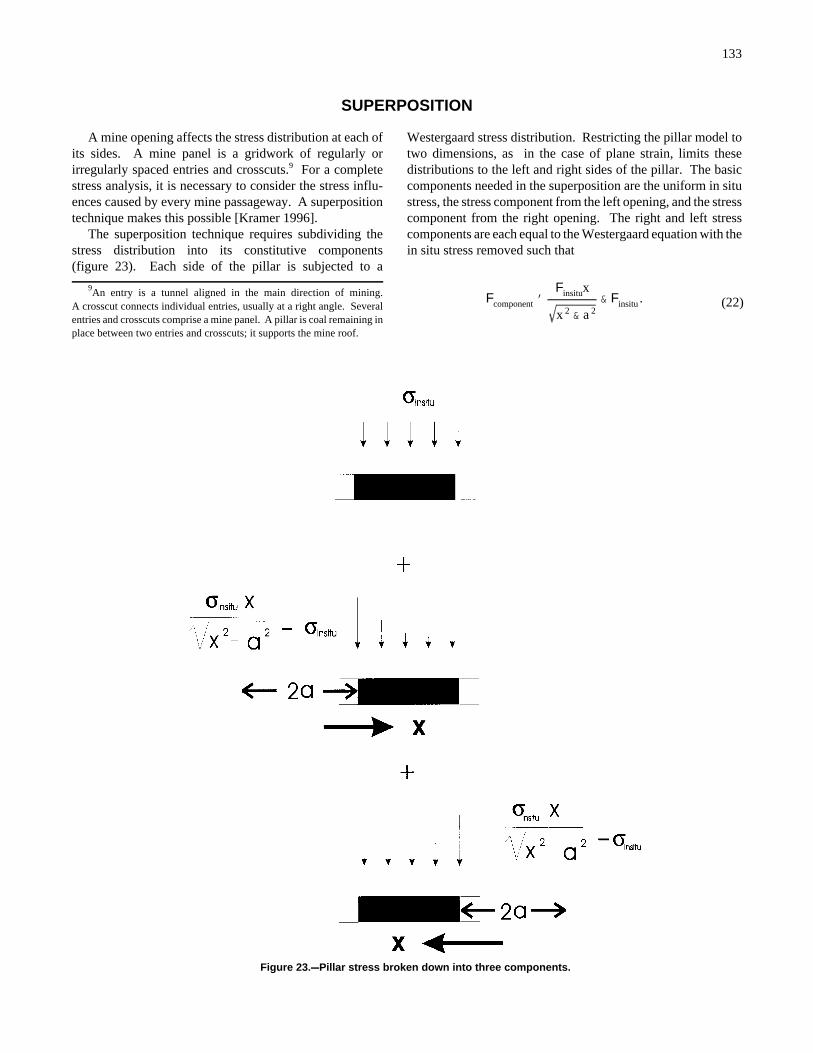
133
Fcomponent 'Finsitux
x 2 & a 2& Finsitu . (22)
Figure 23.CCPillar stress broken down into three components.
SUPERPOSITION
A mine opening affects the stress distribution at each ofits sides. A mine panel is a gridwork of regularly orirregularly spaced entries and crosscuts.9 For a completestress analysis, it is necessary to consider the stress influ-ences caused by every mine passageway. A superpositiontechnique makes this possible [Kramer 1996].
The superposition technique requires subdividing thestress distribution into its constitutive components(figure 23). Each side of the pillar is subjected to a
9An entry is a tunnel aligned in the main direction of mining.A crosscut connects individual entries, usually at a right angle. Severalentries and crosscuts comprise a mine panel. A pillar is coal remaining inplace between two entries and crosscuts; it supports the mine roof.
Westergaard stress distribution. Restricting the pillar model totwo dimensions, as in the case of plane strain, limits thesedistributions to the left and right sides of the pillar. The basiccomponents needed in the superposition are the uniform in situstress, the stress component from the left opening, and the stresscomponent from the right opening. The right and left stresscomponents are each equal to the Westergaard equation with thein situ stress removed such that
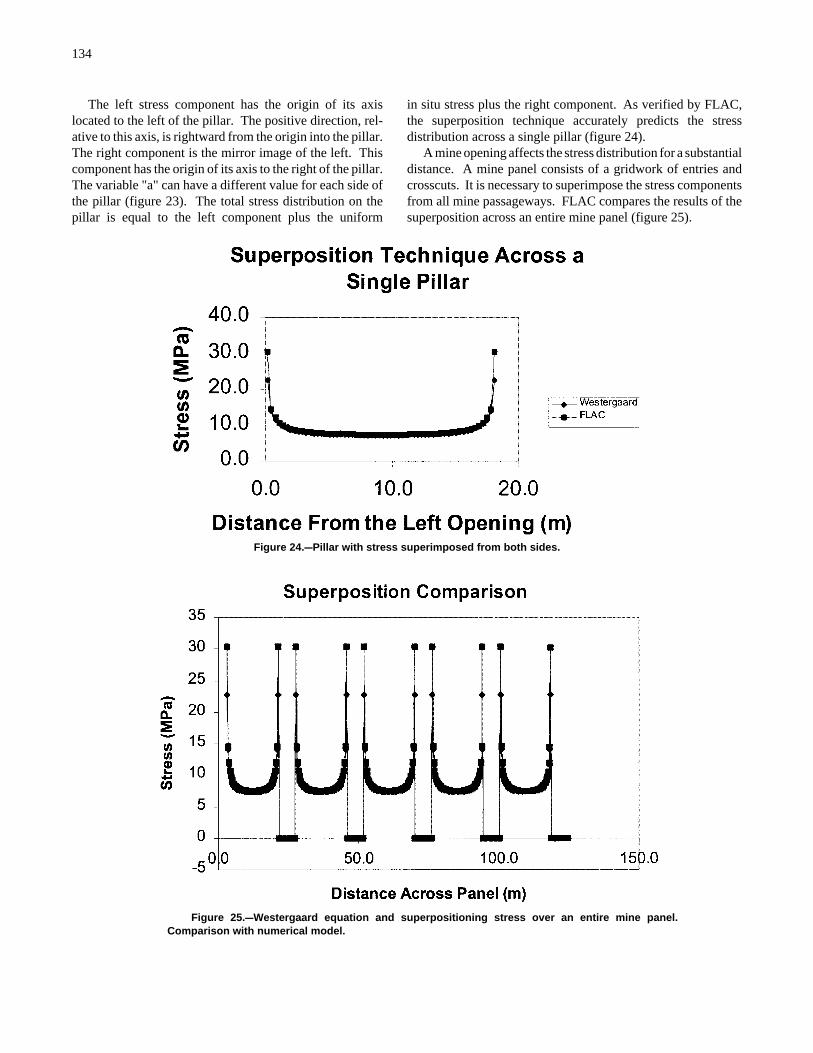
134
Figure 24.CCPillar with stress superimposed from both sides.
Figure 25.CCWestergaard equation and superpositioning stress over an entire mine panel.Comparison with numerical model.
The left stress component has the origin of its axislocated to the left of the pillar. The positive direction, rel-ative to this axis, is rightward from the origin into the pillar.The right component is the mirror image of the left. Thiscomponent has the origin of its axis to the right of the pillar.The variable "a" can have a different value for each side ofthe pillar (figure 23). The total stress distribution on thepillar is equal to the left component plus the uniform
in situ stress plus the right component. As verified by FLAC,the superposition technique accurately predicts the stressdistribution across a single pillar (figure 24).
A mine opening affects the stress distribution for a substantialdistance. A mine panel consists of a gridwork of entries andcrosscuts. It is necessary to superimpose the stress componentsfrom all mine passageways. FLAC compares the results of thesuperposition across an entire mine panel (figure 25).
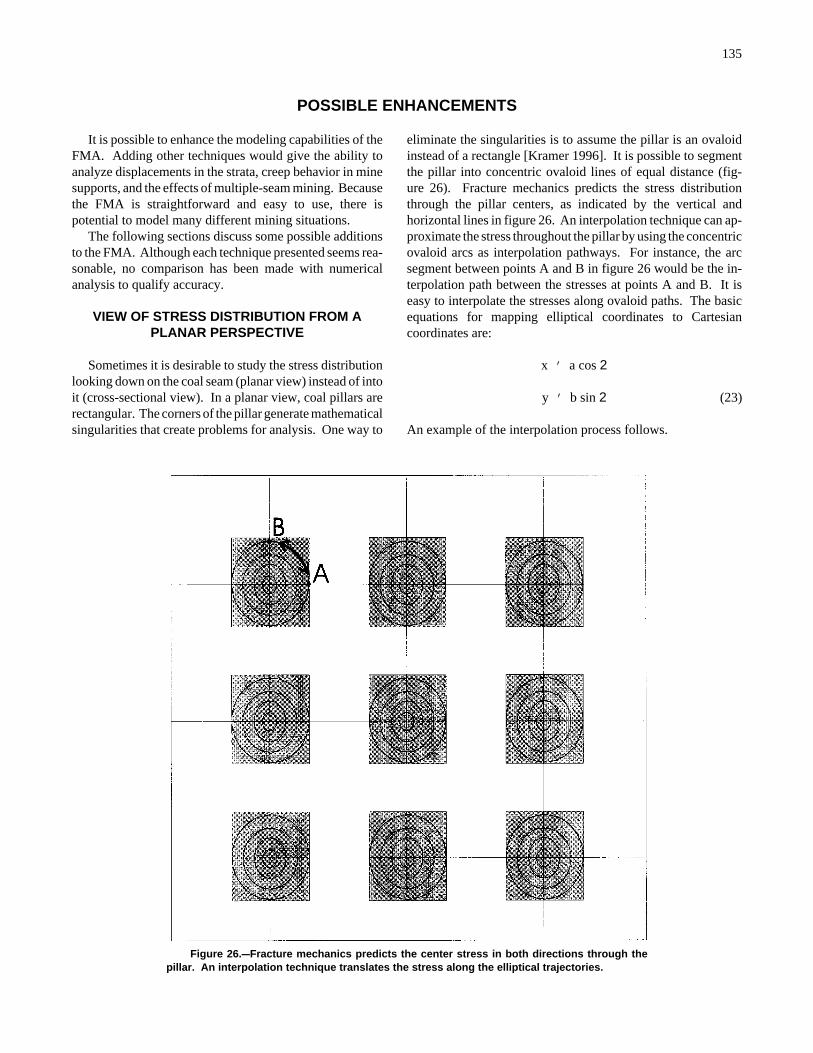
135
Figure 26.CCFracture mechanics predicts the center stress in both directions through thepillar. An interpolation technique translates the stress along the elliptical trajectories.
POSSIBLE ENHANCEMENTS
It is possible to enhance the modeling capabilities of theFMA. Adding other techniques would give the ability toanalyze displacements in the strata, creep behavior in minesupports, and the effects of multiple-seam mining. Becausethe FMA is straightforward and easy to use, there ispotential to model many different mining situations.
The following sections discuss some possible additionsto the FMA. Although each technique presented seems rea-sonable, no comparison has been made with numericalanalysis to qualify accuracy.
VIEW OF STRESS DISTRIBUTION FROM APLANAR PERSPECTIVE
Sometimes it is desirable to study the stress distributionlooking down on the coal seam (planar view) instead of intoit (cross-sectional view). In a planar view, coal pillars arerectangular. The corners of the pillar generate mathematicalsingularities that create problems for analysis. One way to
eliminate the singularities is to assume the pillar is an ovaloidinstead of a rectangle [Kramer 1996]. It is possible to segmentthe pillar into concentric ovaloid lines of equal distance (fig-ure 26). Fracture mechanics predicts the stress distributionthrough the pillar centers, as indicated by the vertical andhorizontal lines in figure 26. An interpolation technique can ap-proximate the stress throughout the pillar by using the concentricovaloid arcs as interpolation pathways. For instance, the arcsegment between points A and B in figure 26 would be the in-terpolation path between the stresses at points A and B. It iseasy to interpolate the stresses along ovaloid paths. The basicequations for mapping elliptical coordinates to Cartesiancoordinates are:
x ' a cos 2
y ' b sin 2 (23)
An example of the interpolation process follows.

136
905
' 18° (24)
1,500 psi & 1,000 psi5 intervals
' 100 psi per interval (25)
COD ' 2v '4FE
a 2 & x 2(27)
CODmax ' 2v '4FaE
. (28)
Figure 27.CCRelationship between elliptical and rec-tilinear coordinates.
Figure 28.CCStresses distributed along interpo-lation arc.
Figure 29.CCThe crack opening displacement (COD) methodconsiders the displacement of the entire surface of a crack.
EXAMPLE OF INTERPOLATION
Considering the elliptical path shown in quadrant I offigure 27, interpolate the stresses along path A-B in the outerarc of quadrant I. For this example, assign the followingproperties:
FA ' 1,000 psi
FB ' 1,500 psi
a ' 20
b ' 10
Divide 2 into five equal angles:
Determine the stress interpolation interval for each 18° arc:
Figure 28 illustrates the stress distribution along this arc.Equation 24 relates any point on the A and B axis to any pointon the ovaloid (figure 27). Therefore, it is possible toapproximate the stress distribution throughout the entire pillar.
VISCOELASTICITY
Sih [1966] and Paris and Sih [1965] discuss crack behaviorin viscoelastic (time-dependent) material. For viscoelasticmaterial, the crack-tip stress field is the same, only the stressintensity factors KI are functions of time, such that
KI ' KI(t) (26)
This function shows promise for future applications using theFMA. For instance, it could be valuable for studying the be-havior of salt.
DISPLACEMENTS
Fracture mechanics may also predict the displacement/strain in a mine environment. A common method to predictdisplacement is referred to as the "crack openingdisplacement" (COD) [Broek 1982]. The COD method takesinto account the total displacement of the crack surface(figure 29). In mining, the COD predicts the combineddisplacement of the roof and floor of an opening, such that
and at the center of the opening:
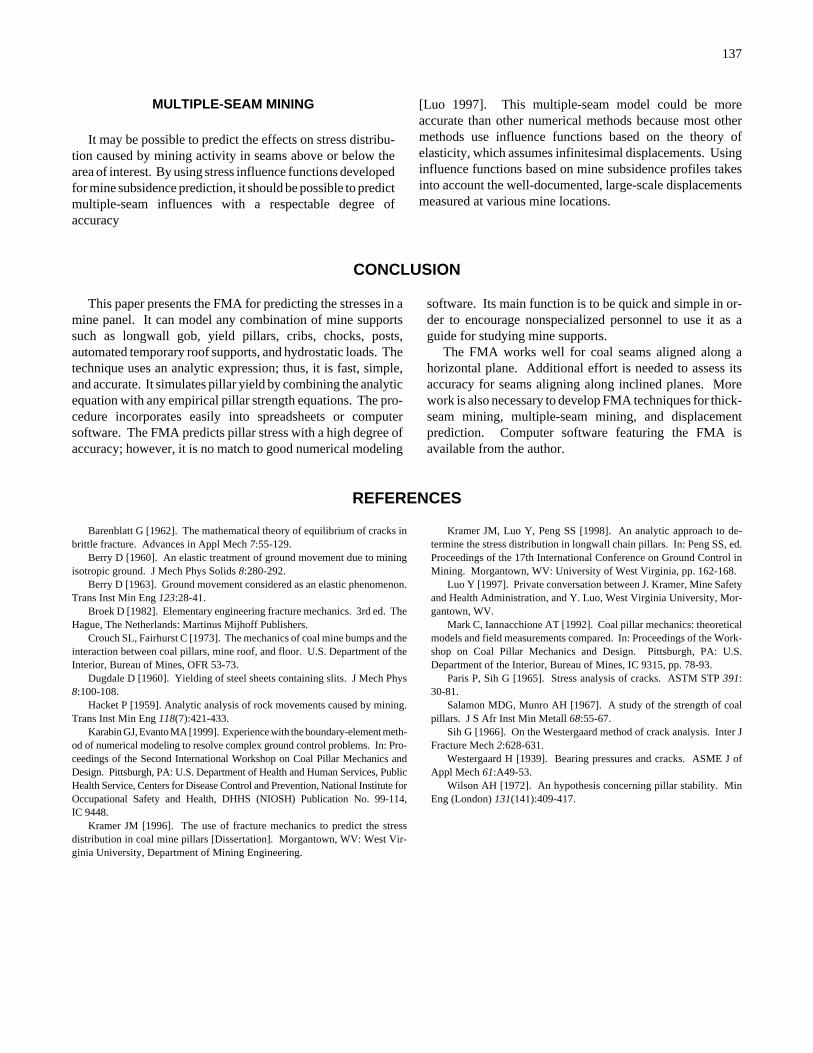
137
MULTIPLE-SEAM MINING
It may be possible to predict the effects on stress distribu-tion caused by mining activity in seams above or below thearea of interest. By using stress influence functions developedfor mine subsidence prediction, it should be possible to predictmultiple-seam influences with a respectable degree ofaccuracy
[Luo 1997]. This multiple-seam model could be moreaccurate than other numerical methods because most othermethods use influence functions based on the theory ofelasticity, which assumes infinitesimal displacements. Usinginfluence functions based on mine subsidence profiles takesinto account the well-documented, large-scale displacementsmeasured at various mine locations.
CONCLUSION
This paper presents the FMA for predicting the stresses in amine panel. It can model any combination of mine supportssuch as longwall gob, yield pillars, cribs, chocks, posts,automated temporary roof supports, and hydrostatic loads. Thetechnique uses an analytic expression; thus, it is fast, simple,and accurate. It simulates pillar yield by combining the analyticequation with any empirical pillar strength equations. The pro-cedure incorporates easily into spreadsheets or computersoftware. The FMA predicts pillar stress with a high degree ofaccuracy; however, it is no match to good numerical modeling
software. Its main function is to be quick and simple in or-der to encourage nonspecialized personnel to use it as aguide for studying mine supports.
The FMA works well for coal seams aligned along ahorizontal plane. Additional effort is needed to assess itsaccuracy for seams aligning along inclined planes. Morework is also necessary to develop FMA techniques for thick-seam mining, multiple-seam mining, and displacementprediction. Computer software featuring the FMA isavailable from the author.
REFERENCES
Barenblatt G [1962]. The mathematical theory of equilibrium of cracks inbrittle fracture. Advances in Appl Mech 7:55-129.
Berry D [1960]. An elastic treatment of ground movement due to miningisotropic ground. J Mech Phys Solids 8:280-292.
Berry D [1963]. Ground movement considered as an elastic phenomenon.Trans Inst Min Eng 123:28-41.
Broek D [1982]. Elementary engineering fracture mechanics. 3rd ed. TheHague, The Netherlands: Martinus Mijhoff Publishers.
Crouch SL, Fairhurst C [1973]. The mechanics of coal mine bumps and theinteraction between coal pillars, mine roof, and floor. U.S. Department of theInterior, Bureau of Mines, OFR 53-73.
Dugdale D [1960]. Yielding of steel sheets containing slits. J Mech Phys8:100-108.
Hacket P [1959]. Analytic analysis of rock movements caused by mining.Trans Inst Min Eng 118(7):421-433.
Karabin GJ, Evanto MA [1999]. Experience with the boundary-element meth-od of numerical modeling to resolve complex ground control problems. In: Pro-ceedings of the Second International Workshop on Coal Pillar Mechanics andDesign. Pittsburgh, PA: U.S. Department of Health and Human Services, PublicHealth Service, Centers for Disease Control and Prevention, National Institute forOccupational Safety and Health, DHHS (NIOSH) Publication No. 99-114,IC 9448.
Kramer JM [1996]. The use of fracture mechanics to predict the stressdistribution in coal mine pillars [Dissertation]. Morgantown, WV: West Vir-ginia University, Department of Mining Engineering.
Kramer JM, Luo Y, Peng SS [1998]. An analytic approach to de-termine the stress distribution in longwall chain pillars. In: Peng SS, ed.Proceedings of the 17th International Conference on Ground Control inMining. Morgantown, WV: University of West Virginia, pp. 162-168.
Luo Y [1997]. Private conversation between J. Kramer, Mine Safetyand Health Administration, and Y. Luo, West Virginia University, Mor-gantown, WV.
Mark C, Iannacchione AT [1992]. Coal pillar mechanics: theoreticalmodels and field measurements compared. In: Proceedings of the Work-shop on Coal Pillar Mechanics and Design. Pittsburgh, PA: U.S.Department of the Interior, Bureau of Mines, IC 9315, pp. 78-93.
Paris P, Sih G [1965]. Stress analysis of cracks. ASTM STP 391:30-81.
Salamon MDG, Munro AH [1967]. A study of the strength of coalpillars. J S Afr Inst Min Metall 68:55-67.
Sih G [1966]. On the Westergaard method of crack analysis. Inter JFracture Mech 2:628-631.
Westergaard H [1939]. Bearing pressures and cracks. ASME J ofAppl Mech 61:A49-53.
Wilson AH [1972]. An hypothesis concerning pillar stability. MinEng (London) 131(141):409-417.
139
A HYBRID STATISTICAL-ANALYTICAL METHOD FOR ASSESSINGVIOLENT FAILURE IN U.S. COAL MINES
By Hamid Maleki, Ph.D.,1 Eric G. Zahl,2 and John P. Dunford3
ABSTRACT
Coal bumps are influenced by geologic conditions, the geometric design of coal mine excavations, and thesequence and rate of extraction. Researchers from private industry and government agencies around the worldhave studied mechanisms of violent failure and have identified individual factors that contribute to coal bumps.To develop predictive tools for assessing coal bump potential, the authors initiated a comprehensive studyusing information from 25 case studies undertaken in U.S. mines. Multiple linear regression and numericalmodeling analyses of geological and mining conditions were used to identify the most significant factorscontributing to stress bumps in coal mines.
Twenty-five factors were considered initially, including mechanical properties of strata, stress fields, faceand pillar factors of safety, joint spacings, mining methods, and stress gradients. In situ strength was estimatedin 12 coal seams where uniaxial compressive strength exceeded 2,000 psi. Allowances were made for favor-able local yielding characteristics of mine roof and floor in reducing damage severity. Pillar and face factorsof safety were calculated using displacement-discontinuity methods for specific geometries.
This work identified the most important variables contributing to coal bumps. These are (1) mechanicalproperties of strata, including local yield characteristics of a mine roof and floor, (2) gate pillar factors ofsafety, (3) roof beam thickness, joint spacing, and stiffness characteristics, which influence released energy,(4) stress gradients associated with the approach of mining to areas of higher stress concentrations, and (5) themining method. By combining the strength of both analytical and statistical methods, new capabilities weredeveloped for predicting coal bump potential and for building confidence intervals on expected damage.
1Principal, Maleki Technologies, Inc., Spokane, WA.2Civil engineer, Spokane Research Laboratory, National Institute for Occupational Safety and Health, Spokane, WA.3Mining engineer, Spokane Research Laboratory, National Institute for Occupational Safety and Health, Spokane, WA.
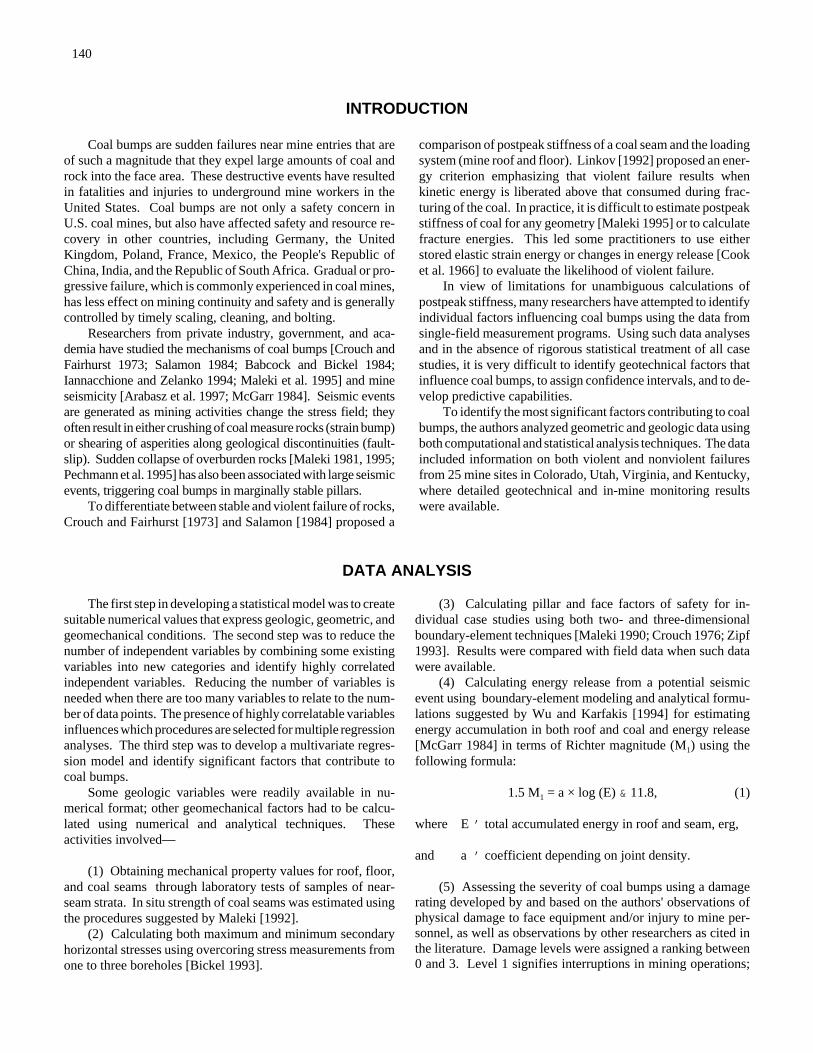
140
INTRODUCTION
Coal bumps are sudden failures near mine entries that areof such a magnitude that they expel large amounts of coal androck into the face area. These destructive events have resultedin fatalities and injuries to underground mine workers in theUnited States. Coal bumps are not only a safety concern inU.S. coal mines, but also have affected safety and resource re-covery in other countries, including Germany, the UnitedKingdom, Poland, France, Mexico, the People's Republic ofChina, India, and the Republic of South Africa. Gradual or pro-gressive failure, which is commonly experienced in coal mines,has less effect on mining continuity and safety and is generallycontrolled by timely scaling, cleaning, and bolting.
Researchers from private industry, government, and aca-demia have studied the mechanisms of coal bumps [Crouch andFairhurst 1973; Salamon 1984; Babcock and Bickel 1984;Iannacchione and Zelanko 1994; Maleki et al. 1995] and mineseismicity [Arabasz et al. 1997; McGarr 1984]. Seismic eventsare generated as mining activities change the stress field; theyoften result in either crushing of coal measure rocks (strain bump)or shearing of asperities along geological discontinuities (fault-slip). Sudden collapse of overburden rocks [Maleki 1981, 1995;Pechmann et al. 1995] has also been associated with large seismicevents, triggering coal bumps in marginally stable pillars.
To differentiate between stable and violent failure of rocks,Crouch and Fairhurst [1973] and Salamon [1984] proposed a
comparison of postpeak stiffness of a coal seam and the loadingsystem (mine roof and floor). Linkov [1992] proposed an ener-gy criterion emphasizing that violent failure results whenkinetic energy is liberated above that consumed during frac-turing of the coal. In practice, it is difficult to estimate postpeakstiffness of coal for any geometry [Maleki 1995] or to calculatefracture energies. This led some practitioners to use eitherstored elastic strain energy or changes in energy release [Cooket al. 1966] to evaluate the likelihood of violent failure.
In view of limitations for unambiguous calculations ofpostpeak stiffness, many researchers have attempted to identifyindividual factors influencing coal bumps using the data fromsingle-field measurement programs. Using such data analysesand in the absence of rigorous statistical treatment of all casestudies, it is very difficult to identify geotechnical factors thatinfluence coal bumps, to assign confidence intervals, and to de-velop predictive capabilities.
To identify the most significant factors contributing to coalbumps, the authors analyzed geometric and geologic data usingboth computational and statistical analysis techniques. The dataincluded information on both violent and nonviolent failuresfrom 25 mine sites in Colorado, Utah, Virginia, and Kentucky,where detailed geotechnical and in-mine monitoring resultswere available.
DATA ANALYSIS
The first step in developing a statistical model was to createsuitable numerical values that express geologic, geometric, andgeomechanical conditions. The second step was to reduce thenumber of independent variables by combining some existingvariables into new categories and identify highly correlatedindependent variables. Reducing the number of variables isneeded when there are too many variables to relate to the num-ber of data points. The presence of highly correlatable variablesinfluences which procedures are selected for multiple regressionanalyses. The third step was to develop a multivariate regres-sion model and identify significant factors that contribute tocoal bumps.
Some geologic variables were readily available in nu-merical format; other geomechanical factors had to be calcu-lated using numerical and analytical techniques. Theseactivities involved—
(1) Obtaining mechanical property values for roof, floor,and coal seams through laboratory tests of samples of near-seam strata. In situ strength of coal seams was estimated usingthe procedures suggested by Maleki [1992].
(2) Calculating both maximum and minimum secondaryhorizontal stresses using overcoring stress measurements fromone to three boreholes [Bickel 1993].
(3) Calculating pillar and face factors of safety for in-dividual case studies using both two- and three-dimensionalboundary-element techniques [Maleki 1990; Crouch 1976; Zipf1993]. Results were compared with field data when such datawere available.
(4) Calculating energy release from a potential seismicevent using boundary-element modeling and analytical formu-lations suggested by Wu and Karfakis [1994] for estimatingenergy accumulation in both roof and coal and energy release[McGarr 1984] in terms of Richter magnitude (M1) using thefollowing formula:
1.5 M1 = a × log (E) & 11.8, (1)
where E ' total accumulated energy in roof and seam, erg,
and a ' coefficient depending on joint density.
(5) Assessing the severity of coal bumps using a damagerating developed by and based on the authors' observations ofphysical damage to face equipment and/or injury to mine per-sonnel, as well as observations by other researchers as cited inthe literature. Damage levels were assigned a ranking between0 and 3. Level 1 signifies interruptions in mining operations;
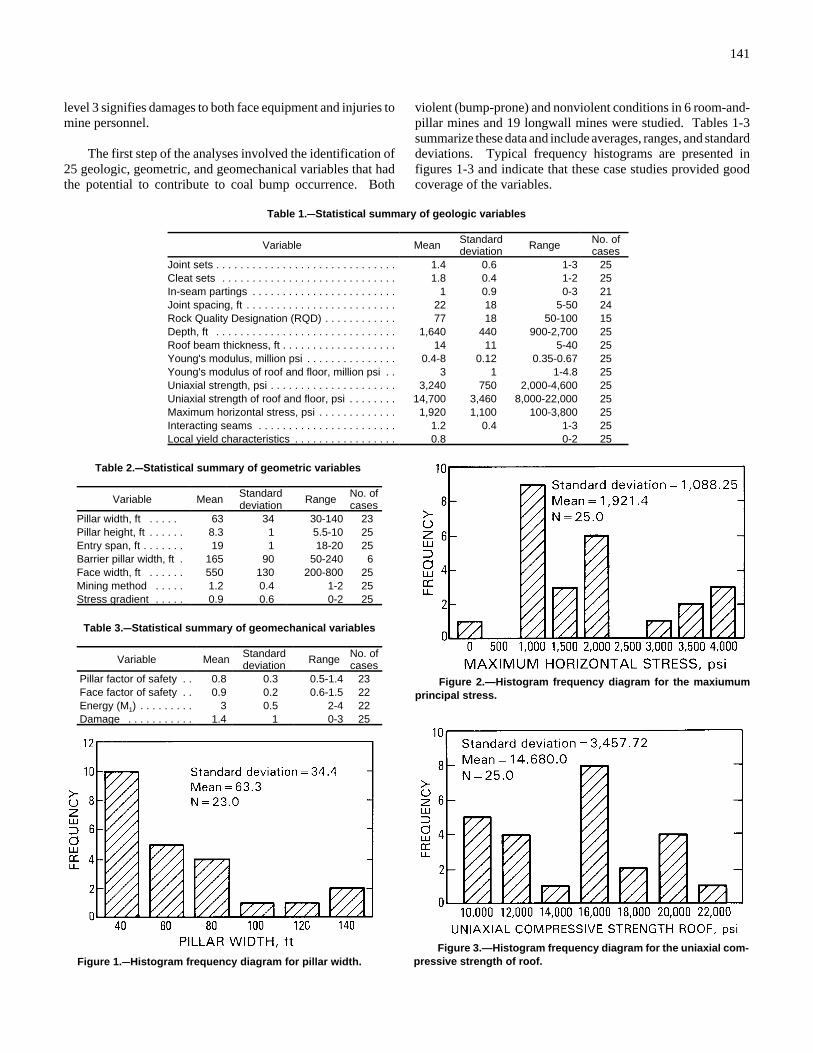
141
Figure 1.CCHistogram frequency diagram for pillar width.Figure 3.—Histogram frequency diagram for the uniaxial com-
pressive strength of roof.
Figure 2.—Histogram frequency diagram for the maxiumumprincipal stress.
level 3 signifies damages to both face equipment and injuries tomine personnel.
The first step of the analyses involved the identification of25 geologic, geometric, and geomechanical variables that hadthe potential to contribute to coal bump occurrence. Both
violent (bump-prone) and nonviolent conditions in 6 room-and-pillar mines and 19 longwall mines were studied. Tables 1-3summarize these data and include averages, ranges, and standarddeviations. Typical frequency histograms are presented infigures 1-3 and indicate that these case studies provided goodcoverage of the variables.
Table 1.CCStatistical summary of geologic variables
Variable Mean Standarddeviation Range No. of
casesJoint sets . . . . . . . . . . . . . . . . . . . . . . . . . . . . . . 1.4 0.6 1-3 25Cleat sets . . . . . . . . . . . . . . . . . . . . . . . . . . . . . 1.8 0.4 1-2 25In-seam partings . . . . . . . . . . . . . . . . . . . . . . . . 1 0.9 0-3 21Joint spacing, ft . . . . . . . . . . . . . . . . . . . . . . . . . 22 18 5-50 24Rock Quality Designation (RQD) . . . . . . . . . . . . 77 18 50-100 15Depth, ft . . . . . . . . . . . . . . . . . . . . . . . . . . . . . . 1,640 440 900-2,700 25Roof beam thickness, ft . . . . . . . . . . . . . . . . . . . 14 11 5-40 25Young's modulus, million psi . . . . . . . . . . . . . . . 0.4-8 0.12 0.35-0.67 25Young's modulus of roof and floor, million psi . . 3 1 1-4.8 25Uniaxial strength, psi . . . . . . . . . . . . . . . . . . . . . 3,240 750 2,000-4,600 25Uniaxial strength of roof and floor, psi . . . . . . . . 14,700 3,460 8,000-22,000 25Maximum horizontal stress, psi . . . . . . . . . . . . . 1,920 1,100 100-3,800 25Interacting seams . . . . . . . . . . . . . . . . . . . . . . . 1.2 0.4 1-3 25Local yield characteristics . . . . . . . . . . . . . . . . . 0.8 0-2 25
Table 2.CCStatistical summary of geometric variables
Variable Mean Standard deviation Range No. of
casesPillar width, ft . . . . . 63 34 30-140 23Pillar height, ft . . . . . . 8.3 1 5.5-10 25Entry span, ft . . . . . . . 19 1 18-20 25Barrier pillar width, ft . 165 90 50-240 6Face width, ft . . . . . . 550 130 200-800 25Mining method . . . . . 1.2 0.4 1-2 25Stress gradient . . . . . 0.9 0.6 0-2 25
Table 3.CCStatistical summary of geomechanical variables
Variable Mean Standarddeviation Range No. of
casesPillar factor of safety . . 0.8 0.3 0.5-1.4 23Face factor of safety . . 0.9 0.2 0.6-1.5 22Energy (M1) . . . . . . . . . 3 0.5 2-4 22Damage . . . . . . . . . . . 1.4 1 0-3 25
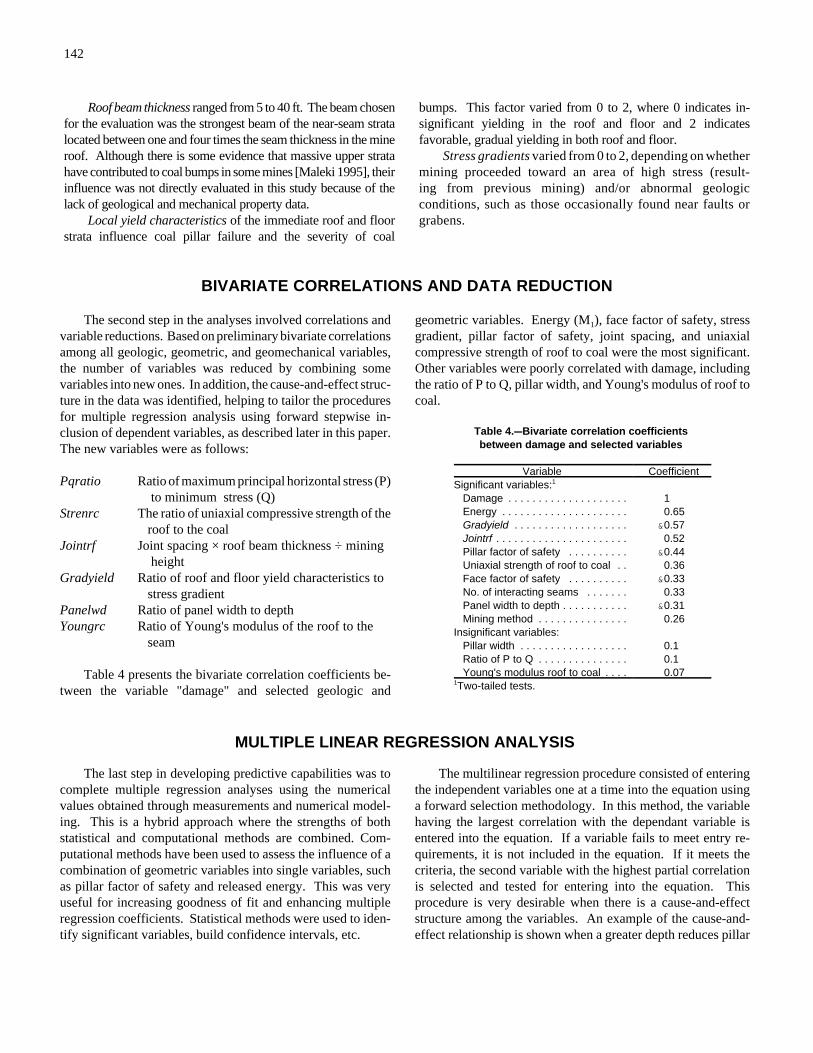
142
Roof beam thickness ranged from 5 to 40 ft. The beam chosenfor the evaluation was the strongest beam of the near-seam stratalocated between one and four times the seam thickness in the mineroof. Although there is some evidence that massive upper stratahave contributed to coal bumps in some mines [Maleki 1995], theirinfluence was not directly evaluated in this study because of thelack of geological and mechanical property data.
Local yield characteristics of the immediate roof and floorstrata influence coal pillar failure and the severity of coal
bumps. This factor varied from 0 to 2, where 0 indicates in-significant yielding in the roof and floor and 2 indicatesfavorable, gradual yielding in both roof and floor.
Stress gradients varied from 0 to 2, depending on whethermining proceeded toward an area of high stress (result-ing from previous mining) and/or abnormal geologicconditions, such as those occasionally found near faults orgrabens.
BIVARIATE CORRELATIONS AND DATA REDUCTION
The second step in the analyses involved correlations andvariable reductions. Based on preliminary bivariate correlationsamong all geologic, geometric, and geomechanical variables,the number of variables was reduced by combining somevariables into new ones. In addition, the cause-and-effect struc-ture in the data was identified, helping to tailor the proceduresfor multiple regression analysis using forward stepwise in-clusion of dependent variables, as described later in this paper.The new variables were as follows:
Pqratio Ratio of maximum principal horizontal stress (P) to minimum stress (Q)
Strenrc The ratio of uniaxial compressive strength of the roof to the coal
Jointrf Joint spacing × roof beam thickness ÷ mining height
Gradyield Ratio of roof and floor yield characteristics to stress gradient
Panelwd Ratio of panel width to depthYoungrc Ratio of Young's modulus of the roof to the
seam
Table 4 presents the bivariate correlation coefficients be-tween the variable "damage" and selected geologic and
geometric variables. Energy (M1), face factor of safety, stressgradient, pillar factor of safety, joint spacing, and uniaxialcompressive strength of roof to coal were the most significant.Other variables were poorly correlated with damage, includingthe ratio of P to Q, pillar width, and Young's modulus of roof tocoal.
Table 4.CCBivariate correlation coefficientsbetween damage and selected variables
Variable CoefficientSignificant variables:1
Damage . . . . . . . . . . . . . . . . . . . . 1 Energy . . . . . . . . . . . . . . . . . . . . . 0.65 Gradyield . . . . . . . . . . . . . . . . . . . &0.57 Jointrf . . . . . . . . . . . . . . . . . . . . . . 0.52 Pillar factor of safety . . . . . . . . . . &0.44 Uniaxial strength of roof to coal . . 0.36 Face factor of safety . . . . . . . . . . &0.33 No. of interacting seams . . . . . . . 0.33 Panel width to depth . . . . . . . . . . . &0.31 Mining method . . . . . . . . . . . . . . . 0.26Insignificant variables: Pillar width . . . . . . . . . . . . . . . . . . 0.1 Ratio of P to Q . . . . . . . . . . . . . . . 0.1 Young's modulus roof to coal . . . . 0.071Two-tailed tests.
MULTIPLE LINEAR REGRESSION ANALYSIS
The last step in developing predictive capabilities was tocomplete multiple regression analyses using the numericalvalues obtained through measurements and numerical model-ing. This is a hybrid approach where the strengths of bothstatistical and computational methods are combined. Com-putational methods have been used to assess the influence of acombination of geometric variables into single variables, suchas pillar factor of safety and released energy. This was veryuseful for increasing goodness of fit and enhancing multipleregression coefficients. Statistical methods were used to iden-tify significant variables, build confidence intervals, etc.
The multilinear regression procedure consisted of enteringthe independent variables one at a time into the equation usinga forward selection methodology. In this method, the variablehaving the largest correlation with the dependant variable isentered into the equation. If a variable fails to meet entry re-quirements, it is not included in the equation. If it meets thecriteria, the second variable with the highest partial correlationis selected and tested for entering into the equation. Thisprocedure is very desirable when there is a cause-and-effectstructure among the variables. An example of the cause-and-effect relationship is shown when a greater depth reduces pillar
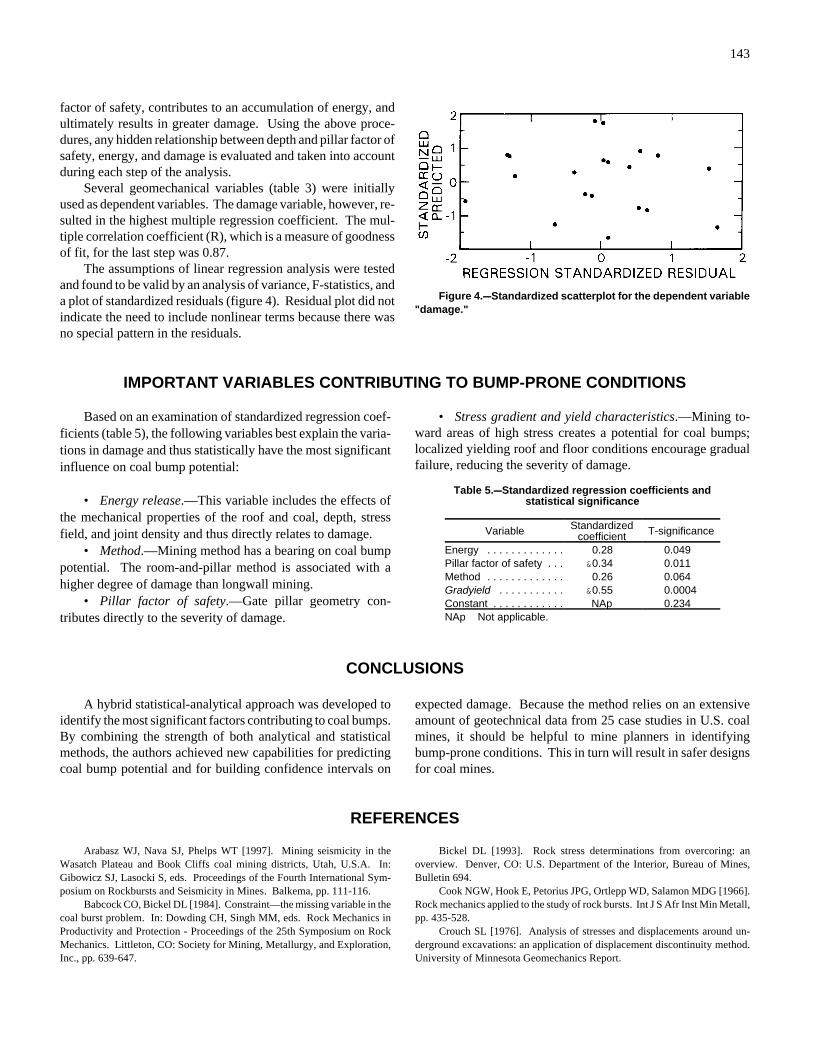
143
Figure 4.CCStandardized scatterplot for the dependent variable"damage."
factor of safety, contributes to an accumulation of energy, andultimately results in greater damage. Using the above proce-dures, any hidden relationship between depth and pillar factor ofsafety, energy, and damage is evaluated and taken into accountduring each step of the analysis.
Several geomechanical variables (table 3) were initiallyused as dependent variables. The damage variable, however, re-sulted in the highest multiple regression coefficient. The mul-tiple correlation coefficient (R), which is a measure of goodnessof fit, for the last step was 0.87.
The assumptions of linear regression analysis were testedand found to be valid by an analysis of variance, F-statistics, anda plot of standardized residuals (figure 4). Residual plot did notindicate the need to include nonlinear terms because there wasno special pattern in the residuals.
IMPORTANT VARIABLES CONTRIBUTING TO BUMP-PRONE CONDITIONS
Based on an examination of standardized regression coef-ficients (table 5), the following variables best explain the varia-tions in damage and thus statistically have the most significantinfluence on coal bump potential:
• Energy release.—This variable includes the effects ofthe mechanical properties of the roof and coal, depth, stressfield, and joint density and thus directly relates to damage.
• Method.—Mining method has a bearing on coal bumppotential. The room-and-pillar method is associated with ahigher degree of damage than longwall mining.
• Pillar factor of safety.—Gate pillar geometry con-tributes directly to the severity of damage.
• Stress gradient and yield characteristics.—Mining to-ward areas of high stress creates a potential for coal bumps;localized yielding roof and floor conditions encourage gradualfailure, reducing the severity of damage.
Table 5.CCStandardized regression coefficients andstatistical significance
Variable Standardizedcoefficient T-significance
Energy . . . . . . . . . . . . . 0.28 0.049Pillar factor of safety . . . &0.34 0.011Method . . . . . . . . . . . . . 0.26 0.064Gradyield . . . . . . . . . . . &0.55 0.0004Constant . . . . . . . . . . . . NAp 0.234NAp Not applicable.
CONCLUSIONS
A hybrid statistical-analytical approach was developed toidentify the most significant factors contributing to coal bumps.By combining the strength of both analytical and statisticalmethods, the authors achieved new capabilities for predictingcoal bump potential and for building confidence intervals on
expected damage. Because the method relies on an extensiveamount of geotechnical data from 25 case studies in U.S. coalmines, it should be helpful to mine planners in identifyingbump-prone conditions. This in turn will result in safer designsfor coal mines.
REFERENCES
Arabasz WJ, Nava SJ, Phelps WT [1997]. Mining seismicity in theWasatch Plateau and Book Cliffs coal mining districts, Utah, U.S.A. In:Gibowicz SJ, Lasocki S, eds. Proceedings of the Fourth International Sym-posium on Rockbursts and Seismicity in Mines. Balkema, pp. 111-116.
Babcock CO, Bickel DL [1984]. Constraint—the missing variable in thecoal burst problem. In: Dowding CH, Singh MM, eds. Rock Mechanics inProductivity and Protection - Proceedings of the 25th Symposium on RockMechanics. Littleton, CO: Society for Mining, Metallurgy, and Exploration,Inc., pp. 639-647.
Bickel DL [1993]. Rock stress determinations from overcoring: anoverview. Denver, CO: U.S. Department of the Interior, Bureau of Mines,Bulletin 694.
Cook NGW, Hook E, Petorius JPG, Ortlepp WD, Salamon MDG [1966].Rock mechanics applied to the study of rock bursts. Int J S Afr Inst Min Metall,pp. 435-528.
Crouch SL [1976]. Analysis of stresses and displacements around un-derground excavations: an application of displacement discontinuity method.University of Minnesota Geomechanics Report.
144
Crouch SL, Fairhurst C [1973]. The mechanics of coal mine bumps andthe interaction between coal pillars, mine roof, and floor. U.S. Department ofthe Interior, Bureau of Mines, OFR 53-73.
Iannacchione AT, Zelanko JC [1994]. Pillar mechanics of coal minebursts: a control strategy. In: Proceedings of the 16th World Mining Congress,The Mining Industry on the Threshold of XXI Century (Sofia, Bulgaria).Vol. 5, pp. 15-23.
Linkov AM [1992]. Dynamic phenomena in mines and the problem ofstability. University of Minnesota/MTS Systems Corp., lecture notes.
Maleki H [1981]. Coal mine ground control [Dissertation]. Golden, CO:Colorado School of Mines, Department of Mining Engineering.
Maleki H [1990]. Development of modeling procedures for coal minestability evaluation. In: Hustrulid WA, Johnson GA, eds. Rock MechanicsContributions and Challenges: Proceedings of the 31st U.S. Symposium.Balkema, pp. 85-92.
Maleki H [1992]. In situ pillar strength and failure mechanisms for U.S.coal seams. In: Proceedings of the Workshop on Coal Pillar Mechanics andDesign. Pittsburgh, PA: U.S. Department of the Interior, Bureau of Mines,IC 9315, pp. 73-77.
Maleki H [1995]. An analysis of violent failure in U.S. coal mines: casestudies. In: Proceedings - Mechanics and Mitigation of Violent Failure in Coaland Hard-Rock Mines. Spokane, WA: U.S. Department of the Interior, Bureauof Mines, SP 01-95, pp. 5-25.
Maleki H, Wopat PF, Repsher RC, Tuchman RJ, eds. [1995]. Proceedings- Mechanics and Mitigation of Violent Failure in Coal and Hard-Rock Mines.Spokane, WA: U.S. Department of the Interior, Bureau of Mines, SP 01-95.
McGarr A [1984]. Some applications of seismic source mechanism stud-ies to assessing underground hazard. In: Gay NC, Wainwright EH, eds. Rock-bursts and Seismicity in Mines - Proceedings of the Symposium on Seismicityin Mines, Johannesburg, Republic of South Africa, 1982. South AfricanInstitute of Mining and Metallurgy, Symposium Series 6, pp. 199-208.
Pechmann JC, Walter WR, Arabasz W, Nava S [1995]. The February 3,1995, M 5.1 seismic event in the trona mining district of southwestern Wy-oming. Seismol Res Letter, Vol. 66, pp. 25-34.
Salamon MDG [1984]. Energy considerations in rock mechanics:fundamental results. Int J S Afr Inst Min Metall, pp. 237-246.
Wu X, Karfakis MG [1994]. An analysis of strain energy accumulationaround longwall panels under strong roofs. In: Chugh YP, Beasley GA, eds.Proceedings of the Fifth Conference on Ground Control for Midwestern U.S.Coal Mines. Southern Illinois University, Department of Mining Engineering,pp. 230-253.
Zipf RK Jr. [1993]. Stress analysis in coal mines with MULSIM/NL. In:Proceedings of the 89th Meeting of the Rocky Mountain Coal Mining Institute.Lakewood, CO: Rocky Mountain Coal Mining Institute, pp. 38-43.
145
EMPIRICAL METHODS FOR COAL PILLAR DESIGN
By Christopher Mark, Ph.D.1
ABSTRACT
Empirical methods involve the scientific interpretation of real-world experience. Many problems in groundcontrol lend themselves to an empirical approach because the mines provide us with plenty of experience withfull-scale rock structures. During the past 10 years, powerful design techniques have emerged from statisticalanalyses of large databases of real-world pillar successes and failures. These include the Analysis of RetreatMining Pillar Stability (ARMPS), the Analysis of Longwall Pillar Stability (ALPS), the Mark-Bieniawskirectangular pillar strength formula, and guidelines for preventing massive pillar collapses. In the process, ourpractical understanding of pillar behavior has been greatly enriched.
1Supervisory physical scientist, Pittsburgh Research Laboratory, National Institute for Occupational Safety and Health, Pittsburgh, PA.
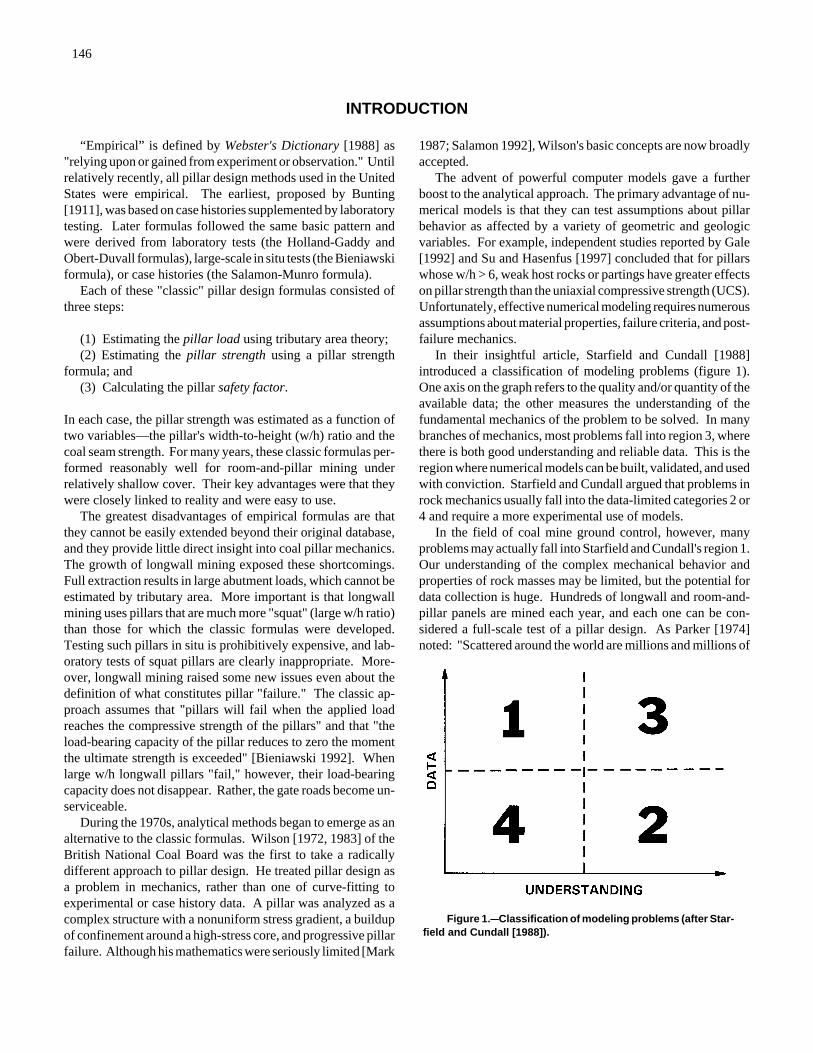
146
Figure 1.CCClassification of modeling problems (after Star-field and Cundall [1988]).
INTRODUCTION
“Empirical” is defined by Webster's Dictionary [1988] as"relying upon or gained from experiment or observation." Untilrelatively recently, all pillar design methods used in the UnitedStates were empirical. The earliest, proposed by Bunting[1911], was based on case histories supplemented by laboratorytesting. Later formulas followed the same basic pattern andwere derived from laboratory tests (the Holland-Gaddy andObert-Duvall formulas), large-scale in situ tests (the Bieniawskiformula), or case histories (the Salamon-Munro formula).
Each of these "classic" pillar design formulas consisted ofthree steps:
(1) Estimating the pillar load using tributary area theory;(2) Estimating the pillar strength using a pillar strength
formula; and(3) Calculating the pillar safety factor.
In each case, the pillar strength was estimated as a function oftwo variables—the pillar's width-to-height (w/h) ratio and thecoal seam strength. For many years, these classic formulas per-formed reasonably well for room-and-pillar mining underrelatively shallow cover. Their key advantages were that theywere closely linked to reality and were easy to use.
The greatest disadvantages of empirical formulas are thatthey cannot be easily extended beyond their original database,and they provide little direct insight into coal pillar mechanics.The growth of longwall mining exposed these shortcomings.Full extraction results in large abutment loads, which cannot beestimated by tributary area. More important is that longwallmining uses pillars that are much more "squat" (large w/h ratio)than those for which the classic formulas were developed.Testing such pillars in situ is prohibitively expensive, and lab-oratory tests of squat pillars are clearly inappropriate. More-over, longwall mining raised some new issues even about thedefinition of what constitutes pillar "failure." The classic ap-proach assumes that "pillars will fail when the applied loadreaches the compressive strength of the pillars" and that "theload-bearing capacity of the pillar reduces to zero the momentthe ultimate strength is exceeded" [Bieniawski 1992]. Whenlarge w/h longwall pillars "fail," however, their load-bearingcapacity does not disappear. Rather, the gate roads become un-serviceable.
During the 1970s, analytical methods began to emerge as analternative to the classic formulas. Wilson [1972, 1983] of theBritish National Coal Board was the first to take a radicallydifferent approach to pillar design. He treated pillar design asa problem in mechanics, rather than one of curve-fitting toexperimental or case history data. A pillar was analyzed as acomplex structure with a nonuniform stress gradient, a buildupof confinement around a high-stress core, and progressive pillarfailure. Although his mathematics were seriously limited [Mark
1987; Salamon 1992], Wilson's basic concepts are now broadlyaccepted.
The advent of powerful computer models gave a furtherboost to the analytical approach. The primary advantage of nu-merical models is that they can test assumptions about pillarbehavior as affected by a variety of geometric and geologicvariables. For example, independent studies reported by Gale[1992] and Su and Hasenfus [1997] concluded that for pillarswhose w/h > 6, weak host rocks or partings have greater effectson pillar strength than the uniaxial compressive strength (UCS).Unfortunately, effective numerical modeling requires numerousassumptions about material properties, failure criteria, and post-failure mechanics.
In their insightful article, Starfield and Cundall [1988]introduced a classification of modeling problems (figure 1).One axis on the graph refers to the quality and/or quantity of theavailable data; the other measures the understanding of thefundamental mechanics of the problem to be solved. In manybranches of mechanics, most problems fall into region 3, wherethere is both good understanding and reliable data. This is theregion where numerical models can be built, validated, and usedwith conviction. Starfield and Cundall argued that problems inrock mechanics usually fall into the data-limited categories 2 or4 and require a more experimental use of models.
In the field of coal mine ground control, however, manyproblems may actually fall into Starfield and Cundall's region 1.Our understanding of the complex mechanical behavior andproperties of rock masses may be limited, but the potential fordata collection is huge. Hundreds of longwall and room-and-pillar panels are mined each year, and each one can be con-sidered a full-scale test of a pillar design. As Parker [1974]noted: "Scattered around the world are millions and millions of
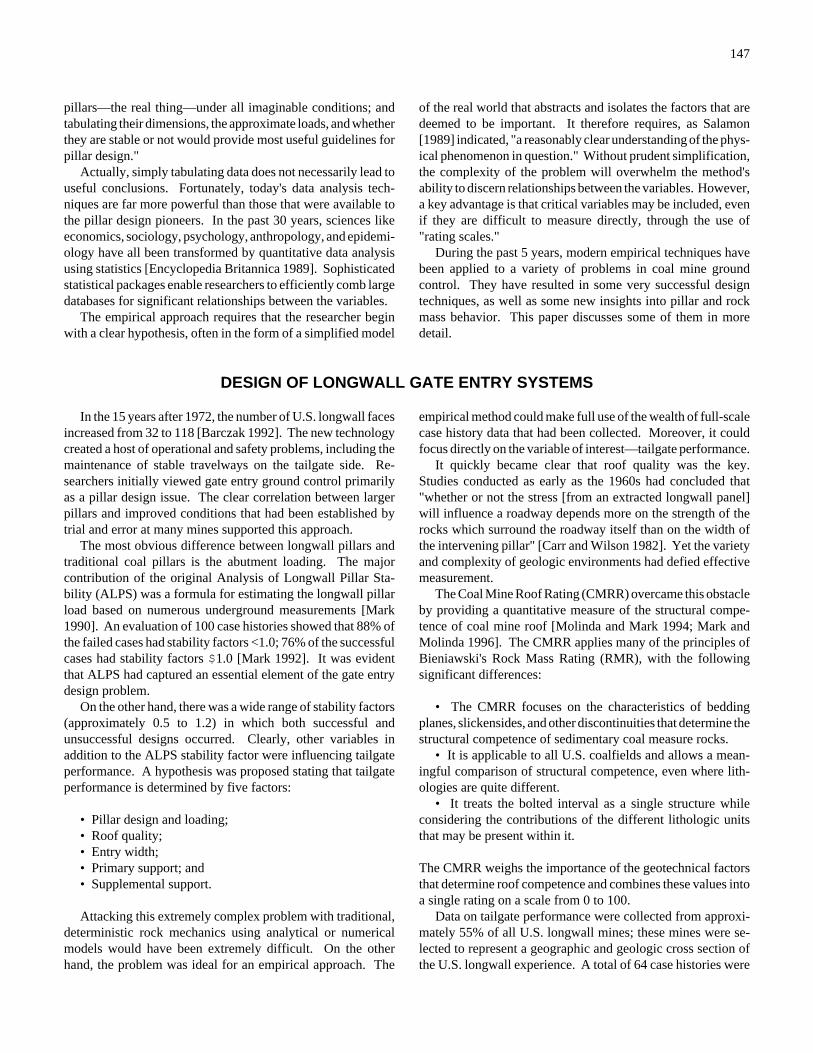
147
pillars—the real thing—under all imaginable conditions; andtabulating their dimensions, the approximate loads, and whetherthey are stable or not would provide most useful guidelines forpillar design."
Actually, simply tabulating data does not necessarily lead touseful conclusions. Fortunately, today's data analysis tech-niques are far more powerful than those that were available tothe pillar design pioneers. In the past 30 years, sciences likeeconomics, sociology, psychology, anthropology, and epidemi-ology have all been transformed by quantitative data analysisusing statistics [Encyclopedia Britannica 1989]. Sophisticatedstatistical packages enable researchers to efficiently comb largedatabases for significant relationships between the variables.
The empirical approach requires that the researcher beginwith a clear hypothesis, often in the form of a simplified model
of the real world that abstracts and isolates the factors that aredeemed to be important. It therefore requires, as Salamon[1989] indicated, "a reasonably clear understanding of the phys-ical phenomenon in question." Without prudent simplification,the complexity of the problem will overwhelm the method'sability to discern relationships between the variables. However,a key advantage is that critical variables may be included, evenif they are difficult to measure directly, through the use of"rating scales."
During the past 5 years, modern empirical techniques havebeen applied to a variety of problems in coal mine groundcontrol. They have resulted in some very successful designtechniques, as well as some new insights into pillar and rockmass behavior. This paper discusses some of them in moredetail.
DESIGN OF LONGWALL GATE ENTRY SYSTEMS
In the 15 years after 1972, the number of U.S. longwall facesincreased from 32 to 118 [Barczak 1992]. The new technologycreated a host of operational and safety problems, including themaintenance of stable travelways on the tailgate side. Re-searchers initially viewed gate entry ground control primarilyas a pillar design issue. The clear correlation between largerpillars and improved conditions that had been established bytrial and error at many mines supported this approach.
The most obvious difference between longwall pillars andtraditional coal pillars is the abutment loading. The majorcontribution of the original Analysis of Longwall Pillar Sta-bility (ALPS) was a formula for estimating the longwall pillarload based on numerous underground measurements [Mark1990]. An evaluation of 100 case histories showed that 88% ofthe failed cases had stability factors <1.0; 76% of the successfulcases had stability factors $1.0 [Mark 1992]. It was evidentthat ALPS had captured an essential element of the gate entrydesign problem.
On the other hand, there was a wide range of stability factors(approximately 0.5 to 1.2) in which both successful andunsuccessful designs occurred. Clearly, other variables inaddition to the ALPS stability factor were influencing tailgateperformance. A hypothesis was proposed stating that tailgateperformance is determined by five factors:
• Pillar design and loading;• Roof quality;• Entry width;• Primary support; and• Supplemental support.
Attacking this extremely complex problem with traditional,deterministic rock mechanics using analytical or numericalmodels would have been extremely difficult. On the otherhand, the problem was ideal for an empirical approach. The
empirical method could make full use of the wealth of full-scalecase history data that had been collected. Moreover, it couldfocus directly on the variable of interest—tailgate performance.
It quickly became clear that roof quality was the key.Studies conducted as early as the 1960s had concluded that"whether or not the stress [from an extracted longwall panel]will influence a roadway depends more on the strength of therocks which surround the roadway itself than on the width ofthe intervening pillar" [Carr and Wilson 1982]. Yet the varietyand complexity of geologic environments had defied effectivemeasurement.
The Coal Mine Roof Rating (CMRR) overcame this obstacleby providing a quantitative measure of the structural compe-tence of coal mine roof [Molinda and Mark 1994; Mark andMolinda 1996]. The CMRR applies many of the principles ofBieniawski's Rock Mass Rating (RMR), with the followingsignificant differences:
• The CMRR focuses on the characteristics of beddingplanes, slickensides, and other discontinuities that determine thestructural competence of sedimentary coal measure rocks.
• It is applicable to all U.S. coalfields and allows a mean-ingful comparison of structural competence, even where lith-ologies are quite different.
• It treats the bolted interval as a single structure whileconsidering the contributions of the different lithologic unitsthat may be present within it.
The CMRR weighs the importance of the geotechnical factorsthat determine roof competence and combines these values intoa single rating on a scale from 0 to 100.
Data on tailgate performance were collected from approxi-mately 55% of all U.S. longwall mines; these mines were se-lected to represent a geographic and geologic cross section ofthe U.S. longwall experience. A total of 64 case histories were
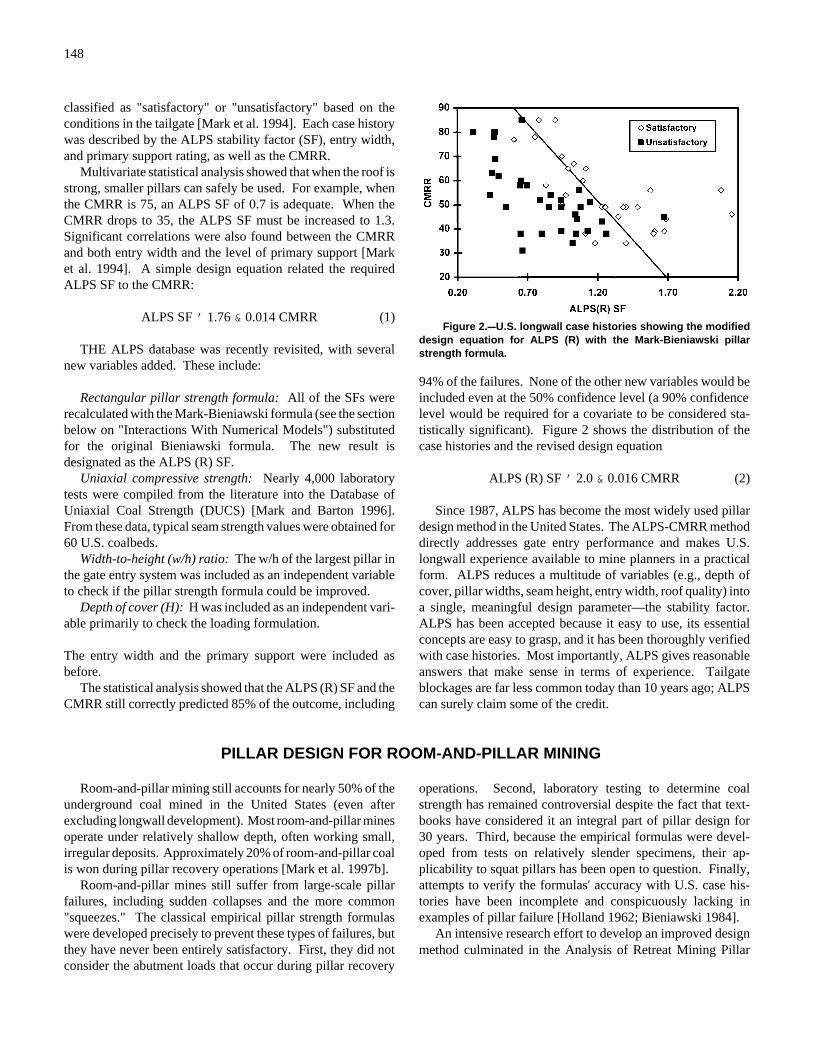
148
Figure 2.CCU.S. longwall case histories showing the modifieddesign equation for ALPS (R) with the Mark-Bieniawski pillarstrength formula.
classified as "satisfactory" or "unsatisfactory" based on theconditions in the tailgate [Mark et al. 1994]. Each case historywas described by the ALPS stability factor (SF), entry width,and primary support rating, as well as the CMRR.
Multivariate statistical analysis showed that when the roof isstrong, smaller pillars can safely be used. For example, whenthe CMRR is 75, an ALPS SF of 0.7 is adequate. When theCMRR drops to 35, the ALPS SF must be increased to 1.3.Significant correlations were also found between the CMRRand both entry width and the level of primary support [Market al. 1994]. A simple design equation related the requiredALPS SF to the CMRR:
ALPS SF ' 1.76 & 0.014 CMRR (1)
THE ALPS database was recently revisited, with severalnew variables added. These include:
Rectangular pillar strength formula: All of the SFs wererecalculated with the Mark-Bieniawski formula (see the sectionbelow on "Interactions With Numerical Models") substitutedfor the original Bieniawski formula. The new result isdesignated as the ALPS (R) SF.
Uniaxial compressive strength: Nearly 4,000 laboratorytests were compiled from the literature into the Database ofUniaxial Coal Strength (DUCS) [Mark and Barton 1996].From these data, typical seam strength values were obtained for60 U.S. coalbeds.
Width-to-height (w/h) ratio: The w/h of the largest pillar inthe gate entry system was included as an independent variableto check if the pillar strength formula could be improved.
Depth of cover (H): H was included as an independent vari-able primarily to check the loading formulation.
The entry width and the primary support were included asbefore.
The statistical analysis showed that the ALPS (R) SF and theCMRR still correctly predicted 85% of the outcome, including
94% of the failures. None of the other new variables would beincluded even at the 50% confidence level (a 90% confidencelevel would be required for a covariate to be considered sta-tistically significant). Figure 2 shows the distribution of thecase histories and the revised design equation
ALPS (R) SF ' 2.0 & 0.016 CMRR (2)
Since 1987, ALPS has become the most widely used pillardesign method in the United States. The ALPS-CMRR methoddirectly addresses gate entry performance and makes U.S.longwall experience available to mine planners in a practicalform. ALPS reduces a multitude of variables (e.g., depth ofcover, pillar widths, seam height, entry width, roof quality) intoa single, meaningful design parameter—the stability factor.ALPS has been accepted because it easy to use, its essentialconcepts are easy to grasp, and it has been thoroughly verifiedwith case histories. Most importantly, ALPS gives reasonableanswers that make sense in terms of experience. Tailgateblockages are far less common today than 10 years ago; ALPScan surely claim some of the credit.
PILLAR DESIGN FOR ROOM-AND-PILLAR MINING
Room-and-pillar mining still accounts for nearly 50% of theunderground coal mined in the United States (even afterexcluding longwall development). Most room-and-pillar minesoperate under relatively shallow depth, often working small,irregular deposits. Approximately 20% of room-and-pillar coalis won during pillar recovery operations [Mark et al. 1997b].
Room-and-pillar mines still suffer from large-scale pillarfailures, including sudden collapses and the more common"squeezes." The classical empirical pillar strength formulaswere developed precisely to prevent these types of failures, butthey have never been entirely satisfactory. First, they did notconsider the abutment loads that occur during pillar recovery
operations. Second, laboratory testing to determine coalstrength has remained controversial despite the fact that text-books have considered it an integral part of pillar design for30 years. Third, because the empirical formulas were devel-oped from tests on relatively slender specimens, their ap-plicability to squat pillars has been open to question. Finally,attempts to verify the formulas' accuracy with U.S. case his-tories have been incomplete and conspicuously lacking inexamples of pillar failure [Holland 1962; Bieniawski 1984].
An intensive research effort to develop an improved designmethod culminated in the Analysis of Retreat Mining Pillar
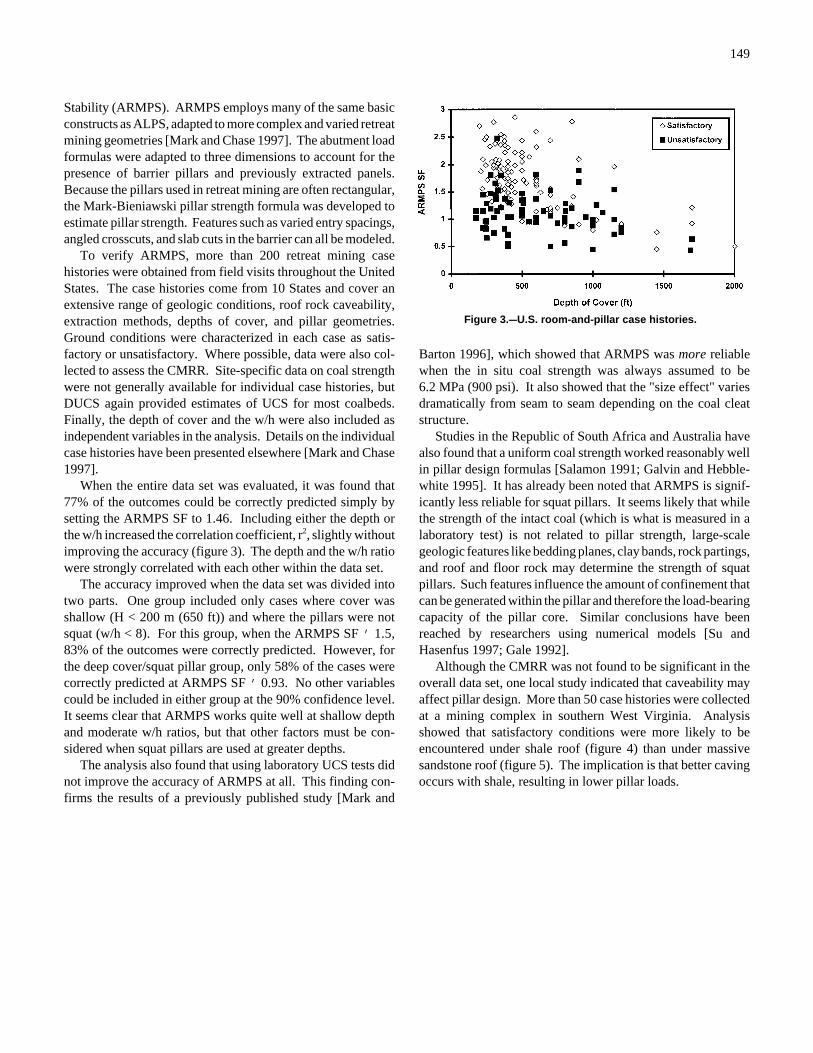
149
Figure 3.CCU.S. room-and-pillar case histories.
Stability (ARMPS). ARMPS employs many of the same basicconstructs as ALPS, adapted to more complex and varied retreatmining geometries [Mark and Chase 1997]. The abutment loadformulas were adapted to three dimensions to account for thepresence of barrier pillars and previously extracted panels.Because the pillars used in retreat mining are often rectangular,the Mark-Bieniawski pillar strength formula was developed toestimate pillar strength. Features such as varied entry spacings,angled crosscuts, and slab cuts in the barrier can all be modeled.
To verify ARMPS, more than 200 retreat mining casehistories were obtained from field visits throughout the UnitedStates. The case histories come from 10 States and cover anextensive range of geologic conditions, roof rock caveability,extraction methods, depths of cover, and pillar geometries.Ground conditions were characterized in each case as satis-factory or unsatisfactory. Where possible, data were also col-lected to assess the CMRR. Site-specific data on coal strengthwere not generally available for individual case histories, butDUCS again provided estimates of UCS for most coalbeds.Finally, the depth of cover and the w/h were also included asindependent variables in the analysis. Details on the individualcase histories have been presented elsewhere [Mark and Chase1997].
When the entire data set was evaluated, it was found that77% of the outcomes could be correctly predicted simply bysetting the ARMPS SF to 1.46. Including either the depth orthe w/h increased the correlation coefficient, r2, slightly withoutimproving the accuracy (figure 3). The depth and the w/h ratiowere strongly correlated with each other within the data set.
The accuracy improved when the data set was divided intotwo parts. One group included only cases where cover wasshallow (H < 200 m (650 ft)) and where the pillars were notsquat (w/h < 8). For this group, when the ARMPS SF ' 1.5,83% of the outcomes were correctly predicted. However, forthe deep cover/squat pillar group, only 58% of the cases werecorrectly predicted at ARMPS SF ' 0.93. No other variablescould be included in either group at the 90% confidence level.It seems clear that ARMPS works quite well at shallow depthand moderate w/h ratios, but that other factors must be con-sidered when squat pillars are used at greater depths.
The analysis also found that using laboratory UCS tests didnot improve the accuracy of ARMPS at all. This finding con-firms the results of a previously published study [Mark and
Barton 1996], which showed that ARMPS was more reliablewhen the in situ coal strength was always assumed to be6.2 MPa (900 psi). It also showed that the "size effect" variesdramatically from seam to seam depending on the coal cleatstructure.
Studies in the Republic of South Africa and Australia havealso found that a uniform coal strength worked reasonably wellin pillar design formulas [Salamon 1991; Galvin and Hebble-white 1995]. It has already been noted that ARMPS is signif-icantly less reliable for squat pillars. It seems likely that whilethe strength of the intact coal (which is what is measured in alaboratory test) is not related to pillar strength, large-scalegeologic features like bedding planes, clay bands, rock partings,and roof and floor rock may determine the strength of squatpillars. Such features influence the amount of confinement thatcan be generated within the pillar and therefore the load-bearingcapacity of the pillar core. Similar conclusions have beenreached by researchers using numerical models [Su andHasenfus 1997; Gale 1992].
Although the CMRR was not found to be significant in theoverall data set, one local study indicated that caveability mayaffect pillar design. More than 50 case histories were collectedat a mining complex in southern West Virginia. Analysisshowed that satisfactory conditions were more likely to beencountered under shale roof (figure 4) than under massivesandstone roof (figure 5). The implication is that better cavingoccurs with shale, resulting in lower pillar loads.

150
Figure 4.CCPillar performance under different roof geologies at a mining complex in West VirginiaCCshaleroof.
Figure 5.CCPillar performance under different roof geologies at a mining complex in WestVirginiaCCsandstone roof.
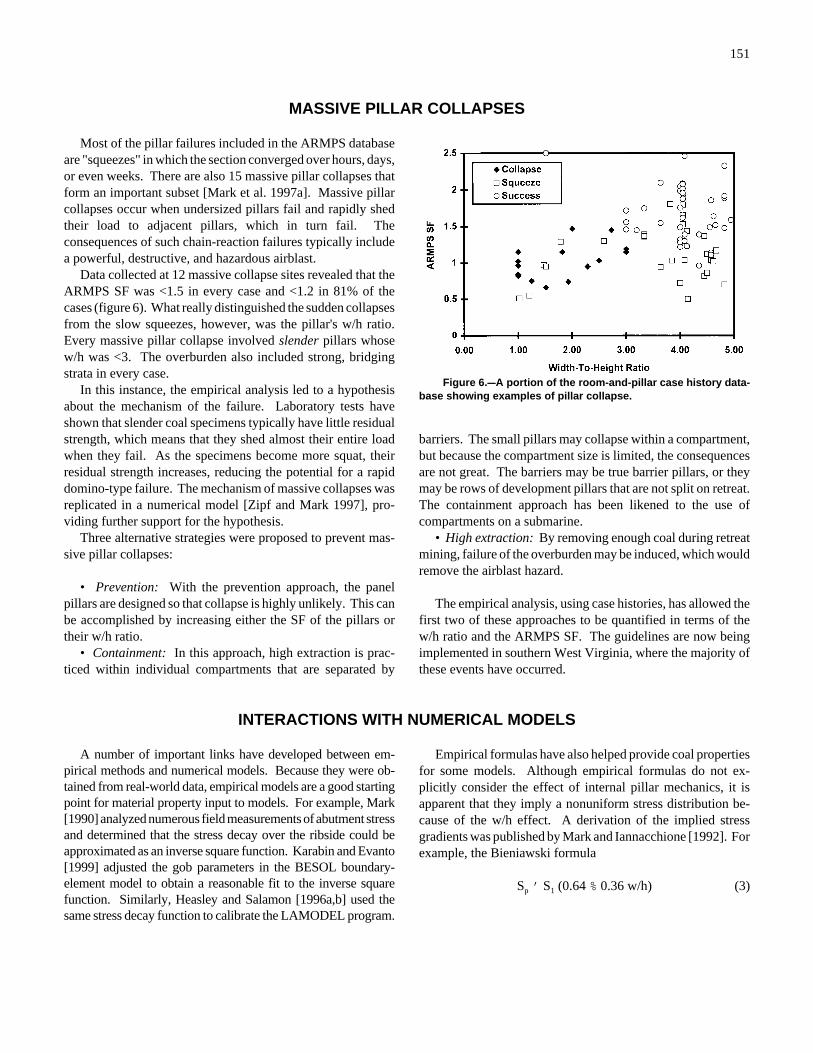
151
Figure 6.CCA portion of the room-and-pillar case history data-base showing examples of pillar collapse.
MASSIVE PILLAR COLLAPSES
Most of the pillar failures included in the ARMPS databaseare "squeezes" in which the section converged over hours, days,or even weeks. There are also 15 massive pillar collapses thatform an important subset [Mark et al. 1997a]. Massive pillarcollapses occur when undersized pillars fail and rapidly shedtheir load to adjacent pillars, which in turn fail. Theconsequences of such chain-reaction failures typically includea powerful, destructive, and hazardous airblast.
Data collected at 12 massive collapse sites revealed that theARMPS SF was <1.5 in every case and <1.2 in 81% of thecases (figure 6). What really distinguished the sudden collapsesfrom the slow squeezes, however, was the pillar's w/h ratio.Every massive pillar collapse involved slender pillars whosew/h was <3. The overburden also included strong, bridgingstrata in every case.
In this instance, the empirical analysis led to a hypothesisabout the mechanism of the failure. Laboratory tests haveshown that slender coal specimens typically have little residualstrength, which means that they shed almost their entire loadwhen they fail. As the specimens become more squat, theirresidual strength increases, reducing the potential for a rapiddomino-type failure. The mechanism of massive collapses wasreplicated in a numerical model [Zipf and Mark 1997], pro-viding further support for the hypothesis.
Three alternative strategies were proposed to prevent mas-sive pillar collapses:
• Prevention: With the prevention approach, the panelpillars are designed so that collapse is highly unlikely. This canbe accomplished by increasing either the SF of the pillars ortheir w/h ratio.
• Containment: In this approach, high extraction is prac-ticed within individual compartments that are separated by
barriers. The small pillars may collapse within a compartment,but because the compartment size is limited, the consequencesare not great. The barriers may be true barrier pillars, or theymay be rows of development pillars that are not split on retreat.The containment approach has been likened to the use ofcompartments on a submarine.
• High extraction: By removing enough coal during retreatmining, failure of the overburden may be induced, which wouldremove the airblast hazard.
The empirical analysis, using case histories, has allowed thefirst two of these approaches to be quantified in terms of thew/h ratio and the ARMPS SF. The guidelines are now beingimplemented in southern West Virginia, where the majority ofthese events have occurred.
INTERACTIONS WITH NUMERICAL MODELS
A number of important links have developed between em-pirical methods and numerical models. Because they were ob-tained from real-world data, empirical models are a good startingpoint for material property input to models. For example, Mark[1990] analyzed numerous field measurements of abutment stressand determined that the stress decay over the ribside could beapproximated as an inverse square function. Karabin and Evanto[1999] adjusted the gob parameters in the BESOL boundary-element model to obtain a reasonable fit to the inverse squarefunction. Similarly, Heasley and Salamon [1996a,b] used thesame stress decay function to calibrate the LAMODEL program.
Empirical formulas have also helped provide coal propertiesfor some models. Although empirical formulas do not ex-plicitly consider the effect of internal pillar mechanics, it isapparent that they imply a nonuniform stress distribution be-cause of the w/h effect. A derivation of the implied stressgradients was published by Mark and Iannacchione [1992]. Forexample, the Bieniawski formula
Sp ' S1 (0.64 % 0.36 w/h) (3)
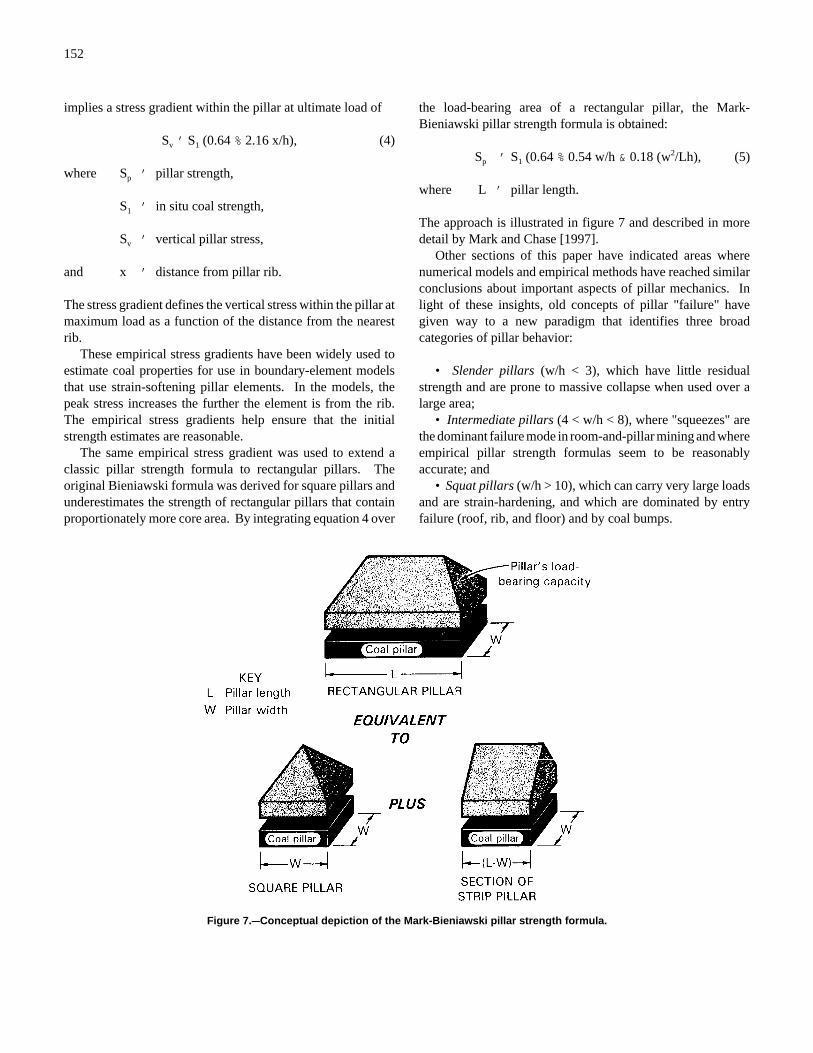
152
Figure 7.CCConceptual depiction of the Mark-Bieniawski pillar strength formula.
implies a stress gradient within the pillar at ultimate load of
Sv ' S1 (0.64 % 2.16 x/h), (4)
where Sp ' pillar strength,
S1 ' in situ coal strength,
Sv ' vertical pillar stress,
and x ' distance from pillar rib.
The stress gradient defines the vertical stress within the pillar atmaximum load as a function of the distance from the nearestrib.
These empirical stress gradients have been widely used toestimate coal properties for use in boundary-element modelsthat use strain-softening pillar elements. In the models, thepeak stress increases the further the element is from the rib.The empirical stress gradients help ensure that the initialstrength estimates are reasonable.
The same empirical stress gradient was used to extend aclassic pillar strength formula to rectangular pillars. Theoriginal Bieniawski formula was derived for square pillars andunderestimates the strength of rectangular pillars that containproportionately more core area. By integrating equation 4 over
the load-bearing area of a rectangular pillar, the Mark-Bieniawski pillar strength formula is obtained:
Sp ' S1 (0.64 % 0.54 w/h & 0.18 (w2/Lh), (5)
where L ' pillar length.
The approach is illustrated in figure 7 and described in moredetail by Mark and Chase [1997].
Other sections of this paper have indicated areas wherenumerical models and empirical methods have reached similarconclusions about important aspects of pillar mechanics. Inlight of these insights, old concepts of pillar "failure" havegiven way to a new paradigm that identifies three broadcategories of pillar behavior:
• Slender pillars (w/h < 3), which have little residualstrength and are prone to massive collapse when used over alarge area;
• Intermediate pillars (4 < w/h < 8), where "squeezes" arethe dominant failure mode in room-and-pillar mining and whereempirical pillar strength formulas seem to be reasonablyaccurate; and
• Squat pillars (w/h > 10), which can carry very large loadsand are strain-hardening, and which are dominated by entryfailure (roof, rib, and floor) and by coal bumps.
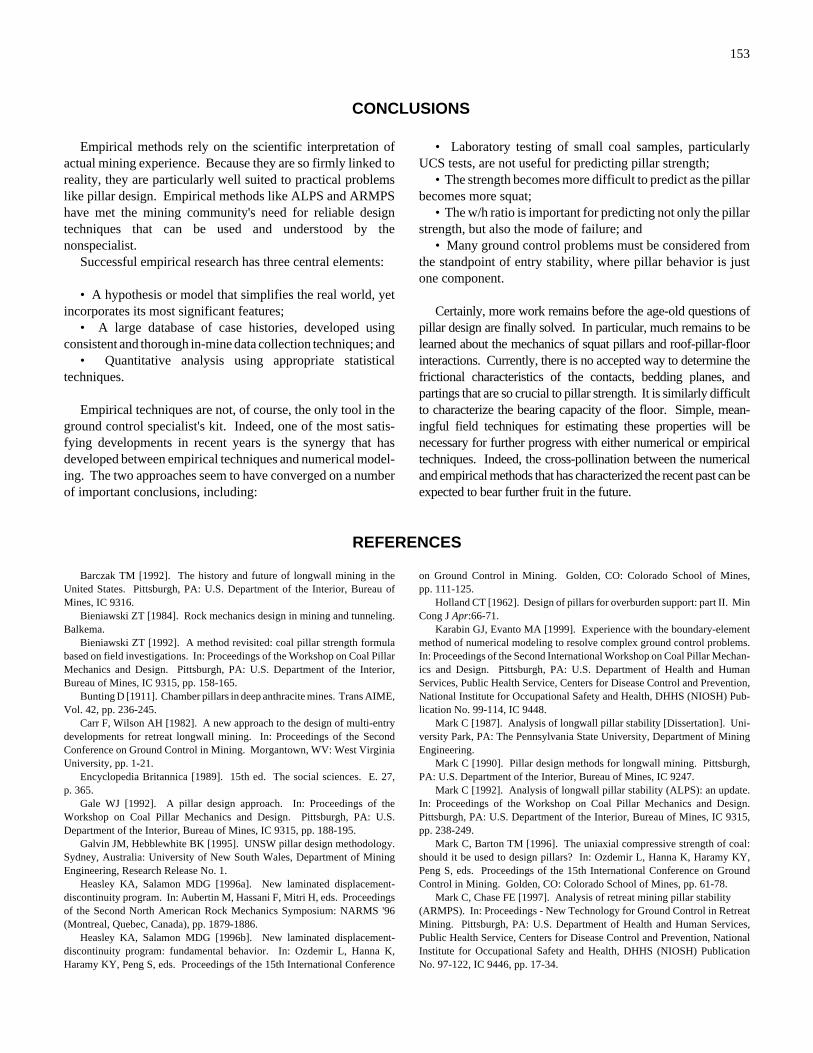
153
CONCLUSIONS
Empirical methods rely on the scientific interpretation ofactual mining experience. Because they are so firmly linked toreality, they are particularly well suited to practical problemslike pillar design. Empirical methods like ALPS and ARMPShave met the mining community's need for reliable designtechniques that can be used and understood by thenonspecialist.
Successful empirical research has three central elements:
• A hypothesis or model that simplifies the real world, yetincorporates its most significant features;
• A large database of case histories, developed usingconsistent and thorough in-mine data collection techniques; and
• Quantitative analysis using appropriate statisticaltechniques.
Empirical techniques are not, of course, the only tool in theground control specialist's kit. Indeed, one of the most satis-fying developments in recent years is the synergy that hasdeveloped between empirical techniques and numerical model-ing. The two approaches seem to have converged on a numberof important conclusions, including:
• Laboratory testing of small coal samples, particularlyUCS tests, are not useful for predicting pillar strength;
• The strength becomes more difficult to predict as the pillarbecomes more squat;
• The w/h ratio is important for predicting not only the pillarstrength, but also the mode of failure; and
• Many ground control problems must be considered fromthe standpoint of entry stability, where pillar behavior is justone component.
Certainly, more work remains before the age-old questions ofpillar design are finally solved. In particular, much remains to belearned about the mechanics of squat pillars and roof-pillar-floorinteractions. Currently, there is no accepted way to determine thefrictional characteristics of the contacts, bedding planes, andpartings that are so crucial to pillar strength. It is similarly difficultto characterize the bearing capacity of the floor. Simple, mean-ingful field techniques for estimating these properties will benecessary for further progress with either numerical or empiricaltechniques. Indeed, the cross-pollination between the numericaland empirical methods that has characterized the recent past can beexpected to bear further fruit in the future.
REFERENCES
Barczak TM [1992]. The history and future of longwall mining in theUnited States. Pittsburgh, PA: U.S. Department of the Interior, Bureau ofMines, IC 9316.
Bieniawski ZT [1984]. Rock mechanics design in mining and tunneling.Balkema.
Bieniawski ZT [1992]. A method revisited: coal pillar strength formulabased on field investigations. In: Proceedings of the Workshop on Coal PillarMechanics and Design. Pittsburgh, PA: U.S. Department of the Interior,Bureau of Mines, IC 9315, pp. 158-165.
Bunting D [1911]. Chamber pillars in deep anthracite mines. Trans AIME,Vol. 42, pp. 236-245.
Carr F, Wilson AH [1982]. A new approach to the design of multi-entrydevelopments for retreat longwall mining. In: Proceedings of the SecondConference on Ground Control in Mining. Morgantown, WV: West VirginiaUniversity, pp. 1-21.
Encyclopedia Britannica [1989]. 15th ed. The social sciences. E. 27,p. 365.
Gale WJ [1992]. A pillar design approach. In: Proceedings of theWorkshop on Coal Pillar Mechanics and Design. Pittsburgh, PA: U.S.Department of the Interior, Bureau of Mines, IC 9315, pp. 188-195.
Galvin JM, Hebblewhite BK [1995]. UNSW pillar design methodology.Sydney, Australia: University of New South Wales, Department of MiningEngineering, Research Release No. 1.
Heasley KA, Salamon MDG [1996a]. New laminated displacement-discontinuity program. In: Aubertin M, Hassani F, Mitri H, eds. Proceedingsof the Second North American Rock Mechanics Symposium: NARMS '96(Montreal, Quebec, Canada), pp. 1879-1886.
Heasley KA, Salamon MDG [1996b]. New laminated displacement-discontinuity program: fundamental behavior. In: Ozdemir L, Hanna K,Haramy KY, Peng S, eds. Proceedings of the 15th International Conference
on Ground Control in Mining. Golden, CO: Colorado School of Mines,pp. 111-125.
Holland CT [1962]. Design of pillars for overburden support: part II. MinCong J Apr:66-71.
Karabin GJ, Evanto MA [1999]. Experience with the boundary-elementmethod of numerical modeling to resolve complex ground control problems.In: Proceedings of the Second International Workshop on Coal Pillar Mechan-ics and Design. Pittsburgh, PA: U.S. Department of Health and HumanServices, Public Health Service, Centers for Disease Control and Prevention,National Institute for Occupational Safety and Health, DHHS (NIOSH) Pub-lication No. 99-114, IC 9448.
Mark C [1987]. Analysis of longwall pillar stability [Dissertation]. Uni-versity Park, PA: The Pennsylvania State University, Department of MiningEngineering.
Mark C [1990]. Pillar design methods for longwall mining. Pittsburgh,PA: U.S. Department of the Interior, Bureau of Mines, IC 9247.
Mark C [1992]. Analysis of longwall pillar stability (ALPS): an update.In: Proceedings of the Workshop on Coal Pillar Mechanics and Design.Pittsburgh, PA: U.S. Department of the Interior, Bureau of Mines, IC 9315,pp. 238-249.
Mark C, Barton TM [1996]. The uniaxial compressive strength of coal:should it be used to design pillars? In: Ozdemir L, Hanna K, Haramy KY,Peng S, eds. Proceedings of the 15th International Conference on GroundControl in Mining. Golden, CO: Colorado School of Mines, pp. 61-78.
Mark C, Chase FE [1997]. Analysis of retreat mining pillar stability (ARMPS). In: Proceedings - New Technology for Ground Control in RetreatMining. Pittsburgh, PA: U.S. Department of Health and Human Services,Public Health Service, Centers for Disease Control and Prevention, NationalInstitute for Occupational Safety and Health, DHHS (NIOSH) PublicationNo. 97-122, IC 9446, pp. 17-34.

154
Mark C, Iannacchione AT [1992]. Coal pillar mechanics: theoreticalmodels and field measurements compared. In: Proceedings of the Workshopon Coal Pillar Mechanics and Design. Pittsburgh, PA: U.S. Department of theInterior, Bureau of Mines, IC 9315, pp. 78-93.
Mark C, Molinda GM [1996]. Rating coal mine roof strength fromexploratory drill core. In: Ozdemir L, Hanna K, Haramy KY, Peng S, eds.Proceedings of the 15th International Conference on Ground Control inMining. Golden, CO: Colorado School of Mines, pp. 415-428.
Mark C, Chase FE, Molinda GM [1994]. Design of longwall gate entrysystems using roof classification. In: New Technology for Longwall GroundControl - Proceedings: U.S. Bureau of Mines Technology Transfer Seminar.Pittsburgh, PA: U.S. Department of the Interior, Bureau of Mines, SP 01-94,pp. 5-17.
Mark C, Chase FE, Zipf RK Jr. [1997a]. Preventing massive pillarcollapses in coal mines. In: Proceedings - New Technology for GroundControl in Retreat Mining. Pittsburgh, PA: U.S. Department of Health andHuman Services, Public Health Service, Centers for Disease Control andPrevention, National Institute for Occupational Safety and Health, DHHS(NIOSH) Publication No. 97-122, IC 9446, pp. 35-48.
Mark C, McCall FE, Pappas DM [1997b]. A statistical overview of retreatmining of coal pillars in the United States. In: Proceedings - New Technologyfor Ground Control in Retreat Mining. Pittsburgh, PA: U.S. Department ofHealth and Human Services, Public Health Service, Centers for DiseaseControl and Prevention, National Institute for Occupational Safety and Health,DHHS (NIOSH) Publication No. 97-122, IC 9446, pp. 2-16.
Molinda GM, Mark C [1994]. Coal mine roof rating (CMRR): a practicalrock mass classification for coal mines. Pittsburgh, PA: U.S. Department ofthe Interior, Bureau of Mines, IC 9387.
Parker J [1974]. Practical rock mechanics for the miner: part 7 - the logicalway to design pillars. Eng Min J Feb:67.
Salamon MDG [1989]. Significance of strata control to the safety andefficiency of mining. In: Proceedings of the Eighth International StrataControl Conference (Düsseldorf, Germany).
Salamon MDG [1991]. Behavior and design of coal pillars. AustralianCoal J, No. 32, pp. 11-22.
Salamon MDG [1992]. Strength and stability of coal pillars. In:Proceedings of the Workshop on Coal Pillar Mechanics and Design.Pittsburgh, PA: U.S. Department of the Interior, Bureau of Mines, IC 9315,pp. 94-121.
Starfield AM, Cundall PA [1988]. Towards a methodology for rockmechanics modelling. Int J Rock Mech Min Sci 25(3):99-106.
Su DWH, Hasenfus GJ [1997]. Effects of in-seam and near-seamconditions on coal pillar strength. Handout at the 16th InternationalConference on Ground Control in Mining (Morgantown, WV).
Webster's II New Riverside University Dictionary [1988]. Itasca, IL: TheRiverside Publishing Co.
Wilson AH [1972]. An hypothesis concerning pillar stability. Min Eng(London) 131(141):409-417.
Wilson AH [1983]. The stability of underground workings in the soft rocksof the coal measures. Int J Min Eng 1:91-187.
Zipf RK Jr., Mark C [1997]. Design methods to control violent pillarfailures in room-and-pillar mines. Transactions of the Institution of Miningand Metallurgy 106(Sept-Dec):A124-A132.

155
COAL PILLAR STRENGTH AND PRACTICAL COAL PILLAR DESIGN CONSIDERATIONS
By Daniel W. H. Su, Ph.D.,1 and Gregory J. Hasenfus2
ABSTRACT
This paper demonstrates that finite-element modeling can be used to predict in situ coal pillar strength,especially under nonideal conditions where interface friction and roof and floor deformation are the primarycontrolling factors. Despite their differences in approach, empirical, analytical, and numerical pillar designmethods have apparently converged on fundamentally similar concepts of coal pillar mechanics. The finite-element model results, however, are not intended to suggest a new pillar design criterion. Rather, theyillustrate the site-specific and complex nature of coal pillar design and the value of using modeling proceduresto account for such complex site-specific conditions. Because of the site-specific nature of coal pillar design,no single pillar design formula or model can apply in all instances. Understanding and accounting for the site-specific parameters are very important for successful coal pillar design. More work remains before thecentury-old problems related to pillar design are finally solved. Future research should focus on the cross-linkage of empirical, analytical, and numerical pillar design methods.
1Senior research scientist.2Group leader.CONSOL, Inc., Research & Development, Library, PA.
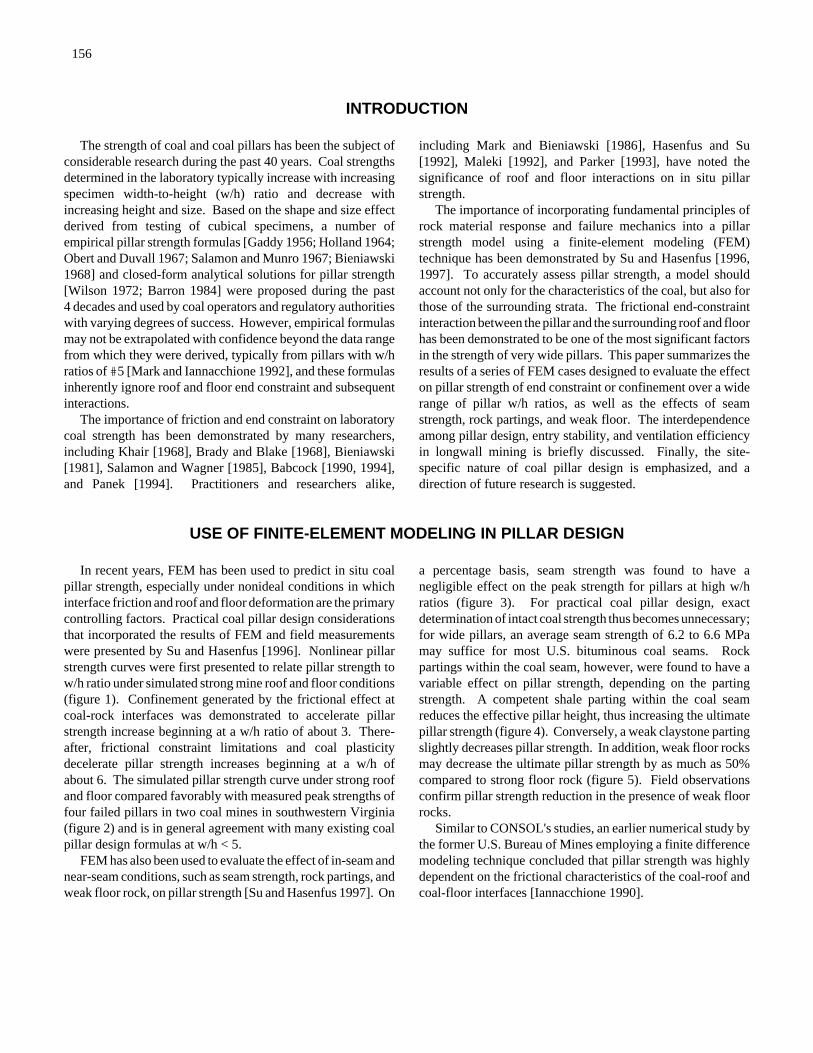
156
INTRODUCTION
The strength of coal and coal pillars has been the subject ofconsiderable research during the past 40 years. Coal strengthsdetermined in the laboratory typically increase with increasingspecimen width-to-height (w/h) ratio and decrease withincreasing height and size. Based on the shape and size effectderived from testing of cubical specimens, a number ofempirical pillar strength formulas [Gaddy 1956; Holland 1964;Obert and Duvall 1967; Salamon and Munro 1967; Bieniawski1968] and closed-form analytical solutions for pillar strength[Wilson 1972; Barron 1984] were proposed during the past4 decades and used by coal operators and regulatory authoritieswith varying degrees of success. However, empirical formulasmay not be extrapolated with confidence beyond the data rangefrom which they were derived, typically from pillars with w/hratios of #5 [Mark and Iannacchione 1992], and these formulasinherently ignore roof and floor end constraint and subsequentinteractions.
The importance of friction and end constraint on laboratorycoal strength has been demonstrated by many researchers,including Khair [1968], Brady and Blake [1968], Bieniawski[1981], Salamon and Wagner [1985], Babcock [1990, 1994],and Panek [1994]. Practitioners and researchers alike,
including Mark and Bieniawski [1986], Hasenfus and Su[1992], Maleki [1992], and Parker [1993], have noted thesignificance of roof and floor interactions on in situ pillarstrength.
The importance of incorporating fundamental principles ofrock material response and failure mechanics into a pillarstrength model using a finite-element modeling (FEM)technique has been demonstrated by Su and Hasenfus [1996,1997]. To accurately assess pillar strength, a model shouldaccount not only for the characteristics of the coal, but also forthose of the surrounding strata. The frictional end-constraintinteraction between the pillar and the surrounding roof and floorhas been demonstrated to be one of the most significant factorsin the strength of very wide pillars. This paper summarizes theresults of a series of FEM cases designed to evaluate the effecton pillar strength of end constraint or confinement over a widerange of pillar w/h ratios, as well as the effects of seamstrength, rock partings, and weak floor. The interdependenceamong pillar design, entry stability, and ventilation efficiencyin longwall mining is briefly discussed. Finally, the site-specific nature of coal pillar design is emphasized, and adirection of future research is suggested.
USE OF FINITE-ELEMENT MODELING IN PILLAR DESIGN
In recent years, FEM has been used to predict in situ coalpillar strength, especially under nonideal conditions in whichinterface friction and roof and floor deformation are the primarycontrolling factors. Practical coal pillar design considerationsthat incorporated the results of FEM and field measurementswere presented by Su and Hasenfus [1996]. Nonlinear pillarstrength curves were first presented to relate pillar strength tow/h ratio under simulated strong mine roof and floor conditions(figure 1). Confinement generated by the frictional effect atcoal-rock interfaces was demonstrated to accelerate pillarstrength increase beginning at a w/h ratio of about 3. There-after, frictional constraint limitations and coal plasticitydecelerate pillar strength increases beginning at a w/h ofabout 6. The simulated pillar strength curve under strong roofand floor compared favorably with measured peak strengths offour failed pillars in two coal mines in southwestern Virginia(figure 2) and is in general agreement with many existing coalpillar design formulas at w/h < 5.
FEM has also been used to evaluate the effect of in-seam andnear-seam conditions, such as seam strength, rock partings, andweak floor rock, on pillar strength [Su and Hasenfus 1997]. On
a percentage basis, seam strength was found to have anegligible effect on the peak strength for pillars at high w/hratios (figure 3). For practical coal pillar design, exactdetermination of intact coal strength thus becomes unnecessary;for wide pillars, an average seam strength of 6.2 to 6.6 MPamay suffice for most U.S. bituminous coal seams. Rockpartings within the coal seam, however, were found to have avariable effect on pillar strength, depending on the partingstrength. A competent shale parting within the coal seamreduces the effective pillar height, thus increasing the ultimatepillar strength (figure 4). Conversely, a weak claystone partingslightly decreases pillar strength. In addition, weak floor rocksmay decrease the ultimate pillar strength by as much as 50%compared to strong floor rock (figure 5). Field observationsconfirm pillar strength reduction in the presence of weak floorrocks.
Similar to CONSOL's studies, an earlier numerical study bythe former U.S. Bureau of Mines employing a finite differencemodeling technique concluded that pillar strength was highlydependent on the frictional characteristics of the coal-roof andcoal-floor interfaces [Iannacchione 1990].

157
Figure 1.CCPillar strength comparison of FEM model results versus existing empiricalformula.
Figure 2.CCComparison of FEM modeled versus field pillar strength data (strong roof andstrong floor conditions).
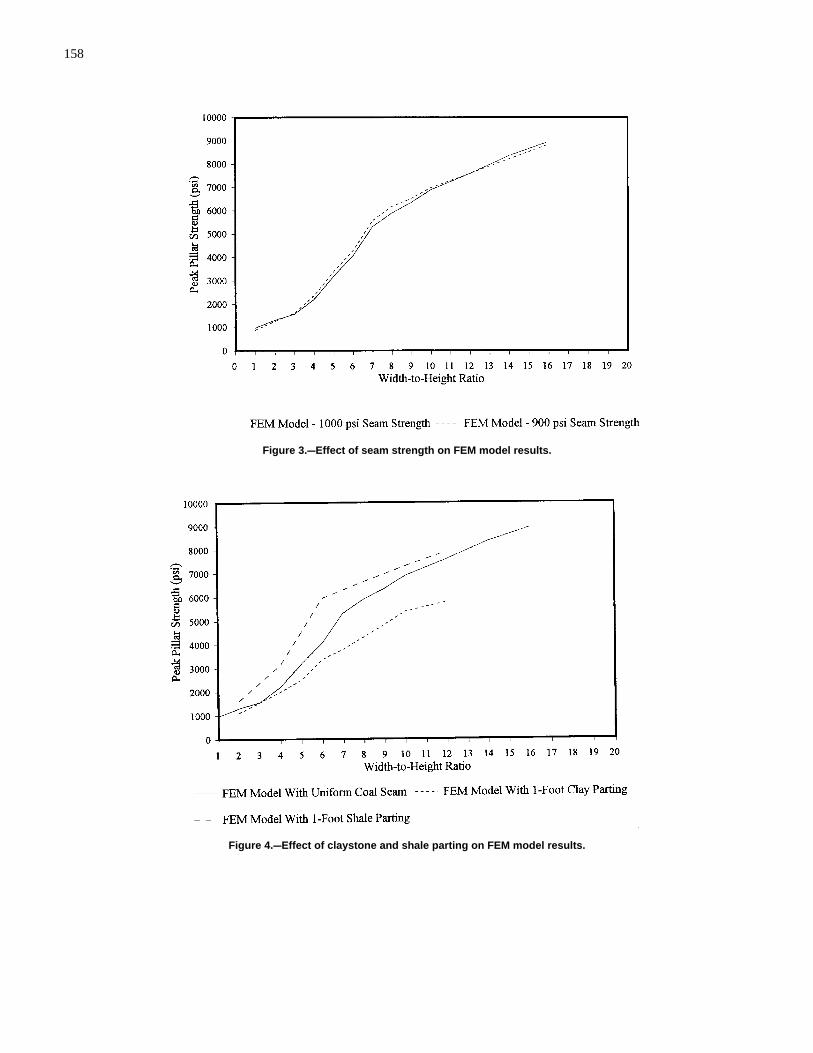
158
Figure 3.CCEffect of seam strength on FEM model results.
Figure 4.CCEffect of claystone and shale parting on FEM model results.
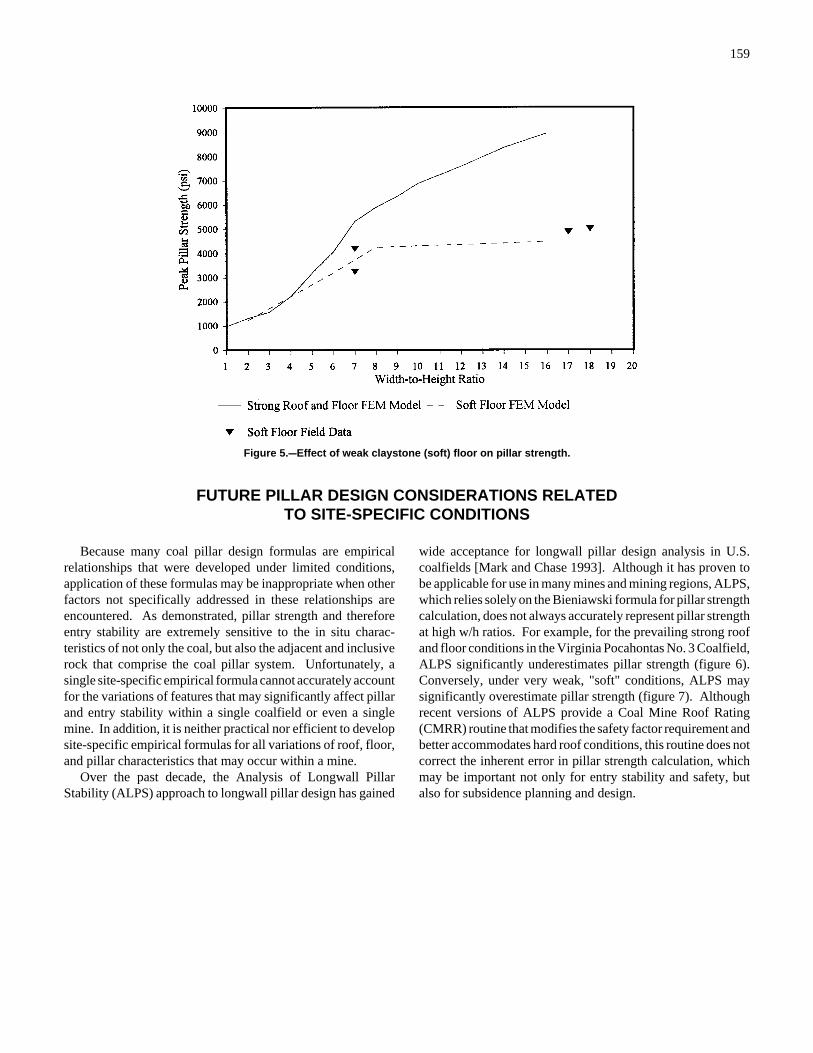
159
Figure 5.CCEffect of weak claystone (soft) floor on pillar strength.
FUTURE PILLAR DESIGN CONSIDERATIONS RELATEDTO SITE-SPECIFIC CONDITIONS
Because many coal pillar design formulas are empiricalrelationships that were developed under limited conditions,application of these formulas may be inappropriate when otherfactors not specifically addressed in these relationships areencountered. As demonstrated, pillar strength and thereforeentry stability are extremely sensitive to the in situ charac-teristics of not only the coal, but also the adjacent and inclusiverock that comprise the coal pillar system. Unfortunately, asingle site-specific empirical formula cannot accurately accountfor the variations of features that may significantly affect pillarand entry stability within a single coalfield or even a singlemine. In addition, it is neither practical nor efficient to developsite-specific empirical formulas for all variations of roof, floor,and pillar characteristics that may occur within a mine.
Over the past decade, the Analysis of Longwall PillarStability (ALPS) approach to longwall pillar design has gained
wide acceptance for longwall pillar design analysis in U.S.coalfields [Mark and Chase 1993]. Although it has proven tobe applicable for use in many mines and mining regions, ALPS,which relies solely on the Bieniawski formula for pillar strengthcalculation, does not always accurately represent pillar strengthat high w/h ratios. For example, for the prevailing strong roofand floor conditions in the Virginia Pocahontas No. 3 Coalfield,ALPS significantly underestimates pillar strength (figure 6).Conversely, under very weak, "soft" conditions, ALPS maysignificantly overestimate pillar strength (figure 7). Althoughrecent versions of ALPS provide a Coal Mine Roof Rating(CMRR) routine that modifies the safety factor requirement andbetter accommodates hard roof conditions, this routine does notcorrect the inherent error in pillar strength calculation, whichmay be important not only for entry stability and safety, butalso for subsidence planning and design.
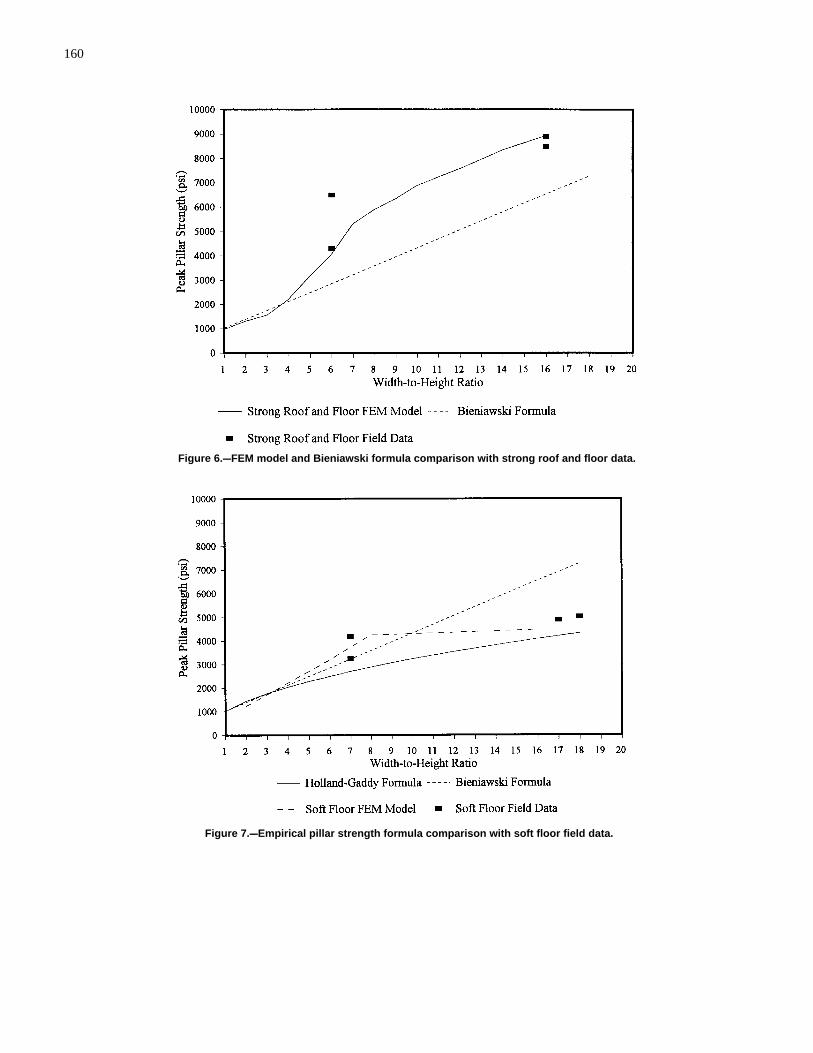
160
Figure 6.CCFEM model and Bieniawski formula comparison with strong roof and floor data.
Figure 7.CCEmpirical pillar strength formula comparison with soft floor field data.
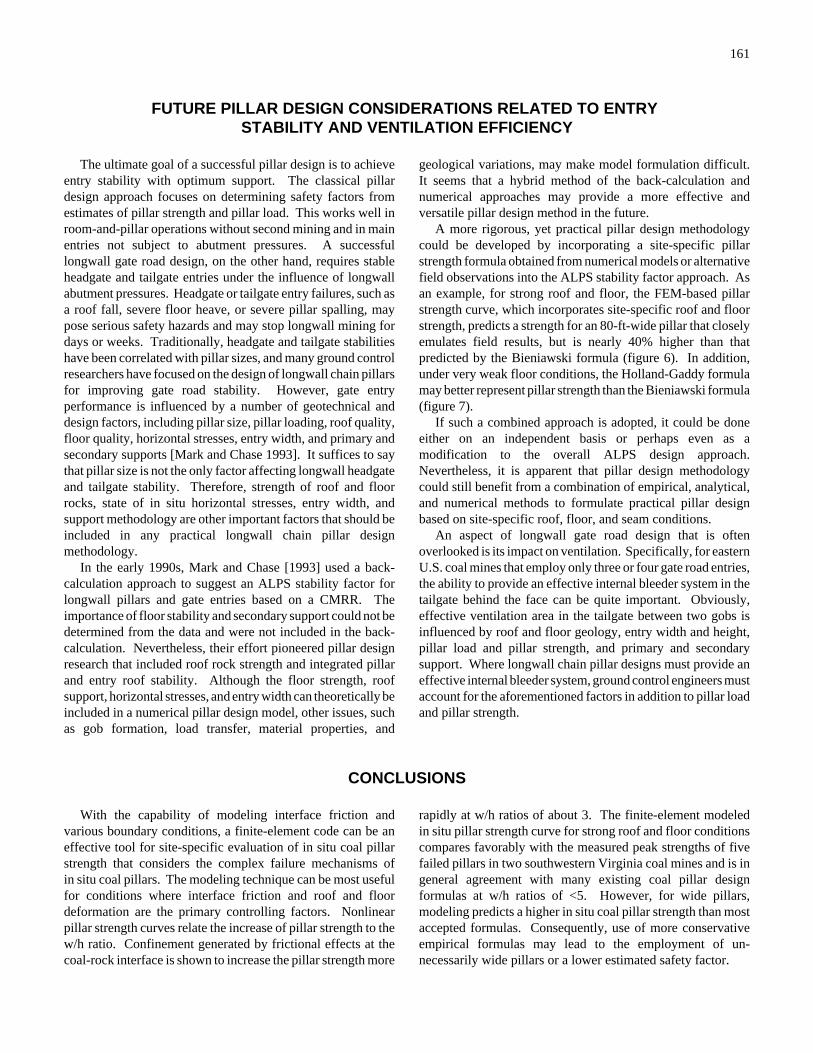
161
FUTURE PILLAR DESIGN CONSIDERATIONS RELATED TO ENTRY STABILITY AND VENTILATION EFFICIENCY
The ultimate goal of a successful pillar design is to achieveentry stability with optimum support. The classical pillardesign approach focuses on determining safety factors fromestimates of pillar strength and pillar load. This works well inroom-and-pillar operations without second mining and in mainentries not subject to abutment pressures. A successfullongwall gate road design, on the other hand, requires stableheadgate and tailgate entries under the influence of longwallabutment pressures. Headgate or tailgate entry failures, such asa roof fall, severe floor heave, or severe pillar spalling, maypose serious safety hazards and may stop longwall mining fordays or weeks. Traditionally, headgate and tailgate stabilitieshave been correlated with pillar sizes, and many ground controlresearchers have focused on the design of longwall chain pillarsfor improving gate road stability. However, gate entryperformance is influenced by a number of geotechnical anddesign factors, including pillar size, pillar loading, roof quality,floor quality, horizontal stresses, entry width, and primary andsecondary supports [Mark and Chase 1993]. It suffices to saythat pillar size is not the only factor affecting longwall headgateand tailgate stability. Therefore, strength of roof and floorrocks, state of in situ horizontal stresses, entry width, andsupport methodology are other important factors that should beincluded in any practical longwall chain pillar designmethodology.
In the early 1990s, Mark and Chase [1993] used a back-calculation approach to suggest an ALPS stability factor forlongwall pillars and gate entries based on a CMRR. Theimportance of floor stability and secondary support could not bedetermined from the data and were not included in the back-calculation. Nevertheless, their effort pioneered pillar designresearch that included roof rock strength and integrated pillarand entry roof stability. Although the floor strength, roofsupport, horizontal stresses, and entry width can theoretically beincluded in a numerical pillar design model, other issues, suchas gob formation, load transfer, material properties, and
geological variations, may make model formulation difficult.It seems that a hybrid method of the back-calculation andnumerical approaches may provide a more effective andversatile pillar design method in the future.
A more rigorous, yet practical pillar design methodologycould be developed by incorporating a site-specific pillarstrength formula obtained from numerical models or alternativefield observations into the ALPS stability factor approach. Asan example, for strong roof and floor, the FEM-based pillarstrength curve, which incorporates site-specific roof and floorstrength, predicts a strength for an 80-ft-wide pillar that closelyemulates field results, but is nearly 40% higher than thatpredicted by the Bieniawski formula (figure 6). In addition,under very weak floor conditions, the Holland-Gaddy formulamay better represent pillar strength than the Bieniawski formula(figure 7).
If such a combined approach is adopted, it could be doneeither on an independent basis or perhaps even as amodification to the overall ALPS design approach.Nevertheless, it is apparent that pillar design methodologycould still benefit from a combination of empirical, analytical,and numerical methods to formulate practical pillar designbased on site-specific roof, floor, and seam conditions.
An aspect of longwall gate road design that is oftenoverlooked is its impact on ventilation. Specifically, for easternU.S. coal mines that employ only three or four gate road entries,the ability to provide an effective internal bleeder system in thetailgate behind the face can be quite important. Obviously,effective ventilation area in the tailgate between two gobs isinfluenced by roof and floor geology, entry width and height,pillar load and pillar strength, and primary and secondarysupport. Where longwall chain pillar designs must provide aneffective internal bleeder system, ground control engineers mustaccount for the aforementioned factors in addition to pillar loadand pillar strength.
CONCLUSIONS
With the capability of modeling interface friction andvarious boundary conditions, a finite-element code can be aneffective tool for site-specific evaluation of in situ coal pillarstrength that considers the complex failure mechanisms ofin situ coal pillars. The modeling technique can be most usefulfor conditions where interface friction and roof and floordeformation are the primary controlling factors. Nonlinearpillar strength curves relate the increase of pillar strength to thew/h ratio. Confinement generated by frictional effects at thecoal-rock interface is shown to increase the pillar strength more
rapidly at w/h ratios of about 3. The finite-element modeledin situ pillar strength curve for strong roof and floor conditionscompares favorably with the measured peak strengths of fivefailed pillars in two southwestern Virginia coal mines and is ingeneral agreement with many existing coal pillar designformulas at w/h ratios of <5. However, for wide pillars,modeling predicts a higher in situ coal pillar strength than mostaccepted formulas. Consequently, use of more conservativeempirical formulas may lead to the employment of un-necessarily wide pillars or a lower estimated safety factor.
162
However, to accurately assess pillar strength, a model orformula should account not only for the characteristics of thecoal, but also for those of the surrounding strata. Althoughseam strength is observed to have some effect on pillar strength,its significance is often overrated. In fact, for coal pillars withlarge w/h ratios, ultimate pillar strength is more dependent onend constraints than on seam strength. This reduces thesignificance of laboratory coal compressive strength deter-mination for such conditions. For practical purposes, a uniformseam strength averaging about 6.2 to 6.6 MPa is adequate formost U.S. bituminous coal seams when employing finite-element models to simulate pillars with high w/h ratios.
The finite-element model results presented are not intendedto suggest new pillar design relationships with w/h ratios. Theprimary objective of this paper is to emphasize the site-specificnature of coal pillar design and the value of using modelingprocedures to account for such site-specific conditions.Understanding the site-specific parameters is an importantingredient for successful coal pillar design. Due to thevariability of in situ properties, no currently available empirical,
analytical, or numerical pillar design formula is applicable in allcases. Utilization or imposition of pillar design formulas thatdo not, or cannot, account for site-specific variations in roof,floor, and parting conditions may lead to incorrect assessmentsof pillar strength, whether high or low, and incorrect estimatesof pillar design safety factors. Empirical, analytical, ornumerical design procedures should be validated by site-specific measurements or observational field studies wheneverpossible.
For longwall mining, pillar design is not the only factoraffecting headgate and tailgate stability and ventilationefficiency. Strength of roof and floor rocks, state of in situstresses, entry width, and support methodology are otherimportant factors affecting longwall gate road stability andshould be considered in practical longwall chain pillar design.Certainly, more work remains before the century-old problemsrelated to pillar design are finally solved. Future pillar designmethodology could benefit from a cross-linkage of empirical,analytical, and numerical pillar design methods.
REFERENCES
Babcock CO [1990]. True uniaxial compressive strengths of rock or coalspecimens are independent of diameter-to-length ratios. Denver, CO: U.S.Department of the Interior, Bureau of Mines, RI 9316.
Babcock CO [1994]. Critique of pillar design equations from 1833 to1990. Denver, CO: U.S. Department of the Interior, Bureau of Mines, IC 9398.
Barron K [1984]. An analytical approach to the design of coal pillars.CIM Bulletin 77(868):37-44.
Bieniawski ZT [1968]. The effects of specimen size on the compressivestrength of coal. Int J Rock Mech Min Sci 5:325-335.
Bieniawski ZT [1981]. Improved design of coal pillars for U.S. miningconditions. In: First Annual Conference on Ground Control in Coal.Morgantown, WV: West Virginia University, pp. 13-22.
Brady BT, Blake W [1968]. An elastic solution of the laterally constrainedcircular cylinder under uniaxial loading. In: 10th U.S. Symposium on RockMechanics, pp. 199-214.
Gaddy FL [1956]. A study of the ultimate strength of coal as related to theabsolute size of the cubical specimens tested. Blacksburg, VA: VirginiaPolytechnic Institute and State University, Bulletin VPI 49(10), tables 6-10.
Hasenfus GJ, Su DWH [1992]. A comprehensive integrated approach forlongwall development design. In: Proceedings of the Workshop on Coal PillarMechanics and Design. Pittsburgh, PA: U.S. Department of the Interior,Bureau of Mines, IC 9315, pp. 225-237.
Holland CT [1964]. The strength of coal in mine pillars. In: Proceedingsof the Sixth Symposium on Rock Mechanics. Rolla, MO: University ofMissouri, pp. 450-456.
Iannacchione AT [1990]. The effect of roof and floor interface slip on coalpillar behavior. In: Proceedings of the 31st U.S. Symposium on RockMechanics, pp. 156-160.
Khair AW [1968]. The effects of coefficient of friction on strength ofmodel coal pillar [Thesis]. Morgantown, WV: West Virginia University,Department of Mining Engineering.
Maleki H [1992]. In situ pillar strength and failure mechanisms for U.S.coal seams. In: Proceedings of the Workshop on Coal Pillar Mechanics andDesign. Pittsburgh, PA: U.S. Department of the Interior, Bureau of Mines,IC 9315, pp. 73-77.
Mark C, Bieniawski ZT [1986]. Field measurements of chain pillarresponse to longwall abutment loads. In: Proceedings of the Fifth Conferenceon Ground Control in Mining, pp. 114-122.
Mark C, Chase FE [1993]. Gate entry design for longwall using the coalmine roof rating. In: Proceedings of the 12th International Conference onGround Control in Mining. Morgantown, WV: West Virginia University,pp. 76-83.
Mark C, Iannacchione AT [1992]. Coal pillar mechanics: theoreticalmodels and field measurements compared. In: Proceedings of the Workshopon Coal Pillar Mechanics and Design. Pittsburgh, PA: U.S. Department of theInterior, Bureau of Mines, IC 9315, pp. 78-93.
Obert L, Duvall WI [1967]. Rock mechanics and the design of structuresin rock. New York, NY: John Wiley and Sons, pp. 542-545.
Panek L [1994]. Sealing mine pillar size and slope with the R function.SME preprint 94-52. Littleton, CO: Society for Mining, Metallurgy, andExploration, Inc.
Parker J [1993]. Mine pillar design in 1993: computers have become theopiate of mining engineering, parts I and II. Min Eng July:714-717 andAug:1047-1050.
Salamon MDG, Munro AH [1967]. A study of the strength of coal pillars.J S Afr Inst Min Metall 68:55-67.
Salamon MDG, Wagner H [1985]. Practical experiences in the design ofcoal pillars. In: Green AR, ed. Proceedings of the 21st InternationalConference of Safety in Mines Research Institutes (Sydney, Australia).Balkema, pp. 3-9.
Su DWH, Hasenfus GJ [1996]. Practical coal pillar design considerationsbased on numerical modeling. Handout at the 15th International Conferenceon Ground Control in Mining (Golden, CO).
Su DWH, Hasenfus GJ [1997]. Effects of in-seam and near-seamconditions on coal pillar strength. Handout at the 16th InternationalConference on Ground Control in Mining (Morgantown, WV).
Wilson AH [1972]. An hypothesis concerning pillar stability. Min Eng(London) 131(141):409-417.

163
NEW STRENGTH FORMULA FOR COAL PILLARS IN SOUTH AFRICA
By J. Nielen van der Merwe, Ph.D.1
ABSTRACT
For the last 3 decades, coal pillars in the Republic of South Africa have been designed using the well-knownstrength formula of Salamon and Munro that was empirically derived after the Coalbrook disaster. Thedatabase was recently updated with the addition of failures that occurred after the initial analysis and theomission of failures that occurred in a known anomalous area. An alternative method of analysis was usedto refine the constants in the formula. The outcome was a new formula that shows that the larger width-to-height ratio coal pillars are significantly stronger than previously believed, even though the material itself isrepresented by a reduced constant in the new formula. The formula predicts lower strength for the smallerpillars, explaining the failure of small pillars that were previously believed to have had high safety factors. Application of the new formula will result in improved coal reserve utilization for deeper workings andenhanced stability of shallow workings.
1Managing director, Itasca Africa (Pty.) Ltd., Johannesburg, Republic of South Africa.
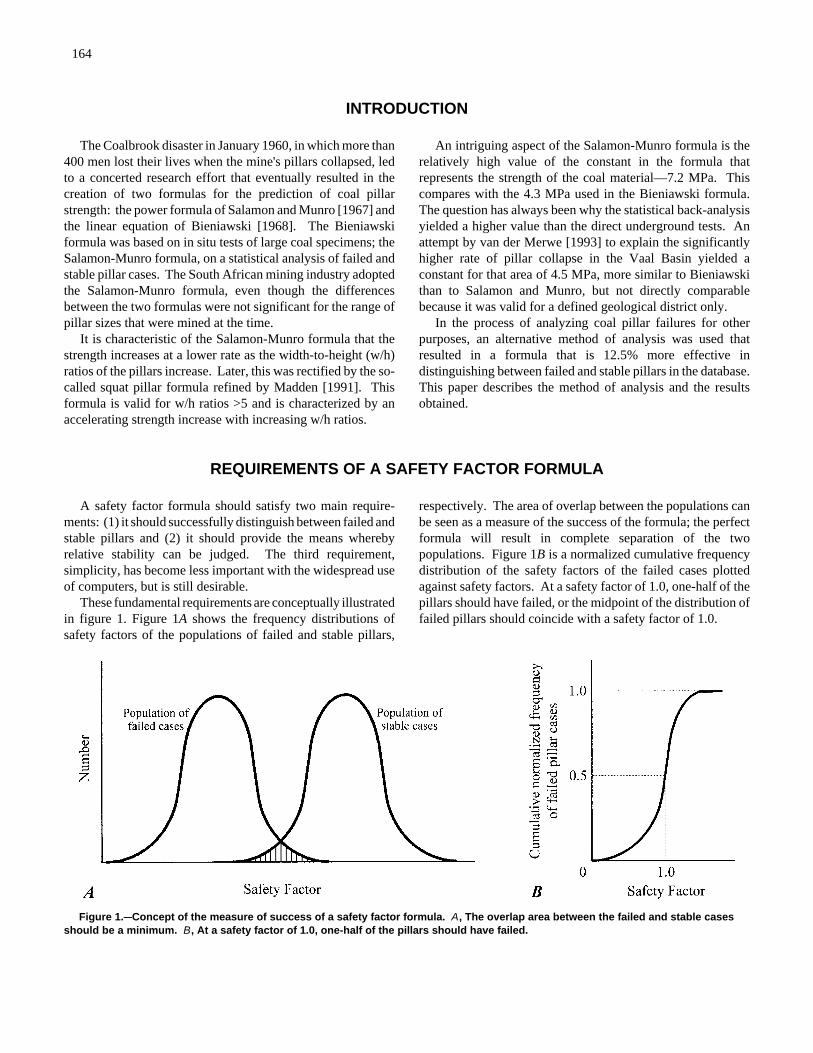
164
Figure 1.CCConcept of the measure of success of a safety factor formula. A, The overlap area between the failed and stable casesshould be a minimum. B, At a safety factor of 1.0, one-half of the pillars should have failed.
INTRODUCTION
The Coalbrook disaster in January 1960, in which more than400 men lost their lives when the mine's pillars collapsed, ledto a concerted research effort that eventually resulted in thecreation of two formulas for the prediction of coal pillarstrength: the power formula of Salamon and Munro [1967] andthe linear equation of Bieniawski [1968]. The Bieniawskiformula was based on in situ tests of large coal specimens; theSalamon-Munro formula, on a statistical analysis of failed andstable pillar cases. The South African mining industry adoptedthe Salamon-Munro formula, even though the differencesbetween the two formulas were not significant for the range ofpillar sizes that were mined at the time.
It is characteristic of the Salamon-Munro formula that thestrength increases at a lower rate as the width-to-height (w/h)ratios of the pillars increase. Later, this was rectified by the so-called squat pillar formula refined by Madden [1991]. Thisformula is valid for w/h ratios >5 and is characterized by anaccelerating strength increase with increasing w/h ratios.
An intriguing aspect of the Salamon-Munro formula is therelatively high value of the constant in the formula thatrepresents the strength of the coal material—7.2 MPa. Thiscompares with the 4.3 MPa used in the Bieniawski formula.The question has always been why the statistical back-analysisyielded a higher value than the direct underground tests. Anattempt by van der Merwe [1993] to explain the significantlyhigher rate of pillar collapse in the Vaal Basin yielded aconstant for that area of 4.5 MPa, more similar to Bieniawskithan to Salamon and Munro, but not directly comparablebecause it was valid for a defined geological district only.
In the process of analyzing coal pillar failures for otherpurposes, an alternative method of analysis was used thatresulted in a formula that is 12.5% more effective indistinguishing between failed and stable pillars in the database.This paper describes the method of analysis and the resultsobtained.
REQUIREMENTS OF A SAFETY FACTOR FORMULA
A safety factor formula should satisfy two main require-ments: (1) it should successfully distinguish between failed andstable pillars and (2) it should provide the means wherebyrelative stability can be judged. The third requirement,simplicity, has become less important with the widespread useof computers, but is still desirable.
These fundamental requirements are conceptually illustratedin figure 1. Figure 1A shows the frequency distributions ofsafety factors of the populations of failed and stable pillars,
respectively. The area of overlap between the populations canbe seen as a measure of the success of the formula; the perfectformula will result in complete separation of the twopopulations. Figure 1B is a normalized cumulative frequencydistribution of the safety factors of the failed cases plottedagainst safety factors. At a safety factor of 1.0, one-half of thepillars should have failed, or the midpoint of the distribution offailed pillars should coincide with a safety factor of 1.0.
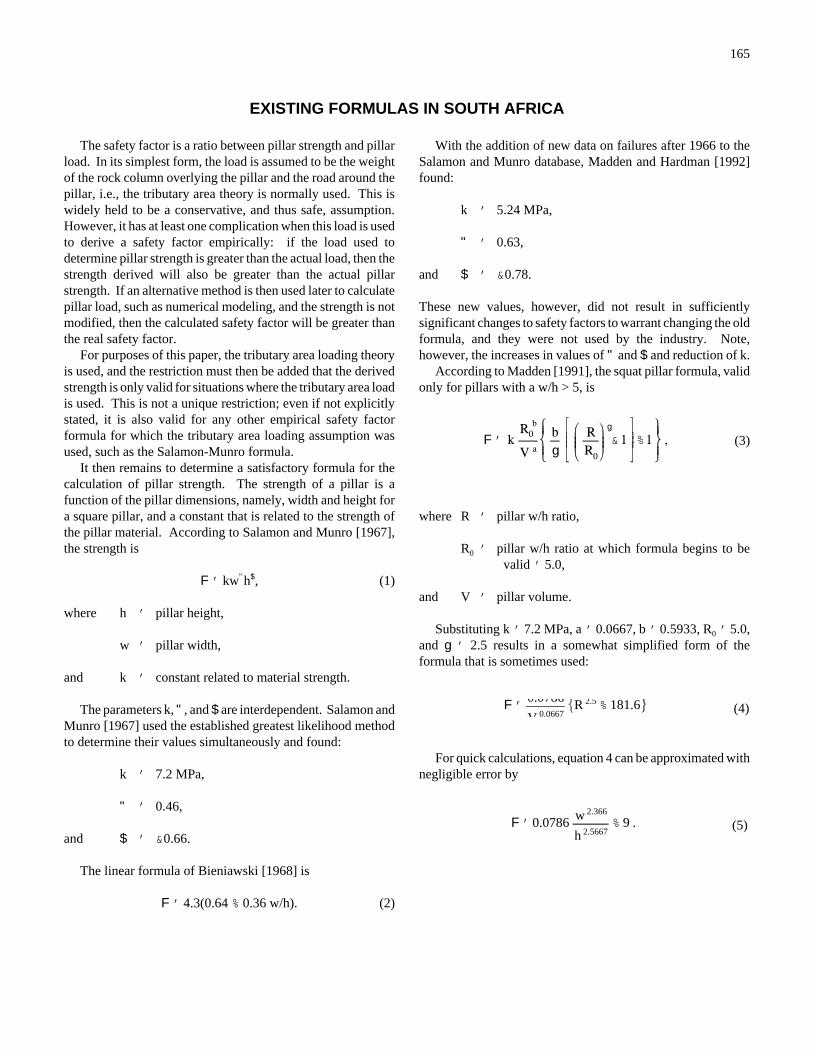
165
F ' kR b
0
V a
bg
RR0
g
&1 %1 , (3)
F '0.0786
V 0.0667R 2.5 % 181.6 (4)
F ' 0.0786 w 2.366
h 2.5667% 9 . (5)
EXISTING FORMULAS IN SOUTH AFRICA
The safety factor is a ratio between pillar strength and pillarload. In its simplest form, the load is assumed to be the weightof the rock column overlying the pillar and the road around thepillar, i.e., the tributary area theory is normally used. This iswidely held to be a conservative, and thus safe, assumption.However, it has at least one complication when this load is usedto derive a safety factor empirically: if the load used todetermine pillar strength is greater than the actual load, then thestrength derived will also be greater than the actual pillarstrength. If an alternative method is then used later to calculatepillar load, such as numerical modeling, and the strength is notmodified, then the calculated safety factor will be greater thanthe real safety factor.
For purposes of this paper, the tributary area loading theoryis used, and the restriction must then be added that the derivedstrength is only valid for situations where the tributary area loadis used. This is not a unique restriction; even if not explicitlystated, it is also valid for any other empirical safety factorformula for which the tributary area loading assumption wasused, such as the Salamon-Munro formula.
It then remains to determine a satisfactory formula for thecalculation of pillar strength. The strength of a pillar is afunction of the pillar dimensions, namely, width and height fora square pillar, and a constant that is related to the strength ofthe pillar material. According to Salamon and Munro [1967],the strength is
F ' kw"h$, (1)
where h ' pillar height,
w ' pillar width,
and k ' constant related to material strength.
The parameters k, ", and $ are interdependent. Salamon andMunro [1967] used the established greatest likelihood methodto determine their values simultaneously and found:
k ' 7.2 MPa,
" ' 0.46,
and $ ' &0.66.
The linear formula of Bieniawski [1968] is
F ' 4.3(0.64 % 0.36 w/h). (2)
With the addition of new data on failures after 1966 to theSalamon and Munro database, Madden and Hardman [1992]found:
k ' 5.24 MPa,
" ' 0.63,
and $ ' &0.78.
These new values, however, did not result in sufficientlysignificant changes to safety factors to warrant changing the oldformula, and they were not used by the industry. Note,however, the increases in values of " and $ and reduction of k.
According to Madden [1991], the squat pillar formula, validonly for pillars with a w/h > 5, is
where R ' pillar w/h ratio,
R0 ' pillar w/h ratio at which formula begins to be valid ' 5.0,
and V ' pillar volume.
Substituting k ' 7.2 MPa, a ' 0.0667, b ' 0.5933, R0 ' 5.0,and g ' 2.5 results in a somewhat simplified form of theformula that is sometimes used:
For quick calculations, equation 4 can be approximated withnegligible error by
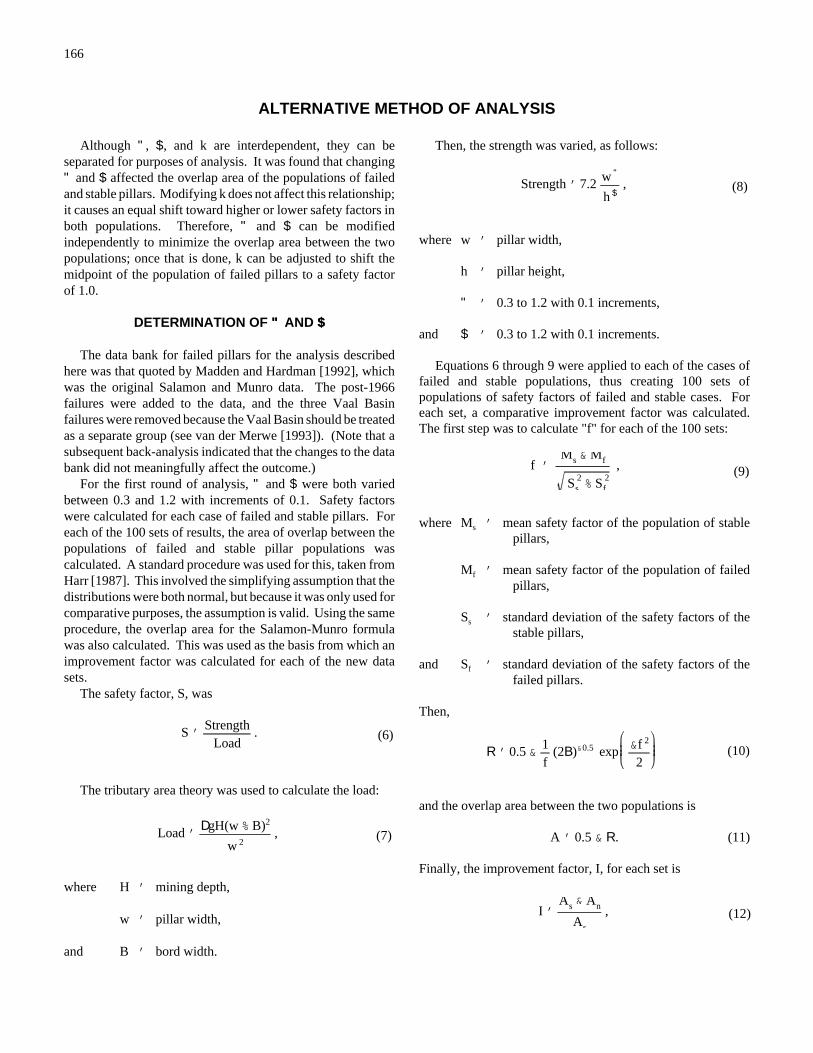
166
S 'Strength
Load. (6)
Load 'DgH(w % B)2
w 2, (7)
Strength ' 7.2 w "
h $, (8)
f 'Ms & Mf
S 2s % S 2
f
, (9)
R ' 0.5 &1f
(2B)&0.5 exp &f 2
2(10)
I 'As & An
As
, (12)
ALTERNATIVE METHOD OF ANALYSIS
Although ", $, and k are interdependent, they can beseparated for purposes of analysis. It was found that changing" and $ affected the overlap area of the populations of failedand stable pillars. Modifying k does not affect this relationship;it causes an equal shift toward higher or lower safety factors inboth populations. Therefore, " and $ can be modifiedindependently to minimize the overlap area between the twopopulations; once that is done, k can be adjusted to shift themidpoint of the population of failed pillars to a safety factorof 1.0.
DETERMINATION OF "" AND $$
The data bank for failed pillars for the analysis describedhere was that quoted by Madden and Hardman [1992], whichwas the original Salamon and Munro data. The post-1966failures were added to the data, and the three Vaal Basinfailures were removed because the Vaal Basin should be treatedas a separate group (see van der Merwe [1993]). (Note that asubsequent back-analysis indicated that the changes to the databank did not meaningfully affect the outcome.)
For the first round of analysis, " and $ were both variedbetween 0.3 and 1.2 with increments of 0.1. Safety factorswere calculated for each case of failed and stable pillars. Foreach of the 100 sets of results, the area of overlap between thepopulations of failed and stable pillar populations wascalculated. A standard procedure was used for this, taken fromHarr [1987]. This involved the simplifying assumption that thedistributions were both normal, but because it was only used forcomparative purposes, the assumption is valid. Using the sameprocedure, the overlap area for the Salamon-Munro formulawas also calculated. This was used as the basis from which animprovement factor was calculated for each of the new datasets.
The safety factor, S, was
The tributary area theory was used to calculate the load:
where H ' mining depth,
w ' pillar width,
and B ' bord width.
Then, the strength was varied, as follows:
where w ' pillar width,
h ' pillar height,
" ' 0.3 to 1.2 with 0.1 increments,
and $ ' 0.3 to 1.2 with 0.1 increments.
Equations 6 through 9 were applied to each of the cases offailed and stable populations, thus creating 100 sets ofpopulations of safety factors of failed and stable cases. Foreach set, a comparative improvement factor was calculated.The first step was to calculate "f" for each of the 100 sets:
where Ms ' mean safety factor of the population of stable pillars,
Mf ' mean safety factor of the population of failed pillars,
Ss ' standard deviation of the safety factors of the stable pillars,
and Sf ' standard deviation of the safety factors of the failed pillars.
Then,
and the overlap area between the two populations is
A ' 0.5 & R. (11)
Finally, the improvement factor, I, for each set is
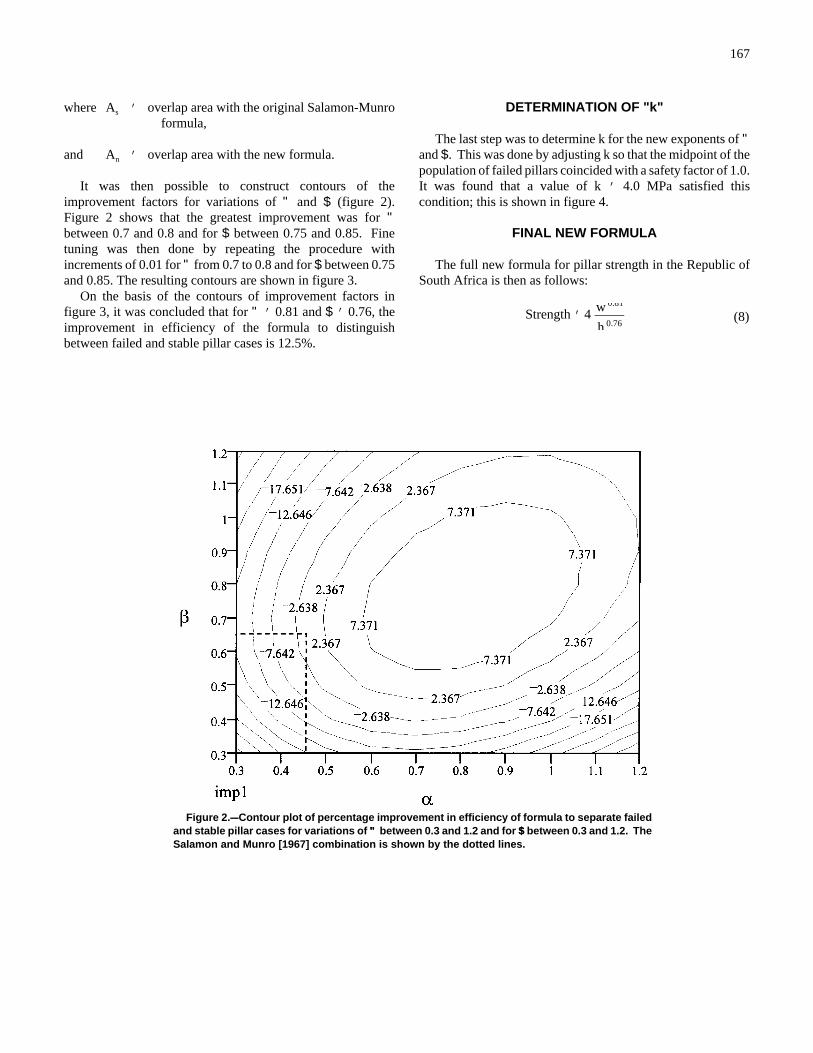
167
Strength ' 4 w 0.81
h 0.76(8)
Figure 2.CCContour plot of percentage improvement in efficiency of formula to separate failedand stable pillar cases for variations of "" between 0.3 and 1.2 and for $$ between 0.3 and 1.2. TheSalamon and Munro [1967] combination is shown by the dotted lines.
where As ' overlap area with the original Salamon-Munro formula,
and An ' overlap area with the new formula.
It was then possible to construct contours of theimprovement factors for variations of " and $ (figure 2).Figure 2 shows that the greatest improvement was for "between 0.7 and 0.8 and for $ between 0.75 and 0.85. Finetuning was then done by repeating the procedure withincrements of 0.01 for " from 0.7 to 0.8 and for $ between 0.75and 0.85. The resulting contours are shown in figure 3.
On the basis of the contours of improvement factors infigure 3, it was concluded that for " ' 0.81 and $ ' 0.76, theimprovement in efficiency of the formula to distinguishbetween failed and stable pillar cases is 12.5%.
DETERMINATION OF "k"
The last step was to determine k for the new exponents of "and $. This was done by adjusting k so that the midpoint of thepopulation of failed pillars coincided with a safety factor of 1.0.It was found that a value of k ' 4.0 MPa satisfied thiscondition; this is shown in figure 4.
FINAL NEW FORMULA
The full new formula for pillar strength in the Republic ofSouth Africa is then as follows:
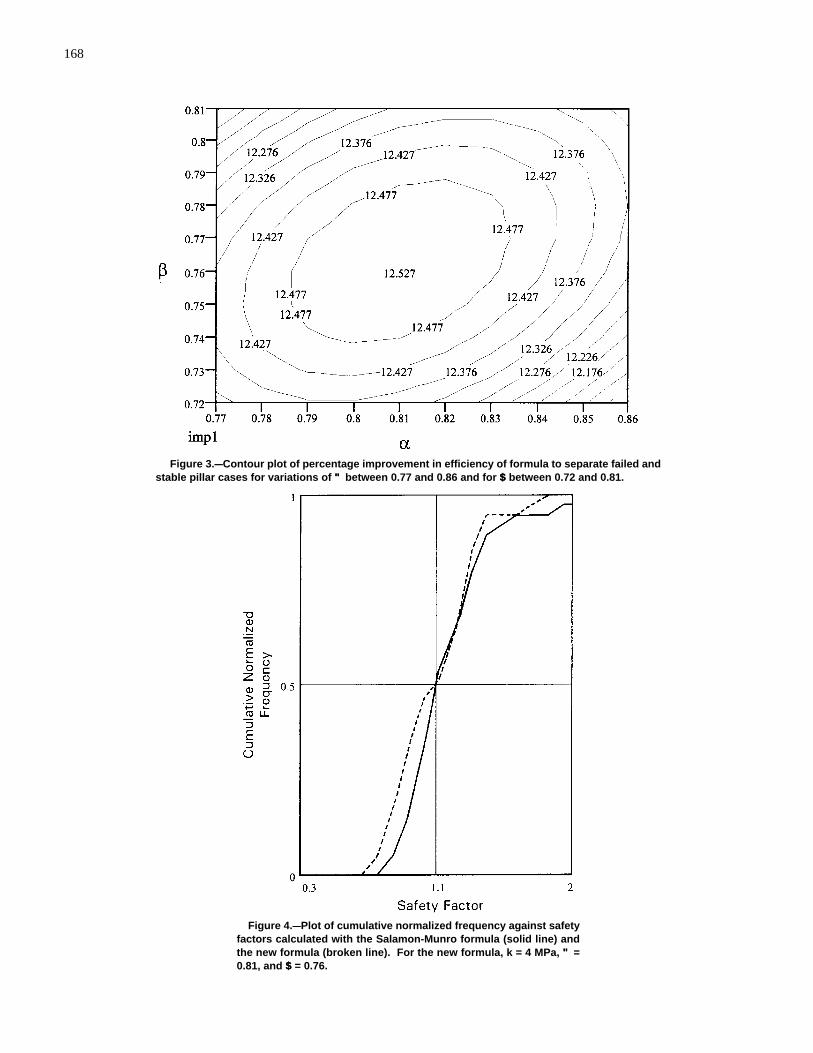
168
Figure 3.CCContour plot of percentage improvement in efficiency of formula to separate failed andstable pillar cases for variations of "" between 0.77 and 0.86 and for $$ between 0.72 and 0.81.
Figure 4.CCPlot of cumulative normalized frequency against safetyfactors calculated with the Salamon-Munro formula (solid line) andthe new formula (broken line). For the new formula, k = 4 MPa, "" =0.81, and $$ = 0.76.
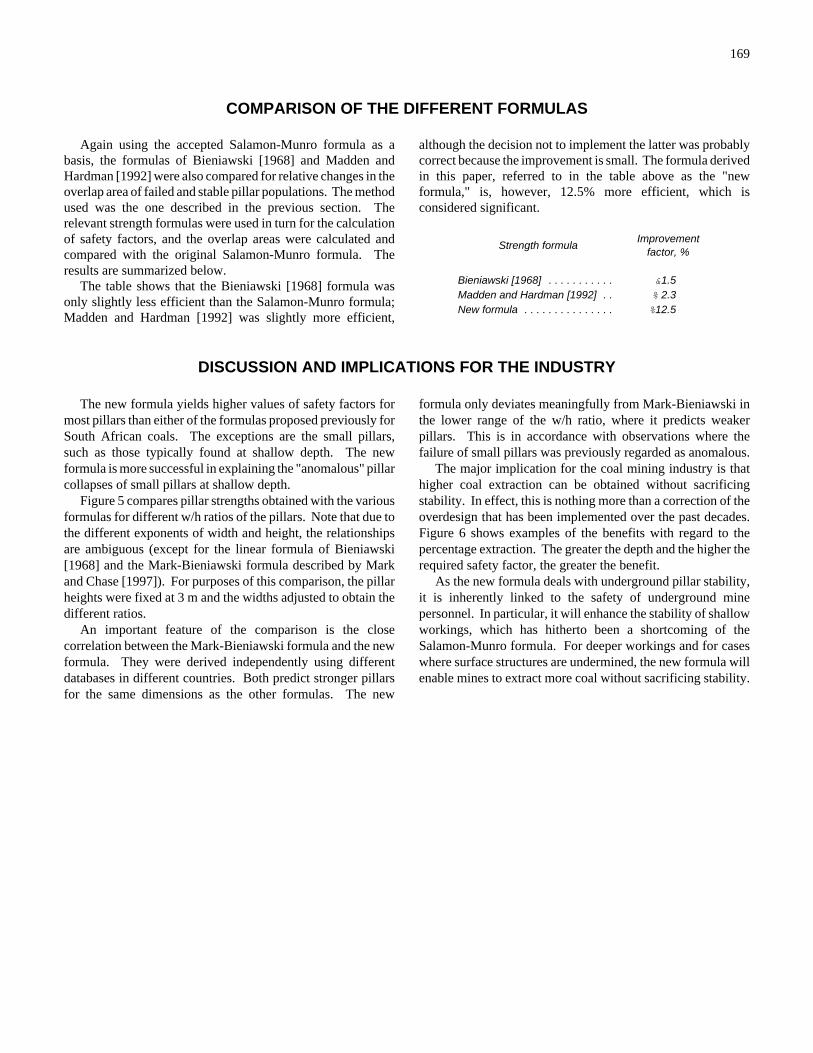
169
COMPARISON OF THE DIFFERENT FORMULAS
Again using the accepted Salamon-Munro formula as abasis, the formulas of Bieniawski [1968] and Madden andHardman [1992] were also compared for relative changes in theoverlap area of failed and stable pillar populations. The methodused was the one described in the previous section. Therelevant strength formulas were used in turn for the calculationof safety factors, and the overlap areas were calculated andcompared with the original Salamon-Munro formula. Theresults are summarized below.
The table shows that the Bieniawski [1968] formula wasonly slightly less efficient than the Salamon-Munro formula;Madden and Hardman [1992] was slightly more efficient,
although the decision not to implement the latter was probablycorrect because the improvement is small. The formula derivedin this paper, referred to in the table above as the "newformula," is, however, 12.5% more efficient, which isconsidered significant.
Strength formulaImprovement
factor, %
Bieniawski [1968] . . . . . . . . . . . &1.5Madden and Hardman [1992] . . % 2.3New formula . . . . . . . . . . . . . . . %12.5
DISCUSSION AND IMPLICATIONS FOR THE INDUSTRY
The new formula yields higher values of safety factors formost pillars than either of the formulas proposed previously forSouth African coals. The exceptions are the small pillars,such as those typically found at shallow depth. The newformula is more successful in explaining the "anomalous" pillarcollapses of small pillars at shallow depth.
Figure 5 compares pillar strengths obtained with the variousformulas for different w/h ratios of the pillars. Note that due tothe different exponents of width and height, the relationshipsare ambiguous (except for the linear formula of Bieniawski[1968] and the Mark-Bieniawski formula described by Markand Chase [1997]). For purposes of this comparison, the pillarheights were fixed at 3 m and the widths adjusted to obtain thedifferent ratios.
An important feature of the comparison is the closecorrelation between the Mark-Bieniawski formula and the newformula. They were derived independently using differentdatabases in different countries. Both predict stronger pillarsfor the same dimensions as the other formulas. The new
formula only deviates meaningfully from Mark-Bieniawski inthe lower range of the w/h ratio, where it predicts weakerpillars. This is in accordance with observations where thefailure of small pillars was previously regarded as anomalous.
The major implication for the coal mining industry is thathigher coal extraction can be obtained without sacrificingstability. In effect, this is nothing more than a correction of theoverdesign that has been implemented over the past decades.Figure 6 shows examples of the benefits with regard to thepercentage extraction. The greater the depth and the higher therequired safety factor, the greater the benefit.
As the new formula deals with underground pillar stability,it is inherently linked to the safety of underground minepersonnel. In particular, it will enhance the stability of shallowworkings, which has hitherto been a shortcoming of theSalamon-Munro formula. For deeper workings and for caseswhere surface structures are undermined, the new formula willenable mines to extract more coal without sacrificing stability.
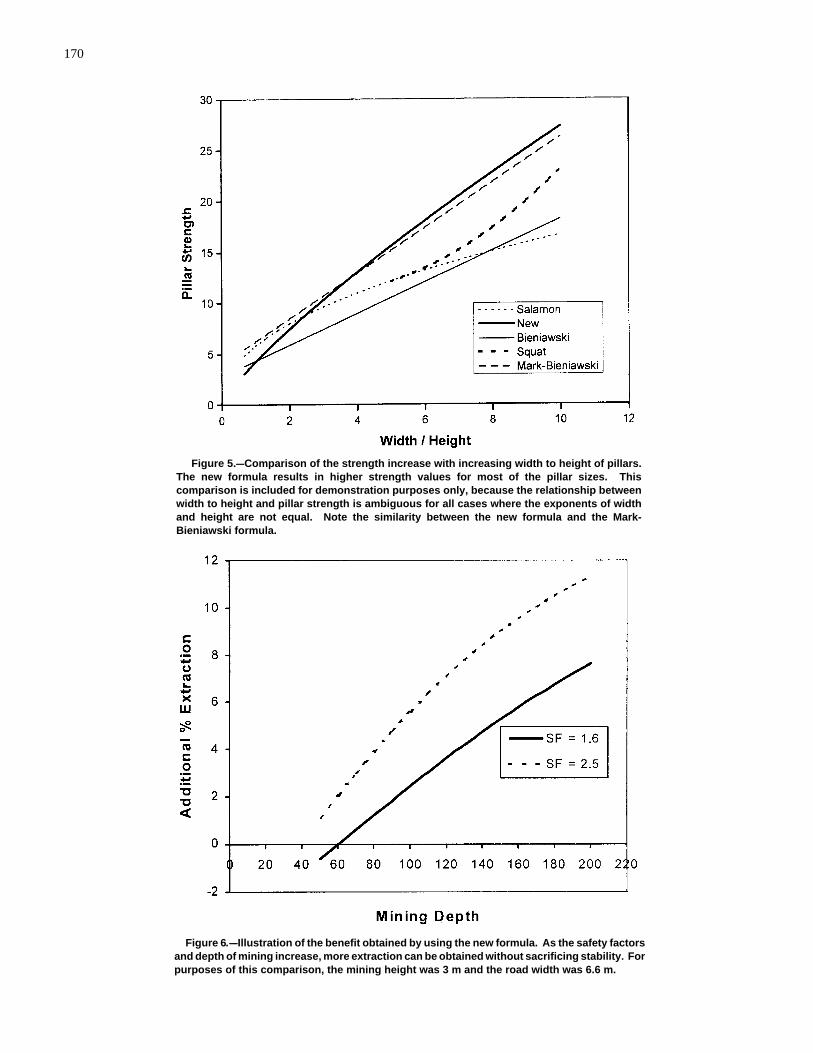
170
Figure 5.CCComparison of the strength increase with increasing width to height of pillars.The new formula results in higher strength values for most of the pillar sizes. Thiscomparison is included for demonstration purposes only, because the relationship betweenwidth to height and pillar strength is ambiguous for all cases where the exponents of widthand height are not equal. Note the similarity between the new formula and the Mark-Bieniawski formula.
Figure 6.CCIllustration of the benefit obtained by using the new formula. As the safety factorsand depth of mining increase, more extraction can be obtained without sacrificing stability. Forpurposes of this comparison, the mining height was 3 m and the road width was 6.6 m.
171
ACKNOWLEDGMENTS
This work is part of a larger research project sponsored by Sasol Mining (Pty.) Ltd., whose support is gratefully acknowledged.
REFERENCES
Bieniawski ZT [1968]. In situ strength and deformation characteristics ofcoal. Eng Geol, Vol. 2, pp. 325-340.
Harr ME [1987]. Reliability-based design in civil engineering. McGraw-Hill Book Co., pp. 130-134.
Madden BJ [1991]. A re-assessment of coal pillar design. J S Afr Inst MinMetall 91(1):27-37.
Madden BJ, Hardman DR [1992]. Long-term stability of bord-and-pillarworkings. In: Proceedings of the Symposium on Construction Over MinedAreas (Pretoria, Republic of South Africa, May 1992). Yeoville, Republic ofSouth Africa: South African Institution of Civil Engineers.
Mark C, Chase FE [1997]. Analysis of retreat mining pillar stability(ARMPS). In: Proceedings - New Technology for Ground Control in RetreatMining. Pittsburgh, PA: U.S. Department of Health and Human Services,Public Health Service, Centers for Disease Control and Prevention, NationalInstitute for Occupational Safety and Health, DHHS (NIOSH) PublicationNo. 97-122, IC 9446, pp. 17-34.
Salamon MDG, Munro AH [1967]. A study of the strength of coal pillars.J S Afr Inst Min Metall Sep:55-67.
Van der Merwe JN [1993]. Revised strength factor for coal in the VaalBasin. J S Afr Inst Min Metall 93(3):71-77.

172
173
THE ROLE OF OVERBURDEN INTEGRITY IN PILLAR FAILURE
By J. Nielen van der Merwe, Ph.D.1
ABSTRACT
The move toward partial pillar extraction versus full pillar extraction has necessitated a new approach tounderground section stability. When pillars are mined too small to support the weight of the overburden, theywill, in some cases, remain stable for a considerable period; in other cases, they will collapse unexpectedly andviolently. There is no discernable difference between the pillar safety factors of the failed and stable cases.The explanation lies in the characteristics of the overburden layers.
A method is proposed that recognizes the overburden characteristics in the evaluation of stability. Twostability factors are calculated: one for the pillars, the other for the overburden. Using this method, it ispossible to make use of the bridging capabilities of overburden layers to prevent pillar collapse. It is possibleto scientifically design partial pillar extraction layouts that will be safe. Using energy considerations, it is alsopossible to prevent violent failure of pillars.
1Managing director, Itasca Africa (Pty.) Ltd., Johannesburg, Republic of South Africa.
174
INTRODUCTION
In order for underground coal pillars to fail completely, tworequirements must be met: (1) the pillars themselves must beloaded to beyond their load-bearing capacity, and (2) theoverburden must deflect sufficiently to totally deform the pil-lars. In the consideration of pillar failure, the first requirementhistorically has received almost all of the attention; only scantmention is sometimes made of the role of the overburden.
Until recently, this has not been necessary. South Africanmining methods, longwalling apart, were either bord-and-pillaror pillar extraction methods with a number of variations. Forbord-and-pillar, the pillars are sufficiently large to support thefull weight of the overburden and the stiffness of the over-burden is a bonus, merely decreasing the load on the pillars. Inpillar extraction, the overburden usually fails completely, al-though there are situations where it is prone to be self-sup-porting for large enough distances to result in overloaded pillarsand the well-known and understood negative consequencesthereof.
Lately, however, there has been a move toward partial pillarextraction with a number of different names attached to themethods, like pillar robbing, pillar splitting, checkerboardextraction, etc. These methods all have in common the partialextraction of pillars, leaving self-supporting snooks (stubs) inthe back area. They are usually larger than the ones left in nor-mal stooping operations. These snooks are often stable for long
periods of time, even though their strengths are less than thatrequired to support the full overburden. This in turn creates theimpression that the pillars are much stronger than the predictionmade with the strength formula.
There have also been occasions where the snooks failed aftera period of time. The author has been involved in investiga-tions into two of these. In both instances, the lack of seriousaccidents can only be ascribed to luck, both having occurred inthe off-shift. In one case, ventilation stoppings were destroyedfor a distance of several kilometers; in the other, the collapseoverran unmined pillars and resulted in severe roof falls up tosix lines of pillars beyond the end of the split pillars.
The difference between the cases that failed and those thatremained stable is not to be found in the strengths of the pillars.The range of safety factors was from 0.5 to 0.7, and the stableones were not the ones with the higher safety factors. The pillarsafety factor alone does not explain stability in these marginalcases. There were, however, significant differences in the over-burden composition and stability. The investigation indicatedthat in the stable cases, the overburden was strong enough tobridge the panels; in the failed cases, the overburdens failed.This resulted in the development of a concept that takes intoaccount the overburden stability as well as pillar stability. Thisconcept will be explained in this paper.
EFFECTS OF MINING ON THE OVERBURDEN
Mining results in increased loads on the unmined pillars.This causes the pillars to compress; the amount of compressionis a function of the additional load on the pillars and the pillar'smodulus of elasticity. The pillar compression is translated intodeflection for the overburden. The higher the pillar loads, thegreater the compression and the more the overburden will de-flect. In the most simplistic view, coal mine overburdens canbe regarded as a series of plates that can be conveniently simpli-fied further to a series of beams in the general case where thepanel lengths are several times greater than the panel widths.
The beam deflection results in induced tensile stress in theupper beam edges and the bottom center of the beam. The mostsimplistic view, adopted here as the starting point for the de-velopment of a more accurate model, is that the beam will failwhen the induced tension exceeds the sum of the virgin hor-izontal stress and the tensile strength of the beam material.
However, it is well known that the overburden, consisting pre-dominantly of sedimentary rock types often supplemented by adolerite sill, is vertically jointed and therefore the tensilestrength of the material can be ignored. Failure will thus occurwhen the induced tensile stress exceeds the virgin horizontalcompressive stress.
The amount of deflection of any individual beam in theoverburden is enhanced by the weight of the material on top ofit and restricted by the resistance of the pillars underneath.There are no major differences in the moduli of the overburdenrocks, dolerite sills apart, and the differential amounts ofbending become a function of the thicknesses of the beams. Inconsidering overburden stability, the identification of thicklithological units therefore is more important than the ratio ofmining depth to panel width.
175
)h ')FEc
h , (1)
Ecf '0.562w
h& 2.293 . (2)
)Fp ' (H 11 & e
& 1 , (3)
0 '(rL
4
32Ert3
, (4)
Ft '(rL
2
2t 2. (5)
Ft '16t)hEr
L 2(6)
MATHEMATICAL RELATIONSHIP BETWEEN PILLAR LOADAND OVERBURDEN DEFLECTION
The link between overburden deflection and pillar load is thepillar compression. The pillar cannot compress by a greateramount than the overburden deflection and vice versa. Themaximum pillar deflection, )h, is
where h ' pillar height,
)F ' load increase caused by mining,
and Ec ' modulus of elasticity of coal.
The above is valid for the situation where the overburden issufficiently soft not to restrict the compression of the pillars.There is general consensus that the modulus of elasticity of coalis around 4 GPa. However, the postfailure modulus is a
function of the pillar shape. According to data supplied by vanHeerden [1975], the postfailure modulus, Ecf, appears to be2
Assuming tributary area loading conditions, the load in-crease on the pillars due to mining is
where H ' mining depth,
e ' areal extraction ratio,
and ( ' Dg.
RELATIONSHIP BETWEEN PILLAR DEFLECTION AND INDUCED TENSIONIN OVERBURDEN BEAM
The generic equation for beam deflection is
where L ' panel width,
Er ' modulus of elasticity of the rock layer,
t ' thickness of the rock layer,
and (r ' unit load on the rock layer.
The generic expression for the maximum generated tensilestress is
By substituting 0 by )h, the tension induced by bending canalso be expressed in terms of the deflection, as follows:
This is the tensile stress that will be generated in theoverburden beam if the restriction to deflection is the resistanceoffered by the pillars underneath. It is also the upper limit ofthe generated tension because the resistance offered by the pil-lars will not allow further deflection. However, the overburdenhas inherent stiffness that will also restrict deflection. Themaximum deflection that an unsupported beam will undergo isindicated by equation 4.
If 0 from equation 4 is greater than )h from equation 1, itmeans that the overburden is dependent on the pillars to restrictdeflection and that the tensile stress generated in the beam isthat found with equation 6. If )h is greater than 0, it meansthat the beam is sufficiently stiff to control its own deflectionand that the tension generated in the beam is that found withequation 5.
2Author's own linear fit to van Heerden's data.
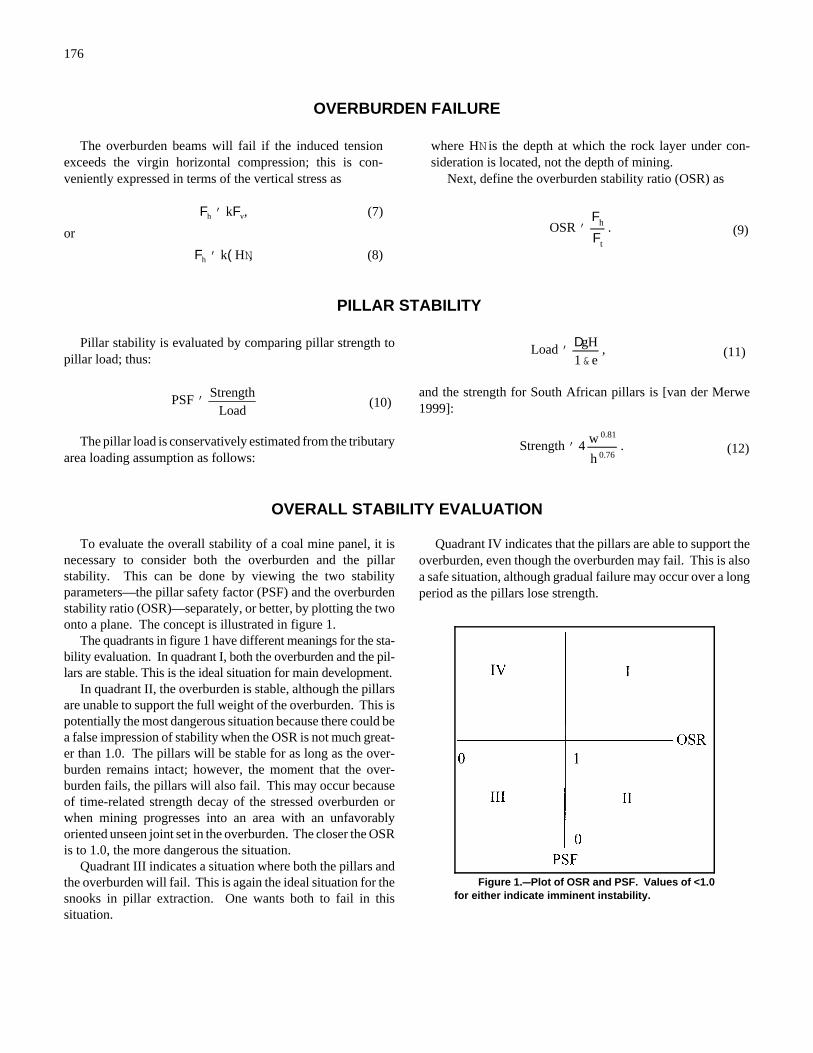
176
OSR 'Fh
Ft
. (9)
PSF 'Strength
Load(10)
Load 'DgH1&e
, (11)
Strength ' 4 w 0.81
h 0.76. (12)
Figure 1.CCPlot of OSR and PSF. Values of <1.0for either indicate imminent instability.
OVERBURDEN FAILURE
The overburden beams will fail if the induced tensionexceeds the virgin horizontal compression; this is con-veniently expressed in terms of the vertical stress as
Fh ' kFv, (7)
or
Fh ' k(HN, (8)
where HN is the depth at which the rock layer under con-sideration is located, not the depth of mining.
Next, define the overburden stability ratio (OSR) as
PILLAR STABILITY
Pillar stability is evaluated by comparing pillar strength topillar load; thus:
The pillar load is conservatively estimated from the tributaryarea loading assumption as follows:
and the strength for South African pillars is [van der Merwe1999]:
OVERALL STABILITY EVALUATION
To evaluate the overall stability of a coal mine panel, it isnecessary to consider both the overburden and the pillarstability. This can be done by viewing the two stabilityparameters—the pillar safety factor (PSF) and the overburdenstability ratio (OSR)—separately, or better, by plotting the twoonto a plane. The concept is illustrated in figure 1.
The quadrants in figure 1 have different meanings for the sta-bility evaluation. In quadrant I, both the overburden and the pil-lars are stable. This is the ideal situation for main development.
In quadrant II, the overburden is stable, although the pillarsare unable to support the full weight of the overburden. This ispotentially the most dangerous situation because there could bea false impression of stability when the OSR is not much great-er than 1.0. The pillars will be stable for as long as the over-burden remains intact; however, the moment that the over-burden fails, the pillars will also fail. This may occur becauseof time-related strength decay of the stressed overburden orwhen mining progresses into an area with an unfavorablyoriented unseen joint set in the overburden. The closer the OSRis to 1.0, the more dangerous the situation.
Quadrant III indicates a situation where both the pillars andthe overburden will fail. This is again the ideal situation for thesnooks in pillar extraction. One wants both to fail in thissituation.
Quadrant IV indicates that the pillars are able to support theoverburden, even though the overburden may fail. This is alsoa safe situation, although gradual failure may occur over a longperiod as the pillars lose strength.
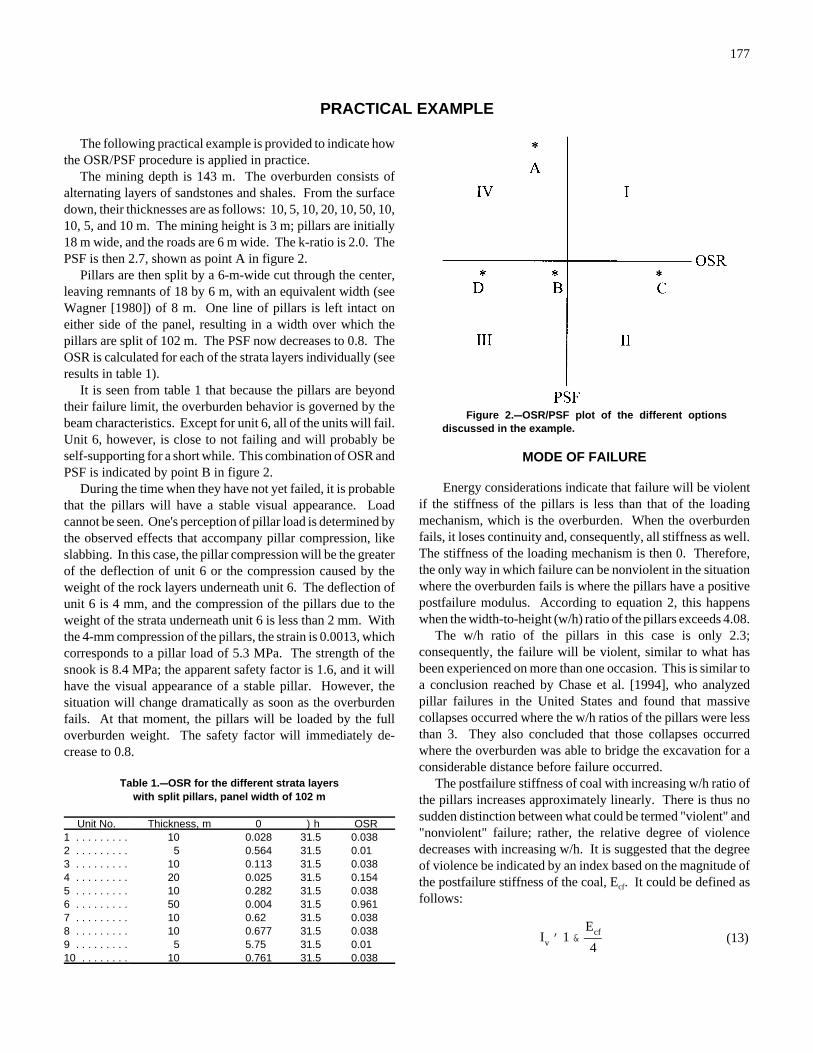
177
Iv ' 1 &Ecf
4(13)
Figure 2.CCOSR/PSF plot of the different optionsdiscussed in the example.
PRACTICAL EXAMPLE
The following practical example is provided to indicate howthe OSR/PSF procedure is applied in practice.
The mining depth is 143 m. The overburden consists ofalternating layers of sandstones and shales. From the surfacedown, their thicknesses are as follows: 10, 5, 10, 20, 10, 50, 10,10, 5, and 10 m. The mining height is 3 m; pillars are initially18 m wide, and the roads are 6 m wide. The k-ratio is 2.0. ThePSF is then 2.7, shown as point A in figure 2.
Pillars are then split by a 6-m-wide cut through the center,leaving remnants of 18 by 6 m, with an equivalent width (seeWagner [1980]) of 8 m. One line of pillars is left intact oneither side of the panel, resulting in a width over which thepillars are split of 102 m. The PSF now decreases to 0.8. TheOSR is calculated for each of the strata layers individually (seeresults in table 1).
It is seen from table 1 that because the pillars are beyondtheir failure limit, the overburden behavior is governed by thebeam characteristics. Except for unit 6, all of the units will fail.Unit 6, however, is close to not failing and will probably beself-supporting for a short while. This combination of OSR andPSF is indicated by point B in figure 2.
During the time when they have not yet failed, it is probablethat the pillars will have a stable visual appearance. Loadcannot be seen. One's perception of pillar load is determined bythe observed effects that accompany pillar compression, likeslabbing. In this case, the pillar compression will be the greaterof the deflection of unit 6 or the compression caused by theweight of the rock layers underneath unit 6. The deflection ofunit 6 is 4 mm, and the compression of the pillars due to theweight of the strata underneath unit 6 is less than 2 mm. Withthe 4-mm compression of the pillars, the strain is 0.0013, whichcorresponds to a pillar load of 5.3 MPa. The strength of thesnook is 8.4 MPa; the apparent safety factor is 1.6, and it willhave the visual appearance of a stable pillar. However, thesituation will change dramatically as soon as the overburdenfails. At that moment, the pillars will be loaded by the fulloverburden weight. The safety factor will immediately de-crease to 0.8.
Table 1.CCOSR for the different strata layerswith split pillars, panel width of 102 m
Unit No. Thickness, m 0 )h OSR1 . . . . . . . . . 10 0.028 31.5 0.0382 . . . . . . . . . 5 0.564 31.5 0.013 . . . . . . . . . 10 0.113 31.5 0.0384 . . . . . . . . . 20 0.025 31.5 0.1545 . . . . . . . . . 10 0.282 31.5 0.0386 . . . . . . . . . 50 0.004 31.5 0.9617 . . . . . . . . . 10 0.62 31.5 0.0388 . . . . . . . . . 10 0.677 31.5 0.0389 . . . . . . . . . 5 5.75 31.5 0.0110 . . . . . . . . 10 0.761 31.5 0.038
MODE OF FAILURE
Energy considerations indicate that failure will be violentif the stiffness of the pillars is less than that of the loadingmechanism, which is the overburden. When the overburdenfails, it loses continuity and, consequently, all stiffness as well.The stiffness of the loading mechanism is then 0. Therefore,the only way in which failure can be nonviolent in the situationwhere the overburden fails is where the pillars have a positivepostfailure modulus. According to equation 2, this happenswhen the width-to-height (w/h) ratio of the pillars exceeds 4.08.
The w/h ratio of the pillars in this case is only 2.3;consequently, the failure will be violent, similar to what hasbeen experienced on more than one occasion. This is similar toa conclusion reached by Chase et al. [1994], who analyzedpillar failures in the United States and found that massivecollapses occurred where the w/h ratios of the pillars were lessthan 3. They also concluded that those collapses occurredwhere the overburden was able to bridge the excavation for aconsiderable distance before failure occurred.
The postfailure stiffness of coal with increasing w/h ratio ofthe pillars increases approximately linearly. There is thus nosudden distinction between what could be termed "violent" and"nonviolent" failure; rather, the relative degree of violencedecreases with increasing w/h. It is suggested that the degreeof violence be indicated by an index based on the magnitude ofthe postfailure stiffness of the coal, Ecf. It could be defined asfollows:
178
With the limited information at hand, mainly that of Chaseet al. [1994], it appears that if Iv > 1.15, the failure may resultin a dangerous situation. This obviously also depends on thearea involved.
By substituting equation 2 into equation 13, the relativedegree of violence may be expressed in terms of the w/h ratioas follows:
Iv ' 1.57 & 0.14 w/h (14)
CONTROL MEASURES
There are a number of ways in which pillar splittingsituations can be controlled using the OSR/PSF. One is to limitthe width over which the pillars are split. For instance, if thewidth in the example is limited to 78 m (i.e., by splitting onlythree lines of pillars), the OSR of unit 6 increases to 1.6 and
there is a much higher probability that the unit will remain to beself-supporting, if only for a longer time. Note that when thisis done, the PSF is not affected; it remains at a value of 0.8.This situation is indicated by point C in figure 2. Thiscorresponds to other situations that have been observed, i.e.,where split pillars with low apparent safety factors remainstable for considerable periods of time.
A second alternative is to do full extraction of every secondpillar on a checkerboard pattern, leaving the alternating pillarsintact. When this is done, the PSF decreases to 0.7. The OSRof the strongest unit, No. 6, is 0.3, indicating failure of the over-burden. This is shown as point D in figure 2. However, thew/h ratio of the pillars is 6.0, which means that the pillars willnot fail violently. The attraction of this option is that 50% of allof the coal contained in pillars is extracted, as opposed to 17%using the method in the previous paragraph.
INFLUENCE OF GEOLOGY
A cautionary note must be expressed at this point. Theprocess of pillar failure for low safety factor pillars is driven bythe overburden characteristics. It is thus very important to havedetailed knowledge of the overburden composition. For instance,if the thickness of unit 6 in the example is 40 m instead of 50 m,then the control measure to restrict the number of pillars to besplit to 78 m will not be effective; the OSR in that case will be1.0, which places it back into the category with the highestuncertainty. The example in the previous section is nothing morethan an example to illustrate the application of the method: it isnot to be viewed as a guideline for panel widths, etc.
The full application of the method will require the es-tablishment of guidelines for limit values of OSR and PSF. Itseems reasonable to assume that there will be an area in thecenter of the plot shown in figure 1 that is to be avoided—thearea of highest uncertainty, where the values of OSR and PSFare close to 1.0. Those limits need to be established; the bestway of doing that will probably be through back-analysis inareas where there are examples of failed and stable cases fordifferent periods of time.
CONCLUSIONS
• For underground workings to collapse, both the pillars andthe overburden must fail. The model described here, simplifiedas it is, offers a method to evaluate the stability of pillarworkings with low pillar safety factors by adding an evaluationof overburden stability to the evaluation of pillar stability.
• Even if the pillars are not strong enough to support theoverburden, it is possible to prevent collapse by limiting thepanel width, thereby allowing the overburden to be self-supporting.
• Refinement of the model will enable the scientific designof alternatives to full pillar extraction, avoiding the situation
where apparent stability caused by temporary bridging of theoverburden leads to a false sense of security, only to befollowed by catastrophic collapse.
• Quantification of the energy considerations can be done,leading to a design that will result in nonviolent failure ofpillars.
• These conclusions are broadly similar to those reached byChase et al. [1994]. The main difference is that this work offersa simple method of classifying the likelihood of failureoccurring and the mode of failure should it occur.
ACKNOWLEDGMENTS
This work is part of a larger research project sponsored by Sasol Mining (Pty.) Ltd., whose support is gratefully acknowledged.

179
REFERENCES
Chase FE, Zipf RK Jr., Mark C [1994]. The massive collapse of coalpillars: case histories from the United States. In: Peng SS, ed. Proceedings ofthe 13th International Conference on Ground Control in Mining. Morgantown,WV: West Virginia University, pp. 69-80.
Van der Merwe JN [1999]. New strength formula for coal pillars in SouthAfrica. In: Proceedings of the Second International Workshop on Coal PillarMechanics and Design. Pittsburgh, PA: U.S. Department of Health and
Human Services, Public Health Service, Centers for Disease Control andPrevention, National Institute for Occupational Safety and Health, DHHS(NIOSH) Publication No. 99-114, IC 9448.
Van Heerden WL [1975]. In situ determination of complete stress-straincharacteristics of large coal specimens. J S Afr Inst Min Metall 75(8):207-217.
Wagner H [1980]. Pillar design in coal mines. J S Afr Inst Min Metall80:37-45.

181
USING A POSTFAILURE STABILITY CRITERION IN PILLAR DESIGN
By R. Karl Zipf, Jr., Ph.D.1
ABSTRACT
Use of Salamon's stability criterion in underground mine design can prevent the occurrence of catastrophic domino-type pillarfailure. Evaluating the criterion requires computation of the local mine stiffness and knowledge of the postfailure behavior ofpillars. This paper summarizes the status of the practical use of this important criterion and suggests important research toimprove our capabilities.
Analytical and numerical methods are used to compute the local mine stiffness. Work to date in computing local minestiffness relies mainly on elastic continuum models. Further work might investigate local mine stiffness in a discontinuous rockmass using alternative numerical methods.
Existing postfailure data for coal pillars are summarized, and a simple relationship for determining the postfailure modulusand stiffness of coal pillars is proposed. Little actual postfailure data for noncoal pillars are available; however, numerical modelscan provide an estimate of postfailure stiffness. Important factors controlling postfailure stiffness of rock pillars include thepostfailure modulus of the material, end conditions, and width-to-height ratio.
Studies show that the nature of the failure process after strength is exceeded can be predicted with numerical models usingSalamon's stability criterion; therefore, a method exists to decrease the risk of this type of catastrophic failure. However, thegeneral lack of good data on the postfailure behavior of actual mine pillars is a major obstacle. Additional back-analyses of failedand stable case histories in conjunction with laboratory testing and numerical modeling are essential to improve our ability toapply the stability criterion.
1Assistant professor, Department of Mining Engineering, University of Missouri-Rolla.
182
INTRODUCTION
As first noted by Cook and Hojem [1966], whether a testspecimen in the laboratory explodes violently or crushesbenignly depends on the stiffness of the testing system relativeto the postfailure stiffness of the specimen. Full-scale pillars inmines behave similarly. Salamon [1970] developed the localmine stiffness stability criterion, which formalizes mathe-atically laboratory and field observations of pillar behavior inthe postfailure condition. Although we understand theprinciples well, little is known by direct observation or back-calculation about the postfailure behavior of actual mine pillars.
The local mine stiffness stability criterion governs themechanics of cascading pillar failure (CPF) [Swanson andBoler 1995], also known as progressive pillar failure, massiveroof collapse, domino-type pillar failure, or pillar run. In thistype of failure, when one pillar collapses, the load it carriestransfers rapidly to its neighbors, causing them to fail and soforth. This failure mechanism can lead to the rapid collapse ofvery large mine areas. In mild cases, only a few tens of pillarsfail; in extreme cases, hundreds, even thousands of pillars canfail.
Recent work by Chase et al. [1994] and by Zipf and Mark[1997] document 13 case histories of this failure mechanism incoal mines and 6 case histories in metal/nonmetal mines withinthe United States. Further work by Zipf [in press] has analyzedadditional examples of this failure mechanism in thecatastrophic collapse of web pillars in highwall miningoperations. Reports by Swanson and Boler [1995], Ferriteret al. [1996], and Zipf and Swanson [in press] document theevents and present analyses of the partial collapse at a tronamine in southwestern Wyoming, where one of the largestexamples of this failure mechanism occurred.
Numerous instances of CPF have occurred in other parts ofthe world. The most infamous case is the Coalbrook disaster inthe Republic of South Africa in which 437 miners perishedwhen 2 km2 of the mine collapsed within a few minutes onJanuary 21, 1960 [Bryan et al. 1966]. Other instances occurred
recently at a coal mine in Russia and a large potash mine inGermany.
These collapses draw public interest for two reasons. Firstand foremost, a collapse presents an extreme safety hazard tominers. Obviously, the collapse area itself is the greatesthazard, but the collapse usually induces a devastating airblastdue to displacement of air from the collapse area. An airblastcan totally disrupt a mine's ventilation system by destroyingventilation stoppings, seals, and fan housings. Flying debriscan seriously injure or kill mining personnel. The failureusually fractures a large volume of rock in the pillars andimmediate roof and floor. In coal and certain other mines, thissudden rock fragmentation can release a substantial quantity ofmethane into the mine atmosphere that could result in anexplosion.
Secondly, large mine collapses emit substantial seismicenergy indicative of an implosional failure mechanism. Forexample, the seismic event associated with the collapse insouthwestern Wyoming had a local magnitude of 5.3 [Swansonand Boler 1995]. Strong seismic signals of this type receivescrutiny from the international community because of U.S.obligations under the Comprehensive Test Ban Treaty (CTBT).Large collapses may initiate questions from the FederalGovernment and could result in further questions from othernations participating in the CTBT [Casey 1998; Heuze 1996].
The pillar failure mechanism considered in this paper (CPFor domino-type pillar failure) should not be confused with coalmine bumps and rock bursts, although both failure types arefrequently associated with large seismic energy releases.Although the damage can seem similar, the underlyingmechanics are completely different. The mechanism of pillarcollapse largely depends on vertical stress and the postfailureproperties of pillars. The mechanism for coal mine bumps androck bursts is more complex. In these events, larger failures(seismic events) in the surrounding rock mass induce severedamage in susceptible mine workings.
LOCAL MINE STIFFNESS STABILITY CRITERION
When the applied stress on a pillar equals its strength, thenthe "safety factor" defined as the ratio strength over stressequals 1. Beyond peak strength when the strength criterion isexceeded, the pillar enters the postfailure regime, and the failureprocess is either stable or unstable. In this paper, stability refers
to the nature of the failure process after pillar strength isexceeded. Based on the analogy between laboratory testspecimens and mine pillars, Salamon [1970] developed acriterion to predict stable or unstable failure of mine pillars.Figure 1 illustrates this well-known criterion.

183
Figure 1.CCUnstable, violent failure versus stable, nonviolent failure. Loading machine stiffness or local minestiffness is represented by the downward sloping line intersecting the pillar load convergence (stress-strain) curve.A, Loading machine stiffness less than postfailure stiffness in a "soft" loading system. B, Loading machine stiffnessgreater than postfailure stiffness in a "stiff" loading system.
Figure 2.CCBoth cases violate the local mine stiffness stability criterion, i.e., **KLMS ** < **Kp**. A, Slow squeezeresults when **KLMS ** < **Kp**. B, Rapid CPF results when **KLMS ** « **Kp**.
Stable, nonviolent failure occurs when
|KLMS| > |KP|
and unstable, violent failure occurs when
|KLMS| < |KP|,
where |KLMS| is the absolute value of the local mine stiffness and|KP| is the absolute value of the postfailure stiffness at any pointalong the load convergence curve for a pillar. As long as thiscriterion is satisfied, CPF (domino-type pillar failure) cannotoccur; however, when the criterion is violated, then unstablefailure is possible.
Salamon's local mine stiffness stability criterion does notinclude the time variable and thus does not predict the rapidityof an unstable failure should it occur. CPF resides at the far endof the unstable pillar failure spectrum. At the other end areslow "squeezes" that develop over days or weeks. Workers andmachinery have ample time to get out of the way of the failure.In a CPF, the failure is so rapid that workers and machinerycannot evacuate in time. Both CPF and squeezes violate astrength criterion and, somewhat later, the stability criterion;thus, unstable pillar failure can proceed. The rapidity of afailure may depend on the degree to which the local minestiffness stability criterion is violated, i.e., the magnitude of thedifference between KLMS and KP, as shown in figure 2.
184
KLMS ')P)D
'(Su & Sp )A
Du & Dp
,
COMPUTING LOCAL MINE STIFFNESS
The local mine stiffness KLMS relates deformation in the rockmass to changes in force on the rock mass. Force changesoccur as stresses in the mined-out rock go from in situ values tozero as a result of mining. Deformations then occur in the rockmass. If a given amount of mining (and force change) resultsin small deformations, the system is "stiff"; if the resultingdeformations are large, the system is "soft." The magnitude ofthe local mine stiffness depends in part on the modulus of therock mass and in part on the geometry of the miningexcavations. In general, the more rock that is mined out, thesofter the system. Obtaining direct measurements of the localmine stiffness is generally not possible, since it is more of amathematical entity than a measurable quantity for a rock mass.Numerical or analytical methods are employed to evaluate it foruse in the stability criterion.
Figure 3 illustrates the behavior of the local mine stiffnessfor different mine layouts. This hypothetical example consistsof an array of long narrow openings separated by similar pillars.An opening width to pillar width of 3 is assumed, implying75% extraction. As the number of pillars increases from 3 to15, stress concentration on the central pillar approaches itstheoretical maximum of 4, and the local mine stiffnessdecreases as the panel widens. Local mine stiffness decreasesas the extraction ratio increases. At sufficient panel width andhigh enough extraction, local mine stiffness decreases to zero,which is the worst possible condition for failure stability sinceit corresponds to pure dead-weight loading. If failure occurs,its nature is unstable and possibly violent.
An expression for local mine stiffness is
where )P ' change in force,
)D ' change in displacement,
Su ' unperturbed stress,
Sp ' perturbed stress,
Du ' unperturbed displacements,
Dp ' perturbed displacements,
and A ' element area.
This expression is easily implemented into boundary-element programs such as MULSIM/NL [Zipf 1992a,b; 1996],LAMODEL [Heasley 1997, 1998], and similar programs.Changes in stress and displacement are noted between adjacentmining steps, i.e., the "unperturbed" and "perturbed" state. Byway of example, to compute the local mine stiffness associatedwith a pillar, first stresses and displacements are calculated ateach element in the model in the usual way, giving the so-calledunperturbed stresses and displacements. The pillar is thenremoved and all of the stresses and displacements arerecomputed, giving the so-called perturbed stresses anddisplacements. In this case, Sp is identically zero. Local minestiffness KLMS is then calculated with the expression above.
Other numerical models can also be used to calculate KLMS.Recent studies of web pillar collapses in highwall miningsystems [Zipf, in press] used FLAC2 to calculate local minestiffness. Two-dimensional models of the web pillar geometrywere used for the initial stress and displacement calculations.All elements comprising one pillar were removed, and stressesand displacements were recomputed. Sp is identically zero atthe mined-out pillar. Local mine stiffness for the pillar is thenevaluated for the pillar. When using FLAC, a simple FISHfunction can be constructed to facilitate the numericalcomputations.
2Fast Langrangian Analysis of Continuum, Itasca Corp., Minneapolis, MN.
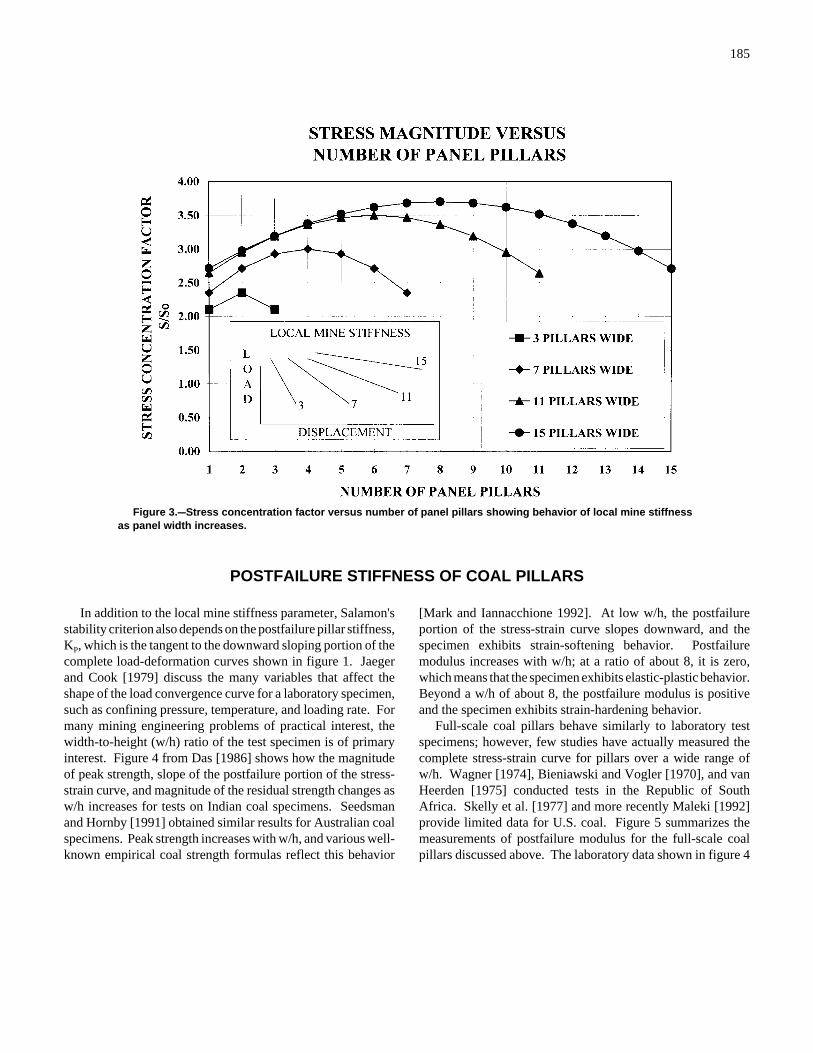
185
Figure 3.CCStress concentration factor versus number of panel pillars showing behavior of local mine stiffnessas panel width increases.
POSTFAILURE STIFFNESS OF COAL PILLARS
In addition to the local mine stiffness parameter, Salamon'sstability criterion also depends on the postfailure pillar stiffness,KP, which is the tangent to the downward sloping portion of thecomplete load-deformation curves shown in figure 1. Jaegerand Cook [1979] discuss the many variables that affect theshape of the load convergence curve for a laboratory specimen,such as confining pressure, temperature, and loading rate. Formany mining engineering problems of practical interest, thewidth-to-height (w/h) ratio of the test specimen is of primaryinterest. Figure 4 from Das [1986] shows how the magnitudeof peak strength, slope of the postfailure portion of the stress-strain curve, and magnitude of the residual strength changes asw/h increases for tests on Indian coal specimens. Seedsmanand Hornby [1991] obtained similar results for Australian coalspecimens. Peak strength increases with w/h, and various well-known empirical coal strength formulas reflect this behavior
[Mark and Iannacchione 1992]. At low w/h, the postfailureportion of the stress-strain curve slopes downward, and thespecimen exhibits strain-softening behavior. Postfailuremodulus increases with w/h; at a ratio of about 8, it is zero,which means that the specimen exhibits elastic-plastic behavior.Beyond a w/h of about 8, the postfailure modulus is positiveand the specimen exhibits strain-hardening behavior.
Full-scale coal pillars behave similarly to laboratory testspecimens; however, few studies have actually measured thecomplete stress-strain curve for pillars over a wide range ofw/h. Wagner [1974], Bieniawski and Vogler [1970], and vanHeerden [1975] conducted tests in the Republic of SouthAfrica. Skelly et al. [1977] and more recently Maleki [1992]provide limited data for U.S. coal. Figure 5 summarizes themeasurements of postfailure modulus for the full-scale coalpillars discussed above. The laboratory data shown in figure 4
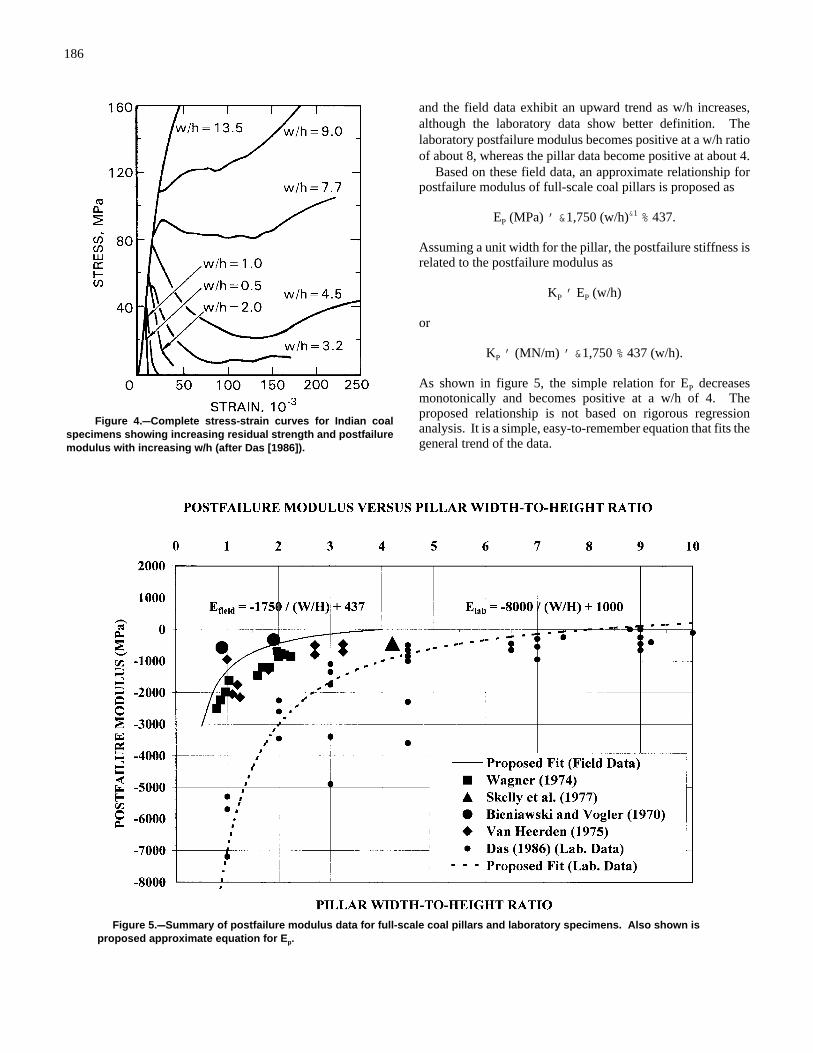
186
Figure 4.CCComplete stress-strain curves for Indian coalspecimens showing increasing residual strength and postfailuremodulus with increasing w/h (after Das [1986]).
Figure 5.CCSummary of postfailure modulus data for full-scale coal pillars and laboratory specimens. Also shown isproposed approximate equation for Ep.
and the field data exhibit an upward trend as w/h increases,although the laboratory data show better definition. Thelaboratory postfailure modulus becomes positive at a w/h ratioof about 8, whereas the pillar data become positive at about 4.
Based on these field data, an approximate relationship forpostfailure modulus of full-scale coal pillars is proposed as
EP (MPa) ' &1,750 (w/h)&1 % 437.
Assuming a unit width for the pillar, the postfailure stiffness isrelated to the postfailure modulus as
KP ' EP (w/h)
or
KP ' (MN/m) ' &1,750 % 437 (w/h).
As shown in figure 5, the simple relation for EP decreasesmonotonically and becomes positive at a w/h of 4. Theproposed relationship is not based on rigorous regressionanalysis. It is a simple, easy-to-remember equation that fits thegeneral trend of the data.
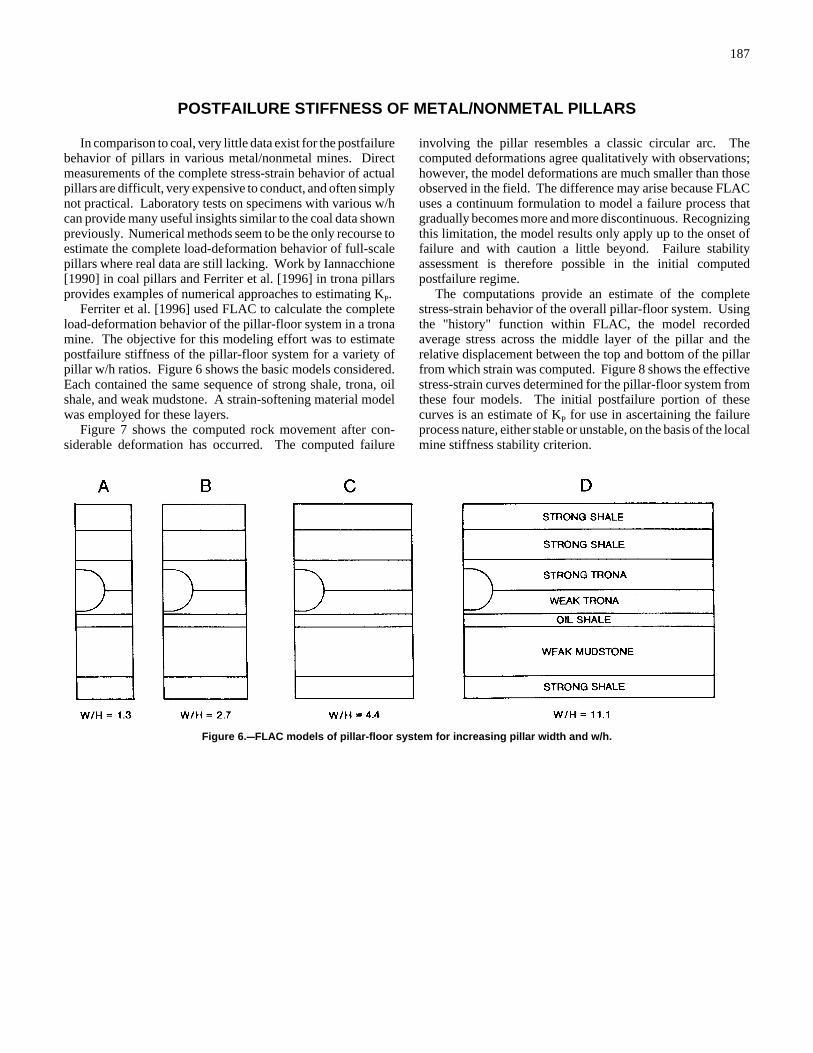
187
Figure 6.CCFLAC models of pillar-floor system for increasing pillar width and w/h.
POSTFAILURE STIFFNESS OF METAL/NONMETAL PILLARS
In comparison to coal, very little data exist for the postfailurebehavior of pillars in various metal/nonmetal mines. Directmeasurements of the complete stress-strain behavior of actualpillars are difficult, very expensive to conduct, and often simplynot practical. Laboratory tests on specimens with various w/hcan provide many useful insights similar to the coal data shownpreviously. Numerical methods seem to be the only recourse toestimate the complete load-deformation behavior of full-scalepillars where real data are still lacking. Work by Iannacchione[1990] in coal pillars and Ferriter et al. [1996] in trona pillarsprovides examples of numerical approaches to estimating KP.
Ferriter et al. [1996] used FLAC to calculate the completeload-deformation behavior of the pillar-floor system in a tronamine. The objective for this modeling effort was to estimatepostfailure stiffness of the pillar-floor system for a variety ofpillar w/h ratios. Figure 6 shows the basic models considered.Each contained the same sequence of strong shale, trona, oilshale, and weak mudstone. A strain-softening material modelwas employed for these layers.
Figure 7 shows the computed rock movement after con-siderable deformation has occurred. The computed failure
involving the pillar resembles a classic circular arc. Thecomputed deformations agree qualitatively with observations;however, the model deformations are much smaller than thoseobserved in the field. The difference may arise because FLACuses a continuum formulation to model a failure process thatgradually becomes more and more discontinuous. Recognizingthis limitation, the model results only apply up to the onset offailure and with caution a little beyond. Failure stabilityassessment is therefore possible in the initial computedpostfailure regime.
The computations provide an estimate of the completestress-strain behavior of the overall pillar-floor system. Usingthe "history" function within FLAC, the model recordedaverage stress across the middle layer of the pillar and therelative displacement between the top and bottom of the pillarfrom which strain was computed. Figure 8 shows the effectivestress-strain curves determined for the pillar-floor system fromthese four models. The initial postfailure portion of thesecurves is an estimate of KP for use in ascertaining the failureprocess nature, either stable or unstable, on the basis of the localmine stiffness stability criterion.
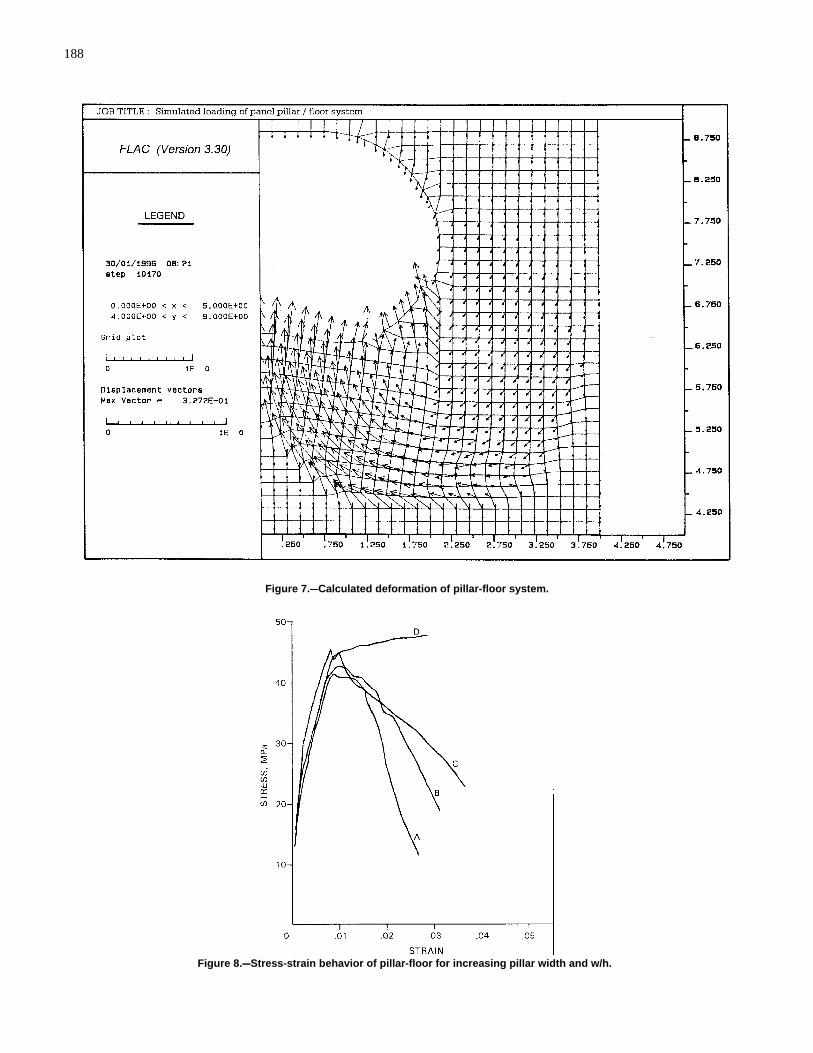
188
Figure 7.CCCalculated deformation of pillar-floor system.
Figure 8.CCStress-strain behavior of pillar-floor for increasing pillar width and w/h.
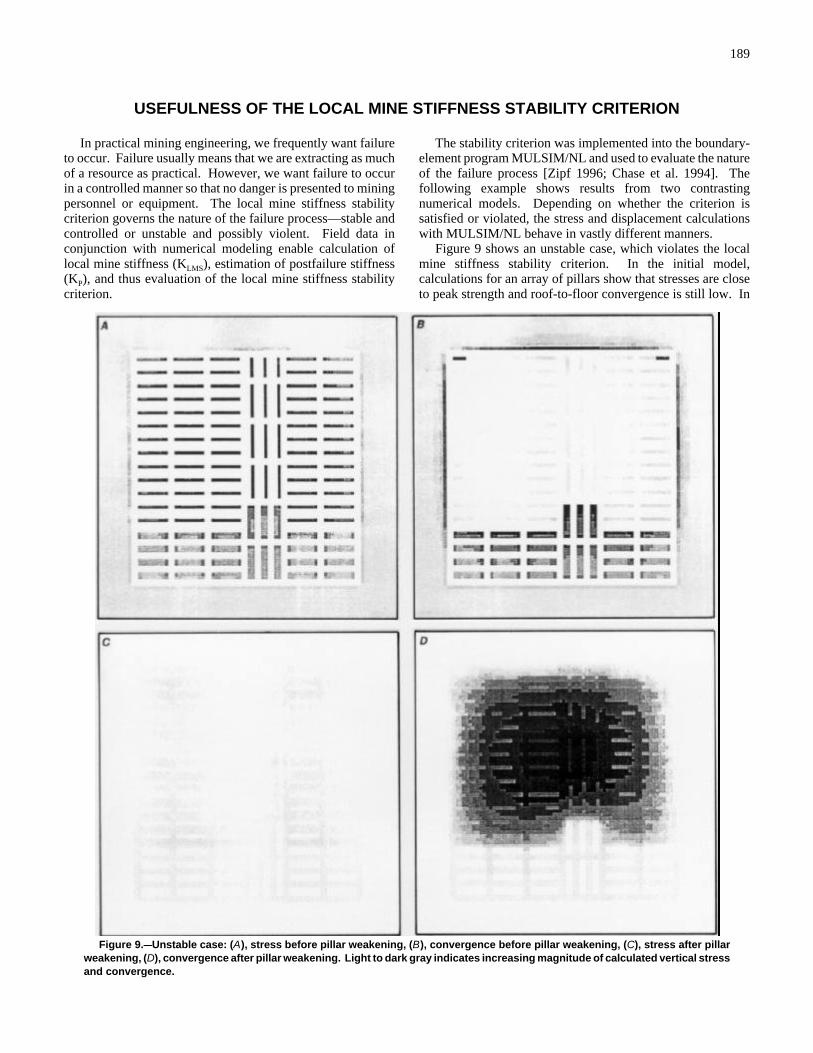
189
Figure 9.CCUnstable case: (A), stress before pillar weakening, (B), convergence before pillar weakening, (C), stress after pillarweakening, (D), convergence after pillar weakening. Light to dark gray indicates increasing magnitude of calculated vertical stressand convergence.
USEFULNESS OF THE LOCAL MINE STIFFNESS STABILITY CRITERION
In practical mining engineering, we frequently want failureto occur. Failure usually means that we are extracting as muchof a resource as practical. However, we want failure to occurin a controlled manner so that no danger is presented to miningpersonnel or equipment. The local mine stiffness stabilitycriterion governs the nature of the failure process—stable andcontrolled or unstable and possibly violent. Field data inconjunction with numerical modeling enable calculation oflocal mine stiffness (KLMS), estimation of postfailure stiffness(KP), and thus evaluation of the local mine stiffness stabilitycriterion.
The stability criterion was implemented into the boundary-element program MULSIM/NL and used to evaluate the natureof the failure process [Zipf 1996; Chase et al. 1994]. Thefollowing example shows results from two contrastingnumerical models. Depending on whether the criterion issatisfied or violated, the stress and displacement calculationswith MULSIM/NL behave in vastly different manners.
Figure 9 shows an unstable case, which violates the localmine stiffness stability criterion. In the initial model,calculations for an array of pillars show that stresses are closeto peak strength and roof-to-floor convergence is still low. In
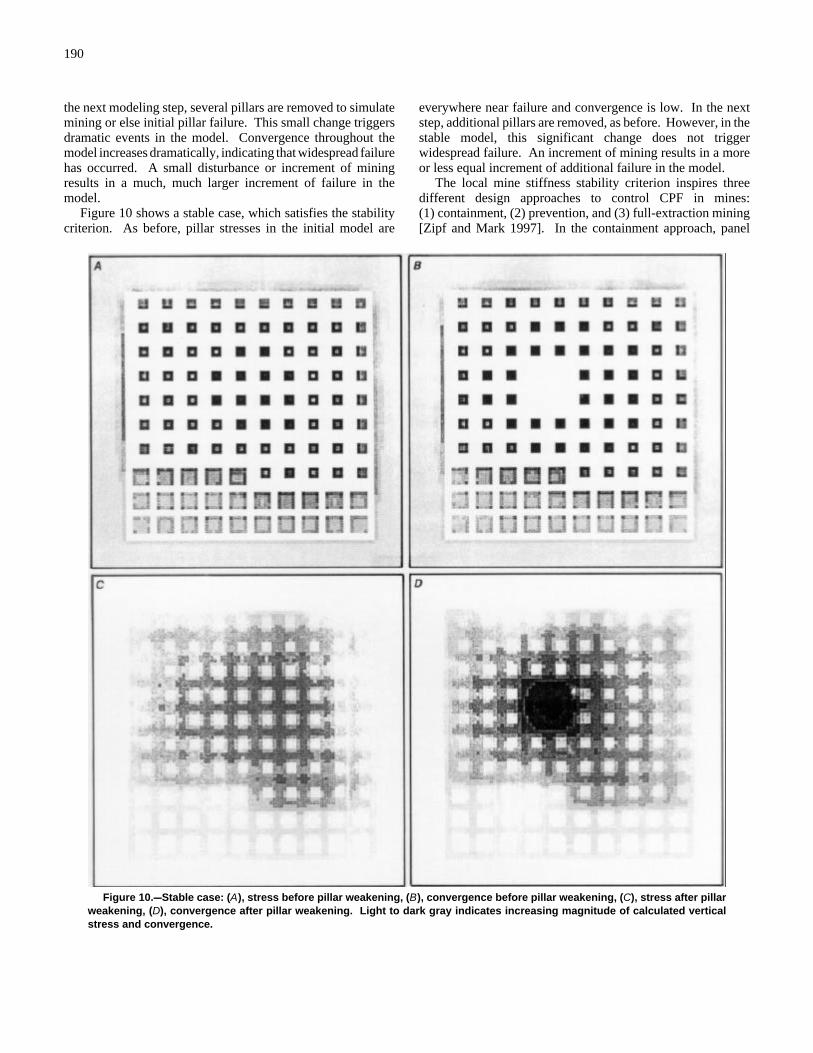
190
Figure 10.CCStable case: (A), stress before pillar weakening, (B), convergence before pillar weakening, (C), stress after pillarweakening, (D), convergence after pillar weakening. Light to dark gray indicates increasing magnitude of calculated verticalstress and convergence.
the next modeling step, several pillars are removed to simulatemining or else initial pillar failure. This small change triggersdramatic events in the model. Convergence throughout themodel increases dramatically, indicating that widespread failurehas occurred. A small disturbance or increment of miningresults in a much, much larger increment of failure in themodel.
Figure 10 shows a stable case, which satisfies the stabilitycriterion. As before, pillar stresses in the initial model are
everywhere near failure and convergence is low. In the nextstep, additional pillars are removed, as before. However, in thestable model, this significant change does not triggerwidespread failure. An increment of mining results in a moreor less equal increment of additional failure in the model.
The local mine stiffness stability criterion inspires threedifferent design approaches to control CPF in mines:(1) containment, (2) prevention, and (3) full-extraction mining[Zipf and Mark 1997]. In the containment approach, panel
191
pillars must satisfy a strength-type design criterion, but theyviolate the stability criterion. Substantial barrier pillars"contain" the spread of potential CPF that could start. In theprevention approach, pillars must satisfy two design criteria—one based on strength, the other based on stability. This more
demanding approach ensures that should pillar failurecommence, its nature is inherently stable. Finally, the full-extraction approach avoids the possibility of CPF altogether byensuring total closure of the opening (and surface subsidence)upon completion of retreat mining.
SUMMARY AND RECOMMENDATIONS
Practical work to date with the local mine stiffness stabilitycriterion reveals both the promises and shortcomings of thecriterion in the effort to prevent catastrophic failures in mines.Back-analysis of case histories in various mines demonstratesthe possibilities of using the criterion in predictive design todecrease the risk of catastrophic collapse [Swanson and Boler1995; Zipf 1996; Chase et al. 1994; Zipf, in press]. The toolcould have wide application in metal, nonmetal, and coal room-and-pillar mines, as well as other mining systems. However,a larger database of properly back-analyzed case histories ofcollapse-type failure is required. In addition to collapse-typefailures, the criterion could evaluate the nature of shear-typefailure and have applications in rock burst and coal mine bumpmitigation.
Practical calculations of the local mine stiffness (KLMS) termin the stability criterion have been done using analyticalmethods [Salamon 1970; 1989a,b] and, more recently,numerical methods [Zipf, in press]. Major factors affectingKLMS are rock mass modulus; mine geometry, including paneland barrier pillar width; and the percentage extraction, i.e., theoverall amount of mining. Analytical and numerical KLMS
calculations done to date assume an elastic continuum andneglect the presence of major discontinuities. The effect ofthese discontinuities is certain to decrease KLMS; however, themagnitude of these effects requires further numerical study.
Other numerical approaches, such as discrete-element ordiscontinuous deformation analysis, may provide useful insightinto the KLMS for practical mine design.
Better understanding of the postfailure behavior of minepillars requires additional effort. Experiments on full-scalepillars are generally not practical; however, careful laboratoryand numerical studies could provide justifiable estimates of KP
for mine pillars. Tests in the laboratory should examine thecomplete stress-strain behavior of various roof-pillar-floorcomposites at a variety of w/h ratios. Other variables toconsider include the effect of horizontal discontinuities andwater in the rock mass. Laboratory experiments can provide thenecessary benchmark data for numerical studies that extrapolateto the field.
This paper summarizes the status of practical evaluation ofthe local mine stiffness stability criterion for prevention ofcertain types of catastrophic ground failures in mines. Back-analyses of collapse case histories show that the stabilitycriterion can predict the possibility of these catastrophicfailures. Evaluating the criterion depends on numericalcomputation of KLMS and limited knowledge of the postfailurebehavior of pillars. Further laboratory and numerical studies ofthe input parameters KLMS and KP should increase ourconfidence in predicting failure nature with the local minestiffness stability criterion.
REFERENCES
Bieniawski ZT, Vogler UV [1970]. Load-deformation behavior of coalafter failure. In: Proceedings of the Second ISRM Congress on RockMechanics, ISRM (Belgrade, Yugoslavia). Vol. 1, paper No. 2-12.
Bryan A, Bryan JG, Fouche J [1966]. Some problems of strata control andsupport in pillar workings. The Mining Engineer 123:238-254.
Casey LA [1998]. Comprehensive test ban treaty research anddevelopment plans and accomplishments...from signature to entry into force.Washington, DC: U.S. Department of Energy, Office of Nonproliferation andNational Security, Office of Research and Development, Report No. DOE/NN-98001802.
Chase FE, Zipf RK Jr., Mark C [1994]. The massive collapse of coalpillars: case histories from the United States. In: Peng SS, ed. Proceedings ofthe 13th International Conference on Ground Control in Mining. Morgantown,WV: West Virginia University, pp. 69-80.
Cook NGW, Hojem JPM [1966]. A rigid 50-ton compression and tensiontesting machine. J S Afr Inst Mech Eng 1:89-92.
Das MN [1986]. Influence of width/height ratio on postfailure behavior ofcoal. Int J of Mining and Geol Eng 4:79-87.
Ferriter RL, Zipf RK Jr., Ropchan DM, Davidson J [1996]. Report ofTechnical Investigation, Underground Nonmetal Mine, Mine Collapse
Accident, Solvay Mine, Solvay Minerals, Inc., Green River, SweetwaterCounty, Wyoming, February 3, 1995. Denver, CO: U.S. Department of Labor,Mine Safety and Health Administration.
Heasley KA [1997]. A new laminated overburden model for coal minedesign. In: Proceedings - New Technology for Ground Control in RetreatMining. Pittsburgh, PA: U.S. Department of Health and Human Services,Public Health Service, Centers for Disease Control and Prevention, NationalInstitute for Occupational Safety and Health, DHHS (NIOSH) PublicationNo. 97-122, IC 9446, pp. 60-73.
Heasley KA [1998]. Numerical modeling of coal mines with a laminateddisplacement-discontinuity code [Dissertation]. Golden, CO: Colorado Schoolof Mines, Department of Mining and Earth Systems Engineering.
Heuze F [1996]. LLNL's partnership with selected U.S. mines for CTBTverification: a pictorial and some reflections. UCRL-ID-122577.
Iannacchione AT [1990]. Behavior of a coal pillar prone to burst in thesouthern Appalachian Basin of the United States. In: Fairhurst C, ed.Proceedings of Rockbursts and Seismicity in Mines. Balkema, pp. 295-300.
Jaeger JC, Cook NGW [1979]. Fundamentals of rock mechanics. 3rd ed.Chapman and Hall.
192
Maleki H [1992]. In situ pillar strength and failure mechanisms for U.S.coal seams. In: Proceedings of the Workshop on Coal Pillar Mechanics andDesign. Pittsburgh, PA: U.S. Department of the Interior, Bureau of Mines,IC 9315, pp. 73-77.
Mark C, Iannacchione AT [1992]. Coal pillar mechanics: theoreticalmodels and field measurements compared. In: Proceedings of the Workshopon Coal Pillar Mechanics and Design. Pittsburgh, PA: U.S. Department of theInterior, Bureau of Mines, IC 9315, pp. 78-93.
Salamon MDG [1970]. Stability, instability, and design of pillar workings.Int J of Rock Mech Min Sci 7:613-631.
Salamon MDG [1989a]. Some applications of the frictionless laminatedmodel. In: Proceedings of the 30th U.S. Rock Mechanics Symposium(Morgantown, WV). Balkema: pp. 891-898.
Salamon MDG [1989b]. Subsidence prediction using a laminated model.In: Proceedings of the 30th U.S. Rock Mechanics Symposium (Morgantown,WV). Balkema: pp. 503-510.
Seedsman RW, Hornby P [1991]. Controlled and uncontrolled pillarcollapse. NERDDC project report No. 1440. Australia: ACIRL Ltd.
Skelly WA, Wolgamott J, Wang FD [1977]. Coal pillar strength anddeformation prediction through laboratory sample testing. In: Proceedings ofthe 18th U.S. Rock Mechanics Symposium. Golden, CO:: Colorado School ofMines, pp. 2B5-1 to 2B5-5.
Swanson PL, Boler FM [1995]. The magnitude 5.3 seismic event andcollapse of the Solvay trona mine: analysis of pillar/floor failure stability. U.S.Department of the Interior, Bureau of Mines, OFR 86-95.
Van Heerden WL [1975]. In situ determination of complete stress-straincharacteristics of large coal specimens. J S Afr Inst Min Metall 75(8):207-217.
Wagner H [1974]. Determination of the complete load-deformationcharacteristics of coal pillars. In: Proceedings of the Third InternationalCongress on Rock Mechanics. National Academy of Sciences, Vol. 2B,pp. 1076-1081.
Zipf RK Jr. [1992a]. MULSIM/NL application and practitioner's manual.Pittsburgh, PA: U.S. Department of the Interior, Bureau of Mines, IC 9322.
Zipf RK Jr. [1992b]. MULSIM/NL theoretical and programmer's manual.Pittsburgh, PA: U.S. Department of the Interior, Bureau of Mines, IC 9321.
Zipf RK Jr. [1996]. Simulation of cascading pillar failure in room-and-pillar mines using boundary-element method. In: Proceedings of the SecondNorth American Rock Mechanics Symposium. Balkema, pp. 1887-1892.
Zipf RK Jr. [in press]. Catastrophic collapse of highwall web pillars andpreventative design methods. In: Proceedings of the 18th InternationalConference on Ground Control in Mining. Morgantown, WV: West VirginiaUniversity.
Zipf RK Jr., Mark C [1997]. Design methods to control violent pillarfailures in room-and-pillar mines. Transactions of the Institution of Miningand Metallurgy 106(Sept-Dec):A124-A132.
Zipf RK Jr., Swanson PL [in press]. Description of a large catastrophicfailure in a southwestern Wyoming trona mine. In: Proceedings of the 37thU.S. Rock Mechanics Symposium (Vail, CO).

DHHS (NIOSH) Publication No. 99-114
June 1998
To receive other information about occupational safety and health problems, call 1-800-35-NIOSH (1-800-356-4674), or
visit the NIOSH Home Page on the World Wide Web athttp://www.cdc.gov/niosh