proceedings of sdas 1996 - sdaos.org of the south dakota academy of science volume 75 1996 published...
TRANSCRIPT
Proceedingsof the
South Dakota Academy of Science
Volume 751996
Published by the South Dakota Academy of ScienceAcademy Founded November 22, 1915
Co-EditorsKenneth F. Higgins and Emil F. Knapp
Terri Symens, Wildlife & Fisheries, SDSUprovided secretarial assistance
Tom Holmlund, Graphic Designer

TABLE OF CONTENTS
Minutes of the Eighty-First Annual Meeting of the South DakotaAcademy of Science........................................................................................1
Presidential Address: Molecular Machines and Ion Propulsion:A Random Walk By a Mitochondriac. John A. Thomas..............................5
Complete Senior Research Papers presented at The 81st Annual Meeting of the South Dakota Academy of Science
Generalized Synthetic Order Axioms, Which Apply to Geodesics andOther Uniquely Extensible Curves Which May Cross Themselves.Richard P. Menzel..........................................................................................11
Effect of Continuous Cropping on Yields and Soil Fertility from 1941to 1980 at Brookings. E. M. White .............................................................57
Gravity Base Stations in South Dakota. Ronald L. Zawislak............................63Comparison of Two Methods for Measuring Soil Phosphorous
Desorption Quantity-Intensity Relationships. James J. Doolittleand Jin-Ho Lee ..............................................................................................71
Calibration of a Digital Camera for Contrast Ratio Measurement.Justin Williams and Oren Quist....................................................................79
Age Ratios of Male Mallards Harvested in Eastern South Dakota.Jeremy P. Rakowicz, Jeffrey S. Gleason, and Jonathan A. Jenks ...............89
Subspecific Discrimination of Canada Geese Harvested in SouthDakota. Jeffrey S. Gleason, Scott A. Stolz, and Jonathan A. Jenks ..........99
Patch Residence Times of Downy Woodpeckers. Jeffrey S. Palmer .............107Effects of Drought Stress and Wheat Streak Mosaic Virus on Yield andGrowth Characteristics in Winter Wheat. M.A.C. Langham, J. Gellner,and D.J. Gallenberg............................................................................................111The Dilatancy Caused by Shearing Motion. George H. Duffey.....................119Nonclassical Physical Processes in Networks of Nerves.
George H. Duffey........................................................................................123Variation of Wheat Streak Mosaic Virus Concentration in Early Growth
of Winter Wheat. Z. Wu and M.A.C. Langham ........................................127
Abstracts of Senior Research Papers presented at The 81st Annual Meeting of the South Dakota Academy of Science
Mathematical Models for Soybean Pod Growth. Peter Claussenand Neil Reese.............................................................................................141
Fusarium Oxysporum Infection of Cultivated Coneflowers (Echinaceaangustifolia). K. Peichowski, S. Rizvi, and R.N. Reese...........................143
Separation of Chloroplast Pigments Using Reverse PhaseChromatography. R.A. Brewster and R.N. Reese .....................................145
Transport of Agrichemicals by Wind Eroded Sediments to NontargetAreas. Thomas M. DeSutter, Sharon A. Clay, and David E. Clay ...........147
The Effects of Hyperbaric Air on the Population Growth Rates of theCommon Etiological Agents of Otitis and the Development of aBuffered General Growth Medium for Use in Compressed AirEnvironments. Bradley L. Dubbels, Jena D. French, Jennifer D. Tranas,Richard T. Dickey, David J. Dingsor and William J. Soeffing.......................149

Quantum Chemistry of Oxoacid Tautomers. Arlen Visteand Rachel R. Leininger ..............................................................................151
Carbon Isotopes and Ring Widths of Pinus Canariensis RecordLong-Term and Dynamic Changes in Tenerife, Canary Islands.Corrine Lundell, Larry Tieszen, and Lázaro Sánchez-Pinto ......................155
The Disappearance of Eclipse Minima of the Binary StarSS Lacertae. Tammy L. Clifton and Stephen J. Schiller ..........................157
Examining the Mechanism of Electrophilic Aromatic SubstitutionUsing Molecular Complexes of HCl. Russell Hobsonand L.C. Lewis .............................................................................................159
Enthalpies of Formation of Hydrates of Cobalt(II) Chloride.Timothy Mulder and L. C. Lewis................................................................161
The Effect of a Magnetic Field on Plant Growth and Reproduction.Odean Selchert and Dale Droge ................................................................163
Preliminary Survey of Plant Pathogens Present in Corn and SoybeanFields in Southeastern South Dakota. Darla Koffordand Donna Hazelwood...............................................................................165
Variation in Stability of Aphid Transmission Phenotype ofSerologically Similar Barley Yellow Dwarf Luteovinises.Donna Hazelwood, Stewart Gray, and Thomas Carroll ...........................167
WetLand Surface Water and Surrounding Groundwater Quality inAgricultural Landscapes in Eastern South Dakota.David E. Kringen and Diane H. Rickerl ....................................................169
A Comparison of Acid Mine Drainage With Natural Acid Seeps.Kris Chupka and Cathleen Webb...............................................................171
A Study of the Total Dissolved and Suspended Solids in theStrawberry Creek/Bear Butte Creek Watershed.Sondra Landrigan, Cathleen Webb, and Arden Davis...............................173
Carbon Isotope Composition of Hackberry, Celtis Occidentalis L.,Accessions Grown at Test Sites in the Great Plains.Larry L. Tieszen, Steven B. Ortmeier, Mark L. Gabel,and Richard A. Cunningham ......................................................................175
Interpretation of Seasonal Diet Patterns in Bison from Stable IsotopicAnalysis of Horn Sheaths. Joel Vander Kooi, Larry L. Tieszen,and Chad McMurtry.....................................................................................177
Evaluation of Oat Lines in Reaction to Five Isolates of Crown Rust.B.L. Hollesen, Jr., M.A.C. Langham, D.L. Reeves, and Y. Jin ...................179
Transformation of Soybean with an Anti-senseCholinephosphotransferase Gene to Increase Saturated LipidContent. Buffy Ellsworth and T. M. Cheesbrough...................................181
Cholinephosphotransferase mRNA Is Expressed in the OuterIntegument of Young Soybean Seeds. Qi Luo andThomas M. Cheesbrough............................................................................183
Classificatory Significance of Pygidial and Ovipositor Glands inElateridae (Coleoptera). Xinjie Lin and Paul J. Johnson .........................185
Male Betta Splendens Aggressive Threat Display Related to Visual Familiarity with Opponent Fish. Gregory W. Krajewskiand T. P. Cox ...............................................................................................187

Least Chipmunk, Eutamias minimus, Return to Capture Site Relatedto Displacement Distance. T. P. Cox ........................................................189
In Situ Observations in Thunderstorms. Andrew Detwiler,Paul L. Smith, Gary Johnson, Ken Hartman, Charles Summers,and Jon Leigh ..............................................................................................191
Multiple Scattering Contributions to Atmospheric Radiance withApplications to Remote Sensing. Jim Olson.............................................193
A Biological Assessment of Landscape Disturbance Potential on theLittoral Zone Benthos of a Prairie Pothole Lake. John L. Foleyand Nels H. Troelstrup, Jr. ..........................................................................195
Spectrally Resolved Ground Measurement of the Multiple ScatteringContribution to Diffuse Sky Irradiance. Hang Yuan................................197
Short-Day Photoperiod Responses of Three Vitis Species:Surveying for Dormancy Induction. Carol M.F. Wakeand Anne Fennell ........................................................................................199
Gender Ratios, Oocyte Maturation, and Insemination Rates ofBlack Dot Flea Beetles (Aphthona Nigriscutis) in CampbellCounty, South Dakota. Mark A. Brinkman, Sharon A. Clay,and Jan J. Jackson .......................................................................................201
Parental Acclimation and Developmental Temperature Relationshipsof the Japanese Medaka Fish, Oryzias Latipes. Andrew B. Rahn,Mark A. Cade, and Leland G. Johnson ......................................................203
Stable Isotope Values for Two Modern Black Bears from Prince ofWales Island, Alaska. Korey B. Champe and Timothy H. Heaton .........205
Molecular Mapping of Hexaploid Oats (Avena sativa L.) Using RFLPMarkers. Mehmet Cakir, Lon A. Hall, Dale L. Reeves,and Alex L. Kahler ......................................................................................207
A Comparative Analysis of Atmospheric Extinction Data Between aShadawband Solar Radiometer and a Reagan 10-ChannelSunphotometer. Steve Fox and Stephen Schiller .....................................209
Design, Construction and Use of a Sturdy Photomultiplier TubeHousing for Bioluminescence Experiments. Michael Fossumand Bruce H. Bleakley................................................................................211
Bovine Herpesvirus 1 Does Not Cause Apoptoses in Bovine Cells.W. Wiese, L.J. Braun, and C.C.L. Chase.....................................................213
In Situ Hybridization for Expression of the Agouti Gene in Tissuesof the Lethal Yellow Mouse. Maureen R. Diggins,Raymond R.R. Rowland, and Nels H. Granholm ......................................215
A Dual Function Modified Glassy Carbon Electrode. Betsy B. Ratcliffand Royce C. Engstrom...............................................................................217
Scanning Probe Microscopy Investigations of Electrode Morphologyand Activity. Brian D. Lamp, Betsy B. Ratcliff,and Royce C. Engstrom...............................................................................219
The Effects of Phorate on Wetland Macroinvertebrates.Charles D. Dieter, Walter G. Duffy, and Lester D. Flake..........................221
Analysis of a Mathematical Model for the Dynamics of InteractionBetween a Unilingual and Bilingual Population in Two AdjacentRegions. A.S. Elkhader...............................................................................223

Melanogenic Potential of des-Ac-αMSH. Partha Ramasastryand Nels Granholm .....................................................................................225
Agouti Locus Regulation of Dopa Oxidase Activity in Mutant Mice.Elden Rand and Nels H. Granholm ...........................................................227
Effects of Ay on Fertility in Ay/A Mice—Ovarian Compensation.Ryan J. Saetveit, Maureen R. Diggins, and Nels H. Granholm ................229
An Examination of the Effects of Cytopathic and Non-CytopathicBovine Viral Diarrhea Virus Strains on T-Cell Activation.T.M. Appel, D.J. Hurley, and C.C.L. Chase................................................231
Assessment of the Impact of Diesel Fuel Contamination on PlantGrowth and Microbial Degradation. Lenore M. Koczon,Susan Landon-Arnold, Frank Birch, and Nicole Manning ........................233
The Investigation of the Rate of Degradation of Known Componentof Number 2 Diesel Fuel by South Dakota Native Microorganisms.Lenore M. Koczon, Virginia Laredo, and Kristi Millslagle ........................235
The Use of Miniaturized Most Probable Number Technique forAssessing Bioremediation Capabilities of PetroleumContaminated Soil. Carol Weigel, Dwayne Wilson,S. Landon-Arnold, and Lenore M. Koczon ................................................237
Cloning and Determination of the Expression of the String Gene andIts Effects on the Mitotic Cycles of Drosophila Melanogaster.Patrick Klimczyk, Bruce Edgar, and Dara Lehman ...................................239
Determination of Cadmium and Lead in Northern Pike from theMissouri River. Jennifer Even and Shahrokh Ghaffari .............................241
Use of Lectin Histochemistry to Evaluate the Effects of Tunicamycinon Hymenolepis Diminuta Adult Tapeworms. E.J. Olson,M.B. Hildreth, and J.A.Oaks .......................................................................243
Agouti Gene Transcription in Wild-Type and Mutant Mice.S.M.K. Andersen, C.A. Westby, R.R.R. Rowland,and N.H. Granholm.....................................................................................245
Effects of Agouti Expressionon Gamma-GlutamyltranspeptidaseActivity in Mice. J. Brunz, R.N. Reese, and N.H. Granholm ...................247
Identification and Characterization of the Agouti Gene in Livestock.M.D. Johansen, R.R.R. Rowland, and N.H. Granholm..............................249

Proceedings of the South Dakota Academy of Science, Vol. 75 (1996) 1
MINUTES OF THE EIGHTY-FIRST ANNUALMEETING OF THE SOUTH DAKOTA
ACADEMY OF SCIENCE
The Eighty-first Annual Meeting of the South Dakota Academy of Sciencewas held 12-13 April 1996 at South Dakota State University in Brookings, SouthDakota.
The Executive Committee met at 7:30 pm Thursday, 11 April, for a finalplanning session for the annual meeting.
The opening general session began at 10:15 Friday morning with Acade-my President Tim Sorenson presiding.
Carol Peterson, SDSU’s Vice-president for Academic Affairs, welcomedmeeting participants to the university campus. She remarked that she was im-pressed by the wide area of sciences represented in the meeting and by thementoring process evident in the Junior Academy as well as undergraduate andgraduate student presentations. Dr. Peterson invited Academy members to vis-it the Museum of Agricultural History and the Art Museum.
The main attraction of the opening meeting was an address on bioener-getics, entitled “Molecular Machines and Ion Propulsion” or “A Random Walkby a Mitochondriac” given by Academy President-Elect John Thomas. The talkwas full of interesting quotes about science by both scientists and non-scien-tists.
Senior Academy and Junior Academy papers were presented throughoutthe day on Friday and during the morning on Saturday. There were sixty-nineSenior Academy papers and fourteen Junior Academy papers.
The banquet was held at the Brookings Holiday Inn beginning 6:30 Fridayevening.
TREASURER’S REPORT
Statement of Receipts, Disbursements, and Changes in Cash Balances
Cash Balance, 1 January 1995Certificate of Deposit $ 4728.44Savings Account 9.15Checking Account 3147.56
TOTAL BEGINNING CASH $ 7,885.15
ReceiptsDues $ 3395.00Annual Meeting Registration 800.00Banquet Tickets 414.00Page Charges 5809.54Proceedings Sales 66.21Interest on Investments 117.87

2 Proceedings of the South Dakota Academy of Science, Vol. 75 (1996)
Awards 230.00Returns 866.66
TOTAL RECEIPTS $ 11,699.28
Cash Available for Disbursements $ 19,584.43Disbursements:
Proceedings Production 6085.00Annual Meeting 2313.68Supplies 1038.86Postage 613.22Printing 711.28Junior Academy 401.63National Dues 67.00Refund 200.00Miscellaneous 7.00
TOTAL DISBURSEMENTS $ 11,437.67
Cash Balance, 31 December 1995Certificate of Deposit $ 4846.31Savings Account 9.15Checking Account 3291.30
TOTAL ENDING CASH $ 8,146.76
Frederick J. Peabody, Treasurer
REPORT OF THE JUNIOR ACADEMY COMMITTEE
The annual South Dakota Junior Academy of Science Research Paper Com-petition was held Friday April 12, 1996, on the campus of South Dakota StateUniversity, Brookings, South Dakota. Fourteen students from five schools pre-sented papers. The schools represented were: Brookings High School, IpswichHigh School, Ipswich Middle School, Rapid City Stevens High School, andSioux Falls Roosevelt High School.
Laura Grant and Justin Heereman, both from Rapid City Stevens, were se-lected to present their papers to the Senior Academy at the Saturday morningmeeting, with Teresa Kub from Ipswich High School named as alternate. Noneof these students were able to appear at the Saturday meeting because of con-flicts with the Science Olympiad or the Scholastic Aptitude Test.
Grant, Heereman, and Kub will present their research at the MinnesotaAcademy of Science in October. They will receive $150 grants for their re-search if they return with a research paper next spring. Alternate presenters atthe Minnesota Academy are Jill Heitz of Ipswich High and Carl Lebsack ofRapid City Stevens. They were awarded research grants of $75 to be claimedupon completing research presentations in the spring of ‘97.
Scholarships were generously provided by Black Hills State University, Au-gustana College, University of South Dakota, South Dakota State University,

Proceedings of the South Dakota Academy of Science, Vol. 75 (1996) 3
Northern State University, Dakota Wesleyan University, and University of SiouxFalls. Jodell Whittington of Rapid City will select from the scholarships offered.Research grants of $100 each were provided for Justin Herreman, Jodell Whit-tington, and Teresa Kub. These grants were awarded for their work in 1995.Grants of $50 were provided to Carl Lebsack and Jill Heitz for completing theirresearch and presenting at the 1996 meeting. Due to generous support of theJunior Academy and area contributors, all presenters were awarded at least oneprize.
The judging of projects was conducted by science undergraduate and grad-uate students from South Dakota State University. The SDSU students wereSteve Hawks, Chris Kraft, Nancy Marbach, Chris McCart, and John Steiner. TheJunior |Academy greatly appreciates their contribution to the science experi-ences of the high school students.
The 1995-96 Junior Academy President Justin Herreman, Vice PresidentTeresa Kub, and Secretry-Treasurer Carl Lebsack were very helpful with Acade-my activities. Newly elected officers for 1996-97 are President Laura Grant,Vice President Nathan Kadlec (of Ipswich), and Secretary-Treasurer Carl Leb-sack.
The Junior Academy is grateful for the cooperation of South Dakota StateUnivesity and the staff of the Biology Department. They provided equipment,rooms, and refreshments that made our meeting a great success. The specialassistance of Arvid Boe and Gary Peterson was much appreciated. A specialthank you is due Frederick Peabody, Senior Academy Secretary, for the ac-counting of funds and the writing of checks for the various awards.
Respectfully submitted,John Landegent
SOUTH DAKOTA ACADEMY OF SCIENCE MEMBERSHIP
Letters after names indicate field of science: A—mathematics; B—physics;C—chemistry; E—geology; G—biological sciences; J—psychology;
Life Members
Marjorie Beaty (A)Henry V. Cobb (J)Ray D. Dillon (G)William Ekman (A)Charles R. Estee (C)Harold Foss (G)Arie Gaalswyk (A)Harold B. Goodell (G)Morton Green (E)Edna Grieb (C)John Paul Gries (E)Al L. Halstead (C)William F. Houk (G)Ernest J. Hugghins (G)Robert Roy Kintner (C)Harlan L. Klug (G)
Richard John Landborg (C)Jerry Loomer (B)Ralph H. McGregor (A)John C. Mickelson (E)Norman Miller (C)Gottfried I. Moller (B)V. Ronald Nelson (B)Oscar E. Olson (C)Fay L. Partlo (B)Robert M. Pengra (G)Robert D. Redin (B)Roy W. Rissky (C)James C. Schmulbach (G)George Semeniuk (G)Harold L. Smith (G)Charles A. Taylor, Jr. (G)Theodore Van Bruggen (G)
Charles M. Vaughn (G)Victor S. Webster (C)Zeno W. Wicks, III (G)Augustana CollegeGilbert W. Blankespoor (G)Maureen Diggins (G)Milton P. Hanson (C)Leland G. Johnson (G)Emil F. Knapp (A)Lansing M. Prescott (G)Timothy Sorenson (A)Craig Spencer (G)J.D. Thompson (B)Larry L. Tieszen (G)Karel Vander Lugt (B)Arlen Viste (C)Duane E. Weisshaar (C)

4 Proceedings of the South Dakota Academy of Science, Vol. 75 (1996)
Black Hills State UniversityCurtis Card (A)Thomas P. Cox (J)Audrey Gabel (G)Mark Gabel (G)Douglas J. Wessel (J)
Dakota State UniversityDavid E. Cook (C)Dale Droge (G)Patrick F. Fields (E)Donna Hazelwood (G)Jeffrey S. Palmer (A)Rick Simmons (A)Jerald A. Tunheim (B)
Dakota WesleyanUniversityJames L. Lefferts (C)Tim R. Mullican (G)Robert Tatina (G)Mount Marty CollegeShahrokh Ghaffari (C)Thomas Guetzloff (C)Shirley Jennewein (G)John W. Stene (A)
Northern State UniversityA.S. Elkhader (A)Lenore M. Koczon (C)Susan Landon (G)John C. Naughten (G)Dwayne W. Rehfeld (C)Dan Tallman (G)Erika Tallman (G)Jonathan C. Wright (G)Lu Zhang (A)
South Dakota School ofMines and TechnologyMatthew J. Bunkers (W)Andy Detwiler (W)L. Ronald Johnson (W)James Reid MacDonald (E)James E. Martin (E)James R. Miller, Jr. (W)Perry H. Rahn (E)
South DakotaState UniversitySherwood O. Berg (G)Bruce Bleakley (G)Arvid Boe (G)Mark A. Brinkman (G)Michael Lee Brown (G)Larry Browning (B)Christopher Chase (G)Thomas E. Chase (G)Thomas Cheesebrough (G)Sharon A. Clay (G)Tammy L. Clifton (B)Nancy Cook (C)
Darrel W. DeBoer (O)Douglas J. Dieterman (G)James J. Doolittle (G)George H. Duffey (B)Lester D. Flake (G)John L. Foley (G)Harry A. Geise (O)Nels H. Granholm (G)Lois Haertel (G)Teresa Hein (B)Warren Hein (B)Kenneth F. Higgins (G)Michael B. Hildreth (G)David J. Hurley (G)H.L. Hutcheson (G)Jonathan A. Jenks (G)Paul J. Johnson (G)Kevin J. King (G)Robert A. Kohl (G)Marie A.C. Langham (G)Gary E. Larson (G)Douglas D. Malo (G)Charles McMullen (G)Gerald A. Myers (G)James Olson (B)Partasarathy Ramsastry (G)Joel Rauber (B)R. Neil Reese (G)Diane Rickerl (G)Charles Scalet (G)James D. Smolik (G)Leo Spinar (C)Nels H. Troelstrup (G)Everett M. White (G)Zeno W. Wicks III (G)Jo Ann Willgohs (G)David W. Willis (G)Hang Yuan (B)Ken Yocom (A)
University of Sioux FallsW.F. Klawiter, Jr. (B)L. Cliff Lewis (C)Keith Perkins (G)William J. Soeffing (G)
University of South DakotaHoward Coker (C)Royce C. Engstrom (C)Richard Hammond (E)Donna Henderson (A)Allen D. Johnson (G)Gary D. Johnson (E)Frederick J. Peabody (G)Stan F. Pence (E)M. Robert Stoner (C)David L. Swanson (G)John Thomas (C)
High Schools andMiddle SchoolsMike Barondeau (C)—Ed-
monds Central H.S.Roberta Gaines (C)—Rapid
City Stevens H.S.John Landegent (G)—Sioux
Falls Roosevelt H.S.Cassandra Kay Soeffing—
Sioux Falls Axtell Park M.S.Arlyn Thomas—Sioux Falls
Roosevelt H.S.
Out-of-State SchoolsDennis T. Disrud—Minot
State University, No. Dak.Lynn M. Hodgson (G)—Uni-
versity of HawaiiAllen J. Kihm (E)—Minot
State University, No. Dak.Robert A. Kreber (G)—Uni-
versity of WisconsinPeter Maldonado (C)—Find-
lay College, OhioRussell H. Stanhope—Worces-
ter Science Center, Mass.Wade Winters (G)—Urban-
dale High School, IowaRonald L. Zawislak (E)—Mid-
dle Tennessee State Univer-sity
Non-AcademicThomas V. Durkin (C)—S.D.
Dept. Envir. & Nat. Res.,Pierre
Carroll J. Hanten (G)—S.D.Dept. of Agriculture, Pierre
Joe Ideker (G)—McDonnelNat. Hist. Center, Texas
Carrie Lynn Jacobson (G)—S.D. Dept. Envir. & Nat.Res., Pierre
Jeffrey D, Jung (C)—T&R Ser-vice, Colman
Joseph A. Kawatski (G)—Oikos Publishers, Holmen,Wisc.
Kent Keenlyne (G)—U.S. Fishand Wildlife, Pierre
James J. Norton (E)—U.S. Ge-ological Survey, Rapid City
David J. Ode (G)—S.D. Natu-ral Heritage Prog., Pierre

Proceedings of the South Dakota Academy of Science, Vol. 75 (1996) 5
PRESIDENTIAL ADDRESS
Molecular Machines and Ion Propulsion:A Random Walk By a Mitochondriac
Address to the South Dakota Academy of ScienceSouth Dakota State University
April 13, 1996
Presented by John A. ThomasDepartment of Biochemistry and Molecular Biology
University of South Dakota School of MedicineVermillion, SD 57069
It has been quite some time now since I gave my Presidential Address tothe Academy, and now I am faced with the task of putting it in printed form.The project of translation from my oral presentation to a written account hasme somewhat stymied. In my talk, I relied heavily on slides as something Icould talk around, a format I am familiar with as a teacher and researcher. NowI have to put it in bare words without the benefit of illustrative materials thatmake speaking so much easier. Also, the particular slides have long since beenrefiled various places, and I am uncertain what some of them were. So be it.
My talk was based partly on my direct research experiences and partly onrelated biological phenomena that I just find interesting but have not personal-ly studied in the laboratory. One of my research interests involved developingmethods to measure pH within various cellular compartments. The measure-ment of pH within cells and subcellular compartments had become interestingwhen it was realized that cells have active mechanisms to regulate internal pH,and that each subcellular compartment seems to have its own system to do so.Also, it had finally been accepted, due largely to the singular persistent voice ofone scientist working alone on his estate (Peter Mitchell), that transmembraneelectrochemical gradients of protons (hereafter called “proton gradients” for sim-plicity) are the driving force for ATP formation in mitochondria, bacteria, andchloroplasts, as well as for other biological energy conversion processes, in-cluding the transport of nutrients and locomotion in bacteria.
I focused my talk on two systems that convert transmembrane proton gra-dients into other useful energy forms. One system was the mitochondrial ATPsynthase, which converts the energy inherent in the proton gradient into ATP(chemical energy). The other system involved the flagella of bacteria, whichuse proton gradients to propel the bacterium (mechanical energy). In both sys-tems, the movement of protons through a specific membrane assembly appar-ently drives the rotation of a molecular motor. A crude analogy would be thewind (the proton gradient) striking the blades of a windmill (our molecular mo-tor), causing them to turn and do useful work. Structurally speaking, this ro-tor-stator analogy is not bad for either system. The rotational aspect is well es-

6 Proceedings of the South Dakota Academy of Science, Vol. 75 (1996)
tablished for the bacterial system and somewhat less so for the mitochondrialATP synthase.
Flagella propel a bacterium forward by rotation in a counter-clockwise di-rection. When the motor rotation is in this direction, all the individual flagel-la cooperate by fitting together in a single large flagellar bundle that drives thebacterium ahead in a straight line. However, periodically the molecular motormomentarily reverses to a clockwise direction. The individual flagella cannotform a bundle when rotating clockwise. This causes the flagellar bundle to flyapart and the bacterium to tumble. After tumbling briefly, the motor quicklyre-establishes its original counter-clockwise direction, the flagellar bundle re-forms, and the bacterium proceeds to travel off in a new direction. Thus bac-terial motion involves a series of straight line movements interrupted by tum-bling,which causes it to set out in a new direction. Of course, it is the protongradient that drives the motor in both clockwise and counter-clockwise direc-tions. The details of how this reversible motor actually functions are still a sub-ject of active investigation.
Since the tumbling process is random, so is the new direction. So howdoes the bacterium get anywhere? Without any regulation, this would simplyresult in a random walk. The bacterium accomplishes net movement by ad-justing the length of time it moves ahead before reversing the motor and tum-bling. If the direction is favorable (i.e., towards food, light, etc.), the motor re-versal occurs less frequently. If the new direction is unfavorable, it undergoestumbling much sooner. Hence, movement towards a desired goal is essential-ly a process of trial and error. It seems to change direction for variety (changefor change’s sake) but soon realizes its mistake if that change is unfavorable,and tries a different direction.
The other system I discussed was the ATP synthase, an enzyme which isfound in bacteria, plants, and animals. In all systems studied, the structure ofthe enzyme is essentially conserved. Although the energy used to create theproton gradients varies from system to system (e.g., light in plants, oxidativeprocesses in animals), the basic mechanism for ATP synthesis is the same in allthree systems. The three-dimensional structure of this enzyme is known. Basi-cally, it consists of a three-bladed turbine-like structure (headpiece) that sitsatop a shaft that extends into the membrane. The contacts between this shaftand the turbine blades are mostly hydrophobic; that is to say, they are “welloiled.” It is believed that the movement of the stream of protons through themembrane causes the shaft to rotate with respect to the turbine.
So how is the rotation of this shaft coupled to ATP formation? The ATPsynthase can, in fact, make a limited amount of ATP in the absence of a pro-ton gradient. If one adds a molar equivalent of ADP and inorganic phosphateto the enzyme, one finds approximately a mole of ATP is formed, but that it istightly bound to the enzyme. In fact, it is this binding energy that pulls thisotherwise unfavorable reaction towards completion.
(1) ADP + Pi ATP + H20 (2) ATP + ENZYME [ENZYME-ATP]
NET ADP + Pi + ENZYME [ENZYME-ATP]

Proceedings of the South Dakota Academy of Science, Vol. 75 (1996) 7
Unfortunately, because the ATP is so tightly bound to the enzyme, it is un-available for use. The role of the proton gradient is to release it from the en-zyme. It does this by causing rotation of the asymmetric shaft. Because theshaft is asymmetric (“wobbles”), rotation essentially causes it to “knock” thebound ATP off a subunit as it contacts it. This is a rather unsophisticated de-scription and an oversimplification, to which my mitochondrial colleagueswould probably take offense, but I think it provides a useful visual image ofwhat occurs. Besides, a little inaccuracy saves tons of explanation. Because ofthe asymmetric nature of the shaft, each of the three identical turbine parts(subunits) of the headpiece is in a slightly different conformation at a giventime. In other words, interactions with the shaft forces each to assume a slight-ly different three-dimensional shape. Thus, at a given time, one subunit ispoised to bind ADP and phosphate, another to bind ATP very tightly, and thethird is unable to bind nucleotides at all. As the shaft rotates, each subunit inturn assumes the shape best suited to its interaction with the shaft, with thestructural changes occurring in the order as described. Thus, a given subunitfirst binds ADP and phosphate, then assumes a shape that favors it convertingthe ADP and phosphate to tightly bound ATP, and finally that ATP is releasedas it is forced into the third conformation. The process keeps being repeatedas the shaft rotates, with each subunit undergoing these transitions sequential-ly, but 120 degrees out of phase with each other.
I punctuated my talk with aphorisms or “take-home lessons” that were re-lated or could be gained from the science that was discussed. It was sort ofthe researcher’s version of All I Really Need To Know I Learned in Kindergarten,a book that has been popular recently. Actually my inspiration for this ap-proach was a pair of books on bioenergetics written by Efraim Racker [1,2], oneof the pioneers in characterizing the components of the mitochondrial ATP syn-thesizing enzyme. In those books he accented his scientific narrative with wit-ticisms from various historical sources. In fact, a number of the sayings I usedin my talk were lifted directly from the books of Racker, who, of course, hadcollected them from various sources. I conclude this account with a listing ofsome of those sayings but, unlike in my actual talk, without any attempt to in-tegrate them into the narrative.
FRUSTRATIONS AND FAILURES
“Troubles are good for you.”“It doesn’t matter if you fall down, as long as you pick up something from
the floor while you get up.”—Efraim Racker [1]“A man learns to skate by staggering about making a fool of himself. In-
deed, he progresses in all things by resolutely making a fool of himself.”—George Bernard Shaw, in Advice to a Young Critic
NEW THEORIES AND SCIENTIFIC PROGRESS
“Progress is made by young scientists who carry out experiments old sci-entists said wouldn’t work.”—F. Westheimer

8 Proceedings of the South Dakota Academy of Science, Vol. 75 (1996)
“Listening to both sides of a story will convince you that there is more toa story than both sides.”—Frank Tyger
“It takes time for an old theory to be replaced by a new one, even if it issimpler and more encompassing. The reason for this long time lag was ex-plained by Max Planck. He remarked, ‘Scientists never change their minds, butthey eventually die.’ “—E. Racker [1]
“Even if you are on the right track, you’ll get run over if you just sitthere.”—Will Rogers
“When the dust settles, thou will see whether thou ridest a horse or anass.”—Chinese Proverb [1]
“It is the customary fate of new truths to begin as heresies, and end as su-perstitions.”—Thomas Henry Huxley
“The difficulty lies not in new ideas, but in escaping the old ones.”—J. M.Keynes
“All general statements are false.” (Including this one.)—Unknown“Things are only impossible until they are not.”—Jean-Luc Pickard“Discovery consists of seeing what everybody has seen and thinking what
nobody has thought.”—Albert von Szefft-Gyorgi“An undefined problem has an infinite number of solutions.”—Robert A.
Humphrey
THE NATURE OF SCIENTISTS
“If you can’t do it spectroscopically, it’s not worth doing.”—Britton Chance“Scientists have odious manners, except when you prop up their theory;
then you can borrow money from them.”—Mark Twain“Only two things are infinite, the universe and human stupidity, and I’m
not sure about the former.”—Albert Einstein
REFERENCES
A New Look at Mechanisms in Bioenergetics. Efraim Racker. Academic Press,Inc., 1976.
Reconstitutions of Transporters, Receptors, and Pathological States. EfraimRacker. Academic Press, Inc., 1985.

Complete Senior Research Papers
presented at
The 81st Annual Meeting
of the
South Dakota Academy of Science


Proceedings of the South Dakota Academy of Science, Vol. 75 (1996) 11
GENERALIZED SYNTHETIC ORDER AXIOMS,WHICH APPLY TO GEODESICS AND
OTHER UNIQUELY EXTENSIBLE CURVESWHICH MAY CROSS THEMSELVES
Richard P. Menzelc/o Karl MenzelP.O. Box 261
Bassett, NE 68714

12 Proceedings of the South Dakota Academy of Science, Vol. 75 (1996)
Figure 1.

Proceedings of the South Dakota Academy of Science, Vol. 75 (1996) 13

14 Proceedings of the South Dakota Academy of Science, Vol. 75 (1996)
Figure 2.

Proceedings of the South Dakota Academy of Science, Vol. 75 (1996) 15

16 Proceedings of the South Dakota Academy of Science, Vol. 75 (1996)

Proceedings of the South Dakota Academy of Science, Vol. 75 (1996) 17

18 Proceedings of the South Dakota Academy of Science, Vol. 75 (1996)

Proceedings of the South Dakota Academy of Science, Vol. 75 (1996) 19

20 Proceedings of the South Dakota Academy of Science, Vol. 75 (1996)

Proceedings of the South Dakota Academy of Science, Vol. 75 (1996) 21

22 Proceedings of the South Dakota Academy of Science, Vol. 75 (1996)

Proceedings of the South Dakota Academy of Science, Vol. 75 (1996) 23

24 Proceedings of the South Dakota Academy of Science, Vol. 75 (1996)

Proceedings of the South Dakota Academy of Science, Vol. 75 (1996) 25

26 Proceedings of the South Dakota Academy of Science, Vol. 75 (1996)
Proceedings of the South Dakota Academy of Science, Vol. 75 (1996) 27

28 Proceedings of the South Dakota Academy of Science, Vol. 75 (1996)

Proceedings of the South Dakota Academy of Science, Vol. 75 (1996) 29

30 Proceedings of the South Dakota Academy of Science, Vol. 75 (1996)

Proceedings of the South Dakota Academy of Science, Vol. 75 (1996) 31
32 Proceedings of the South Dakota Academy of Science, Vol. 75 (1996)

Proceedings of the South Dakota Academy of Science, Vol. 75 (1996) 33
34 Proceedings of the South Dakota Academy of Science, Vol. 75 (1996)

Proceedings of the South Dakota Academy of Science, Vol. 75 (1996) 35

36 Proceedings of the South Dakota Academy of Science, Vol. 75 (1996)
Proceedings of the South Dakota Academy of Science, Vol. 75 (1996) 37

38 Proceedings of the South Dakota Academy of Science, Vol. 75 (1996)

Proceedings of the South Dakota Academy of Science, Vol. 75 (1996) 39

40 Proceedings of the South Dakota Academy of Science, Vol. 75 (1996)
Proceedings of the South Dakota Academy of Science, Vol. 75 (1996) 41

42 Proceedings of the South Dakota Academy of Science, Vol. 75 (1996)

Proceedings of the South Dakota Academy of Science, Vol. 75 (1996) 43

44 Proceedings of the South Dakota Academy of Science, Vol. 75 (1996)

Proceedings of the South Dakota Academy of Science, Vol. 75 (1996) 45

46 Proceedings of the South Dakota Academy of Science, Vol. 75 (1996)

Proceedings of the South Dakota Academy of Science, Vol. 75 (1996) 47

48 Proceedings of the South Dakota Academy of Science, Vol. 75 (1996)

Proceedings of the South Dakota Academy of Science, Vol. 75 (1996) 49

50 Proceedings of the South Dakota Academy of Science, Vol. 75 (1996)
Proceedings of the South Dakota Academy of Science, Vol. 75 (1996) 51

52 Proceedings of the South Dakota Academy of Science, Vol. 75 (1996)

Proceedings of the South Dakota Academy of Science, Vol. 75 (1996) 53
54 Proceedings of the South Dakota Academy of Science, Vol. 75 (1996)

Proceedings of the South Dakota Academy of Science, Vol. 75 (1996) 55


Proceedings of the South Dakota Academy of Science, Vol. 75 (1996) 57
EFFECT OF CONTINUOUS CROPPINGON YIELDS AND SOIL FERTILITY FROM
1941 TO 1980 AT BROOKINGS
E. M. WhitePlant Science Department
South Dakota State UniversityBrookings, SD 57007
ABSTRACT
Crop yields are controlled in large part by climate, mainly seasonal pre-cipitation amounts, and by fertility levels. Additions of fertilizer increase wa-ter use efficiency and increase yields in most years. Average yields, over anumber of years, for wheat, oats, rye, barley, and corn were increased, re-spectively, about 6, 20, 14, 15, and 15 bushels per acre by fertilization. Fer-tilization with phosphorus (P) increased soil total P, Bray P, and NaCl P butdecreased soil pH. The total nitrogen (N) of the unfertilized plot soils de-creased 29% from 1942 to 1976, and moderate N fertilizer applications didnot increase the amount significantly. The soil N and Bray P amounts in1941 likely are lower than the amounts originally present in the uncultivatedsoil. In 1908 on the same farm and soil series as the present study, total Nwas reported as 6335 lbs acre-1 and total P was 1330 lbs acre-1. In contrast,the amounts found in 1976 were 3400 lbs N acre-1 and 920 lbs P acre-1. Fer-tilization at recommended rates can increase crop yields without increasingthe content of fertilizer elements in the soil above amounts in the uncultivat-ed soil.
The purpose of this paper is to summarize 40 years of research by vari-ous investigators on plots planted continuously to wheat, oats, rye, barley, orcorn without applications of fertilizer and chemicals. What are the effects oncrop yields and soil fertility? The plots were part of a large study on soilmanagement (Puhr, 1962) that was discontinued in 1961, but the continuous-ly cropped plots were maintained for another 20 years. Half of each plotwas fertilized from 1959 through 1980 to compare crop yields and soil fertili-ty in fertilized and unfertilized plots.
Long-term crop rotations and soil management systems have been evalu-ated for yields and soil fertility at a number of locations (Mitchell et al.,1991). Studies were initiated in 1843 at Rothamsted, England (Allison, 1943),in 1876 at the Morrow plots in Illinois (DeTurk, et al, 1927; DeTurk, 1938),and in 1888 at the Sanborn Field in Missouri (Smith, 1942; Woodruff, 1949).In general, soil organic matter and nitrogen (N) decrease with continuouscropping but rotations with legumes and/or applying manure or cropresidues can reduce the rate of decrease or maintain the amounts in the soil.Phosphorus (P) can limit yields after crops have removed the reserves thataccumulated in the uncultivated soil.

58 Proceedings of the South Dakota Academy of Science, Vol. 75 (1996)
METHODS
Three replications of 28 x 52 foot field plots on Vienna silt loam wereplanted continuously to wheat, oats, rye, barley, sorghum, and corn from1942 through 1980. In 1959, the plots were divided and half of each plotwas fertilized. Corn received 60 lbs (N) acre-1 and 40 lbs P2O5 acre-1 annuallyand small grain received 40 lbs N and 40 lbs P2O5 per acre-1 annually. Grainyields were collected by Puhr from 1941 to 1961 and by the Soil Testing Lab-oratory in 1978 and 1980. Soil analyses of the plow layer (0 to 7 inches)were by Puhr (1962) for 1941 and 1958, by the Soil Testing Laboratory for1968, 1971, and 1980, and by the author for 1976. Analyses in 1976 were:total nitrogen—Kjeldahl, organic matter—Walkley-Black, available potassium--ammonium acetate extraction and flame photometer, total phosphorus--per-chloric acid digestion and ascorbic acid colorimetric procedure, availablephosphorus—Bray weak acid method or by extraction with 0.1 N NaCl, andpH—glass electrode procedure. Results
Average yields from fertilized plots were higher than from unfertilizedones (Table 1). Small grain yields from unfertilized plots were similar in the1942-58 and 1959-80 periods, but corn yields were larger in the second peri-od when hybrid corn was planted. Precipitation was low from September1958 to May 1959 (Table 2), but summer precipitation was sufficient so thatcorn yields were larger from fertilized than from unfertilized plots. Cornplants per acre in the fertilized plots may not have been great enough to useabove-average summer precipitation water. Average corn yields (1959-80)were about 15 lbs acre-1 higher from fertilized plots than unfertilized ones.
Hutton (1933) reported results of a 20-year study (1908-1927) of a corn-oats-wheat-barley-red clover rotation with or without various combinations ofNPK fertilization. These plots were located about 0.1 mile from Puhr’s plots
Table 1. Crop yields (bu/acre) from fertilized (F) and unfertilized (U) plots thatwere continuously cropped.
CROPHarvest Wheat Oats Rye Barley CornYears U F U F U F U F U F
Av. 42-58 19 - 50 - 27 - 34 - 45 -
1959 9 6 26 22 12 17 15 15 35 50
1960 30 30 51 78 33 48 47 56 54 63
1961 16 21 52 71 28 39 27 49 55 71
1978 32 44 41 64 23 49 34 51 65 76
1980 21 37 46 81 29 41 38 62 88 103
5 yr. av. 22 28 43 63 25 39 32 47 59 74

Proceedings of the South Dakota Academy of Science, Vol. 75 (1996) 59
on the same soil type. Average yields from six unfertilized and two NPK-fer-tilized plots were, respectively, for corn—34 and 42, wheat—14 and 17,oats—35 and 36, barley—29 and 39 bu acre-1 or for red clover—806 and 1315lbs acre—. Average yields in the 1933 study are in the lower part of therange reported in Table 1 for the unfertilized continuously cropped plots dur-ing the 1959-80 period. In 1908, total soil nitrogen and phosphorus were, re-spectively, 6335 and 1330 lbs acre-1 in the plow layer. The fertility probablywas higher in the earlier study because the area had been farmed only a fewyears. Thus, fertilization increased yields less in the Hutton study than in thisstudy.
The soil analyses in 1976 (Table 3) for the unfertilized and fertilizedplots, averaged across the six crops, were significantly different for total P,NaCl P, and Bray P. The applied P fertilizer had increased the amount readi-ly available to plants as measured by the NaCl- and Bray-P methods. Theaddition of fertilizer decreased soil pH (Table 3), probably because nitrogenfertilizers characteristically decrease soil pH. Soil pH was also lower in fertil-ized compared to unfertilized plots in 1968, 1971, and 1980 (Table 4). Fertil-ized soils tended to have higher average organic matter contents than the un-fertilized ones (Table 3), but the difference was significant only in 1980(Table 4). Fertilizer increases root growth as well as top growth. Corn andsorghum plots may have the least organic matter (Table 3) because theseplots were cultivated. Small grains were not cultivated and have many fi-brous roots which grow in the plow layer.
The average total P of the unfertilized and fertilized plots in 1976 was460 and 549 ppm, respectively, or a difference of 89 ppm P (Table 3). Forty
Table 2. September through August precipitation at Brookings that affect the1959, 60, 61, 78, and 80 crop yields.
CROP YEAR1959 1960 1961 978 1980
inches/monthSept. 1.91 2.10 2.64 3.70 1.40Oct. 0.13 2.59 0.55 2.34 1.97Nov. 0.97 0.60 0.88 1.49 0.38Dec. 0.10 0.62 1.22 0.73 0.00Jan. 0.23 0.32 0.12 0.15 0.13Feb. 0.36 0.04 0.23 0.00 0.41March 0.00 0.97 0.54 0.75 0.53April 0.32 3.00 0.97 3.77 0.34May 6.81 3.26 6.00 4.17 1.09June 2.43 4.73 4.64 2.89 9.28July 1.60 1.49 2.03 4.03 2.58Aug. 3.06 6.98 5.52 2.25 3.93

60 Proceedings of the South Dakota Academy of Science, Vol. 75 (1996)
pounds of P2O5 fertilizer is equivalent to 8.7 ppm P in the plow layer, assum-ing the soil weighs 2 million pounds. From 1958 to 1976, 157 ppm P wasadded. The 89 ppm P divided by 18 years is about 4.9 ppm P per year thatwas not removed by the crops. Puhr (1962) reported the soil available P (i.e.Bray P) in 1941 and 1962 was, respectively, for corn plots, 107 and 33 lbsacre-1 and for sorghum plots, 122 and 28 lbs acre-1. The Bray P in 1976(Table 3) for unfertilized and fertilized plots was, respectively, 18 and 37ppm (36 and 75 lbs acre-1) for corn and 14 and 41 ppm (28 and 82 lbs acre-1)for sorghum. Thus, the unfertilized plots in 1962 and 1976 had approximate-ly the same amount of available P but the fertilized plots had about two
Table 3. Soil differences in unfertilized (U) and fertilized (F) plots used forcorn, sorghum, oats, wheat, barley, or rye in 1976.§
CROP PROPERTYSoil Corn Sorghum Oats Wheat Barley Rye AVERAGEProperties U F U F U F U F U F U F U F
pH 6.8 6.6† 6.7 6.3† 6.8 6.5† 6.8 6.4 7.0 6.9 6.7 6.5 6.8 6.5**Total N—% 0.16 0.16 0.15 0.16 0.17 0.19* 0.18 0.18 0.18 0.18 0.19 0.20 0.17 0.18Bray P—ppm# 18 37* 14 41** 10 40* 11 41** 28 20 7 37** 15 36*NaCl P—ppm 1.0 2.5† 0.4 2.8* 0.3 2.8* 0.4 3.2* 1.1 2.2 0.4 3.9* 0.6 2.9**Total P—ppm 382 510† 400 515 458 564** 575 534 530 531 478 638* 460 549**Organic matter % 3.1 3.1 2.9 3.0 3.6 3.6 3.4 3.5* 3.5 3.4 3.9 4.0 3.4 3.5
§ Plots were not fertilized from 1942 to 1958, and half of each plot was fertilized after 1958. Means for U and F significantlydifferent at, † p < 0.1, * p < 0.05 and ** p < 0.01. # 1 ppm equals 2 pounds/acre
Table 4. Average properties of the continuous crop plots that were unfertilized(U) or fertilized (F).
SOIL MATERIAL†
Organic Bray P Potassium NitrogenYear Matter % lbs/acre lbs/acre lbs/acre pH
U F U F U F U F U F
1941 - - 109 - - - 4790 - - -1958 - - 29 - - - 3920 - - -1968 2.7 2.7 19 50** 181 184 - - 6.8 6.6**1971 3.0 3.1 31 66** 219 217 - - 6.9 6.6**1976 3.4 3.5 29 72* - - 3400 3600 6.8 6.5* 1980 2.3 2.5** 32 69** 322 312 - - 7.1 6.9**
† Data for 1941 and 1958 from Puhr (1962): 1968 and 1971 unpublished data by Quentin Kingsley and SoilTesting, SDSU: 1980 data from Soil Testing,SDSU.** Means for U and F significantly different at p < 0.01.* Means for U and F significantly different at p < 0.05.

Proceedings of the South Dakota Academy of Science, Vol. 75 (1996) 61
times more available P in 1976. However, the amount reported in 1941 was109 lbs acre-1 so the fertilization rate was not large enough to increase theamount to the 1941 available P level.
The average total N content of the soils in the unfertilized plots was4790, 3920, and 3400 lbs acre-1, respectively, in 1941, 1958, and 1976 (Table3). The decrease in soil N was 51 lbs/acre/year during the 1941-1958 periodand 29 lbs/acre/year during the 1958-1976 period. Hutton (1933) had report-ed 6335 pounds/acre in his plot soils in 1908. If this value is correct forPuhr’s plots, the loss of N was 47 lbs/acre/year from 1908 to 1941. Loss of Nfrom 1908 to 1941 and from 1941 to 1976 was approximately the same. TheN contents of the unfertilized and fertilized plot soils in 1976 were not signif-icantly different. Fertilization has not replenished the N lost in cultivation.
Soil nitrogen and organic matter are closely related because much of thenitrogen is incorporated into organic matter as microbes decompose plant tis-sue. Differences reported in Table 4 for organic matter from one year to oth-ers probably result from differences in laboratory procedures, because differ-ences between fertilized and unfertilized soils are similar from year to year.The average soil has about 20 times more organic matter than nitrogen. In1976, the soils in unfertilized plots had 20 times more organic matter than ni-trogen. If the relationship was correct in 1908 and 1941, the organic mattercontents would have been, respectively, 6.3 and 4.8 percent.
Grain yields are usually greater from fertilized plots than from unfertil-ized ones even in years with below-average precipitation. Fertilizer appliedat recommended rates would not increase the nitrogen and phosphorus toamounts greater than were in the pristine prairie soils.
LITERATURE CITED
Allison, R.V. 1943. The original field plot studies at Rothamsted. Soil Sci.Soc. Am. Proc. 8:6-11.
DeTurk, E.E. 1938. Changes in the soil which have accompanied long-con-tinued cropping. Soil Sci. Soc. Am. Proc. 3:83-85.
DeTurk, E.E., F.C. Bauer, and L.H. Smith. 1927. Lessons from the MorrowPlots. Illinois Agric. Exp. Sta. Bul. 300. p. 105-140.
Hutton, J.G. 1933. The results of twenty years complete soil fertility tests,Brookings, SD. SD Agric. Exp. Sta. Bul. 280. 20 p.
Mitchell, C.C., R.L. Westerman, J.R. Brown, and T.R. Peck. 1991. Overview oflong-term agronomic research. Agronomy J. 83:24-29.
Puhr, L.F. 1962. Twenty years of soil management on a Vienna silt loam.South Dakota Agric. Exp. Stat. Bull. 508.
Smith, G.E. 1942. Sanborn Field. Missouri Agric. Exp. Sta. Bul. 458: 1-61.Woodruff, C.M. 1949. Estimating the nitrogen delivery of soil from the or-
ganic matter determination as reflected by the Sanborn Field. Soil Sci.Soc. Am. Proc. 14:208-212.


Proceedings of the South Dakota Academy of Science, Vol. 75 (1996) 63
GRAVITY BASE STATIONS IN SOUTH DAKOTA
Ronald L. Zawislak Department of Geography and Geology
Middle Tennessee State University Murfreesboro, TN 37132
ABSTRACT
Thirty-two gravity base stations of record are described for South Dakota. Astation of record is defined as: having an accuracy of at least 0.1 mgal., being onfile as a base station in the United States Geological Survey’s gravity database, hav-ing a field location readily discernible to within 1/2 foot, and preferably marked.
During field work for the new South Dakota Bouguer Anomaly Map, a checkof existing base stations was conducted. Several new base stations were measuredand monumented; some older stations were excluded because of site destructionor accuracy requirements. A network of base stations at intervals of approximate-ly 50 miles has been established throughout the state. Station spacing is greater inthe northwest.
Each station’s name (town), latitude, longitude, elevation, and observed gravi-ty is listed. Brief, specific local directions are given to each site. These base sta-tions comprise a fundamental gravity reference for the state.
INTRODUCTION
The most accurate gravity surveys are land based and involve measuring “g”,the acceleration due to gravity at ground level (Robinson and Coruh, 1988). The in-strument used is the gravity meter, a sensitive balance in which small changes in gexert torques on a mass of fixed size. As learned in basic physics, g for the earthat sea level averages about 980 cm/sec/sec. These units are termed “gals”, afterGalileo. Units of one thousandth of a gal, the milligal, are commonly used. Thusg for earth averages about 980,000 mgal. at sea level.
Gravity meter readings are relative; that is, the given meter reading is theamount of change from a location where observed gravity is accurately known.These reference locations can be divided into two general types, primary and base.At primary stations, the total value of g was determined. This is a painstaking andcumbersome measurement commonly using either a pendulum or falling weight.Accuracies of .04 to .06 mgal. are typical (Hammond and Faller, 1971). The morecommon base stations have their values determined relatively, by measuring the dif-ference from a known reference (primary or another base). A gravity meter is used;this is a fast and simple measurement. Gravity meters, such as the LaCoste andRomberg instrument, are capable of measuring gravity variations as small as 0.01mgal. Thus, differences in g can be measured more accurately and quickly than theactual value of g.
In 1987 the writer began field work for the new South Dakota gravity anoma-ly map (Zawislak, 1989). A typical day’s survey consisted of a loop of 50 mea-

64 Proceedings of the South Dakota Academy of Science, Vol. 75 (1996)
surements beginning and ending at a base station. In this work it was essential tohave access to a nearby base station. In early 1987, approximately 25 South Dako-ta base stations were on file with the United States Geological Survey (USGS) in thegravity database for the US (Kucks, 1987). Many of these were established in thelate 1960’s by geodetic teams of the US Air Force. This was in conjunction withwidely spaced gravity survey work related to Air Force missile installations in thenorth central and northwestern US.
In the course of the South Dakota survey work, it was discovered that some ofthe base stations had been destroyed, and that some were not of sufficient accura-cy (in location and/or g value). As a second project, the writer undertook a re-connaissance of all the state’s gravity base stations and the establishment of newones where needed.
CONSIDERATIONS
Some earlier base station work, particularly that of the US Air Force, has notwithstood the test of time. Many of the stations were installed at airports. Unfor-tunately, over the past 25-30 years, commercial air travel grew rapidly. Old airportswere expanded, replaced, or abandoned; base station sites were often destroyed.
Some recent work involved establishment of what will be termed “temporary”base stations (C. Magee, 1988). These were carefully measured sites, such as a pointat the side of the road, that were used for several days as the reference for localgravity studies, then abandoned and never monumented. It soon became appar-ent to the writer that the concept of a gravity base station needed to be carefullydefined before a list could be drawn up.
For the purposes of this report, only gravity base stations of record are listed.Stations of record:
1. have gravity measured to at least 0.1 mgal. accuracy; 2. are on file as a base in the USGS’s gravity database; 3. have a field location identifiable to with 1/2 foot (horizontally and vertically); 4. are monumented (preferably) — usually as a gravity base, or, sometimes an
existing bench mark is used. The 1/2 foot location requirement is of particular importance in the vertical. Grav-ity changes as the inverse square of distance from earth’s center. A one foot changein elevation amounts to a 0.1 mgal. change in gravity (Robinson and Coruh, 1988).Practically, if the station’s exact site is not marked (or at least measured with respectto some nearby object), it is seldom possible to relocate within 1/2 foot.
PROCEDURE FOR NEW BASES
Gravity surveys in large areas of the state with no nearby bases led the writerto conclude that a base station spacing of about 50 miles was most expeditious. Aclose base is convenient. It saves time by reducing the survey team’s travel. On theother hand, it takes time, about one day, to set up each monumented base.
New base stations were installed at towns with restaurants, lodging, and accessto major roads, in other words, in locations from which future gravity surveys couldbe conveniently centered. Readily accessible landmark buildings, not likely to betorn down, were the first choice. The county courthouse (steps, porch, foyer, etc.)

Proceedings of the South Dakota Academy of Science, Vol. 75 (1996) 65
being a common location, the station should be as “permanent” as reasonably pos-sible. The following steps were involved.
Field: 1. Select location, obtain permission to place station. 2. Carefully measure gravity at an existing base station. 3. Drive to the new location, carefully measure gravity. 4. Drive back to existing base station, carefully measure gravity. 5. Repeat steps 3 and 4 until 2 to 4 measurements are obtained for the
new station. 6. Affix (bolt and epoxy glue) the marker plate at the new site.
Office: 1. Reduce data: correct for earth tides, minor instrument drift, etc.—a stan-dard procedure (Dobrin and Savit, 1988).
2. Prepare (draft) a locator sheet with: area map, directions to the new sta-tion, observed gravity, latitude and longitude, elevation, etc.—a stan-dard USGS format.
3. Send results to USGS for incorporation into the national gravitydatabase.
RESULTS
There are presently 32 gravity base stations of record in South Dakota. Figure1 shows their statewide location. Station spacing averages about 50 miles through-out most of South Dakota. However, in the northwest, spacing is greater. Table 1lists the following basic data for each station: name, elevation, latitude, longitude,observed gravity. Table 2 gives specific local directions to each of the stations.Table 3 lists 18 South Dakota gravity base stations that are on file with the USGSbut do not meet the criteria defined above. These stations were excluded.
The directions in Table 2 should enable the reader to find the station’s markerplate, where present; or at least the spot, if no longer monumented. In the eventthe site cannot be found, a copy of the locator sheets is available, at cost, from thewriter or from the geophysical branch of the Denver USGS.
Figure 1. Distribution ofGravity Base Stations.

66 Proceedings of the South Dakota Academy of Science, Vol. 75 (1996)
Table 1. South Dakota Gravity Base Station Data.
No. Station Elev. Latitude (N) Longitude (W) Obs. Gravity*
(ft.) (deg.,min.) (deg., min.) (mgals)
1 Aberdeen Cthouse 1303 45 27.87 98 29.17 980531.28
2 Bison 2782 45 30.90 102 28.35 980423.35
3 Britton 1366 45 47.45 97 45.24 980550.60
4 Brookings 1638 44 19.02 96 46.93 980414.33
5 Buffalo 2876 45 35.00 103 33.00 980431.34
6 Chamberlain 1720 43 47.40 99 19.20 980327.55
7 Dupree 2380 45 2.85 101 36.08 980396.54
8 Eleven Mile 2395 44 11.81 101 39.99 980311.22
9 Gettysburg 2161 45 0.68 99 57.23 980436.81
10 Hayes 2050 44 22.37 101 2.02 980349.08
11 Hot Springs 3460 43 25.89 103 28.50 980173.13
12 Huron 1283 44 23.00 98 33.30 980438.59
13 Kadoka 2460 43 49.95 101 30.60 980266.59
14 Lake Andes 1480 43 9.16 98 32.52 980280.69
15 Martin 3330 43 10.50 100 44.10 980160.61
16 McIntosh 2301 45 55.27 101 21.00 980497.73
17 Mitchell 1290 43 46.12 98 2.39 980367.33
18 Mobridge 1715 45 33.00 100 24.00 980511.73
19 Murdo 2326 43 53.38 100 42.78 980264.63
20 Philip 2162 44 2.33 101 39.97 980313.38
21 Pierre 1719 44 22.85 100 17.02 980405.08
22 Pine Ridge 3235 43 1.45 102 33.75 980144.54
23 Rapid City 3202 44 4.90 103 12.90 980257.16
24 Redfield 1303 44 52.61 98 31.00 980496.00
25 Sansarc 2080 44 31.89 101 2.02 980378.35
26 Scenic 2809 43 46.73 102 33.07 980261.86
27 Sioux Falls 1450 43 34.20 96 44.00 980345.21
28 Vermillion 1234 42 47.05 96 55.72 980309.54
29 Watertown 1731 44 53.91 97 6.85 980452.12
30 Webster 1857 45 19.95 97 31.29 980482.25
31 White River 2067 43 34.05 100 44.70 980244.95
32 Winner 2038 43 23.40 99 50.55 980239.31
* Referenced to ISGN 1971 Datum.

Proceedings of the South Dakota Academy of Science, Vol. 75 (1996) 67
Table 2. Local Directions to Gravity Base Stations.
1 Aberdeen Cthouse — at the (new) south entrance to the Brown Co. Court-house in Aberdeen; on the east side of a covered entry, about 3 feet in front ofthe doors; monumented with a USGS aluminum gravity base plate.
2 Bison — at the Perkins County Airport, near Bison; on the concrete at the eastedge of the south door of a white wooden hanger between older hangers;marker plate absent but some glue remains, location obvious.
3 Britton — at the north (Hwy 10) side of the Marshall Co. Courthouse in Brit-ton; at the southwest corner of an outside landing; monumented with a USGSaluminum gravity base plate.
4 Brookings — on the South Dakota State Univ. campus in Brookings; on a con-crete pad at the southwest corner of the Student Union Building; beside a benchmark and electric box; monumented with a USGS aluminum gravity base plate.
5 Buffalo — in north Buffalo, west of US Route 85, on the grounds of BuffaloHigh School; in the southeast corner of a 6 feet high woven wire fence; at themonumented bench mark stamped “B32 1934”.
6 Chamberlain — at the airport, south of Chamberlain; at the southeast cornerof the most westerly hanger; on the concrete building footing; monumentedwith a USAF gravity disk.
7 Dupree — at the Ziebach Co. Courthouse in Dupree, 25 feet from the main(west) entrance; 1 foot north of a flagpole and 1 foot lower in elevation than anearby bench mark; monumented with a USAF gravity disk.
8 Eleven Mile — 10 miles north of Philip (Hwy 73) at “eleven-mile” intersection;on the southeast side of the intersection at existing bench mark K371 1962.
9 Gettysburg — at the Potter Co. Courthouse in Gettysburg; outside, at the southend of the top step to the west entrance; marker plate absent, location obvious.
10 Hayes — near the T5N, R25E, S24/25 and T5N, R26E, S19/30 corner; on thenortheast side of a short curving road segment that bypasses this corner; at abench mark labeled “Hayes 1952”.
11 Hot Springs — at the Post Office in Hot Springs; on the front (south) porch land-ing, 3 feet west of the entrance doors; marker plate absent, location obvious.
12 Huron — one mile north of Huron, at the airport; on a concrete step to theeast door of a stone and mortar hangar; marked with a bronze disk stamped“USC&GS Gravity Station”.
13 Kadoka — inside the Post Office in Kadoka; on the tile floor at the window be-tween the two northeast corner entrances; monumented with a USAF gravity disk.
14 Lake Andes — south of Lake Andes, at a gas station on Hwys 281 and 18, and0.25 miles west of the junction with Hwy 50; at the west corner of the stationbuilding, on the concrete sidewalk; marker plate absent, location obvious.
15 Martin — inside the Post Office at Martin; in the mailbox room, at the north-west corner, 8 feet north of the entrance; marker plate absent, location obvious.
16 McIntosh — at the Corson Co. Courthouse in McIntosh; on the northwest cor-ner of the concrete base of the south steps leading to the porch at the main en-trance; marker plate absent, location obvious.
17 Mitchell — at the Municipal Airport north of Mitchell; on the field side of thewooden frame hanger, at the northeast corner of the sliding door casing, on theconcrete floor; remonumented with a USGS aluminum gravity base plate.

68 Proceedings of the South Dakota Academy of Science, Vol. 75 (1996)
18 Mobridge — at the Mobridge Airport, at a hanger 200 yards east of the Na-tional Guard Armory; beside a power pole next to a phone booth at the north-west corner; monumented with a USAF gravity disk.
19 Murdo — in Murdo, on the sidewalk directly in front of the corner stone ofthe First Fidelity Bank on Main Street; the corner stone is monumented as“USC&GS BM E9 1925”.
20 Philip — at the Haakon County Courthouse in Philip; on the north side of thetiled top step to the S. Howard St. entrance; at the monumented site “USC&GSBM J-22 1933”.
21 Pierre — at the Pierre Municipal airport; on the field side of the terminal, atthe east corner of the building on the concrete apron, 50 feet from the lobbyentrance; marker plate absent, location obvious.
22 Pine Ridge — in Pine Ridge, at the Sioux Indian Agency complex; in the cen-ter of the north sidewalk of Main Street; approximately 100 feet west of the RedCloud Center, and just southwest of the Oglala Tribal Office; monumented witha brass disk inscribed “Bureau of Indian Affairs ‘A’”.
23 Rapid City — at Community Care Center, Inc. (formerly the Municipal Build-ing, main entrance to west) in Rapid City; inside and 2 feet east of the doors, inthe corner of the tile floor; monumented with a US National Gravity Base disk.
24 Redfield — outside the Redfield Post Office; on the concrete landing at thetop step of the main (north) entrance, and just to the west of the doors; mark-er plate absent but some glue remains, location obvious.
25 Sansarc — at the corner of T7N, R25E, S25/36 and T7N, R26E, S30/31; 10.8miles north of Hayes at the northwest corner (roadside) of an intersection ofgravel roads; monumented as bench mark “MC67” (reset 1977).
26 Scenic — in southern Scenic, near Hwy 40, at the school; in the northeast cor-ner of the landing at the top of the stairway to the main entrance; marker plateabsent but some glue remains, location obvious.
27 Sioux Falls — inside the Post Office, in the Federal Building at S 2nd and E12th Streets; on the terrazzo floor, in the southwest corner (formed by entrancevestibule and outside wall) of the mailbox room; monumented with a Nation-al Gravity Base disk.
28 Vermillion — on the University of South Dakota campus in Vermillion; out-side the main (Dakota Street) entrance to Akeley Science Center; on a coveredconcrete walk, against the building wall and just north of the entry doors; mon-umented with a USGS aluminum gravity base plate.
29 Watertown — outside the back (2nd Ave S) entrance to the Codington Co.Courthouse; on a landing, and 3 feet to the east of the entry doors; monu-mented with a USGS aluminum gravity base plate.
30 Webster — outside the east entrance to the Day Co. Courthouse; on the gran-ite floor of a covered porch, against the wall and 8 feet north of the entry doors;monumented with a USGS aluminum gravity base plate.
31 White River — inside the White River Post Office; on the floor at the southside of an enlarged mailbox room; monumented with a USAF gravity disk.
32 Winner — one mile north of Winner, at the airport; on the concrete ramp about10 feet north of the northeast corner of the maintenance shop, and beside a con-crete pad that once had a gas pump; monumented with a USAF gravity disk.

Proceedings of the South Dakota Academy of Science, Vol. 75 (1996) 69
Table 3. USGS On-file Base Stations Not Meeting Criteria.
Station & Location (County) Reason Excluded
Aberdeen (old), Brown Co. destroyed — new construction Spearfish, Lawrence Co.
Bowdle, Edmunds Co. moved (by tornado)
Egan, Moody Co. 0.3 mgal. accuracyHerreir,Campbell Co.Junction City, Clay-Union Co. line
Highmore (old), Hyde Co. not found (destroyed?)
Highmore* (new – airport), Hyde Co. never monumented, near base of phone pole (abandoned, location within 1 to 4 ft.?)
Lees Corner*, Buffalo Co. never monumented, Midland*, Haakon Co. a spot beside or in road Miller*, Hand Co. (location within 2 to 5 ft.?)Standing Butte Ranch*, Stanley Co.Stony Butte*, Lyman Co.
BA2.1423*, Stanley Co. location uncertain (at a bench mark?),
BA2.1326*, Hughes Co. never monumented, BA2.1651*, Jerauld Co. a spot beside or in roadBA2.1718*, Hand Co. (location within 2 to 5 ft.?)BA2.2300*, Hughes Co.
* These 1987 EDCON bases were carefully measured and may be useable if exactsite can be relocated.
ACKNOWLEDGMENTS
Initial funding for the first year of reconnaissance was provided by the Univer-sity of South Dakota. The United States Geological Survey (W. Pratt, T. Hilden-brand, W. Day) and the South Dakota Geological Survey (L. Hedges, M. Tipton, C.Christensen) funded surveys for the new state gravity map, which is nearing com-pletion. Base station work was a necessary part of this project. John Ahart assist-ed in checks of existing stations and in installation of new bases. C. Magee (ED-CON) provided data on base stations added in late 1987. Robert Kucks (DenverUSGS) helped with data reduction. Julia Heaton reviewed the data.

70 Proceedings of the South Dakota Academy of Science, Vol. 75 (1996)
REFERENCES CITED
Dobrin, M.B., and C.H. Savit. 1988. Introduction to Geophysical Prospecting. Mc-Graw-Hill Book Company, New York.
Hammond, J.A., and J.E. Faller. 1971. Results of absolute gravity determinations ata number of different sites. J. of Geophys. Research. 76:32:7852.
Kucks, R. 1987. Personal communication. Geophysical Branch, U. S. Geol. Survey,Denver.
Magee, C. 1988. Personal communication. Exploration Data Consultants, Inc. (ED-CON), Denver.
Robinson, E.S., and C. Coruth. 1988. Basic Exploration Geophysics. John Wiley andSons, New York.
Zawislak, R.L. 1989. The status of detailed gravity mapping in South Dakota. Proc.S.D. Acad. Sci. 68:101-105.

Proceedings of the South Dakota Academy of Science, Vol. 75 (1996) 71
COMPARISON OF TWO METHODS FOR MEASURING SOIL PHOSPHORUS DESORPTION
QUANTITY-INTENSITY RELATIONSHIPS
James J. Doolittle and Jin-Ho Lee Department of Plant ScienceSouth Dakota State University
Brookings, South Dakota 57007
ABSTRACT
Information about phosphorus desorption quantity-intensity (Q/I) relation-ships in soil is useful for environmental evaluations. The objective of this studywas to investigate a simplified membrane procedure to determine the phos-phorus (P) desorption Q/I relationships of soils. Samples of four South Dako-ta soil series, Egeland, Fordville, Lakoma, and Opal, were enriched with 100mg P kg-1 and incubated for 2 weeks. Subsamples of each enriched soil sam-ple were equilibrated with different amounts of bicarbonate-saturated anion-exchange resin beads in a mesh bag and membrane disks for 72 h. Theamount of P extracted from a soil by anion-exchange resin was relatively smallcompared with the total P. The amount of P extracted by the resin membranefrom each soil was similar to that extracted by the resin bag even though theexchange capacity of the resin membrane was much lower than that of theresin bead bag. The coefficient of determination (R2) ranged between 0.976and 0.998. Quantity-intensity parameters measured by both procedures weresimilar for each soil. The intensity parameter (Io) ranged between 1.42 and 3.82mg P L-1 for the resin bag procedure, and between 2.34 and 3.89 mg P kg-1 forthe resin membrane procedure. The phosphorus release capacity parameter(Qmax) ranged between 90.9 and 173.1 mg P kg-1 when measured by the resinbag procedure, and between 35.2 and 92.4 mg P kg-1 when measured by theresin membrane procedure. Buffering power, |BPo|, ranged between 22 and29 L kg-1 using the resin bag procedure and between 16 and 52 L kg-1 using theresin membrane procedure. The resin membrane procedure measured slight-ly lower |BPo| for each soil except Fordville. Substituting a resin membranefor the resin bead bag in the P desorption Q/I method simplified the procedureand produced similar results.
INTRODUCTION
Information about P desorption Q/I relationships in soil is useful for envi-ronmental evaluations and for studying P movement in soil. Phosphorus des-orption Q/I parameters can be affected by physical and chemical properties ofsoils (Raven and Hossner, 1993). Anion-exchange resins are frequently usedto extract plant available phosphorus from soils. The resin method gives bet-ter correlation with plant uptake than chemical extractant methods because it

72 Proceedings of the South Dakota Academy of Science, Vol. 75 (1996)
simulates P desorption by plant roots (Kadeba and Boyle, 1978). The resinmethod traditionally uses anion-exchange resin beads in a nylon mesh bag(Sibbesen, 1977, 1978; Bache and Ireland, 1980; Raven and Hossner, 1993);however, many researchers have adopted the use of an anion-exchange resinmembrane (Saggar et al., 1990; Cooperband and Logan, 1994). The anion-ex-change membrane procedure has some advantages over the anion-exchangeresin bag procedure, in that it is easier to remove soil particles and fine rootmaterials. These materials often get trapped in the resin bags. If the debris isnot removed by thorough washing, it interferes with the analysis (Saggar et al.,1990). However, the anion-exchange membranes have not been used to studyP desorption Q/I relationships (P buffering power).
The objective of this study was to investigate the possibility of using an-ion-exchange membranes to determine P desorption Q/I relationships in soils.
MATERIALS AND METHODS
Soils
Four soils from South Dakota were studied: Egeland (coarse-loamy, mixedUdic Haploborolls), Fordville (fine-loamy over sandy or sandy-skeletal, mixedPachic Udic Haploborolls), Lakoma (fine, montmorillonitic, mesic Typic Us-tochrepts), and Opal (fine, montmorillonitic, mesic Leptic Udic Haplusterts).The samples were air dried and crushed to pass through a 2-mm sieve. Se-lected physical and chemical properties of the soils are presented in Table 1.
Determination of Phosphorus Desorption Q/I Relationship
Resin and Resin Bags. Bags, 4 cm x 4 cm, were prepared by cutting doublesheets of nylon meshes (Nitex 100% polyamide fiber, 75-mm opening, TetkoInc., New York) with hot iron rod. Bicarbonate -saturated Dowex 1-X8 anion-exchange resin (300-850mm diam. Bead, Bio-Rad Laboratories, Richmond CA)was used as a phosphorus sink. Sets of mesh bags containing 0, 0.0075, 0.015,0.03, 0.05, 0.1, 0.2, 0.5, 1.2, and 3 g of resin (oven-dry basis) were prepared.
Table 1. Select chemical and physical properties of soils studied.

Proceedings of the South Dakota Academy of Science, Vol. 75 (1996) 73
Resin Membranes. The anion-exchange resin membrane used was a com-mercially available synthetic resin (BHD Chemicals Ltd., England) in the formof 125 mm2 sheets with mechanical, chemical and electrical properties suitablefor shaking with soil. The purchased resin membrane was cut into disks, 6.35mm in diameter (0.0035-0.004 meq of charge) to determine P desorption Q/Irelationships, and into strips 60 mm long and 25 mm wide (0.18-0.19 meq ofcharge) to determine amount of extractable P comparing with those from 1 gof resin bag (0.93-0.96 meq of charge). The round disks were connected intochains of 0, 1, 2, 3, 4 and 6 disks using monofilament thread.
Procedure. Each soil was studied in duplicate samples. Four grams of soil,oven-dry basis, were weighed into plastic vials, one for each resin bag or mem-brane disk to be used. Forty (40) ml of deionized water and 8 to 10 drops ofchloroform were added to each vial. The proper resin bag or membrane diskwas placed into the vial. The vial was covered with a perforated lid and thenequilibrated for 72 hours on a wrist-action shaker. Chloroform (8 to 10 drops)was added every 24 hours to suppress microbial growth. After equilibration,the resin bags or membrane disks were removed from the vials, washed freeof soil particles with deionized water, and placed on watch glasses. Phospho-rus was desorbed from the resin by putting the bags or membrane disks intovials containing 50 ml of 0.5 M NaCl. After shaking for 30 min, the extractswere filtered, the resin bags or membrane disks washed with deionized water,and the final volumes made to 100 ml. Soil solution samples were obtainedby centrifuging the suspensions at 20,000 x g for 30 min after allowing the soilsuspension to post-equilibrate for 1 hour. Clay particles still in suspension af-ter centrifugation were removed using a 0.2-mm millipore filter.
Measurement of P Concentrations. Phosphorus concentration in resin ex-tracts and post-equilibration solution samples were measured by the Murphy andRiley procedure using aspectrophotometer set at awavelength of 880 nm(Olsen and Sommers, 1982).
Desorption Q/I Curvesand Related Parameters.Quantity and intensity weredefined as the amounts of Pextracted by the resin andthe corresponding solutionP concentration, respective-ly. Characteristic parame-ters were derived from theQ/I curves, and the relatedparameters, Qmax , Io, BPi,and BPo, are represented inFigure 1.
Figure 1. Theoretical soil desorption Q/Icurve and related parameters.

74 Proceedings of the South Dakota Academy of Science, Vol. 75 (1996)
Mathematical Model for P Desorption Q/I Curve. The equation Q = a I-1 + b ln(I + 1) + c as developed by Raven and Hossner (1993) fit our da-ta. Here aI-1 is a hyperbolic function and determines the shape of the curve atrelatively low I values, b ln(I+1) is a logarithmic function, and c is a verticalshifting factor.
Resin Treatment and Regeneration. To desorb the resin extracted P forquantification the resin bags or membrane disks were put in a 0.5 to 1 M HClsolution and equilibrated for 2 h with intermittent shaking. The acid solutionwas decanted and then new 0.5 to 1 M HCl solution was added. After the sec-ond acid solution was decanted, the resin bags or membrane disks werewashed several times with deionized water to remove excess acidity. A 1 MNaHCO3 solution was added in two portions to begin saturating the resin withHCO3
-. The resin bags or membrane disks were leached with a 0.5 M NaHCO3
solution until no chloride was detected in the leachate, and then the bags ordisks were washed several times with deionized water to eliminate excess saltand stored at 95% to 100% relative humidity.
RESULTS AND DISCUSSION
Desorbed soil P is composed of solution P and solid-phase P. The small-er the solution P concentration, the smaller the proportion of solution P in thetotal desorbed P. As desorption of P from the soil begins, the proportion ofthe solution P in the total desorbed P is highest. If the P in the soil is deplet-ed, the total desorbed P contains very little solution P. The amount of P ex-tracted from a soil by anion-exchange resin is relatively small compared withthe total soil P (Tables 1 and 2).
Table 2. P desorption Q/I parameters determined by use of resin bag and resinmembrane procedure.

The amount of P ex-tracted might be dependentupon the relationship be-tween the soil propertiesand the exchange capacityof the resin system. In thisstudy, the amount of P ex-tracted by the resin mem-brane from each soil was al-most the same as that ex-tracted by the resin bageven though the exchangecapacity of the resin mem-brane was much lower thanthat of the resin bead bag.The resin membrane ex-tracted P was closely relat-ed to that extracted by resinbag procedure (Fig. 2). Thecoefficient of determination(R2) ranged between 0.976and 0.998 (Fig. 3).
In both soil-water resinbag or resin membrane sys-tem, a solution P concen-tration equal to zero is un-likely to occur, more be-cause of the faster resin-so-lution anion-exchangeequilibrium than becauseof the slower rate of ap-proach to equilibrium be-tween soil and solution. Atleast traces of P will alwaysbe in the solution. Thedesorption Q/I equation in-timately described the ex-perimental data, as judgedfrom the R2 values. Usuallyanticipated Q/I concavecurves could not be ob-tained with the untreatedLakoma and Opal samples;however, expected curvefits were obtained with un-treated Egeland andFordville samples which
Figure 2. Comparison between the amount ofP extracted by resin bag and resin membranefrom the soil samples.
Figure 3. Relationship between the amount ofP extracted by resin bag and resin membranefrom the soils samples.
Figure 4. Phosphorus desorption Q/I curvesfor the enriched soil samples determined byuse of resin bag and resin membrane proce-dure.
Proceedings of the South Dakota Academy of Science, Vol. 75 (1996) 75
76 Proceedings of the South Dakota Academy of Science, Vol. 75 (1996)
had relatively moderate to high levels of available P (data not shown). We ob-tained better curve fits with 100 mg P kg-1 enriched samples (Fig. 4). The R2
ranged between 0.997 and 0.999 using resin bag procedure, between 0.943 and0.978 using resin membrane procedure (Table 2). The relationship betweencurve-fitting parameters and the soil P enrichment did not show any specific orcharacteristic trend. The values of Io, an index of the intensity factor, rangedbetween 1.42 and 3.82 mg P L-1 for the soils determined by use of resin bagprocedure, and ranged between 2.34 and 3.89 mg L-1 for the soils determinedby using resin membrane procedure. The values of Qmax, an index of P re-lease capacity, ranged between 90.9 and 173.1 mg P kg-1 for the soils deter-mined by use of resin bag procedure, and ranged between 35.2 and 92.4 mgkg-1 for the soils determined by using resin membrane procedure. However,the relationships between Io or Qmax and other soil properties were not veryclose. The |BPo| values, indices of the P buffering power, ranged between 22and 29 L kg-1 for the soils determined by use of resin bag procedure, andranged between 16 and 55 L kg-1 for the soils determined by using resin mem-brane procedure. The |BPo| values tended to be associated with silt and claycontent in the soils (Tables 1 and 2). These results indicate anion-exchangeresin membrane behaves in a similar manner to the anion-exchange resinbeads.
CONCLUSION
Four soil samples used in this study had a relatively low to moderate orhigh capacity to release phosphorus. The amount of P extracted by the resinmembrane from each soil was almost the same as that extracted by the resinbag even though the exchange capacity of the resin membrane was much low-er than that of the resin bead bag. The resin membrane extracted P was close-ly related to that extracted by resin bag procedure. Also the results of P des-orption Q/I relationships determined using both procedures were closely relat-ed. Substituting a resin membrane for the resin bead bag in the P desorptionQ/I method simplified the procedure and produced similar results.
REFERENCES
Bache, B. W., and C. Ireland. 1980. Desorption of phosphate from soils usinganion exchange resins. J. Soil Sci. 31:297-306.
Brewster, J. L., A. N. Gancheva, and P. H. Nye. 1975. The determination ofdesorption isotherms of soil phosphate using low volumes of solution andan anion exchange resin. J. Soil Sci. 26:364-377.
Cooperband, L. R., and T. J. Logan. 1994. Measuring in situ changes in labilesoil phosphorus with anion-exchange membrane. Soil Sci. Soc. Am. J.58:105-114.
Kadeba, O., and J. R. Boyel. 1978. Evaluation of phosphorus in forest soils:comparison of phosphorus uptake, extraction method and soil properties.Plant and Soil. 49:285-297.

Proceedings of the South Dakota Academy of Science, Vol. 75 (1996) 77
Olsen, S. R., and L. E. Sommers. 1982. Phosphorus. p. 403-430. IN A.L. Pageet al. (ed.) Methods of soil analysis. Part 2. 2nd ed. Agron. Monogr. 9. ASAand SSSA, Madison, WI.
Raven K. P., and L. R. Hossner. 1993. Phosphorus Desorption Quantity-Inten-sity Relationships in Soils. Soil Sci. Soc. Am. J. 57:1501-1508.
Saggar, S., M. J. Hedley, and R. E. White. 1990. A simplified resin membranetechnique for extracting phosphorus from soils. Fertilizer Research. 24:173-180.
Sibbesen, E. 1977. A simple ion-exchange resin procedure for extractingplant-available elements from soil. Plant and Soil. 46:665-669.
Sibbesen, E. 1978. An investigation of the anion-exchange resin method forsoil phosphate extraction. Plant and Soil. 50:305-321.

Proceedings of the South Dakota Academy of Science, Vol. 75 (1996) 79
CALIBRATION OF A DIGITAL CAMERA FORCONTRAST RATIO MEASUREMENT
Justin Williams and Oren QuistPhysics Department
South Dakota State UniversityBrookings, SD 57007
ABSTRACT
A pertinent parameter to evaluate the readability of a Changeable MessageSigns’ (CMS) performance is the Contrast Ratio, which is the ratio of the lightintensity of the message area to that of the background area of the sign. Lightintensity in this context implies light illuminance values from the sign as de-tected by the measuring device. In order to effectively evaluate the Contrast Ra-tio of CMS signs, a photometric measuring system is needed that can quicklymake light intensity readings under a variety of environmental conditions. Thispaper describes research done in developing such a system, concentrating onthe calibration of the digital camera used.
An AppleTM Quicktake 100 digital camera was chosen as the image captur-ing device for the application. The camera was tested for various parameterssuch as shutterspeed, resolution, and spectral response that would be neededin later areas of the calibration. The response of the camera to changes in dis-tance and angle were determined to establish the limits of the camera’s effec-tiveness. The camera was calibrated to a known intensity source resulting in atransfer function relating the intensity of the source as seen by the camera (il-luminance) to the digital number output of the camera.
INTRODUCTION
There is much information that can be determined from the light that is ei-ther radiated, transmitted, or reflected by an object. One such application ofthis is in the determination of the visibility and readability of signs from mea-surements of the light intensity of their various components. In recent years,one of the most serious attempts to improve highway safety and the effective-ness in conveying information to motorists is the development of real-timeroad-side information displays in the form of Changeable Message Signs(CMS’s). These CMS’s are used to convey various appropriate messages underdiffering conditions without the need to clutter the road side with numerousconfusing signs. The Office of Implementation of the FHWA has published areport entitled, “Guidelines on the Use of Changeable Message Signs” (Dudek,1991). This report provides guidelines and standards for various message andlighting parameters associated with CMS performance. One pertinent parame-ter to evaluate CMS performance is the Contrast Ratio, which is the ratio of thelight intensity of the message to that of the background area of the sign. For

80 Proceedings of the South Dakota Academy of Science, Vol. 75 (1996)
sign companies and others interested in this type of information, it can be alengthy and expensive process. The equipment needed is expensive and verysensitive. To facilitate the measurement of the Contrast Ratio parameter duringsign field testing, a different system is needed that quickly can make light in-tensity readings under a variety of environmental conditions. A solution to thisproblem is a digital camera.
A digital camera is like any other camera except that it uses a charge cou-pled device (CCD) chip in place of film as the image recorder. Digital camerasstore images by associating digital numbers with the light received by individ-ual CCD pixel elements. Typical cameras store 24 bits of data per pixel; eighteach for Red, Green, and Blue (RGB) channels. Interesting physics is uncov-ered as one tries to calibrate the results and convert the digital numbers to lu-minous intensities. This paper reports on these physical properties as they re-late to an AppleTM Quicktake 100 digital camera.
METHODS
Calibration of the digital camera was broken up into several tasks. Theseincluded benchmarking, data collection, data analysis, interpretation of the re-sults, calibration, and uncertainty.
Before calibration of the camera could begin, all of the various parametersof the camera had to be tested or “benchmarked” to determine what effect theymay have on the measurement of light intensity. The first such parameters tobe measured were the shutterspeed and aperture. The shutterspeed was mea-sured by taking images of a rotating disk with an LED at its edge. By measur-ing the angle through which the image of the LED passed in the image, alongwith measurements of the angular speed and radius of the disk, the shutter-speed was determined. Measurements were taken at varying light intensitiesand it was found that the shutterspeed increased with increasing intensity.Since the intensity of light incident upon the CCD is dependent upon the ex-posure time, the shutterspeed has to be controlled. This was accomplishedthrough an electro-optical circuit that provides a constant input to the sensorthat regulates the shutterspeed. The aperture also was found to vary with theshutterspeed. The aperture was held constant by covering the light meter thatcontrolled the aperture.
The spatial resolution of the camera was established. Images were takenof measuring standards at known distances. The results of this are shown inFigure 1. This shows the camera’s resolution versus distance in linear units. theappropriate analysis shows that one pixel encompassed approximately 1.20x10-
6 steradians per pixel. This information was useful in the next section of thecalibration. Images were obtained of a constant light source at different dis-tances. The results of this are shown in Figure 2. It can be seen from this fig-ure that the digital numbers obtained from the source remain constant out toa distance of approximately forty five feet. This data remains consistent withthat obtained from the resolution of the camera. Once again, Figure 2 showsthat for the one inch target used, the maximum distance at which one imagepixel would still entirely encompass one target pixel would be about sixty feet.

Proceedings of the South Dakota Academy of Science, Vol. 75 (1996) 81
Assuming the probability that an image pixel would likely contain an overlapof more than one sign pixel at this distance, this data agrees well with the res-olution versus distance trial. This also agrees with the theoretical evaluation ascan be demonstrated in Figure 3. As the distance between the camera and ob-ject increases, the area that is captured by one pixel also increases until thearea captured by one image pixel is larger than one sign pixel.
The next aspect of the camera’s performance to be tested was its output atvarying angles to a source. To test this, images of a constant source were tak-en at varying angles and the digital output was recorded. The results of thistest are graphed in Figure 4. The output remains essentially constant at any an-gle. The theoretical explanation for this can be shown in Figure 5. Where asthe area captured differs at different angles, the included solid angle remainsthe same, producing the same output.
In order to calibrate the camera to a known standard, the spectral responseof the camera had to be determined. An Oriel (tm) monochrometer was usedto produce monochromatic light. Images were taken by the camera at wave-lengths at increments of five nanometers throughout the visible spectrum. Aplot of the digital number output versus input wavelength is shown in Figure6 for the red, green, and blue channels. The next step was to compare the dig-ital output to a known input.
The calibration of the incoming light illuminance with the digital numberoutput proved to be the most troublesome of the calibration tasks. From initialtrials it was found that the relation between incident light illuminance and re-
Figure 1. Graph showing the relationship between pixel relationship and ob-ject to camera distance.
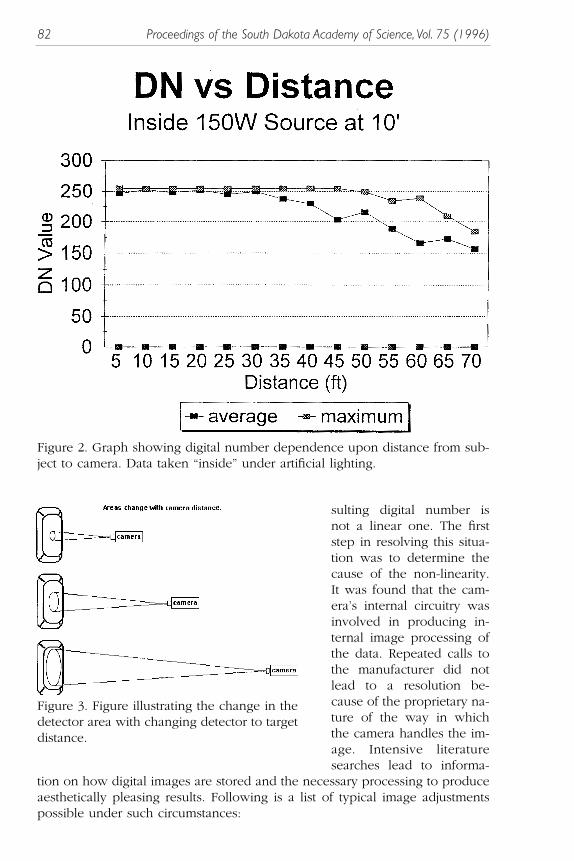
82 Proceedings of the South Dakota Academy of Science, Vol. 75 (1996)
sulting digital number isnot a linear one. The firststep in resolving this situa-tion was to determine thecause of the non-linearity.It was found that the cam-era’s internal circuitry wasinvolved in producing in-ternal image processing ofthe data. Repeated calls tothe manufacturer did notlead to a resolution be-cause of the proprietary na-ture of the way in whichthe camera handles the im-age. Intensive literaturesearches lead to informa-
tion on how digital images are stored and the necessary processing to produceaesthetically pleasing results. Following is a list of typical image adjustmentspossible under such circumstances:
Figure 2. Graph showing digital number dependence upon distance from sub-ject to camera. Data taken “inside” under artificial lighting.
Figure 3. Figure illustrating the change in thedetector area with changing detector to targetdistance.

Proceedings of the South Dakota Academy of Science, Vol. 75 (1996) 83
Gain and Bias Modifi-cation: Electronic gain iscontrolled to maintain de-sirable contrast while a biasis altered to control thebrightness. This results in a“clipping” of high lumi-nance values. The valuesnot clipped will have a lin-ear relationship betweenrecorded digital numberand light luminance fallingon a CCD pixel (Niblack,1986).
Mean and StandardDeviation Adjustment:This yields results very sim-ilar to the gain and biasmodification above. The difference lies in the method whereby the gain andbias are determined. This method determines the gain and bias from the meanand standard deviations of the obtained digital number data (Waldman, 1993).
Figure 4. Graph showing the relationship between digital number obtained andthe angle between the object’s surface and the camera.
Figure 5. Figure illustrating the change in thedetector area with changing detector to targetangle and also the constancy of the includeddetector solid angle.

84 Proceedings of the South Dakota Academy of Science, Vol. 75 (1996)
Logarithmic: The dynamic range of camera sensitivity is enhanced by log-arithmical transforming the captured data. This has the effect of spreading outthe low pixel values while compressing the high. In this way, details in darkareas are made visible at the expense of detail in the light areas (Schreiber,1986).
Histogram Matching: This is a transformation based on the idea that onecan control the number of luminance levels in the various grey levels. A“lookup” table is then constructed to evaluate the appropriate digital numberbased upon the actual pixel value.
These are only a select few of the possibilities that are available for imageprocessing. It is difficult to ascertain the particular transformation used by thecircuitry of the camera used of study. Knowing that a transform, or series oftransforms, exist within the camera enables one to develop a function whichwill allow the evaluation of the respective original light intensities from theirresulting digital number outputs. This can be accomplished by realizing thatany transforms that occur during the data acquisition and analysis can be com-bined into an overall transfer function which relates the final digital output toits original light illuminance input.
Figure 7 shows data from the initial calibration test. To obtain inputs of dif-ferent illuminance values, a calibrated source was used with filters of differenttransmissions. Analysis of this data indicates the possibility of some form of a
Figure 6. Graph showing monochrometer effects on RGB digital numbers.

Proceedings of the South Dakota Academy of Science, Vol. 75 (1996) 85
logarithmic transformation. Assuming this form of the function one can math-ematically manipulate the expression to arrive at a relationship, between theexisting data and the known input, in the form of a polynomial.
Using calibrated reflectance standards along with calibrated absorption fil-ters enabled one to obtain digital numbers over a large range of intensities. Theresults of this portion of the study are shown in Figure 8. It is possible to eval-uate the constants of the polynomial up to the fourth order by fitting the ex-perimental data from a large sample of experimental values. The size of high-er order constants are small and contributions from the higher order terms aresmall allowing truncation of the series to a second order polynomial. The re-sulting equation can be seen at the bottom of Figure 8.
The next step was to realize that the resulting equation is in terms of thefilter transmission and not the actual incoming luminance. This was rectified bylooking at the manufacturers data on the source output. The source bulb illu-minance was 10987 lux or lumens/cm2. The source also included a reflector inseries with the bulb that had a multiplicative luminance conversion constant of0.1. This resulted in the luminance from the reflector to be 1098.7 lumens/m2sr.To obtain the incident illuminance on a camera pixel it is only necessary tomultiply by the solid angle of the pixel. The resulting final calibration is shownin Figure 9. Once a digital number is obtained from an image, the calibrationequation is used to obtain the illuminance on that pixel which can then be con-verted to the initial luminance from the source by dividing by the solid angleof the detector’s pixels.
Figure 7. Graph showing digital numbers versus percent of transmitted lightthrough calibrated filters for different calibrated reflectance panels.

86 Proceedings of the South Dakota Academy of Science, Vol. 75 (1996)
The final step in calibration is to use the light luminance from various por-tions of the message on a CMS to evaluate the Contrast Ratio.
Contrast Ratio = Lm/LB
Thus in determining the Contrast Ratio for a message on a CMS, the lumi-nance values can be determined from the digital number output of the cameraby the polynomial calibrated transformation and inserted into the above equa-tion for calculation.
RESULTS AND ANALYSIS
Statistical analysis of the calibration data shows that the deviation of the cal-culated light illuminance values varies from two to five percent depending onthe digital number range evaluated. This corresponded to a maximum uncer-tainty in calculation of Contrast Ratios of approximately five percent. While thismay be a large variance for many precise procedures, it is suitable for the ap-plication of the digital camera to the present problem. In the field testing ofchangeable message signs, environmental factors introduce more significant er-
Figure 8. Graph showing relation between digital number and the fraction ofan object’s luminance incident on the camera detector.

Proceedings of the South Dakota Academy of Science, Vol. 75 (1996) 87
ror than does the detector. The calibrated digital camera system of this studywould effectively provide satisfactory accuracy.
ACKNOWLEDGMENTS
This work was supported by the Governor’s Office of Economic Develop-ment, Pierre, South Dakota, and also by Daktronics Corporation, Brookings,South Dakota.
BIBLIOGRAPHY
Dudek & Associates. 1991. Guidelines on the use of changeable message signs.U.S. Department of Transportation.
Niblack, Wayne. 1986. An Introduction to Digital Image Processing. Prentice-Hall International (UK) Ltd.
Waldman, Gray; Wooton, John. 1993. Electro-Optical Systems PerformanceModeling. Artech House, Inc., Norwood, MA.
Schreiber, W.F. 1986. Fundamentals of Electronic Imaging Systems, Some As-pects of Image Processing. Springer-Verlag Berlin.
Figure 9. Graph showing relation between digital number and the object’s lu-minance incident on the camera detector.


Proceedings of the South Dakota Academy of Science, Vol. 75 (1996) 89
AGE RATIOS OF MALE MALLARDS HARVESTEDIN EASTERN SOUTH DAKOTA
Jeremy P. Rakowicz, Jeffrey S. Gleason, and Jonathan A. JenksDepartment of Wildlife and Fisheries Sciences
South Dakota State UniversityBrookings, SD 57007
ABSTRACT
We analyzed harvest age ratios (immatures/adult) of male mallards (Anasplatyrhynchos) (n = 146) obtained opportunistically from hunters during Octo-ber - November 1995 in 3 eastern South Dakota counties (Brookings, Kings-bury, and Lake). Our objectives were to evaluate within year temporal trendsin harvest age ratios for male mallards and to compare our age ratios to esti-mates obtained from the U.S. Fish and Wildlife Service’s (USFWS) Parts Col-lection Survey (PCS). Our overall age ratio (0.7 immatures/adult) for male mal-lards harvested in eastern South Dakota was not significantly different (P =0.10) than the statewide PCS age ratio (1.03 immatures/adult). Harvest age ra-tios differed (P ≤ 0.05) across 3 time periods; 2.1 immatures/adult for early,0.24 immatures/adult for mid, and 0.42 immatures/adult for late season. Cal-culated age ratios (USFWS, unpubl. data) for the 3 county region by period(0.89, 1.09, and 0.45) did not differ (P ≥ 0.05) from those generated in ourstudy. Weather data was obtained from 3 weather stations on the study area.No differences (P > 0.05) in temperatures were found for the 3 counties; how-ever, temperatures declined significantly (P ≤ 0.05) across time periods. We at-tributed differences in male mallard harvest age ratios to differential migrationand local weather patterns.
INTRODUCTION
The mallard is the most common and heavily harvested waterfowl speciesin North America (Johnson et al., 1986; Caithamer et al., 1995). Its breedingrange is the most extensive of all North American waterfowl species (Bellrose,1976). Breeding population estimates for the mallard have shown dramatic in-creases over the last 2 years with an estimated 8.3 million in 1995, the highestestimate since the early 1970’s (Caithamer et al., 1995). The goal of the NorthAmerican Waterfowl Management Plan (NAWMP) for breeding mallards is 8.7million by the year 2000 (Anonymous, 1986).
Duck harvest management in the United States is driven by mallard popu-lation dynamics and is based on breeding population estimates and Canadianponds surveyed in May (Anonymous, 1995). An estimated 2.9 million mallardswere harvested in the United States in 1994 (Sharp, 1995). Effects of harvestand harvest regulations on mallards has been studied extensively (Anderson,1975; Anderson and Burnham, 1976; Rogers et al., 1979; Burnham et al., 1984;
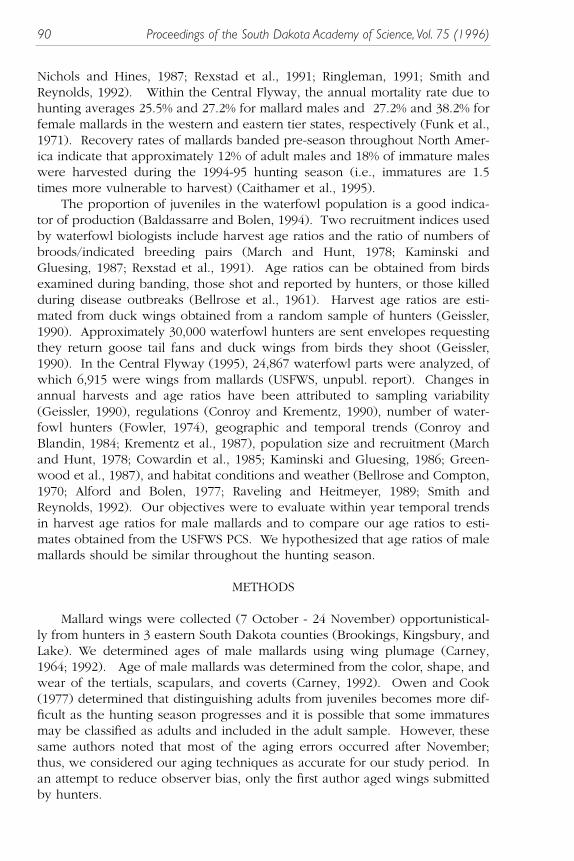
90 Proceedings of the South Dakota Academy of Science, Vol. 75 (1996)
Nichols and Hines, 1987; Rexstad et al., 1991; Ringleman, 1991; Smith andReynolds, 1992). Within the Central Flyway, the annual mortality rate due tohunting averages 25.5% and 27.2% for mallard males and 27.2% and 38.2% forfemale mallards in the western and eastern tier states, respectively (Funk et al.,1971). Recovery rates of mallards banded pre-season throughout North Amer-ica indicate that approximately 12% of adult males and 18% of immature maleswere harvested during the 1994-95 hunting season (i.e., immatures are 1.5times more vulnerable to harvest) (Caithamer et al., 1995).
The proportion of juveniles in the waterfowl population is a good indica-tor of production (Baldassarre and Bolen, 1994). Two recruitment indices usedby waterfowl biologists include harvest age ratios and the ratio of numbers ofbroods/indicated breeding pairs (March and Hunt, 1978; Kaminski andGluesing, 1987; Rexstad et al., 1991). Age ratios can be obtained from birdsexamined during banding, those shot and reported by hunters, or those killedduring disease outbreaks (Bellrose et al., 1961). Harvest age ratios are esti-mated from duck wings obtained from a random sample of hunters (Geissler,1990). Approximately 30,000 waterfowl hunters are sent envelopes requestingthey return goose tail fans and duck wings from birds they shoot (Geissler,1990). In the Central Flyway (1995), 24,867 waterfowl parts were analyzed, ofwhich 6,915 were wings from mallards (USFWS, unpubl. report). Changes inannual harvests and age ratios have been attributed to sampling variability(Geissler, 1990), regulations (Conroy and Krementz, 1990), number of water-fowl hunters (Fowler, 1974), geographic and temporal trends (Conroy andBlandin, 1984; Krementz et al., 1987), population size and recruitment (Marchand Hunt, 1978; Cowardin et al., 1985; Kaminski and Gluesing, 1986; Green-wood et al., 1987), and habitat conditions and weather (Bellrose and Compton,1970; Alford and Bolen, 1977; Raveling and Heitmeyer, 1989; Smith andReynolds, 1992). Our objectives were to evaluate within year temporal trendsin harvest age ratios for male mallards and to compare our age ratios to esti-mates obtained from the USFWS PCS. We hypothesized that age ratios of malemallards should be similar throughout the hunting season.
METHODS
Mallard wings were collected (7 October - 24 November) opportunistical-ly from hunters in 3 eastern South Dakota counties (Brookings, Kingsbury, andLake). We determined ages of male mallards using wing plumage (Carney,1964; 1992). Age of male mallards was determined from the color, shape, andwear of the tertials, scapulars, and coverts (Carney, 1992). Owen and Cook(1977) determined that distinguishing adults from juveniles becomes more dif-ficult as the hunting season progresses and it is possible that some immaturesmay be classified as adults and included in the adult sample. However, thesesame authors noted that most of the aging errors occurred after November;thus, we considered our aging techniques as accurate for our study period. Inan attempt to reduce observer bias, only the first author aged wings submittedby hunters.

Proceedings of the South Dakota Academy of Science, Vol. 75 (1996) 91
We assigned wings to one of 3 time periods; early (7 - 20 October), mid(21 October - 3 November), and late (4 - 24 November) depending on whenthey were harvested. Harvest age ratios were calculated for the 3 periods bydividing the number of immatures by the number of adults. We compared ourharvest age ratios to the overall South Dakota PCS age ratios by totaling ourbirds (86 adults vs. 60 immatures = 146 male mallards) and calculating (i.e., thatproportion of immatures/adults that equaled 146 and an age ratio of 1.03) acorresponding PCS ratio (72 adults vs. 74 immatures = 146 male mallards). Wealso compared our harvest age ratios by period (early, mid, and late season) toPCS ratios for the 3 county (Brookings, Kingsbury, and Lake) region. Using PCSdata obtained from Sharp (1995), we compared male mallard age ratios forSouth Dakota to ratios obtained for the Central Flyway during 1961 - 94.Weather data were obtained from 3 weather stations on the study area ; Brook-ings (Brookings Co.), DeSmet (Kingsbury Co.), and Madison (Lake Co.). Weanalyzed mean daily temperatures for the 3 counties and periods. Age ratioswere analyzed using Chi-Square analysis and weather data was analyzed usingAnalysis of Variance (ANOVA).
RESULTS
A total of 146 (60 immatures, 86 adults) male mallard wings was collectedduring the season; early (38 immatures, 18 adults), mid (9 immatures, 37adults), and late (13 immatures, 31 adults) (Table 1). A total of 332 immatureand 327 adult male mallards was obtained from South Dakota during the 1995-96 PCS (USFWS unpubl. report). A total of 96 (45 immatures, 51 adults) malemallards was obtained for the 3 county area during the 1995-96 PCS; early (17immatures, 19 adults), mid (23 immatures, 21 adults), and late (5 immatures, 11adults) (Table 1). Male mallard age ratios from wings obtained from huntersdiffered significantly (P < 0.05) between the 3 periods; early (2.1immatures/adult), mid (0.24 immatures/adult), and late (0.42 immatures/adult)but were similar (P > 0.05) to projected PCS age ratios for the 3 counties (0.89,1.09, and 0.92) (Fig. 1). Our overall age ratio (0.7 immatures/adult) for malemallards harvested in eastern South Dakota was not significantly different (P =0.10) from the statewide PCS age ratio (1.03 immatures/adult). South Dakotamale mallard age ratios generally followed age ratios for the Central Flywaywith larger yearly variations over the 33 year period (Fig. 2). Mean daily tem-perature did not differ (P > 0.05) among the 3 counties and thus temperaturedata were pooled. Mean daily temperature and wind chill index declinedthrough the hunting season (Fig. 3). Mean daily temperatures (3 county aver-age) were significantly different (P ≤ 0.05) for the 3 hunting periods; early(x = 28.03º C), mid (x = 18.62º C), and late (x = 15.30º C).
DISCUSSION
The use of harvest age ratios obtained from U.S. Fish and Wildlife Service’sParts Collection Survey has been widely accepted as an index to recruitment(Baldassarre and Bolen, 1994). However, the differences between production

92 Proceedings of the South Dakota Academy of Science, Vol. 75 (1996)
estimates (i.e., nest success and brood production) and harvest age ratios hasbeen a concern for some time. Currently, the USFWS uses 3 variables to pre-dict annual production; spring breeding population size, number of July ponds,and an index of brood production (Martin et al., 1979; Kaminski and Gluesing,1987). Kaminski and Gluesing (1987) documented an inverse relationship be-tween recruitment rates and breeding population size and a positive relation-ship between recruitment rates and May and July ponds for mallards. Theseauthors hypothesized that a population exhibiting high recruitment in year1(year t) may show a decline the following year (year t + 1) due to a prepon-derance of yearling females which exhibit a lower reproductive potential (i.e.,density-dependent reproduction). These authors used unadjusted harvest age
Table 1. Male mallards harvested in 3 eastern South Dakota counties, 1995.

Proceedings of the South Dakota Academy of Science, Vol. 75 (1996) 93
Figure 1. Comparison of male mallard age ratios by time period from data der-vided from this study and the U.S. Fish and Wildlife Service’s Parts CollectionSurvey, 1995.
Figure 2. Comparison of male mallard age ratios for South Dakota and theCentral Flyway, 1961–95.
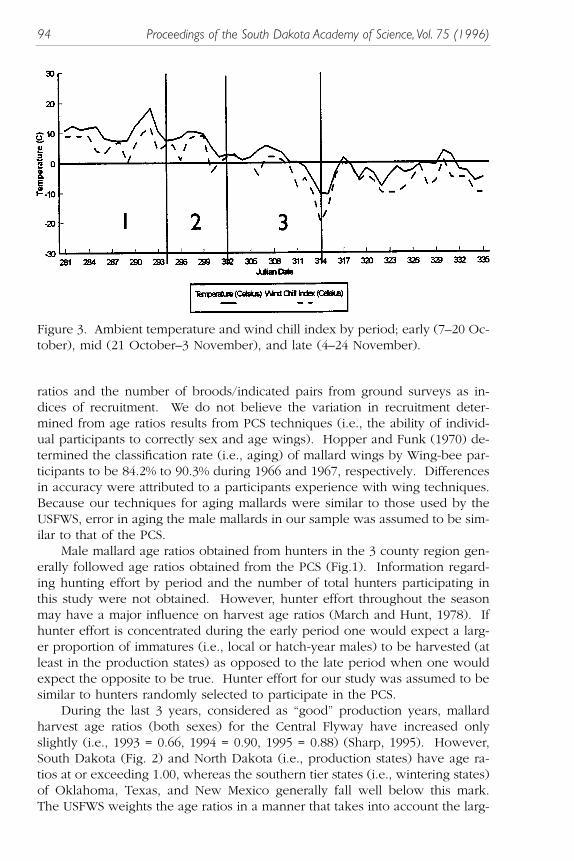
94 Proceedings of the South Dakota Academy of Science, Vol. 75 (1996)
ratios and the number of broods/indicated pairs from ground surveys as in-dices of recruitment. We do not believe the variation in recruitment deter-mined from age ratios results from PCS techniques (i.e., the ability of individ-ual participants to correctly sex and age wings). Hopper and Funk (1970) de-termined the classification rate (i.e., aging) of mallard wings by Wing-bee par-ticipants to be 84.2% to 90.3% during 1966 and 1967, respectively. Differencesin accuracy were attributed to a participants experience with wing techniques.Because our techniques for aging mallards were similar to those used by theUSFWS, error in aging the male mallards in our sample was assumed to be sim-ilar to that of the PCS.
Male mallard age ratios obtained from hunters in the 3 county region gen-erally followed age ratios obtained from the PCS (Fig.1). Information regard-ing hunting effort by period and the number of total hunters participating inthis study were not obtained. However, hunter effort throughout the seasonmay have a major influence on harvest age ratios (March and Hunt, 1978). Ifhunter effort is concentrated during the early period one would expect a larg-er proportion of immatures (i.e., local or hatch-year males) to be harvested (atleast in the production states) as opposed to the late period when one wouldexpect the opposite to be true. Hunter effort for our study was assumed to besimilar to hunters randomly selected to participate in the PCS.
During the last 3 years, considered as “good” production years, mallardharvest age ratios (both sexes) for the Central Flyway have increased onlyslightly (i.e., 1993 = 0.66, 1994 = 0.90, 1995 = 0.88) (Sharp, 1995). However,South Dakota (Fig. 2) and North Dakota (i.e., production states) have age ra-tios at or exceeding 1.00, whereas the southern tier states (i.e., wintering states)of Oklahoma, Texas, and New Mexico generally fall well below this mark.The USFWS weights the age ratios in a manner that takes into account the larg-
Figure 3. Ambient temperature and wind chill index by period; early (7–20 Oc-tober), mid (21 October–3 November), and late (4–24 November).

Proceedings of the South Dakota Academy of Science, Vol. 75 (1996) 95
er proportion of hunters contributing parts from certain states, i.e., Texas (1995-96 = 1,062 mallard wings). In most years, Texas is 1 of the top states con-tributing parts to the Wing-bee which depresses the overall Central Flyway mal-lard age ratios (i.e., below 1.00). The Central Flyway states of North Dakota,South Dakota, and eastern Montana lie within the Prairie Pothole Region (PPR),generally considered to be the “duck factory” of North America (Smith et al.,1964). However, mallard age ratios in the Central Flyway are generally thelowest of all 4 Flyways (Sharp, 1995). Waterfowl biologists and researchersalike do not fully understand the discrepancy between production estimatesand harvest age ratios.
Differences between production estimates and harvest age ratios may like-ly be a result of an individual bird’s physical condition (Kendeigh et al., 1977).The physical condition of a bird influences its habitat use (Nichols et al., 1983),dominance rank and pair status (Jorde, 1981; Jorde et al., 1983), flocking be-havior (Bain, 1980; Hepp et al., 1986), and its mobility and migration tenden-cies (Hepp et al., 1986). Individuals in poor condition are more likely to uti-lize habitats other than “preferred” increasing their vulnerability to harvest(Bain, 1980). Birds in poor condition are less dominant and may not be paired.Subordinate birds, which in this case are immature male mallards in poor con-dition, are forced to use habitats in which food availability and quality is low(Rabenberg, 1982) and thermoregulatory costs are high (Jorde et al., 1984).
Results from our study indicate that using harvest age ratios obtained dur-ing the early period (i.e., the first 2 - 3 weeks of season) from the northern pro-duction states may provide a more accurate estimate of recruitment. In ourstudy, age ratios for male mallards may have declined during mid and late sea-son periods due to differential costs of thermoregulation for immatures andadults associated with declining temperatures and a snowstorm that occurredon 24 October, decreasing the number of immature male mallards available tobe harvested (Figs. 1 and 3). Birds in poor condition may be more mobile andhave more to gain (i.e., higher benefit:cost ratio) from migrating than birds ingood condition (i.e., adult males). This mobility and migration tendency in-creases the likelihood of immature male mallards contacting hunters (Olson,1965; Hepp et al., 1986). Body weights of immature male mallards are lessthan adults (Owen and Cook, 1977) and thus, basal metabolic rate per gram ofbody mass would be greater for immatures. Using body weights from Owenand Cook (1977) and formulae from Kendeigh et al., (1977) we calculated a 3%increase in basal metabolic rate per gram of body mass for immature versusadult male mallards. Thus, the energetic costs of remaining in South Dakotaduring mid to late season when temperatures are low would be energeticallygreater for immatures. Because of the adult male mallard’s larger body sizeand pair status (Jorde, 1981; Paulus, 1983) immature males may be relegatedto the edges of flocks increasing their vulnerability to predation (Powell, 1974;Kenward, 1978) as well as increasing their thermoregulatory costs (Jorde et al.,1984). Consequently, energetic costs of immature male mallards remaining inSouth Dakota may actually be higher than our calculated 3%.

96 Proceedings of the South Dakota Academy of Science, Vol. 75 (1996)
ACKNOWLEDGMENTS
We would like to thank the many individuals who donated wings. Wewould like to thank P. Padding and B. H. Powell both from the U.S. Fish andWildlife Service’s Office of Migratory Bird Management, Laurel, Maryland forproviding 1995-96 Wing-bee data as well as E. Martin for providing assistancewith the literature review. Reviews of earlier drafts of this manuscript weredone by R. Johnson, S. Vaa and K. Higgins. This project was supported bySouth Dakota State University and the South Dakota Cooperative Fish andWildlife Research Unit in cooperation with the U.S. Fish and Wildlife Service,South Dakota Department of Game, Fish and Parks, and the Wildlife Manage-ment Institute.
LITERATURE CITED
Alford III, J. R., and E. G. Bolen. 1977. Influence of winter temperatures onpintail sex ratios in Texas. Southwest Nat. 21:554-556.
Anderson, D. R. 1975. Population ecology of the mallard: V. Temporal andgeographic estimates of survival, recovery, and harvest rates. U.S. FishWildl. Serv. Resour. Publ. 125. 110pp.
Anderson, D. R., and K. P. Burnham. 1976. Population ecology of the mal-lard: VI. The effect of exploitation on survival. U.S. Fish Wildl. Serv. Re-sour. Publ. 128. 66pp.
Anonymous. 1986. North American waterfowl management plan. U.S. FishWildl. Serv. And Can. Wildl. Serv., Washington, D.C.
Anonymous. 1995. Duck harvest management considerations for 1995. U.S.Fish Wildl. Serv., Office Migr. Bird Manage., Laurel, MD.
Bain, G. A. C. 1980. The relationship between preferred habitat, physical con-dition and hunting mortality of canvasbacks (Aythya valisineria) and red-heads (Aythya americana) at Long Point, Ontario. M.S. Thesis, Univ. West-ern Ontario, London. 38pp.
Baldassarre, G. A., and E. G. Bolen. 1994. Waterfowl ecology and manage-ment. John Wiley and Sons, Inc., New York, NY.
Bellrose, F. C. 1976. Ducks, geese, and swans of North America, 3rd edition.Stackpole Books, Harrisburg, PA.
Bellrose, F. C., and R. D. Crompton. 1970. Migrational behavior of mallardsand black ducks as determined from banding. Ill. Nat. Hist. Surv. Bull.30:168-234.
Bellrose, F. C., T. G. Scott, A. S. Hawkins, and J. B. Low. 1961. Sex ratios andage ratios in North American ducks. Ill. Nat. Hist. Surv. Bull. 27:391-474.
Burnham, K. P., G. C. White, and D. R. Anderson. 1984. Estimating the effectof hunting on annual survival rates of adult mallards. J. Wildl. Manage.48:350-361.
Caithamer, D. F., J. A. Dubovsky, J. P. Bladen, F. A. Johnson, J. R. Kelley, Jr., C.T. Moore, and G. W. Smith. 1995. Waterfowl population status, 1995. U.S.Fish Wildl. Serv. Status Rep., Laurel, MD.

Proceedings of the South Dakota Academy of Science, Vol. 75 (1996) 97
Carney, S. M. 1964. Preliminary keys to waterfowl age and sex identificationby means of wing plumage. U.S. fish Wildl. Serv., Spec. Sci. Rept., Wildl.No. 82. 47pp.
Carney, S. M.. 1992. Species, sex and age identification of ducks using wingplumage. U.S. Fish Wildl. Serv., Washington, D.C.
Conroy, M. J., and D. G. Krementz. 1990. A review of evidence for the effectsof hunting on American black duck populations. Trans. N. Am. Wildl. Nat.Resour. Conf. 55:501-517.
Conroy, M. J., and W. Blandin. 1984. Geographic and temporal differences inband reporting rates for American black ducks. J. Wild. Manage. 48:23-36.
Cowardin, L. M., D. S. Gilmer, and C. W. Shaiffer. 1985. Mallard recruitmentin the agricultural environment of North Dakota. Wildl. Monogr. 92. 37pp.
Fowler, R. M. 1974. Investigations of Canada geese, using Missouri River im-poundments in South Dakota: 1973-74. South Dakota Dept. Game, Fishand Parks, Annual Report, Pierre.
Funk, H. D., D. Witt, G. F. Wrakestraw, G. F. Merrill, T. Kuck, D. Timm, T. Lo-gan, and C. D. Stutzenbaker. 1971. Justification of the Central Flyway highplains mallard management unit. Central Flyway Tech. Comm. Rep. 48pp.
Geissler, P. H. 1990. Estimation of confidence intervals for federal waterfowlharvest surveys. J. Wildl. Manage. 54:201-205.
Greenwood, R. J., A. B. Sargeant, D. H. Johnson, L. M. Cowardin, and T. L.Shaffer. 1987. Mallard nest success and recruitment in prairie Canada.Trans. N. Am. Wildl. Nat. Resour. Conf. 52:298-309.
Hepp, G. R., R. J. Blohm, R. E. Reynolds, J. E. Hines, and J. D. Nichols. 1986.Physiological condition of autumn-banded mallards and its relationship tohunting vulnerability. J. Wildl. Manage. 50:177-183.
Hopper, R. M., and H. D. Funk. 1970. Reliability of the mallard wing age-de-termination technique for field use. J. Wildl. Manage. 34:333-339.
Johnson, D. H., L. M. Cowardin, and D. W. Sparling. 1986. Evaluation of amallard productivity model. Pages 23-29 in J. Verner, M. L. Morrison, andC. J. Ralph, eds. Wildlife 2000: Modeling habitat relationships of terrestri-al vertebrates. Univ. Wisconsin Press, Madison, WI.
Jorde, D. G. 1981. Winter and spring staging ecology of mallards in south cen-tral Nebraska. M.S. Thesis, Univ. North Dakota, Grand Forks. 131pp.
Jorde, D. G., G. L. Krapu, and R. D. Crawford. 1983. Feeding ecology of mal-lards wintering in Nebraska. J. Wildl. Manage. 47:1044-1053.
Jorde, D. G., G. L. Krapu, R. D. Crawford, and M. A. Hay. 1984. Effects ofweather on habitat selection and behavior of mallards wintering in Ne-braska. Condor 86:258-265.
Kaminski, R. M., and E. A. Gluesing. 1987. Density- and habitat-related re-cruitment in mallards. J. Wildl. Manage. 51:141-148.
Kendeigh, S. C., V. R. Dol’ Nik, and V. M. Gavrilov. 1977. Avian energetics.Pages 127-204 in J. Pinowski and S. C. Kendeigh, eds. Granivorous birdsin ecosystems. Cambridge Univ. Press, New York, NY.
Kenward, R. E. 1978. Hawks and doves: factors affecting success and selec-tion in goshawk attacks on woodpigeons. J. Anim. Ecol. 47:449-460.

98 Proceedings of the South Dakota Academy of Science, Vol. 75 (1996)
Krementz, D. G., M. J. Conroy, J. E. Hines, and H. J. Percival. 1988. The ef-fects of hunting on survival rates of American black ducks. J. Wild. Man-age. 52:214-226.
March, J. R., and R. A. Hunt. 1978. Mallard population and harvest dynamicsin Wisconsin. Wisc. Dept. Nat. Resour. Tech. Bull. No. 106. 74pp.
Martin, F. W., R. S. Pospahala, and J. D. Nichols. 1979. Assessment and pop-ulation management of North American migratory birds. Pages 187-239 inJ. Cairns, Jr., G. P. Patil, and W. E. Waters, eds. Environmental biomoni-toring, assessment, prediction, and management: certain case studies andrelated quantitative issues. Inter. Coop. Publ. House, Fairland, MD.
Nichols, J. D., K. J. Reinecke, and J. E. Hines. 1983. Factors affecting the dis-tribution of mallards wintering in the Mississippi Alluvial Valley. Auk100:932-946.
Nichols, J. D., and J. E. Hines. 1987. Population ecology of the mallard: VIII.Winter distribution patterns and survival rates of winter-banded mallards.U.S. Fish Wildl. Serv. Resour. Publ. 162. 154pp.
Olson, D. P. 1965. Differential vulnerability of male and female canvasbacksto hunting. Trans. N. Am. Wildl. Nat. Resour. Conf. 30:121-135.
Owen, M., and W. A. Cook. 1977. Variations in body weight, wing length andcondition of Mallard Anas platyrhynchos platyrhynchos and their relation-ship to environmental changes. J. Zool. 183:377-395.
Paulus, S. L. 1983. Dominance relations, resource use, and pairing chronolo-gy of gadwalls in winter. Auk 100:947-952.
Powell, G. V. N. 1974. Experimental analysis of the social value of flockingby starlings (Sturnus vulgaris) in relation to predation and foraging. An-im. Behav. 22:501-505.
Rabenberg, M. J. 1982. Ecology and population dynamics of mallards winter-ing in the Columbia Basin. M.S. Thesis, Univ. Montana, Missoula. 135pp.
Raveling, D. G., and M. E. Heitmeyer. 1989. Relationships of population sizeand recruitment of pintails to habitat conditions and harvest. J. Wildl. Man-age. 53:1088-1103.
Rexstad, E. A., D. R. Anderson, and K. P. Burnham. 1991. Lack of sex-selec-tivity in harvest of mallards under the point system. J. Wildl. Manage.55:586-592.
Ringleman, J. K. 1991. Differential harvest of male and female mallards underconventional and point system regulations. Wildl. Soc. Bull. 19:258-267.
Rogers, J. P., J. D. Nichols, F. W. Martin, C. F. Kimball, and R. S. Pospahala.1979. An examination of harvest and survival rates of ducks in relation tohunting. Trans. N. Am. Wildl. Nat. Resour. Conf. 44:114-126.
Sharp, D. E. 1995. Central Flyway- harvest and population survey data book.U.S. Fish Wildl. Serv., Office Migr. Bird Manage., Denver, CO.
Smith, G. W., and R. E. Reynolds. 1992. Hunting and mallard survival, 1979-88. J. Wildl. Manage. 56:306-316.
Smith, A. G., J. H. Stoudt, and J. B. Gollop. 1964. Prairie potholes and marsh-es. Pages 39-50 in J. P. Linduska, ed. Waterfowl tomorrow. U.S. Govern.Print. Off., Washington, D.C., USA.

Proceedings of the South Dakota Academy of Science, Vol. 75 (1996) 99
SUBSPECIFIC DISCRIMINATION OF CANADAGEESE HARVESTED IN SOUTH DAKOTA
Jeffrey S. Gleason, Scott A. Stolz, andJonathan A. Jenks
Wildlife and Fisheries Sciences DepartmentBox 2140B
South Dakota State UniversityBrookings, South Dakota 57007
ABSTRACT
Nineteen morphological characters were measured on Canada geese(Branta canadensis) (n = 66) obtained opportunistically from hunters duringOctober-December, 1995. We used principle components analysis (PCA) toevaluate 19 separate morphological characters on a model data set of Canadageese (n = 47) harvested in South Dakota. Principle components loadings iden-tified which characters best discriminated between the subspecies and thesecharacters were used to identify a model for discriminant function analysis(DFA). Seven characters were found to be most important by both PCA andDFA. A univariate F-test was significant (P ≤ 0.073) for all 7 variables testedfor the multivariate model (DFA). Classification rate for the model data was100%; giant (n = 36), interior (n = 4), B.c. parvipes (n = 1), and B.c. hutchinsii(n = 2). An additional 19 geese were measured as test data for the model.Classification rate for the test data was 89%.
INTRODUCTION
Canada geese are one of the most commonly harvested waterfowl speciesin North America, comprising 63% (1969-88) of the total goose harvest (Trostet al., 1990). Canada goose harvest estimates have continued to increase inSouth Dakota peaking in 1995 (n = 73,377), the highest estimated total sincethe surveys inception (Sharp, 1995). The Central Flyway, of which SouthDakota is a part, generally ranks second among the 4 flyways in the numberof wintering geese and their harvest (Kraft and Funk, 1990). Four managementpopulations (Eastern Prairie Population, Western Prairie Population, TallgrassPrairie Population, and Shortgrass Prairie Population) of Canada geese migratethrough South Dakota enroute to southern wintering areas (Fowler, 1972; Bell-rose, 1976). The 5 Canada goose subspecies that comprise these managementpopulations are the giant (B. c. maxima), interior (B. c. interior), great basin(B. c. moffitti), lesser (B. c. parvipes), and Richardson’s (B. c. hutchinsii)(Fowler, 1972; Bellrose, 1976).
According to Pettingill (1985), measurements of birds have 3 general pur-poses; first, to aid in systematic studies, second, to determine differences be-tween sexes, and third, to measure the growth of young. Numerous studies

100 Proceedings of the South Dakota Academy of Science, Vol. 75 (1996)
have been conducted to determine the best method of aging and differentiat-ing subspecies of Canada geese (Johnson et al., 1979; Tacha et al., 1987; Tachaet al., 1989; Moser and Rolley, 1990; Merendino et al., 1994). Fowler (1972;1974; 1975) determined yearly trends in size-class composition, and sex andage ratios for Canada geese harvested in 12 counties (Campbell, Walworth,Dewey, Potter, Sully, Stanley, Hughes, Lyman, Buffalo, Brule, Gregory, andCharles Mix) along the Missouri River, South Dakota. Measurements taken toseparate ratios of large to small Canada geese were culmen, tarsus, bodyweight, and middle tail feather length. Proportion of large Canadas varied forall years of the study (x = 61%, range 29% - 94%). The author also noted a ge-ographical difference in size ratios, with a decreasing proportion of large geesefrom north to south.
Currently, harvest estimates of Canada geese are obtained from tail fans asa component of the U.S. Fish and Wildlife Service’s Parts Collection Survey.The middle rectrix is measured (adult large ≥ 156 mm, adult small ≤ 155 mm)and the individual is classified as either large or small based on this measure-ment. Our objective was to determine if length and shaft diameters of the 8th,9th, and 10th primaries, as well as the middle rectrix could be used as accu-rate morphological characters for discrimination of Canada goose subspecies.
METHODS
Canada geese were collected (2 October–10 December 1995) opportunis-tically from hunters in 9 counties in eastern and central South Dakota (Brook-ings, Brown, Clark, Deuel, Haakon, Kingsbury, Lake, Stanley, and Sully). An-nouncements describing the study were strategically placed around Brookings,South Dakota. The whole bird was preferred; however, in cases where thewhole bird could not be obtained the head, left foot, left wing, and tail werecollected. We used visual cues (i.e., size and breast and neck feather col-oration) as a preliminary method of Canada goose subspecies separation. Wedetermined sex by cloacal (Hanson, 1962) and/or internal examination (Pet-tingill, 1985) and age by external characteristics such as breast and neck feath-er coloration, primary feather shape and wear, rectrix notching, and presenceor absence of wing spurs (Hanson, 1962; Marquardt, 1962; Higgins andSchoonover, 1969; Caithamer et al., 1993).
We measured 19 morphological characters using an electronic digitalcaliper (± 0.1 mm) and a metric tape (± 1.0 mm). In an attempt to reduce ob-server bias, only the second author took measurements on all geese. Culmen1 (distance from the distal tip of the bill to the V-point where the integumentmeets the horny portion of the mandible), culmen 2 (distance from the distaltip of the bill nail to the proximal tip of the posterior lateral extension of theupper mandible), bill width, skull length, total tarsus length, tarsus bone length,mid-toe length, mid-toe nail length, body length and flat wing length weremeasured following guidelines of Dzubin and Cooch (1992). In addition, wemeasured 9 other characters. These included skull width (distance across thehead including skin and feathers at the temporal canthus) (Pettingill, 1985), thelength of the 8th, 9th, and 10th primaries and the middle rectrix (proximal end
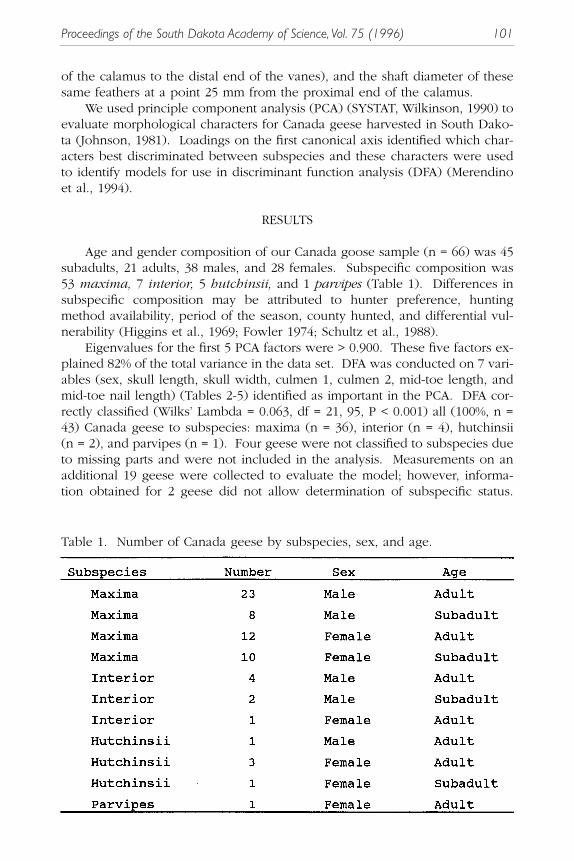
Proceedings of the South Dakota Academy of Science, Vol. 75 (1996) 101
of the calamus to the distal end of the vanes), and the shaft diameter of thesesame feathers at a point 25 mm from the proximal end of the calamus.
We used principle component analysis (PCA) (SYSTAT, Wilkinson, 1990) toevaluate morphological characters for Canada geese harvested in South Dako-ta (Johnson, 1981). Loadings on the first canonical axis identified which char-acters best discriminated between subspecies and these characters were usedto identify models for use in discriminant function analysis (DFA) (Merendinoet al., 1994).
RESULTS
Age and gender composition of our Canada goose sample (n = 66) was 45subadults, 21 adults, 38 males, and 28 females. Subspecific composition was53 maxima, 7 interior, 5 hutchinsii, and 1 parvipes (Table 1). Differences insubspecific composition may be attributed to hunter preference, huntingmethod availability, period of the season, county hunted, and differential vul-nerability (Higgins et al., 1969; Fowler 1974; Schultz et al., 1988).
Eigenvalues for the first 5 PCA factors were > 0.900. These five factors ex-plained 82% of the total variance in the data set. DFA was conducted on 7 vari-ables (sex, skull length, skull width, culmen 1, culmen 2, mid-toe length, andmid-toe nail length) (Tables 2-5) identified as important in the PCA. DFA cor-rectly classified (Wilks’ Lambda = 0.063, df = 21, 95, P < 0.001) all (100%, n =43) Canada geese to subspecies: maxima (n = 36), interior (n = 4), hutchinsii(n = 2), and parvipes (n = 1). Four geese were not classified to subspecies dueto missing parts and were not included in the analysis. Measurements on anadditional 19 geese were collected to evaluate the model; however, informa-tion obtained for 2 geese did not allow determination of subspecific status.
Table 1. Number of Canada geese by subspecies, sex, and age.
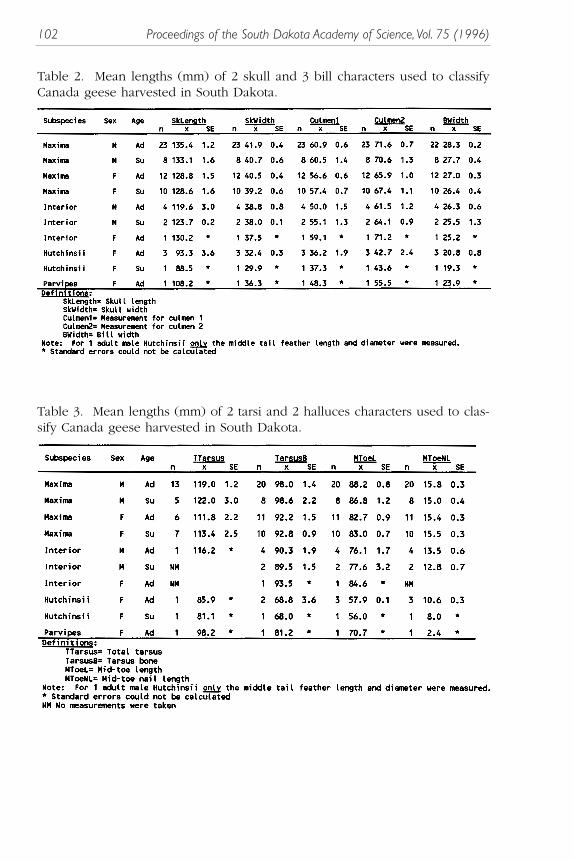
102 Proceedings of the South Dakota Academy of Science, Vol. 75 (1996)
Table 2. Mean lengths (mm) of 2 skull and 3 bill characters used to classifyCanada geese harvested in South Dakota.
Table 3. Mean lengths (mm) of 2 tarsi and 2 halluces characters used to clas-sify Canada geese harvested in South Dakota.

Proceedings of the South Dakota Academy of Science, Vol. 75 (1996) 103
Tab
le 4
. M
ean len
gths
(mm
) of
6 prim
ary
feat
her
char
acte
rs u
sed to c
lass
ify
Can
ada
gees
e har
vest
ed in S
outh
Dak
ota
.

104 Proceedings of the South Dakota Academy of Science, Vol. 75 (1996)
True classification rate for the model was 89%; 15 of 17 geese were correctlyclassified (1 giant and 1 interior were incorrectly classified).
DISCUSSION
Most studies concerning taxonomic separation of Canada geese have beenconducted on the breeding grounds (Johnson et al., 1979; Moser and Rolley,1990; Merendino et al., 1994). The advantage of measuring Canada geese ontheir breeding grounds versus measuring harvested birds in the fall are twofold;first, a large sample of available birds, and second, the philopatric nature of thespecies enables separation of subspecific breeding areas (Johnson et al., 1979).In their study conducted in Alaska, Johnson et al. (1979) accurately described82.9% of 1,156 Canada geese (B. c. minima, B. c. leucoparia, B. c. taverneri,B. c. parvipes, B. c. occidentalis, and B. c. fulva) using culmen, tarsus, and to-tal tarsus. Merendino et al. (1994) were able to accurately separate (> 99%)breeding interior and giant Canada geese on Akimiski Island, Northwest Terri-tories.
Management of subspecies of Canada geese is often difficult due to mix-ing on the wintering grounds (Kraft and Funk, 1990). Analysis of tail fans sentin by a random sample of hunters provides an estimate of harvest, age ratios,and ratio of large to small Canada geese (Sorenson et al., 1987). The accura-cy of tail fans as an estimator for age ratios has been questioned (Tacha et al.,1987) and these ratios (immatures/adult) are generally considered to be biasedlow (Caithamer et al., 1993).
Neither PCA nor DFA selected feather characters (i.e., shaft diameters andlengths of the 8th, 9th, and 10th primaries, as well as the middle rectrix) as re-liable variables for subspecies discrimination. The variables we used to dis-criminate subspecies in the DFA were “hard” characters (characters which donot change within individuals as a function of age, length of time the bird isheld, or time of year the bird is measured) (Dzubin and Cooch 1992). Resultsindicate that use of these 7 characters in conjunction with principle compo-nents analysis and discriminant function analysis should provide an accuratemethod of subspecific separation of Canada geese harvested in South Dakota.
Accurately estimating composition of mixed subspecies flocks of Canadageese may result in regulations specifically tailored for areas of the country inwhich geese from many populations breed, migrate, or winter (Moser and Rol-ley, 1990). As local, urban giant Canada goose populations continue to in-crease, harvest regulations that allow for harvest of a specific subspecies willmaximize recreational opportunities while protecting migratory flocks.
ACKNOWLEDGEMENTS
We thank the many individuals who donated geese. We would like tothank T. Symens, D. Franke, and R. Doorenbos for their computer assistance.Reviews of earlier drafts of this manuscript were done by R. Johnson and K.Higgins. This project was supported by South Dakota State University and theSouth Dakota Cooperative Fish and Wildlife Research Unit in cooperation with

Proceedings of the South Dakota Academy of Science, Vol. 75 (1996) 105
the U.S. Fish and Wildlife Service, South Dakota Department of Game, Fish andParks, and the Wildlife Management Institute.
LITERATURE CITED
Bellrose, F. C. 1976. Ducks, geese, and swans of North America, 3rd edition.Stackpole Books, Harrisburg, PA.
Caithamer, D. F., R. J. Gates, J. D. Hardy, and T. C. Tacha. 1993. Field identi-fication of age and sex of interior Canada geese. Wildl. Soc. Bull. 21:480-487.
Dzubin, A., and E. G. Cooch. 1992. Measurements of geese: general fieldmethods. Calif. Water. Assoc. Sacramento, CA.
Fowler, R. M. 1972. Investigation of Canada geese, using Missouri River im-poundments in South Dakota: 1971-72. South Dakota Dept. Game, Fishand Parks, Annual Report, Pierre.
Fowler, R. M. 1974. Investigation of Canada geese, using Missouri River im-poundments in South Dakota: 1973-74. South Dakota Dept. Game, Fishand Parks, Annual Report, Pierre.
Fowler, R. M. 1975. Investigation of Canada geese, using Missouri River im-poundments in South Dakota: 1974-75. South Dakota Dept. Game, Fishand Parks, Annual Report, Pierre.
Hanson, H. C. 1962. Characters of Age, sex, and sexual maturity in Canadageese. Ill. Nat. Hist. Surv. Biol. Notes 49. 15pp.
Hanson, H. C.. 1965. The giant Canada goose. Southern Illinois Univ.Press, Carbondale, IL.
Higgins, K. F., and L. J. Schoonover. 1969. Aging small Canada geese by neckplumage. J. Wildl. Manage. 33:212-214.
Higgins, K. F., R. L. Linder, and P. F. Springer. 1969. A comparison ofmethods used to obtain age ratios of snow and Canada geese. J. Wildl.Manage. 33:949-956.
Hochbaum, H. A. 1942. Sex and age determination of waterfowl by cloacalexamination. Trans. N. Am. Wildl. Nat. Resour. Conf. 7:299-307.
Johnson, D. H. 1981. The use and misuse of statistics in wildlife habitat stud-ies. Pages 11-19 IN D. E. Capen, ed. The use of multivariate statistics instudies of wildlife habitat. U.S. Dept. Agric., For. Serv. Den. Tech. Rep. RM-87.
Johnson, D. H., D. E. Timm, P. F. Springer. 1979. Morphologicalcharacteristics of Canada geese in the Pacific Flyway. Pages 56-80 IN R. L.Jarvis, and J. C. Bartoneck, eds. Management and biology of Pacific Fly-way geese- a symposium. Oregon State Univ. Book Stores, Inc., Corvallis,OR.
Kraft, M. J., and H. D. Funk. 1990. Goose management in the ‘90s: a centralflyway perspective. Trans. N. Am. Wildl. Nat. Resour. Conf. 55:321-326.
Marquardt, R. E. 1962. Ecology of the migrating and wintering flocks of thesmall white-cheeked geese within the south central United States. Ph.D.Thesis. Oklahoma State Univ., Stillwater.

106 Proceedings of the South Dakota Academy of Science, Vol. 75 (1996)
Merendino, T. M., C. D. Ankney, D. G. Dennis, J. O. Leafloor. 1994. Morpho-metric discrimination of giant and Akimiski Island Canada geese. Wildl.Soc. Bull. 22:14-19.
Moser, T. J. and R. E. Rolley. 1990. Discrimination of giant and interior Cana-da geese of the Mississippi Flyway. Wildl. Soc. Bull. 18:381-388.
Pettingill, O. S., Jr. 1985. Ornithology in laboratory and field. 5th ed. Aca-demic Press, Inc., New York, NY.
Schultz, D. F., J. A. Cooper, and M. C. Zicus. 1988. Fall flock behavior andharvest of Canada geese. J. Wildl. Manage. 52:679-688.
Sharp, D. E. 1995. Central flyway- harvest and population survey data book.U.S. Fish Wildl. Serv., Off. Migr. Bird Manage., Denver, CO.
Sorenson, M. F., S. M. Carney, and E. M. Martin. 1987. Age and sex composi-tion of ducks and geese harvested in the 1986 hunting season in compar-ison with prior years. U.S. Fish Wildl. Serv. Adm. Rep., Off. Migr. BirdManage., Laurel, MD.
Tacha, T. C., D. D. Thornburg, and R. A. Williamson. 1987. Bias of tail-fan sur-veys for estimating Canada goose age ratios. Wildl. Soc. Bull. 15:533-534.
Tacha, T. C., D. D. Thornburg, and R. A. Williamson. 1989. Use of wing-tipsto estimate age ratios of Canada geese. Wildl. Soc. Bull. 17:146-148.
Trost, R. E., K. E. Gamble, and D. J. Nieman. 1990. Goose surveys in NorthAmerica: current procedures and suggested improvements. Trans. N. Am.Wildl. Nat. Resour. Conf. 55:338-349.
Wilkinson, L. 1990. SYSTAT: the system for statistics. SYSTAT, Inc., Evanston,IL. 676pp.

Proceedings of the South Dakota Academy of Science, Vol. 75 (1996) 107
PATCH RESIDENCE TIMESOF DOWNY WOODPECKERS
Jeffrey S. PalmerCollege of Natural Sciences
Dakota State UniversityMadison, SD 57042
ABSTRACT
Simple models of foraging behavior predict that the patch residence timeof an organism should decrease when the average travel time between patch-es decreases. From 25 October 1995 to 31 March 1996, foraging “habitats” con-taining 1, 2, or 4 suet patches were presented to Downy Woodpeckers, Pi-coides pubescens, in an attempt to experimentally test this theory. Measure-ments of patch residence time were made at a single suet patch, which wasavailable throughout the study. Every 30 observations or 30 days, whicheveroccurred first, a different “habitat” was made available by either adding or re-moving suet patches from the site. Although we might expect patch residencetime to decrease when more suet patches were available in the habitat (andhence the travel time between patches is decreased), this was not the case. Theaverage patch residence times of Downy Woodpeckers was not significantlydifferent for the three different foraging habitats studied. However, femaleDowny Woodpeckers exhibited significantly longer patch residence times thandid males; this was consistent throughout the course of the study.
INTRODUCTION
Either innately or as a learned response, organisms make a variety of “de-cisions” regarding the acquisition of food in their environment. Foraging theo-ry uses experimental and theoretical models to examine the mechanisms thatbiological organisms use to make these decisions. Broadly speaking, researchhas focused on three questions: for what types of food should an animalsearch, when should an animal move and search elsewhere, and to whereshould it move? The prey model and the patch model (Stephens and Krebs,1986) respectively form the foundation for study of the first two questions. Thethird question, where to move, has received considerably less attention (Pyke,1983). This paper presents initial results of an experimental test of the predic-tions of the patch model.
The Marginal Value Theorem predicts that a forager should leave a patchwhen the marginal rate of energy gain in the patch drops below the long-termaverage rate of the habitat. There have been numerous experimental tests ofthis prediction (see the review by Shoener, 1986); the interpretation of the ex-periments is, however, far from unanimous within the ecological community

108 Proceedings of the South Dakota Academy of Science, Vol. 75 (1996)
(Pyke, 1984). The Marginal Value Theorem is obtained under the assumptionthat a forager experiences a negatively accelerated rate of energy gain per unittime spent in the patch. However, Kacelnik and Cuthill (1986) suggest that thepositive correlation between patch residence time and average travel time be-tween patches should hold even in the absence of patch depression.
The Downy Woodpecker, Picoides pubescens, is a fairly common,widespread, permanent resident in South Dakota. In winter, they are easily at-tracted to suet patches which they utilize as a food source. I present resultsfrom an initial experimental test of the average patch residence times of DownyWoodpeckers foraging in the absence of patch depression.
STUDY METHODS
Between 25 October 1995 and 31 March 1996, foraging “habitats” consist-ing of 1, 2, or 4 suet patches were presented to Downy Woodpeckers foragingin a residential neighborhood of Madison, Lake County, South Dakota. Thestudy site, defined, as the maximum rectangular area within which the suetpatches were located, was approximately 30 meters by 50 meters. Suet patch-es were placed on the trunk of trees approximately 2-3 meters above theground. All measurements of patch residence time (reported here as Mean ±Standard Error) were made at a single patch, which was available throughoutthe study. Patch residence was considered initiated when a bird landed on thetree containing the suet patch and was concluded when the bird flew from thetree. If the bird visited the suet patch, patch residence time was recorded. Oc-casionally, individuals would land on the tree and “rest” or survey the sur-roundings for potential predators before moving to the suet patch. More com-monly, birds would spend time perched on the tree after they had finishedfeeding from the suet. These times were included in the measured patch resi-dence time. Patch residence times were recorded at various times throughoutthe day, although, the majority of measurements occurred during the first hourafter sunrise. Birds were not marked for individual identification. Based on ca-sual observations, an estimated 2-5 individuals were thought to be in the area.Every 30 observations or 30 days, whichever occurred first, a new foraging“habitat” was made available by either adding or removing suet patches fromthe study site. Habitats consisting of 1, 2, 1, 4, 2, 1 and 4 patch (es) respec-tively, were used during the study. Average distance between patches was ap-proximately 50 and 30 meters for the 2 and 4 patch habitats respectively. Astandard t-test was used to assess statistical significance between average patchresidence times of Downy Woodpeckers in the 1, 2, and 4 patch “habitats”(pairwise comparisons) and for comparison of the mean patch residence timesof males versus females.
RESULTS AND DISCUSSION
Early models of patch behavior, such as Charnov (1976), predict that patchresidence time should decrease when the average travel time between other-wise identical patches decreases. Although Charnov’s model assumes patch de-

Proceedings of the South Dakota Academy of Science, Vol. 75 (1996) 109
pression, Kacelnik and Cuthill (1986) suggest that this should be the case evenin the absence of patch depression. Lima (1985) has shown that Black-cappedChickadees are able to select foraging strategies that allow for a trade-off be-tween predation risk and energy gain. Thus, when we consider that a forageris itself subject to predation, it is not altogether surprising that the predictionof the Marginal Value Theorem may still hold in an environment without patchdepression. Hence, we might expect that patch residence time would decreasewhen more patches are available in the habitat (and hence the travel time be-tween patches is less). I have conducted an experimental test of this predictionusing Downy Woodpeckers foraging at artificially placed suet patches. Averagepatch residence times of Downy Woodpeckers in the 1, 2, and 4 patch habitatswere 242 ± 16 (N = 99), 225 ± 19 (N = 67), and 212 ± 33 (N = 25) seconds, re-spectively. Recorded patch residence times ranged from 14 to 928 seconds. Thetrend indicated by the data above is consistent with this prediction; however,average patch residence time of Downy Woodpeckers was not significantly dif-ferent for the 1, 2, and 4 patch habitats studied (pairwise t-tests, P > 0.001).Since the spatial scale of this study was very small, the difference in the aver-age travel time between patches in the three “habitats” may not have beenlarge enough to significantly influence patch residence times.
Sexual differences in foraging behavior of passerines are well known(Grubb 1978). In this study, female Downy Woodpeckers exhibited signifi-cantly longer (P < 0.001) average patch residence times, 269 ± 15 seconds (N= 127), than did males, 159 ± 12 seconds (N = 64). As shown in Fig. 1, withthe exception of the single patch habitat presented at the onset, this result was
Figure 1. Average patch residence times (error bars show SE) of male and fe-male Downy Woodpeckers in each of the foraging “habitats” studied between25 October 1995 (leftmost) and 31 March 1996 (rightmost). In all but the first“habitat” at the onset of the study, males had significantly shorter patch resi-dence times than females (t-test, P < 0.001).

110 Proceedings of the South Dakota Academy of Science, Vol. 75 (1996)
observed consistently in all habitats used throughout the course of the study.Grubb (1978) has shown that under a variety of environmental conditions, theaverage foraging speed (meters per second) of male Downy Woodpeckers isfaster than that of females; this is consistent with shorter patch residence timesof male woodpeckers. Alternatively, since all measurements of patch residencetimes were made at a single patch, it is possible that the difference betweenmale and female patch residence time might be attributed to individual varia-tion, patch preference and/or competition among male and female DownyWoodpeckers. This is partially suggested by the observation that males visitedthe patch less often than did females.
ACKNOWLEGEMENTS
I would like to thank Dr. David L Swanson of the University of SouthDakota and an anonymous reviewer for comments on an earlier draft of thispaper.
REFERENCES
Charnov, E.L. 1976. Optimal foraging: the marginal value theorem. Theor. Pop-ul. Biol. 9:129-136.
Grubb, T.C. 1978. Weather-dependent foraging rates of wintering woodlandbirds. Auk 95: 370-376.
Kacelnik, A. and I. Cuthill. 1986. Starlings and optimal foraging theory: model-ing in a fractal world. pp. 303-334. In: A.C. Kamil, J.R. Krebs, and H.R. Pul-liam (eds.), Foraging Behavior. Plenum Press, New York.
Lima, S.L. 1985. Maximizing feeding efficiency and minimizing time exposed to predators: a tradeoff in the black-capped chickadee. Oecologia 66: 60-67.Pyke, G.H. 1984. Optimal foraging theory: a critical review. Annual Review of
Ecology and Systematics. 15: 523-575.Shoener, T.W. 1986. A brief history of optimal foraging ecology. pp. 5-68. In:
A.C. Kamil, J.R. Krebs, and H.R. Pulliam (eds.), Foraging Behavior. PlenumPress, New York.
Stephens, D.W. and J.R. Krebs. 1986. Average-rate maximizing: the prey andpatch models. pp. 13-37. In: D.W. Stephens and J.R. Krebs, Foraging The-ory. Princeton University Press, Princeton, New Jersey.

Proceedings of the South Dakota Academy of Science, Vol. 75 (1996) 111
EFFECTS OF DROUGHT STRESS AND WHEATSTREAK MOSAIC VIRUS ON YIELD AND GROWTH
CHARACTERISTICS IN WINTER WHEAT
M.A.C. Langham, J. Gellner, and D.J. GallenbergPlant Science Department
South Dakota State UniversityBrookings, SD 57007
ABSTRACT
Two stresses which limit production of winter wheat (Triticum aestivumL.) in South Dakota are drought and wheat streak mosaic virus (WSMV). Win-ter wheat plants (cultivar Arapahoe) were grown under greenhouse conditions.Plants were divided into two moisture treatments: one which was watered con-tinuously and one which had all water withheld for seven days. The moisturegroups were subdivided into four disease treatments. Plants in three of thetreatments were inoculated with WSMV either at the two leaf stage (prior todrought), the day that water withholding was started (at drought), or one dayafter watering was resumed (post-drought). The fourth group of plants was in-oculated with KPB to serve as a control. Two weeks after the post-drought in-oculation, plants were moved to a cold chamber and allowed to vernalize. Af-ter the cold treatment, plants were moved back to the greenhouse and grownto maturity. All growth and yield characteristics measured were significantly af-fected by WSMV infection. However, only the number of kernels per tiller wassignificantly affected by drought. Inoculation with WSMV prior to or at thetime of drought stress produced the greatest reductions in yield and growthcharacteristics.
INTRODUCTION
Wheat streak mosaic rymovirus (WSMV) causes one of the most importantviral diseases of wheat (Triticum aestivum L.) in the United States. Severe loss-es due to WSMV have been recorded across the Great Plains (Harvey et al.,1990; Sim et al., 1988). Wheat streak mosaic is the most important viral dis-ease of wheat in South Dakota, where it causes five percent minimum yieldloss, equivalent to approximately 2.5 million bushels annually (Langham et al,1993).
Wheat streak mosaic virus is a member of the Rymovirus group and is ap-proximately 700 nm in length by 15 nm in width (Brakke, 1971; Wiese, 1987).Symptoms in wheat include a mosaic pattern on the leaves, streaking, yellow-ing, stunting, partial or total sterility, tiller death, and general necrosis (Brakke,1971; Wiese, 1987). Major hosts of WSMV include winter and spring wheat,corn, oats, barley, sorghum, millet, and many native and introduced grasses(Brakke, 1971; Finley, 1957; Seifers, et al., 1996; Sill and Agusiobo, 1955;

112 Proceedings of the South Dakota Academy of Science, Vol. 75 (1996)
Wiese, 1987). The wheat curl mite (Aceria tosichella Kiefer), which is an im-portant pest of wheat (Seifers et al., 1996; Slykhuis, 1955), transmits WSMV.Wheat streak mosaic virus typically infects winter wheat during the fall wherethe virus overwinters. In the spring, it is transmitted to a succession of springwheat, corn, or grasses until its infection cycle begins again in fall-planted win-ter wheat (Gardner, 1981; Wiese, 1987).
During interviews with farmers and county agents from areas of SouthDakota severely affected by WSMV, it was repeatedly stated that yield lossesfrom WSMV were more severe during drought years. Further, this increase inseverity was associated with drought periods during the fall as well as in thespring. The objective of this research was to test the effects of WSMV infec-tion and a brief period of drought during the early growth stage of winterwheat on growth and yield characteristics.
MATERIALS AND METHODS
A strain of WSMV (WSMV-AR) obtained from Drs. H. A. Scott and R. C.Gergerich (University of Arkansas, Fayetteville, AR) was utilized as the virussource in this research. The virus was maintained in the winter wheat cultivarSturdy by mechanical inoculation. Antisera to WSMV was also provided byDrs. Scott and Gergerich.
Winter wheat (cultivar Arapahoe) was planted in 10 cm square pots filledwith a sterilized 1:3 sand:top soil (v:v) mixture. All experiments were con-ducted under greenhouse conditions. Plants were allowed to germinate andthinned to two seedlings per pot.
Plants were randomly divided into two moisture treatment groups, onewhich was watered daily (water treatment) and one which had all water with-held for seven days (drought treatment). The drought treatment was initiatedsixteen days after planting (seven days after the plants had reached the twoleaf stage). Pots were elevated above the bench surface by placing them ontwo narrow wooden slats to prevent drought treatment plants from accidental-ly imbibing overflow water. All plants were randomly positioned on thebench, and adequate spacing was maintained between plants to prevent me-chanical transmission by plant contact throughout the entire experiment.
Each of the two moisture treatment groups was subdivided into four dis-ease treatments: control (CON), prior to drought (PRD), at onset of drought(AOD), and post-drought (PSD). Plants in three of the treatments were inocu-lated with sap extracted from WSMV infected Sturdy wheat plants. Sap extractswere obtained by macerating a 1:3 (W:V) mixture of infected wheat:buffer [0.02M potassium phosphate buffer (KPB), pH 7.0]. The macerated tissue mixturewas strained through double layers of cheesecloth to remove fiber debris. Oneper cent of silica carbide powder (600 mesh) was added as an abrasive. Sapextracts were applied with a saturated square of cheesecloth to both surfacesof leaves. Plants in the PRD group were inoculated at the two leaf stage (ninedays after planting), plants in the AOD group were inoculated the day waterwithholding was begun (sixteen days after planting), and plants in the PSDgroup were inoculated the day after watering was resumed (twenty-four days

Proceedings of the South Dakota Academy of Science, Vol. 75 (1996) 113
after planting). The CON group of plants was inoculated with KPB and oneper cent silica carbide at nine days after planting when the plants were mostsusceptible to mechanical damage. Each treatment group was replicated sixtimes, and the experiment was repeated twice.
Seven days after the last inoculation, plants were moved to the cold cham-ber for vernalization. Plants were held at 2-3º C for six weeks with an eighthour day length. Following vernalization, plants were returned to the green-house and allowed to completely mature. Three leaves were taken from plantsprior to maturity and tested using protein-A ELISA to confirm infection (Ed-wards and Cooper, 1985). Once plants were mature, the following measure-ment were taken: counts of total tiller number, primary tiller height, vegetativelength, head length, the number of plants with sterile tillers or heads, the num-ber of filled spikelet pairs on the primary tiller, kernels per plant and per tiller,kernel weight per plant, and single kernel weight.
All characteristics except sterility were analyzed using a factorial analysisof variance utilizing Statistical Analysis System (SAS), Cary, NC (SAS InstituteInc., 1982) to compare the main effects and interaction. Least significant dif-ferences (LSD) were calculated for comparison within the main effect means.Sterility was analyzed by X2 analysis.
RESULTS
Maximum greenhouse temperatures ranged from 29º-39º C during themoisture withholding period. At the end of this period, plants in the droughttreatment demonstrated a marked loss of turgidity. However, all plants recov-ered once watering was resumed.
Winter wheat plants that were inoculated with WSMV developed mosaicsymptoms and were positive for WSMV when analyzed by PA-ELISA. Plantsinoculated with buffer (CON) remained symptomless and were negative forWSMV infection in PA-ELISA. Sterility of one or more tillers or heads was ob-served in mature wheat inoculated with WSMV (Table 1) with up to 50% steril-ity occurring in some treatment groups.
Tiller number (Table 2) was significantly affected by the date of inocula-tion. Control plants (CON) had significantly more tillers than any of the othergroups. Plants inoculated PRD and AOD had significantly fewer tillers thanplants inoculated PSD. Tiller numbers ranged from 3.4 (CON) to 1.0 (PRD).Tiller number was not significantly influenced by the drought treatment, andthere was not an interaction between drought and WSMV inoculation.
Tillers of CON plants (Table 2) were significantly taller than tillers fromother treatments. Tillers from plants inoculated PSD were significantly tallerthan those from plants inoculated PRD or AOD. Tiller heights ranged from 29.8cm (PRD) to 68.0 cm (CON). Tiller height was subdivided into vegetative andhead length. Vegetative length was significantly affected by inoculation withWSMV (Table 2) in PRD, AOD, and PSD treatments. Prior to drought, AOD,and PSD vegetative lengths were significantly less than the CON group. How-ever, head lengths of the CON and PSD plants were not significantly differentfrom each other, although they were longer than the PRD and AOD groups.

Neither drought treatment nor the interaction between drought and inoculationwas significant for any of the above characteristics.
Control plants had significantly more filled spikelets than the other inocu-lation groups (Table 3). Spikelets often filled only one of the seed pairs in WS-MV inoculated treatments indicating that the other side was aborted. Num-bers of filled spikelets ranged from 10.2 in the CON to 3.9 in the AOD treat-ment.
The number of kernels per plant (Table 3) and the number of kernels pertiller (Figure 1) were both significantly affected by inoculation with WSMV.The number of kernels per plant was reduced 58.2% in the PSD group, 73.6%in the PRD group, and 81% in the AOD group. The number of kernels per
114 Proceedings of the South Dakota Academy of Science, Vol. 75 (1996)
Table 1. The percentage of winter wheat cv. Arapahoe plants with one or moresterile tiller or head at maturity (X2 significant at α = 0.01).
INOCULATION
Moisture CON PRD AOD PSD
Drought 0% 33% 50% 33%Water 0% 50% 33% 25%
Table 2. Vegetative characteristics measured for ‘Araphoe’ winter wheat in-fected with WSMV.
INOCULATION
Moisture CON PRD AOD PSD P > F LSDINOC*
Tiller NumberMeansInoc* 3.4 1.0 1.3 2.2 0.0001 0.6
Primary Tiller—Height (cm)MeansInoc* 68.0 29.8 32.0 41.1 0.0001 8.9
Primary Tiller—Vegetative (Culm) Length (cm)MeansInoc* 62.7 26.6 28.6 36.6 0.0001 8.1
Primary Tiller—Head Length (cm)MeansInoc* 5.4 3.2 3.5 4.5 0.0001 0.9
*Inoculation was a significant main effect. Means and LSDs (α= 0.05) calculated for thiseffect are shown in this table. Moisture treatments and the interaction between moistureand inoculation were not significant.

Proceedings of the South Dakota Academy of Science, Vol. 75 (1996) 115
tiller was also significantly affected by the moisture treatments. Elevated ker-nel numbers were observed in the PRD drought treatment and in the PSD wa-ter treatment. This was the only significant effect due to drought observed inthis study.
The kernel weight per plant (Table 3) was significantly affected by inocu-lation with WSMV. Kernel weights of WSMV infected plants were reduced upto 87% compared to the CON treatment. Single kernel weight was also signif-icantly reduced by WSMV infection (Table 3). Single kernel weight from plantsinoculated AOD was reduced 68%, which represents the greatest reduction insingle kernel weight. Kernels from CON plants had significantly higherweights than WSMV inoculated plants. Neither drought treatment nor the in-teraction between drought and inoculation was significant.
DISCUSSION
Inoculation with WSMV (PRD, AOD, and PSD) influenced the growth ofwinter wheat. Tiller number, primary tiller height, vegetative length, and headlength were most affected by PRD inoculation. The number of filled spikelets,kernels per plant, kernels per tiller, kernel weight per plant, and single kernelweight were lowest in AOD inoculation. Post-drought inoculation with WSMVaffected most characters in a manner similar to PRD and AOD; however, theeffects were generally not as severe. Two exceptions to this pattern werefound in measurement of head lengths, in which the PSD treatment was not
Table 3. Yield characteristics measured for ‘Arapahoe’ winter wheat infectedwith WSMV.
INOCULATION
Moisture CON PRD AOD PSD P > F LSDINOC*
Filled spikelets on primary tillerMeansInoc* 10.2 4.9 3.9 6.4 0.0001 2.5
Kernels per plantMeansInoc* 31.8 8.4 6.1 13.3 0.0001 6.5
Kernel weight per plant (mg)MeansInoc* 649.7 93.8 85.1 180.5 0.0001 124.8
Single kernel weight (mg)MeansInoc* 22.3 8.1 7.8 10.4 0.0001 5.1
*Inoculation was a significant main effect. Means and LSDs (α = 0.05) calculated forthis effect are shown in this table. Moisture treatments and the interaction between mois-ture and inoculation were not significant.

116 Proceedings of the South Dakota Academy of Science, Vol. 75 (1996)
significantly different from the CON, and in tiller height, where PSD inoculat-ed plants were different from plants in all other treatments. Thus, timing of in-oculation with WSMV had variable effects for different characters. This differsfrom the traditional concept that inoculation at the youngest growth stage al-ways produces the greatest effects.
The number of kernels per tiller was the only characteristic that was sig-nificantly affected by a brief period of drought stress during the early growthstages. Increases in the number of kernels of the PRD drought treatment andthe PSD watered treatment may indicate that the drought period influence vi-ral replication. All other wheat growth parameters recovered from lack ofmoisture when watering was resumed. This conflicts with the observation byfarmers and county agents that even brief periods of drought increase WSMVlosses. However, other factors such as increased movement of wheat curlmites due to drought or repeated cycles of drought stress may contribute to thisobservation. Also, the effects of drought may be correlated with other factors,such as reductions in root growth by WSMV infection, which were not studiedin this experiment. Other research is currently being conducted to explore thisarea.
Figure 1. Mean number of kernels per tiller of ‘Arapahoe’ winter wheat in-fected with WSMV. Plants were significantly affected by inoculation with WS-MV (P > F 0.0033 LSDINOC = 3.6 at α = 0.05) and by moisture treatments (P >F0.0257 LSDDRO = 2.4 at α = 0.05). Interaction effects between inoculation andmoisture were found (P > F 0.0511).
Proceedings of the South Dakota Academy of Science, Vol. 75 (1996) 117
LITERATURE CITED
Brakke, M. K. 1971. Wheat streak mosaic virus. Descriptions of Plant Viruses.Commonwealth Mycological Institute, Kew, Surrey, England.
Edwards, M. C., and J. I. Cooper. 1985. Plant virus detection using a new formof indirect ELISA. J. Virol. Methods 11:309-319.
Finley, A. M. 1957. Wheat streak mosaic, a disease of sweet corn in Idaho. PlantDis. Rep. 41:589-591.
Gardner, W. S. 1981. Relationship of corn to the spread of wheat streak mosa-ic virus in winter wheat. (Abstr.) Phytopathology 72;217.
Harvey, T. L., T. J. Martin, and D. L. Seifers. 1990. Wheat curl mite and wheatstreak mosaic in moderate trichome density wheat cultivars. Crop Sci.30:534-536.
Langham, M. A. C., D. J. Gallenberg, and J. E. Powell. 1993. Prevernalizationincidence of wheat streak mosaic virus in South Dakota winter wheat. (Ab-str.) Phytopathology 83:1421-1422.
SAS Institute Inc. 1982. SAS User’s Guide: Statistics. Cary, NC: SAS Institute Inc.584 pp.
Seifers, D. L., T. L. Harvey, K. D. Kofoid, and W. D. Stegmeier. 1996. Naturalinfection of pearl millet and sorghum by wheat streak mosaic virus inKansas. Plant Dis. 80:179-185.
Sill, W.H., and P. C. Agusiobo. 1955. Host range studies of the wheat streak mo-saic virus. Plant Dis. Rep. 39:633-642.
Sim IV, T., W. G. Willis, and M. G. Eversmeyer. 1988. Kansas plant disease sur-vey. Plant Dis. 72:832-836.
Slykhuis, J. T. 1955. Aceria tulipae Kiefer (Acarina: Eriophyidae) in relation tothe spread of wheat streak mosaic virus. Phytopathology 45:116-128.
Weise, N. V. 1987. Compendium of Wheat Diseases. American Phytopatholog-ical Society, St. Paul, MN. 112 pp.

Proceedings of the South Dakota Academy of Science, Vol. 75 (1996) 119
THE DILATANCY CAUSED BY SHEARING MOTION
George H. DuffeyDepartment of Physics
South Dakota State UniversityBrookings, SD 57007
ABSTRACT
The disruption of molecular packing caused by shear motion in a fluid de-pends not only on the velocity gradient in the pertinent region but also on howfast the molecules in the given material respond to any change in this gradi-ent. So the author has replaced this gradient with the dilatancy, introducing itinto the formula for dE, where E is the specific internal energy. Then combin-ing the known relationship between the rate at which the shearing can relax,the author has derived a relationship between the dilatancy and the corre-sponding steady state rate of shear. Measurements of the dilatancy in a fluidundergoing a known rate of shear can then yield a value for the relaxationtime. A similar treatment of heat flow yields a relationship between the dila-tancy and the corresponding steady-state temperature gradient.
INTRODUCTION
In developing thermodynamics for a system undergoing shear, Hanley andEvans (Hanley and Evans, 1982; Evans, 1983) employed the velocity gradientcausing the shear as a state variable. However, the resulting disruption in thepacking of the molecules does not follow instantaneously on imposition of thegradient. Instead, a relaxation time τ is involved. So their choice is suitable on-ly when the velocity gradient across each element is fixed (Duffey, 1986).
Similarly, heat flow across an element disrupts the molecular packing. Herethe driving force is due to the temperature gradient. But again, a relaxationtime τ is involved.
Characterizing the disruption in a typical element is its specific dilatancy
β = V – Veq. (1)
Here V is the specific volume, while Veq is the specific volume about a repre-sentative point if local equilibrium prevailed at the same temperature T andpressure P. (Classical irreversible thermodynamic theory assumes that such lo-cal equilibrium prevails.)
Also characterizing the state of the given element is the specific entropy S.This is related to the value Seq it would have if local equilibIium prevailed, bycalculating the entropy produced in the element as it relaxes freely to the stateof equilibrium at the given T and P. One may imagine that a typical macro-scopically homogeneous element is suddenly isolatecl, kept at the same T andP, and allowed to relax.

120 Proceedings of the South Dakota Academy of Science, Vol. 75 (1996)
ANALYSIS
Maintaining a shear rate in a fluid of viscosity η dissipates energy.From the time rate of this dissipation, one finds the time rate of specific en-tropy production to be
(2)
When the given element is suddenly freed of stress, it presumably relaxes ex-ponentially. So we set
(3)
where t is the time coordinate while τ is the relaxation time.Now, the corresponding change in the internal energy E over an infinites-
imal interval is
(4)
(Duffey, 1986). Here ξ is the state variable conjugate to the dilatancy β. Sincewe keep T constant, we assume there is no transfer of heat. So the increase ininternal energy is set equal to the work of compression. Cancelling these termsfrom equation (4) and solving foI –dβ gives
(5)
Introducing (2) and (3) into (5) and integrating over complete relaxation withthe approximation that V is constant yields
(6)
Here is the relative dilatancy while η is the viscosity coefficient, τ is the
relaxation time, and is the velocity gradient.
For a system in which heat is flowing in the –x direction, we similarly iso-late a typical element. The temperature gradient presumably relaxes exponon-tially:
(7)
The relaxation tirne τ for this process generally differs from that for flow. Nowthe corresponding rate of specific entropy production is
(8)
where λ is the thermal conduction coefficient.

Proceedings of the South Dakota Academy of Science, Vol. 75 (1996) 121
Substituting into equation (5) and integrating over complete relaxationnow yields
(9)
for the relative dilatancy. Parameter ξ is given by
(10)
This may be approximated by the pressure P (Duffey, 1986).
DISCUSSION
Equation (6) relates the dilatancy in an element of a flowing fluid, kept ata given temperature, to the corresponding velocity gradient under steady-stateconditions. For a given substance, the effect is probably small except in the su-percritical region immediately above the critical point.
A person may measure the dilatancy of a given fluid element undergoinga measured rate of shear. With the viscosity of the fluid and the imposed pres-sure, one can then calculate the relaxation time for the given fluid. This maythen be compared with the relaxation time obtained from measurements ontransverse viscoelastic waves (Jou et al., 1993, pages 205-207).
Similarly, equation (9) relates the dilatancy in an elemcnt of a given sub-stance that is caused by a temperature gradient, to this gradient. The effect maybe similar to that of raising the temperature in the chosen layer by a few de-grees with no gradient present. Again, the effect would be considerable in thenear supercritical region.
REFERENCES
Duffey, G.H. 1986. Dilatancy associated with one-dimensional compression ofmaterials. J. Phys. Chem. 90:205-206.
Evans, D.J. 1993. Computer “experiment” for nonlinear thermodynamics ofCouette flow. J. Chem. Phys. 78:3297-3302.
Hanley, H.J.M., and D.J. Evans. 1982. A thermodynamics for a system undershear. J. Chem. Phys. 76:3225-3232.
Jou, D., J. Casas-Vazquez, and G. Lebon. 1993. Extended Irreversible Thermo-dynamics. Springer-Verlag, Berlin.


Proceedings of the South Dakota Academy of Science, Vol. 75 (1996) 123
NONCLASSICAL PHYSICAL PROCESSESIN NETWORKS OF NERVES
George H. DuffeyDepartment of Physics
South Dakota State UniversityBrookings, SD 57007
ABSTRACT
Neuroscientists have shown how the typical brain is composed of a com-plicated network of nerve fibers. Electric impulses in these may act as in a com-plex computer. But Penrose argues that the higher actions of the brain are notalgorithmic in nature. Thus, the network can act in a nonclassical manner. Theauthor points out how each action potential appears to be a soliton quantized.As a result, the functions for succeeding pulses can be combined in a sym-metric fashion to yield a state function with a phase. So different trains of suchpulses can be made coherent. Consciousness requires coherences among athinking section, one or more memory sections, and sensory sections. Bio-chemical processes rnay act to establish and maintain the requisite coherences.
INTRODUCTION
A nervous system is a network of neurons and synapses that may act as acomplicated computer (Churchland and Sejnowski, 1992, pages 1-329). Eachparticipating neuron receives information, organizes it, and transmits the resultthrough synapses to the appropriate receiving neurons (Hall, 1992; Hille, 1992,pages 1-258; Sargent, 1992; Schiller and Hall, 1992). A signal in an axon or den-drite of a neuron is of the off-on type, as in an element of a computer. Eachpulse, or action potential, along a given fiber is equivalent to all others. It car-ries no information in its amplitude or duration. Only the timing and frequen-cy of the impulses are important. Each impulse lasts about 1 ms. The speed oftravel depends on the fiber. In myelinated ones, it is from 10 to 100 m s-1; inunmyelinated ones, less than 1 m s-1.
Synapses are of two types, chemical and electronic. At a chemical synapse,an incident action potential releases a number of neurotransmitter molecules.These travel to receptors on the receiving neuron, where they may open chan-nels and incite no, one, or more than one action potential, with a lag of a fewms. At an electronic synapse, current flows directly across the gap by way ofprotein channels. This may trigger action in the postsynaptic cell within 0.1 ms.
A fundamental question is how consciousness is produced. Some have ar-gued that it is an emergent phenomenon, arising out of the complexity of thebrain. Indeed, the human brain contains around 1011 neurons. Each neuronsports an axon and many dendrites that connect with other neurons throughsynapses. The number of synapses for a single neuron averages about 103. Sothe interconnectivity possible is enormous.

124 Proceedings of the South Dakota Academy of Science, Vol. 75 (1996)
But in a subconscious part of the brain, the cerebellum, there are about 3 x 10¹⁰ neurons. This by itself acts as a complex computer. But here the com-plexity does not lead to awareness. On the other hand, consciousness arises inthe cerebellum. Furthermore, some processes are not algorithmic. So Penroseconcludes that some actions of the brain are not like those of a computer, nomatter how complex (Penrose, 1994, pages 7-209). Thus, the brain cannot bebehaving as a purely classical system. Arnong the pertinent actions are thosethat lead to consciousness and to understanding. Also noteworthy are mentalconclusions reached by non-algorithmic reasoning.
ANALYSIS
Let us revisit the physical processes going on in and among nerve cells.The interior of such a cell is separated from the surrounding fluid by a phos-pholipid bilayer. Ions and molecules move through the membrane by carriersand pores. There are pumps transporting K+ in, but Na+ ancl Cl– out. Thus, con-centration differences are maintained. Negative ions are adsorbed on the insideof the rnembrane, positive ions on the outside. As a consequence, the poten-tial of a resting nerve is negative, typically about –70 mV with respect to thesurroundings. At this stage, a slow leakage of K+ out and Na+ in balances thepumping rates.
Depolarization of the rnembrane past the threshold in a small region openssorne Na+ pores there, and a few Na+ ions move in, causing more such poresto open and carrying the potential rapidly into the positive region. Somewhatmore slowly, the K+ pores open. Some of these ions move out, bringing thecell body quickly to its resting potential or slightly beyond, with the poresagain closed and momentarily deactivated.
Since a rise in electric potential propagates in an electrolytic solution, theaction in the initial region is followed by a similar action in subsequent layersof the nerve fiber. The resulting action potential propagates with constantshape, height, and duration. It is a soliton.
Continued activation causes redepolarization and formation of a train ofsolitons. In a given nerve fiber, these pulses are generally equivalent, as not-ed.
On traveliIlg down a nerve fiber, a soliton includes movement of Na+ in,then K+ out, through their channels. We have here a coherent transverse move-ment of mass in the wave. In a sense, it is analogous to the movement of massin a low-lying vibrational mode of a solid. There one quantizes the motion. Theresulting quasiparticles are the phonons of solid-state physics.
In a similar way, let us consider the transverse movement of ions in the ac-tion potential as a concerted movement. It forms in effect a quasiparticle, anacton, traveling down the fiber. Its propagation may be represented by a wavefunction
(1)

Proceedings of the South Dakota Academy of Science, Vol. 75 (1996) 125
Here the x-axis points in the direction of the propagation, k is the wave-vec-tor, ω the angular frequency, υ the velocity of propagation. Function F isstrongly peaked, almost a delta function, about the point
xi = υt –αi. (2)
Electromagnetic considerations allow υ to be calculated (Rall, 1989; Segev etal., 1989).
All pulses, or actons, in a given nerve fiber appear to be equivalent. Thissupports the view that we are dealing with the quantization we have con-structed. A train of pulses is then described as a symmetric combination offunctions of type (1) with appropriately differing parameters αi.
At a chemical synaptic connection to a subsequent neuron, the resultingtransverse wave becomes longitudinal because the released neurotransmitterstravel longitudinally to receptors on the target neuron. In this process, the num-ber of pulses produced by a given incident train may be more than, equal to,or less than those in the incident unit. Thus over a series of neurons, a vectorcode for a thought can be established.
Presumably, consicousness involves trains of solitons traversing subnet-works of a complex network. In a subnetwork, the train varies from neuron toneuron following the established vector code. The trains in the participatingnetworks form a coherent whole, with definite relative phases (Duffey, 1992,pages 348-350; Duffey, 1993). Some subnetworks would contribute memories;others, sensations from the sensory organs of the body. Some would involvemotor neurons; others, internal control systems.
Any one of these subnetworks would be opened up to the conscious mindby coherence being establishcd with the primary conscious sections. Remov-ing a particular subnetwork from consciousness is accomplished by breakingthe pertinent coherence. Loss of consiousness results when the coherencesamong the various subnetworks are broken. The changes would be effected atthe pertinent synapses.
Introducing coherence between trains in two different subnetworks re-duces the number of effective disjoint quantum states. For linking two trains,the number is approximately cut in two. The corresponding entropy change is
∆S = k ln1⁄2 = –k ln 2 (3)
according to the Boltzmann equation. But for the process to take place, theGibbs energy change
∆G = ∆H – T ∆S (4)
must be negative. Thus, the cnthalpy change needs to be
∆H < T ∆S = –kT ln2. (5)

126 Proceedings of the South Dakota Academy of Science, Vol. 75 (1996)
Some biochemical processes must act to effect this removal. Breaking the co-herence, on the other hand, may occur spontaneously when the biochemicalsupport is rcmoved.
DISCUSSION
The neural network in a brain differs from that in a computer with its plastici-ty. Synaptic connections can be introduced or eliminated. Furthermore, thestrengths of the synaptic connections in a region can be altered. Thus, the vec-tor code for a perception can be constructed, altered, or eliminated. And ab-stractions can be made.
A person generally considers his or her consciousness as a continuouslyvarying unit. Because different sections of the brain are presumably involvedat a given time, the phenomenon is a nonlocal one cemented by the coher-ences among its participating parts. In this respect, it involves theEinstein-Podolsky-Rosen effect (Penrose, 1994, pages 237-306).
What we llave outlined in the preceding section is only a part of the sto-ry, however. It shows how quantum effects are involved. But these effects arenot sufficient to explain the higher mental processes, where nonalgorithmicchoices are made.
Such purposeful actions involve control processes that act on the pertinentsynapses. The details for these are yet to be established. (See Pemose, 1994,pages 307-421).
REFERENCES
Churchland, P.S., and T.J. Sejnowski. 1992. The Computational Brain. MITPress, Cambridge, MA.
Duffey, G.H. 1992. Quantum. States and Processes. Prentice-Hall, EnglewoodCliffs, NJ.
Duffey, G.H. 1993. The relationship between classical and quantum mechan-ics. Proc. S.D. Acad. Sci. 72:27-29.
Hall, Z.W. 1992. The cells of the nervous system. / Ion channels, the nerve ter-minal. Pages 1-32, 81-118, 148-178 IN Hall, Z.W. (ecl.), Molecular Neuro-biology. Sinauer Associates, Sunderland, MA.
Hille, B. 1992. Ionic Channels of Excitable Membranes. Sinauer Associates, Sun-derland, MA.
Penrose, R. 1994. Shadows of the Mind. Oxford University Press, Oxford.Rall, W. 1989. Cable theory for dendritic neurons. Pages 9-62 IN Koch, C., and
I. Segev (eds.), Methods in Neuronal Modeling. MIT press, Cambridge, MA.Sargent, P.B. 1992. Electrical Signaling. Pages 33-80 IN Hall, Z.W. (ed.), Molec-
ular Neurobiology. Sinauer Associates, Sunderland, MA.Schiller, R.H., and Z.W. Hall. 1992. Chemical messengers at synapses. Pages
119-147 IN Hall, Z.W. (ecl.), Molecular Neurobiology. Sinauer Associates,Sunderland, MA.
Segev, I., J.W. Fleshman, and R.E. Burks. 1992. Compartmental models of com-plex neurons. Pages 63-96 IN Koch, C., and I. Segev (eds.), Methods inNeuronal Modeling. MIT press, Cambridge, MA.

Proceedings of the South Dakota Academy of Science, Vol. 75 (1996) 127
VARIATION OF WHEAT STREAKMOSAIC VIRUS CONCENTRATION INEARLY GROWTH OF WINTER WHEAT
Z. Wu and M.A.C. LanghamPlant Science Department
South Dakota State UniversityBrookings, South Dakota 57007
ABSTRACT
In order to investigate interaction of winter wheat and wheat streak mosa-ic virus (WSMV), variation of WSMV concentration and its effects on vegetativegrowth was determined in two winter wheat cultivars, Arapahoe and Rose, dur-ing early growth. Initial symptoms in both cultivars occurred at 6 days post-in-oculation (DPI), and became a pronounced systemic mosaic by 9 DPI. Symp-toms developed at a steady rate and reached maximum severity at 30 DPI bywhich time ELISA (enzyme-linked immunosorbent assay) values from shootsand roots have already peaked and began to decline. Protein-A ELISA detect-ed WSMV in shoots and roots at the same time as symptoms developed (6DPI). Values of ELISA in shoots and roots exhibited cyclic changes, increasingto peak values at 21 DPI in shoots and at 18 DPI in roots. Values decreased at24 DPI, and increased again at 27 and 30 DPI in both shoots and roots. Shootweights from both cultivars and root weight for Arapahoe were significantly re-duced by WSMV at 30 DPI. The correlation coefficients for ELISA values andfresh weights indicated the growth of shoots and roots at an early growth wasaffected by each other as well as influenced by WSMV infection.
INTRODUCTION
Wheat streak mosaic, caused by wheat streak mosaic virus (WSMV), is aserious threat to wheat production in the northern Great Plains (Slykhuis, 1952;Staples and Allington, 1956). The virus is transmitted by the eriophyid mite, Ac-eria tosichella Kiefer (A. tulipae Kiefer), commonly referred to as the wheatcurl mite (Amrine and Staany, 1994; Slykhuis, 1955). Although it is most com-monly known as an important disease of winter wheat (Triticum aestivum L.),WSMV also infects spring wheat, corn, oats, other small grain crops, and an-nual and perennial grasses (Brakke, 1977; Christian and Willis, 1993).
The first report of WSMV in South Dakota was in June 1949, but there wereindications of the disease earlier (Slykhuis, 1952). Infected plants are usuallystunted and have reduced seed production at maturity. WSMV was found in45% of all farmer’s fields surveyed in South Dakota during the falls of 1991-1993. Symptoms of wheat infected with WSMV include characteristic green andyellow streaks parallel with the leaf veins, followed by a more severe necrosis(Brakke, 1977; Slykhuis, 1952). Annual losses in winter wheat are estimated at

128 Proceedings of the South Dakota Academy of Science, Vol. 75 (1996)
5% in South Dakota with approximately 2.5 million bushels lost per year (Lang-ham et al, 1993).
Development of wheat cultivars resistant to WSMV would increase ourability to control this disease (Negal, 1960; Niblett et al, 1974; Staples andAllington, 1956). High levels of resistance to WSMV, demonstrated by the ab-sence of virus symptoms or by very mild symptoms, are not available in com-mercial cultivars (Edwards and McMullen, 1988; Rahman et al, 1974). Somesources of tolerance, which were found in wheat, have not been used exten-sively in breeding programs because of the difficulty and inaccuracy of evalu-ation (Bellingham et al, 1957; Pfannenstiel and Niblett, 1978). Responses ofwheat plants to WSMV are an important basis for selection of resistance or tol-erance. However, little quantitative information is available on the correlationof WSMV concentration with responses of wheat during early growth. The ob-jective of this study was to assess variation of the WSMV concentration and itseffects on winter wheat plants during early growth.
MATERIALS AND METHODS
Virus Isolate
All experiments were conducted using a wheat streak mosaic virus isolate(WSMV-SD), collected locally from South Dakota by Dr. M.A.C. Langham. Thevirus isolate was maintained on the winter wheat cultivar ‘Arapahoe’ undergreenhouse conditions.
Growing Conditions and Inoculation
All experiments were conducted under greenhouse conditions. Seeds oftwo winter wheat cultivars were sown in 13 cm plastic pots, containing a ster-ilized (1 hr at 121º C), sieved mixture of top soil and sand in a 1:3 (v:v) ratio.Seedlings were thinned to four plants per pot prior to inoculation. Plants wereinoculated at the 2 to 3 leaf stage by rubbing with a sap extract prepared bymacerating WSMV infected leaves (1:3 tissue:buffer) in 0.02 M potassium phos-phate buffer (KPB), pH 7.0. One percent (w/v) silica carbide was added to theinoculation mixture as an abrasive. Control plants were inoculated with KPBand silica carbide. Two pots (one for inoculation and one for control) wereused at each sampling date per cultivar. All pots were arranged randomly afterinoculation, and enough space was maintained between pots to prevent acci-dental transmission from nearby plants. Experiments were replicated threetimes.
Symptom Rating
Before each sampling (every three days after inoculation), diseased andcontrol plants were visually assessed for severity on a scale of 0-5 (0=no visi-ble symptoms, 1=light green broken streaks, 2=mostly light green and a few

Proceedings of the South Dakota Academy of Science, Vol. 75 (1996) 129
yellow streaks, 3=mixed green and yellow continuous streaks, 4=yellowstreaks, and 5=severe yellow streaks and necrosis).
Sampling
Plants were sampled every three days from 0 to 30 days post- inoculation(DPI). Roots were washed free of soil and debris, dried with paper towels, andseparated from shoots. Fresh shoots and roots were weighed separately andthen stored at -20º C until laboratory processing for ELISA.
Sample Extraction and ELISA
Crude extracts from shoot and root tissues were prepared with a sap ex-tractor (Erich Pollahne, Germany) and were then diluted 1:10 (v:v) with ex-traction buffer [2% polyvinylpyrrolidone (MW 10,000) in phosphate bufferedsaline containing 0.05% Tween-20 (PBS-Tween)]. The protein-A ELISA proce-dure was modified from the procedure of Edwards and Cooper (1985). Fivelayers of reactants (Table 1) were applied to microtiter plates in volumes of 200µl per well. A mixture containing p-nitrophenyl phosphate (1 mg/ml) in sub-strate buffer was added, and plates were developed at room temperature untilthe reaction in the wells containing WSMV infected sap (positive control) ex-ceeded an absorbance of 2.0. Substrate reactions were stopped by adding 50µl 3 M NaOH per well. Absorbance was measured at 405 nm using an ELISAmicroplate reader (Denley Welscan).
Data Analysis
Linear regression utilizing SAS REG procedure (1985) was used to analyzethe shoot and root growth data for WSMV-infected and control plants of eachcultivar. Analysis of variance followed by least significant difference (LSD) wasused to compare the difference of means between infected and control plants.The correlation between plant growth and ELISA values were determined us-ing Pearson correlation coefficients. Values of ELISA were considered positiveif they exceeded a threshold equalling the mean plus three times the standarddeviation of corresponding controls.
Table 1. Five layers of reactants and the concentration in PA-ELIS.
Reactant Concentration
1. Protein A 1 µg/ml2. Primary antiserum 1:10,0003. Sample extract 1:104. Secondary antiserum 1:2,0005. Protein-A alkaline
phosphatase conjugate 1.05 µg/ml
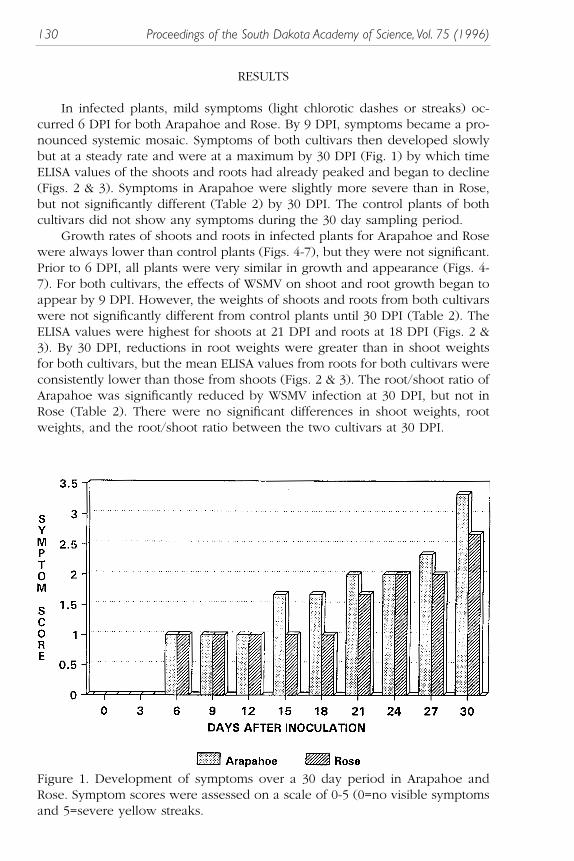
130 Proceedings of the South Dakota Academy of Science, Vol. 75 (1996)
RESULTS
In infected plants, mild symptoms (light chlorotic dashes or streaks) oc-curred 6 DPI for both Arapahoe and Rose. By 9 DPI, symptoms became a pro-nounced systemic mosaic. Symptoms of both cultivars then developed slowlybut at a steady rate and were at a maximum by 30 DPI (Fig. 1) by which timeELISA values of the shoots and roots had already peaked and began to decline(Figs. 2 & 3). Symptoms in Arapahoe were slightly more severe than in Rose,but not significantly different (Table 2) by 30 DPI. The control plants of bothcultivars did not show any symptoms during the 30 day sampling period.
Growth rates of shoots and roots in infected plants for Arapahoe and Rosewere always lower than control plants (Figs. 4-7), but they were not significant.Prior to 6 DPI, all plants were very similar in growth and appearance (Figs. 4-7). For both cultivars, the effects of WSMV on shoot and root growth began toappear by 9 DPI. However, the weights of shoots and roots from both cultivarswere not significantly different from control plants until 30 DPI (Table 2). TheELISA values were highest for shoots at 21 DPI and roots at 18 DPI (Figs. 2 &3). By 30 DPI, reductions in root weights were greater than in shoot weightsfor both cultivars, but the mean ELISA values from roots for both cultivars wereconsistently lower than those from shoots (Figs. 2 & 3). The root/shoot ratio ofArapahoe was significantly reduced by WSMV infection at 30 DPI, but not inRose (Table 2). There were no significant differences in shoot weights, rootweights, and the root/shoot ratio between the two cultivars at 30 DPI.
Figure 1. Development of symptoms over a 30 day period in Arapahoe andRose. Symptom scores were assessed on a scale of 0-5 (0=no visible symptomsand 5=severe yellow streaks.
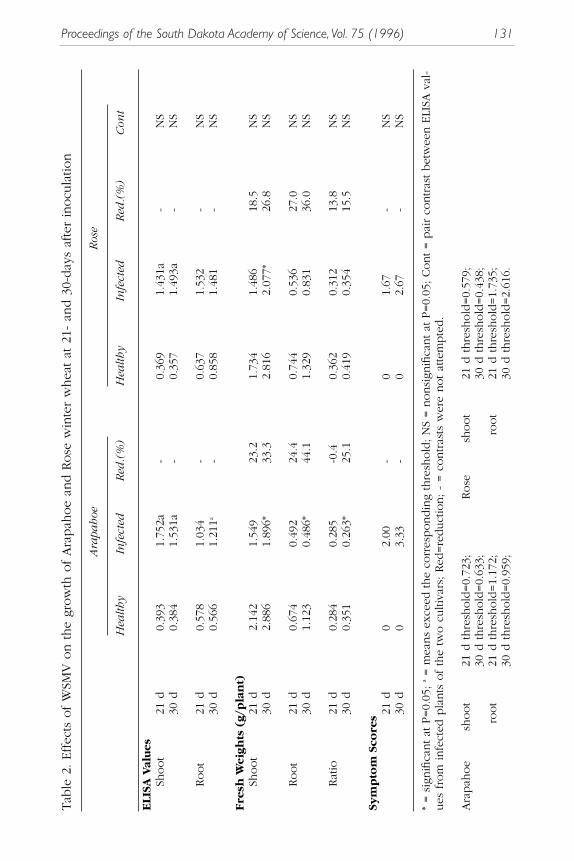
Proceedings of the South Dakota Academy of Science, Vol. 75 (1996) 131
Tab
le 2
. Effec
ts o
f W
SMV o
n the
grow
th o
f Ara
pah
oe
and R
ose
win
ter
whea
t at
21-
and 3
0-day
s af
ter
inocu
latio
n
Ara
pah
oeR
ose
Hea
lth
yIn
fect
edR
ed.(
%)
Hea
lth
yIn
fect
edR
ed.(
%)
Con
t
ELI
SA V
alu
esSh
oot
21 d
0.39
31.
752a
-0.
369
1.43
1a-
NS
30 d
0.38
41.
531a
-0.
357
1.49
3a-
NS
Root
21 d
0.57
81.
034
-0.
637
1.53
2-
NS
30 d
0.56
61.
211a
-0.
858
1.48
1-
NS
Fre
sh W
eigh
ts (
g/p
lan
t)Sh
oot
21 d
2.14
21.
549
23.2
1.73
41.
486
18.5
NS
30 d
2.88
61.
896*
33.3
2.81
62.
077*
26.8
NS
Root
21 d
0.67
40.
492
24.4
0.74
40.
536
27.0
NS
30 d
1.12
30.
486*
44.1
1.32
90.
831
36.0
NS
Rat
io21
d0.
284
0.28
5-0
.40.
362
0.31
213
.8N
S30
d0.
351
0.26
3*25
.10.
419
0.35
415
.5N
S
Sym
pto
m S
core
s 21 d
02.
00-
01.
67-
NS
30 d
03.
33-
02.
67-
NS
* = s
ignifi
cant at
P=0.
05;
a= m
eans
exce
ed the
corr
espondin
g th
resh
old
; N
S = n
onsi
gnifi
cant at
P=0.
05; Cont = p
air
contras
t bet
wee
n E
LISA
val
-ues
fro
m infe
cted
pla
nts
of
the
two c
ulti
vars
; Red
=re
duct
ion; -
= c
ontras
ts w
ere
not at
tem
pte
d.
Ara
pah
oe
shoot
21 d
thre
shold
=0.
723;
Rose
shoot
21 d
thre
shold
=0.
579;
30 d
thre
shold
=0.
633;
30 d
thre
shold
=0.
438;
root
21 d
thre
shold
=1.
172;
root
21 d
thre
shold
=1.
735;
30 d
thre
shold
=0.
959;
30 d
thre
shold
=2.
616.

132 Proceedings of the South Dakota Academy of Science, Vol. 75 (1996)
Figure 2. ELISA absorbance values from shoots of Arapahoe and Rose over a30 day period post-inoculation. Each column represents the mean of three ex-periments. Mean ELISA values were corrected by the mean of correspondingcontrols in each experiment.
Figure 3. ELISA absorbance values from shoots of Arapahoe and Rose over a30 day period after inoculation. Each column represents the mean of three ex-periments. Mean ELISA values were corrected by the mean of correspondingcontrols in each experiment.
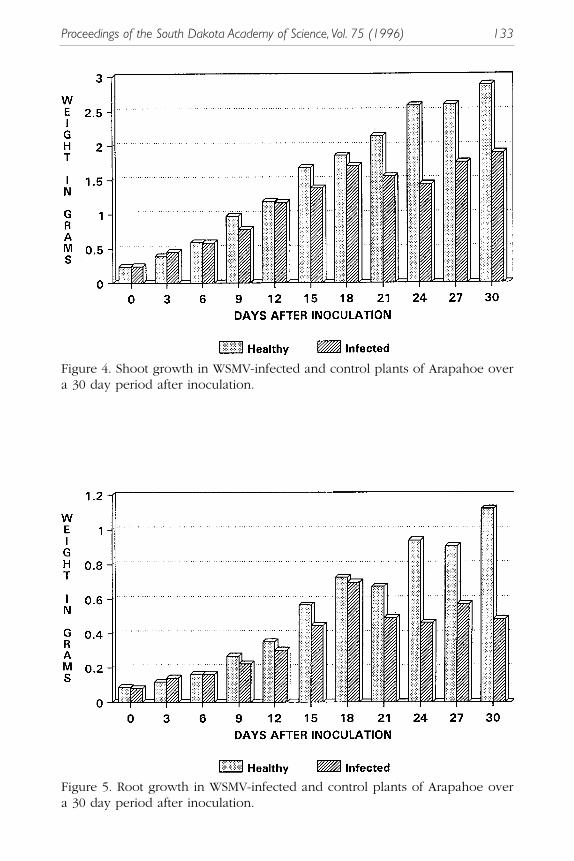
Proceedings of the South Dakota Academy of Science, Vol. 75 (1996) 133
Figure 4. Shoot growth in WSMV-infected and control plants of Arapahoe overa 30 day period after inoculation.
Figure 5. Root growth in WSMV-infected and control plants of Arapahoe overa 30 day period after inoculation.

134 Proceedings of the South Dakota Academy of Science, Vol. 75 (1996)
Figure 6. Shoot growth in WSMV-infected and control plants of Rose over a 30day period after inoculation.
Figure 7. Root growth in WSMV-infected and control plants of Rose over a 30day period after inoculation.
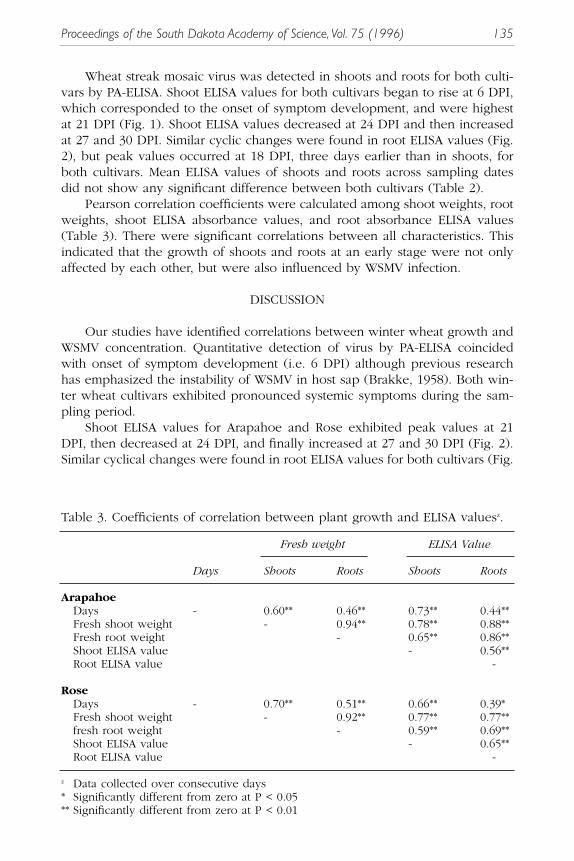
Proceedings of the South Dakota Academy of Science, Vol. 75 (1996) 135
Wheat streak mosaic virus was detected in shoots and roots for both culti-vars by PA-ELISA. Shoot ELISA values for both cultivars began to rise at 6 DPI,which corresponded to the onset of symptom development, and were highestat 21 DPI (Fig. 1). Shoot ELISA values decreased at 24 DPI and then increasedat 27 and 30 DPI. Similar cyclic changes were found in root ELISA values (Fig.2), but peak values occurred at 18 DPI, three days earlier than in shoots, forboth cultivars. Mean ELISA values of shoots and roots across sampling datesdid not show any significant difference between both cultivars (Table 2).
Pearson correlation coefficients were calculated among shoot weights, rootweights, shoot ELISA absorbance values, and root absorbance ELISA values(Table 3). There were significant correlations between all characteristics. Thisindicated that the growth of shoots and roots at an early stage were not onlyaffected by each other, but were also influenced by WSMV infection.
DISCUSSION
Our studies have identified correlations between winter wheat growth andWSMV concentration. Quantitative detection of virus by PA-ELISA coincidedwith onset of symptom development (i.e. 6 DPI) although previous researchhas emphasized the instability of WSMV in host sap (Brakke, 1958). Both win-ter wheat cultivars exhibited pronounced systemic symptoms during the sam-pling period.
Shoot ELISA values for Arapahoe and Rose exhibited peak values at 21DPI, then decreased at 24 DPI, and finally increased at 27 and 30 DPI (Fig. 2).Similar cyclical changes were found in root ELISA values for both cultivars (Fig.
Table 3. Coefficients of correlation between plant growth and ELISA valuesz.
Fresh weight ELISA Value
Days Shoots Roots Shoots Roots
ArapahoeDays - 0.60** 0.46** 0.73** 0.44**Fresh shoot weight - 0.94** 0.78** 0.88**Fresh root weight - 0.65** 0.86**Shoot ELISA value - 0.56**Root ELISA value -
RoseDays - 0.70** 0.51** 0.66** 0.39*Fresh shoot weight - 0.92** 0.77** 0.77**fresh root weight - 0.59** 0.69**Shoot ELISA value - 0.65**Root ELISA value -
z Data collected over consecutive days* Significantly different from zero at P < 0.05** Significantly different from zero at P < 0.01

136 Proceedings of the South Dakota Academy of Science, Vol. 75 (1996)
3). Brakke and Ball (1968) found cyclical changes of WSMV in winter wheatwith density gradient centrifugation, which agrees with our results.
Our results indicate that roots exhibit peak WSMV concentration at 18 DPI,for both Arapahoe and Rose, earlier than shoots at 21 DPI. Seifers and Martin(1988) reported that ELISA values increase from leaf base to leaf tip in the ex-panding leaf at 7 DPI, and no significant difference in ELISA values was foundin the fully expanded leaf at 14 DPI. These results combined with our resultssuggest that WSMV may move to the roots first after infecting plants, then movefrom root to leaf, and within leaves from base to tip. This could explain whythe root weight was reduced by WSMV more than shoot weight, since WSMVmay arrive and replicate in the roots earlier than in the shoots.
Root WSMV concentrations from both cultivars were consistently lowerthan those in shoots (Figs. 2 & 3). These results indicate that roots may be af-fected more by WSMV infection than shoots or that WSMV replicates at a dif-ferent rate in root tissue than in shoot tissue.
Infection by WSMV significantly reduced shoot fresh weights for both Ara-pahoe and Rose, and root fresh weight for Arapahoe by 30 DPI. Significant re-duction in shoot dry weight and root dry weights for WSMV at 19-21 DPI wasobserved by Larsen et al (1985). Earlier detection of reduction in weights byLarsen may be due to the differences in varieties utilized or the differences infresh and dry weights; although Ranieri et al (Ranieri et al, 1993) reported sig-nificant correlations between fresh and dry weight in barley. Growth rates ofshoots and roots by 30 DPI were not significantly reduced. This suggests thata 30 day sampling period may be inadequate for plants to exhibit differencesin growth rates between infected and control plants.
Correlation coefficients among ELISA values and fresh weights (Table 3)were significant for both Arapahoe and Rose. This suggests that the growth ofshoots and roots at an early growth stage was affected by each other as wellas by WSMV concentration. Effects of WSMV infection on shoot and rootgrowth during the early growth stage may be an important factor in decreasedplant survival during winter and loss of grain yield, since the shoots are re-sponsible for photosynthesis and roots for nutrient and water uptake and car-bohydrate storage.
Our research has shown that PA-ELISA can be useful in the assessment ofquantitative variation by virus concentration in tolerant cultivars. Assessment oftolerance is more difficult than the assessment of resistance when based onlyon symptoms and is more time-consuming when based on yield reduction.However, the cyclic changes in WSMV concentration suggest that the practicaluse of ELISA in the assessment of tolerance requires adequate samples fromdifferent dates. This will help eliminate the error which results from such cycli-cal changes of virus titer and from various lines exhibiting peak virus concen-trations at different times (Comeau et al, 1992).
In utilizing PA-ELISA to evaluate WSMV concentration in roots, higherbackground absorbance resulting from non-specific reactions was found. Thiskind of non-specific reaction may result from the contamination by fine soilparticles on the roots (Xia et al, 1995) even though efforts were made in wash-ing roots to prevent the adherence of soil or by some phosphatase-like enzyme

Proceedings of the South Dakota Academy of Science, Vol. 75 (1996) 137
(Hampton et al, 1990) endogenous in the root tissue or added by contamina-tion during handling.
CONCLUSION
Concentration of WSMV in winter wheat plants exhibited cyclic changesover time during the early growth stage. Infection by WSMV significantly re-duced the shoot growth for both cultivars, and root growth and root/shoot ra-tio for Arapahoe. Infection by WSMV reduced root growth more than shootgrowth for both cultivars, but WSMV concentration in roots was lower than inshoots. The correlation coefficients for WSMV concentration measured byELISA and fresh weights demonstrated that the growth of shoots and roots atan early growth stage was affected by each other as well as influenced by WS-MV infection. Reduction in shoot and root growth may be responsible for de-creased survival of winter wheat during winter and loss of grain yield. Protein-A ELISA, which detected WSMV at almost same time as the symptoms devel-oped, is very useful in quick quantitative assessment of WSMV during the ear-ly growth of winter wheat.
REFERENCES CITED
Amrine Jr., J. W., and T. A. Staany. 1994. Catalog of the Eriophyoidae (Acarina:Prostigmata) of the World. Indira Publishing, W. Bloomfield. MI.
Bellingham, R. C., H. Fellows, and H. S. Webster Jr. 1957. Resistance to wheatstreak mosaic virus in foreign and domestic wheats and various wheatcrosses. (Abstr.) Phytopathology 47:516.
Brakke, M. K. 1958. Properties, assay, and purification of wheat streak mosaicvirus. Phytopathology 48:439-445.
Brakke, M. K. 1977. Wheat streak mosaic virus. No 48 In Descriptions of Plantviruses. Commonw. Mcol. Inst., Assoc. Appl. Biol., Kew, Surrey. England.
Brakke, M. K., and E. M. Ball. 1968. Purification and antigenicity of wheatstreak mosaic virus. Phytopathology 68:963-971.
Christian, M. L., and W. G. Willis. 1993. Survival of wheat streak mosaic virusin grass hosts in Kansas from wheat harvest to fall wheat emergence. PlantDis. 77:239-242.
Comeau, A., J. Collin, and F. Cheour. 1992. Barley yellow dwarf virus symp-toms and ELISA data in relation to biomass and yield loss. 131-138 INComeau, A., K. M. Makkouk (eds), Barley Yellow Dwarf in West Asia andNorth Africa. Proceedings of a workshop organized by the ICARDA andIDRC held in Rabat, Morocco and Aleppo, Syria.
Edwards, M. C., and J. I. Cooper. 1985. Plant virus detection using a new formof indirect ELISA. J. Virol. Methods 11:309-319.
Edwards, M. C., and M. P. McMullen. 1988. Variation in tolerance to wheatstreak mosaic virus among cultivars of hard red spring wheat. Plant Dis.72:705-707.

138 Proceedings of the South Dakota Academy of Science, Vol. 75 (1996)
Hampton, R., E. Ball, and S. De Boer. 1990. Serological Methods for Detectionand Identification of Viral and Bacterial Plant Pathogens: A LaboratoryManual. APS Press, The American Phytopathological Society, St. Paul, Min-nesota, USA.
Langham, M. A. C., D. J. Gallenberg, and J. E. Powell. 1993. Prevernalizationincidence of wheat streak mosaic virus in South Dakota winter wheat. (Ab-str.) Phytopathology 83:1421-1422.
Larsen, H. J., M. K. Brakke, and W. G. Langenberg. 1985. Relationships be-tween wheat streak mosaic virus and soilborne wheat mosaic virus infec-tion, disease resistance, and early growth of winter wheat. Plant Dis.69:857-862.
Negal, C. M. 1960. Control of Yellow Streak Mosaic of Winter Wheat. SouthDakota State College, Plant Path. Dept. Pamphlet No.10.
Niblett, G. L., E. G. Heyne, C. L. King, and R. W. Livers. 1974. ControllingWheat Streak Mosaic. Kansas Agric. Exp. Stn. AES.
Pfannenstiel, M. A., and C. L. Niblett. 1978. The nature of the resistance ofagrotricums to wheat streak mosaic virus. Phytopathology 68:1204-1209.
Rahman, F., J. G. Ross, and W. S. Gardner. 1974. Tolerance to wheat streak mo-saic virus in spring and winter wheat cultivars. Crop Sci. 14:178-180.
Ranieri, R., R. M. Lister, and P. A. Burnett. 1993. Relationships between barleyyellow dwarf virus titer and symptom expression in barley. Crop Sci.33:968-973.
SAS Institute Inc. 1985. SAS User’s Guide: Statistics. Cary, NC: SAS Institute Inc. Seifers, D. L., and T. J. Martin. 1988. Correlation of low level wheat streak mo-
saic virus resistance in Triumph 64 wheat with low virus titer. Phy-topathology 78:703-704.
Slykhuis, J. T. 1952. Virus Diseases of Cereal Crops in South Dakota. SouthDakota Agr. Exp. Sta. Tech. Bull.
Slykhuis, J. T. 1955. Aceria tulipae Keifer (Acerina: Eriophyidae) in relation tospread of wheat streak mosaic. Phytopathology 45:116-128.
Staples, R., and W. B. Allington. 1956. Streak Mosaic of Wheat in Nebraska andIts Control. Nebraska Agr. Exp. Sta. Res. Bull.
Xia, J. Q., W. Bliss, and C. Sutula. 1995. Examination of simple factors interfer-ing with result in ELISA. (Abstr.) Phytopathology 85:1131.

Abstracts of Senior Research Papers
presented at
The 81st Annual Meeting
of the
South Dakota Academy of Science


Proceedings of the South Dakota Academy of Science, Vol. 75 (1996) 141
MATHEMATICAL MODELSFOR SOYBEAN POD GROWTH
Peter Claussen and Neil ReeseSouth Dakota State University
Brookings, SD 57007
ABSTRACT
Soybean yield can be limited by failure of developing pods to mature orset. Growth rate may be an important factor in determining pod set. Growthrate, however, cannot directly be measured but instead requires multiplemeasurements over time. Growth rate also varies non-linearly over time, soanalysis of experimental data requires non-linear curve fitting to a modelfunction. Choosing an appropriate model can be difficult when there is littletheoretical foundation for the phenomena studied. We are currently examin-ing several model equations to describe growth phenomena to determinetheir applicability to soybean pod growth. These models (listed in increasingnumber of parameters) include the logistic model and Gompertz, Richard’s,and Weibull’s models as well as a generalized logistic model. Richard’s andWeibull’s models and the generalized logistic models allow for better interpo-lation of the data but do so by transforming data asymmetrically about an in-flection point. This transformation is inconsistent when fitting to different in-dividual pods. This may tend to make the fitting process a non-linear map-ping of physiological parameters influencing pod growth to the model pa-rameters used to describe pod growth.
We are currently developing a more mechanistic model to overcome thisproblem. Our model is based on the Lockhart equations governing cell ex-pansion and a logistic model to describe cell tissue deposition.
The Lockhart model (1) describes change in cell volume (V) given by thedifferential equation
where ψint and ψext are osmotic pressure inside and outside (respectively) thecell and ψthr is a threshold pressure below which cell wall tension is suffi-cient to prevent cell expansion. Coefficient L gives relative hydraulic conduc-tivity of the plasmalemma and m is related to cell wall extensibility.
The logistic model is used to describe increase in tissue mass. The logisticmodel assumes that a population will increase in proportion to the number of in-dividuals in the population while that population is relatively small. As the popu-lation increases, however, some factor(such as an environmental resource) be-comes limiting and inhibits growth. Verhulst (2) suggested the following model:
where r and K are constants. K is usually given as the carrying capacity of

142 Proceedings of the South Dakota Academy of Science, Vol. 75 (1996)
the environment, thus the term N⁄K may be taken to represent the amount ofcompetition among individuals in a population. For our purposes it may bebetter to consider the N⁄K term as representing the proportion of cells in agiven organ that are incapable of further division.
This model is implemented as a system of difference equations, given by:
Equations [3, 4, 5] are used to describe seed (embryo) and pod growth by alogistic model [2]. Seed growth is split into two equations because we useseed growth rate[4] to determine the rate of synthesis of factor S in [6]. Thecurrent amount of factor S is given by the rate of synthesis by the seeds mi-nus the rate of degradation in pods[6]. In equation [7] the relative concentra-tion of S is given by the amount of S from [6] divided by pod volume from[9]. Pod density is similarly derived from pod mass and pod volume in [8].Pod volume is given by the Lockhart equations in [9]. Equations [10,12] relatecell wall elasticity and threshold turgor pressure to pod density. This modelassumes that more dense cell walls are less elastic. Equation [11] states that abaseline cell wall conductance in increases proportionally to factor S.
Pod growth simulated by this model can be made to mimic the growthof soybean pods. However, this model is very sensitive to initial conditionsdue to the use of the logistic model, so further refinement of this model isneeded for it to be generally useful.
REFERENCES
Lockhart J.A. (1965) J. Theoret. Biol. 8:264-275.J.D. Murray (1989) Mathematical Biology, Springer-Verlag

Proceedings of the South Dakota Academy of Science, Vol. 75 (1996) 143
FUSARIUM OXYSPORUM INFECTIONOF CULTIVATED CONEFLOWERS (ECHINACEA ANGUSTIFOLIA)
K. Peichowski, S. Rizvi and R.N. ReeseBiology/Microbiology and Plant Science Departments
South Dakota State UniversityBrookings, SD 57007
ABSTRACT
The narrow-leaf purple coneflower Echinacea angustifolia D.C. is a peren-nial composite native to the Central Great Plains. Because of its potential or-namental and pharmacological value, Echinacea is currently being brought in-to commercial production in South Dakota. A blight or wilt was observed in afield research plot on 1-to 3-year-old plants in the summers of 1993 and 1994.Up to 5% of plants growing in the wetter portion of the field showed symp-toms. Affected plants became necrotic along leaf margins, followed by wiltingand eventual death. Diseased plants were harvested and brought to the lab foranalysis. Examination of roots and stems revealed darkening of the vascularand ground tissues. The pathogen was consistently isolated by plating 0.5 cmsurface sterilized stem segments on lactic acid PDA for 3 to 5 days at room tem-perature. To complete Koch’s postulates, a single hyphal tip of the pathogenwas transferred to carnation leaf agar. Micro and macro conidia formed abun-dantly within 10 days and matched the description of Fusarium oxysporumSchlect. Two to three month old coneflower seedlings were inoculated with theisolated pathogen by placing six mycelial plugs directly on the roots of eachplant, just below the soil surface. Infected seedlings showed typical diagnosticsymptoms (30% of inoculated seedlings) within three weeks. Non-inoculatedplants remained symptomless. Fusarium oxysporum was reisolated from theseedlings as above. This is the first report of F. oxysporum as a pathogen onE. angustifolia.

Proceedings of the South Dakota Academy of Science, Vol. 75 (1996) 145
SEPARATION OF CHLOROPLAST PIGMENTSUSING REVERSE PHASE CHROMATOGRAPHY
R.A. Brewster and R.N. ReeseBiology/Microbiology Department
South Dakota State UniversityBrookings, SD 57007
ABSTRACT
Solvent extraction and separation of chlorophylls and carotenoids by pa-per, thin layer chromatography (TLC), or normal phase column chromatogra-phy are common components of many high school biology programs and mostgeneral botany and plant physiology courses. The primary limitation of theseprotocols is their reliance on toxic and highly flammable compounds such asacetone, carbon tetrachloride, chloroform, diethyl ether, hexane, andpetroleum ether.
Ethanol, which is less toxic and has a lower flash point than most of thesesolvents, has been used successfully for extraction of plant photosynthetic pig-ments. The protocol described below extends the use of ethanol to the sepa-ration of the pigments using inexpensive, disposable C-18 reverse phasecolumns. Photosynthetic pigments were extracted from spinach leaves with95% ethanol. Extracts were centrifuged to remove debris and loaded onto 1 mLC-18 columns equilibrated in 28.5% ethanol (3 parts reagent grade ethanol: 7parts distilled water). Xanthophyll and chlorophyll pigments were eluted iso-cratically with 81% ethanol (8.5 parts reagent grade ethanol: 1.5 parts distilledwater). -Carotene was eluted with 95% ethanol after all of the chlorophylls hadbeen washed from the column. Eluates were collected in 3 mL fractions andanalyzed spectrophotometrically.
For teaching, a major advantage of using reverse phase chromatography isthat separation of the pigments can be obtained using aqueous-ethanol sol-vents instead of the standard non-polar solvents. This modification greatly re-duces the hazard and costs associated with the standard procedures and makesconducting this type of experiment possible in facilities that lack the ventila-tion equipment needed to use the more dangerous solvents.


Proceedings of the South Dakota Academy of Science, Vol. 75 (1996) 147
TRANSPORT OF AGRICHEMICALS BY WINDERODED SEDIMENTS TO NONTARGET AREAS
Thomas M. DeSutter, Sharon A. Clay, and David E. ClayDepartment of Plant Science South Dakota State University
Brookings, SD 57007
ABSTRACT
Water and wind erosion are the primary mechanisms by which surface soilis removed from agricultural fields. Wind erosion accounts for as much ormore soil loss (tons/acre/year) than does water erosion. Sediments moved bywind may carry agrichemicals from agricultural fields to nontarget areas. Non-target areas may include road ditches, shelterbelts, and waterways. The ob-jective of this study was to determine if agrichemical movement via windblown sediment is a potential pollutant of surface and/or groundwater. Sam-ples of sediment that had been deposited in ditches on top of snow were col-lected during winters of 1994 and 1995 near or around Brookings, SD. Soilsamples from adjacent fields (top 1 inch) were also collected. Soil and sedi-ment samples were extracted and alachlor, atrazine, and atrazine metabolites,desethylatrazine and desisopropylatrazine were quantified. Alachlor was de-tected in about 30% of soil and sediment samples in both years with an aver-age concentration of 2.2 ppb in soil and 5.44 ppb in sediment in 1995. In 1994,atrazine, desethylatrazine, and desisopropylatrazine were detected in 70%,100%, and 50% of the sediment samples and 70%, 90%, and 60% of the soilsamples, respectively. In 1995, atrazine, desethylatrazine, and desisopropyla-trazine were detected in 73%, 27%, and 9% of the sediment samples at averageconcentrations of 8.9, 0.89, and 56.4 ppb, respectively. Atrazine, desethyla-trazine, and desisopropylatrazine were detected in 70%, 40%, and 10% of thesoil samples in 1995 at average concentrations of 11.9, 2.0, and 0.9 ppb, re-spectively. Herbicides were detected in most of the sediment samples. Thissuggests that wind erosion may be a transport mechanism by which herbicidesare deposited into nontarget areas.


Proceedings of the South Dakota Academy of Science, Vol. 75 (1996) 149
THE EFFECTS OF HYPERBARIC AIR ONTHE POPULATION GROWTH RATES OF THECOMMON ETIOLOGICAL AGENTS OF OTITISAND THE DEVELOPMENT OF A BUFFERED
GENERAL GROWTH MEDIUM FOR USEIN COMPRESSED AIR ENVIRONMENTS
Bradley L. Dubbels, Jena D. French, Jennifer D. Tranas, Richard T. Dickey, David J. Dingsor and William J. Soeffing
Natural Sciences Area University of Sioux Falls Sioux Falls, SD 57105
ABSTRACT
The redistribution of normal bacterial flora of the human body has beenimplicated with the prevalence of auditory canal infections in saturation diversliving in and working from undersea habitats. This study examined the influ-ence that hyperbaric air environments have on the population growth param-eters of three bacterial species (Escherichia coli, Pseudomonas aeruginosa andStaphylococcus epidermidis) associated with epidemiology and pathology ofotitis externa and media. As a result of preliminary data analyses, the need forthe development of a general growth medium capable of minimizing the in-fluence of carbon dioxide gas absorption on the pH of experimental conditionswas identified. Subsequent experimentation into the identification and charac-terization of that medium was pursued.
Standardized bacterial subcultures were incubated at 37ºC in a humidifiedcompressed air microenvironment (hyperbaric chamber). Standard plate countmethods were used to evaluate population growth as influenced by normo-baric, 151, 162, 182 and 202 kPa pressures. Ancillary experimentation was con-ducted in a manned undersea habitat (MarineLab, Key Largo, FL) pressurizedat 162 kPa and population growth was evaluated as aforementioned.
The carbon dioxide absorption profiles of phosphate and bicarbonatebuffered and non-buffered media were indirectly evaluated by measuring thechange in pH of 50 mL samples during four hour exposures to the manned un-dersea habitat environment. The buffering capacities of suitable buffered andnon-buffered general growth media were evaluated by standardized acid-basetitrations at normobaric conditions.
Results obtained from experimentation conducted in the hyperbaric cham-ber were reproducible and statistically significant. E. coli and S. epidermidisdemonstrated predictable declining population growth rates along increasingpressure gradients. Conversely, P. aeruginosa initially demonstrated an in-creasing population growth rate along the pressure gradient to 162 kPa and

150 Proceedings of the South Dakota Academy of Science, Vol. 75 (1996)
subsequently declined. Results obtained from experimentation conducted inthe manned undersea habitat were inconsistent but appeared to be associated(r < -0.90) with abnormally excessive (486 ± 7 Pa: mean ± sem) and fluctuat-ing partial pressures of atmospheric carbon dioxide (385-571 Pa range).
Preliminary screening of buffered and non-buffered general growth mediarevealed that only phosphate buffered nutrient broth possessed the initial pH(pH 7.09) and buffering capacity (0.007 M/pH) appropriate for ensuing stud-ies. Furthermore, the buffered media did not demonstrate the transitory pHchanges observed in the non-buffered media.
The implications of varying population growth rates along a pressure gra-dient, contributing to a redistribution and reapportionment of bacterial flora,might alter symbioses that are proportion-dependent and promote opportunis-tic pathogenesis. To advance the comparison of microenvironmental in vitroexperimentation, a phosphate-buffered general growth medium has been de-veloped and is being characterized.
Proceedings of the South Dakota Academy of Science, Vol. 75 (1996) 151
QUANTUM CHEMISTRY OF OXOACID TAUTOMERS
Arlen Viste and Rachel R. LeiningerDepartment of Chemistry
Augustana CollegeSioux Falls, SD 57197
ABSTRACT
We have studied tautomers of several oxoacids, using ab initio molecularorbital calculations with Spartan™ software (Wavefunction, 1995), and semiem-pirical molecular orbital calculations with HyperChem™ software (Hypercube,1994).
Both HyperChem and Spartan software packages provide convenientgraphical user interfaces for carrying out quantum chemistry calculations, andfor visualizing the results. Our Spartan 4.0 calculations were done using on anIBM RS/6000, with X windows display, and the HyperChem 4.0 calculationswere done in a Windows 3.1 environment on a Gateway 486 PC.
Calculations on carbonic acid tautomers (HO)2CO and H2OCO2 yield quitedifferent bond lengths and bond angles. Shifting a proton from one OH to theother, followed by geometry optimization, leads to evolution from near 120ºangles in the CO3 of the former to near 180º in the CO2 of the latter. The H2Ois loosely bound to CO2 in H2OCO2, with a long O—C bond. Related results arefound for sulfurous acid tautomers (HO)2SO and H2OSO2. A rather long O—Sbond evolves from the proton shift from one OH to the other.
Results from AM1 molecular orbital calculations in HyperChem 4.0 aresummarized in Table 1, and are pictured in Figures 1. Results 6-31G* ab initiomolecular orbital calculations in Spartan 4.0 are summarized in Table 2.
Table 1. AM1 Calculations in HyperChem
Molecule OXO, º (H)OXO, º (H)OXO(H), º OX,Å (H)OX,Å EBE,kcal/molFig. 1
1: OC(OH)2(cis) 125.4 109.2 1.231 1.348 -603.6
2: OC(OH)2(trans) 120.8 118.4 1.220 1.354 -596.7
3: H2O-CO2 178.5 75.6, 105.9 1.19 2.49 -595.6
4: OS(OH)2 97.8 95.9 1.445 1.677 -499.9
5: HSO3H 122.3 103.2, 107.0 1.38 1.647 -463.1
6: H2O-SO2 107.4 85.6 1.451 2.17 -472.0
7: O2SOH- 106.5 98.7 1.500 1.737 -462.2
8: HSO3- 114.0 1.418 -453.6
In Table 1, EBE is the SCF binding energy (relative to isolated atoms).

152 Proceedings of the South Dakota Academy of Science, Vol. 75 (1996)
Table 2. 6-31G* Calculations in Spartan
Molecule OXO, º (H)OXO, º (H)OXO(H), º OX,Å (H)OX,Å ET,hartreeFig. 1
1: OC(OH)2(cis) 125.1 109.7 1.188 1.315 -263.647
3: H2O-CO2 177.2 91.3, 91.5 1.144 2.77 -263.650
4: OS(OH)2 105.1 100.1 1.445 1.605 -623.188
5: HSO3H 122.6 107.3, 108.5 1.42 1.578 -623.163
6: H2O-SO2 117.9 90.4, 90.5 1.416 2.77 -622.646
7: O2SOH- 111.8 100.3, 102.9 1.47 1.69 -622.64
8: HSO3- 114.4 1.450 -622.646
In Table 2, ET is total energy in hartrees, relative to isolated nuclei and electrons. (1 hartree = 627.510 kcall-mol = 2625.50 kJ/mol).
Figure 1. Tautomers of Oxoacids: H2CO3, H2SO3, and HSO3-

Proceedings of the South Dakota Academy of Science, Vol. 75 (1996) 153
For the related oxides, Spartan 6-31G* results for bond distance and bondangle are 1.143 Å and 180.0 º for CO2, and 1.414 Å and 118.8 º for SO2.
Figure 2 shows the evolution of the O2COH2 tautomer of carbonic acid,from a molecular mechanics structure to a quantum chemistry structure. Eachstructure has been geometry minimized in HyperChem (using mm+ for thefirst, and AM1 for the second).
These results are for isolated molecules in the gas phase.The carbonic acidresults are similar to earlier HF SCF split-valence 3-21G calculations (Nguyen,1984). Further solvation needs to be considered in relation to results for aque-ous solution equilbria and kinetics (Cotton, 1988; Paneth, 1985). Geometries ofthe sulfur species are similarto STO-3Gresults (Baird, 1981).
ACKNOWLEDGMENTS
Augustana College Summer Institute in Science and Mathematics, summer1995 funding for RRL.
REFERENCES
Baird, N. C., and K. F. Taylor. 1981. Ab initio MO calculations for the oxides,oxyacids, and oxyanions of S(IV) and S(VI). J. Comput. Chem. 2:225-230.
Cotton, F. A., and G. Wilkinson. 1988. Advanced Inorganic Chemistry. 5th ed.John Wiley, New York, NY. P. 245-247, 519-521.
Hypercube, Inc. 1994. HyperChem v. 4.0, software package. Waterloo, Ontario.Nguyen, M. T., and T-K. Ha. 1984. A theoretical study of the formation of car-
bonic acid from the hydration of carbon dioxide: a case of active solventcatalysis. J. Am. Chem. Soc. 106:599-602.
Paneth, P., and M. H. O’Leary. 1985. Mechanism of the spontaneous dehydra-tion of bicarbonate ion. J. Am. Chem. Soc. 107:7381-7384.
Wavefunction, Inc. 1995. Spartan v. 4.0, software package. Irvine, CA.
Figure 2. Evolution ofthe O2COH2 Tautomer.

Proceedings of the South Dakota Academy of Science, Vol. 75 (1996) 155
CARBON ISOTOPES AND RING WIDTHS OFPINUS CANARIENSIS RECORD LONG-TERM
AND DYNAMIC CHANGES INTENERIFE, CANARY ISLANDS
Corrine Lundell and Larry TieszenDepartment of Biology
Augustana CollegeSioux Falls, SD
Lázaro Sánchez-PintoMuseo Ciencias NaturalesSanta Cruz de Tenerife
Canary Islands
ABSTRACT
Ring widths and ∆13C values were measured on a Pinus canariensis corefrom Tenerife, Canary Islands. Because tree cellulose is formed from carbonacquired through photosynthesis, its 13C/12C isotope ratio reflects that of the am-bient atmospheric CO2 at the time of fixation. In addition, water stress, recy-cling of CO2, and other factors can alter the Ci/Ca ratio further modifying theisotopic composition. We measured ring widths and corrected the isotope val-ues for anthropogenic changes in atmospheric CO2 to obtain an estimate of iso-topic fractionation, a ∆13C value, in an attempt to determine past climatic orforest growth conditions of Tenerife. Both the width measurements and theisotopic composition reveal long-term trends and short-term variations.
The most noticeable is a large increase in ring width simultaneous with asubstantial shift toward more positive isotopic values for a 59-year period be-ginning near 1853. The rings widen substantially and the 13C value moves ap-proximately 2‰. We interpret this to indicate that around 1853 the forest be-came more open. The decreased competition in an open area and the in-creased effect of variations in moisture would explain both the greater ringwidths and the change in ∆13C values. Remaining patterns in the isotoperecord likely record other climatic trends on Tenerife during this 213-yearrecord.


Proceedings of the South Dakota Academy of Science, Vol. 75 (1996) 157
THE DISAPPEARANCE OF ECLIPSE MINIMAOF THE BINARY STAR SS LACERTAE
Tammy L. Clifton and Stephen J. SchillerSouth Dakota State University
Brookings, SD 57007
ABSTRACT
The eclipsing spectroscopic binary star system SS Lacertae in the opencluster NGC 7209 had once been identified as being typical of its kind. Pho-tographic observations obtained between the years 1890 and 1950, which havebeen published by several astronomers, have clearly identified SS Lacertae asan eclipsing binary system with a known period of 14.4 days. The system hasalso been identified with eclipse depths of 0.5 magnitude of both the primaryand secondary eclipses. However, photographic and photoelectric photome-try after 1951 revealed that the light variations of the system have completelydisappeared with the last reported eclipse on October 20, 1949. The cessationof eclipses appears to have been complete by August 27, 1951 when photo-graphic plates obtained at the predicted time of minimum revealed no lightvariations. More recent extensive photoelectric photometry have confirmedthat the eclipses are now non-existent.
We have compared observed radial velocity data to the results producedby the synthetic light curve program Binary Maker 2.0 to investigate thechange in the inclination to account for the observed disappearance ofeclipses. The program also produces a light curve based upon that of a circu-lar orbit, providing an accurate magnitude depth of the individual eclipses fora given inclination. In addition to modeling the system, we are providing aneffort to improve historical photographic photometry that includes applyingimage processing techniques to nearly 1700 photographic plates located in theHarvard College Observatory Archives. The images of the plates were takenwith a software package and the Plate Digitizer/Stellar Photometer, both de-veloped at South Dakota State University. Preliminary results for approxi-mately 600 plates obtained between 1898 and 1910 illustrate the periodiceclipses and change in magnitude at time of minima.


Proceedings of the South Dakota Academy of Science, Vol. 75 (1996) 159
EXAMINING THE MECHANISM OFELECTROPHILIC AROMATIC SUBSTITUTION
USING MOLECULAR COMPLEXES OF HCl
Russell Hobson and L.C. LewisDepartment of ChemistryUniversity of Sioux FallsSioux Falls, SD 57105
ABSTRACT
Aromatic compounds (Ekstrand) and ethers (Anderson) are known to formdonor-acceptor complexes with HCl in organic solvents. This study deter-mined the relative stability of several complexes in heptane solvent, and es-tablished the relative basicity of the ether or aromatic donors, by measuring the1:1 association constants (K11) for the complex formation using a solute isopi-estic technique with 12 F HCl(aq) providing a source of constant HCl activity(Anderson). Results are shown in the table.
donor(heptane solvent) K11 at 298 K
ethoxybenzene 1.01 ±.16ether donors methoxybenzene 1.02 ±.06
diisopropyl ether*† 5.60 ±.10
benzene* 0.27 ±.02aromatic donors p-xylene* 0.37 ±.03
chlorobenzene 0.12 ±.02
*previously determined, not in this study† cyclohexane solvent
For the aromatic donors, substituents which activate the ring toward elec-trophilic aromatic substitution increased K11 relative to benzene, and deactivat-ing groups decreased K11. The measured solubility (mole fraction) of HCl atunit activity in each of the neat, aromatic donors also supported this trend.The K11 of the diisopropyl ether complex is much larger than that of eithermethoxybenzene or ethoxybenzene, indicating that the oxygen in the aromat-ic ether has lower basicity (i.e. is a poorer donor). This suggests that electronsfrom the oxygen are delocalized onto the ring by resonance as shown.

160 Proceedings of the South Dakota Academy of Science, Vol. 75 (1996)
This evidence supports the use of the above resonance structures to ex-plain why electron donor substituents (such as alkoxy groups) are both ringactivating and ortho/para directing with respect to electrophilic aromatic sub-stitution. That is, the ring is activated prior to approach of an electrophile withhigher electron density at the ortho and para positions. This is a more directexplanation than that typically employed in organic chemistry texts to accountfor substituent effects on further substitution and is consistent with the com-monly used explanations for the relatively low nitrogen basicity in aromaticamines (e.g. aniline) and in amides.
REFERENCES
Ronald Anderson and L. C. Lewis. 1979. Solvent Effects on Ether-HCl Associ-ation Reactions. Proceedings of the North Dakota Academy of Science.62:191-92.
John Ekstrand and L. C. Lewis. 1982. The Association of Hydrogen Chloridewith Aromatic Molecules. Proceedings of the South Dakota Academy ofScience. 61:178-79.

Proceedings of the South Dakota Academy of Science, Vol. 75 (1996) 161
ENTHALPIES OF FORMATION OFHYDRATES OF COBALT(II) CHLORIDE
Timothy Mulder and L. C. LewisDepartment of ChemistryUniversity of Sioux FallsSioux Falls, SD 57105
ABSTRACT
Cobalt(II) chloride forms a series of hydrates, Co(H2O)nCl2, with n = 1, 2, 4,and 6. The standard enthalpies of formation for each of these hydrates and foranhydrous CoCl2 have been previously determined by calorimetry. The purposeof this study was to determine the enthalpies of formation using a differenttechnique and to compare these results to those previously published. The tech-nique of this study involved measuring the equilibrium water vapor pressure asa function of temperature for each dissociation reaction in the series:
Co(H2O)nCl2(s) Co(H2O)n - mCl2(s) + m H2O(g)where, (n,m) = (6,2), (4,2), (2,1), and (1,1)
In order to prepare equilibrium systems, anhydrous CoCl2 was hydratedover either saturated calcium nitrate solution or pure water. Hydrate systemshaving gross water content corresponding to n = 5.0, 3.0, 1.5, and 0.5 were pre-pared and placed in the vapor pressure apparatus. After evacuation and seal-ing, the apparatus was completely submerged in a constant temperature oil orwater bath, and the equilibrium vapor pressure measured using an integral mer-cury manometer. Reaction enthalpies were calculated from the temperature de-pendence of the vapor pressure using the van’t Hoff equation. The standardenthalpy of formation of each hydrate was then calculated using these reactionenthalpies (assumed to remain constant to 298K) and the known value for theenthalpy of formation of the anhydrous CoCl2. The values obtained in thisstudy, literature values, and comparison data are shown in the table below.
hydrate reaction ∆Hreaction ∆H0f ∆H0
f* %(n,m) (this study) (this study) (calorimetry) difference
Co(H2O)0Cl2(s) - 325.5 -Co(H2O)1Cl2(s) (1,1) 52.5 ±3.5 -620 ±4 - -Co(H2O)2Cl2(s) (2,1) 51.7 ±2 -914 ±5 - 932.6 2.0Co(H2O)4Cl2(s) (4,2) 107.3 ±2 -1505 ±7 -1536.4 2.0Co(H2O)6Cl2(s) (6,2) 111.6 ±2 -2101 ±9 -2129.2 1.3
* National Bureau of Standards, Washington, D.C., Circular 500, 1952.

162 Proceedings of the South Dakota Academy of Science, Vol. 75 (1996)
The n = 6 and n = 4 hydrates show evidence of solid solution formation.This could account for some of the difference since the vapor pressure would,thus, be somewhat dependent on the actual composition of the equilibriumsystem. Causes of the remaining variations are unknown.

Proceedings of the South Dakota Academy of Science, Vol. 75 (1996) 163
THE EFFECT OF A MAGNETIC FIELD ONPLANT GROWTH AND REPRODUCTION
Odean Selchert and Dale DrogeCollege of Natural Sciences
Dakota State University Madison, SD 57042-1799
ABSTRACT
Research on organisms from protozoans to birds indicates that magneticfields are perceived by organisms and influence biological functions. Severalclaims of the medical benefit of magnetic fields have also been advanced. Wetested the influence of a magnetic field on the germination, growth and repro-duction of mustard plants, Brassica rapa. We placed large bar magnets at thebottom of pots and covered them with soil. We established three treatmentgroups: 1) pots with the north pole of the magnet up; 2) pots with the southpole up; and 3) control pots with no magnet. We planted five seeds in eachpot and placed the pots in random arrangements in a greenhouse. The plantsgrew under the natural photoperiod of a South Dakota summer. We wateredand fertilized the plants regularly and recorded several measurements of plantgowth. When the plants flowered, we hand- pollinated each plant. After seedmaturation, we harvested the seed pods and counted the number of seeds pro-duced by each plant. Seeds in the pots with a south magnetic field tended togerminate earlier than other treatments, but this difference was not significant.There was no difference among the treatments in final plant size, the numberof leaves produced, or the dry weight of plants. The size and number of seedsalso was not significantly different with respect to treatment. We conclude thatthe constant magnetic field produced by a dipole bar magnet did not have asignificant effect on the growth and reproduction of mustard plants.


Proceedings of the South Dakota Academy of Science, Vol. 75 (1996) 165
PRELIMINARY SURVEY OF PLANT PATHOGENSPRESENT IN CORN AND SOYBEAN FIELDS IN
SOUTHEASTERN SOUTH DAKOTA
Darla Kofford and Donna HazelwoodCollege of Natural Sciences
Dakota State UniversityMadison, SD 57042
ABSTRACT
Southeastem South Dakota fields of corn (Zea mays L.) were surveyed fortwo foliar diseases. Fields were examined during August when field complants were past tassel and ears were filling. Survey method consisted of a thir-ty minute random walk along and across corn rows recording presence of Usti-lage mayids (DC.) Cda., common corn smut, and Puccinia sorghi Schw., com-mon maize rust. Incidence and severity were examined in five fields, onecropped without the addition of chemical fertilizers, herbicides, or pesticides(organic), and the other four cropped with the use of chemicals (convention-al). Common smut was clearly visible on tassel ears, but not regular ears, inthe field cropped organically, was not visible in one of the conventionallycropped fields, and was comnion in each of the other fields cropped conven-tionally. The survey also examined incidence and severity of common maizerust in these fields, and preliminary results suggest that differences niay havebeen present among the fields by cropping practice. In the field cropped or-ganically, one corn plant and the adjacent downwind plant were the onlyplants that exhibited small rust pustules. In contrast, corn plants in each of theconventionally cropped fields exhibited rust pustules in varying amounts, themost dramatic of which was one conventionally cropped field in which theleaves of each com plant examined exhibited multiple rust pustules. The ap-parent differences among organic and conventional fields will be re-examinedin 1996. In conclusion, common smut and rust were present in varying inci-dence and severity in southeastem South Dakota com fields examined duringsummer 1995.


Proceedings of the South Dakota Academy of Science, Vol. 75 (1996) 167
VARIATION IN STABILITY OF APHIDTRANSMISSION PHENOTYPE OF SEROLOGICALLYSIMILAR BARLEY YELLOW DWARF LUTEOVINISES
Donna HazelwoodCollege of Natural Sciences
Dakota State UniversityMadison, SD 57042
Stewart Gray USDA/ARS
Comell UniversityIthaca, NY
Thomas CarrollMontana State Uriiversity
Bozeman, MT
ABSTRACT
Specific association of barley yellow dwarf luteoviruses (BYDV) with spe-cific aphid vectors is an unvarying and distinctive characteristic of the five NewYork (NY) isolates. RMV-NY is transmitted efficiently by Rhopalosiphum maid-is and inefficiently by Schizaphis graminum. This study was conducted to ex-amine the stability of BYDV isolates that differ from the phenotypes of the NYBYDV. The phenotypes of five Montana (MT) BYDV isolates were comparedwith RMV-NY by serial transmission using R. maidis and S. graminum. Sero-logical reactions were examined by ELISA. For the MT BYDV isolates, but notfor RW-NY, six sequential transmissions by S. graminum resulted in an alteredaphid transmission phenotype. The efficiency of transmission of the MT BY-DV by S. graminum increased from 33% to 36% at transmission trial 1, to 70%to 95% at transmission trial 6. The efficient transmission by R. maidis was notaltered by previous transmissions by S. graminum. In contrast, under the sameconditions, the low level of transmission of RMV-NY by S. graminum was notaffected, yet the efficient transmission of RMV-NY by R. maidis decreased sig-nificantly following an increasing number of sequential transmissions by S.graminum. From each transmission trial, for each aphid-isolate combination,the virus antigen in infected plants reacted against antisera raised against RMV-NY only. These findings established that isolates of BYDV that have a variabletransmission phenotype can be selected from a common serotype virus popu-lation. Yet, without selection by aphids, in this case, S. graminum, for someisolates, the majority of virus particles may have a transmission phenotype thatreflects the serotype. The MT BYDV may be a new type of BYDV isolate witha broader vector range and a variable aphid transmission phenotype.


Proceedings of the South Dakota Academy of Science, Vol. 75 (1996) 169
WETLAND SURFACE WATER AND SURROUNDINGGROUNDWATER QUALITY IN AGRICULTURALLANDSCAPES IN EASTERN SOUTH DAKOTA
David E. Kringen and Diane H. Rickerl Plant Science Department
South Dakota State University Brookings, SD 57007
ABSTRACT
This study investigated the transport of nitrogen and phosphorus in fourseasonal and two semipermanent wetlands in the Prairie Pothole Region ofeastern South Dakota near Madison, SD. The wetlands were situated in tran-sitional no-till (TNT) and organic (ORG) farm management systems. The ob-jective of this study was to determine the effects of farm management and wet-land classification on wetland surface water and groundwater quality. The wet-lands were instrumented with observation wells arranged in two axes extend-ing from the wetland border to upland sites. Nitrate-nitrogen and orthophos-phate concentrations were determined on a two week cycle throughout the1994 and 1995 growing season using a Hach DR/2000 spectrophotometer fromboth wetland surface water, surrounding groundwater, and surface run-off. Re-sults indicated that nitrate-nitrogen concentrations were higher in semiperma-nent than seasonal wetlands for both groundwater and surface water, while or-thophosphate concentrations were higher in seasonal than semipermanentwetlands. The effects of farming systems can be seen in the run-off data,which indicated high concentrations of nitrate following nitrogen applicationin the TNT system. Phosphorus adsorption isotherms from wetland sedimentsare also being investigated and results are pending. Results of this study sug-gest that both wetland classification and farming practices can impact wetlandsurface water and groundwater quality.


Proceedings of the South Dakota Academy of Science, Vol. 75 (1996) 171
A COMPARISON OF ACID MINE DRAINAGEWITH NATURAL ACID SEEPS
Kris Chupka and Cathleen WebbDepartment of Chemistry and Chemical Engineering
South Dakota School of Mines and TechnologyRapid City, SD 57701
ABSTRACT
Highly acidic drainage resulting from the oxidation of metal sulfides occursin two different forms: acid mine drainage and bog iron deposit drainage. Theformer usually has a low pH and contains high levels of solubilized heavy met-als. Drainage from natural sources such as bog iron deposits has not beenwidely studied but has the same physical appearance as acid mine drainage,with unsightly deposits of ferric hydroxide (yellow boy). However, field stud-ies have indicated the pH at the bog deposits is slightly higher. In order to de-termine both the similarities and differences between the two types ofdrainage, samples were taken of both types of drainage and analyzed for iron,manganese, magnesium, calcium, sodium, copper, zinc, cadmium, arsenic, ni-trate, chloride, and sulfate. Both the pattern of metal release and the levels ofmetals solubilized differ significantly for the two types of drainages. Eight nat-ural bog iron deposits were used in this study. In addition to comparing “man-made” acid drainages sites with natural acid generating sites, the long term re-sults from this study could lead to a new understanding of the reaction mech-anisms for natural acid generation.

Proceedings of the South Dakota Academy of Science, Vol. 75 (1996) 173
A STUDY OF THE TOTAL DISSOLVEDAND SUSPENDED SOLIDS IN THE STRAWBERRY
CREEK / BEAR BUTTE CREEK WATERSHED
Sondra Landrigan and Cathleen WebbDepartment of Chemistry and Chemical Engineering
andArden Davis
Department of Geology and Geological EngineeringSouth Dakota School of Mines and Technology
Rapid City, SD 57701
ABSTRACT
The impact of past mining activities on water quality in the StrawberryCreek/Bear Butte Creek watershed was evaluated through the analyses of totalsuspended and dissolved solids. This watershed is a small, well-defined basinand is in one of the most heavily mined areas in the Black Hills. StrawberryCreek originates near the historical mining area of Galena and drains into BearButte Creek approximately 2 miles before Bear Butte Creek enters the Madisonaquifer sinkhole loss zone. Samples were collected during stream surveys con-ducted along the length of Bear Butte Creek at critical points such as the con-fluence of Strawberry Creek, at background sites, and along the sinkhole losszone and coordinated with stream gauging. The results were correlated withthe location of mining activities in the watershed. Samples were also collect-ed before, during, and after the restoration and remediation of StrawberryCreek by Brohm Mining Company. Both analyses were used to help monitorthe impacts of remediation upon the general watershed. Other analyses in-cluded arsenic, zinc, copper, iron, manganese, and cadmium, as well as stan-dard anions and cations.


Proceedings of the South Dakota Academy of Science, Vol. 75 (1996) 175
CARBON ISOTOPE COMPOSITION OF HACKBERRY,CELTIS OCCIDENTALIS L., ACCESSIONS GROWN
AT TEST SITES IN THE GREAT PLAINS
Larry L. Tieszen and Steven B. OrtmeierDepartment of Biology
Augustana CollegeSioux Falls, SD
Mark L. GabelDepartment of Biology
Black Hills State UniversitySpearfish, SD
Richard A. CunninghamUSDA ARS
High 6 South, P.O. Box 459Mandan, ND
ABSTRACT
Hackberry, Celtis occidentalis L., is a native, deciduous tree widely dis-tributed across the Great Plains of North America and east to the Eastern De-ciduous Forest. It is also abundant in the fossil record where macrofossils ofendocarps can be found in abundance. This preservation is likely a conse-quence of a high carbonate concentration (25% to 64%) which also preservesoccluded organic carbon. These specimens are of great value as sources ofcarbon and oxygen for isotopic analyses through geological time.
We undertook a comparison of accessions grown at 11 sites to assess theextent of genetic variation in isotopic composition and the degree to which iso-topic composition was affected by large differences in climate. Leaf and stemsamples were obtained from 30 accessions of hackberry trees grown at 11 US-DA test sites from Oklahoma to Manitoba. Holocellulose was purified fromthree years of young twig growth and analyzed for carbon isotope composi-tion. Mean isotopic composition varied significantly from -23‰ to -26.6‰across all accessions. Although differences were small, accessions from thenorth were significantly more negative when grown in the north than whengrown in the south. Across all accessions, test sites in the north were 0.4 morenegative than sites in the south.
Leaves of young trees showed large intra-seasonal variation in isotopiccomposition. Buds began the growing season at -25.6‰, and became morepositive (-23.1‰) until early May. Both leaf and stem tissue then became morenegative and approached values of the original bud tissue. This variation ap-pears independent of crown closure, photosynthetic potential, and Ci/Ca ratio.

176 Proceedings of the South Dakota Academy of Science, Vol. 75 (1996)
We believe it reflects substantial fractionation associated with storage, mobi-lization, and translocation of reserve chemicals, likely starch or its monomers.Thus, hackberry plants show small amounts of genetic variation in isotopicfractionation, appear to be somewhat insensitive to environmental controls,and show large intra-seasonal variation.

Proceedings of the South Dakota Academy of Science, Vol. 75 (1996) 177
INTERPRETATION OF SEASONAL DIETPATTERNS IN BISON FROM STABLE
ISOTOPIC ANALYSIS OF HORN SHEATHS
Joel Vander Kooi, Larry L. Tieszen, and Chad McMurtryDepartment of Biology
Augustana CollegeSioux Falls, SD 57197
ABSTRACT
Horn sheaths were collected from seven bison (Bison bison) from five ar-eas across a wide range of latitudes in North America: Wood Buffalo NationalPark (59.67º N, 113.5º W) in the Northwest Territories of Canada, YellowstoneNational Park (44.58º N, 110.58º W) in Wyoming, Wind Cave National Park(43.58º N, 103.5º W) in South Dakota, Niobrara Valley Preserve (42.77º N,100º W) in northern Nebraska, and Konza Prairie (39.09º N, 96.6º W) in Kansas.These areas possess different proportions of C3 and C4 vegetation due to thetendency of C4 grasses to be more competitive at higher temperatures. Thisvariation by site provides specific carbon isotope signatures which are assimi-lated into the tissues of resident bison. Seasonal patterns in bison feedinghabits should also be evident as seasonal patterns of carbon isotope signatures;and periods of dietary stress may result in tissue recycling which can causechanges in nitrogen isotope levels of tissues.
The horn sheaths were analyzed for the stable isotopes of carbon and ni-trogen (measured in terms of δ13C and δ15N). We found that bison horn sheathsrecord the stable isotopic signatures of assimilated food sources. The meanδ13C values by site were -23.9‰ for Wood Buffalo, -23.4‰ for Yellowstone, -15.9‰ for Niobrara, and -13.8‰ for Konza, thus following the expected lati-tudinal trend of grass production. Further, horn sheaths may be used to de-termine changes in bison diets through time. The horn sheath collected fromWind Cave displayed a significant increase in δ13C (indicating an increase in C4
consumption) at subsection 1 of each annulus, which translates to the end ofthe growth period of each annulus. If annulus growth ended in fall/winter, thispattern would correlate with bison feeding patterns (providing for some lag be-tween consumption and assimilation into horn material) as bison feed on C4
vegetation most in July and August.It also appears that horn sheaths may be useful to indicate periods of di-
etary stress. A particular annulus within the Niobrara horn sheath possessedδ15N values which differed significantly from the values of the other annuli ofthe sheath. Similar differences were evident within the Wind Cave sheath andone of the Konza sheaths. These changes in δ15N between annuli may reflectdietary stresses which occurred during the years when the differing annuliwere grown. Horn sheaths provide the potential to quantify inter- and intra-

178 Proceedings of the South Dakota Academy of Science, Vol. 75 (1996)
annual assimilation under natural or managed conditions. We sampled hornsheaths to assess their potential to document annual and intra-annual season-al shifts in dietary patterns.

Proceedings of the South Dakota Academy of Science, Vol. 75 (1996) 179
EVALUATION OF OAT LINES IN REACTIONTO FIVE ISOLATES OF CROWN RUST
B.L. Hollesen, Jr., M.A.C. Langham, D.L. Reeves, and Y. Jin Plant Science Department
South Dakota State University Brookings, SD 57007
ABSTRACT
Crown rust caused by (Puccinia coronata Corda) on oats (Avena sativa L.)has been a serious problem to oat producers in most parts of the United States.Host plant resistance has been the most viable option for control of crown rust.The occurrence of new races is, however, a constant challenge to oat breedersand producers. The research reported in this abstract compares the reactionof 16 multiple gene cultivars and 24 single gene lines to five isolates of crownrust. Oat plants were grown in cylindrical containers 4 cm in diameter by plantswere grown in 20 cm in length. Three plants were grown per container. Plantswere inoculated at the two leaf stage 14 days after planting. Urediniospores ofcrown rust were suspended in a mineral oil and applied to plants using an at-omizer. After inoculation, plants were incubated at 200C with 100% relativehumidity for 24 hrs. The inoculated plants were then placed in a greenhousefor incubation. Rust reactions were evaluated 12 days after inoculation. Twoisolates, 94-SD-137 and 94-MN-167, of crown rust from the northern GreatPlains region were found to be virulent on the majority of the dominantlygrown oat cultivars. Oat line IA H777 was found to have the highest level ofresistance to all five isolates. Cultivar Horicon displayed a high level of resis-tance to 94-SD-137 and 94-MN-167. Eight cultivars produced in this regionshowed only low levels of resistance to these isolates. Of the 24 single genelines, PC-53-H441 and PC 68 exhibited the highest level of resistance to all fiveisolates. The genes contained in these lines could be useful for the future de-velopment of crown rust resistant cultivars.

Proceedings of the South Dakota Academy of Science, Vol. 75 (1996) 181
TRANSFORMATION OF SOYBEAN WITH ANANTI-SENSE CHOLINEPHOSPHOTRANSFERASE
GENE TO INCREASE SATURATED LIPID CONTENT
Buffy Ellsworth and T. M. CheesbroughDepartment of Biology and Microbiology
South Dakota State UniversityBrookings, SD 57007
ABSTRACT
Diacylglycerol cholinephosphotransferase is the enzyme that forms phos-pha-tidylcholine, a major membrane lipid and the substrate for fatty acid de-saturation in soybeans. The goal of this project is to modify the lipidmetabolism of soybeans to increase the saturated and monosaturated fatty acidcontent of the seed. A soybean high in saturated lipids will be valuable formaking diesel fuel.
A transgenic soybean will be produced which contains a modified diacyl-glycerol cholinephosphotransferase gene in the anti-sense orientation. Anti-sense genes express the reverse complement of an mRNA. When the copy hy-bridizes with the normal mRNA it blocks translation, thereby eliminating theenzyme. In the case of cholinephosphotransferase this will eliminate the sub-strate for polyunsaturated fatty acid synthesis, resulting in seeds with high lev-els of saturated and monosaturated fatty acids. A particle inflow gun will beused to target the anti-sense construction into soybean embryonic tissue. Theresulting transformed tissue will be regenerated, self-pollinated, and tested toconfirm that the diacylglycerol cholinephospho-transferase anti-sense gene ispresent.


Proceedings of the South Dakota Academy of Science, Vol. 75 (1996) 183
CHOLINEPHOSPHOTRANSFERASE mRNAIS EXPRESSED IN THE OUTER INTEGUMENT
OF YOUNG SOYBEAN SEEDS
Qi Luo and Thomas M. CheesbroughDepartment of Biology and Microbiology
South Dakota State UniversityBrookings, SD 57007
ABSTRACT
Cholinephosphotransferase (CPT) is a key enzyme in lipid metabolism insoybean seeds. It catalyzes the synthesis of phosphotidylcholine, the predom-inant lipid component of membranes (Kennedy and Weiss, 1956). The kinet-ic properties of CPT and the growth temperature effect on soybean CPT activ-ity have been well studied (Cheesbrough, 1989; Cho and Cheesbrough, 1990).
CPT mRNA was detected using Fluorescence In Situ Hybridization (FISH).Asymmetric sense and antisense CPT RNA probes were synthesized in vitro bytranscription from recombinants of pGEM3Z-CPT. The protocol of FISH wasmodified from Cox et al. (1984). For the first time, this technique was appliedsuccessfully to detect CPT mRNA expressed in young soybean seeds (earlystage of R5). Estimates from the observed symbols suggest that a large fractionof CPT mRNA is both retained in sections and hybridized with probes. The re-sults indicate that CPT mRNA is expressed in the layer of outer integument ofyoung soybean seeds.
REFERENCES
Cheesbrough, T.M. 1989. Changes in the enzymes for fatty acid synthesis anddesaturation during acclimation of developing soybean seeds to alteredgrowth temperature. Plant Physiology 90:760-764.
Cho, S.H., and T.M. Cheesbrough. 1990. Warm growth temperatures decreasesoybean cholinephosphotransferase activity. Plant Physiology 93:72-76.
Cox, K.H., D.V. Deleon, L.M. Angerer, and R.C. Angerer. 1984. Detection ofmRNAs in sea urchin embryos by in situ hybridization using asymmetricRNA probes. Developmental Biology 101:485-502.
Kennedy, E.P., and S.B. Weiss. 1956. The function of cytidine coenzymes inthe biosynthesis of phospholipids. J. Biol. Chem. 222:193-214.


Proceedings of the South Dakota Academy of Science, Vol. 75 (1996) 185
CLASSIFICATORY SIGNIFICANCE OF PYGIDIAL AND OVIPOSITOR GLANDS
IN ELATERIDAE (COLEOPTERA)
Xinjie Lin and Paul J. JohnsonInsect Research CollectionPlant Science Department
South Dakota State UniversityBrookings, SD 57007
ABSTRACT
Phylogenetic investigations on Elateridae (Coleoptera) are hindered by anabundance of equivocal adult characters. Potentially valuable characters arefound with the presence and positions of ovipositor glands that are probablypherome production sites.
Three males and females of 31 generic representatives of 6 subfamilies and14 tribes were examined. Two pairs of glands were found, one pair attachedat a fold in the sheathing membrane of the ovipositor (probably pheromonal),the other attached between terga 7-8 of both sexes (possible function unclear).Ovipositor glands were identified in 13 genera of Agrypninae (Conoderini,Agrypnini), Elaterinae (Agriotini, Physorhinini), Prosterninae (Athoini, Prostern-ini, Oxynopterini) and Lissominae (Semiotini, Lissomini). Representatives of 4genera of Prosterninae had only ovipositor glands. Representatives of Cardio-phorinae and Tetralobinae lacked both ovipositor and pygidial glands. Noovipositor glands were found in Anthracalaus (Conoderini), Lacon, Danosoma(Agrypnini), Alaus (Hemirhipini), Pyrophorus (Pyrophorini), Melanotus, Ampe-dus (Ampedini), Diplostethus, Orthostethus (Elaterini), Dipropus, Dicrepidius(Dicrepidiini), Athous, Hemicrepidius (Athoini), and Pseudanostirus, Aplotar-sus (Prosternini). Pygidial glands were found only on Aeolus spp. (Conoderi-ni) and Agrypnus spp. (Agrypnini).
The presence of pygidial glands appears important as a taxonomic char-acter for discriminating Aeolus from Conoderus and other genera in Conoderi-ni, and Agrypnus from Danosoma and other genera in Agrypnini. Rarity of py-gidial glands suggests that their presence may be derived. If so, these glandsmay be synapomorphic. The sharing of pygidial glands by Aeolus spp. andAgrypnus spp. supports larval characters and implies paraphyly of Conoderiniand Agrypnini.


Proceedings of the South Dakota Academy of Science, Vol. 75 (1996) 187
MALE BETTA SPLENDENS AGGRESSIVETHREAT DISPLAY RELATED TO VISUAL FAMILIARITY WITH OPPONENT FISH
Gregory W. Krajewski and T. P. CoxDepartment of PsychologyBlack Hills State University
Spearfish, SD 57799
ABSTRACT
Male Siamese fighting fish, Betta splendens, characteristically exhibit astereotypic aggressive threat display when exposed to the image of anothermale of the same species. This display consists of intensification of color andflared fins and operculum. However, propensity to display is quite variable.Possibly male B. splendens preferentially display to neighbors they recognize.Or, alternatively, strangers may constitute a greater threat and are thereforemore frequently met with the stereotypic threat display. To test the hypothe-sis, frequency, duration of threat display, and apparent visual orientation wererecorded when a “resident” male B. splendens was exposed to another male B.splendens with which it had either frequent or little exposure.
In this pilot study a single male Siamese fighting fish was housed in a ten-gallon “resident” aquarium. Other male B. splendens with similar physicalcharacteristics (color, shape, and size) were housed in two one-quart aquaria,one on either side of the resident tank. The fish were visually separated fromone another by one-way mirrors. A randomly determined non-resident fishwas placed in a water-filled zip-lock container positioned in the resident tank.This familiarization procedure was repeated three times. Following familiar-ization both the familiar and unfamiliar neighbor fish were individually ex-posed to the resident fish. However, the one-way mirrors prevented neighborfish visual access to the resident fish.
Results indicate male B. splendens threat displayed more frequently andspent more time viewing the familiar neighbor versus the unfamiliar fish. How-ever, some variability was noted. Familiarity with another fish may influencethe likelihood for display.


Proceedings of the South Dakota Academy of Science, Vol. 75 (1996) 189
LEAST CHIPMUNK, EUTAMIAS MINIMUS, RETURN TO CAPTURE SITE RELATED
TO DISPLACEMENT DISTANCE
T. P. CoxDepartment of PsychologyBlack Hills State University
Spearfish, SD 57799
ABSTRACT
Many animal species displaced from the point of their live capture returnto the original capture site. Return to capture site is referred to as homing be-havior. Most mammals possessing a permanent or semi-permanent residencedisplay homing behavior.
This study, during the summers of 1994 and 1995, monitored recapturerates of wild lest chipmunks, Eutamias minimus, displaced increasing distancesfrom their point of capture. The chipmunks resided in Raspberry Gulch,Spearfish Canyon, Lawrence County, South Dakota (T4, R2, Sec 15).
A central provisioning station was established. Approximately two weekslater, when chipmunks were feeding consistently at the provisioning station,live trapping commenced. Each captured chipmunk was individually markedand displaced from the provisioning/capture site a distance increasing 12.5 me-ters with each subsequent recapture. Direction of displacement (i.e., north,south, east, west) for each chipmunk for each capture was randomly deter-mined.
Chipmunks were regularly recaptured at the provisioning/capture site fol-lowing displacement of 62.5 meters from the captioning site. Chipmunks re-turned to the capture site from a maximum displacement distance of 137.5 me-ters. Mean displacement distance for return was 87.5 meters. Return to cap-ture site appeared related to terrain (i.e., more difficult to traverse, obstructedterrain was related to lower recapture rates). Individual chipmunks were ob-served returning from greater distances than those reported, but because theydid not reenter live traps, data for those returns are not included. In addition,trap shyness may have biased capture data.


Proceedings of the South Dakota Academy of Science, Vol. 75 (1996) 191
IN SITU OBSERVATIONS IN THUNDERSTORMS
Andrew Detwiler, Paul L. Smith, Gary Johnson,Ken Hartman, Charles Summers, and Jon Leigh
Institute of Atmospheric SciencesSouth Dakota School of Mines and Technology
Rapid City, SD 57701-3995
ABSTRACT
Since 1970 the Institute of Atmospheric Sciences at the South DakotaSchool of Mines and Technology has operated an armored T-28 aircraft for thepurpose of obtaining in situ observations of mature convective storm phe-nomena. The focus of its work has shifted over the years as interest wanes inolder research topics and shifts to newer topics.
Initially, most projects employing the T-28 were focused on the formationand growth of hail in thunderstorms. There was hope that with sufficient un-derstanding of this process, beneficial intervention could be made in the hailformation process that would result in less hail damage and more total precip-itation on the ground. Despite progress towards this goal, it became apparentby the mid-1970s that the problems were far more complicated than initiallysupposed. As is characteristic of similar situations in many branches of science,when the prospect of quick advances disappeared, interest began to wane inthis research endeavor.
Starting in the 1980s, the dominant themes in the atmospheric scienceshave become understanding the component processes resulting in long-termchanges in weather patterns and climate, and improved measurements andprediction of precipitation at all time scales from hours to seasons. Interest inverifying laboratory studies of microphysical charge separation processes within situ observations in natural clouds also continued. Participation by the ar-mored T-28 in several recent field projects has contributed new insight in bothgeneral areas.
Participation in convective storms projects in Illinois, North Dakota, Okla-homa, Florida, Colorado, and Texas in the late 1980s and 1990s has resulted inunique observations of the evolution of precipitation and electrification inthunderstorms. Among other insights, these observations are consistent withan electrification process in thunderstorms that is not strongly modulated byexternal factors, such as variations in ionospheric potential due to solar activi-ty. Hypotheses that invoke thunderstorm response to such ionospheric varia-tions to explain long-term drought cycles are thus not supported by the ob-servations.
Another insight has been a clearer depiction of the variation of cloud andprecipitation processes with changes in cloud base temperature. Warmerclouds tend to be composed of larger droplets which might, in favorable cir-cumstances, be more readily artificially-treated to enhance precipitation thancolder clouds composed of smaller droplets. Warmer clouds composed of larg-
192 Proceedings of the South Dakota Academy of Science, Vol. 75 (1996)
er droplets in general will be less reflective than colder ones, at least until icedevelops in the upper portions, and probably even after ice develops. Final-ly, warmer clouds are also more efficient precipitators in most situations. Thus,several cloud properties are sensitive to temperature shifts related to globalchange processes. Observations obtained with the T-28 have contributed tothe exploration of these issues.
In many of its recent projects, the T-28 has been used to provide in situobservations of precipitation characteristics that are used to verify new tech-niques for classifying hydrometeors and retrieving more accurate precipitationestimates with advanced meteorological radars. These new techniques will beused to improve estimates, and short-range forecasts, of precipitation amounts.
ACKNOWLEDGMENTS
Operation of the T-28 since 1987 has been made possible by a series ofcooperative agreements between the National Science Foundation and theSouth Dakota School of Mines and Technology.

Proceedings of the South Dakota Academy of Science, Vol. 75 (1996) 193
MULTIPLE SCATTERING CONTRIBUTIONS TO ATMOSPHERIC RADIANCE WITHAPPLICATIONS TO REMOTE SENSING
Jim OlsonDepartment of Physics
South Dakota State UniversityBrookings, SD 57007
ABSTRACT
In the transport of sunlight through the Earth’s atmosphere, the quantity oflight incident on any given horizontal surface from the hemispherical sky isknow as the diffuse irradiance. The diffuse irradiance seen on a given hori-zontal surface consists of three components. The first component, diffusespectral irradiance due to Rayleigh scattering, is caused by the scattering ofsunlight by molecules. The second component, diffuse spectral irradiance dueto aerosol scattering, is caused by the scattering of sunlight by aerosols. Thethird component is diffuse spectral irradiance and is caused by multiple reflec-tions of light between the atmosphere and the Earth’s surface. The first twocomponents of the diffuse irradiance arise due to a process known as scatter-ing, in which light energy impinges on particulate matter (molecules andaerosols) in the atmosphere and becomes diffuse (i.e. spreads out in differentdirections). In a single scattering event of incident sunlight, a single impinge-ment occurs and the resulting energy is scattered in a given direction but doesnot undergo further scattering before the radiation reaches the Earth’s surfaceor passes into space. Single scattering dominates the signal in a scattering at-mosphere. In multiple scattering within the atmosphere, the diffuse radiationproduced by the first impingement undergoes further impingement as it en-counters other molecules and aerosols. Usually, the diffuse spectral irradiance(in both Rayleigh and aerosol cases) contribution from multiple scattering with-in the atmpshere is significantly smaller than the contribution from single scat-tering and is ignored when considering the diffuse irradiance on a surface.When scattering due to Rayleigh (molecular) effects and aerosols as well as at-tenuation through absorption (the process in which the molecular and aerosolspecies present in the atmosphere absorb the incident radiation) and reflectionback into spcae are all taken into account, calculation of the diffuse irradiancereaching a portion of the Earth’s surface can be made. This calculation, how-ever, does not normally include multiple scattering contributions from theground or atmosphere because of the complexity in estimating their contribu-tion.
The objective of this research is to evaluate the contribution of ground andatmosphere multiple scattering to diffuse sky irradiance and radiance spectralmeasurements made in the field under cloudless sky conditions. In order toestimate the contribution from multiple scattering effects between the ground
194 Proceedings of the South Dakota Academy of Science, Vol. 75 (1996)
and atmosphere, the total amount of light scattered by a particular atmosphere(as characterized by its aerosol properties, since these are the primary variablesource of scattering in the visible and infrared spectrum) is calculated for var-ious zenith angles for a slant path from the ground into space. This is donewith the radiative transfer software LOWTRAN and MODTRAN. These codescan separately model each scattering component, including the ground/atmo-sphere multiple scattering components. Since each atmosphere is character-ized by its aerosol concentration and size distribution (which are both func-tions of altitude), these parameters are also varied to measure effects onground/atmosphere multiple scattering. The effects of using different groundspectral reflectances are also explored. Once a complete study of the amountof scattered radiance reaching the Earth’s surface is made, better techniquescan be developed to account for ground/atmosphere multiple scattering in theradiative transfer equations, which are solved to yield the total irradiance on ahorizontal surface (i.e. the Earth’s surface). Total irradiance is the sum of thedirect solar irradiance and the diffuse irradiance incident on some surface. Theresults of this reseaerch will produce tools needed to better evaluate the adja-cency effect in remote sensing images of the Earth’s surface. The adjacency ef-fect results in blurring of remote sensing images. It is caused by multiple scat-tering in the atmosphere and allows the signal from one location on the groundto contain information originating from adjacent ground cover.
This material is based on work suppored by the National Science Founda-tion, Grant OSR-9452894, and the South Dakota Future Fund.

Proceedings of the South Dakota Academy of Science, Vol. 75 (1996) 195
A BIOLOGICAL ASSESSMENT OF LANDSCAPEDISTURBANCE POTENTIAL ON THE LITTORAL
ZONE BENTHOS OF A PRAIRIE POTHOLE LAKE.
John L. Foley and Nels H. Troelstrup, Jr.Department of Biology and Microbiology
South Dakota State UniversityBrookings SD 57007.
ABSTRACT
Land-use practices are known to impact adjacent water bodies. Little in-formation exists regarding the identification of areas of disturbance around asingle lake basin. Thirty-six drainages were identified on the landscape sur-rounding Oak Lake, Brookings County, SD. Components of the Revised Uni-versal Soil Loss Equation (RUSLE) and land-use practices were incorporated in-to a GIS to delineate high and low disturbance potential for each drainagepoint. Littoral zone macroinvertebrates were sampled at drainage entry pointsaround the basin to determine if changes in community structure were corre-lated with the disturbance potential of adjacent land areas. Preliminary analy-sis indicates more variety in high disturbance potentiai sites than referencesites, as well as some unexpected results for several metrics. For example,some high disturbance potential sites exhibit higher species diversity. This mayreflect an intermediate disturbance and support the concept of a subsidy-stressgradient. Mean Macroinvertebrate Biotic Index scores (7.28 vs 6.14) and meanEPT: Chironomidae ratios (0.30 vs 1.61) for high disturbance potential vs ref-erence sites, respectively, indicate a shift in community structure toward moretolerant species at high disturbance potential sites. These data suggest a corre-lation between landscape disturbance potential and adjacent littoral zone ben-thic communities.


Proceedings of the South Dakota Academy of Science, Vol. 75 (1996) 197
SPECTRALLY RESOLVED GROUND MEASUREMENTOF THE MULTIPLE SCATTERING CONTRIBUTION
TO DIFFUSE SKY IRRADIANCE
Hang YuanDepartment of Physics
South Dakota State UniversityBrookings, SD 57007
ABSTRACT
The focus of this work is to develop techniques for detecting the compo-nent of the diffuse sky irradiance on a horizontal surface originating from anadjacent developed surface target (vinyl covered nylon) by using Multi-filterRotating Shadowband Radiometer. The intent is to optimize the radiometer formeasuring the contribution from the upwelling target radiance to the measureddownwelling diffuse sky irradiance through the process of multiple scattering.This program supports a research project in the Physics Department at SouthDakota State University (SDSU), which deals with a comprehensive study of theatmospheric point-spread function (PSF) and the corresponding adjacency ef-fect degrading the radiometric data contained in satellite and airborne imagery.
The detector used in this program is MFR-7 Rotating Shadowband Ra-diometer which is developed by Yankee Environmental Systems, Inc.. MFR-7 isa powerful field instrument which simultaneously measures the global, direct,and diffuse components of solar radiation incident on a horizontal surface atup to seven wavelengths. At each wavelength, each of the three componentsof solar shortwave (visible and near-infrared) irradiance is measured with thesame filter-detector using the shadowband technique. Along with the YESEDAScontrol box and host software Dosband, the total horizontal, diffuse horizontaland direct normal irradiance in seven wavelength passbands (broadband,415nm, 500nm, 615nm, 673nm, 870nm, and 940nm) are calculated and plottedfrom the raw data. The raw data can be angularly corrected. Then the famousLangley analysis can be performed to direct normal components, which pro-duces optical depths, extinction coefficients, and a determination of the spec-tral solar constant. Transformation of instrument irradiance to absolute units ofWatts/m2 is obtained through comparison with a standard lamp.
Normally the solar radiative transfer process include scattering and ab-sorption of electromagnetic radiation in the atmosphere and reflection of radi-ation from the ground surface. The radiation received by a ground-based de-tector can be divided into direct normal and total diffuse horizontal. The totaldiffuse includes single and multiple scattering by molecules and aerosols, andmultiple ground-atmosphere scattering interactions. Our goal is to separate thelast component from the other two and measure the signal to noise ratio (SNR)of this portion to determine the minimum radiance the adjacent reflectance ma-terial (a developed surface target: vinyl covered nylon) must reflect upward to

198 Proceedings of the South Dakota Academy of Science, Vol. 75 (1996)
be detected. After obtaining the corrected data from Dosband, we use MODTRAN to model the scattering atmosphere and work with these data toachieve our goal. The initial results of these work will be presented.
This material is based upon work supported by the National Science Foun-dation under Grant OSR-94S2894 and by the South Dakota Future Fund.

Proceedings of the South Dakota Academy of Science, Vol. 75 (1996) 199
SHORT-DAY PHOTOPERIOD RESPONSESOF THREE VITIS SPECIES: SURVEYING
FOR DORMANCY INDUCTION
Carol M.F. WakeBiology and Microbiology Department
andAnne Fennell
Horticulture, Forestry, Landscape and Parks DepartmentSouth Dakota State University
Brookings, SD 57007
ABSTRACT
Short-day (SD) photoperiod-induced dormancy has been observed inmany woody species. In Vitis riparia (river-bank grape, native to Manitoba,Canada), SD-induced dormancy is indicated by periderm development, cessa-tion of cane growth, terminal-bud abortion and delay, or failure, of bud re-growth after spur-pruning. During 6 weeks of SD (8hrs) and long-day (LD con-trol, 15hrs) climate-controlled photoperiod treatments, the induction of dor-mancy was monitored in three species: V. riparia, V. vinifera ‘Seyval Blanc’(French-American hybrid prone to winter-injury in N. latitudes) and the F1 hy-brid, V. riparia x ‘Seyval’. After 4 wks of SD photoperiod treatment, V. ripariawent dormant, demonstrating several morphologic changes: extensive perid-erm maturation, complete cessation of growth, tip yellowing and abortion, nobud regrowth after pruning, and dramatic decrease in bud water content. ‘Sey-val’ canes did not go dormant, as they continued to grow, showing very littleperiderm browning, no tip abortion, little or no delay in regrowth after prun-ing, and only moderate decreases in bud water content after 6 wks of SD treat-ments. The F1 hybrid demonstrated the vigorous LD cane growth habit of ‘Sey-val’, as well as the SD dormancy responses of V. riparia, albeit at a slower rate.
In addition to SD photoperiod-induced decreases in water content andfresh weight of these overwintering buds, there were varying decreases in to-tal soluble protein extracted per bud in each species. At the same time, 10%SDS-PAGE revealed 2- to 12-fold increases in relative abundance of an 18-22kD-range protein in these respective Vitis spp. 6 wks SD photoperiod also in-duces dramatic onset of expression of a 16-19 kD-range protein in all threespecies. In V. riparia, a 17-20 kD-range protein was observed to increase 2-fold over the same period. These proteins will be further resolved by chargeand size for characterization and sequencing.


Proceedings of the South Dakota Academy of Science, Vol. 75 (1996) 201
GENDER RATIOS, OOCYTE MATURATION,AND INSEMINATION RATES OF BLACK DOTFLEA BEETLES (APHTHONA NIGRISCUTIS)
IN CAMPBELL COUNTY, SOUTH DAKOTA
Mark A. Brinkman and Sharon A. ClayPlant Science Department
South Dakota State UniversityBrookings, SD 57007
Jan J. JacksonNorthern Grain Insect Research Laboratory
USDA-ARSBrookings, SD 57007
ABSTRACT
Black dot flea beetles, Aphthona nigriscutis Foudras, are collected annual-ly from a site near Pollack, South Dakota and redistributed to other areas forbiological suppression of leafy spurge, Euphorbia esula L. However, little isknown about the reproductive biology of black dot flea beetles. The purposeof this research was to monitor the reproductive status of black dot flea bee-tles during a summer season and determine the optimum period for collectionof reproductively viable females. Gender ratios, oocyte maturation, and in-semination rates of the black dot flea beetle population at the Pollack site werestudied in 1995. Adults were collected weekly with sweep nets followingemergence. Spermatheca were removed from abdomens of females and wereanalyzed for presence of sperm. Oocyte maturation was determined by dis-secting female abdomens and rating oocyte development. Adult emergencebegan after June 12, but before June 26, 1995. Males were rare in sweep netsamples and did not exceed 4% of the adult population throughout the sum-mer. The insemination rate of females on July 6 was 44% and was significant-ly (P < 0.01) higher than previous or subsequent sampling periods. FollowingJuly 18, only about 20% of adult females from samples were inseminated.Oocyte maturation gradually increased to a peak on July 25. Adults were rareat the Pollack site on August 3 and were not present on August 22. Althoughmales were scarce and insemination rates were somewhat low at times, repro-duction appears adequate to sustain the black dot flea beetle population at thePollack site. However, care should be taken when collecting black dot fleabeetles for redistribution to other areas. Collections taken too early or late inthe season may contain few individuals that are in optimum reproductive con-dition.


Proceedings of the South Dakota Academy of Science, Vol. 75 (1996) 203
PARENTAL ACCLIMATION AND DEVELOPMENTALTEMPERATURE RELATIONSHIPS OF THE
JAPANESE MEDAKA FISH, ORYZIAS LATIPES
Andrew B. Rahn, Mark A. Cade, and Leland G. JohnsonDepartment of Biology
Augustana CollegeSioux Falls, SD 57197
ABSTRACT
The purpose of the experiment was to examine effects of parental tem-perature exposure on offspring temperature tolerance and developmental ratein the Japanese Medaka, Oryzias latipes.
Adult medakas were acclimated to 21º C for seven days. Then, the pho-toperiod was adjusted to induce breeding (16L: 8D). Egg collection began sev-en days after photoperiod adjustment. Therefore, the total temperature accli-mation time was two weeks. Since age of the embryos was critical, eggs werecollected shortly after oviposition. (Oviposition normally occurs one to twohours after initiation of the light phase of the cycle). Eggs collected from eachof seven (eight in some cases) individual female medakas, were separated andplaced in eight petri dishes containing embryo rearing solution. At least oneegg from each female was included among the eggs in each petri dish. Thedishes were distributed to temperature-controlled growth chambers set at 6, 10,13, 16, ambient, 35, 38, and 41º C. Five replicate cultures were established ateach temperature by collecting eggs on each of five successive days. At inter-vals, the embryos’ developmental progress and viability were observed. Werecorded the times when two-thirds of the embryos in each petri dish displayedeach of two developmental markers: heartbeat and presence of pink blood.Subsequently, the same adults were acclimated to 28º C and the experimentwas repeated.
Parental acclimation caused a shift of embryonic temperature toleranceranges. When parents had been acclimated at 21º C, embryos could survivelower temperatures than when parents had been acclimated at 28º C. Con-versely, when parents had been acclimated at 28º C, embryos could survivewarmer temperatures than when parents had been acclimated at 21º C.
When parents had been acclimated at 21º C, embryos developed to heart-beat faster at lower exposure temperatures than when parents had been accli-mated at 28º C. At warmer exposure temperatures, embryos reached heartbeatquicker when parents had been acclimated at 28º C than when parents hadbeen acclimated at 21º C. Similar data were obtained for the appearance ofpink blood in the circulatory system. These data strongly suggest that parentalacclimation causes rotation of temperature response curves of developing off-spring.

204 Proceedings of the South Dakota Academy of Science, Vol. 75 (1996)
Our results lead us to conclude that in the medaka, parental temperatureacclimation affects both offspring temperature tolerance and developmentalrates. Our study differs from many laboratory acclimation studies because thesame adults were acclimated sequentially to the two acclimation temperatures.Thus, we eliminated the problem of genetic variation encountered when sep-arate sets of animals are subjected to the acclimated temperature being inves-tigated.

Proceedings of the South Dakota Academy of Science, Vol. 75 (1996) 205
STABLE ISOTOPE VALUES FORTWO MODERN BLACK BEARS FROMPRINCE OF WALES ISLAND, ALASKA
Korey B. Champe and Timothy H. HeatonDepartment of Earth Sciences and Physics
University of South DakotaVermillion, SD 57069
ABSTRACT
In southeast Alaska, stable isotope values indicate dietary patterns accord-ing to a simple two-food-source model. Exclusively terrestrial plant eaters, suchas rodents and ungulates, exhibit an average delta 13 C value of –22.7 o/ooand an average delta 15 N value of 5 o/oo, while exclusively marine fish eaters,such as otters and seals, exhibit an average delta 13 C value of –12.4 o/oo andan average delta 15 N value of 15.8 o/oo. Marine fish from the region have anaverage delta 13 C value of –13.5 o/oo. Some coastal Alaskan bears are mixedterrestrial and marine feeders and therefore exhibit intermediate values.
Until now only fossil specimens from Prince of Wales Island have beenstudied and only delta 13 C values measured. Prior to 7,000 years ago brownand black bears coexisted on the island, but only black bears are present to-day. We examined the delta 13 C values on collagen and bioapatite and thedelta 15 N values on collagen of two large male black bears that were recent-ly killed on the island. The delta 13 C values are –19.8 o/oo and –20.0 o/ooand the delta 15 N values are 7.9 o/oo and 7.8 o/oo on collagen, and the delta13 C values are –18.3 and –18.2 o/oo on bioapatite.
Fossil black bears from Prince of Wales Island and living inland black bearshave average delta 13 C values of –21.0 o/oo and average delta 15 N values of4.8 o/oo on collagen, indicating that they are almost exclusively terrestrial planteaters. The slightly higher values exhibited by the modern black bears fromPrince of Wales Island suggest a marine component to their diet, and this isconfirmed by sightings of bears fishing for salmon in island streams. Fossilbrown bears from the island have an average delta 13 C value of –17.6 o/oo,indicating a significant marine component to their diet. We postulate that theextinction of brown bears allowed black bears access to salmon streams andresulted in the higher stable isotope values for the modern population. Cor-responding differences can be found between coastal and inland populationsof modern brown bears. The primary black bear diet on Prince of Wales Is-land (at least 90%) is still terrestrial plants, however, as indicated by the stableisotope values and examination of feces.
Differences (spacings) between delta 13 C values on collagen and bioap-atite have been suggested to indicate the trophic level of an organism with aspacing of 7 o/oo for herbivores and 3 o/oo for carnivores. Spacings of 1.5o/oo and 1.7 o/oo for the two modern black bears from Prince of Wales Island

206 Proceedings of the South Dakota Academy of Science, Vol. 75 (1996)
are in substantial conflict with our conclusion that these bears are primarilyherbivores. These values contrast with a 3.9 o/oo spacing for an inland blackbear, 6.1 o/oo for a British brown bear, and a mean of 6.6 o/oo for nine Eu-ropean cave bears. The only low spacings we have found are from a polarbear (1.1 o/oo), two seals (2.1 o/oo), and 35 ancient coastal humans (2.6o/oo). While unusually low spacings are typical for marine carnivores, suchvalues in primarily herbaceous bears are especially perplexing. Until we haveobtained spacings on a wider variety of island animals, we cannot speculate onthis apparent contradiction.

Proceedings of the South Dakota Academy of Science, Vol. 75 (1996) 207
MOLECULAR MAPPING OF HEXAPLOID OATS(AVENA SATIVA L.) USING RFLP MARKERS
Mehmet Cakir, Lon A. Hall, and Dale L. ReevesPlant Science Department
South Dakota State UniversityBrookings, SD 57007
Alex L. KahlerBiogenetic Services, Inc.
Brookings, SD 57006
ABSTRACT
Cultivated oat (Avena sativa L.) is hexaploid with a basic chromosomenumber of n=3x=21. It consists of three basic genomes (A, B, and D). Fewsimply inherited morphological markers and disease resistance genes havebeen identified and no classical linkage map has been developed for this cropspecies. As a result, genetic studies of oat have lagged behind those of othercrops.
The development of molecular markers, such as RFLP (restriction fragmentlength polymorphism) and other polymerase chain reaction-based markers, haspermitted the development of linkage maps in many crop species. A prereq-uisite for RFLP mapping is to have a sufficient level of polymorphism betweenlines. In a preliminary study, we have found that 71% of the probes used de-tected polymorphisms among 90 oat cultivars grown throughout North Ameri-ca.
The mapping of cultivated oats is complicated by its large genome size andits polyploid nature. To date, two A-genome diploid oat maps have been de-veloped. Also, construction of a molecular linkage map of hexaploid oats hasbeen initiated by several US and Canadian researchers using recombinant in-bred lines.
The objective of this study was to construct an RFLP-based linkage map ofhexaploid oats using an F2 population. The mapping population consisted of173 F2 plants that were developed from a cross of Cayuse and Froker varieties.F2 plants were selfed in the greenhouse. F2 plants were space-planted in thefield. Fresh leaf tissue samples were collected from F2 plants. Analysis ofRFLPs included isolation of genomic DNA, digestion with restriction enzymes,Southern blotting, hybridization with labeled probes, and developing autora-diograms. Initially, parents were screened with 256 probes with 110 detectingpolymorphisms between parents. These polymorphic probes were then usedto analyze RFLPs of F2 plants. Autoradiograms were read visually using a lightbox, and presence or absence of polymorphic bands were recorded as ‘1’ and‘0’, respectively. So far, analysis of 71 probes has been completed. MAP-MAKER version 3.0 software was used for linkage analysis. Linkage groups

208 Proceedings of the South Dakota Academy of Science, Vol. 75 (1996)
were obtained using two-point analysis with an LOD score (logarithm of thelikelihood ration) of 3.0 and a maximum recombination level of .40 using the“group” command. Multipoint analysis was then used to order the loci withineach linkage group. The loci formed 14 linkage groups ranging in size from5.2 cM (centimorgan) to 92.9 cM and consisted of an average of 4.2 loci. Twen-ty-seven loci remained unlinked. The current map is 517.7 cM. With the ad-dition of 39 probes (in process), the map size is expected to increase.
This map will provide a tool for quantitative trait loci analysis of severalimportant traits that we are investigating currently, such as hull percent, head-ing date, and plant height. These data will be used for marker-assisted selec-tion in oat breeding.

Proceedings of the South Dakota Academy of Science, Vol. 75 (1996) 209
A COMPARATIVE ANALYSIS OF ATMOSPHERICEXTINCTION DATA BETWEEN A SHADOWBAND
SOLAR RADIOMETER AND A REAGAN 10-CHANNEL SUNPHOTOMETER
Steve Fox and Stephen SchillerPhysics Department
South Dakota State UniversityBrookings, SD 57007
ABSTRACT
The purpose of this project was to measure the atmospheric extinction ofsolar radiation as it traverses through the atmosphere using a shadowband so-lar radiometer and to compare those results with those obtained from a Rea-gan 10-channel sunphotometer. Atmospheric extinction is a constant underclear sky conditions that represents the fractional rate of light loss per unit pathlength through the atmosphere due to absorption and scattering by moleculesand aerosols. This analysis will be used in the development of the PortableGround-Based Atmospheric Monitoring System (PGAMS) being constructed inpart by the second author.
The shadowband solar radiometer and sunphotometer were set up on theroof of Crothers Engineering Hall at South Dakota State University to track thesun on mostly cloudless days. Measurements of solar irradiance began short-ly after sunrise and continued until sunset as long as the sky remained clear.This gave a.m. and p.m. sets of data. The radiometer and sunphotometer bothstore data in binary code, so it had to be converted to ASCII format before anal-ysis could be made using a spreadsheet. After the data were imported onto aspreadsheet it was manipulated by Langley analysis to give calculations of airmass, the path length through the atmosphere that the light traveled. The dig-ital numbers, uncalibrated measurements of solar irradiance, are recorded alsoin the spreadsheet. Since the sunphotometer measures solar irradiance con-tinuously perpendicular to the sun it was not necessary to modify the data.The shadowband solar radiometer, however, does not measure solar irradianceperpendicular to the direction of the sun. Therefore the data had to be anglecorrected so that the two instruments both measured solar irradiance directly.
The shadowband radiometer not only measures atmospheric extinction butalso has the ability to measure both the global and diffuse sky components ofthe total irradiance on a horizontal surface. The global to diffuse ratio providesa measurement of the amount of scattering of solar radiation by atmosphericaerosols. This is important in developing models used for remote sensing ap-plications that predict the transport of radiation through the atmosphere.
The goal was to compare the precision of the extinction coefficients ob-tained with the shadowband radiometer to the Reagan sunphotometer in order

210 Proceedings of the South Dakota Academy of Science, Vol. 75 (1996)
to determine the reliability in the measurements of the global to diffuse ratio.Preliminary evaluation of measured extinction yielded an agreement betweenthe two instruments ranging from 0.02% to 4.6% error for various wavelengths.(Final results of this evaluation will be presented.)

Proceedings of the South Dakota Academy of Science, Vol. 75 (1996) 211
DESIGN, CONSTRUCTION, AND USE OFA STURDY PHOTOMULTIPLIER TUBE HOUSING
FOR BIOLUMINESCENCE EXPERIMENTS
Michael FossumBiology/Microbiology Department
andBruce H. Bleakley
Biology/Microbiology and Plant Science DepartmentsSouth Dakota State University
Brookings, SD 57007
ABSTRACT
Many organisms, including several marine bacteria, produce photons (lightenergy) via enzymatic reactions catalyzed by luciferase enzymes. Several lu-ciferase genes have been cloned and expressed in heterologous hosts viamolecular cloning techniques. Measurements of the production of light can beused in assays of gene expression, and of luminescent bacterial activity and dis-persal in different environments. Technology exists to accurately measure lowlevels of light emission that would not be detectable by the unaided humaneye. In order to facilitate bioluminescence studies, our research laboratory ac-quired a used Hamamatsu photon counter and a photomultiplier tube (PMT),but there was a need to acquire a light-tight housing to protect the PMT fromexposure to high light intensities (such as are found in normal indoor roomlighting) which would ruin the PMT. The purpose of this project was to de-sign, construct, and use a sturdy PMT housing that could be used in classroomteaching or research while reliably protecting the PMT from accidental expo-sure to damaging light levels. In addition, the housing needed to afford rapid,easy changing of sample holders having different shapes and volumes thatwould contain the bioluminescent samples; needed to be sturdy enough towithstand many years of use by people with varying levels of laboratory ex-perience and skills; and needed to be relatively low in cost to manufacture.
Several designs were formulated on paper, and those that were not “stu-dent-proof” were eliminated. The final design judged to be most suitable wastransferred to computer via an Autocad computer program. Further addi-tions/modifications to the design were then made. A lip was added to thespecimen holder to prevent light leaks, and the sides of the sample chamberwere stepped to ensure light-tightness. The final design was capable of ac-commodating several different specimen holders, including test tubes, petriplates, and scintillation vials.
The material chosen for the housing was aluminum because of its non-magnetic properties, light weight, and resistance to rust or corrosion. The sam-ple carrier was constructed of graphite-impregnated nylon, which was rela-tively inexpensive and also quite durable. The entire apparatus was con-

212 Proceedings of the South Dakota Academy of Science, Vol. 75 (1996)
structed to tolerances greater than 0.001, which further aided the light-tightnessof the design. All metal surfaces were black anodized to prevent reflectionswithin the PMT chamber. Bearings were installed in the drum to allowsmoother rotation, and to provide lasting durability and light-tightness. ThePMT-housing was fitted to the specimen chamber, and an additional supportwas added to the rear of the PMT-housing for stability. The entire light-mea-suring apparatus with the housing in place provided extremely low back-ground counts when the sample chamber was empty or contained sterile me-dia, showing that the housing was light-tight. The apparatus was used to ac-curately measure light production by several luminescent bacterial strains. Thetotal cost of the project to construct the housing was less than $1,900.00, pro-viding a durable, sensitive light-measuring device for considerably less moneythan many commercially available designs.

Proceedings of the South Dakota Academy of Science, Vol. 75 (1996) 213
BOVINE HERPESVIRUS 1 DOES NOTCAUSE APOPTOSIS IN BOVINE CELLS
W. Wiese, L.J. Braun, and C.C.L. ChaseDepartment of Veterinary Science
South Dakota State UniversityBrookings, SD 57007
ABSTRACT
Bovine herpesvirus 1 (BHV-1 is a cause of upper respiratory tract diseasein cattle. BHV-1 infection causes rapid death in bovine cells in vitro. Manyother cytopathic viruses cause apoptosis, a process of cellular DNA fragmenta-tion as a result of infection. We analyzed cellular DNA from bovine cells fol-lowing BHV-1 infection to determine any apoptotic effect. Previously, we haveshown that BHV-1 does not shut down or stimulate cellular DNA synthesis fol-lowing viral infection. Confluent monolayers of Madin Darby bovine kidney(MDBK) or bovine turbinate (BT) cells were infected with BHV-1 at a multi-plicity of infection (MOI) of 1. The cells were harvested at 0, 6, 12, 18, or 24hours post infection or 0, 12, 24, 36, or 48 hours post infection. The cellularDNA was extracted, quantitated, loaded on a 1.0% agarose gel, and elec-trophoresed in a horizontal gel apparatus. The DNA present in the gel wasstained with ethidium bromide, visualized with UV light, and photographed.All the cellular DNA ran at a high molecular weight, and there was no evidenceof the multiple bands (DNA ladder) characteristic of apoptosis. BHV-1 infec-tion of bovine cells in vitro does not trigger apoptosis. Other mechanismsneed to be investigated to determine the factors responsible for the rapid celldeath seen in BHV-1 infections.


Proceedings of the South Dakota Academy of Science, Vol. 75 (1996) 215
IN SITU HYBRIDIZATION FOR EXPRESSIONOF THE AGOUTI GENE IN TISSUES OF
THE LETHAL YELLOW MOUSE
Maureen R. Diggins, Raymond R.R. Rowland, and Nels H. GranholmDepartment of Biology
Augustana CollegeSioux Falls, SD 57197
Department of Biology and MicrobiologySouth Dakota State University
Brookings, SD 57007
ABSTRACT
The lethal yellow allele of the mouse agouti locus causes a number of phe-notypic expressions collectively known as the lethal yellow syndrome. Theseexpressions include yellow coat color, obesity, progressive infertility, and de-creased immunocompetence. The agouti gene has been isolated, cloned, andsequenced. it encodes a small, 131 amino acid protein referred to as agoutiprotein. The lethal yellow allele causes overexpression of the agouti gene invirtually all tissues thus far examined; e.g., brain, liver, lung, spleen, kidney,and day 6 skin.
The purpose of this study is to examine the development of obesity in thelethal yellow mouse. It is hypothesized that the progressive obesity character-istic of this mutant is due to overexpression of the agouti gene in adipose tis-sue. The excess agouti protein may act as an autocrine or paracrine factor pro-moting hypertrophy of adipocytes.
Purified agouti genes (exons II, III, and IV) were labeled with 35S and usedto probe for agouti mRNA in adipose tissue of black (a/a), agouti (AwJ/AwJ),and lethal yellow (Ay/a) mice that were 120 and 300 days old. The data indi-cate that the agouti gene is being ectopically overexpressed in adipose tissuesof the lethal yellow mouse but not in adipose tissues of black or wild typeagouti mice.
The overexpression of the agouti gene in adipose tissues of the lethal yel-low mouse may be a direct cause of the hypertrophy of the adipocytes and theresulting obesity seen in this mutant. This does not rule out the additional ef-fects of more indirect causes of obesity such as changes in insulin and/or glu-cocorticoid secretion which could cause increased lipogenesis and decreasedlipolysis and result in obesity.
This study was funded by USDA-NRI grant 95-37208-2245.


Proceedings of the South Dakota Academy of Science, Vol. 75 (1996) 217
A DUAL FUNCTION MODIFIEDGLASSY CARBON ELECTRODE
Betsy B. Ratcliff and Royce C. EngstromDepartment of Chemistry
University of South DakotaVermillion, SD 57069
ABSTRACT
The design of practical analytical devices frequently requires modificationof the electrode surface to impart selectivity. However, in practice it is oftenfound that the modification process interferes with electron transfer. For ex-ample, it has been shown that enzymes can be covalently bound to the sur-face of carbon electrodes while still retaining their viability. The covalentlybound enzyme can then convert an electrochemically inactive species to onethat can be detected by the electrode, thus allowing detection of an electro-chemically inactive analyte. Unfortunately, immobilized enzyme surfaces oftenimpede electron transfer between the electrode and the enzyme generated an-alyte of interest. What is needed is the ability to spatially select where on theelectrode the enzyme is to be placed, leaving the remaining electrode surfaceunhindered for electron transfer. Here we report on a glassy carbon electrode(GCE) surface incorporating both covalently bonded viable enzyme and spa-tially directed electrochemically active regions.
A waxy transparent anodization layer forms on GC immersed in support-ing electrolyte and subjected to potentials greater than +1.5V for several min-utes. This layer is rich in a variety of carbon-oxygen functional groups and en-zymes were covalently bonded to the GCE surface via an imide linkagethrough the carboxyl groups present. In addition to providing the necessarycarboxyl groups, the anodized surface blocks most electron transfer. Electro-chemical activity is restored upon exposure to highly basic solutions. We haveused microelectrodes to create electrochemically active domains by generationof hydroxide while the tip was in close proximity to the enzyme modified GCEsurface.
Enzyme viability and electrochemical activity of the enzyme immobilizedGCE was characterized by bulk solution methods and ECL imaging. In ECLimaging the electrode is immersed in a basic luminol solution. The luminol isoxidized at the active electrode surface and through a series of rapid reactionsemits light. Since the lifetime of the electro-oxidative product of luminol issmall on a diffusional time scale, the spatial distribution of light collected abovean electrode surface reflects the spatial distribution of electroactive sites. Theresults demonstrate presence of active enzyme immobilized within diffusionalcontact of electroactive domains on the GCE surface.


Proceedings of the South Dakota Academy of Science, Vol. 75 (1996) 219
SCANNING PROBE MICROSCOPY INVESTIGATIONSOF ELECTRODE MORPHOLOGY AND ACTIVITY
Brian D. Lamp, Betsy B. Ratcliff, and Royce C. EngstromDepartment of Chemistry
University of South DakotaVermillion, SD 57069
ABSTRACT
With the increasing interest in the development of devices of micro- andnano-scopic dimensions, elucidation of the structure and reactivity of materialson such a scale is critical. We are interested in the preparation and character-ization of microscopically heterogeneous structures on electrode surfaces,which will prove useful in the design of complex devices such as sensors.
Scanning probe microscopies (SPM) such as scanning tunneling mi-croscopy (STM), atomic force microscopy (AFM), and scanning electrochemi-cal microscopy (SECM) are powerful tools for the investigation of surface struc-ture and reactivity for a wide array of materials on scales ranging from mi-crometer to sub-nanometer. SPM as well as electrochemical techniques wereused to examine glassy carbon electrode surfaces which had undergone sev-eral pretreatment processes. Freshly polished electrodes revealed a fairlyamorphous surface structure with features consisting of polishing scratches andvoids which result from manufacture. Following the application of a large an-odic potential, a graphitic oxide layer formed which was characterized by anincreased degree of surface roughness as well as a marked decrease in elec-trochemical activity. The oxide layer was then removed from micrometer-sizedareas on the electrode surface by the localized electrochemical generation ofhydroxide using a microelectrode tip placed in close proximity to the carbonelectrode surface. These locally generated sites showed surface morphologyapproaching that of freshly polished glassy carbon, as well as increased elec-trochemical activity, as measured by SECM and luminescence imaging.
These results provide insight into the structural changes which accompanyvarious pretreatment methods for glassy carbon electrodes. The results alsounderscore the utility of scanning probe microscopy as a method for the elu-cidation of structure and activity of electrode materials and surfaces in gener-al.


Proceedings of the South Dakota Academy of Science, Vol. 75 (1996) 221
THE EFFECTS OF PHORATE ONWETLAND MACROINVERTEBRATES
Charles D. DieterDepartment of Biology/Microbiology
andWalter G. Duffy and Lester D. FlakeDepartment of Wildlife and Fisheries
South Dakota State UniversityBrookings, SD 57007
ABSTRACT
Macroinvertebrates are important for food chains, nutrient cycling, andproductivity in wetlands and provide a crucial link between detrital resourcesand higher order consumers. Waterfowl consume large numbers of wetlandmacroinvertebrates to meet requirements of reproduction and growth. If theabundance of wetland macroinvertebrates is depressed by insecticides, water-fowl may be indirectly affected through reduced clutch size as well as duck-ling mortality and severe reductions in growth of ducklings. The effects ofphorate, an organophosphorus insecticide, on aquatic macroinvertebrates werestudied in littoral mesocosms in South Dakota wetlands. In 1991 and 1992,four mesocosms were constructed in each of three wetlands. In each wetland,one mesocosm was a reference and phorate concentrations of 1.2, 2.4, and 4.8kg/ha were applied to treatment mesocosms. We assessed the effect of phor-ate by monitoring survival of macroinvertebrates in enclosures with meso-cosms. We constructed enclosures that allowed water to circulate within themfrom 2-liter plastic buckets. Four genera of aquatic macroinvertebrates repre-senting different functional feeding groups were stocked into separate buckets:midges (Chironomus spp.), amphipods (Hyalella azteca), pond snails (Stagni-cola elodes), and leeches (Nephelopsis obscura). Phorate caused mortality toamphipods and chironomids throughout the study. Leeches and snails wereresistant to phorate. We also indexed macroinvertebrate populations within thewetland and inside each mesocosm using sweep nets. We made three 1-msweeps with a macroinvertebrate sampling net (20 cm by 50 cm, 0.5-mmmesh). Two days after treatment, we repeated this index. After 28 days, weconducted an index to determine recovery. Few living macroinvertebrateswere present in mesocosms after phorate treatment and populations recoveredonly slightly after one month. In this study, macroinvertebrate taxa had vari-able responses to phorate treatment, but most responses were negative. Phor-ate treatments at the lowest concentration tested killed all amphipods and chi-ronomids for one month. Even though phorate concentrations decreased overthe study, concentrations were still high enough to kill most macroinverte-brates. Index samples showed that other taxa of macroinvertebrates were al-so sensitive to phorate. Macroinvertebrate taxa that were sensitive to phorate

222 Proceedings of the South Dakota Academy of Science, Vol. 75 (1996)
included: Odonata, Hemiptera, Culicidae, Heliidae, Ephemeroptera, Acarina,Coleoptera, Stratiomyidae, and Hydracarina. Taxa that were tolerant to phor-ate included: Hirudinea, Gastropoda, Oligochaeta, and Ostracoda.
Proceedings of the South Dakota Academy of Science, Vol. 75 (1996) 223
ANALYSIS OF A MATHEMATICAL MODELFOR THE DYNAMICS OF INTERACTION
BETWEEN A UNILINGUAL AND A BILINGUALPOPULATION IN TWO ADJACENT REGIONS
A.S. ElkhaderDepartment of Mathematics and Natural Sciences
Northern State UniversityAberdeen, SD 57401
ABSTRACT
Interaction between various language groups has increased in the last twocenturies. A mathematical model that describes the interactions between aunilingual and a bilingual population in a closed environment was developedby Baggs and Freeman (BF) in 1990. The model consists of two autonomousordinary differential equations. Conditions under which the bilingual popula-tion become extinct and conditions under which it persists were given.
In this research, we modify the BF model to accommodate the same in-teractions between two adjacent communities. The two environments containthe same unilingual and bilingual populations. The two populations are en-joying a free movement between each other. The model consists of a systemof four nonlinear ordinary differential equations. The modified model and itsparameters will be introduced. Basic properties of the model will be present-ed. In addition, the persistence theory of dynamical systems has been used togive conditions regarding extinction and persistence of the bilingual popula-tion. [Introduce the model, present its properties, and state conditions regard-ing extinction and persistence.]


Proceedings of the South Dakota Academy of Science, Vol. 75 (1996) 225
MELANOGENIC POTENTIAL OF des-Ac-αMSH
Partha Ramasastry and Nels GranholmDepartment of Biology/Microbiology
South Dakota State UniversityBrookings, SD 57007
ABSTRACT
Desacetyl-αMSH (des-Ac-αMSH), one of three species of αMSH, has beenimplicated in the development of yellow coats in yellow mutants (Ay/- and Avy/-) of the agouti locus. Ay may perturb the synthesis and/or maturation of _MSHwithin the pituitary; also Ay may disrupt the deployment of αMSH in varioustissues leading to the lethal yellow syndrome i.e., diabetes, infertility, yellowcoat, cancer, immune system defects and others. The purpose of this study wasto test the role of des-Ac-αMSH in the development of yellow coat orphaeomelanin synthesis by testing its melanogenic potential using B16melanoma cell line as an experiment model.
We treated B16 cells (initial seeding density of 3x10⁵ cells/T75 flask) withdes-Ac-αMSH (0.2µm) and assessed the levels of both activities of the enzymetyrosinase – tyrosine hydroxylase (TH) and dopa oxidase (DO) every 24 hrsover a 96-hr period. Levels of the second messenger cAMP were also mea-sured over 30 and 60 minute intervals.
Results indicate that des-ac-αMSH induces a 6.5-fold and a 5.5-fold in-crease in TH and DO activities, respectively, over a 4-day period. The levelsof cAMP at 30 and 60 min of exposure todes-Ac-αMSH increase 75- and 53-fold, respectively.
To summarize, present data suggest that des-Ac-αMSH possessesmelanogenic potential as supported by elevated cAMP levels and increasing THand DO activities of tyrosinase. Thus, these data do not support a direct causalrole for the des-Ac-αMSH induced induction of yellow coat (phaeomelano-genesis) and perhaps other features of the lethal yellow syndrome. Study fund-ed by SDSU-AES-HD089, Eagles Ehrman Cancer Fund and NIH (AR42757).


Proceedings of the South Dakota Academy of Science, Vol. 75 (1996) 227
AGOUTI LOCUS REGULATION OF DOPAOXIDASE ACTIVITY IN MUTANT MICE
Elden Rand and Nels H. GranholmDepartment of Biology and Microbiology
South Dakota State UniversityBrookings, SD 57007
ABSTRACT
Although the gene product encoded by the mouse agouti locus (agoutiprotein) influences tyrosinase activity, the mechanism(s) are unknown. Dopaoxidase (DO) activity of tyrosinase catalyzes the conversion of dopa todopaquinone during melanin synthesis. The purpose of this study was to as-sess the effects of three agouti locus alleles (Ay, a, and AwJ) on dopa oxidase(DO) activity and to determine how the agouti locus regulates the synthesis ofeither yellow or black pigment within hair follicle melanocytes. We harvestedregenerating hair follicles at 5, 8, and 11 days post-plucking of yellow (Ay/a),black (a/a), and agouti (AwJ/AwJ) mice and prepared fractions to measure DOactivity based on Alison Winder’s colorimetric method. Winder’s method mea-sures the intensity of a pink pigment caused by the reaction of newly formeddopaquinone with Besthorn’s hydrazone (MBTH). This assay has an advan-tage over previous colorimetric procedures because it directly measures con-centration of dopaquinone rather than dopachrome and/or other melanin in-termediates distal to dopaquinone in the melanin pathway.
There were significant genotype differences (P<0.05) in DO activity at allthree days of regeneration indicating that each of the three agouti alleles spec-ifies unique patterns of DO activity. We observed a high-to-low (decreasing?)DO activity hierarchy of a/a > AwJ/AwJ > Ay/a on all three regeneration days.DO activities (nmol dopaquinone/min/ug protein) for day 8 were 3.91 (a/a),2.03 (AwJ/AwJ), and 1.08 (Ay/a). Aya to a/a DO activity ratios for days 5, 8,and 11 were 0.2, 0.3, and 0.2, respectively. These ratios are highly consistentwith our previous tyrosinase activity measurements and those from other re-searchers. DO activity of AwJ/AwJ resembles that of Ay/a on day 8 (whenAwJ/AwJ synthesize yellow pigment) and that of a/a on day 11 (when AwJ/AwJhas switched back to black pigment). These data further delineate the effectsof agouti alleles on DO activity and suggest that analysis of the synthesis andmetabolic fate of dopaquinone are critical to understanding agouti gene regu-lation of melanogenesis. Funded by SDSU AES-HD089, Eagles’ Ehrmann Can-cer Fund, and NIH (AR42757).


Proceedings of the South Dakota Academy of Science, Vol. 75 (1996) 229
EFFECTS OF Ay ON FERTILITY INAy/A MICE—OVARIAN COMPENSATION
Ryan J. Saetveit, Maureen R. Diggins, and Nels H. GranholmDepartment of Biology and Microbiology
South Dakota State UniversityBrookings, SD 57007
ABSTRACT
The lethal yellow allele (Ay) of the mouse agouti locus causes infertility.The severity of the infertility is directly related to the degree of obesity. Sinceovary transplantation studies document that Ay/a ovaries have no intrinsic de-fects, Ay-induced infertility must be caused by defects extrinsic to the ovary.The purpose of this study was to assess the overall functionality of one of theseextrinsic pathways – the hypothalamus-pituitary-ovary axis in extremely obeseAy/a and control a/a mice. Following unilateral ovariectomies (OVX) and con-trol operations (SHAM), we recorded mating success and analyzed a series ofreproductive parameters (ovary, uterus, and developing embryos).
Of the a/a mice 57% were pregnant on day 10 of gestation as comparedto 53% (17/32) of Ay/a mice. However, 94% (16/17) of the Ay/a pregnant miceweighed 45 g or less, whereas 67% (10/15) of the Ay/a mice in the nonpreg-nant group (which had equal opportunities to mate) weighed in excess of 45g. Mean weights (g) for pregnant and nonpregnant Ay/a females were 37.4and 45.9, respectively, significantly elevated (P<0.01) over their a/a counter-parts (26.0 and 27.3). Ay did not affect ovarian compensation or numbers ofvisual follicles and mechanically liberated oocytes in either the lighter pregnantor heavier nonpregnant Ay/a females. Although Ay appeared to have a nega-tive effect on uterine weight, weights of embryo implantation chambers (de-diduae) were not different between genotypes. However, 54% (33/61) of theembryos from OVX Ay/a females were abnormal; thus Ay caused a significantdecline (P<0.01) in embryo viability and developmental progress.
To summarize: 1) Ay does not disrupt the hormonal feedback circuitry ofovarian compensation even in severely obese females [(mean wt. = 45.9g)], 2)Ay does not arrest the production of oocytes within ovaries of obese mice;[however, recovered oocytes could have been derived from primary folliclessuggesting that normal follicular maturation may not occur in obese Ay/a fe-males,] and 3) Ay appears to have a negative effect on uterine performance [asmeasured by reduced uterine weight and significantly decreased embryo via-bility and developmental progress]. Agouti protein, ectopically overexpressedin Ay/a mice, may by virtue of its competitive interaction with melanocortinsinterfere with the normal signaling of pituitary and ovarian hormones with theirrespective target ovarian and uterine tissues. Study funded by SDSU-AES-HD089, Eagles’ Ehrmann Cancer Fund, and NIH (AR42757).


Proceedings of the South Dakota Academy of Science, Vol. 75 (1996) 231
AN EXAMINATION OF THEEFFECTS OF CYTOPATHIC AND
NON-CYTOPATHIC BOVINE VIRAL DIARRHEAVIRUS STRAINS ON T-CELL ACTIVATION
T.M. Appel, D.J. Hurley, and C.C.L. ChaseDepartment of MicrobiologySouth Dakota State University
Brookings, SD 57007
ABSTRACT
Atluru et. al. demonstrated the BVDV inhibition of Concanavalin A andPhytohemagglutinin stimulated mitogenic activation of peripheral bloodmononuclear cells (PBMCs) (Atluru et. al., Vet. Immunol. Immunopathol., 25(1990) 47-59). We propose that BVDV causes immunosuppression by directlyinhibiting one or more of the intracellular signal transduction components thatregulate PBMC proliferation. The purpose of this study was to correlate cyto-pathic character with the degree of mitogen suppression. In addition, the pointat which BVDV interrupted signal transduction was identified using superanti-gens (TCR activation), mitogens (CD2 and CD3 complex activation), andCa++ionophore + PMA (direct stimulation of PKC and calcineurin). Our resultsshow that cytopahtic type I and II strains, NADL and Singer respectively, in-hibit mitogenic activation of PBMCs from all three classes of stimulators. Thenon-cytopathic type II strain, 890, exhibited partial inhibition. N.Y.I. non-cy-topathic type I, infected PBMCs did not show any inhibition. These results sug-gest that non-cytopathic BVDV isolates are less inhibitory than cytopathic iso-lates. Also, BVDV inhibition is occurring beyond inophore + PMA stimulator.


Proceedings of the South Dakota Academy of Science, Vol. 75 (1996) 233
ASSESSMENT OF THE IMPACT OF DIESELFUEL CONTAMINATION ON PLANT GROWTH
AND MICROBIAL DEGRADATION
Lenore M. Koczon, Susan Landon-Arnold, Frank Birch, and Nicole ManningDepartment of Mathematics and Natural Sciences
Northern State UniversityAberdeen, SD 57401
ABSTRACT
Chemicals become contaminants when they are present in amounts thatare harmful to plants, animals, or human beings. Taken in this light any chem-ical compound, from common table salt to the organic compounds found indiesel fuel, can be considered an environmental contaminant if it is present inconcentrations large enough to cause damage. Depending upon the chemicalinvolved, concentrations that determine when a compound becomes harmfulchange.
This research looked at the effects of soil spills of petroleum on the ger-mination of rye grass seed, the microbial populations in the area of the plantroots, and degradation of the hydrocarbon contaminants.
Soil samples, approximately 50 g, were contaminated with no. 2 diesel fu-el in the range of 250 ppm to 10,000 ppm and transferred to Buchner funnels.Coarse filter paper was placed in the funnel to stop the soil from runningthrough and pea gravel was added to aid drainage. The Buchner funnels wereplaced onto side-arm flasks to allow us to collect the leachate. The flasks andfunnels were placed on the sill of a west-facing window in one of the chem-istry laboratories. Twenty-five grass seeds were scattered on the surface of soil.The controls used for this experiment included: 1) a funnel containing soil,gravel, and grass seed, but no petroleum; 2) funnels containing soil, gravel, andpetroleum, but no grass seed; 3) a funnel containing soil. The funnels werecovered with clear plastic to prevent dehydration. The soil was watered asneeded. Temperature was monitored daily.Early results from this work have indicated that the germination of grass seedis slowed somewhat in the contaminated soils versus the control. Seeds sprout-ed at concentrations ranging from 250 ppm to 10,000 ppm. The rate at whichthe plants grew was also measured. We are currently looking for the concen-tration at which germination no longer will occur by studying soil contaminat-ed with 50,000 to 250,000 ppm of no. 2 diesel fuel.Tests are underway to assess the microbial populations at representative con-centration of diesel fuel. GC analysis is also being conducted to assess theamount of degradation that occurred.


Proceedings of the South Dakota Academy of Science, Vol. 75 (1996) 235
THE INVESTIGATION OF THE RATE OFDEGRADATION OF KNOWN COMPONENT
OF NUMBER 2 DIESEL FUEL BY SOUTHDAKOTA NATIVE MICROORGANISMS
Lenore M. Koczon, Virginia Laredo, and Kristi MillslagleDepartment of Mathematics and Natural Sciences
Northern State UniversityAberdeen, SD 57401
ABSTRACT
As the population continues to increase throughout the United States moredemand is being placed on the available natural resources. One of these re-sources that is being utilized to a greater extent is groundwater. As societyplaces more demands on groundwater for industrial, agricultural, and domes-tic use, the quality of groundwater has become a primary environmental con-cern. In South Dakota, contamination of wells from releases of petroleumproducts pose a real threat to this state’s supply of drinking water. Clean-upmethodologies used in South Dakota are broadly classified into physical meth-ods, chemical methods, thermal treatments, land treatment methods, and biore-mediation. The conventional treatments based on excavation of the contami-nated soil and treatment of that soil by incineration or landfilling can be quitehigh-priced. Bioremediation is proving itself a viable and cost-effective meansof cleaning up spills of organic contaminants.
This research investigated the rate of degradation of four compounds thatare known to be present in no. 2 diesel fuel: 1) two straight chains, docosane(C22H46) and octacosane (C28H58); 2) one branched chain, pristane (2, 6, 10, 14-tetramethyl-pentadecane); and 3) an aromatic compound, naphthalene. A con-sortium of microorganisms was obtained from a sample of slurry cascade be-ing used to study the degradation of no. 2 diesel fuel. The slurry was dilutedby addition of an equal volume of a non-carbon containing buffer and divid-ed into 50 mL portions. Solid samples were dissolved in hexane and a knownamount was added to each flask. Liquids were added neat. Samples were tak-en periodically for analysis by gas chromatography (GC) to determine theamount of compound that remained in each flask. From the GC data we wereable to determine the half-lives for the compounds being studied; docosane,19 days; octacosane, 33 days; pristane, 17 days; and naphthalene, 22 days.These data show the slurry microorganisms were capable of quickly degradingstraight-chain as well as branched-chain hydrocarbons and aromatic systems.In fact, pristane was degraded more rapidly than expected. The rate ofbiodegradation occurred in correlation with the molecular weight of the sub-strates.

236 Proceedings of the South Dakota Academy of Science, Vol. 75 (1996)
The number of bacterial colony forming units was also determined foreach of the experimental flasks. Bacteria were isolated and eight species iden-tified. The isolates belonged to the genus Pseudomonas with one exception,Bodetella.Degradation of no. 2 diesel fuel by Pseudomonas aeruginosa was also investi-gated. Degradation occurred, but compared to the consortium of microorgan-isms, the individual microorganism was not as efficient at degrading all of thecompounds in the diesel fuel.
Proceedings of the South Dakota Academy of Science, Vol. 75 (1996) 237
THE USE OF A MINIATURIZED MOSTPROBABLE NUMBER TECHNIQUE FOR
ASSESSING BIOREMEDIATION CAPABILITIESOF PETROLEUM CONTAMINATED SOIL
Carol Weigel, Dwayne Wilson, S. Landon-Arnold, and Lenore M. KoczonDepartment of Mathematics and Natural Sciences
Aberdeen, SD 57401
ABSTRACT
The quantitation of microorganisms in the soil is inadequate at best. Whenone desires to quantitate microbes of specific capabilities, the accuracy dimin-ishes. This study looked at a miniaturized most probably number (MPN) test,initially developed by the EPA for the determination of possible petroleum de-graders in soil. This method employs 96-well microtiter plates. To each wellwas added 75 uL of a mineral salts medium, 10uL of diesel fuel #2 (DF#2), and20 uL of a sample that had been serially diluted. Incubation was at ambientroom temperature in a moist chamber to prevent desiccation. Readings weretaken at two and then three weeks, using a microtiter plate reader (MolecularDevices). The wavelength was 405, using the ranged data program. Datarange was set with a maximum of three and a minimum of one. Standardizedplate counts were performed using Tryptic Soy Agar (Difco) and PseudomonasIsolation Agar (Difco). A comparison between the miniaturized MPN and thestandard plate count techniques was done on soil taken from a South Dakotasite contaminated with DF#2. The miniaturized MPN test proved much moreaccurate and reproducible for determining potential microbial degraders ofDF#2.
The miniaturized MPN test was then used to quantitate numbers of poten-tial degraders in soil intentionally contaminated with DF#2 in the laboratory.Soils contaminated with 0 to 250,000 ppm of DF#2 were tested with respect tograss seed germination. At the end of the 14-day experiment, the soils weretested for numbers of petroleum degraders. A correlation between number ofdegraders and grass germination was conducted.

Proceedings of the South Dakota Academy of Science, Vol. 75 (1996) 239
CLONING AND DETERMINATION OF THEEXPRESSION OF THE STRING GENE AND
ITS EFFECTS ON THE MITOTIC CYCLES OFDROSOPHILA MELANOGASTER
Patrick KlimczykBiology and Chemistry Departments
Mount Marty CollegeYankton, SD 57078
Bruce Edgar and Dara LehmanFred Hutchinson Cancer Research Center
Seattle, WA 98104
ABSTRACT
Expression of the string gene (cdc25) is required for the progression of themitotic cycle from G2 phase to M phase during early embryogenesis inDrosophila melanogaster. Accumulation of string protein activates cdc2 kinasewhich induces M phase. Maternal string gene product is present during thefirst thirteen mitotic divisions of the blastoderm embryo. In interphase of thefourteenth cycle, gastrulation takes place, maternal string protein is exhausted,and the zygotic string gene is activated after complete exhaustion of maternalstring protein. Mitotic cycles fourteen through sixteen occur asynchronouslywithin individual mitotic domains. The timing of string gene activation in eachmitotic domain differs according to tissue type. Differentiation of cells is de-pendent upon the patterning genes expressed in each mitotic domain; thesegenes control transcription of string.
The string gene and its regulatory region made up of position-specific el-ements have a total length of approximately thirty kilobases. We propose toclone the string gene and transform Drosophila melanogaster embryos to clar-ify the total region of position-specific elements required for the complete ex-pression pattern of string transcription and rescue the string mutant. Cloningtechniques involved are: ligation of thirty-kilobase string DNA into a cosmidtransformation vector, packaging of the cosmid into a E. coli bacteria by bac-teriophage, hybridization of bacterial colonies containing the string gene, andanalysis of the genes by restriction mapping.


Proceedings of the South Dakota Academy of Science, Vol. 75 (1996) 241
DETERMINATION OF CADMIUM AND LEAD INNORTHERN PIKE FROM THE MISSOURI RIVER
Jennifer Even and Shahrokh GhaffariMount Marty CollegeYankton, SD 57078
ABSTRACT
Lead and cadmium are trace metals which are extremely toxic in living or-ganisms and serve no known purpose in the body. Previous studies show thatboth elements accumulate in the body. The purpose of this study was to findorgan(s) with the greatest concentrations of these elements. In this study liv-er, gill, intestines, and kidney of five samples of Northern Pikes were analyzed.After the organs were dried and digested using nitric acid the anodic strippingvoltammetry method was employed to analyze the samples for lead and cad-mium concentrations. This method was used for its low detection limit of 10-9 to 10-10 M. However, no trace of either lead or cadmium was found in anyof the 60 samples analyzed in this study. We attribute these findings to the fol-lowing: First, Northern Pikes are not bottom dwellers, and thus would not behighly exposed to sediments that most commonly contain trace metals. Sec-ond, the temperature and time of year may also have reduced uptake and con-centration. Third, the type of industries which typically produce these con-taminants are not present in this region.


Proceedings of the South Dakota Academy of Science, Vol. 75 (1996) 243
USE OF LECTIN HISTOCHEMISTRY TO EVALUATETHE EFFECTS OF TUNICAMYCIN ON
HYMENOLEPIS DIMINUTA ADULT TAPEWORMS
E.J. Olson and M.B. HildrethDepartment of Biology and Microbiology
South Dakota State UniversityBrookings, SD 57007
J.A.OaksDepartment of Comparative Biosciences
School of Veterinary MedicineUniversity of Wisconsin
Madison, WI 53706
ABSTRACT
The rat tapeworm, Hymenolepis diminuta, has become the laboratorymodel of choice for physiological studies involving adult tapeworms becauseits life-cycle is easily maintained in the laboratory. The surface of tapewormsis lined by an epithelial, syncytial tegument composed of a single, distal sheetof cytoplasm that completely encompasses each worm. The function of thetegumental surface plasma membrane is analogous to surface membranes ofintestinal enterocytes because both are responsible for absorbing nutrientswhile also resisting various intestinal proteinases and lipases. An external lay-er of complex carbohydrates (the glycocalyx) is thought to provide at leastsome protection to this membrane. The protective role of these sugars couldbe evaluated by eliminating these sugars from the membrane and then evalu-ating the ability of these worms to resist the intestinal enzymes. TunicamycinTM
inhibits the glycosylation of many N-linked glycoproteins in a variety of animalcells, and has been used to produce sugarless membranes in a few cell sys-tems. Radioactive-galactose studies suggest that TM has similar effects in H.diminuta. Lectin histochemistry has been used to identify various complexcarbohydrates associated with cells and tissues, and therefore might be usefulfor monitoring the effect of TM on the glycocalyx of H. diminuta. The pur-pose of this study was to use lectin histochemistry to compare the distributionof complex carbohydrates amongst mature proglottids of TM-treated H. dimin-uta to that of untreated proglottids. For this study, 10 day-old H. diminutawere incubated for varying time-periods (i.e. 30 min, 1 hr, 2 hrs, 4 hrs or 6 hrs)in RPMI-1640 culture media with or without 10µg/ml TM. The worms werethen fixed either in 4% neutral-buffered-formalin or in neutral-buffered-3%paraformaldehyde-0.5% glutaraldehyde. Formalin-fix worms were then em-bedded in either paraffin or glycol methacralate (JB-4; Polysciences Inc.).Worms fixed in paraformaldehyde-glutaraldehyde were embedded in a mixtureof epon and araldite. Paraffin sections (6 µm thick) were incubated in Pro-par

244 Proceedings of the South Dakota Academy of Science, Vol. 75 (1996)
clearant (Anatech, LTD), hydrated in an ethanol series ending in phosphatebuffered saline (PBS) and incubated in the various lectins (at 50 µg/ml) for atleast 1 hour. Epon-araldite sections (1 µm thick) were treated similarly exceptthat only some of the plastic was removed (in sodium methoxide), and incu-bations in lectin were for 24 hours. The JB-4 sections (2 µm thick) were di-rectly incubated in lectins (at 100 µg/ml). Lectins evaluated included con-canavalin A (Con A), wheat germ agglutinin, soybean agglutinin and peanutagglutinin. After the lectin incubation, sections were washed in PBS, and cov-er-slips mounted (Vetashield; Vetor Lab. Inc.). Sections were observed with anOlympus fluorescent microscope. Binding to the tegumental membrane wasmost easily observed in paraffin-sectioned material; however, binding to vesi-cles in the distal cytoplasm (representing future membranes) were only ob-served in the JB-4 and epon-araldite sections. All but PNA bound to the sur-face glycocalyx of H. diminuta, and all but Con-A bound to the tegumentalvesicles. The surface glycocalyx and vesicles form tunicamycin-treated proglot-tids appeared to bind the four lectins in a manner similar to the untreatedworms. Therefore, incubation of the worms in TM for up to 6 hours could notbe used to produce worms with a diminished glycocalyx.

Proceedings of the South Dakota Academy of Science, Vol. 75 (1996) 245
AGOUTI GENE TRANSCRIPTION INWILD-TYPE AND MUTANT MICE
S.M.K. Andersen, C.A. Westby, R.R.R. Rowland, and N.H. GranholmDepartment of Biology/Microbiology
South Dakota State UniversityBrookings, SD 57007.
ABSTRACT
The agouti gene directs cyclic deposition of black (eumelanin) and yellow(phaeomelanin) pigments in coats of wild-type (AwJ/AwJ) mice. Specific mu-tations in the agouti gene restrict pigment synthesis to eumelanin andphaeomelanin, exclusively. Phaeomelanogenic (Ay/a) mutants exhibit dramat-ic physiological abnormalities, although they differ from wild-type mice by on-ly a single Ay allele. These defects are thought to result from dysregulatedagouti gene expression. The goal of this work was to correlate agouti genetranscription to phaeomelanogenic and pathogenic phenotypes. Northern hy-bridization and in situ hybridization (ISH) were used to determine temporaland spatial transcription patterns in wild-type and mutant mice. Data demon-strated that transcript levels peaked on day 6 of the agouti hairgrowth cycle,just as phaeomelanogenesis began, and remained elevated through the last dayof the yellow phase. Follicular transcripts detected by ISH were 3.8 times morenumerous (P<0.01) during the yellow phase (day 6) than during the blackphase (day 4). Computerized densitometry, used to analyze developmentalNorthern blots for the presence of agouti transcripts, demonstrated expressiononly in yellow-phase agouti follicular RNA. Transcript levels in black follicleswere indistinguishable from background, while in yellow follicles expressionwas continuous. Less expression was observed in yellow follicles than in de-velopmentally matched agouti follicles. These data correlated agouti tran-scription to phaeomelanogenesis. The spatial transcription pattern also dif-fered between yellow and wild-type mice. Northern analysis detected tran-scripts in adipose, brain, kidney, liver, lung, and spleen tissues of yellow micebut transcripts were restricted to hair follicle tissue in wild-type mice, suggest-ing a correlation between Ay expression and systemic defects. Study support-ed by research funds of RRRR, CAW, and NHG.


Proceedings of the South Dakota Academy of Science, Vol. 75 (1996) 247
EFFECTS OF AGOUTI EXPRESSIONON GAMMA-GLUTAMYLTRANSPEPTIDASE
ACTIVITY IN MICE
J. Brunz, R.N. Reese, and N.H. GranholmDepartment of Biology/Microbiology
South Dakota State UniversityBrookings, SD 57007
ABSTRACT
Alleles of the agouti locus regulate pigmentation in follicular melanocytesof the mouse. Agouti protein (AP) expression in the wild-type mouse(AwJ/AwJ) correlates with a switch from black pigment (eumelanin) to yellowpigment (phaeomelanin). Ectopic overexpression of AP in the lethal yellowmouse (Ay/a) leads to an intense yellow coat as well as the lethal yellow syn-drome (LYS). Agouti protein may modulate pigmentation by influencing thiolconcentrations within the hair follicle. Thiol concentrations appear to controlthe conversion of dopaquinone to phaeomelanin in hair follicle melanocytes.Previous studies have demonstrated that AP expression correlates with an in-crease in cysteine and a decrease in GSH levels within the hair follicle.
This study proposes that the agouti gene regulates thiol concentrationswithin the hair follicle (and therefore the type of pigment made) by modulat-ing the activity of gamma-glutamyl- transpeptidase (GGT). GGT is an enzymethat catalyzes the first of two reactions which lead to the breakdown of GSHand release of cysteine. Using a modification of the colorimetric method of Ja-cobs (Clin. Chem. Acta. 31:175, 1971), GGT was measured in regenerating hairfollicles of nonagouti black (a/a), white-bellied agouti (AwJ/AwJ), and lethalyellow mice (Ay/a) mice on days 6, 9, and 12 of the hair growth cycle. We at-tempted to correlate increased cysteine levels (previously measured) with anincrease in GGT activity.
Cysteine levels have been shown to peak on days 9-11 of the hair growthcycle in all three genotypes and display a hierarchy of yellow>agouti>black(Granholm et al. J Invest Dermatol 106:559, 1996). Results of this study failedto show any differences in GGT activity between genotypes on day 9 when re-sults were expressed on a per protein basis. When activity was expressed asunits of activity/mg sample, however, GGT in the agouti (LS Mean = 2.42) wasseen to be elevated over that of the yellow and black mice (LS Means = 1.27& 1.52, respectively). GGT activity may reflect a short intense demand for cys-teine during the relatively brief period of yellow pigment production in theagouti mouse. In addition, GGT activity was seen to increase slightly in bothyellow and agouti mice between days 6 and 12, confirming the findings of oth-ers that GGT activity is a marker of hair growth induction. The results of thisstudy do not lend strong support to the hypothesis that agouti protein influ-ences thiol metabolism in the hair follicle by directly modulating the activity of

248 Proceedings of the South Dakota Academy of Science, Vol. 75 (1996)
the enzyme GGT. These results lead to the speculation that agouti protein maybe influencing cysteine concentrations within the hair follicle by modulatingactivity levels of a dipeptidase which catalyzes the cleavage of GSH-derivedcysteinyl-glycine. Study funded by SDSU-AES-HD089, Eagles’ Ehrmann CancerFund, and NIH (AR42757).

Proceedings of the South Dakota Academy of Science, Vol. 75 (1996) 249
IDENTIFICATION AND CHARACTERIZATIONOF THE AGOUTI GENE IN LIVESTOCK
M.D. Johansen, R.R.R. Rowland, and N.H. GranholmDepartment of Biology/Microbiology
South Dakota State UniversityBrookings, SD 57007
ABSTRACT
The agouti gene has been identified in humans and mice. The primaryrole of the agouti gene in mice is to produce black and/or yellow pigment. Inthe mutant yellow mouse (Ay/a), the gene is overexpressed and results in thelethal yellow syndrome, a collection of defects which includes obesity, dia-betes, infertility, cancer, and immune deficiencies. The objective of this studywas to confirm that livestock possess an agouti gene and to characterize thatgene.
The cattle genomic DNA was isolated and prepared from liver cells. Weused Southern Blot hybridization to identify an agouti gene in cattle by hy-bridizing cattle genomic DNA that was cut by various restriction enzymes tomouse agouti cDNA containing the coding region of the gene (exons 2-4).Polymerase chain reaction (PCR) was used to amplify part of the coding of theagouti gene for sequencing. Primers for PCR were designed to complementthe 5’ and 3’ ends of exon 2.
Southern blot hybridizations indicate that cattle have an agouti gene. PCRresults indicate that a region approximately the same size as the human agoutiexon 2 has been amplified. We speculate this could be cattle agouti exon 2.These data provide preliminary evidence that an agouti gene is present in cat-tle. This information could ultimately have a significant impact on overallhealth, growth rate, feed efficiency, and other production traits of cattle. Fund-ed by SDSUAES-HD089, Eagles’ Ehrmann Cancer Fund, and NIH (AR42757)