procedures for updating weather databases and the … experiment station • cooperative extension...
TRANSCRIPT

To find more resources for your business, home, or family, visit the College of Agriculture and Home Economics on the World Wide Web at www.cahe.nmsu.edu
Procedures for Updating Weather Databases and the Weather Data Website on the NMSU Corona Range and Livestock Research Center Technical Report 46L. Allen Torell, Kirk C. McDaniel, Shad Cox, Suman Majumdar1
Agricultural Experiment Station • Cooperative Extension Service • College of Agriculture and Home Economics
INtRoDUCtIoNThis technical report describes the procedures required to update and maintain weathHa that is collected on the Corona Range and Livestock Research Center (CRLRC). The intended audience for this report is professional and research staff who will download and update Corona Ranch weather data in the future. It is also a reminder to the authors about the process and steps that were used to update and maintain the weather databases. The directions assume use of Office 2003 Excel and Access applications. It is further assumed that the reader knows how data are stored and queried in both Access and Excel and that the file being described is open and the user is following along with the direc-tions. Experience with pivot tables and pivot charts is also useful.
Corona Weather data are stored in two Access data-bases and in numerous spreadsheets that are linked to these databases. One database is maintained for weather data collected by the South House (SH) and Oil Well (OW) data loggers and recorders. The second data-base is for the Natural Resources Conservation Service (NRCS) Soil Climate Analysis Network (SCAN) site located on the Corona Ranch and referred to as the Adams Site (http://www.wcc.nrcs.usda.gov/scan/site.pl?sitenum=2015&state=nm). Data from these sites are stored and available on the NMSU Agricultural Eco-nomics Website (http://agecon.nmsu.edu/corona). As a person responsible for updating the files you will need to map a network drive to the Agricultural Economics server at \\agesvr1\agepages\Corona. To obtain a user-name and password for the server, contact Dr. Allen Torell at [email protected]. The Corona weather web-page is stored in this root directory. Data files are stored in the folder called Datafiles.
INtRoDUCtIoN HoW to UPDate SoUtH HoUSe (SH) aND oIL Weather data for the SH and OW sites were download-ed and recorded in separate spreadsheet files over earlier periods by Dr. Kirk C. McDaniel and his students. Data are now recorded in a similar way by professional staff stationed at the Corona Ranch. Annual spreadsheet files are maintained on the Agricultural Economics Corona Weather web server. Annual data are loaded into an Ac-cess database called “Corona_SH_and_OW_Weather_Data.mdb.”
DoWNLoaDINg Data fRoM tHe oW aND SH CR-10 ReCoRDeRSThe weather stations located at the Oil Well (designated as 201 in the database) and South House (101) sites are manually downloaded periodically throughout the year. The station data loggers record data on a limited-memory hard drive that can store 78 days of data. When data loggers are full, the oldest data are overwritten with newer data and the old data are lost forever. Attention to timely downloads is a must to keep a full and accu-rate weather record for each site. A two-month (60-day) schedule for downloads is probably the most convenient and manageable. The storage module (SM 192), along with the keyboard display (CR10KD) is utilized for downloading and transporting data from the field to the office for permanent download and storage. Further mention of the storage module collectively includes stor-age module (SM 192) and keyboard display (CR10KD) as a combined unit. Again, this storage module has limited capacity and can only store approximately 280 days of data (140 days from each site). When the storage module is full it will not allow any further data down-
1Respectively, Professor, Department of Agricultural Economics and Agricultural Business; Professor, Department of Animal and Range Sciences; Superintendent, Corona Range and Livestock Research Center, and former Graduate Research Assistant, Department of Agricultural Economics and Agricultural Business, all of New Mexico State University, Las Cruces.

Technical Report 46 • Page 2
load and will not erase any stored data. Periodically, the storage module will need to be erased to allow further downloads. A rule of thumb has been to erase the stor-age module every other download sequence after cur-rent data are downloaded correctly. Directions for eras-ing the storage module are addressed in the later section describing use of the PC208W interface program.
Using the Storage Module for Station DownloadPlug the storage module 9-pin male serial cable plug into the weather station data logger 9-pin female serial receptacle (there is only one located on the data logger unit facing you). At this time you should see activity on the storage module display. The following keystrokes and explanation will complete the download task:
Directions for downloading only data recorded from last download:
Key Strokes Explanation
* 8 Start manual dump to storage module (Display should be 01:)
71A Advance
A Advance; shows start location of new data (Display should be 03:)
A Advance; shows ending location of new data (Display should be 04:)
1A Dump data; Advance; download is complete when numbers stop changing
It may be necessary to download all the data from the data logger, and the following directions will download all data:
Key Strokes Explanation
* 7 Displays current location of data on hard drive (Display should be 07: and 4 or 5 digits; disregard decimal with 4 digits). Write this pointer location number down.
* 8 Start manual dump (Display should be 01:) to storage module; Advance
71A Key in the 4- or 5-digit pointer location number plus 1 (e.g., if pointer location number was 13569, key in 13570)
A Advance; shows start location of new data (Display should be 03:)
A Advance; shows ending location of new data (Display should be 04:)
1A Dump data; Advance; download is complete when numbers stop changin
Using the PC208W Software Interface for Storage Module DownloadOnce all the data have been downloaded to the storage module it can be taken to the office for downloading to a PC. To connect the storage module to a PC it is nec-essary to connect, through the 9-pin peripheral, to the RS232 interface (SC532) and then connect the SC532 to the serial port of the PC with a 25-pin to 9-pin se-rial interface card. Make sure the SC532 is plugged into a 120v outlet for power. At this point the keyboard display will light up all LEDs. Open the PC208W program on the computer, which will open as an inde-pendent tool bar at the top of the screen. Click on the Stg_Module button to open the storage module utility. Click on the Connect tab located at the lower right of the window. After a few moments the Connect tab will change to Disconnect; at this point the storage module is in communication with the storage module utility. If this is the first time using the utility with this PC you will need to click the File Naming Options button to direct the utility to save the data in the appropriate folder on the PC. Once this has been set it will always save the new file by advancing the file name one number and saving it to the selected folder. Separate data logger downloads will be saved as individual files. To download the data from the storage module you need to click the Get New button at the left of the window and wait for data to download. Download status is indicated at the lower right hand side of the window.
Erasing the storage module is accomplished using the above utility as well. Click the Erase tab at the bot-tom left-hand corner of the window. Be sure to click the Erase Data button and not any of the other buttons. Clicking the Erase Data button will ensure that the stor-age module programming is restored after the data are erased. Press the Disconnect button after the task has been completed. Station raw hourly data are now filed in the folder chosen and ready for upload to the data-base as discussed next.
Updating the DatabaseIf all goes well and the CR-10 recorder functioned prop-erly with no skips in data recordings over the period, hourly data are added to the table called “Summary” in the Access database file called “Corona_SH_and_OW_Weather_Data.mdb” (located at http://agecon.nmsu.edu/corona/). This section describes how to add the data to the Access database. The “Summary” table is the main table of the database and it contains hourly data with 20 data columns as described below. Variables in-cluded in the table are:

Technical Report 46 • Page 3
1. SITE: Code name of site (101) for South House and 201 for Oil Well)
2. SITENAME: Name of site (SH South House and OW for Oil Well)
3. YEAR: Four-digit year number (e.g., 2003)
4. MONTH: Serial number for the months of a year (e.g., 6 for June)
5. WEEK: Serial number for the week of the year (e.g., 45 for 11/1/2005)
6. DAY: Serial number for the day of the year (e.g., 305 for 11/1/2005)
7. HOUR: Serial number for the hour of the day (e.g., 1300 for 1:00 p.m. and 2400 for 12 a.m.)
8. DATE/TIME: Date and time of a particular day (e.g., 10/30/2005 8:00 p.m.)
9. ATEMP: Air temperature (oC)
10. STEMP1: Soil temperature (oC) at 10 cm
11. STEMP2: Soil temperature (oC) at 50 cm
12. RH: Relative humidity
13. WS: Wind speed (meter/second)
14. WD: Wind direction (degrees on the compass)
15. VOLT: Voltage on system
16. RAIN: Rainfall (mm)
17. Extra1: This column actually contains nothing. Users should ignore this column.
18. Extra2: This column actually contains nothing. Users should ignore this column.
19. SMOIS1: Soil moisture at 10 cm
20. SMOIS2: Soil moisture between 10 cm and 30 cm
For the convenience of database users a Welcome screen (Figure 1) with buttons to open different tables and queries and to add new hourly or daily data has been built into the MS Access database. From this screen a user can browse various parts of the database with a mouse click. Data are easily viewed from the Welcome screen, but the knowledgeable user can mini-mize or close this screen to view other tables and que-ries. If the Welcome screen is closed the screen can be activated by opening the form called Welcome. The user can also view the data by opening the following queries or other queries.
•Hourlydata–Open“Query_Combined_Daily”
•Dailydata–Open“Query_All_Data”•Monthlydata–Open“Monthly_Sum-
mary_Query”
The knowledgeable user can set criteria in these que-ries to provide different views of the data. Care must be taken to remove any temporary queries that you may define for a particular analysis.
adding New Hourly Data to the Weather Database 1. Open Excel and select File, then Open from the top
menu.
2. Navigate to where the CR-10 data file is located and select All Files in the Files of Type section.
3. Choose the Delimited option in the Text Import Wizard, and using Comma as the separator retrieve the data from the data logger file into Excel.
Figure 1. Welcome Screen for SH and OW weather database.

Technical Report 46 • Page 4
4. Delete columns M and N, as they are not needed.
5. Click on the header of column B and insert a blank column. If column A is “101” add “SH” down the inserted column, and if column A is “201” add “OW” to the corresponding cells in this new col-umn. You are adding a column with the abbrevia-tions for the research site.
6. Column C is now YEAR. Click on Column D and insert two blank columns.
7. Column H is now ATEMP. Click on column H and insert a blank column. In cell H1 type the formula “=DATE (C1, 1, F1) +TIME (G1/100, 0, 0)” and copy it down. Format this column with a date and time format (e.g., 3/14/01 1:30 p.m.). Verify that the correct date and time are displayed.
8. In cell D1 type the formula “=MONTH (H1)” and copy it down.
9. In cell E1 type the formula “=WEEKNUM (H1,2)” and copy it down. If this formula does not work go to the Tools menu, then Add-Ins and turn on the “Analysis ToolPak.”
10. AtcolumnQ,whichshouldnowbeSMOIS1,insert two blank columns. The spreadsheet should now include data through column T and be orga-nized into 20 columns of data as described earlier. Minimize this file.
11. Open the spreadsheet file called “Add hourly data to this table.xls.” This spreadsheet has the required headings, and Access macros link to this file to im-port data from it. The file is currently available on the NMSU Ag Econ server.
12. In “Add hourly data to this table.xls” delete all the data (except the column headings) on the sheet titled “Insert Data Here.” From left to right, the columns should be SITE, SITENAME, YEAR, MONTH, WEEK, DAY, HOUR, DATE/TIME, ATEMP, STEMP1, STEMP2, RH, WS, WD, VOLT, RAIN, Extra1, Extra2, SMOIS1, and SMOIS2.
13. Paste the data from the temporary spreadsheet file
you built with all cells pasted as values. Verify that all columns match and are in the right order.
14. Check the data for errors. The recorders will record a number like 6999, -6999, 9999, or -9999 when an error occurred. You will need to fix or delete these errors. This is most easily done by selecting Data, then Filter, and then Autofilter from the menu at the top.
15. Now, select all of the data including the column headings. In the menu bar go to Insert, then Name, and then Define. A dialog box with caption Define Name will pop up. Type “Import” in the space given just below Names in workbook in the dialog box. Then click on OK at the right-hand side of the dialog box. This provides a named range called “Im-port” for the data imported into Access. This named range should be defined to include all of your im-ported data from cell A1 to the last data entry in column T.
16. Save and close the spreadsheet file after writing down the date and time of the first data entry.
17. Open the OW and SH Weather Database. Move tothequerycalled“Query_All_Data,”and—forthesiteyouareimportingdatafor—looktoseewhat day and hour were the last time data were pre-viously entered into the database. Go back to the spreadsheet you are about to import data from and, after verifying the similarity of data for the overlap days, delete any rows that would result in duplicate rows.
18. In the Welcome screen click on Add Hourly Data (Figure 1). Macros must be enabled. As you pro-ceed, a message box will pop up warning about add-ing data properly to the Excel file. If you have done the previous steps properly then click Next. Read the instructions carefully and click Continue. Select the link called ImportH with your mouse. Note that the mouse pointer will likely look busy at this point, but proceed anyway. Move and link up to the Excel file called “Add hourly data to this table.xls.” Click OK to refresh the links. Microsoft Access will confirm a successful refresh. Click OK again on the dialog box that pops up and then click Close on the Linked Table Manager.
19. A macro is executed that transfers the data from the spreadsheet called “Add hourly data here.xls” to the bottom of the Access table called “Summary.” A message box will pop up confirming successful transfer. Click on OK in the message box. Open the

Technical Report 46 • Page 5
table called “Summary” and verify the data were imported correctly.
20. You are not done yet. You must update the daily tables whereby additional queries are executed to compute and merge the new data to daily averages.
21. To update the daily data tables and queries with the new data, click on the Add Daily Data button on the Welcome screen (Figure 1) and follow the direc-tions (detailed next).
adding New Daily Data to the Weather DatabaseIn some cases, hourly data were not available and daily weather recordings were used from other weather sta-tions at or near the Corona Ranch. Daily data were used to define weather variables from September 1989 until October 1990 when the weather stations at the study sites became operational. Nearby NOAA data were pri-marily used to define weather conditions during these early years. The amount of rainfall was usually the only useful data recorded in the daily data file. The last two columnsinthequerycalled“Query_All_Data”indicatewhether data have been replaced from another source and what this source was. If you replace hourly or daily data from a different source you should check and add data for these two columns.
1. To add daily data to the database, open the Excel file “Add daily data to this table.xls.” that is on the \\agesvr1\agepages\Corona server. The data are stored on Sheet1. Descriptions of variables are given on Sheet2. Data for many of these variables were not available or were not recorded on a daily basis. However, the variable names are needed as place-holders and for proper merging with the hourly data once it is tabulated to a daily time step.
2. It is important that you do not delete any of the existing data from the spreadsheet file. Instead, add new data to the end of appropriate columns. Enter “1” under the column “Count” (column AF) for each entry, indicating that one daily value is being recorded.
3. Once the data are entered you must redefine the length of the range name that will be exported to Access. To do this, select all of the data (old plus new Columns A through AF) including the column headings. In the menu bar go to Insert, then Name, and then Define. A dialog box with caption Define
Name will pop up. Type “Import” in the space given just below where it says Names in workbook in the dialog box. Then click OK at the right-hand side of the dialog box. Save the spreadsheet file.
4. The next step is to import and link the daily data to the Access database. To do this, open the Weather Database. In the Welcome screen (Figure 1) click on Queriesandthenclickon“Query_All_Data.”Thehourly data query will open. Now, go to View in the Access menu bar and click on Design View. Make sure that no criterion is set for the hourly data que-ry. Close the query and exit back to the Welcome screen.
5. In the Welcome screen click on Add Daily Data. Read the instructions carefully and click Continue. The Linked Table Manager will open. Select the check box to the left of Import. Note that the mouse pointer may look busy at this point, but proceed anyway. Click OK to refresh the links. Microsoft Access will eventually confirm a successful refresh. Click OK again in the dialog box that pops up and then click Close on the Linked Table Manager. This refreshes the interactive link with the daily data table that is stored in Excel. This will execute a macro called Add Daily Data that first deletes the existing “Dailydata” table and recreates a blank table with the same name and headings, and then adds to this the imported daily data and tabulations of daily values calculated from the hourly data in the database. Two sources of data are merged: the Excel table called “Import” that includes the spreadsheet data and the Access query called “Daily_Averages”. Two append queries are executed for this purpose, “Append1” and “Append2,” stored in the Queries section of the Access database. A message box will pop up confirming the successful addition of data.
6. Because averages are computed from hourly values it is important that any updated hourly data be entered before updating the daily data. It is also important that this daily data query is executed after updating the hourly data.
How to Update Monthly adams Site DataData for the Adams SCAN site is downloaded and retrievable within a day of recording, but it is best to update the data at the end of each month. Ac-cumulated data can be downloaded at the end of the month as a columnar text file from the website

Technical Report 46 • Page 6
located at http://www.wcc.nrcs.usda.gov/scan/site.pl?sitenum=2015&state=nm. The variables included in the text file are described at the Adams website as “Sen-sor Label Descriptions.” Excel macros are used to con-sistently and accurately break the data into columns and add the data to the Access database maintained at the Corona Ranch website. The data are stored in separate spreadsheets for each year (November through October) in comma separated value (CSV) format. The annual CSV files are then merged together to create the Access database. The basic steps required to update the Adams site weather data are to download the text file from the Adams SCAN site and arrange the data into the same format and columns used in the Access database.
foRMattINg aDaMS SIte Data IN exCeL 1. Historical data files for updating Adams site weather
data are located on the NMSU Ag. Econ. Web Server (\\agesvr1\agepages\Corona)
2. Go to the Adams weather SCAN site at http://www.wcc.nrcs.usda.gov/scan/site.pl?sitenum=2015&state=nm.
3. Follow the link “TK Formatted Historical Files for
this Site (FTP Server)” to the correct annual folder and download the appropriate month’s data file to your computer by right clicking on the TEXT file (“2015_200708.txt” as an example) located at the SCAN site and selecting Save Target As….
4. Open the spreadsheet file called “Adams_Site_Data_Template.xls” (this file is stored on the Ag. Econ. Web Server at \\agesvr1\agepages\Corona).
a. Enable the macros that are included in this spreadsheet program.
b. Look at the data that are stored in this spread-sheet on Sheet1 to become familiar with how the data should look when done.
c. Sheet1 of the “Adams_Site_Data_Template.xls” spreadsheet must initially be set correctly by erasing all the data that was previously stored on the sheet and by deleting the columns labeled Date. The required steps have been automated by pressing the macro button on Sheet2 labeled Clear Sheet1.
d. Leave this file open, as you will run the macros included, but in another file described next. Minimize “Adams_Site_Data_Template.xls.”
5. Right-click on the text file that you downloaded (“2015_200708.txt” as an example) and select Open With and then Excel. The data need to come into Excel so that all data are in column A as a single text string. You can also bring the data into Excel correctly by opening the text file with Excel, and when it tries to convert the text to columns select Delimited and then specify no option for the delim-iter. The text will appear as a jumbled mess. Both spreadsheets, the one with the new data and “Ad-ams_Site_Data_Template.xls,” should be open in the same session.
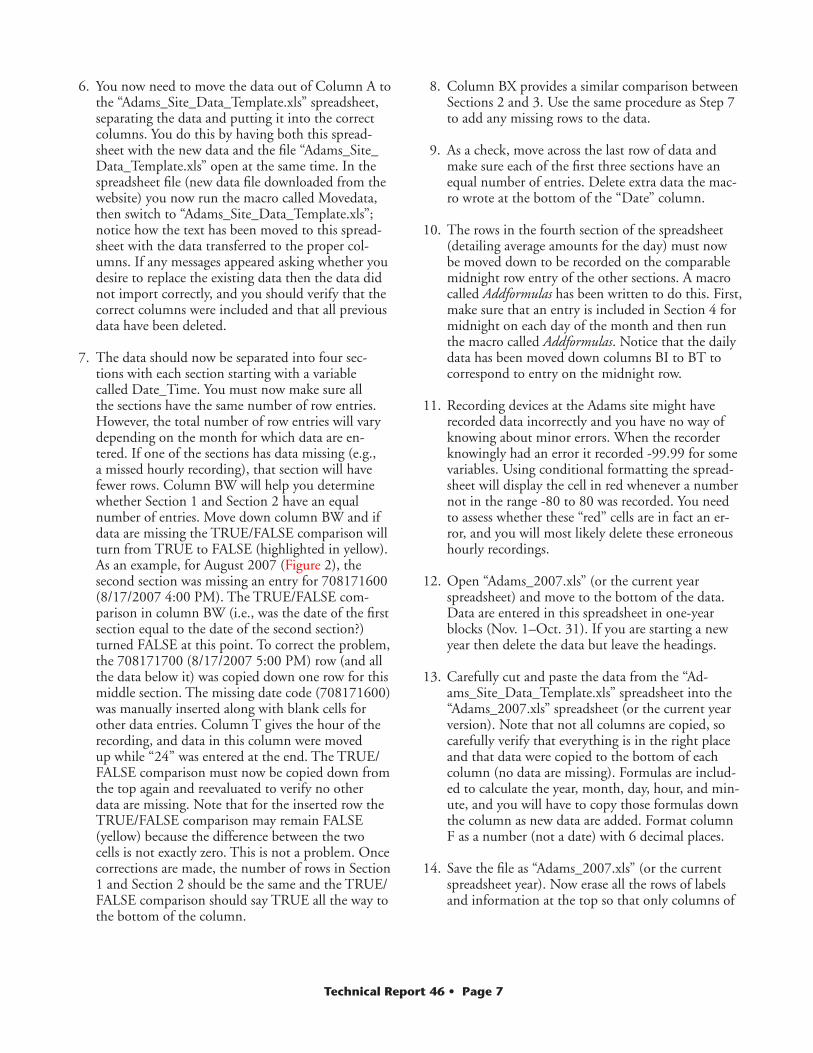
Figure 2. An example of correcting missing data.
Technical Report 46 • Page 7
6. You now need to move the data out of Column A to the “Adams_Site_Data_Template.xls” spreadsheet, separating the data and putting it into the correct columns. You do this by having both this spread-sheet with the new data and the file “Adams_Site_Data_Template.xls” open at the same time. In the spreadsheet file (new data file downloaded from the website) you now run the macro called Movedata, then switch to “Adams_Site_Data_Template.xls”; notice how the text has been moved to this spread-sheet with the data transferred to the proper col-umns. If any messages appeared asking whether you desire to replace the existing data then the data did not import correctly, and you should verify that the correct columns were included and that all previous data have been deleted.
7. The data should now be separated into four sec-tions with each section starting with a variable called Date_Time. You must now make sure all the sections have the same number of row entries. However, the total number of row entries will vary depending on the month for which data are en-tered. If one of the sections has data missing (e.g., a missed hourly recording), that section will have fewer rows. Column BW will help you determine whether Section 1 and Section 2 have an equal number of entries. Move down column BW and if data are missing the TRUE/FALSE comparison will turn from TRUE to FALSE (highlighted in yellow). As an example, for August 2007 (Figure 2), the second section was missing an entry for 708171600 (8/17/2007 4:00 PM). The TRUE/FALSE com-parison in column BW (i.e., was the date of the first section equal to the date of the second section?) turned FALSE at this point. To correct the problem, the 708171700 (8/17/2007 5:00 PM) row (and all the data below it) was copied down one row for this middle section. The missing date code (708171600) was manually inserted along with blank cells for other data entries. Column T gives the hour of the recording, and data in this column were moved up while “24” was entered at the end. The TRUE/FALSE comparison must now be copied down from the top again and reevaluated to verify no other data are missing. Note that for the inserted row the TRUE/FALSE comparison may remain FALSE (yellow) because the difference between the two cells is not exactly zero. This is not a problem. Once corrections are made, the number of rows in Section 1 and Section 2 should be the same and the TRUE/FALSE comparison should say TRUE all the way to the bottom of the column.
8. Column BX provides a similar comparison between Sections 2 and 3. Use the same procedure as Step 7 to add any missing rows to the data.
9. As a check, move across the last row of data and make sure each of the first three sections have an equal number of entries. Delete extra data the mac-ro wrote at the bottom of the “Date” column.
10. The rows in the fourth section of the spreadsheet
(detailing average amounts for the day) must now be moved down to be recorded on the comparable midnight row entry of the other sections. A macro called Addformulas has been written to do this. First, make sure that an entry is included in Section 4 for midnight on each day of the month and then run the macro called Addformulas. Notice that the daily data has been moved down columns BI to BT to correspond to entry on the midnight row.
11. Recording devices at the Adams site might have recorded data incorrectly and you have no way of knowing about minor errors. When the recorder knowingly had an error it recorded -99.99 for some variables. Using conditional formatting the spread-sheet will display the cell in red whenever a number not in the range -80 to 80 was recorded. You need to assess whether these “red” cells are in fact an er-ror, and you will most likely delete these erroneous hourly recordings.
12. Open “Adams_2007.xls” (or the current year spreadsheet) and move to the bottom of the data. Data are entered in this spreadsheet in one-year blocks(Nov.1–Oct.31).Ifyouarestartinganewyear then delete the data but leave the headings.
13. Carefully cut and paste the data from the “Ad-ams_Site_Data_Template.xls” spreadsheet into the “Adams_2007.xls” spreadsheet (or the current year version). Note that not all columns are copied, so carefully verify that everything is in the right place and that data were copied to the bottom of each column (no data are missing). Formulas are includ-ed to calculate the year, month, day, hour, and min-ute, and you will have to copy those formulas down the column as new data are added. Format column F as a number (not a date) with 6 decimal places.
14. Save the file as “Adams_2007.xls” (or the current spreadsheet year). Now erase all the rows of labels and information at the top so that only columns of

Technical Report 46 • Page 8
data are saved. This includes deleting the row with variable names. Re-save the file as “Adams_2007R.csv” (in CSV format).
15. Spreadsheet CSV files for multiple years are com-bined next using the “MERGE.bat” file. Run the “MERGE.bat” file to combine the multiple years of data to a file called “Hourly_data.txt.” If you add another year (spreadsheet) you will have to alter the code of “Merge.bat.” To run the batch file, click on the Windows Start menu, then click Run and enter “CMD” into the box. This brings up a DOS ses-sion. From the DOS prompt, navigate to the direc-tory where “MERGE.bat” is saved. To navigate in DOS, type “cd\directoryname\subdirectoryname” (note: you must start at the C:\ prompt); for exam-ple, the whole command might be “cd\Documents and Settings\Documents\Adams Site,” depending on where you have stored the “MERGE.bat” file on your computer. Once you have navigated to the correct directory, type “MERGE.bat” at the DOS prompt. This merges all the years of data to a text file called “Hourly_data.txt.”
Updating the Database16. Open the Adams Site Access database and right-
click on the Table called “Hourly_data” and update the link using link manager with the right mouse button. Point to (link to) the “Hourly_data.txt” file you just created and update the link.
17. Open the Table called “Hourly_data” and move to the bottom. If there are blank lines at the bottom of the table this is because there are blank lines at the bottom of the spreadsheet. If this is the case, you need to go back to the CSV file and delete those blank lines by hitting delete after selecting those rows at the left spreadsheet margin. If there are no blank lines, verify that the other data imported cor-rectly.
18. With the imported, updated and combined data, the tables in the Adams Site database are totally rebuilt. So, delete the Table called “Combined_Hourly.”
19. Right-click on “Combined_Hourly_template” and copy it as “Combined_Hourly.”a. Why? The data type is wrong in “Hourly_data”
as read from the spreadsheet and we must rede-fine the data types so they are as defined in the table called “Combined_Hourly.”
b. Run the query called “Append1” to append the data to “Combined_Hourly.”
20. Verify your success by opening the Adams Site da-tabase and ensuring that all data was imported and combined properly.
21. Reduce the size of the Access database file by select-ing from the Access menu Tools, then Database Utilities, and then Compact and Repair.
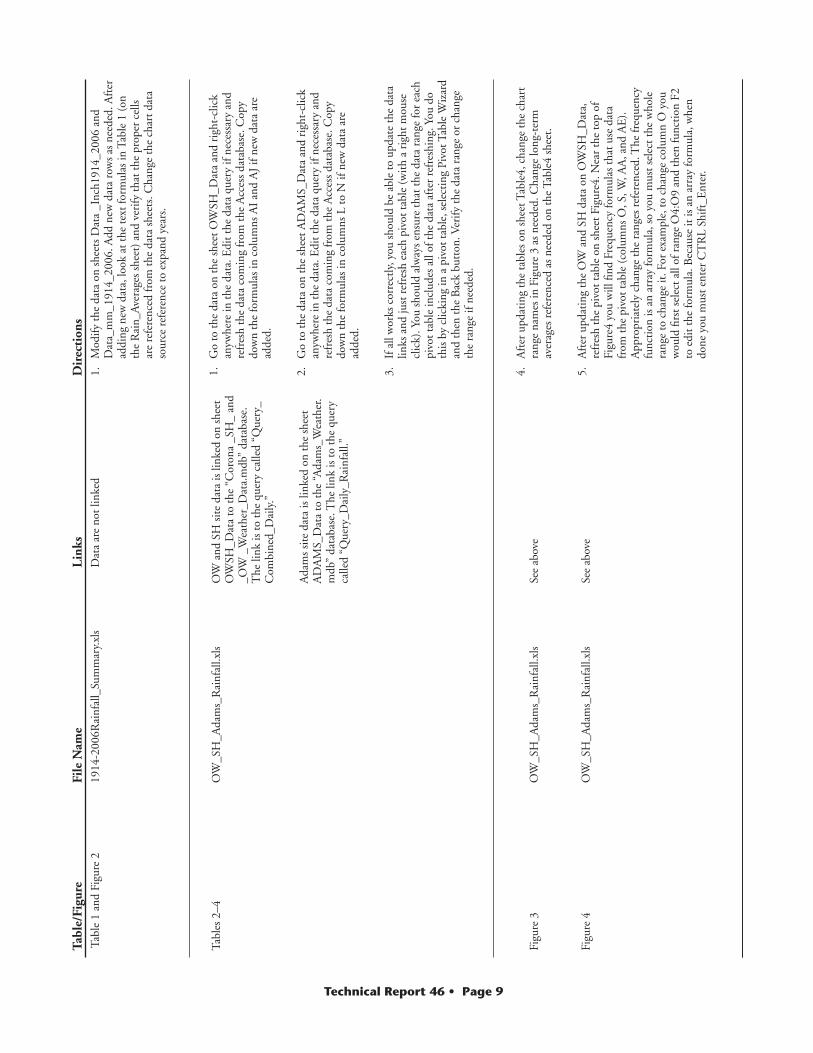
HoW to UPDate ReSeaRCH RePoRt taBLeS aND CHaRtSResearch Report 761 includes various charts and tables. These data are linked to the two Access databases and can be updated relatively easily. The following directions for the update are provided (Table 1). Before you start, save an unaltered backup of each file. For each table and chart, the location and linkage of the data are described, along with the process that would be followed to update the spreadsheet table or chart.
Once the Access databases and Excel spreadsheets are updated, the outside user can only access the data from the Zip files stored in the Datafiles directory on the server. You will need to drag the appropriate Excel and Database program file to the appropriate Zip file to complete the update and make the data available to the user via the web.
Technical Report 46 • Page 9
Tabl
e/Fi
gure
Fi
le N
ame
L
inks
Tab
le 1
and
Fig
ure
2 19
14-2
006R
ainf
all_
Sum
mar
y.xl
s
Dat
a ar
e no
t lin
ked
Tabl
es2
–4
OW
_SH
_Ada
ms_
Rai
nfal
l.xls
OW
and
SH
sit
eda
tais
link
edo
nsh
eet
OW
SH_D
ata
to th
e “C
oron
a _S
H_
and
_OW
_W
eath
er_D
ata.
mdb
” da
taba
se.
The
link
isto
the
quer
yca
lled
“Que
ry_
Com
bine
d_D
aily
.”
A
dam
s si
te d
ata
is li
nked
on
the
shee
t A
DA
MS_
Dat
a to
the
“Ada
ms_
Wea
ther
.m
db”
data
base
. The
link
is to
the
quer
y ca
lled
“Que
ry_D
aily
_Rai
nfal
l.”
Figu
re 3
O
W_S
H_A
dam
s_R
ainf
all.x
ls
Se
e ab
ove
Figu
re 4
O
W_S
H_A
dam
s_R
ainf
all.x
ls
Se
e ab
ove
Dir
ecti
ons
1.
Mod
ify th
e da
ta o
n sh
eets
Dat
a _I
nch1
914_
2006
and
D
ata_
mm
_191
4_20
06. A
dd n
ew d
ata
row
s as
nee
ded.
Aft
er
addi
ng n
ew d
ata,
look
at t
he te
xt fo
rmul
as in
Tab
le 1
(on
th
e R
ain_
Ave
rage
s sh
eet)
and
ver
ify th
at th
e pr
oper
cel
ls
are
refe
renc
ed fr
om th
e da
ta s
heet
s. C
hang
e th
e ch
art d
ata
sour
ce r
efer
ence
to e
xpan
d ye
ars.
1.
Go
to th
e da
ta o
n th
e sh
eet O
WSH
_Dat
a an
d ri
ght-
clic
k an
ywhe
re in
the
data
. Edi
t the
dat
a qu
ery
if ne
cess
ary
and
refr
esh
the
data
com
ing
from
the
Acc
ess
data
base
. Cop
y do
wn
the
form
ulas
in c
olum
ns A
I an
d A
J if
new
dat
a ar
e ad
ded.
2.
Go
to th
e da
ta o
n th
e sh
eet A
DA
MS_
Dat
a an
d ri
ght-
clic
k an
ywhe
re in
the
data
. Edi
t the
dat
a qu
ery
if ne
cess
ary
and
refr
esh
the
data
com
ing
from
the
Acc
ess
data
base
. Cop
y do
wn
the
form
ulas
in c
olum
ns L
to N
if n
ew d
ata
are
adde
d.
3.
If a
ll w
orks
cor
rect
ly, y
ou s
houl
d be
abl
e to
upd
ate
the
data
lin
ks a
nd ju
st r
efre
sh e
ach
pivo
t tab
le (
wit
h a
righ
t mou
se
clic
k). Y
ou s
houl
d al
way
s en
sure
that
the
data
ran
ge fo
r ea
ch
pivo
t tab
le in
clud
es a
ll of
the
data
aft
er r
efre
shin
g. Y
ou d
o th
is b
y cl
icki
ng in
a p
ivot
tabl
e, s
elec
ting
Piv
ot T
able
Wiz
ard
and
then
the
Bac
k bu
tton
. Ver
ify th
e da
ta r
ange
or
chan
ge
the
rang
e if
need
ed.
4.
Aft
er u
pdat
ing
the
tabl
es o
n sh
eet T
able
4, c
hang
e th
e ch
art
rang
e na
mes
in F
igur
e 3
as n
eede
d. C
hang
e lo
ng-t
erm
av
erag
es r
efer
ence
d as
nee
ded
on th
e Ta
ble4
she
et.
5.
Aft
er u
pdat
ing
the
OW
and
SH
dat
a on
OW
SH_D
ata,
re
fres
h th
e pi
vot t
able
on
shee
t Fig
ure4
. Nea
r th
e to
p of
Fi
gure
4 yo
u w
ill fi
nd F
requ
ency
form
ulas
that
use
dat
a fr
om th
e pi
vot t
able
(co
lum
ns O
, S, W
, AA
, and
AE
).
App
ropr
iate
ly c
hang
e th
e ra
nges
ref
eren
ced.
The
freq
uenc
y fu
ncti
on is
an
arra
y fo
rmul
a, s
o yo
u m
ust s
elec
t the
who
le
rang
e to
cha
nge
it. F
or e
xam
ple,
to c
hang
e co
lum
n O
you
w
ould
firs
t sel
ect a
ll of
ran
ge O
4:O
9 an
d th
en fu
ncti
on F
2 to
edi
t the
form
ula.
Bec
ause
it is
an
arra
y fo
rmul
a, w
hen
done
you
mus
t ent
er C
TR
L Sh
ift_E
nter
.

Technical Report 46 • Page 10
Dir
ecti
ons
1.
On
the
shee
t cal
led
Dat
a en
ter
data
in c
olum
ns A
, B, C
, an
d D
. Col
umn
E is
cal
cula
ted
from
col
umn
C s
o co
py th
e fo
rmul
a do
wn.
2.
In c
olum
n D
ent
er a
ny in
form
atio
n ab
out t
he ty
pe o
f st
orm
, etc
., th
at o
ccur
red.
3.
Ent
er a
“ra
in tr
ace”
as
0.00
10 in
ches
.
4.
Go
to th
e bo
ttom
of t
he d
ata
and
ente
r ne
w d
ata
at th
e bo
ttom
. You
may
wan
t to
copy
dow
n da
ta fo
r th
e 7
loca
tion
s an
d ch
ange
the
data
aft
er p
asti
ng.
5.
If, i
n a
part
icul
ar m
onth
, it d
id n
ot r
ain
at a
par
ticu
lar
site
, en
ter
a ze
ro (
0); o
ther
wis
e a
blan
k sp
ace
will
app
ear
in th
e pi
vot t
able
.
6.
It d
oes
not m
atte
r in
wha
t ord
er y
ou ty
pe th
e da
ta.
7.
The
dat
a ra
nge
is a
“dy
nam
ic n
amed
ran
ge,”
so
it w
ill
auto
mat
ical
ly g
row
as
you
type
new
dat
a. T
he p
ivot
tabl
e w
ill a
utom
atic
ally
incl
ude
the
new
dat
a.
8.
Aft
er e
nter
ing
new
dat
a, g
o to
one
of t
he p
ivot
tabl
es, r
ight
-cl
ick
in th
e ta
ble
and
refr
esh
the
pivo
t tab
le. D
o th
is fo
r ea
ch o
f the
piv
ot ta
bles
.
9.
If m
ore
year
s ar
e ad
ded
to th
e da
ta, t
hen
add
a ne
w d
ata
link
at th
e bo
ttom
of t
his
shee
t.
10. C
hang
e th
e pi
vot t
able
link
as
need
ed
11. A
piv
ot ta
ble
is in
clud
ed h
ere
so a
s to
pro
vide
a fl
exib
le p
lot
opti
on b
y ye
ar a
nd r
ain
gaug
e si
te.
1.
Load
this
par
ticu
lar
file
in E
xcel
200
7, a
s th
e pi
vot t
able
w
as b
uilt
in th
is n
ewer
ver
sion
. Go
to th
e da
ta o
n th
e sh
eet
calle
d D
ata
and
righ
t-cl
ick
in th
e da
ta. E
dit t
he d
ata
quer
y if
nece
ssar
y an
d re
fres
h th
e da
ta c
omin
g fr
om th
e A
cces
s da
taba
se.
2.
The
piv
ot ta
ble
on th
e sh
eet c
alle
d Fr
ost w
as u
sed
to
high
light
thos
e da
tes
whe
re te
mpe
ratu
res
dipp
ed b
elow
32
°F a
nd 2
8°F
. Thi
s ta
ble
will
vis
ually
hel
p de
term
ine
the
last
and
ear
liest
fros
t of t
he y
ear.
3.
Fros
t dat
es a
re m
anua
lly ty
ped
in ta
ble
7.
Tabl
e/Fi
gure
Fi
le N
ame
L
inks
Tabl
es 5
and
6
Cor
ona_
Rai
n_G
auge
s.xl
s
Dat
a ar
e no
t lin
ked;
rat
her,
new
dat
a is
ty
ped
dire
ctly
on
the
shee
t cal
led
Dat
a.
Ann
ual p
lotp
ivot
—no
t C
oron
a_R
ain_
Gau
ges.
xls
Thi
s sh
eet r
eads
dat
a fr
om th
ein
clud
ed in
rep
ort
m
onth
ly p
ivot
so
as to
plo
t ann
ual
tota
ls b
y ra
in g
auge
sit
e. T
he p
ivot
tabl
e an
d pi
vot c
hart
are
pre
sent
ed o
n th
e sh
eet
Ann
ualp
lotp
ivot
.
Mon
thly
Plo
t—no
t in
clud
ed in
rep
ort
Dat
a is
rea
d fr
om th
e sh
eet c
alle
d D
ata
usin
g a
dyna
mic
ran
ge n
ame
calle
d D
ata.
Tabl
e 7
Kill
ing
Fros
t.xls
D
ata
is li
nked
on
the
shee
t cal
led
Dat
a to
the
“Cor
ona_
SH_
and
_OW
_Wea
ther
_Dat
a.m
db”
data
base
. The
link
is to
the
quer
y ca
lled
“Que
ry_C
ombi
ned_
Dai
ly.”

Technical Report 46 • Page 11
Tabl
e/Fi
gure
Fi
le N
ame
Lin
ksTa
ble
8 Ta
ble8
_Deg
ree
Day
s.xl
s D
ata
is li
nked
on
the
shee
t cal
led
Look
up to
th
e “C
oron
a _S
H_a
nd _
OW
_W
eath
er_D
ata.
mdb
” da
taba
se. T
he li
nk is
to th
e qu
ery
calle
d “Q
uery
_Diu
rnal
_Tem
p.”
Figu
re 5
and
Fig
ure
6 So
il_m
oist
ure_
SH_O
W.x
ls
Dat
a is
link
ed o
n th
e sh
eet c
alle
d D
ata
to th
e “C
oron
a _S
H_
and
_OW
_W
eath
er_D
ata.
mdb
” da
taba
se. T
he li
nk is
to th
e qu
ery
calle
d “Q
uery
_Soi
lMoi
stur
e_D
aily
.”
Figu
re 7
O
W_S
H_t
empe
ratu
res.
xls
Air
tem
pera
ture
dat
a ar
e st
ored
on
the
shee
t AT
_Dat
a. D
aily
air
tem
pera
ture
ave
rage
s ar
e co
pied
and
pas
ted
into
col
umns
H, I
, an
d J
from
the
Form
cal
led
Dai
ly_
Ave
rage
_Te
mpe
ratu
re in
the
OH
and
SH
dat
abas
e.
Diu
rnal
tem
pera
ture
s ar
e cu
t and
pas
ted
from
th
e Fo
rm c
alle
d D
iurn
al_
Dai
ly_A
vg_t
mp.
Figu
re 8
Dat
a fo
r th
e so
il te
mpe
ratu
re 2
0 cm
cha
rt
are
cut a
nd p
aste
d fr
om th
e fo
rm c
alle
d D
aily
_ So
il_ T
empe
ratu
re_
10cm
follo
win
g a
Dir
ecti
ons
1.
Dat
a lin
ked
on th
e Lo
okup
she
et a
re u
sed
to c
ompu
te
aver
age
diur
nal d
aily
tem
pera
ture
s us
ing
a pi
vot t
able
in
colu
mns
O a
nd P
of t
his
sam
e sh
eet.
If te
mpe
ratu
re is
m
issi
ng, t
he a
vera
ge v
alue
is s
ubst
itut
ed w
hen
calc
ulat
ing
degr
ee d
ays.
2.
Go
to th
e da
ta o
n th
e sh
eet c
alle
d Lo
okup
and
rig
ht-c
lick
anyw
here
in th
e da
ta. E
dit t
he d
ata
quer
y if
nece
ssar
y an
d re
fres
h th
e da
ta c
omin
g fr
om th
e A
cces
s da
taba
se.
3.
App
ropr
iate
dat
a m
ust b
e ty
ped
or c
ut a
nd p
aste
d to
th
e bo
ttom
of t
he s
heet
cal
led
Dat
a. D
ata
are
ente
red
for
colu
mns
A, B
, C, D
, E, a
nd G
. Oth
er c
olum
ns a
re
calc
ulat
ed. E
vent
ually
, deg
ree
days
for
each
day
are
co
mpu
ted
in c
olum
n H
of t
he D
ata
shee
t. C
olum
n F
eval
uate
s w
heth
er d
ata
for
the
day
in q
uest
ion
is m
issi
ng o
n th
e D
egre
eday
s sh
eet.
If it
is m
issi
ng, t
he a
vera
ge fo
r th
at
day
is u
sed
from
the
pivo
t tab
le; o
ther
wis
e, th
e re
port
ed
diur
nal d
ata
is u
sed.
1.
Ope
n th
is p
arti
cula
r fil
e in
Exc
el 2
007,
as
the
pivo
t tab
le
was
bui
lt in
this
new
er v
ersi
on. G
o to
the
data
link
ed o
n th
e sh
eet c
alle
d D
ata
and
righ
t-cl
ick
anyw
here
in th
e da
ta. E
dit
the
data
que
ry if
nec
essa
ry a
nd r
efre
sh th
e da
ta c
omin
g fr
om
the
Acc
ess
data
base
.
2.
Clic
k on
the
char
t and
sav
e th
e ch
art a
s a
user
-defi
ned
char
t on
you
r co
mpu
ter.
By
doin
g th
is y
ou c
an g
et b
ack
to th
is
look
whe
n th
e da
ta a
rere
fres
hed.
3.
Alte
r th
e pi
vot t
able
layo
ut b
y se
lect
ing
SMO
IS20
0 fo
r th
e da
ta if
you
des
ire
to g
raph
the
deep
er p
robe
.
4.
Sele
ct a
diff
eren
t sit
e or
yea
r if
you
desi
re th
ese
to b
e al
tere
d.
5.
The
cha
rts
in th
e re
sear
ch r
epor
t wer
e pl
otte
d to
PD
F in
tw
o- y
ear
incr
emen
ts a
nd c
ut a
nd p
aste
d to
geth
er in
Ado
be
Acr
obat
.
1.
Cop
y an
d pa
ste
data
from
the
Acc
ess
data
base
form
s. T
o co
py th
e da
ta, v
iew
the
form
in p
ivot
tabl
e vi
ew.
2.
No
chan
ges
shou
ld b
e ne
eded
for
the
upda
ted
char
t on
the
AT_C
hart
she
et.
3.
Cop
y an
d pa
ste
data
from
the
Acc
ess
data
base
form
s. T
o co
py th
e da
ta, v
iew
the
form
in p
ivot
tabl
e vi
ew.
4.
The
dat
a ar
e pa
sted
to c
olum
ns C
and
D o
n th
e ST
_D
ata_
10cm
she
et.

Technical Report 46 • Page 12
Tabl
e/Fi
gure
Fi
le N
ame
L
inks
Dat
a fo
r th
e so
il te
mpe
ratu
re 5
0 cm
cha
rt
are
cut a
nd p
aste
d fr
om th
e fo
rm c
alle
d D
aily
_ So
il_ T
empe
ratu
re_
50cm
follo
win
g a
proc
edur
e si
mila
r to
that
of F
igur
e 5.
Figu
re 9
O
W_S
H_t
empe
ratu
res.
xls
Dat
a ab
out r
elat
ive
hum
idit
y ar
e lin
ked
to
the
Acc
ess
data
base
via
“Q
uery
_Dai
ly_R
H_
Ave
rage
” in
sert
ed o
n pa
ge R
Hlo
okup
.
Figu
re 1
0 O
W_S
H_t
empe
ratu
res.
xls
Dat
a ab
out d
aily
win
d sp
eeds
and
dir
ecti
on
are
linke
dto
the
Acc
ess
data
base
via
“Q
uery
_D
aily
_Win
d” o
n sh
eet c
alle
d W
ind
Dir
ecti
ons
6.
Cop
y an
d pa
ste
data
from
the
Acc
ess
data
base
form
s. T
o co
py th
e da
ta, v
iew
the
form
in p
ivot
tabl
e vi
ew.
7.
The
dat
a ar
e pa
sted
to c
olum
ns C
and
D o
n th
e ST
_D
ata_
50cm
she
et.
8.
No
chan
ges
shou
ld b
e ne
eded
for
the
upda
ted
char
t on
the
ST_C
hart
_50c
m s
heet
.
1.
Go
to th
e da
ta o
n th
e sh
eet c
alle
d R
Hlo
okup
and
rig
ht-c
lick
anyw
here
in th
e da
ta.
Edi
t the
dat
a qu
ery
if ne
cess
ary
and
refr
esh
the
data
com
ing
from
the
Acc
ess
data
base
.
2.
Aft
er u
pdat
ing
the
data
, find
the
pivo
t tab
le lo
cate
d on
she
et
RH
_Cha
rt a
nd v
erify
the
full
data
ran
ge is
incl
uded
as
inpu
t to
the
pivo
t tab
le.
Ref
resh
the
pivo
t tab
le.
Thi
s st
ep s
houl
d up
date
the
char
t.
1.
Go
to th
e da
ta o
n th
e sh
eet c
alle
d W
ind
and
righ
t-cl
ick
anyw
here
in th
e da
ta. E
dit t
he d
ata
quer
y if
nece
ssar
y an
d re
fres
h th
e da
ta c
omin
g fr
om th
e A
cces
s da
taba
se
2.
On
the
shee
t MA
XW
S th
ere
are
thre
e fr
eque
ncy
tabl
es.
Cha
nge
the
rang
e re
fere
nces
in th
e fr
eque
ncy
calc
ulat
ion
form
ulas
. The
freq
uenc
y fu
ncti
on is
an
arra
y fo
rmul
a,
so y
ou m
ust s
elec
t the
who
le r
ange
to c
hang
e it
. For
ex
ampl
e, to
cha
nge
the
max
imum
win
d sp
eed
freq
uenc
y co
mpu
tati
ons
you
wou
ld fi
rst s
elec
t all
of r
ange
F5:
F14
and
then
func
tion
F2
to e
dit t
he fo
rmul
a. B
ecau
se it
is a
n ar
ray
form
ula,
whe
n do
ne y
ou m
ust e
nter
CT
RL-
Shift
_Ent
er.

Technical Report 46 • Page 13

Technical Report 46 • Page 14

Technical Report 46 • Page 15

Technical Report 46 • Page 16
New Mexico State University is an equal opportunity/affirmative action employer and educator. NMSU and the U.S. Department of Agriculture cooperating.
September 2008 Las Cruces, NM