procedures evaluation and management management strategy
TRANSCRIPT

Please cite this paper as:
Holland, D. S. (2010), “Management Strategy Evaluationand Management Procedures: Tools for Rebuildingand Sustaining Fisheries”, OECD Food, Agriculture andFisheries Working Papers, No. 25, OECD Publishing.doi: 10.1787/5kmd77jhvkjf-en
OECD Food, Agriculture and FisheriesWorking Papers No. 25
Management StrategyEvaluation and ManagementProcedures
TOOLS FOR REBUILDING AND SUSTAININGFISHERIES
Daniel S. Holland*
*Gulf of Maine Research Institute, United States
MANAGEMENT STRATEGY EVALUATION AND MANAGEMENT PROCEDURES – 1
MANAGEMENT STRATEGY EVALUATION AND MANAGEMENT PROCEDURES © OECD 2010
Management Strategy Evaluation and Management Procedures:
Tools for Rebuilding and Sustaining Fisheries
Daniel S. Holland
Gulf of Maine Research Institute, Portland Maine, USA
OECD FOOD, AGRICULTURE AND FISHERIES
WORKING PAPER No. 251
1 This working paper does not necessarily reflect the views of all OECD member countries and has been released under the
responsibility of the Secretary-General of the OECD.

ABSTRACT – 3
MANAGEMENT STRATEGY EVALUATION AND MANAGEMENT PROCEDURES © OECD 2010
Management Strategy Evaluation and Management Procedures:
Tools for Rebuilding and Sustaining Fisheries
Daniel S. Holland
Gulf of Maine Research Institute, Portland Maine, USA
Abstract2
Fisheries management is complicated in nearly all cases by a high degree of
uncertainty about the current state and expected growth of fish stocks and about the
economic and social factors that affect the desirable harvest levels. Even for fisheries
with excellent data collection programs, scientific surveys and sophisticated assessments,
the estimates of catch levels that will maintain healthy fisheries or rebuild depleted ones
are often far from accurate. Consequently recommended catch levels often fluctuate more
than necessary in response to error in assessments rather than true stock variability and
frequently react too slowly due to lags in data collection, assessment and implementation.
Overly optimistic estimates of stock size and future growth have often led to allowing
catch levels that undermine rebuilding. Fishery management strategies also rarely include
specific objectives developed with stakeholder involvement which can undermine
stakeholders‘ support for conservation even when it may be in their best interest.
In this paper I discuss an approach for evaluating and implementing fishery
management strategies known as management strategy evaluation (MSE), also sometimes
referred to as the management procedure (MP) approach that is designed to identify and
operationalise strategies for managing fisheries that are robust to several types of
uncertainty and capable of balancing multiple economic, social and biological objectives.
When implemented correctly an MSE should result in clear and measurable objectives
and a robust process for achieving them that fishery managers and stakeholders have
jointly developed and agreed to. I review several examples of MSEs that have been used
to evaluate, and in some cases implement, rebuilding strategies for overfished fisheries.
These case studies demonstrate how the MSE approach has been applied and some of its
advantages and limitations
Keywords
Management Strategy Evaluation; Fisheries Rebuilding; Fisheries Economics; South African Hake;
New Zealand Rock Lobster; Fisheries management.
2. I am grateful to Rebecca Rademeyer and Doug Butterworth for assistance with the case study of the
South African Hake MPs and to Paul Starr and Nokome Bentley for assistance with the cases studies of
the New Zealand Rock Lobster MPs. I‘m also grateful to Saba Khwaja and anonymous reviewers from
the OECD Committee for Fisheries for helpful comments that greatly improved the manuscript.

TABLE OF CONTENTS – 5
MANAGEMENT STRATEGY EVALUATION AND MANAGEMENT PROCEDURES © OECD 2010
Table of contents
EXECUTIVE SUMMARY ................................................................................................ 7
1. Introduction .................................................................................................................... 16 2. What is MSE and Why Consider Using It ..................................................................... 19 3. MSE and Bioeconomic Modelling ................................................................................. 23 4. Experiences with MSE and MPs .................................................................................... 27 4.1 Rebuilding the South African Hake Fishery ................................................................ 27 4.2 Rebuilding New Zealand NSS Rock Lobster Fishery .................................................. 34 4.3 Use of MSE in the United States .................................................................................. 40 4.4 Use of MSE in Europe ................................................................................................. 42 5. Conclusions and Recommendations .............................................................................. 47
BIBLIOGRAPHY ............................................................................................................ 51
ANNEX 1: MPs for South African Hake ....................................................................... 57
The First Hake MP 1990-1995 ........................................................................................... 57 The 1998 MP ...................................................................................................................... 57 The 2007 MP ...................................................................................................................... 58
ANNEX 2: MPs for New Zealand Rock Lobster ........................................................... 61
The 1997 MP ...................................................................................................................... 61 The 2003 MP ...................................................................................................................... 61 The 2007 MP ...................................................................................................................... 64
Figures
Figure 1: Schematic of a management strategy evaluation model .................................... 20 Figure 2: Management units and species distribution for southern African hake ............. 29 Figure 3: Trajectories of spawning biomass ...................................................................... 34 Figure 4: New Zealand NSS Rock Lobster Management Areas CRA7 and CRA8 .......... 35 Figure 5: CPUE, TACs and Catch for the CRA7 and CRA8 rock lobster stocks
in New Zealand ............................................................................................................. 36
Figure A1. Trajectories of M. paradoxus resource abundance .......................................... 60 Figure A2: Rebuilding Trajectory for NSS Rock Lobster MP .......................................... 64 Figure A3. 2007 MP for CRA8 ......................................................................................... 66

EXECUTIVE SUMMARY – 7
MANAGEMENT STRATEGY EVALUATION AND MANAGEMENT PROCEDURES © OECD 2010
EXECUTIVE SUMMARY
The depletion and collapse of fisheries is widespread and economic mismanagement
of fisheries still more commonplace, but there is increasing resolve in many OECD
countries to end overfishing, rebuild fisheries and improve economic performance of
fisheries. Unfortunately, the political resolve to rebuild and more effectively manage
fisheries, and even the support of fishery stakeholders for doing so, is not a sufficient
condition for achieving success. Effective fisheries management is nearly always
hindered by uncertainty in the size, composition and spatial distribution of stocks;
uncertainty in stock dynamics; stochastic and unpredictable variation in growth of the fish
stock; error in implementation of management prescriptions; and variations in economic
parameters such as costs and prices that effect optimal management. This can be
particularly problematic for rebuilding fisheries for which managers must balance the
need reduce catches to ensure rebuilding with the need to meet social and economic needs
of fishery stakeholders in the short term as well as the long term. A methodology known
as management strategy evaluation (MSE), also referred to as the management procedure
(MP) approach, is explicitly designed to indentify fishery rebuilding strategies and
ongoing harvest strategies that are robust to uncertainty and natural variation, and that
balance biological and socioeconomic objectives. This paper describes MSE and reviews
several examples of MSE that demonstrate how the approach has been applied and some
of its advantages and limitations. It also compares MSE with bioeconomic modelling and
suggests ways each approach can be improved by drawing from the other.
MSE is a general framework aimed at designing and testing a MPs, which specify
pre-agreed decision rules (heuristics), assessment methods and data used for setting and
adjusting TACs or effort levels to achieve a set of fishery management objectives. Note
that an MP is not simply a harvest control rule (HCR) which might be simply a policy to
set the TAC to achieve a constant specific exploitation rate; an MP must also specify the
data and assessment methods for determining how the TAC is calculated. While use of
HCRs in fisheries is relatively common, use of MPs is rare. A prototypical MSE
incorporates a number of interlinked model structures including: population dynamics;
data collection; data analysis and stock assessment; an HCR that dictates a specific
management action (e.g., the TAC); and implementation of the HCR. An operating model
is typically used to generate ‗true‘ ecosystem dynamics including the natural variations in
the system. Data are sampled from the operating model to mimic collection of fishery
dependent data and research surveys (and their inherent variability). These data are
passed to the assessment model. Based on this assessment and the HCR, a management
action is determined (e.g., a change in the TAC). Fleet effort and catch are then modelled,
potentially allowing for error in implementation, and resulting catches are fed back into
the operating model. By repeating this cycle the full management cycle is modelled. It is
possible to test the effect of modifying any part of this cycle including changes to the
operating model, assumptions about noise, etc. Alternative MPs can be compared by
running many stochastic simulations, each for several years, to identify the performance
of a rule according to different metrics under the likely range of conditions.
The MSE approach is expressly aimed at identifying MPs that are robust to natural
variation in the system and to uncertainty and error, both in stock assessments and
8 –EXECUTIVE SUMMARY
MANAGEMENT STRATEGY EVALUATION AND MANAGEMENT PROCEDURES © OECD 2010
implementation of management controls. The choice of the MP generally involves a
compromise between various objectives since they are often at odds. The objective of the
MSE is to identify MPs that performs acceptably under a range of conditions and
uncertainties rather than try to identify a harvest strategy that is maximizes yield or profit
on average. For some fisheries, it is possible to find an empirically-based, model-free MP
that makes use of fishery-dependent data or simple indices from surveys as inputs to the
HCR requiring less frequent stock assessments and thereby reducing management costs.
A primary goal of the MSE approach is to assess the performance of different rules in
balancing multiple and sometimes competing objectives (e.g., low risk of overfishing and
stock collapse; stability in TACs over time; and maximum catches or profits). The lack of
clear and precise objectives is a common cause of failure in fisheries management. The
MSE process, if done correctly, should lead to explicit definition of, and agreement on,
management objectives. Ideally this should involve all participants in the fishery. This
can help foster a long-term view as well as ensure acceptance and adherence to
management advice. Stakeholders often find it difficult to put explicit, quantitative
weights on multiple performance indicators that can be used to quantitatively rank
different MPs. For this reason, MSEs typically report on a variety of indicators and give
stakeholders the opportunity to consider the trade-offs subjectively relative to the agreed
objectives. Using and MP to adjust catch of effort levels using pre-agreed decision rules
can be more transparent and appear more fair to stakeholders than the traditional
management under which scientists produce harvest recommendations from complex
stock assessments that stakeholders typically do not understand and have had not been
involved in.
MSE and Bioeconomic modeling
MSE and bioeconomic modeling are similar in purpose and are not necessarily
mutually exclusive. However, there are typically important divergences between them in
practice. Consequently each tends to lack some of the important advantages of the other,
though this need not be the case. There are very few examples of MSEs that have
explicitly incorporated economics, either in modeling behaviour or in evaluating MPs
against explicit economic objectives. However, a more realistic depiction of economic
behaviour and consideration of economic objectives could improve the accuracy and the
utility of MSEs to stakeholders. Bioeconomic models on the other hand, often use overly
simplistic models and fail to provide specific and directly usable advice to fishery
managers. Incorporating more realistic biological models that explicitly consider the
various types of uncertainty typically considered in an MSE and provide more specific
management advice would make bioeconomic models more useful to fishery managers. A
merging of the two, i.e., incorporating bioeconomic models in the MSE framework, is
likely to be the most useful approach for providing management advice to fishery
managers and stakeholders. The will require more collaboration between economists and
fishery scientists.
Rebuilding the South African Hake Fishery
The South African hake fishery was the first marine fishery anywhere in the world to
apply the MSE approach and actually implement an operational management procedure
that specifies the data, assessment methods and the specific decision rule that produces
explicit and directly useable management advice (e.g., the TAC). The hake fishery is
South Africa‘s most important fishery both in terms of revenue and employment

EXECUTIVE SUMMARY – 9
MANAGEMENT STRATEGY EVALUATION AND MANAGEMENT PROCEDURES © OECD 2010
accounting for about half of the landed value of all South Africa‘s fisheries. Since 1990,
the hake fishery has been managed (except for transitional periods) with MPs which use
catch per unit effort (CPUE) and research trawl survey abundance indices as inputs to the
HCR to determine the TAC. The MPs, the models they are based on, and the nature of
recommendations have changed several times as new information about fish stock
structure and new assessment methods have emerged. The need for changes to the MP
was expected and planned for with agreed schedules for re-evaluation and procedures for
dealing outcomes that suggested the MP was not working as planned. What has remained
consistent during the post 1990s period is a close congruence between the TACs
recommended by the MP and the actual TACs set by the Minister of Fisheries. Although
the offshore hake stock is not yet rebuilt, the hake fishery was certified as sustainable by
the Marine Stewardship Council in 2004 and has retained that certification since.
The institutional and legal setting of the South Africa hake fishery was particularly
suited to development and implementation of MPs, and no doubt was important in
maintaining support for this approach over time even though the MPs did not always
work as planned. The official recognition of MPs in the Marine Living Resources Act as
a preferred management approach is unique and ensures that the Minister will at least
consider this management approach. The planning process for MPs in the South African
hake fishery was facilitated by having an identifiable set of quota holders who are, in
turn, represented by industry organizations that have the legally recognized right to make
management recommendations on behalf of the industry and resources to participate in
the management process. This not only facilitates industry engagement in the process, it
gives the Minister more assurance that an OPM that is agreed upon will not be undercut
politically by disaffected parties.
Despite the commitment to an MP approach and the resources dedicated to
implementing it, the experience with use of MPs in the South African hake fishery has
been mixed. MPs have not be successful in rebuilding the fish stocks as planned although
this is arguably due to poor recruitment rather than misspecification of TACs resulting in
excessive exploitation rates. Over time the MPs have been improved to utilize new data
and assessment techniques and to account for changes in understanding of the stock
structure. The process of developing, testing and selecting MPs has clearly been costly in
terms of time and human resources, but it has also led to a better understanding of the
fishery and how available data can be used to manage it. It also reduces the required
frequency of full stock assessments. Without the counterfactual it is not possible to say
how conventional management without MPs would have performed, but there is little
reason to believe it would have done better. It is likely that annual adjustments of TACs
based on the ―best assessment‖ each year would have resulted in wider swings in TACs
over time which is clearly something that industry has been keen to avoid.
Perhaps the most important aspect of implementing MPs is engaging stakeholders in
their development to ensure that management meets their objectives to the extent
possible, particularly a reduction in uncertainty and variation of future catches to the
extent that is possible. As noted by one commercial stakeholder in the South African hake
fishery, stakeholder involvement in a planning process such as MSE not only allows
stakeholders to ensure their objectives are considered, it can enable them to reduce risk
and can help create a cooperative atmosphere between fishery manager and industry that
is critical to ensuring scientific management advice is accepted and adhered to by
decision makers and industry.
10 –EXECUTIVE SUMMARY
MANAGEMENT STRATEGY EVALUATION AND MANAGEMENT PROCEDURES © OECD 2010
Rebuilding New Zealand NSS Rock Lobster Fishery
The NSS (Otago and Southland) rock lobster stock in New Zealand has been
managed with individual transferable quotas (ITQs) as part of the quota management
system (QMS) since 1990. Although it is assessed as a single stock, the NSS rock lobster
stock is divided into two quota management areas, CRA7 and CRA8, with separate
TACs, seasons and minimum legal sizes. Rebuilding the NSS stock to safer and more
productive levels was an agreed management goal when the fishery was introduced to the
QMS. In the mid 1990s, the National Rock Lobster Management Group (NRLMG),
which advises the Minister of Fisheries on rock lobster management issues, began to
explore the use of MPs to manage the fishery as a way to ensure fishery rebuilding while
also meeting stakeholder objectives including predictability and stability of TACs. The
fishery has been managed with a series of MPs since 1997. Whether due to good luck or
good management, these MPs are arguably the best example of successful application of
the MP approach in rebuilding a depleted fishery. The fishery rebuilt ahead of schedule
and a new set of separate MPs for the two management areas has been implemented to
maintain the fisheries at desired levels. These two MPs work quite differently reflecting
different biological characteristics and socio-economic objectives in the two areas, but
they have been evaluated to ensure sustainability of the fish stock that supports both
areas.
As in South Africa, development and implementation of an MP in the NSS rock
lobster fishery was facilitated by the institutional structure for fishery management in
New Zealand. Of particular importance was the existence of commercial stakeholder
organizations (the New Zealand Seafood Industry Council, SeaFIC, and the National
Rock Lobster Industry Council (NRLIC)) with legal ability to levy funds for research
from quota holders and legitimacy as representatives of quota holders in consultations
with the government over setting objectives and choosing a particular MP. This enabled
the industry groups to contract and pay for the development and evaluation of the MPs
that would likely not have occurred as part of the normal Ministry science and
management process.
In New Zealand's Quota Management System, TAC changes are relatively rare and
are extremely time-consuming for all parties. With over 97 species grouped into over 600
separate quota stocks, each with its own TAC, it is difficult to adjust TACs for many of
them in any given year with the limited resources of the Ministry and the stakeholders.
MPs greatly simplify this process and allow the system to be much more responsive. The
NSS MPs produced both increases and decreases in TACs that were accompanied by very
little debate and controversy. As note earlier, however, MPs do have large up front
development costs and require extensive human resources (i.e., modellers) that are in
short supply. So, while getting more MPs in place might improve the effectiveness and
responsiveness of management, it will undoubtedly be a long process for this small
country with such a large and complex system of fisheries.
Use of MSE in the United States
Although there is growing interest in applying the MSE approach in the US, there are
very few examples of an MSE framework being used to evaluate a realistically
implementable MP for fishery rebuilding. One notable exception is an MSE designed to
explore rebuilding strategies for overfished rockfish stocks managed by the Pacific
Fishery Management Council (PFMC). The analysis was not designed to lead to
implementation of an MP, but it did demonstrate the performance of alternative HCRs

EXECUTIVE SUMMARY – 11
MANAGEMENT STRATEGY EVALUATION AND MANAGEMENT PROCEDURES © OECD 2010
that would be practical and would meet legal requirements, and that were based on the
current stock assessment approach and data streams and the biological models underlying
them. This MSE is interesting because it deals with fish stocks that cannot be rebuilt
within 10 years thereby allowing and requiring an extended rebuilding plan up to 80 years
for some species. The MSE demonstrated conflicts between the different management
goals which included: a high probability of stock recovery by the target date, high
average catches during rebuilding, low inter-annual variability of catches, low probability
of having to redefine the rebuilding plan, and simplicity of the management approach.
Use of MSE to test and implement MPs in the US is inhibited by a number of factors.
As in most countries, fisheries managers typically lack the resources to undertake an
MSE on top of the normal data collection and stock assessment process. Most US
fisheries also do not have commercial stakeholder organizations that can legitimately
represent the interests of the overall commercial fishery and agree on a particularly MP.
This is important because a lack of agreement on the MP up front could lead to political
pressure to drop it if it leads to greater TAC reductions or slower increases than desired
by some groups. It is also not clear whether an MP would legally be allowed if it could
result in fishing mortality exceeding Fmsy at some points. This might inhibit use of
common stabilizing mechanisms in MPs such as limits on how much or how often TAC
can be changed year to year, and it is these stabilizing mechanisms that often have the
greatest appeal to fishery stakeholders. Nevertheless there is growing interest in MSE in
the US, at least as a means to evaluate HCRs for robustness to uncertainty. It is likely as
more fisheries adopt catch share systems with clearly defined stakeholders and hard catch
limits, interest in developing MPs will grow.
Use of MSE in Europe
There has been considerable interest in the MSE approach in Europe for many years
and there are a number of examples of MSE that have been conducted to evaluate MPs
(or at least HCRs) including a few examples that evaluate rebuilding strategies for
depleted fisheries. However, moving beyond MSE to actual implementation of MPs is
only now starting. The Icelandic cod was an early example of an MSE that was used to
test various HCRs but did not actually test and implement and MP. In 1992 the minister
of fisheries appointed a working group to provide advice on the harvest control rules
including their most important fishery, Icelandic cod. They conducted an MSE that
explored the economic and biological performance of alternative HCRs allowing for
stochastic variability and uncertainty in stock assessments that the HCR would use to set
TAC. The HCR implemented could not really be considered an MP since it did not pre-
specify the assessment process for determining the stock biomass which, through the
HCR, determines the TAC. Use of HCRs in the Icelandic cod fishery over a period of
more than 15 years failed to lead to rebuilding of the fishery. While this was partly due to
poor recruitment uncertainty in stock assessments, implementation failure (e.g. catches in
excess of TACs) and ad hoc changes to the HCR at times allowed much higher
exploitation rates than were envisioned by the rule and this clearly played a role in the
failure to rebuild. It is notable also that a more conservative rule was not chosen despite
the demonstration by the MSE that it would greatly increase the net present value of the
fishery. This suggests that there may have been insufficient involvement of key
stakeholder in the MSE process to create sufficient buy-in to choose and implement a
strategy.
12 –EXECUTIVE SUMMARY
MANAGEMENT STRATEGY EVALUATION AND MANAGEMENT PROCEDURES © OECD 2010
Kell et al. (2005a) applied an MSE approach to evaluating HCRs for the North Sea
flatfish fishery which provided a basis for implementation of a new HCR for the North
Sea plaice and sole fishery in 2008. A long-term management plan adopted by the
Council of the European Union in June 2007 and first implemented in 2008 implements a
version of the HCR explored by Kell et al. (2005a) though it might not be considered an
MP since it does not specify the specific data and analytical process that will be used to
determine the TAC. The plan consists of two stages. The aim of the first phase is to
ensure the return of the stocks of plaice and sole in the North Sea to within safe biological
limits. This should be reached through an annual reduction of fishing mortality (F) by
10% in relation to the fishing mortality estimated for the preceding year. The plan sets a
maximum change of 15% of the TAC between consecutive years. This has been carried
out with 10% reductions in fishing mortality in 2008 and a recommendation for another
10% reduction in 2009, although this would actually allow an increase in the TAC since
the stock has grown. SSB for this plaice stock is now estimated to have increased above
the precautionary target level Bpa. An analogous set of mortality reductions were also
implemented for sole. Like plaice this has actually allowed increase in the TAC since the
stock is growing, despite the fact that the sole stock has not yet recovered to target levels.
Despite longstanding interest in applying an MSE framework to evaluating HCRs,
implementation of full MPs in Europe has been hindered and complicated by the fact that
many of the fisheries are shared between multiple countries each of which makes and
implements their own management decisions. While ICES provides an institutional
framework for undertaking an MSE, adopting an MP, at least in multistate fisheries,
requires a relinquishment of control over domestic fishery policy that may be difficult to
persuade member counties to agree to. Furthermore the fishery stakeholders often include
disparate groups of fishermen from several countries that may be fishing under different
management systems. However agreement on an implementation of an HCR for North
Sea plaice and sole suggests that there may be a growing role for MPs in Europe. Like
most European fisheries these stocks are shared by several countries making it complex
and difficult to agree on a strategy, yet this was accomplished. The test will be to see if it
is adhered to if, in the future, it triggers TAC reductions. Despite the added political
difficulties of reaching agreement on an MP, doing so for shared stocks in Europe would
be particularly important and useful if it served to strengthen resolve to stick to
management advice.
Conclusions and Recommendations
Designing and implementing effective management strategies for rebuilding and
maintaining fisheries to meet the objectives of fishery stakeholders and the broader public
concerned with sustainability is an important but an extremely difficult task. The
unpredictable variability of fisheries and the high level of uncertainty about both current
state and future growth inhibit good management even when there is a strong resolve to
limit catches or effort to rebuild and maintain fish stocks at sustainable levels. Despite the
fact that fishery stakeholders often would benefit from more conservative harvest
strategies that build fish stocks to higher biomass levels, there is often a lack of support
for these strategies when they require reductions in catch. This is no doubt due in large
part to those stakeholders being uncertain that short term sacrifices will be rewarded by
long term gains. MSEs that involve stakeholders in determining objectives and choosing
management strategies to achieve those objectives can be an effective way to achieve
EXECUTIVE SUMMARY – 13
MANAGEMENT STRATEGY EVALUATION AND MANAGEMENT PROCEDURES © OECD 2010
buy-in for rebuilding and sustainable management and continued support even when
catch reductions are required.
The institutional setting is of critical importance in promoting the development and
successful implementation of MPs. To date, MPs have only been implemented in
fisheries managed with individual quota systems where the stakeholders are clearly
indentified and there is a formal and legally recognized process for involving them in
determining management advice. The long term right to a share of the fish catch can be
particularly important for rebuilding fisheries where short term sacrifice is required for
long term gain. However, there may still be a diversity of interests and objective amongst
fishery stakeholders, particularly when the interests of non-commercial stakeholders must
be considered. Therefore, the importance of creating a formal institutional structure for
stakeholder representation in the management process is critical to developing MPs that
will endure political pressure to abandon them. The necessity to get several stakeholder
groups or politicians from several countries, to agree on an MP and stick by it even when
it operates to their disadvantage clearly increases the difficulty of implementing an MP,
or any effective management for that matter. However, the MSE framework does at least
provide an objective way of evaluating a management strategy against objectives, and, by
forcing stakeholders to clarify objectives, it may increase the chance that a fishery
management plan will be designed to achieve them.
Recommendation: Stakeholders should be consulted in the early stages of
developing an MSE to determine the appropriate objectives and performance metrics, and
they should be involved in selecting an MP to ensure that it balances objectives
appropriately and to create buy-in. It is useful to clearly define the stakeholders or
stakeholder groups that have standing and create a formal institutional structure for their
participation in the decision process.
The MSE framework is well suited to addressing many of the challenges of
identifying fishery management strategies that are precautionary in the face of
uncertainty, but also serve the economic and social interests of fishery stakeholders. First
and foremost MSE is designed to indentify management strategies that are robust to
multiple types of variability and uncertainty – a characteristic of almost all fisheries.
Finding strategies that are robust to uncertainty, work reasonably well in good times and
bad, and balance competing objectives will generally mean choosing a strategy that
appears suboptimal in term of maximizing yield or profits.
Recommendation: While a primary criterion for selecting an MP is likely to be low
risk of fishery collapse or high probability of rebuilding, it is also important to identify
MPs that reduce social and economic risks which typically mean finding MPs that reduce
the frequency and magnitude of TAC changes.
Explicit modelling of different types of uncertainty including model error,
observation error and implementation error not only allows for design of MPs that work
well in the face of these errors, it can help identify where it may be most useful to reduce
uncertainty through more research, better data collection or tighter management controls
that reduce implementation error. These means of reducing uncertainty are often costly,
and MSE provides a tool to evaluate the benefits of reduced uncertainty relative to the
gains, either explicitly in terms of higher monetary benefits that can be realized or
qualitatively in terms of greater achievement of competing objectives such as lower
biological risk and both higher and more stable yields.
14 –EXECUTIVE SUMMARY
MANAGEMENT STRATEGY EVALUATION AND MANAGEMENT PROCEDURES © OECD 2010
Recommendation: MSEs should be used as a tool to determine the value of reducing
specific types of uncertainty (e.g. on key parameters, model assumptions, implementation
error, etc.) so as to target scarce research and monitoring resources where they create the
most value.
Most MSEs could be improved with inclusion of integrated economic models that
track economic performance indicators such as costs and revenues and their variability
along with biological outcomes. In addition, few MSEs do a good job of modelling
implementation error which can be facilitated by modelling human behaviour in response
to the economic incentives. Economists may also be able to suggest and test MPs that
create incentives for fisheries to use or reveal private information which can improve
fishery performance in the face of uncertainty.
Recommendation: MSEs should incorporate bioeconomic models that provide
information on economic performance metrics and account for possible errors in
implementation due to human behaviour.
MPs have primarily been implemented in and been most effective for single species
fisheries. In these fisheries it is more likely that empirically based (model free) MPs that
rely on commercial CPUE to determine TAC decisions will be effective. These model-
free MPs may allow savings in management costs as also make management more
understandable to fishery stakeholders which can promote acceptance. Multispecies MPs
may be more difficult to design and test and are more likely have to rely on formal stock
assessments to determine the TACs.
Recommendation: Although they will not be appropriate for many fisheries, model-
free MPs that reduce reliance on frequent stock assessment models should be considered.
Model-free MPs are more likely to be appropriate for single-species fisheries where
fishery dependent data can be effectively used. It may make sense to focus initial
implementation of MSE and MPs on single species fisheries before tackling multispecies
fisheries for which MSEs and MPs will be more complex to model and implement.
While MSE and MPs have some clear advantages over traditional approaches to
developing and implementing management advice, they are not a panacea. A number of
MPs and HCRs that were tested for robustness in an MSE framework failed to achieve
their objectives. Clearly it will not generally be possible to design a perfect MP, and it
will be necessary to adapt the MP as new information and unforeseen events emerge. It is
probably fair to say that the more we learn about fisheries the less certain we are that we
can predict what will happen to them. Therefore it is essential that a schedule and process
for re-evaluating an MP be determined along with meta rules that determine how to react
if appears the MP is not functioning correctly. The process must allow adaptability
without opening the MP up to tinkering any time results are not going the way some
stakeholder group likes.
Recommendation: When an MP is implemented a schedule for reviewing and
potentially changing the MP should be clearly stated along with a procedure for
identifying and reacting to a failure of the MP prior to the schedule review.
Undertaking an MSE and developing and testing an MP will generally require a large
upfront cost. Fishery management authorities‘ budgets and human resources are generally
stretched thin just keeping up with regular stock assessments. Without additional funding
specifically dedicated to undertake MSEs, use of this analytical framework and of MPs is
likely to grow only slowly. Yet there may be substantial long term gains from greater use
of MSE and MPs as a result of superior management that better meets stakeholder

EXECUTIVE SUMMARY – 15
MANAGEMENT STRATEGY EVALUATION AND MANAGEMENT PROCEDURES © OECD 2010
objectives. Use of MPs can reduce rent seeking behaviour focused on management
decisions and engender a long term management focus. In some cases, MPs will reduce
ongoing assessment and management costs by reducing the required frequency of stock
assessments. Therefore greater investment in MSEs and implementation of MPs is
justified and OECD countries would do well to follow the example of South Africa and
make MSE and MPs an integral part of fishery management.
Recommendation: Government authorities responsible for fishery management
should consider making strategic investments to increase capabilities to undertake MSEs
and implement MPs. While this may increase management costs in the short run it should
reduce them in the long run as well as improve the effectiveness of fishery management.

16 – WHAT IS MSE AND WHY CONSIDER USING IT
MANAGEMENT STRATEGY EVALUATION AND MANAGEMENT PROCEDURES © OECD 2010
1. Introduction
The depletion and collapse of fisheries is widespread (Myers and Worm, 2003; Worm
et al., 2009). Economic mismanagement of fisheries is still more commonplace as the
examples include but are not limited to most cases of depletion and collapse (Grafton et
al., 2007). The Food and Agriculture Organization (FAO) estimates that globally between
25 and 30% of assessed fish stocks are overfished (FAO, 2009). In the US the National
Marine Fisheries Service estimated that 24% of assessed fish stocks were in an overfished
state in 2007 (NMFS, 2008). Since, in most cases the economically optimal stock size is
higher, and the fishing mortality rate lower, than levels defined as overfished and
overfishing, the number of economically overfished stocks is almost certainly higher.
There is increasing resolve in many OECD countries to end overfishing and rebuild
depleted fish stocks. Several countries have passed legislation that mandates an end to
overfishing and includes requirements for rebuilding of depleted stocks above levels that
support maximum sustainable yield (i.e., above Bmsy) in specified time frames. Although
the trend toward overfishing and depletion of fish stocks has yet to be reversed, many
depleted stocks have been or are being rebuilt and many fisheries are now being managed
sustainably (Worm et al., 2009). New ―catch share‖ management systems being
implemented in a number of fisheries using individual quotas or harvest cooperatives
create incentives for increased efficiency and may also promote rebuilding and better
biological management (Costello, Gaines and Lynham, 2008).
Unfortunately, the political resolve to end overfishing, and even the support of fishery
stakeholders for doing so, is not a sufficient condition for achieving rebuilding and
effective sustainable management of depleted fisheries. Effective fisheries management is
nearly always hindered by uncertainty in the size, composition and spatial distribution of
stocks; uncertainty in stock dynamics; stochastic and unpredictable variation in growth of
the fish stock; error in implementation of management prescriptions; and uncertainty and
variation in economic parameters such as costs and prices (Francis and Shotton 1997;
Jensen 2008). Even the best fishery stock assessments are highly uncertain. While
scientists often understand fairly well what level of exploitation will drive a fish stock
toward depletion, there is much less understanding of how stocks rebuild and how
rebuilding is impacted by species interactions, climate, and loss of biodiversity and
habitat (Worm et al. 2009). Even determining appropriate catch levels for healthy fish
stocks can be extremely difficult due to natural variability in their productivity that is
often hard to assess in a timely fashion.
For logistical, legal, and political reasons, many if not most fisheries attempt to
implement a constant harvest rate policy based on mean or median model predictions
from the ―best‖ current assessments of the fish stock. However, when total allowable
catches (TACs) are set on the basis of the best assessment each year they can lead to
TACs trending almost independently of the fishery biomass because recommendations
reflect noise arising from choices of data sets, assessment model assumptions, and
analytical methods rather than actual changes in the fish population (Butterworth, 2007).
This problem is aggravated by the fact that there is typically at least a two year lag
between the data used for the assessment and the implementation of the management
recommendation based on it (De Oliveira et al., 2008). This is particularly important for a
fishery concentrated on a few year classes since estimates of the undersized year classes
in the pipeline are typically highly uncertain. As a consequence the fish stock, and the
fishing mortality rate, may be allowed to stray far from the target level. Not only does this
EXECUTIVE SUMMARY – 17
MANAGEMENT STRATEGY EVALUATION AND MANAGEMENT PROCEDURES © OECD 2010
increase the risk of depletion, it tends to lead to unnecessary variation in TACs that is
economically and socially disruptive.
In recognition of the uncertainty and natural variability of fish stocks and the risk that
they will not rebuild easily when depleted, a precautionary approach has been
recommended by the FAO (FAO 1996) and is incorporated in legislation and regulatory
guidelines in some countries. However, the precautionary approach is typically
implemented through an ad hoc reduction of the target fishing mortality rate from the rate
associated with maximum sustainable yield (Fmsy) rather than a rigorous evaluation of
the adjustments needed to reduce risks of overfishing or collapse to specified levels. In
fact this is essentially the approach for setting annual catch limits prescribed in recent
U.S. regulations (Federal Register, 2008). The precautionary approach is typically applied
to reduce biological risk, but economic risk associated with unnecessary or extreme
reductions and high variation in catches is not usually considered. As a result there is
often political pressure against reductions in TACs even when those reductions may be in
the direct economic interest of the fishery participants and the communities they live in.
It is clearly desirable to design fishery rebuilding strategies and ongoing harvest
strategies that are robust to uncertainty and natural variation, and that balance biological
and socioeconomic objectives. A methodology known as management strategy evaluation
(MSE), also referred to as the management procedure (MP) approach, is explicitly
designed for this purpose. MSE is a simulation-based methodology that is meant to
identify harvest strategies with ―adequate, albeit potentially suboptimal, management
performance with respect to multiple criteria over a wide range of model assumptions
about the dynamics of the resource‖ (Cooke 1999). MSE can help identify and facilitate
effective implementation of management strategies that balance a variety of stakeholder
objectives including limiting biological risk but also increasing profitability and stability
of harvest over time.
Like bioeconomic modelling, MSE is a tool for evaluating the potential performance
of particular management strategies and indentifying strategies that meet objectives. In
fact, MSEs can and generally should include bioeconomic models to provide assessments
of economic along with biological performance and to account for the impact of human
behaviour which can cause catches to deviate from target levels. However, unlike many
bioeconomic models, MSE is specifically designed to realistically account for error and
uncertainty in data and model structures and to provide explicit quantitative management
advice that can be directly applied by fishery managers to set catch or effort limits. MSEs
also generally assess performance based on multiple objectives rather than focusing
solely on optimal economic performance.
In this paper I review several examples of MSEs that have been used to evaluate, and
in a few cases implement, rebuilding strategies for depleted fisheries. These case studies
demonstrate how the MSE approach has been applied and some of the advantages and
limitations of the approach. I also compare and contrast MSE with bioeconomic
modelling and suggest ways each approach can be improved by drawing from the other.

WHAT IS MSE AND WHY CONSIDER USING IT – 19
MANAGEMENT STRATEGY EVALUATION AND MANAGEMENT PROCEDURES © OECD 2010
2. What is MSE and Why Consider Using It
MSE is a general framework aimed at designing and testing MPs which specify
decision rules (heuristics) for setting and adjusting TACs or effort levels to achieve a set
of fishery management objectives. Simulation testing is used to determine the extent to
which an MP is robust to uncertainty, and MPs are usually selected so that there is a
reasonable likelihood that the (pre-specified and quantified) management goals can be
satisfied (De Oliviera et al. 2008). Butterworth, Cochrane and De Oliveira (1997) define
an MP, as a simulation-tested set of rules used to determine management actions, in
which the data, the methods for analysing the data (including any method of stock
assessment) as well as the harvest control rule (HCR) are pre-agreed and pre-specified.
Note that an HCR, which might be something like setting the TAC to achieve a specified
constant fishing mortality rate, is not itself considered an MP. An MP must also specify
the data and assessment methods for determining how the TAC that achieves that fishing
mortality rate is actually calculated.
The MSE framework and MPs were first developed by the Scientific Committee of
the International Whaling Commission (IWC) during the 1980s (Punt and Donovan 2007)
and have been applied to a number of fisheries since, predominantly in South Africa,
New Zealand and Australia. MSE has been applied primarily to single-species fisheries;
however, an MSE was conducted for the Southeast fishery in Australia, a multispecies
and multigear fishery spanning a large and diverse geographic range (Smith, Sainsbury
and Stevens, 1999; Smith et al., 2007). Some of the most illustrative examples of the
MSE approach are the MPs implemented to rebuild the South African hake fishery and
the New Zealand NSS rock lobster fishery which are discussed in more detail later in this
paper. Both of these cases are examples of full implementation of the MSE approach
involving joint determination of objectives with stakeholders, simulation-based
evaluation of an MP, and actual implementation of the MP for an extended period of time
(though with adjustments made to it over time).
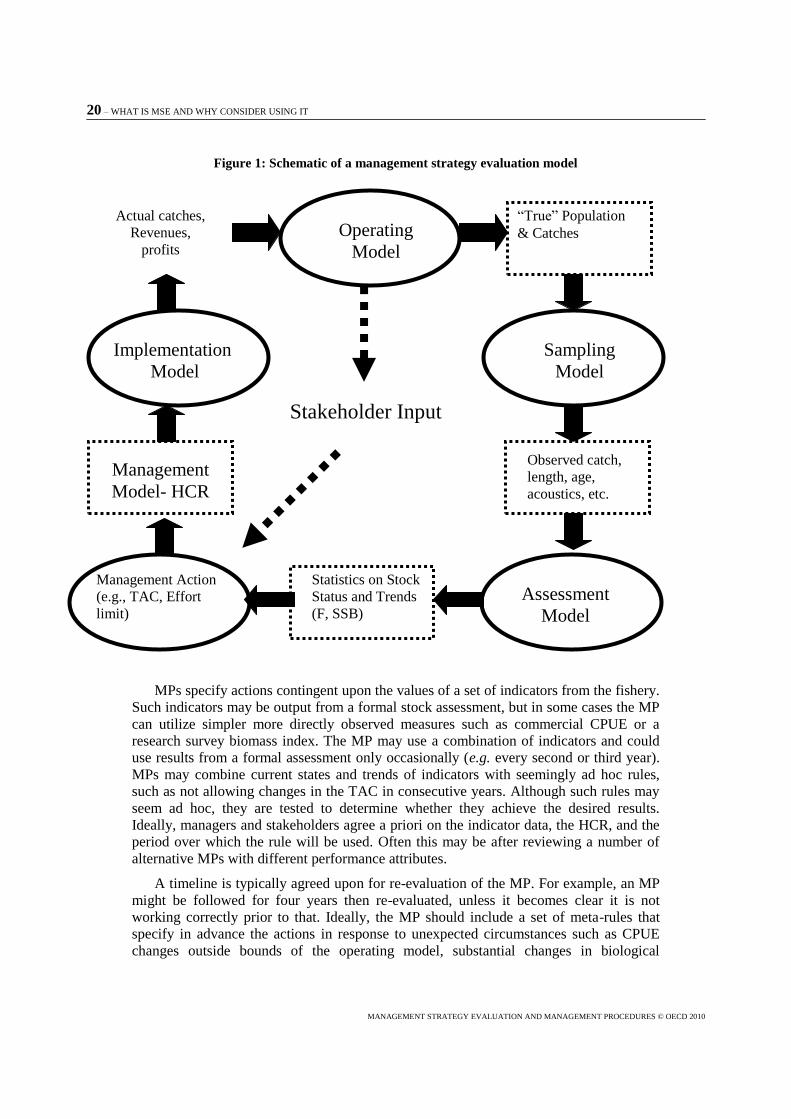
A prototypical MSE incorporates a number of interlinked model structures:
population dynamics; data collection; data analysis and stock assessment; an HCR that
dictates a specific management action (e.g., the TAC); the harvest decision process; and
implementation of that management action (McAllister et al. 1999). An operating model
is typically used to generate ‗true‘ ecosystem dynamics including the natural variations in
the system (Figure 1). Data are sampled from the operating model to mimic collection of
fishery dependent data and research surveys (and their inherent variability). These data
are passed to the assessment model. Based on this assessment and the HCR, a
management action is determined (e.g., a change in the TAC). Fleet effort and catch are
then modelled, ideally accounting for potential error in implementation, and resulting
catches are fed into the operating model. By repeating this cycle the full management
cycle is modelled. It is possible to test the effect of modifying any part of this cycle
including changes to the operating model, assumptions about noise, etc. Alternative MPs
can be compared by running many stochastic simulations for several years to identify the
performance of a rule according to different metrics under the likely range of conditions.
The objective is to identify MPs that perform ―well‖ under the range of conditions based
on the pre-determined objectives and constraints. For example, we might be looking for a
rule that leads to stock collapse less than 1% of the simulation runs, a low average
variance in TACs over time, and relatively high average catch and stock size. The choice
of the MP generally involves a compromise between various objectives since they are
often at odds.
20 – WHAT IS MSE AND WHY CONSIDER USING IT
MANAGEMENT STRATEGY EVALUATION AND MANAGEMENT PROCEDURES © OECD 2010
Figure 1: Schematic of a management strategy evaluation model
MPs specify actions contingent upon the values of a set of indicators from the fishery.
Such indicators may be output from a formal stock assessment, but in some cases the MP
can utilize simpler more directly observed measures such as commercial CPUE or a
research survey biomass index. The MP may use a combination of indicators and could
use results from a formal assessment only occasionally (e.g. every second or third year).
MPs may combine current states and trends of indicators with seemingly ad hoc rules,
such as not allowing changes in the TAC in consecutive years. Although such rules may
seem ad hoc, they are tested to determine whether they achieve the desired results.
Ideally, managers and stakeholders agree a priori on the indicator data, the HCR, and the
period over which the rule will be used. Often this may be after reviewing a number of
alternative MPs with different performance attributes.
A timeline is typically agreed upon for re-evaluation of the MP. For example, an MP
might be followed for four years then re-evaluated, unless it becomes clear it is not
working correctly prior to that. Ideally, the MP should include a set of meta-rules that
specify in advance the actions in response to unexpected circumstances such as CPUE
changes outside bounds of the operating model, substantial changes in biological
Sampling
Model
Operating
Model
Actual catches,
Revenues,
profits
Implementation
Model
―True‖ Population
& Catches
Stakeholder Input
Management
Model- HCR
Assessment
Model
Observed catch,
length, age,
acoustics, etc.
Statistics on Stock
Status and Trends
(F, SSB)
Management Action
(e.g., TAC, Effort
limit)
WHAT IS MSE AND WHY CONSIDER USING IT – 21
MANAGEMENT STRATEGY EVALUATION AND MANAGEMENT PROCEDURES © OECD 2010
parameters, or external impacts not accounted for in the model (Rademeyer, Butterworth
and Plagányi, 2008b).
The MSE approach and use of MPs to determine regular management actions has
several potential advantages over the traditional pattern of regular or periodic stock
assessments followed by TAC determination (Geromont et al. 1999). The MSE approach
is expressly aimed at identifying MPs that are robust to natural variation in the system
and to uncertainty and error, both in stock assessments and implementation. The analysis
usually attempts to identify rules that perform well under a variety of potential future
circumstances and with uncertainty in assessments. Often, when there are uncertainties
about the underlying stock structure or important processes such as migration or
recruitment, an MP may include simulations with multiple variations of the operating
model to test the robustness of the MP given alternatives model structures.
For some fisheries, it is possible to find an empirically-based model-free MP with an
HCR based directly on fishery-dependent data or simple indices from surveys requiring
less frequent stock assessment. This can reduce the required frequency of full stock
assessments and thereby save time and resources. Using a model-free MP to adjust TACs
or effort levels can be more transparent and appear fairer to fishers than the traditional
approach which relies on a complex stock assessment model that few if any stakeholders
understand. Note that this is not meant to suggest that full stock assessments are not
necessary. They must still be done periodically to evaluate the performance of the MP
and whether changes are needed, but full stock assessments may be not be needed as
often and the TAC or effort level may be determined in most years by a simpler
procedure.
A primary goal of the MSE approach is to assess the performance of different rules in
balancing multiple and sometimes competing objectives (e.g., low risk of overfishing and
stock collapse; stability in TACs over time; and maximum catches or profits). The lack of
clear and precise objectives has been described as one of the major causes of failure in
fisheries management (Cochrane, 2002). The MSE process, if done correctly, should lead
to explicit definition of management objectives. Ideally this should involve all
participants in the fishery. This can help foster a long-term view as well as ensure
acceptance and adherence to management advice. There are typically conflicts and trade-
offs between objectives. For example, a workshop fishery scientists held with the
National Rock Lobster Management Council in New Zealand (a group that includes
recreational and Maori stakeholders as well as commercial quota holders) held in 2000
agreed upon six primary management objectives for their fisheries (Bentley et al. 2003b):
maximize catch, maintain high abundance, minimize frequency of catch adjustments,
minimize risk of low biomass levels, maximize the rate of rebuilding and maintain a wide
size range of lobster. Some management strategies may result in lower average yields but
maintain higher average CPUE and thus lower harvest costs. Some strategies may provide
better long term performance at the expense of lower catches or profits in the short run.
Stakeholders often find it difficult to put explicit, quantitative weights on multiple
performance indicators that can be used to quantitatively rank different MPs. For this
reason, MSEs typically report on a variety of indicators and give stakeholders the
opportunity to consider the trade-offs subjectively (Bentley et al. 2003b). Ideally,
stakeholders reach a consensus on which rule balances the objectives rather than ranking
and selecting an MP based on a particular metric such as maximum average catch of
profit.

22 – WHAT IS MSE AND WHY CONSIDER USING IT
MANAGEMENT STRATEGY EVALUATION AND MANAGEMENT PROCEDURES © OECD 2010
Standard fishery assessments and projections often provide error bounds on
predictions based on bootstrap methods that sample from the observations used to fit the
assessment model or allow for stochastic future recruitment, but these projections often
fail to account for the full range of uncertainty in the assessment, particularly errors in
model structure. The simulation-based methodology of MSE allows for evaluation of
complex biological systems, complicated management strategies and constraints, and
multiple sources of uncertainty. It can be used to test the ramifications of alternative
plausible assumptions about stock structure and fish biology. It allows for direct
incorporation of the models and stock assessment processes already used to assess and
manage the fishery. An MSE typically provides outcome information to inform a variety
of performance metrics, and generally produces information on the full distribution of
potential outcomes from hundreds if not thousands of stochastic trials (i.e., a Monte Carlo
approach).
The flexibility and informational richness of the MSE approach comes at a cost
however. Butterworth (2007) notes that development of an MP can be very time-
consuming and that MP can reduce the flexibility of managers after implementation. Paul
Starr, who has worked on several MPs, estimates that developing an MP on average takes
twice the resources and time of an ordinary stock assessment, but, once it is in place, it
can yield real savings by not having to repeat the assessments as often (Paul Starr,
personal communication September 2009). Nevertheless, the front-end costs and the time
to develop an MP can be considerable and should be factored in before opting to adopt
this approach.
In the end, the MP is only as good as the underlying models and assumptions it is
based on. The success or otherwise of the MSE framework depends on the extent to
which the true range of uncertainty can be identified and represented in operating models
(De Oliveira et al., 2008). These uncertainties include: natural variation in dynamic
processes such as recruitment, growth, natural mortality and the selectivity of the fishery;
errors in data collected on the fishery (e.g. age sampling, catches, surveys); error in
estimating parameters of the operating model and the assessment model; misspecification
of the model structure; and implementation error associated with differences in prescribed
versus actual catches (Kell et al. 2006a). Rochet and Rice (2009) note that ―the use of
complex mathematics and statistical tools risks giving users a false sense of rigor
implying a degree of precision and accuracy that may be misleading, particularly for low
probability outcomes‖. If undesirable outcomes have not been experienced enough times
to know the conditions that cause them, and MSE may not bracket the range of possible
outcomes and is unlikely to accurately determine the probability of their occurrence.
Since a common focus of MSE analyses is to identify MPs with a very low probability of
very bad outcomes, the choice of the MP may be driven by the potential outcomes whose
probability of occurrence is least well understood.

MSE AND BIOECONOMIC MODELLING – 23
MANAGEMENT STRATEGY EVALUATION AND MANAGEMENT PROCEDURES © OECD 2010
3. MSE and Bioeconomic Modelling
MSE and bioeconomic modelling are similar in purpose and are not mutually
exclusive; however, there are typically important divergences between them in practice.
Consequently each tends to lack some of the important advantages of the other, though
this need not be the case. There are very few examples of MSEs that have explicitly
incorporated economics either in modelling behaviour or in evaluating MPs against
explicit economic objectives. However, there are many ways in which economics can
strengthen the MSE methodology. Bioeconomic models on the other hand, often use
overly simplistic models and fail to provide specific and directly usable advice to fishery
managers.
MSEs and the MPs they evaluate should take into account variation and uncertainty in
economic variables that effect behaviour and how biological performance translates into
economic performance. MSEs ideally include, as part of the suite of connected models,
an implementation model that allows for a divergence in the desired level of catch (e.g.,
the TAC or target catch) and the actual catch. This is likely to be affected by fishing
behaviour driven by economic considerations and responses to regulation. Most MSEs
have focused on management using TACs and often assume prescribed catches are
simply taken, perhaps with some random variation. Implementation models that account
for behavioural responses to the economic incentives created by regulations, input and
output prices and biological and physical characteristics of the fishery may be better able
to predict how future catches will compare to target catches or at least provide better
insight into how much and in what way they may diverge.
While most MSEs have evaluated output controls to regulate catch, MSEs that
consider effort-based management strategies (e.g. Christensen 1997) may be preferable in
some fisheries. For these analyses the importance of modelling behaviour and
implementation error will increase the need to involve economists. MSEs might also be
used to evaluate tax-based management instruments. Although tax-based management
approaches appear to have advantages over quota-based strategies in many fisheries, they
are almost never used. MSEs may provide a framework to convince stakeholders of the
benefits of such an approach as well as to provide necessary assurances to managers that
it can achieve biological objectives and meet legal constraints. Even for quota-based
strategies, understanding economic behaviour may be critical. Christensen (1997) found
losses due to high-grading with a quota based HCR for Greenland shrimp to be four times
the magnitude due to biological uncertainty. Implementation error that allowed catches to
exceed TACs of Icelandic cod is one of the factors that undermined the success of the
HCR implemented in that fishery (ICES 2005).
The MSE approach could also be strengthened by incorporating explicit economic
objectives and performance metrics, including measures of social and economic risk (e.g.
loss of markets if a fishery is closed or effects on employment). MSEs could be designed
to predict how harvest costs, revenues, producer and consumer surplus, or other welfare
measures will be impacted by the MP choice. Holland and Hererra (2009) note that
assumptions about cost structure, price flexibility and risk preferences can alter optimal
strategies substantially and if ignored may lead to selection of strategies that perform
more poorly that the model projected. For fisheries that are rebuilding, determining the
present value of alternative rebuilding schedules could be very useful information to
stakeholders, particularly in fisheries managed with individual quotas where the value of
future fishery profits should be capitalized in the value of quota. It is not uncommon that
24 – MSE AND BIOECONOMIC MODELLING
MANAGEMENT STRATEGY EVALUATION AND MANAGEMENT PROCEDURES © OECD 2010
a quicker rebuilding strategy and a higher final biomass target can increases the long term
value of the fishery and providing this information in a clear and understandable format
to stakeholders might generate support for more conservative management.
MSEs are designed to provide explicit advice on how to adjust TACs or other
regulations in response to pre-agreed indicators that can be derived with existing data
collection programs and assessment methods. They often incorporate sophisticated and
complex operating models that match up with the stock assessment models used in the
fishery providing some confidence that the simulated biological system is consistent with
the current state of knowledge. Bioeconomic models, in contrast, are typically not
designed to provide explicit management advice that can be directly implemented by
fishery managers, often seeking to provide somewhat generalisable results. But the focus
on the general may undermine the applicability to any particular fishery with specific
characteristics and objectives that can substantially alter the ―optimal‖ management
approach.
Bioeconomic models are often geared more toward providing qualitative advice such
as the relative advantages of alternative rebuilding rates or harvest strategies, or the
effectiveness and efficiency of alternative regulatory approaches (e.g., output vs. input
controls) and management tools and actions (e.g., area closures or capacity reduction).
Bioeconomic models are often based on simplified biological models much different from
those underlying the stock assessments used to make management recommendations.
They rarely take into account the degree and nature of uncertainty associated with the fish
stock biomass and growth, often assuming that fishery managers have perfect knowledge
of the biology. While there are many examples of bioeconomic models that explore how
to adjust management in the face of various types of uncertainty (see Holland and Herrera
2009 for a review), these models tend to provide qualitative rather than specific
quantitative advice on how to adjust harvest recommendations and incorporate very
simplified biological models to make them tractable to dynamic optimization. Because
they do not explicitly model how data is collected and used to implement the HCR,
bioeconomic models do not provide a test of robustness of the overall stock assessment
and management process.
Bioeconomic models, particularly those designed to identify the optimal harvest
strategy, often tend to focus on maximization of profits or fishery rents rather than trying
to identify management strategies that balance alternative and sometimes competing
objectives such as low biological risk, low variability of catch, and high profits.
Identifying strategies that balance these objectives can be particularly important for
rebuilding fisheries where objectives and concerns for maintaining fishing communities,
infrastructure and access to markets may constrain the acceptable reductions in catch
levels. While these might be included as constraints in a bioeconomic model it may
difficult or impossible to incorporate their economic value into a single objective
function. By providing information on a variety of performance indicators and testing a
range of strategies with different performance characteristics, MSE allows stakeholders to
identify management strategies that truly balance objectives in contrast to strategies that
focus on one objective and satisfy other constraints. Other modelling techniques such as
multi-objective programming can also provide information on trade-offs between
objectives (as can an examination of shadow values of constraints in constrained
optimizations). The important thing is to provide stakeholders with the opportunity to
evaluate trade-offs subjectively rather than relying on a decision process based solely on
quantifiable and comparable metrics.

MSE AND BIOECONOMIC MODELLING – 25
MANAGEMENT STRATEGY EVALUATION AND MANAGEMENT PROCEDURES © OECD 2010
In sum, MSEs and bioeconomic models are not mutually exclusive and are sometimes
overlapping. A more realistic depiction of economic behaviour and consideration of
economic objectives could improve the accuracy and the utility of MSEs to stakeholders.
Incorporating more realistic biological models that explicitly consider the various types of
uncertainty typically considered in an MSE and provide more specific management
advice would make bioeconomic models more useful to fishery managers. A merging of
the two, i.e., incorporating bioeconomic models in the MSE framework, is likely to be the
most useful approach for providing management advice to fishery managers and
stakeholders. The will require more collaboration between economists and fishery
scientists. It may also increase the complexity of an MSE and the cost and time associated
with its development. Since MSEs are already typically complex and costly, the benefits
of including economics may not always outweigh the costs particularly if there is
expected to be little behaviour-associated error in implementation of the HCR and if
stakeholders are primarily interested in biological outcomes or those outcomes provide
acceptable indicators of economic performance.


EXPERIENCES WITH MSE AND MPs – 27
MANAGEMENT STRATEGY EVALUATION AND MANAGEMENT PROCEDURES © OECD 2010
4. Experiences with MSE and MPs
Although the IWC began developing MPs in the 1970s, the earliest
implementation of an MP for marine fisheries did not take place until the early
1990s when South Africa began to utilize MPs in a number of fisheries (De
Oliviera et al. 2008). MPs are now formally incorporated in South Africa‘s
national approach to fishery management through the Marine Living Resources
Act which stipulates that the responsible Minister should be advised on ―the
establishment and amendment of operational management procedures, including
management plans‖ (Marine Living Resources Act, 1998). They are now
routinely used for most of the major fisheries in South Africa and are updated at
regular intervals (3–5 years). Importantly, since the late 1990s, fishery managers
have not modified TAC recommendations based on MPs unless motivated by
scientific justification based on new information (Punt, 2006; Plagányi et al.,
2007).The South African hake fishery was the first marine fishery anywhere in
the world to implement an MP (Rademeyer, Butterworth and Plagányi, 2008b).
The case study on that fishery below provides an excellent example to illustrate
how MSE is applied, its pros, cons, and pitfalls, and how to improve its
application.
No other countries have adopted the MSE and MP approach to managing
fisheries as completely as South Africa, but there are examples of its use and there
is growing interest in applying these methods. New Zealand began implementing
MPs in the mid 1990s, starting with a rock lobster fishery on the South Island
which we review below. The MSE approach to evaluating fishery management
strategies has also been used in several Australian fisheries though not to
implement a true MP. In Europe, there are a number of examples of
implementation of HCRs that were evaluated with an MSE framework and a few
from the US as well. Though none of these have led to implementation of what
could accurately be called an MP, they illustrate the potential of the MSE
approach as well as some of the institutional factors that can make it difficult to
move from a purely evaluative MSE to a fully implemented MP.
4.1 Rebuilding the South African Hake Fishery
Background on the South African hake fishery
The hake fishery is South Africa‘s most important fishery both in terms of
revenue and employment (Rademeyer, Butterworth and Plagányi, 2008a)
accounting for about half of the landed value of all South Africa‘s fisheries
(Butterworth and Rademeyer, 2005). The fishery is actually comprised of two
different species of hake, the shallow-water Cape hake Merluccius capensis and
the deep-water Cape hake M. paradoxus (Figure 2). However, the two species
look very similar and cannot easily be differentiated and, consequently,
assessments treated the two species as one until recently. The deep-water species
is harvested primarily by the offshore trawl fleet which accounts for around 85%
of total combined species catch. The offshore trawl fleet also catches a significant
amount of shallow-water hake which intermixes with the deep-water hake. A
longline fleet, which has landed and increasing share of the catch over time,
28 – EXPERIENCES WITH MSE AND MPs
MANAGEMENT STRATEGY EVALUATION AND MANAGEMENT PROCEDURES © OECD 2010
accounts for about 6.5% of total catch and also takes a mixture of the two species.
An inshore trawl and a handline sector take 6.5% and 2% of total catches, almost
solely shallow-water hake. The fishery has Western and Southern components
that have been assessed separately and were considered at one point to be separate
stocks for both species. It is now believed that the Western and Southern
components of each stock are actually single populations (Rademeyer,
Butterworth and Plagányi, 2008a).
The fishery was essentially an open access fishery until 1977 when South
Africa extended its EEZ to 200 miles. Between 1917 and 1977 the combined
species biomass was fished down from around 2 million metric tons (t) to around
300 thousand t (around 15% of the original biomass) (Rademeyer, Butterworth
and Plagányi, 2008a). After that point annual hake TACs were set by the South
African authorities and a conservative rebuilding plan was implemented.
Although it did not become clear until later, the deep-water hake species had been
fished down considerably more (to less than 10 % of the pristine biomass) while
the shallow-water hake has remained well above Bmsy at over 50% of the pristine
level. While catches of the shallow-water hake remained roughly steady after
1940 at around 50,000 t annually, catches of deep-water hake were nearly three
times that in the 1960s and early 1970s.
Since the late 1970‘s the hake fishery has been controlled largely by means of
company-allocated quotas within a TAC as well as limitations on the number of
vessels, and closed areas. Historically the offshore trawl fishery, which accounts
for 85% of catch, was dominated by a few large operators, but ownership has
broadened over time, from six companies in 1979 to 57 in 2001. However, the
three largest companies still control 55% of the quota (Powers et al., 2004). The
inshore trawl fishery, comprised of mostly small side trawlers, also has a
relatively small number of quota holders. The inshore longline fishery, which
began in 1994, adopted an effective individual quota rights system in 2002, and
the handline fishery for hake, which has operated since 1992, was granted quota
rights in April 2003. The quota owners in the offshore trawl fishery formed an
industry association, the South African Deepsea Trawl Industry Association
(SADSTIA), in 1974 (www.sadstia.co.za). In 1994, SADSTIA became a
―Recognized Industrial Body‖ in terms of the then Sea Fisheries Act, enabling it
to make management recommendations on behalf of the entire offshore hake
industry including on choices of the MPs used to manage the fishery.
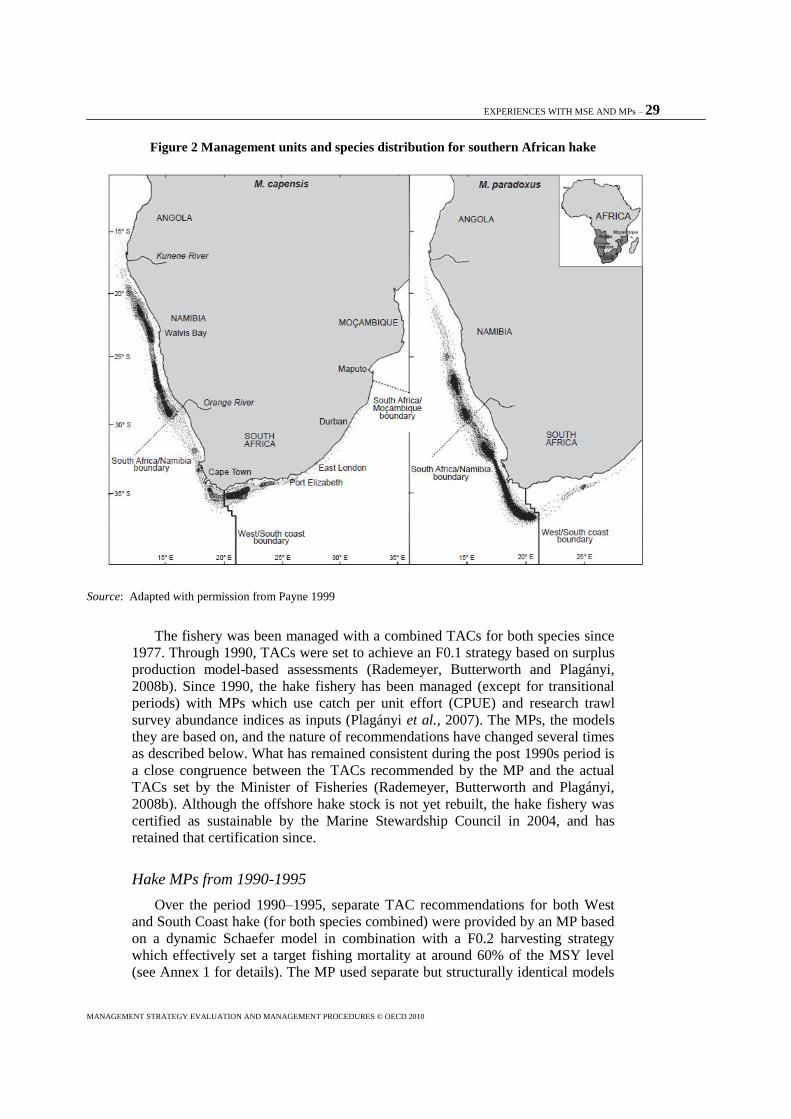
EXPERIENCES WITH MSE AND MPs – 29
MANAGEMENT STRATEGY EVALUATION AND MANAGEMENT PROCEDURES © OECD 2010
Figure 2 Management units and species distribution for southern African hake
Source: Adapted with permission from Payne 1999
The fishery was been managed with a combined TACs for both species since
1977. Through 1990, TACs were set to achieve an F0.1 strategy based on surplus
production model-based assessments (Rademeyer, Butterworth and Plagányi,
2008b). Since 1990, the hake fishery has been managed (except for transitional
periods) with MPs which use catch per unit effort (CPUE) and research trawl
survey abundance indices as inputs (Plagányi et al., 2007). The MPs, the models
they are based on, and the nature of recommendations have changed several times
as described below. What has remained consistent during the post 1990s period is
a close congruence between the TACs recommended by the MP and the actual
TACs set by the Minister of Fisheries (Rademeyer, Butterworth and Plagányi,
2008b). Although the offshore hake stock is not yet rebuilt, the hake fishery was
certified as sustainable by the Marine Stewardship Council in 2004, and has
retained that certification since.
Hake MPs from 1990-1995
Over the period 1990–1995, separate TAC recommendations for both West
and South Coast hake (for both species combined) were provided by an MP based
on a dynamic Schaefer model in combination with a F0.2 harvesting strategy
which effectively set a target fishing mortality at around 60% of the MSY level
(see Annex 1 for details). The MP used separate but structurally identical models

30 – EXPERIENCES WITH MSE AND MPs
MANAGEMENT STRATEGY EVALUATION AND MANAGEMENT PROCEDURES © OECD 2010
to provide TAC recommendations for the Western and Southern stock areas;
however, the TAC implemented by the Minister, for this and later MPs, was for
both coasts and species combined based on adding the TAC recommendations for
each coast (and later species). The industry, however, agreed to operate to achieve
roughly the split between coasts indicated by separate TAC recommendations
(Butterworth and Rademeyer 2005).
Although the 1990 MP itself provides annual TAC recommendations based on
an assessment done with a simpler age-aggregated surplus production model, the
MP was tested and selected with an MSE that used an age-structured operating
model. Alternative MPs that used age structured assessment models to provide
annual TAC recommendations were tested but were found to lead to greater inter-
annual variability in catches with no compensatory gains in terms of either
increased average catch or decreased risk. In other words, these MPs were more
likely to respond to noise in the data instead of the true abundance trends.
In the mid-1990s, problems started to arise with the MP when the assessment
scientists began to use a GLM-standardised commercial CPUE index which
suggested that CPUE was not increasing as much as predicted. It was also realised
that there had been a change in selectivity toward larger fish due to reduced use of
illegal net liners (Geremont et al. 1999). If the existing MP had been applied
using the new GLM-standardised CPUE data, it would have led to a severe drop
in TAC, largely because the age-aggregated model was unable to take the change
in fishing selectivity into account.
Given the problems apparent with continued use of the original MP, a search
was begun for new MP that would provide acceptable socio-economic stability
for industry while at the same time resulting in biological risks that were deemed
acceptable. The three main objectives considered in selecting the new MP were:
(a) a high probability for the resource to recover to Bmsy within the next 10 years,
(b) a low probability of a net decline in the spawning biomass over this 10-year
period and (c) a low probability of a decrease in the TAC early in the 10-year
period (Rademeyer, Butterworth and Plagányi, 2008b). For 1996 and 1997, while
a new MP was being developed, the TAC was frozen at the 1995 level.
Hake MPs from 1999-2007
A new MP for the West Coast hake stock was developed first since the
problems with the West Coast MP seemed greater. The new MP switched to a
Fox production model which was found to perform better than the Schaefer
model. Decision makers were presented with results on performance of the MP
with different target fishing mortalities and ultimately opted for an ƒ0.075 (see
Annex for details).The candidate MPs were checked for robustness to: (1)
different levels of recruitment variability; (2) bias in CPUE as an index of
abundance; (3) absence of future surveys; (4) regime shifts (reflected by a
changing value of the underlying carrying capacity) (5) different natural mortality
schedules; and (6) allowance for discarding. Punt et al. (1995) had previously
conducted tests of the consequences of misplacement of the boundary between the
West and South Coast stocks. The MP was found to be relatively robust except
for a combination of a positive CPUE bias and an absence of future surveys.
Unfortunately the survey was interrupted two years later due to mechanical
problems which apparently did lead to problems with the MP.
EXPERIENCES WITH MSE AND MPs – 31
MANAGEMENT STRATEGY EVALUATION AND MANAGEMENT PROCEDURES © OECD 2010
A new South Coast hake MP was developed subsequent to the new West
Coast MP and first implemented in 2000. It was targeted first at the M. capensis
component of the resource only. The South Coast M. paradoxus component was
computed as an ad hoc proportional addition to the West Coast MP output based
on the average ratio of the catches from these two components of the overall
resource for the preceding 5 yrs. Its primary objective was to maintain the CPUE
at its current level for reasons of economic viability, even though this was
expected to maintain abundance well above Bmsy. The new South Coast shallow-
water hake MP was of the same form as the one used for the West Coast (based
on a Fox-form age-aggregated production model) but implemented an f0.3
harvesting strategy which results in a considerably more conservative exploitation
rate than the West Coast MP. This was necessary to keep the biomass at a high
level. This MP was used to recommend the South Coast M. capensis contribution
to the overall hake TAC from 2000 through 2006.
Hake MPs from 2007-2010
In 2001, it was planned to move over the next 2–3 yrs towards separate MPs
for M. capensis on the West Coast and South Coast (as in 2001), and a single MP
for M. paradoxus on both coasts. The reason for the planned change was to
account for the growth of the longline fishery which changed to age selectivity of
the fishery. In 2006, a new coast- and species-combined MP was adopted as the
default basis for TAC recommendations for the next four years, starting in 2007.
This description of the new MP summarises a more detailed discussion that can
be found in Rademeyer, Butterworth and Plagányi (2008b).
New candidate MPs were evaluated against three primary objectives. (1)
They should improve catch rates quickly in the short-to-medium term. Catch rates
for offshore trawlers have decreased appreciably since the turn of the century, and
given an increasing fuel price, it would become increasingly difficult for this
fishery to operate profitably unless catch rates improve substantially. The selected
MP is tuned to increase the CPUE of the offshore trawl fleet by 50% over the next
10 years to enhance the economic viability of the fishery. (2) In recognition of the
poor status of M. paradoxus, the MP should lead to recovery of that stock to
Bmsy over 20 years. (3) Finally, accepting some potentially large initial cuts to
achieve increased CPUE, the MP should lead to greater TAC stability over time.
Following some initial evaluations of model-based MPs, it was decided to
focus on empirically based MPs under which the TAC is increased or decreased
directly in relation to the magnitude of recent trends in CPUE and survey indices
rather than fitting an assessment model with that information and then deriving
TAC recommendations from the assessment model. The choice of an empirical-
based MP was made because it performed better than computationally feasible
model-based MPs and because it could be easily understood by stakeholders
which would facilitate acceptance.
Alterative candidate MPs were intensively evaluated. Given key uncertainties
regarding major considerations of resource status and productivity, a Reference
Set (RS) of 24 Operating Models (OMs) reflecting alternative assumptions about
the true populations dynamics of the fish stocks rather than a single OM, was
constructed for the South African hake resource. The performance of each
candidate MP was assessed using a number of robustness tests including scenarios
32 – EXPERIENCES WITH MSE AND MPs
MANAGEMENT STRATEGY EVALUATION AND MANAGEMENT PROCEDURES © OECD 2010
with different assumptions concerning discards and past catch series, biological
information (including natural mortality, recruitment, maturity-at-age), changes in
carrying capacity, current status of the resources and future data. The sensitivity
testing of the implementation model was somewhat less robust – it was assumed
that the split of the catches by species and fleet is known without error. The
selection process led to the recommendation that MP120% (detailed in Figure A1
of Annex 1) be adopted for the 2007–2010 period until the next scheduled major
review. The new MP is targeted to increase biomass of deep-water hake species to
20% of the pristine biomass by 2027. Application for 2007 saw the TAC reduced
from 150 000 t to 135 000 t.
As noted above, this MP, like past MPs is not meant to set management of the
fishery on autopilot indefinitely. A major review is scheduled in four years, and
there are agreed upon procedures, ―meta rules‖ to identify and act on ‗exceptional
circumstances‘ that indicate the need for recommendations to deviate from the
outputs from such MPs, or necessitate bringing the regular review forward. These
meta rules can be thought of as ‗rules‘ that pre-specify what should happen in
unlikely, exceptional circumstances when application of the TAC generated by
the MP is considered to be highly risky or highly inappropriate. They are not a
mechanism for making small adjustments, or ‗tinkering‘ with the TAC from the
MP. The need for invoking a meta rule is evaluated by the scientific working
group according to specified procedures (see Rademeyer, Butterworth and
Plagányi, 2008b for details). Examples of what might constitute an exceptional
circumstance include: survey estimates of abundance or CPUE trends that are
appreciably outside the bounds predicted in the MP testing; changes in catch
species composition in major components of the fishery or surveys that differ
markedly from previous patterns (and so may reflect appreciable changes in
selectivity).
An Evaluation the Use of MPs in the South African Hake Fishery
The institutional and legal setting of the South Africa hake fishery was
particularly suited to development and implementation of MPs, and no doubt was
important in maintaining support for this approach over time even though the MPs
did not always work as planned. The official recognition of MPs in the Marine
Living Resources Act as a preferred management approach is unique and ensures
that the Minister will at least consider this management approach. The planning
process for MPs in the South African hake fishery was facilitated by having a
fixed set of quota holders who are, in turn, represented by industry organizations
that have the legally recognized right to make management recommendations on
behalf of the industry. This not only facilitates industry engagement in the
process, it gives the Minister more assurance that an OPM that is agreed upon will
not be undercut politically by disaffected parties.
Despite the commitment to an MP approach and the resources dedicated to
implementing it, the experience with use of MPs in the South African hake fishery
has been mixed. MPs have not be successful in rebuilding the fish stocks as
planned (Figure 3) although this is arguably due to poor recruitment rather than
misspecification of TACs resulting in excessive exploitation rates. Both the
original MP and those implemented in the late 1990s failed to adjust for changes
in the fishery and/or the data informing the MP; however, these problem were
EXPERIENCES WITH MSE AND MPs – 33
MANAGEMENT STRATEGY EVALUATION AND MANAGEMENT PROCEDURES © OECD 2010
recognized and acted upon and new MPs were developed and implemented. Over
time the MPs have been improved to utilize new data and assessment techniques
and to account for changes in understanding of the stock structure. The process of
developing, testing and selecting MPs has clearly been costly in terms of time and
human resources, but it has also led to a better understanding of the fishery and
how available data can be used to manage it. It also reduces the required
frequency of stock assessments.
Without the counterfactual it is not possible to say how conventional
management without MPs would have performed, but there is little reason to
believe it would have done better. It is likely that annual adjustments of TACs
based on the ―best assessment‖ each year would have resulted in wider swings in
TACs over time which is clearly something that industry has been keen to avoid.
Perhaps the most important aspect of implementing MPs is engaging
stakeholders in their development to ensure that management meets their
objectives to the extent possible, particularly a reduction in uncertainty and
variation of future catches to the extent that is possible. As noted by one
commercial stakeholder, stakeholder involvement in a planning process such as
MSE not only allows them to ensure their objectives are considered, it can enable
them to reduce risk and can help create a cooperative atmosphere between fishery
manager and industry that is critical to ensuring that scientific management advice
is accepted and adhered to by decision makers and industry. There are very few
fisheries in the world for which management objectives are as clearly identified as
the South African hake fishery. An industry stakeholder sums up the advantages
of this planning process as follows:
“It is my view that controllable uncertainties can only be managed
successfully, i.e. risk be reduced, if they form the basis of an integrated
comprehensive fishery management strategy that embraces socio-economic
considerations, political imperatives, harvesting strategies, and economic
realities…..The aim of the process is to minimize controllable uncertainties, and
this is achieved by stakeholders participating in the forward-planning process
that leads to the strategy. Strategies should have long- and medium-term goals
and plans of action to achieve them. Members of industry will therefore be aware
what the future likely holds for them and will be able to make informed decisions,
so reducing the element of risk and developing cooperation among all parties to
achieve the mutually agreed goals.” (Penhorn 1999).
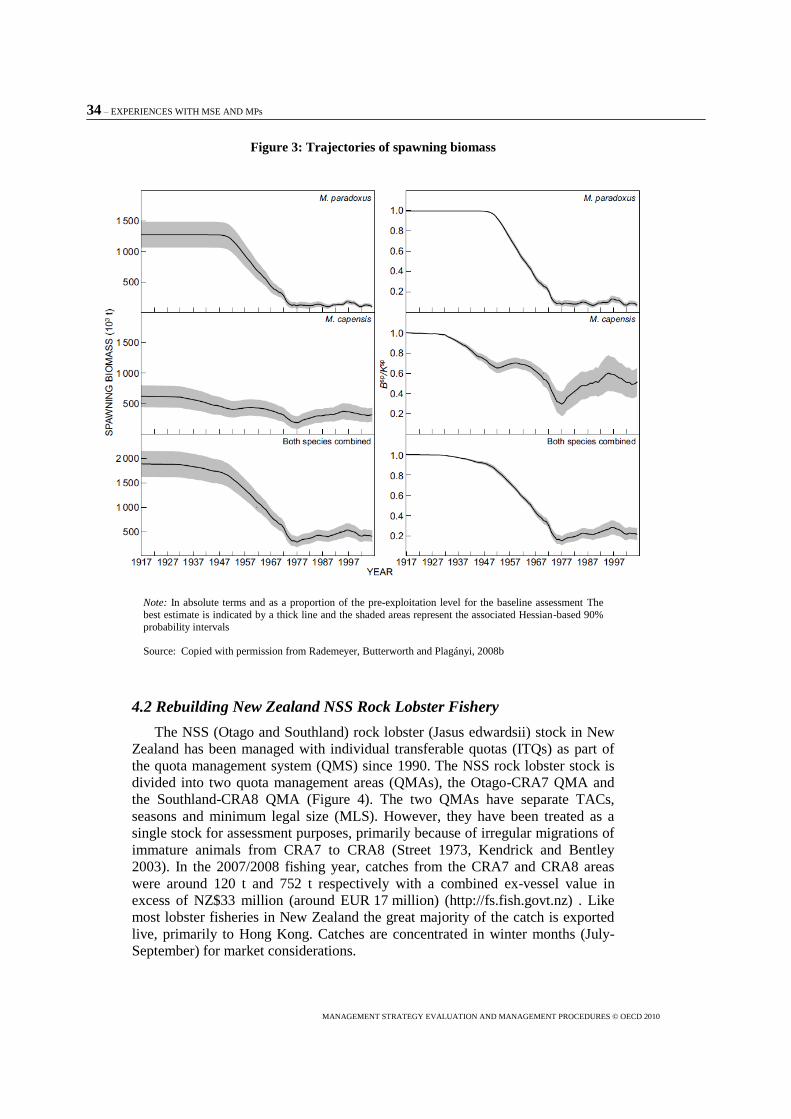
34 – EXPERIENCES WITH MSE AND MPs
MANAGEMENT STRATEGY EVALUATION AND MANAGEMENT PROCEDURES © OECD 2010
Figure 3: Trajectories of spawning biomass
Note: In absolute terms and as a proportion of the pre-exploitation level for the baseline assessment The
best estimate is indicated by a thick line and the shaded areas represent the associated Hessian-based 90%
probability intervals
Source: Copied with permission from Rademeyer, Butterworth and Plagányi, 2008b
4.2 Rebuilding New Zealand NSS Rock Lobster Fishery
The NSS (Otago and Southland) rock lobster (Jasus edwardsii) stock in New
Zealand has been managed with individual transferable quotas (ITQs) as part of
the quota management system (QMS) since 1990. The NSS rock lobster stock is
divided into two quota management areas (QMAs), the Otago-CRA7 QMA and
the Southland-CRA8 QMA (Figure 4). The two QMAs have separate TACs,
seasons and minimum legal size (MLS). However, they have been treated as a
single stock for assessment purposes, primarily because of irregular migrations of
immature animals from CRA7 to CRA8 (Street 1973, Kendrick and Bentley
2003). In the 2007/2008 fishing year, catches from the CRA7 and CRA8 areas
were around 120 t and 752 t respectively with a combined ex-vessel value in
excess of NZ$33 million (around EUR 17 million) (http://fs.fish.govt.nz) . Like
most lobster fisheries in New Zealand the great majority of the catch is exported
live, primarily to Hong Kong. Catches are concentrated in winter months (July-
September) for market considerations.

EXPERIENCES WITH MSE AND MPs – 35
MANAGEMENT STRATEGY EVALUATION AND MANAGEMENT PROCEDURES © OECD 2010
Figure 4: New Zealand NSS Rock Lobster Management Areas CRA7 and CRA8
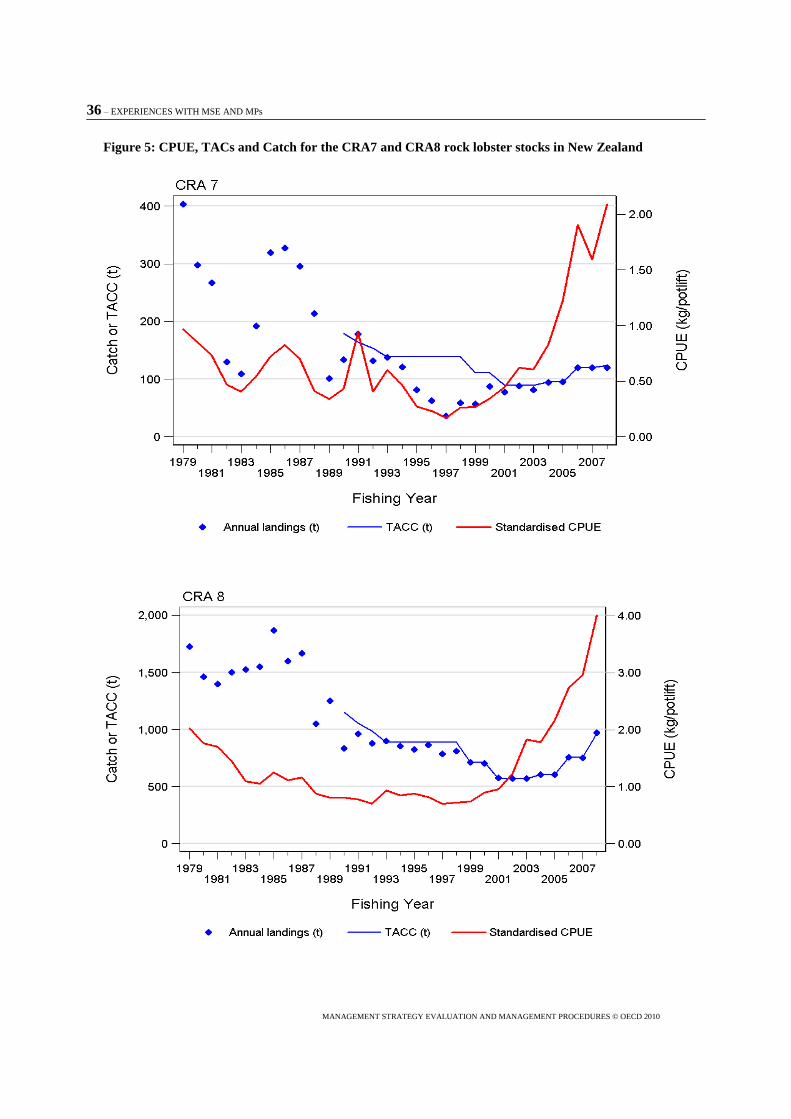
36 – EXPERIENCES WITH MSE AND MPs
MANAGEMENT STRATEGY EVALUATION AND MANAGEMENT PROCEDURES © OECD 2010
Figure 5: CPUE, TACs and Catch for the CRA7 and CRA8 rock lobster stocks in New Zealand

EXPERIENCES WITH MSE AND MPs – 37
MANAGEMENT STRATEGY EVALUATION AND MANAGEMENT PROCEDURES © OECD 2010
Rebuilding the NSS stock to safer and more productive levels was an agreed
management goal when the fishery was introduced to the QMS. Upon
introduction into the QMS, the TACs for the two QMAs were set well below
average catch levels in prior years and were subsequently reduced further. In the
mid 1990s, catch per unit effort (CPUE) was still low relative to historical levels,
and it was determined that an increased stock size could likely support higher
sustainable catches (Breen and Kendrick 1998, Starr and Bentley 2002). In the
mid 1990s, the National Rock Lobster Management Group (NRLMG), which
advises the Minister of Fisheries on rock lobster management issues, began to
explore the use of MPs to manage the fishery as a way to ensure fishery
rebuilding while also meeting stakeholder objectives including predictability and
stability of TACs. The fishery has been managed with a series of MPs since
1997.These MPs are arguably the best example of successful application of the
MP approach in rebuilding a depleted fishery (Figure 5).
MPs for rebuilding the NSS stock
In 1997, an MP was adopted with an HCR that was based on standardized
CPUE from the commercial fishery (CRA7 and CRA8 combined) as an index of
abundance, and acted on the TACs for both QMAs in concert (Starr et al. 1997).
Operation of the MP led to reductions in the TACs in 1999 and again in 2001.
After a few years of operation several concerns with the 1997 MP were
identified (Bentley, Breen and Starr, 2003a). First and foremost assessment
scientists came to the conclusion that the target trajectory, which was based on a
1996 assessment, was becoming dated and the final target of 3.61 kg/potlift was
unrealistic. While CPUE was growing in parallel to the trajectory it was
considerably lower. Although CPUE was growing, indicating the fishery was
rebuilding, continued operation of the MP would have led to further cuts in the
TAC. Finally, the appropriateness of basing the rule on combined CPUE data
from CRA 7 and CRA 8 was brought into doubt and was not supported by quota
holders. CRA 8 fishers complained that CRA 7 had always had low CPUE,
depressing the combined CPUE, while CRA 7 fishers complained that the 1997
rule would deny them access to any good recruitment that arrived in CRA 7.
The NRLMG began to explore refinements of MPs for the NSS stock and
incorporated new information from a stock assessment in 2001 to evaluate the
MP. This led to implementation of a new revised MP in 2002. The new procedure
set a lower CPUE target for rebuilding and utilized a revised MP that was found
to adhere to the rebuilding trajectory with less variation in the TAC. A single
HCR based on CPUE in Southland triggered changes in the TACs for both areas.
The MP was designed to achieve a CPUE based rebuilding target by 2014.The
target CPUE level of 1.9 kg/potlift was chosen because it reflected a CPUE level
from a past stable period of the fishery which stakeholders agreed was an
appropriate biomass. It did not reflect an estimate of Bmsy which was somewhat
problematic since New Zealand law prescribes Bmsy as a target biomass.
Nevertheless, this target has withstood challenges and remains the target CPUE.
The 2003 MP calculated a multiplier that determined the percentage decrease
or increase in the TAC for the next year. The formula for the multiplier took into
account both past CPUE (an average of the last three years) relative to the target
rebuilding trajectory and the rate of change (or gradient) of CPUE relative to the
38 – EXPERIENCES WITH MSE AND MPs
MANAGEMENT STRATEGY EVALUATION AND MANAGEMENT PROCEDURES © OECD 2010
target rate of change (see Annex 2). A summary indicator of these two measures
would then lead to a TAC that was 75% of the previous TAC if it suggested the
biomass was not keeping pace with the rebuilding trajectory or an increase to
125% of the previous TAC if it was growing faster than the rebuilding trajectory.
The inclusion of the recent rate of change of CPUE in the MP was designed to
make the rule operate more smoothly. A correction might not be required if
CPUE was moving in the right direction even if it was below the target, but,
alternatively, a correction could triggered it the biomass was moving in the wrong
direction even if CPUE was above the target. The MP also contained a provision
prohibiting changes to TAC in two consecutive years just as the 1997 MP had.
An unsuccessful bid for an MP change
Although the 2003 MP was not due for a formal review and update until 2007,
by 2004, the NSS stock was apparently rebuilding on or ahead of schedule, and
managers and stakeholders began exploring further refinements to the MP to
make it more suitable for maintenance of the fishery once it was rebuilt (assuming
that might well occur before 2007). Furthermore, the 2003 MPs use of only CRA8
CPUE as an indicator was considered as a temporary measure subject to future
review. A simulation model was developed to assess both the biological and
economic effects of alternative management strategies relative to the then current
one (Holland, Bentley and Lallemand 2005). Performance under the current MP
was compared with alternative MPs that included alternative CPUE targets and an
alternate MP for adjusting the TAC over time that was expected to be more
effective at maintaining biomass and CPUE at the target level. The simulations
also explored alternative stock management structures including: joint
management with an MP using a weighted average CPUE from both areas to
adjust TACs in both areas, and, separate management of the two QMAs, allowing
the TAC in CRA7 to be adjusted in-season in response to CPUE during the
season. Amalgamation of the two quota management areas into a single area with
one TAC and consistent size limits and seasons in both areas was also considered.
Unlike previous analyses, the simulations done in this study included an
economic sub-model that calculated revenues, costs and net revenues and
projected impacts of the value of quota shares. The simulations showed relatively
small differences in performance (both biological and economic) across the
alternative MPs and stock management strategies. The analysis did however
indicate substantial distributional differences of the different management
strategies. While the simulations suggested that the net value of the combined
CRA7 and CRA8 fishery would be increased by amalgamating the two areas, it
also appears that the gains from this policy would accrue to CRA7 quota owners
while CRA8 quota owners might in fact be slightly worse off than they would
with joint management. When presented with these results, quota owners in
CRA8, most of whom were also active fishers, expressed concern that the shift of
quota might lead to more fishing in the area they fish which could decrease their
catch rates. Although this appeared unlikely given that overall effort was
predicted to decline, the model was not able to address this question directly. It
also appeared that there could be negative effects on non quota owners as a result
of shifting catch from CRA7 to CRA8. Part-time lobster fishers in CRA7 that
relied on leasing of quota would probably no longer be able to continue fishing
lobster. They would lose a significant portion of their income which they might

EXPERIENCES WITH MSE AND MPs – 39
MANAGEMENT STRATEGY EVALUATION AND MANAGEMENT PROCEDURES © OECD 2010
have found difficult to replace. Changes to the MP were not taken up until the
scheduled review in 2007, which produced a new set of separate MPs for the two
fisheries.
The 2007 Maintenance MP
In 2007 a new set of separate and independent MPs for the CRA7 and CRA8
fishery were introduced aimed at maintaining the now rebuilt fishery at
sustainable and profitable levels. Both MPs use the most recent standardized
CPUE estimate as input. However, in contrast to the 2003 MP which used three
years of CPUE data, the 2007 MPs use only CPUE data from the most recent
twelve months including 6 months of the current fishing year. Both of the new
MPs produce TAC recommendations that are allowed to change every year unlike
previous MPs which did not allow a TAC change in two consecutive years. The
2007 CRA 7 MP calculates TAC as a simple linear function of standardised
CPUE from the most recent twelve months. The new CRA 8 MP, however, is not
a simple linear function of CPUE. The TAC is held constant over a wide range of
CPUE; it decreases at a faster rate than CPUE when CPUE is below a threshold
and it increases slowly when CPUE is above a threshold. The plateau creates
stability in the TAC which was a primary objective of the CRA 8 commercial
industry, outweighing the possibility of a higher average TAC.
Implementation of the MPs led to increases in the TACs in 2008/2009 for
both CRA7 and CRA8. The CRA7 TAC was raised from 140 to 144 t, and the
CRA8 TAC was raised from 842 t to 1053 t. The most recent annual standardized
CPUE estimate in 2009 for CRA 7 was 2.09 which, under the CRA 7 MP,
allowed for a 2009/10 TAC of 209 t, a substantial increase from the 2008/09
TAC of 143.9 t. In 2009, the standardized CPUE estimate for CRA 8 for the
previous 12 months was 3.84 kg/pot allowing for another increase of 57 t to give
a 2009/10 TAC of 1110 t. The Minister of Fisheries increased the 2009/10 TACs
for both CRA7 and CRA8 in accordance with the new MPs.
An evaluation of the use of MPs in the New Zealand Rock Lobster Fishery
As in South Africa, development and implementation of an MP in the NSS
rock lobster fishery was facilitated by the institutional structure for fishery
management in New Zealand. Of particular importance was the existence of
commercial stakeholder organizations (the New Zealand Seafood Industry
Council, SeaFIC, and the National Rock Lobster Industry Council (NRLIC)) with
legal ability to levy funds for research from quota holders and legitimacy as
representatives of quota holders in consultations with the government. This
enabled the industry groups to contract and pay for the development and
evaluation of the MPs that would likely not have occurred as part of the normal
Ministry science and management process.
In New Zealand's Quota Management System, TAC changes are relatively
rare and are extremely time-consuming for all parties. With over 97 species
grouped into over 600 separate quota stocks, each with its own TAC, it is difficult
to adjust TACs for many of them in any given year given the resources of the
Ministry and the stakeholders. MPs greatly simplify this process and allow the
system to be much more responsive. The NSS MP produced both increases and
40 – EXPERIENCES WITH MSE AND MPs
MANAGEMENT STRATEGY EVALUATION AND MANAGEMENT PROCEDURES © OECD 2010
decreases that were accompanied by very little debate and controversy (Breen et
al. 2009). As noted earlier, however, MPs do have large up front development
costs.
The perceived success of MPs for managing the NSS rock lobster stock led to
development and voluntary implementation of an MP in the CRA4 (Wellington-
Hawke‘s Bay) quota management area on the South end of the North Island.
Although the MP was not yet officially adopted by the Minister in the 2008–09
season, the CRA 4 quota owners abided by the MP and shelved 60% of their
quota (Breen et al. 2009).
Despite the apparent success of the MPs implemented for rock lobster, there is
no indication that MPs will see widespread use in New Zealand any time soon.
An MSE was initiated to explore an MP for hoki in 2003, but was tabled after a
decline in the stock due to poor recruitment forced large reductions in the TAC.
The modelling work required the design and evaluation of a new MP and the lack
of monetary and human resources to carry them out is likely to inhibit all but a
gradual uptake of MPs in the management system.
4.3 Use of MSE in the United States
For fish stocks that are determined to be overfished, it is common practice in
the US to simulate rebuilding trajectories associated with alternative harvest
strategies to find ones that meet legal requirements to rebuild by the target date
with at least a 50% probability. Rebuilding timelines are typically limited to 10
years unless the biology of the stock makes this infeasible in which case the
rebuilding schedule can be lengthened by one mean generation time (16 U.S.C.
1854 MSA § 304). The forward projecting simulations carried out to evaluate
rebuilding plans typically allow for stochastic future recruitment and may also
account for uncertainty in the current size and age structure of the fish stock. In
some cases these simulations are coupled with economic analysis that compare
the net present value of alternative rebuilding schedules (e.g. by comparing
average outcomes with alternative constant fishing mortality rates that lead to
rebuilding more quickly than required).
These simulations generally cannot be considered MSEs and, although fishery
management plans may adopt HCRs such as constant fishing mortality policy,
these HCRs could not be considered MPs since they do not generally specify the
data and assessment methods used to determine the TAC and they do not attempt
to simulate the application of those methods in determining HCRs taking into
account the potential for error in assessments and implementation. Evaluations of
the HCRs do not typically assess the performance of the harvest strategy against a
set of performance measures reflecting objectives determined by mangers and
stakeholders. Since they do not model the variability and error in application of
the harvest strategy that can be expected due to error in assessments and
implementation or error in the biological model underlying the simulations, they
generally do not provide an adequate means to evaluate the robustness of the
harvest strategy to uncertainty or an assessment of how well it can be expected to
balance potentially competing management objectives such as the speed and
certainty of rebuilding and the average level and variability of catches during
rebuilding.
EXPERIENCES WITH MSE AND MPs – 41
MANAGEMENT STRATEGY EVALUATION AND MANAGEMENT PROCEDURES © OECD 2010
Although there is growing interest in applying the MSE approach in the US,
there are very few examples of using an MSE framework to evaluate a
realistically implementable MP for fishery rebuilding. One notable exception is an
MSE designed to explore rebuilding strategies for West coast rockfish. Punt and
Ralston (2007) used an MSE framework to evaluate potential MPs for rebuilding
several overfished rockfish stocks managed by the Pacific Fishery Management
Council (PFMC). The analysis was not designed to lead to implementation of an
MP, but it did demonstrate the performance of alternative approaches to adjusting
HCRs that would be practical and would meet legal requirements, and that were
based on the current stock assessment approach and data streams and the
biological models underlying them. This MSE is interesting because it dealt with
fish stocks that could not be rebuilt within 10 years thereby allowing the
rebuilding schedule to be extended one mean generation. Simulated rebuilding
schedule ranged from 15 to over 80 years for different species. The simulations
allowed not only for adjustment of the fishing mortality rate that determines
catch, but also for the redefining the entire rebuilding plan if, during the course of
the simulation run it becomes apparent that the rebuilding could not be achieved
with at least 50% probability with any positive fishing mortality rate.
Consistent with the MSE approach, the simulations modelled uncertainty and
stochastic variability in the underlying biological system and uncertainty in the
assessments used to set TACs in the simulations. The analysis did not, however
attempt to model implementation uncertainty (i.e., deviation of actual catch from
the TACs specified by the MP). The base case MP began by choosing a fishing
mortality rate that achieved rebuilding to 40% of the unfished spawning potential
with 60% probability. The simulations modelled an assessment every four years at
which time the fishing mortality rate was adjusted downward (to maintain the
60% rebuilding probability) only if the probability of meeting the rebuilding
target by the target date fell below 50%. Otherwise it was left unchanged until the
next assessment. If it became apparent that rebuilding was not possible with any
positive fishing mortality, the rebuilding schedule was redefined and the
simulation continued with a new target date. Alternative MPs were also
considered including: a fixed fishing mortality maintained throughout the initially
determined rebuilding period, MPs with either higher target rebuilding
probabilities or higher thresholds requiring a change in fishing mortality, an MP
that adjusts fishing mortality up or down every four years to achieve the target
rebuilding date, and an MP that prohibits large changes to fishing mortality when
the stock is perceive to be nearly rebuilt.
The MSE demonstrated conflicts between the different management goals
which included: a high probability of stock recovery by the target date, high
average catches during rebuilding, low inter-annual variability of catches, low
probability of having to redefine the rebuilding plan, and simplicity of the
management approach. The MPs that either fixed the fishing mortality or adjusted
it up or down every four years led to higher average catches than the other MPs
but also to the longest recovery times. The MPs that adjusted fishing mortality
every four years also led to greater interannual variability of catches and more
frequent occurrences of having to redefine the rebuilding plan during the
simulation run. The MPs that only adjusted fishing mortality when the rebuilding
probability fell below a threshold (no upward adjustments) led to lower average
catches but shorter rebuilding times.
42 – EXPERIENCES WITH MSE AND MPs
MANAGEMENT STRATEGY EVALUATION AND MANAGEMENT PROCEDURES © OECD 2010
Because the rebuilding timeframes are so long, the stock assessment methods
and data streams and potentially the management objectives and legal
requirements are likely to change during rebuilding. For these reasons there is
probably limited utility in attempting to implement an OPM designed to see the
fishery through to rebuilding. Nevertheless the MSE provides guidance on how to
design a procedure for revising fishing mortality targets in light of changing
assessments and forces managers to explicitly consider the trade-offs between
objectives. Although the results were, for the most part, unsurprising they did
serve to demonstrate explicitly the trade-offs associated with different approaches
including the likelihood of having to completely redefine the rebuilding plan.
Use of MSE and particularly MPs in the US is inhibited by a number of
factors. As in most countries, fisheries managers typically lack the resources to
undertake an MSE on top of the normal data collection and stock assessment
process. Most US fisheries also do not have commercial stakeholder organizations
that can legitimately represent the interests of the overall commercial fishery and
agree on a particular MP. This is important because a lack of agreement on the
MP up front could lead to political pressure to drop it if it leads to greater TAC
reductions or slower increases than desired by some groups. It is also not clear
whether an MP would legally be allowed if it could result in fishing mortality
exceeding Fmsy at some points. This might inhibit use of common stabilizing
mechanisms in MPs such as limits on annual TAC changes or rules that only
allow TAC changes every other year, and it is these stabilizing mechanisms that
often have the greatest appeal to fishery stakeholders. Nevertheless there is
growing interest in MSE in the US, at least as a means to evaluate HCRs for
robustness to uncertainty. It is likely as more fisheries adopt catch share systems
with clearly defined stakeholders and hard catch limits, interest in developing
MPs will grow.
4.4 Use of MSE in Europe
There has been considerable interest in the MSE approach in the ICES
community in Europe for many years and there are a number of examples of MSE
that have been conducted to evaluate MPs (or at least HCRs) including a few
examples that evaluate rebuilding strategies for depleted fisheries. Two special
issues of the ICES Journal of Marine Science (issues 56(6) and 64(4) from 1999
and 2007 respectively) are dedicated largely to MSE and include several MSE
examples from European fisheries as well as a number of others from around the
world. To date there are no examples of a true MP being implemented in Europe -
- one that specifies an HCR that has been simulation tested and dictates the
specific data and analytical process or formula for using that data to directly
determine the TAC. However there are examples of MSE that have led to
implementation of the HCRs evaluated by the MSE including two illustrative
examples discussed here; Icelandic cod and North Sea Plaice and Sole. The MSE
for Icelandic cod is one of the few that explicitly evaluated the economic
performance of the HCR.
Icelandic Cod
The Icelandic cod fishery has been managed under Iceland‘s individual quota
system since 1984. In 1992 the Minister of Fisheries appointed a working group
EXPERIENCES WITH MSE AND MPs – 43
MANAGEMENT STRATEGY EVALUATION AND MANAGEMENT PROCEDURES © OECD 2010
to provide advice on the ―exploitation of fish stocks in Icelandic waters so
maximum yield from Icelandic waters would be reached in the long run‖ (ICES
2005). The group, which included economists as well as fishery scientists,
conducted an analysis of HCRs for cod and also for capelin and shrimp. Some of
their work is described in Baldursson et al. (1996) and in Danielsson et al. (1997).
The analysis can be considered an MSE in that it used simulations to explore the
HCRs that attempted to mimic the stochastic variability of the fishery and the
uncertainty in stock assessments that the HCR would use to set the TAC.
However, Butterworth and Punt (1999) note that the HCR could not be considered
an MP since the simulations do not explicitly model an agreed process for
determining the biomass which in turn determines the TAC. They note that this
can be problematic since stock assessments may in fact be biased, and that bias
can change over time. Rather the MSE assumes an estimate of current biomass is
available with a given level of uncertainty. The MSE also did not model
implementation error -- catches were assumed to equal TACs – though this has
been the case with other MPs.
The MSE described in Baldursson et al. (1996) and in Danielsson et al.
(1997) incorporated a stochastic with an age-structured simulation model of cod
into a bioeconomic model that calculated revenues, costs and profits and enabled
determination of the net present value of returns over the period modelled (1993-
2005). The HCRs evaluated set the TAC as a specified percentage of spawning
stock biomass less some reserve amount over a range of estimated stock sizes(e.g.
TAC=.45[SSB – 50,000 t]). In addition a minimum TAC was set as a floor, and
also a maximum fishing mortality rate was set as a constraint. Symmetric limits
on the maximum annual percentage change in the TAC were also included in the
HCR. The HCR was tested with different TAC floors and exploitation rates.
The analysis indicated that the long term economic value of the fishery would
be increased by setting a low floor for TACs (e.g. 125,000 t) and a low fishing
mortality, thereby letting the stock rebuild. This not only led to higher catches in
future but also much lower costs as a result of increased CPUE. The relationship
between available biomass and catch per effort unit in the fishery was such that
doubling of available biomass would lead to a 63% increase in CPUE (ICES
2005). However, the final recommendation that was given by the working group,
did not directly reflect a version of the MP evaluated in Baldursson et al (1996)
and in Danielsson et al. (1997), but was for a simpler HCR. Nor did that advice
recommend a curtailment of fishing to quickly rebuild the fishery. Rather they
recommended setting the TAC at 22% of catchable biomass (ages four years and
older) which was meant to lead to a fishing mortality of 0.35 (ICES 2005). The
working group recommendations left some flexibility stating that a catch rule of
20-25% of catchable biomass would be beneficial (Gunnar Stefansson, Iceland
Marine Research Institute, personal communication Oct. 6, 2009).The HCR
included a stabilizer so the TAC for the next year was the average of the TAC for
the current year and 22% of the catchable biomass in the beginning of current
year. The HCR also included a minimum TAC floor.
In any event, the government opted in 1995 to adopt a somewhat different
HCR from that recommended. It chose to set the TAC at 25% of the catchable
biomass (which according to the working group did not substantially increase risk
of collapse) and set a floor of 155,000t (ICES 2005). ICES advice notes that this
rule was tested with simulations and found to be robust and was considered

44 – EXPERIENCES WITH MSE AND MPs
MANAGEMENT STRATEGY EVALUATION AND MANAGEMENT PROCEDURES © OECD 2010
―precautionary‖; however, the evaluation of the HCR was based on simulations
that lacked implementation error and there were in fact significant TAC overruns
in subsequent years.
Soon after the HCR was adopted CPUE started to increase and the estimated
stock size grew faster than predicted in the simulations done in 1994. Fishermen
claimed that the stock was much larger than the Marine Research Institute
estimates (ICES 2005). There was also substantial high grading reported. This
rule was used until 2000 when a new stock assessment indicated biomass was
much lower than had been thought. With the new assessment, the rule would have
triggered a very large drop in the TAC. The minister instead implemented a new
policy that limited inter-annual TAC changes to 30 kT but removed the TAC
floor. This new rule operated to reduce the TAC from 250 kT to 190 kT over a
two year period after which point application of the 25% rule was used to set the
TAC over the next several years (as it did not lead to TAC changes greater than
30 kT). Failure to reduce the TAC more quickly lead to high fishing mortality
rates in 2001 and 2002, and error in the assessment had allow high mortality rates
previous to 2000. ICES advice notes that this rule with the 30 kT limit on TAC
changes had not been tested and therefore could not be considered precautionary.
In 2002 the original working group was reconvened and did some additional
modeling with a new and somewhat more sophisticated model (ICES 2005). The
simulations included assessment error and random variations in weights at age,
both with serial autocorrelation. The economic model allowed for size dependent
price of cod. Although the group considered trying to model implementation error
this was not done in the end. The analysis suggested that that fishing mortality
around 0.3-0.35 (18-25% of the catchable biomass) maximized current value of
the profit and the group recommended 22% as they had in 1994.
In 2006 a change was made to the HCR, keeping the 25% rule, but making the
TAC the average of 25% of current catchable biomass and the previous year‘s
TAC. Then, in 2009, a new HCR was adopted which set the TAC at an average of
20% of catchable biomass and the prior year‘s TAC, a rule very similar and
slightly more conservative than the original advice from the working group in.
This rule as designed to achieve a new management objective (>95% probability
that spawning stock biomass will be above the present size of 220 kT by 2015)
which was adopted in 2009 as well.
Use of HCRs in the Icelandic cod fishery over a period of more than 15 years
failed to lead to rebuilding of the fishery. While this was partly due to poor
recruitment uncertainty in stock assessments, implementation failure (e.g. catches
in excess of TACs) and ad hoc changes to the HCR at times allowed much higher
exploitation rates than were envisioned by the rule that clearly played a role in the
failure to rebuild. It is notable also that a more conservative rule was not chosen
despite the demonstration by the MSE that it would greatly increase the net
present value of the fishery. It is not clear from any published documents whether
quota holders in the fishery that would have benefited economically from a more
conservative rebuilding strategy, supported a more conservative HCR originally,
nor is it clear whether the industry was involved in setting objectives and
selecting an HCR that met their objectives.

EXPERIENCES WITH MSE AND MPs – 45
MANAGEMENT STRATEGY EVALUATION AND MANAGEMENT PROCEDURES © OECD 2010
North Sea Plaice and Sole
Kell et al. (2005a) applied an MSE approach to HCRs for the North Sea
flatfish fishery which provided basis for implementation of a new HCR for the
North Sea plaice and sole fishery in 2008. The simulations used stochastic age-
structured operating models based on ICES assessment models and simulated
MPs that mimicked data collection and assessment procedures used for the
flatfish stocks, taking into account error in observations and assessments. The
MSE did not, however, model implementation error, assuming that catches
equalled the TACs determined by the HCR. The HCR for adjusting TACs were
evaluated against performance measures of the probability of SSB falling below
limit reference points and mean yield. The HCRs that were explored set TACs to
achieve fixed fishing mortality targets subject to symmetric limits on how much
TACs could be increased or decreased each year. The MP relied on conducting an
annual stock assessment in order to determine the TAC that achieved the desired
fishing mortality. For each stock, five different fishing mortality targets were
investigated, and for each different limits of inter-annual variability of TAC
(10%, 20%, 30%, and 40%) were simulated. The bounds on TAC variability
between 20% and 40% had little impact on yields or sustainability, but limiting
TAC variability to below 10% was found to affect the ability to achieve
management targets. The authors noted that large fluctuations in yields and effort
could result from the MP itself (i.e. in data collection, stock assessment, and the
management framework), and that simply trying to cap the fluctuations in TACs
would not therefore address problems created by time-lags between the collection
of data, performing the stock assessment, implementing management advice, and
detecting the effect of a given management action.
A long-term management plan proposed by the Commission of the European
Community was adopted by the Council of the European Union in June 2007 and
first implemented in 2008 (EC Council Regulation No. 676/2007). The new
management plan effectively implements a version of the HCR explored by Kell
et al. (2005) though it arguably could not be considered and MP since it does not
specify the data and analytical process that will be used to determine the TAC.
The plan consists of two stages. The aim of the first phase is to ensure the return
of the stocks of plaice and sole in the North Sea to within safe biological limits.
This should be reached through an annual reduction of fishing mortality (F) by
10% in relation to the fishing mortality estimated for the preceding year. The plan
sets a maximum change of 15% of the TAC between consecutive years. This has
been carried out with 10% reductions in fishing mortality in 2008 and a
recommendation for another 10% reduction in 2009, although this would actually
allow an increase in the TAC from 49,000 t to 55,000 t since the stock has grown.
SSB for this plaice stock is now estimated to have increased above the
precautionary target level Bpa. An analogous set of mortality reductions were also
implemented for sole. Like plaice this has actually allowed increase in the TAC
since the stock is growing, despite the fact that the sole stock has not yet
recovered to target levels.
A future for OPMs in Europe?
Despite longstanding interest in applying an MSE framework to evaluating
HCRs, implementation of MPs in Europe has undoubtedly been hindered and
46 – EXPERIENCES WITH MSE AND MPs
MANAGEMENT STRATEGY EVALUATION AND MANAGEMENT PROCEDURES © OECD 2010
complicated by the fact that many of the fisheries are shared between multiple
countries each of which makes and implements their own management decisions.
While ICES provides an institutional framework for undertaking an MSE,
adopting an MP, at least in multistate fisheries, requires a relinquishment of
control over domestic fishery policy that may be difficult to persuade member
counties to agree to. Furthermore the fishery stakeholders often include disparate
groups of fishermen from several countries that may be fishing under different
management systems (e.g. some fish under ITQs while others fish under a
competitive TAC). However agreement on an implementation of an HCR for
North Sea plaice and sole suggests that there may be a growing role for MPs in
Europe. Like most European fisheries these stocks are shared by several countries
making it complex and difficult to agree on a strategy, yet this was accomplished.
The test will be to see if it is adhered to if, in future, it triggers TAC reductions.
Use of quotas (by country and in some cases by company or industry) has not
been entirely successful in Europe. In the summer of 2009, Europe‘s fisheries
chief suggested scrapping annual catch limits in favour of effort limits based
vessel days-at-sea (Forsyth 2009). It is not clear that this will in fact occur, but it
would clearly inhibit the use of MPs based on HCRs that set catch limits. MPs
could be developed based on effort controls, but it would be complicated to
evaluate them. Involvement of economists in developing realistic implementation
models that reflect the potential for implementation error would be critical for
evaluating effort-based MPs. If on the other hand, the EC continues to rely on
hard catch limits, and particularly if this leads to increased used of catch share
management systems the opportunities for and utility of MPs will be enhanced
and interest in them will likely continue to increase.
CONCLUSIONS AND RECOMMENDATIONS – 47
MANAGEMENT STRATEGY EVALUATION AND MANAGEMENT PROCEDURES © OECD 2010
5. Conclusions and Recommendations
Designing and implementing effective management strategies for rebuilding and
maintaining fisheries to meet the objectives of fishery stakeholders and the broader public
concerned with sustainability is an important but an extremely difficult task. The
unpredictable variability of fisheries and the high level of uncertainty about both current
state and future growth inhibit good management even when there is a strong resolve to
limit catches or effort to rebuild and maintain fish stocks at sustainable levels. Despite the
fact that fishery stakeholders often would benefit from more conservative harvest
strategies that build fish stocks to higher biomass levels, there is often a lack of support
for these strategies when they require reductions in catch. This is no doubt due in large
part to those stakeholders being uncertain that short term sacrifices will be rewarded by
long term gains. MSEs that involve stakeholders in determining objectives and choosing
management strategies to achieve those objectives can be an effective way to achieve
buy-in for rebuilding and sustainable management and continued support even when
catch reductions are required. This is a primary benefit of MSE, but one that is often not
realized because insufficient attention is given to involving stakeholders up front in
determining objectives and in the evaluation and selection of the MP. Rochet and Rice
(2009) note that relatively few MSE publications indicate whether and how stakeholders
were included in the process.
The institutional setting is of critical importance in promoting the development and
successful implementation of MPs. To date, MPs have only been implemented in
fisheries managed with individual quota systems where the stakeholders are clearly
indentified and there is a formal and legally recognized process for involving them in
determining management advice. The long term right to a share of the fish catch can be
particularly important for rebuilding fisheries where short term sacrifice is required for
long term gain. However, there may still be a diversity of interests and objective amongst
fishery stakeholders, particularly when the interests of non-commercial stakeholders must
be considered. Therefore, the importance of creating a formal institutional structure for
stakeholder representation in the management process is critical to developing MPs that
will endure political pressure to abandon them. The necessity to get several stakeholder
groups, or politicians from several countries, to agree on an MP and stick by it even when
it operates to their disadvantage clearly increases the difficulty of implementing an MP,
or any effective management for that matter. However, the MSE framework does at least
provide an objective way of evaluating a management strategy against objectives, and, by
forcing stakeholders to clarify objectives, it may increase the chance that a fishery
management plan will be designed to achieve them.
Recommendation: Stakeholders should be consulted in the early stages of
developing an MSE to determine the appropriate objectives and performance metrics, and
they should be involved in selecting an MP to ensure that it balances objectives
appropriately and to create buy-in. It is useful to clearly define the stakeholders or
stakeholder groups that have standing and create a formal institutional structure for their
participation in the decision process.
The MSE framework is well suited to addressing many of the challenges of
identifying fishery management strategies that are precautionary in the face of
uncertainty, but also serve the economic and social interests of fishery stakeholders. First
and foremost MSE is designed to indentify management strategies that are robust to
multiple types of variability and uncertainty – a characteristic of almost all fisheries.
48 –CONCLUSIONS AND RECOMMENDATIONS
MANAGEMENT STRATEGY EVALUATION AND MANAGEMENT PROCEDURES © OECD 2010
Finding strategies that are robust to uncertainty, work reasonably well in good times and
bad, and balance competing objectives will generally mean choosing a strategy that
appears suboptimal in term of maximizing yield or profits.
Recommendation: While a primary criterion for selecting an MP is likely to be low
risk of fishery collapse or high probability of rebuilding, it is also important to identify
MPs that reduce social and economic risks which typically mean finding MPs that reduce
the frequency and magnitude of TAC changes.
Explicit modelling of different types of uncertainty including model error,
observation error and implementation error not only allows for design of MPs that work
well in the face of these errors, it can help identify where it may be most useful to reduce
uncertainty through more research, better data collection or tighter management controls
that reduce implementation error. These means of reducing uncertainty are often costly,
and MSE provides a tool to evaluate the benefits of reduced uncertainty relative to the
gains, either explicitly in terms of higher monetary benefits that can be realized or
qualitatively in terms of greater achievement of competing objectives such as lower
biological risk and both higher and more stable yields.
Recommendation: MSEs should be used as a tool to determine the value of reducing
specific types of uncertainty (e.g. on key parameters, model assumptions, implementation
error, etc.) so as to target scarce research and monitoring resources where they create the
most value.
Most MSEs could be improved with inclusion of integrated economic models that
track economic performance indicators such as costs and revenues and their variability
along with biological outcomes. In addition, few MSEs do a good job of modelling
implementation error which can be facilitated by modelling human behaviour in response
to the economic incentives. Economists may also be able to suggest and test MPs that
create incentives for fisheries to use or reveal private information which can improve
fishery performance in the face of uncertainty.
Recommendation: MSEs should incorporate bioeconomic models that provide
information on economic performance metrics and account for possible errors in
implementation due to human behaviour.
MPs have primarily been implemented in and been most effective for single species
fisheries. In these fisheries it is more likely that empirically based (model free) MPs that
rely on commercial CPUE to determine TAC decisions will be effective. These model-
free MPs may allow savings in management costs as also make management more
understandable to fishery stakeholders which can promote acceptance. Multispecies MPs
may be more difficult to design and test. Empirically based (model free) MPs that rely on
commercial CPUE to drive TAC decisions may be problematic for multispecies fisheries
since species targeting is likely to change with changes in prices as well as species
availability. Therefore CPUE for a given species is unlikely to track its biomass.
Multispecies MPs are more likely have to rely on formal stock assessments to determine
the TACs but MSE and MPs may still be useful in these fisheries. Modelling
implementation error in an MSE will also be particularly important for multispecies
fisheries since the likelihood of catches of particular species being either under or over
target levels is generally higher.
Recommendation: Although they will not be appropriate for many fisheries, model-
free MPs that reduce reliance on frequent stock assessment models should be considered.
Model-free MPs are more likely to be appropriate for single-species fisheries where

CONCLUSIONS AND RECOMMENDATIONS – 49
MANAGEMENT STRATEGY EVALUATION AND MANAGEMENT PROCEDURES © OECD 2010
fishery dependent data can be effectively used. It may make sense to focus initial
implementation of MSE and MPs on single species fisheries before tackling multispecies
fisheries for which MSEs and MPs will be more complex to model and implement.
While MSE and MPs have some clear advantages over traditional approaches to
developing and implementing management advice, they are not a panacea. A number of
MPs and HCRs that were tested for robustness in an MSE framework failed to achieve
their objectives. Clearly it will not generally be possible to design a perfect MP, and it
will be necessary to adapt the MP as new information and unforeseen events emerge. It is
probably fair to say that the more we learn about fisheries the less certain we are that we
can predict what will happen to them. Therefore it is essential that a schedule and process
for re-evaluating an MP be determined along with meta rules that determine how to react
if appears the MP is not functioning correctly. The process must allow adaptability
without opening the MP up to tinkering any time results are not going the way some
stakeholder group likes.
Recommendation: When an MP is implemented a schedule for reviewing and
potentially changing the MP should be clearly stated along with a procedure for
identifying and reacting to a failure of the MP prior to the schedule review.
Undertaking an MSE and developing and testing an MP will generally require a large
upfront cost. Fishery management authorities‘ budgets and human resources are generally
stretched thin just keeping up with regular stock assessments. Without additional funding
specifically dedicated to undertake MSEs, use of this analytical framework and of MPs is
likely to grow only slowly. Yet there may be substantial long term gains from greater use
of MSE and MPs as a result of superior management that better meets stakeholder
objectives. Use of MPs can reduce rent seeking behaviour focused on management
decisions and engender a long term management focus. In some cases, MPs will reduce
ongoing assessment and management costs by reducing the required frequency of stock
assessments. Therefore greater investment in MSEs and implementation of MPs is
justified and OECD countries would do well to follow the example of South Africa and
make MSE and MPs an integral part of fishery management.
Recommendation: Government authorities responsible for fishery management
should consider making strategic investments to increase capabilities to undertake MSEs
and implement MPs. While this may increase management costs in the short run it should
reduce them in the long run as well as make management more effective.


BIBLIOGRAPHY – 51
MANAGEMENT STRATEGY EVALUATION AND MANAGEMENT PROCEDURES © OECD 2010
BIBLIOGRAPHY
Baldursson, F. M., Daníelsson, Á. and Stefánsson, G. (1996), ―On the rational utilization
of the Icelandic cod stock‖, ICES Journal of Marine Science 53, 643–658.
Barnes, W. R. (1999), ―Viewpoint: An industry view of the application of operational
management procedures to setting total allowable catches for the South African
pelagic fishery. ICES Journal of Marine Science, 56: 1067–1069.
Basson, M. (1999), ―The importance of environmental factors in the design of
management procedures‖, ICES Journal of Marine Sciences 56(6), 933-942.
Bentley, N., Breen, P.A. and Starr, P.J. (2003a), ―Design and evaluation of a revised
management decision rule for red rock lobster fisheries (Jasus edwardsii) in CRA 7
and CRA 8‖, New Zealand Fisheries Assessment Report 2003/30.
Bentley, N., P.A. Breen, P.J. Starr, and D.R. Sykes. (2003b), ―Development and
evaluation of decision rules for management of New Zealand rock lobster fisheries‖,
New Zealand Fisheries Assessment Report 2003/29.
Breen, P.A. and Kendrick, T.H. (1998), ―The 1996 assessment of the New Zealand red
rock lobster (Jasus edwardsii) fishery. New Zealand Fisheries Assessment Research
Document 98/13.
Breen, P.A.; Haist, V.; Smith, A.N.H.; Starr, P.J. (2008), ―Review of the NSS decision
rule for stocks CRA 7 and CRA 8 and development of new operational management
procedures‖, New Zealand Fisheries Assessment Report 2008/55. 71 p.
Breen, P.A., D.R. Sykes, P.J. Starr, S. Kim and V. Haist (2009), ―A voluntary reduction
in the commercial catch of rock lobster (Jasus edwardsii) in a New Zealand fishery.
Breen et al.—Voluntary reduction in commercial lobster catch‖, New Zealand Journal
of Marine and Freshwater Research 43:511–23.
Butterworth, D.S. (2007), ―Why a management procedure approach? Some positives and
negatives‖, ICES Journal of Marine Sciences 64:613-617.
Butterworth, D.S. and A.E. Punt. (1999), ―Experiences in the evaluation and
implementation of management procedures‖, ICES Journal of Marine Sciences
56:985-988.
Butterworth, D.S. and RA. Rademeyer (2005), ―Sustainable Management Initiatives for
the Southern African Hake Fisheries Over Recent Years‖, Bulletin of Marine Science,
76(2): 287–319.
Butterworth, D. S., Cochrane, K. L. and De Oliveira, J. A. A. (1997) ―Management
Procedures: a better way to manage fisheries? The South African experience. In:
Global Trends: Fisheries Management (eds E. K. Pikitch, D. D. Huppert and M. P.
Sissenwine), American Fisheries Society Symposium 20, pp. 83–90.
52 –BIBLIOGRAPHY
MANAGEMENT STRATEGY EVALUATION AND MANAGEMENT PROCEDURES © OECD 2010
Christensen, S. (1997), ―Evaluation of management strategies – a bioeconomic approach
applied to the Greenland Shrimp Fishery‖, ICES Journal of Marine Science 54:412-
426.
Cochrane, K. L. (2002) ―Fisheries management. In: A Fishery Manager‘s Guidebook.
Management Measures and their Application. FAO Fisheries Technical Paper 424, 1-
20.
Cochrane, K. L., Butterworth, D. S., De Oliveira, J. A. A., and Roel, B. A. (1998),
―Management procedures in a fishery based on highly variable stocks and with
conflicting objectives: experiences in the South African pelagic fishery‖, Reviews in
Fish Biology and Fisheries, 8: 177–214.
Cooke, J.G. (1999), ―Improvements of fishery-management advice through simulation
testing of harvest algorithms. ICES Journal of Marine Sciences 56:797-810.
Costello, C., S.D. Gaines and J. Lynham., 2008. ―Can catch shares prevent fisheries
collapse? ‖, (with S. Gaines and J. Lynham), Science. 321(5896): 1678-1681. DOI:
0.1126/science.1159478
Daníelsson, Á., Stefánsson, G., Baldursson, F. M. and Thórarinsson, K. (1997),
―Utilization of the Icelandic cod stock in a multispecies context‖, Marine Resource
Economics 12, 329–344.
De Oliveira J.A.A., Kell L.T., Punt A.E., Roel B.A., Butterworth D.S., (2008),
―Managing without best predictions: the management strategy evaluation framework‖,
In: Payne A.I.L., Cotter J., Potter T. (Eds.) Advances in fisheries science 50 years on
from Beverton and Holt. Oxford, Blackwell Publishing, pp. 104–134.
FAO (1996), Precautionary approach to capture fisheries and species introductions‖, FAO
Technical Guidelines for Responsible Fisheries 2. FAO, Rome
Food and Agriculture Organization (FAO) (2009), The State of World Fisheries and
Aquaculture 2008, Rome.
Federal Register. (2008), ―Magnuson-Stevens Act Provisions; Annual Catch Limits;
National Standard Guidelines. Proposed Rule. Vol. 73, No. 111 / Monday, June 9,
2008 / Proposed Rules.
Forsyth, I. (2009), ―Fisheries Commissioner suggests radical action to reform Common
Fisheries Policy‖, The Press Journal September 2, 2009.
Francis, R. I. C. C. and Shotton, R. (1997) ―Risk‘ in fisheries management: a review‖,
Canadian Journal of Fisheries and Aquatic Sciences 54, 1699–1715.
Geromont, H.F., De Oliveira, J.A.A., Johnston, S.J., and Cunningham, C.L. (1999),
―Development and application of management procedures for fisheries in southern
Africa‖, ICES Journal of Marine Sciences 56: 952–966.
Grafton, R. Q., R. Arnason, T. Bjorndal, D. Campbell, H. F. Campbell, C. W. Clark, R.
Connor, D.P. Dupont, R. Hannesson, R. Hilborn, J.E. Kirkley, T. Kompas, D. E. Lane,
G.R. Munro, S. Pascoe, D. Squires, S.I. Steinshamn, B.R. Turris, and Q.Weninger
(2006), ―Incentive-based approaches to sustainable fisheries‖, Canadian Journal of
Fisheries and Aquatic Sciences 63(3), 699-710.

BIBLIOGRAPHY – 53
MANAGEMENT STRATEGY EVALUATION AND MANAGEMENT PROCEDURES © OECD 2010
Grant, D. A. C. (1999), ―Viewpoint: The South African west coast lobster as an example
of uncertainty in fisheries management‖, ICES Journal of Marine Science, 56: 1069–
1070.
Holland, D.S. (2007), ―Managing Environmental Impacts of Fishing: Input Controls
versus Outcome Oriented Approaches‖, International Journal of Global Environmental
Issues 7(2,3):255-272.
Holland, D.S. and G.E. Herrera (2009), ―Uncertainty in the Management of Fisheries:
Contradictory Implications and a New Approach‖, Marine Resource Economics,
24(3):289-299.
Holland, D.S., N. Bentley and P. Lallemand (2005), ―A Bioeconomic Analysis of
Management Strategies for Rebuilding and Maintenance of the NSS Rock Lobster
Stock in Southern New Zealand. Can. J. Fish. Aquat. Sci. 62(7);1553-1569.
ICES (2005), Report of the Study Group on Management Strategies. ICES Advisory
Committee on Fishery Management. ICES CM 2005 /ACFM:09Ref. D, G
ICES (2008), Report of the ICES Advisory Committee 2008. ICES Advice, 2008, Book
6.
ICES (2009), Report of the ICES Advisory Committee 2008. ICES Advice, 2008, Book
2.
Jensen., F. 2008. Uncertainty and asymmetric information: An overview. Marine Policy
32:89–103.
Kell, L. T., De Oliveira, J. A. A., Punt, A. E., McAllister, M. K. and Kuikka, S. (2006)
―Operational Management Procedures: an introduction to the use of management
strategy evaluation frameworks‖, In L. Motos and D. C. Wilson (eds.): The
Knowledge Base for Fisheries Management. Developments in Aquaculture and
Fisheries Science 36, Elsevier, Amsterdam, pp. 379–407.
Kell, L. T., Mosqueira, I., Grosjean, P., Fromentin, J-M., Garcia, D., Hillary, R., Jardim,
E., Mardle, S., Pastoors, M.A., Poos, J. J., Scott, F. and Scott, R. D. (2007) ―FLR: an
open-source framework for the evaluation and development of management
strategies‖, ICES Journal of Marine Science 64, 640–646.
Kell, L. T., Pastoors, M. A., Scott, R. D., Smith, M. T., Van Beek, F. A., O‘Brien, C. M.,
and Pilling, G. M. (2005a) ―Evaluation of multiple management objectives for
Northeast Atlantic flatfish stocks: sustainability vs. stability of yield‖, ICES Journal of
Marine Science 62, 1104–1117.
Kell, L. T., Pilling, G. M., Kirkwood, G. P., Pastoors, M., Mesnil, B., Korsbrekke, K.,
Abaunza, P., Aps, R., Biseau, A., Kunzlik, P., Needle, C., Roel, B. A. and Ulrich-
Rescan, C. (2005b) An evaluation of the implicit management procedure used for
some ICES roundfish stocks‖, ICES Journal of Marine Science 62, 750–759.
Kendrick, T.H. and Bentley, N. (2003), ―Movements of rock lobsters (Jasus edwardsii)
tagged by commercial fishers around the coast of New Zealand from 1993‖, New
Zealand Fisheries Assessment Report 2003/55.
Kirkwood, G.P. (1997), ―The revised management procedure of the international whaling
commission‖, In Global trends: fishery management. Edited by E.K. Pikitch, D.D.
Huppert, and M.P. Sissenwine. American Fisheries Society Symposium 20, Bethesda,
Maryland: 91-99.
54 –BIBLIOGRAPHY
MANAGEMENT STRATEGY EVALUATION AND MANAGEMENT PROCEDURES © OECD 2010
McAllister, M.K., P.J. Star, V. R. Restrepo, and G. P. Kirkwood (1999), ―Formulating
quantitative methods to evaluate fishery-management systems: what fishery processes
should be modelled and what trade-offs should be made? ‖, ICES Journal of Marine
Sciences 56:900-916.
Myers, R. A., and B. Worm. (2003), Rapid worldwide depletion of predatory fish
communities‖, Nature, 423(6937), 280-283.
National Marine Fisheries Service (NMFS) (2008), Status Determinations by Region:
Changes in Stock Status for 2007. Silver Spring. Maryland, United States, June 2008
Needle, C.L. (2008), Management strategy evaluation for North Sea haddock‖, Fisheries
Research 94(2): 141-150.
Parma, A. (1990), ―Optimal harvesting of fish populations with non-stationary stock-
recruitment relationships‖, Natural Resource Modeling 4(1):39-76.
Pastoors, M. A., Poos, J. J., Kraak, S. B. M., and Machiels, M. A. M. (2007), ―Validating
management simulation models and implications for communicating results to
stakeholders‖, ICES Journal of Marine Science, 64: 818–824.
Penhorn, L. J. (1999), ―Viewpoint: A demersal fishing industry management perspective
of risk‖, ICES Journal of Marine Science, 56: 1070–1072.
Plagányi, É. E., Rademeyer, R. A., Butterworth, D. S., Cunningham, C. L. and Johnston,
S. J. (2007) Making management procedures operational – innovations implemented
in South Africa‖, ICES Journal of Marine Science 64, 626–632.
Powers, j. D. Japp, G. Tingley and A. Hough (2004), ―Final Certification Report for the
South African Hake Trawl Fishery‖, Moody Marine Ltd.; ref: 015-013 v2.
(www.msc.org),
Punt, A. E. (2006) ―The FAO Precautionary Approach after almost 10 years: have we
progressed towards implementing simulation-tested feedback-control management
systems for fisheries management? ‖, Natural Resource Modeling 19: 441–464.
Punt, A.E. and G.P. Donovan. (2007), ―Developing management procedures that are
robust to uncertainty: lessons from the International Whaling Commission‖, ICES
Journal of Marine Sciences 64:603-612.
Punt, A.E., and S.V. Ralston. (2007), ―A management strategy evaluation of rebuilding
revision rules for overfished rockfish species‖, In: J. Heifetz, J. DiCosimo, A.J.
Gharrett, M.S. Love, V.M. O‘Connell, and R.D. Stanley (eds.), Biology, assessment,
and management of North Pacific rockfishes. Alaska Sea Grant, University of Alaska
Fairbanks, pp. 329-351.
Rademeyer RA, Butterworth DS, Plagányi, ÉE (2008a) ―Assessment of the South African
hake resource taking two-species nature into account‖, African Journal of Marine
Science 30(2):291–310
Rademeyer RA, Butterworth DS, Plagányi, ÉE (2008b) ―A history of recent bases for
management and the development of a species combined Operational Management
Procedure for the South African hake resource‖, African Journal of Marine Science
30(2):291–310
BIBLIOGRAPHY – 55
MANAGEMENT STRATEGY EVALUATION AND MANAGEMENT PROCEDURES © OECD 2010
Roel, B. A., O'Brien, C. M. and Basson, M. (2004) ―Management options for the
Blackwater herring, a local spring-spawning stock in the Thames Estuary‖, ICES
Journal of Marine Science 61, 297–307.
Sethi, G., C. Costello, A. Fisher, M. Hanemann, and L. Karp. (2005), ―Fishery
management under multiple uncertainty‖, Journal of Environmental Economics and
Management 50(2):300-318.
Singh, R., Q. Weninger and M. Doyle (2006), ―Fisheries management with stock growth
uncertainty and costly capital adjustment‖, Journal of Environmental Economics and
Management 52(2):582-599
Smith, A.D.M., Sainsbury, K.J. and Stevens, R.A. (1999), ―Implementing effective
fisheries management systems - management strategy evaluation and the Australian
partnership approach‖, ICES Journal of Marine Science 56: 967-979.
Smith, A. D. M., Fulton, E. J., Hobday, A. J., Smith, D. C. and Shoulder, P. (2007),
―Scientific tools to support the practical implementation of ecosystem-based fisheries
management‖, ICES Journal of Marine Science 64, 633–639.
Starr, P.J. and Bentley, N. (2002), ―Assessment of the NSS stock of red rock lobster
(Jasus edwardsii) for 1999‖, New Zealand Fisheries Assessment Report. 2002/28.
Starr, P.J.; Breen, P.A.; Hilborn, R.; Kendrick, T.H. (1997), ―Evaluation of a management
decision rule for a New Zealand rock lobster substock‖, Marine and Freshwater
Research 48(8): 1093-1101.
Street, R.J. (1973), ―Trends in the rock lobster fishery in southern New Zealand, 1970
1971‖, New Zealand Fisheries Technical Report No. 116.
Worm, B., R. Hilborn, J.K. Baum, T.A. Branch, J.S. Collie, C. Costello, M..J Fogarty,
E.A. Fulton, J.A. Hutchings, S. Jennings, O.P. Jensen, H.K. Lotze, P.M. Mace, T.R.
McClanahan, C. Minto, S.R. Palumbi, A.M. Parma, D. Ricard, A.A. Rosenberg, R.
Watson, D. Zeller. (2009), ―Rebuilding global fisheries‖, Science 325:578-585 DOI:
10.1126/science.1173146].

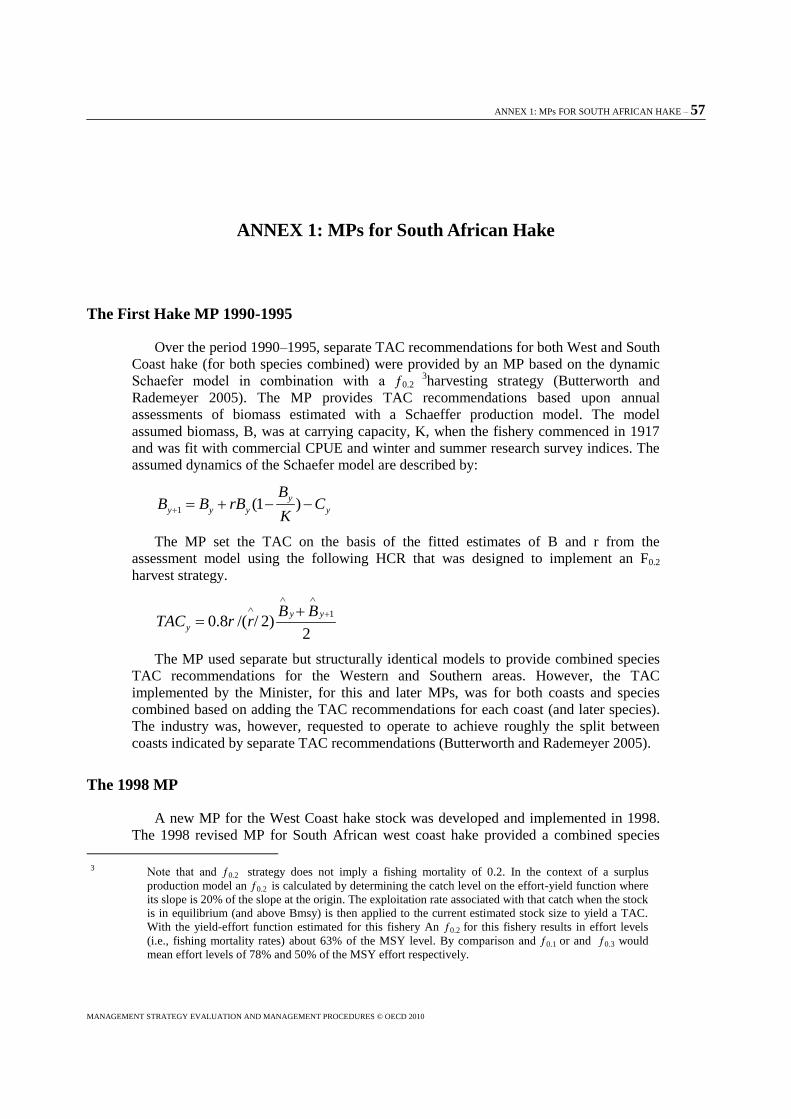
ANNEX 1: MPs FOR SOUTH AFRICAN HAKE – 57
MANAGEMENT STRATEGY EVALUATION AND MANAGEMENT PROCEDURES © OECD 2010
ANNEX 1: MPs for South African Hake
The First Hake MP 1990-1995
Over the period 1990–1995, separate TAC recommendations for both West and South
Coast hake (for both species combined) were provided by an MP based on the dynamic
Schaefer model in combination with a ƒ0.2 3harvesting strategy (Butterworth and
Rademeyer 2005). The MP provides TAC recommendations based upon annual
assessments of biomass estimated with a Schaeffer production model. The model
assumed biomass, B, was at carrying capacity, K, when the fishery commenced in 1917
and was fit with commercial CPUE and winter and summer research survey indices. The
assumed dynamics of the Schaefer model are described by:
1 (1 )
y
y y y y
BB B rB C
K
The MP set the TAC on the basis of the fitted estimates of B and r from the
assessment model using the following HCR that was designed to implement an F0.2
harvest strategy.
1
0.8 /( / 2)2
y y
y
B BTAC r r
The MP used separate but structurally identical models to provide combined species
TAC recommendations for the Western and Southern areas. However, the TAC
implemented by the Minister, for this and later MPs, was for both coasts and species
combined based on adding the TAC recommendations for each coast (and later species).
The industry was, however, requested to operate to achieve roughly the split between
coasts indicated by separate TAC recommendations (Butterworth and Rademeyer 2005).
The 1998 MP
A new MP for the West Coast hake stock was developed and implemented in 1998.
The 1998 revised MP for South African west coast hake provided a combined species
3 Note that and ƒ0.2 strategy does not imply a fishing mortality of 0.2. In the context of a surplus
production model an ƒ0.2 is calculated by determining the catch level on the effort-yield function where
its slope is 20% of the slope at the origin. The exploitation rate associated with that catch when the stock
is in equilibrium (and above Bmsy) is then applied to the current estimated stock size to yield a TAC.
With the yield-effort function estimated for this fishery An ƒ0.2 for this fishery results in effort levels
(i.e., fishing mortality rates) about 63% of the MSY level. By comparison and ƒ0.1 or and ƒ0.3 would
mean effort levels of 78% and 50% of the MSY effort respectively.
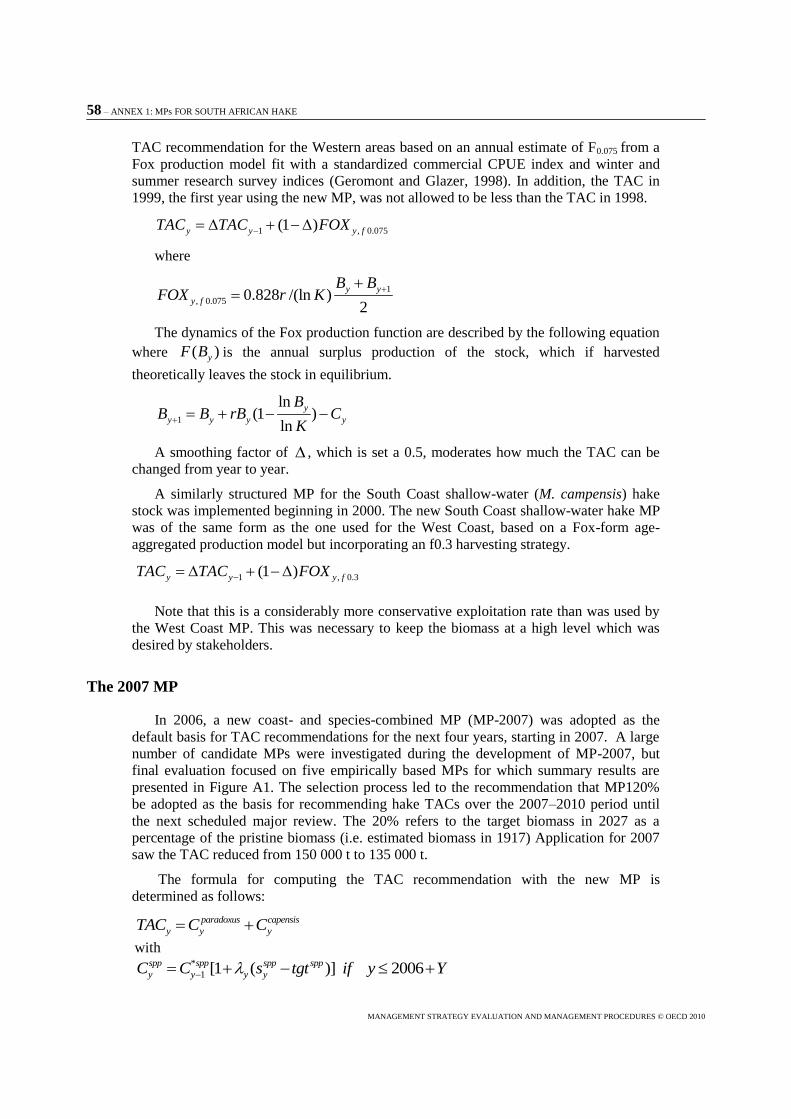
58 – ANNEX 1: MPs FOR SOUTH AFRICAN HAKE
MANAGEMENT STRATEGY EVALUATION AND MANAGEMENT PROCEDURES © OECD 2010
TAC recommendation for the Western areas based on an annual estimate of F0.075 from a
Fox production model fit with a standardized commercial CPUE index and winter and
summer research survey indices (Geromont and Glazer, 1998). In addition, the TAC in
1999, the first year using the new MP, was not allowed to be less than the TAC in 1998.
1 , 0.075(1 )y y y fTAC TAC FOX
where
1
, 0.075 0.828 /(ln )2
y y
y f
B BFOX r K
The dynamics of the Fox production function are described by the following equation
where ( )yF B is the annual surplus production of the stock, which if harvested
theoretically leaves the stock in equilibrium.
1
ln(1 )
ln
y
y y y y
BB B rB C
K
A smoothing factor of , which is set a 0.5, moderates how much the TAC can be
changed from year to year.
A similarly structured MP for the South Coast shallow-water (M. campensis) hake
stock was implemented beginning in 2000. The new South Coast shallow-water hake MP
was of the same form as the one used for the West Coast, based on a Fox-form age-
aggregated production model but incorporating an f0.3 harvesting strategy.
1 , 0.3(1 )y y y fTAC TAC FOX
Note that this is a considerably more conservative exploitation rate than was used by
the West Coast MP. This was necessary to keep the biomass at a high level which was
desired by stakeholders.
The 2007 MP
In 2006, a new coast- and species-combined MP (MP-2007) was adopted as the
default basis for TAC recommendations for the next four years, starting in 2007. A large
number of candidate MPs were investigated during the development of MP-2007, but
final evaluation focused on five empirically based MPs for which summary results are
presented in Figure A1. The selection process led to the recommendation that MP120%
be adopted as the basis for recommending hake TACs over the 2007–2010 period until
the next scheduled major review. The 20% refers to the target biomass in 2027 as a
percentage of the pristine biomass (i.e. estimated biomass in 1917) Application for 2007
saw the TAC reduced from 150 000 t to 135 000 t.
The formula for computing the TAC recommendation with the new MP is
determined as follows:
paradoxus capensis
y y yTAC C C
with *
1 [1 ( )] 2006spp spp spp spp
y y y yC C s tgt if y Y
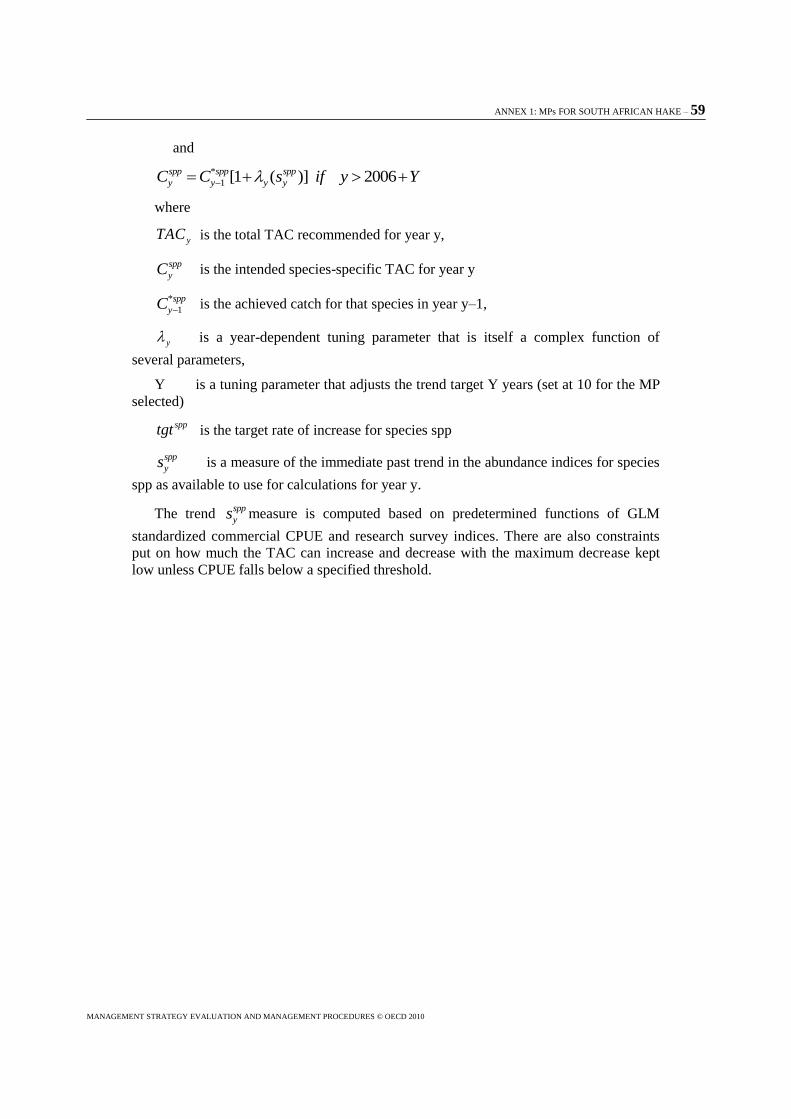
ANNEX 1: MPs FOR SOUTH AFRICAN HAKE – 59
MANAGEMENT STRATEGY EVALUATION AND MANAGEMENT PROCEDURES © OECD 2010
and
*
1 [1 ( )] 2006spp spp spp
y y y yC C s if y Y
where
yTAC is the total TAC recommended for year y,
spp
yC is the intended species-specific TAC for year y
*
1
spp
yC is the achieved catch for that species in year y–1,
y is a year-dependent tuning parameter that is itself a complex function of
several parameters,
Y is a tuning parameter that adjusts the trend target Y years (set at 10 for the MP
selected)
spptgt is the target rate of increase for species spp
spp
ys is a measure of the immediate past trend in the abundance indices for species
spp as available to use for calculations for year y.
The trend spp
ys measure is computed based on predetermined functions of GLM
standardized commercial CPUE and research survey indices. There are also constraints
put on how much the TAC can increase and decrease with the maximum decrease kept
low unless CPUE falls below a specified threshold.

60 – ANNEX 1: MPs FOR SOUTH AFRICAN HAKE
MANAGEMENT STRATEGY EVALUATION AND MANAGEMENT PROCEDURES © OECD 2010
Figure A1. Trajectories of M. paradoxus resource abundanc,
Note: CPUE, catch and variation in catch for an application of MP120%, MP620%, MP720% and the constant catch strategy to the RS In each panel, the median, 50%, 75% and 90% probability intervals are
shown. Units for species-combined CPUE are those of the exploitable biomass to which it corresponds. For pre-2007, the average spawning biomass and species combined CPUE trajectories of the RS
and the actual species-disaggregated CPUE (divided by the estimated q) and total catch are also shown.
Source: (copied with permission from Rademeyer, Butterworth and Plagány (2008b))
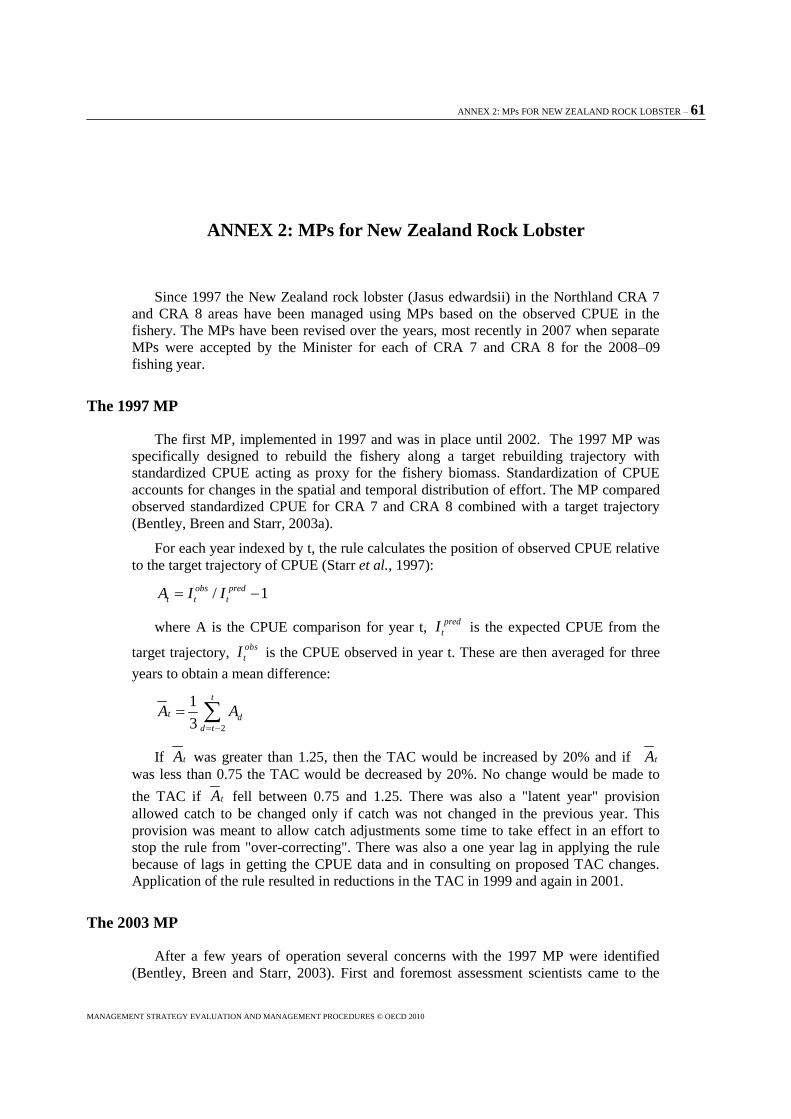
ANNEX 2: MPs FOR NEW ZEALAND ROCK LOBSTER – 61
MANAGEMENT STRATEGY EVALUATION AND MANAGEMENT PROCEDURES © OECD 2010
ANNEX 2: MPs for New Zealand Rock Lobster
Since 1997 the New Zealand rock lobster (Jasus edwardsii) in the Northland CRA 7
and CRA 8 areas have been managed using MPs based on the observed CPUE in the
fishery. The MPs have been revised over the years, most recently in 2007 when separate
MPs were accepted by the Minister for each of CRA 7 and CRA 8 for the 2008–09
fishing year.
The 1997 MP
The first MP, implemented in 1997 and was in place until 2002. The 1997 MP was
specifically designed to rebuild the fishery along a target rebuilding trajectory with
standardized CPUE acting as proxy for the fishery biomass. Standardization of CPUE
accounts for changes in the spatial and temporal distribution of effort. The MP compared
observed standardized CPUE for CRA 7 and CRA 8 combined with a target trajectory
(Bentley, Breen and Starr, 2003a).
For each year indexed by t, the rule calculates the position of observed CPUE relative
to the target trajectory of CPUE (Starr et al., 1997):
/ 1obs pred
t t tA I I
where A is the CPUE comparison for year t, pred
tI is the expected CPUE from the
target trajectory, obs
tI is the CPUE observed in year t. These are then averaged for three
years to obtain a mean difference:
2
1
3
t
t d
d t
A A
If tA was greater than 1.25, then the TAC would be increased by 20% and if tA
was less than 0.75 the TAC would be decreased by 20%. No change would be made to
the TAC if tA fell between 0.75 and 1.25. There was also a "latent year" provision
allowed catch to be changed only if catch was not changed in the previous year. This
provision was meant to allow catch adjustments some time to take effect in an effort to
stop the rule from "over-correcting". There was also a one year lag in applying the rule
because of lags in getting the CPUE data and in consulting on proposed TAC changes.
Application of the rule resulted in reductions in the TAC in 1999 and again in 2001.
The 2003 MP
After a few years of operation several concerns with the 1997 MP were identified
(Bentley, Breen and Starr, 2003). First and foremost assessment scientists came to the
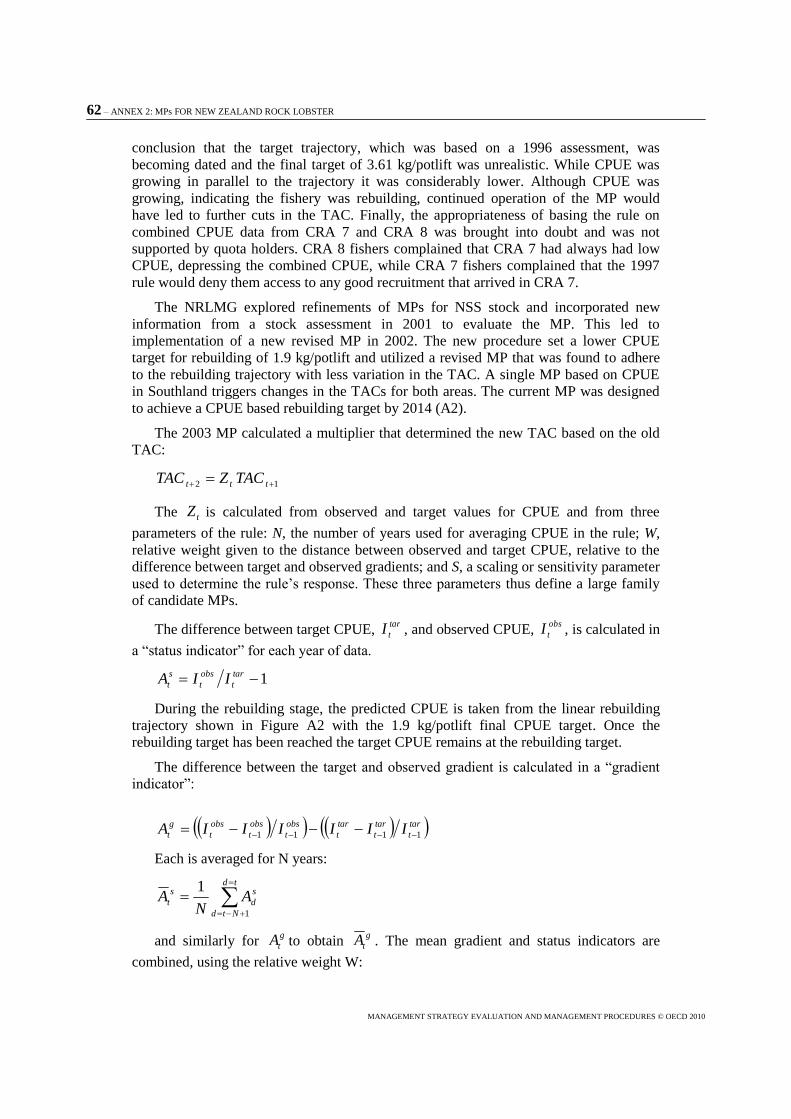
62 – ANNEX 2: MPs FOR NEW ZEALAND ROCK LOBSTER
MANAGEMENT STRATEGY EVALUATION AND MANAGEMENT PROCEDURES © OECD 2010
conclusion that the target trajectory, which was based on a 1996 assessment, was
becoming dated and the final target of 3.61 kg/potlift was unrealistic. While CPUE was
growing in parallel to the trajectory it was considerably lower. Although CPUE was
growing, indicating the fishery was rebuilding, continued operation of the MP would
have led to further cuts in the TAC. Finally, the appropriateness of basing the rule on
combined CPUE data from CRA 7 and CRA 8 was brought into doubt and was not
supported by quota holders. CRA 8 fishers complained that CRA 7 had always had low
CPUE, depressing the combined CPUE, while CRA 7 fishers complained that the 1997
rule would deny them access to any good recruitment that arrived in CRA 7.
The NRLMG explored refinements of MPs for NSS stock and incorporated new
information from a stock assessment in 2001 to evaluate the MP. This led to
implementation of a new revised MP in 2002. The new procedure set a lower CPUE
target for rebuilding of 1.9 kg/potlift and utilized a revised MP that was found to adhere
to the rebuilding trajectory with less variation in the TAC. A single MP based on CPUE
in Southland triggers changes in the TACs for both areas. The current MP was designed
to achieve a CPUE based rebuilding target by 2014 (A2).
The 2003 MP calculated a multiplier that determined the new TAC based on the old
TAC:
12 ttt TACZTAC
The tZ is calculated from observed and target values for CPUE and from three
parameters of the rule: N, the number of years used for averaging CPUE in the rule; W,
relative weight given to the distance between observed and target CPUE, relative to the
difference between target and observed gradients; and S, a scaling or sensitivity parameter
used to determine the rule‘s response. These three parameters thus define a large family
of candidate MPs.
The difference between target CPUE, tar
tI , and observed CPUE, obs
tI , is calculated in
a ―status indicator‖ for each year of data.
1 tar
t
obs
t
s
t IIA
During the rebuilding stage, the predicted CPUE is taken from the linear rebuilding
trajectory shown in Figure A2 with the 1.9 kg/potlift final CPUE target. Once the
rebuilding target has been reached the target CPUE remains at the rebuilding target.
The difference between the target and observed gradient is calculated in a ―gradient
indicator‖:
tar
t
tar
t
tar
t
obs
t
obs
t
obs
t
g
t IIIIIIA 1111
Each is averaged for N years:
td
Ntd
s
d
s
t AN
A1
1
and similarly for g
tA to obtain g
tA . The mean gradient and status indicators are
combined, using the relative weight W:
ANNEX 2: MPs FOR NEW ZEALAND ROCK LOBSTER – 63
MANAGEMENT STRATEGY EVALUATION AND MANAGEMENT PROCEDURES © OECD 2010
g
t
s
tt AWAWA 1*
Now the combined mean indicator is used with the scalar S to determine a response:
*
tt SAR
Then this response is used to determine the multiplier tZ , taking into account the sign
of tR and limiting the magnitude with minimum and maximum thresholds. The minimum
threshold was 0.05, and the maximum is 0.25.
1tZ for -0.05 ≤ ( tR ) ≤ 0.05
tt RZ 1 for -0.25 ≤ ( tR ) < -0.05 and for 0.05 < ( tR ) ≤ 0.25
75.0tZ for ( tR ) < -0.25
25.1tZ for ( tR ) > 0.25
The MP also contained a provision prohibiting changes to TAC in two consecutive
years just as the 1997 MP had.

64 – ANNEX 2: MPs FOR NEW ZEALAND ROCK LOBSTER
MANAGEMENT STRATEGY EVALUATION AND MANAGEMENT PROCEDURES © OECD 2010
Figure A2: Rebuilding Trajectory for NSS Rock Lobster MP
2.1
1.9
1.7
0.0
0.2
0.4
0.6
0.8
1.0
1.2
1.4
1.6
1.8
2.0
2.2
2.4
19
97
-19
98
19
98
-19
99
19
99
-20
00
20
00
-20
01
20
01
-20
02
20
02
-20
03
20
03
-20
04
20
04
-20
05
20
05
-20
06
20
06
-20
07
20
07
-20
08
20
08
-20
09
20
09
-20
10
20
10
-20
11
20
11
-20
12
20
12
-20
13
20
13
-20
14
20
14
-20
15
20
15
-20
16
20
16
-20
17
20
17
-20
18
20
18
-20
19
20
19
-20
20
20
20
-20
21
20
21
-20
22
20
22
-20
23
20
23
-20
24
20
24
-20
25
Fishing year
Sta
nd
ard
ized
CP
UE
kg
per
po
tlif
t
Observed
The 2007 MP
In 2007 a new set of independent MPs for the CRA7 and CRA8 fishery were
introduced. Both MPs use the most recent standardized CPUE estimate as input.
However, in contrast to the 2003 MP which used three years of CPUE data, the 2007 MPs
use only CPUE data from the most recent twelve months including 6 months of the
current fishing year. Both of the new MPs produce TAC recommendations that are
allowed to change every year unlike previous MPs which did not allow a TAC change in
two consecutive years. The 2007 CRA 7 MP calculates TAC as a simple linear function
of standardized CPUE from the most recent twelve months as follows.
1 100y yTAC I
where yI is the standardised commercial fishery CPUE from the most recent 12
months in the CRA7 fishery.
The CRA 8 MP (Figure A3) is not a simple linear function of CPUE. The TAC is
held constant over a wide range of CPUE; it decreases at a faster rate than CPUE when
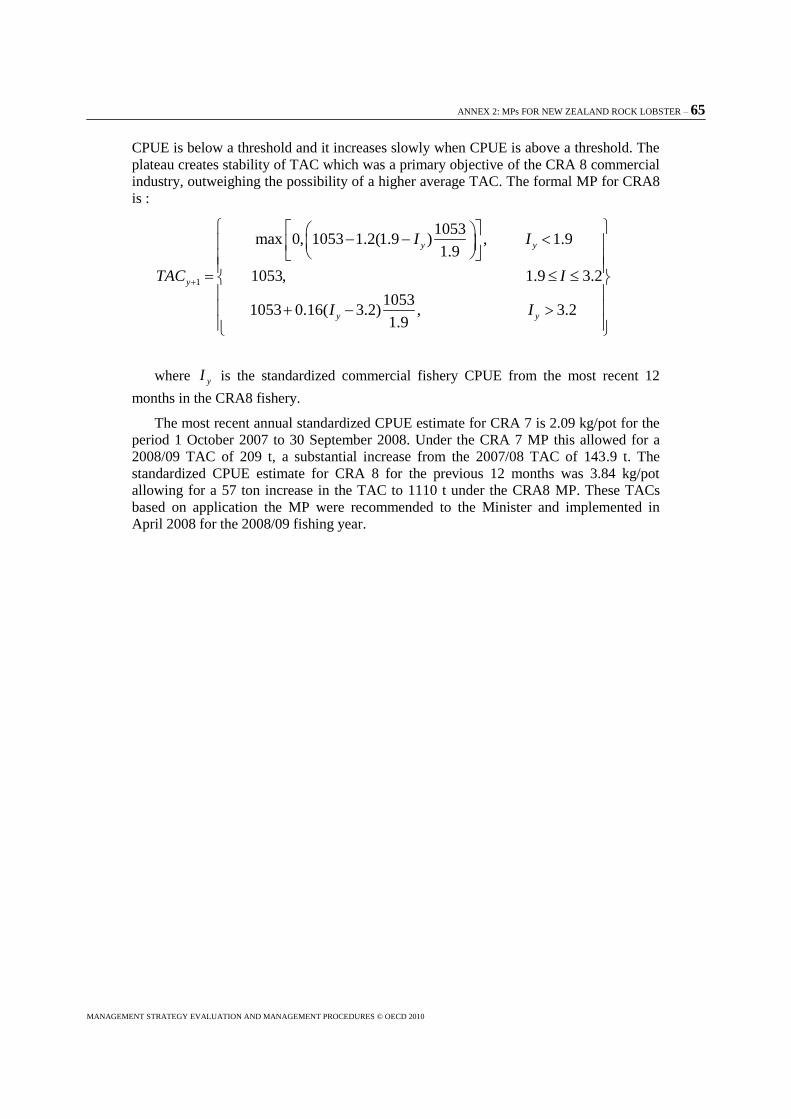
ANNEX 2: MPs FOR NEW ZEALAND ROCK LOBSTER – 65
MANAGEMENT STRATEGY EVALUATION AND MANAGEMENT PROCEDURES © OECD 2010
CPUE is below a threshold and it increases slowly when CPUE is above a threshold. The
plateau creates stability of TAC which was a primary objective of the CRA 8 commercial
industry, outweighing the possibility of a higher average TAC. The formal MP for CRA8
is :
1
1053max 0, 1053 1.2(1.9 ) , 1.9
1.9
1053, 1.9 3.2
10531053 0.16( 3.2) , 3.2
1.9
y y
y
y y
I I
TAC I
I I
where yI is the standardized commercial fishery CPUE from the most recent 12
months in the CRA8 fishery.
The most recent annual standardized CPUE estimate for CRA 7 is 2.09 kg/pot for the
period 1 October 2007 to 30 September 2008. Under the CRA 7 MP this allowed for a
2008/09 TAC of 209 t, a substantial increase from the 2007/08 TAC of 143.9 t. The
standardized CPUE estimate for CRA 8 for the previous 12 months was 3.84 kg/pot
allowing for a 57 ton increase in the TAC to 1110 t under the CRA8 MP. These TACs
based on application the MP were recommended to the Minister and implemented in
April 2008 for the 2008/09 fishing year.
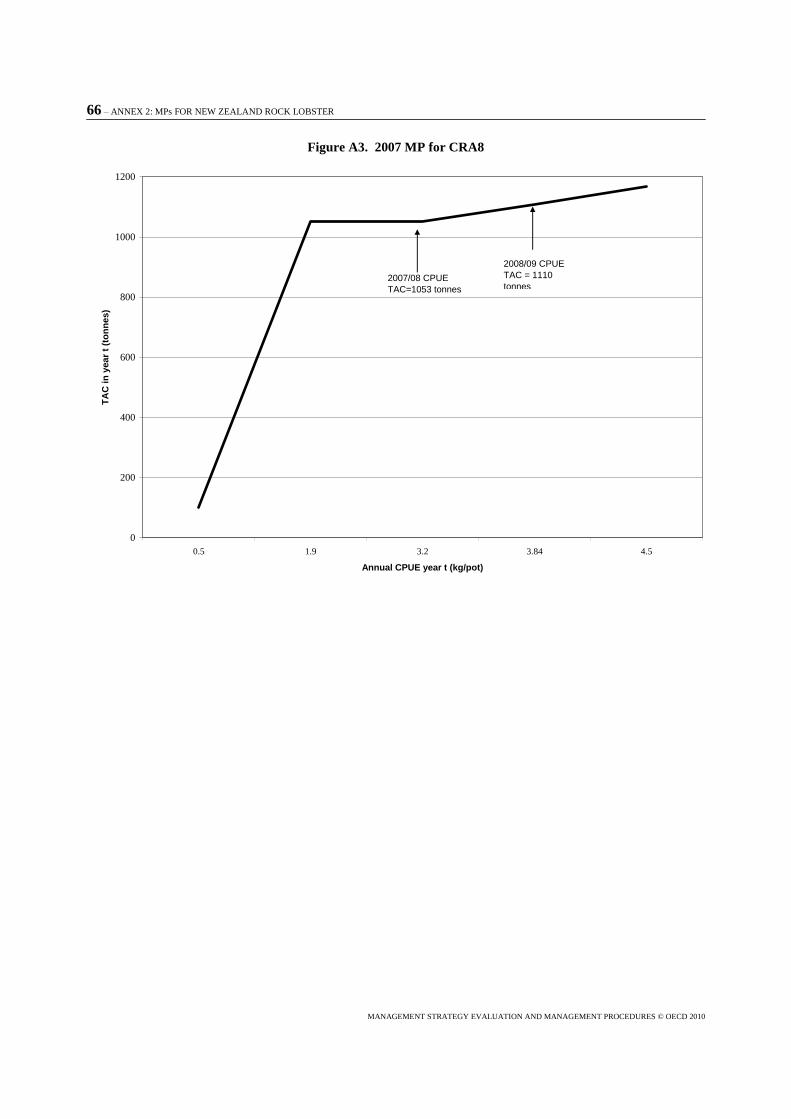
66 – ANNEX 2: MPs FOR NEW ZEALAND ROCK LOBSTER
MANAGEMENT STRATEGY EVALUATION AND MANAGEMENT PROCEDURES © OECD 2010
Figure A3. 2007 MP for CRA8
0
200
400
600
800
1000
1200
0.5 1.9 3.2 3.84 4.5
Annual CPUE year t (kg/pot)
TA
C in
year
t (t
on
nes)
2007/08 CPUE
TAC=1053 tonnes
2008/09 CPUE
TAC = 1110
tonnes