problems of the respiratory system map 19: rate of …
TRANSCRIPT

80 NHS ATLAS OF VARIATION80 NHS ATLAS OF VARIATION
Contains National Statistics data © Crown copyright and database right 2015© Crown copyright and database rights 2015 Ordnance Survey 100016969
PROBLEMS OF THE RESPIRATORY SYSTEM
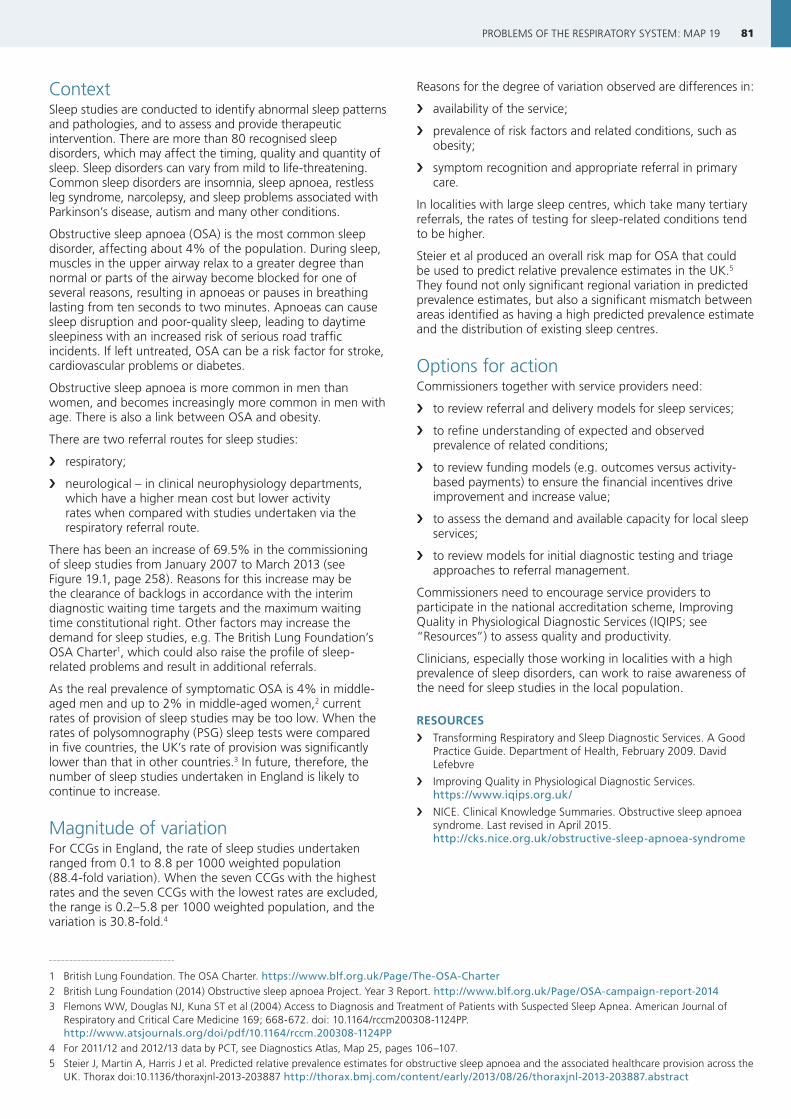
Map 19: Rate of sleep studies undertaken per weighted population by CCGAdjusted for age, sex and “need”, 2013/14
Domain 2: Enhancing quality of life for people with long-term conditions
0
1
2
3
4
5
6
7
8
9
10
211 CCGs
Rat
e p
er 1
000
LONDON
Lowest rate
Highest rateNo data
81PROBLEMS OF THE RESPIRATORY SYSTEM: MAP 19
ContextSleep studies are conducted to identify abnormal sleep patterns and pathologies, and to assess and provide therapeutic intervention. There are more than 80 recognised sleep disorders, which may affect the timing, quality and quantity of sleep. Sleep disorders can vary from mild to life-threatening. Common sleep disorders are insomnia, sleep apnoea, restless leg syndrome, narcolepsy, and sleep problems associated with Parkinson’s disease, autism and many other conditions.
Obstructive sleep apnoea (OSA) is the most common sleep disorder, affecting about 4% of the population. During sleep, muscles in the upper airway relax to a greater degree than normal or parts of the airway become blocked for one of several reasons, resulting in apnoeas or pauses in breathing lasting from ten seconds to two minutes. Apnoeas can cause sleep disruption and poor-quality sleep, leading to daytime sleepiness with an increased risk of serious road traffic incidents. If left untreated, OSA can be a risk factor for stroke, cardiovascular problems or diabetes.
Obstructive sleep apnoea is more common in men than women, and becomes increasingly more common in men with age. There is also a link between OSA and obesity.
There are two referral routes for sleep studies:
› respiratory;
› neurological – in clinical neurophysiology departments, which have a higher mean cost but lower activity rates when compared with studies undertaken via the respiratory referral route.
There has been an increase of 69.5% in the commissioning of sleep studies from January 2007 to March 2013 (see Figure 19.1, page 258). Reasons for this increase may be the clearance of backlogs in accordance with the interim diagnostic waiting time targets and the maximum waiting time constitutional right. Other factors may increase the demand for sleep studies, e.g. The British Lung Foundation’s OSA Charter1, which could also raise the profile of sleep-related problems and result in additional referrals.
As the real prevalence of symptomatic OSA is 4% in middle-aged men and up to 2% in middle-aged women,2 current rates of provision of sleep studies may be too low. When the rates of polysomnography (PSG) sleep tests were compared in five countries, the UK’s rate of provision was significantly lower than that in other countries.3 In future, therefore, the number of sleep studies undertaken in England is likely to continue to increase.
Magnitude of variationFor CCGs in England, the rate of sleep studies undertaken ranged from 0.1 to 8.8 per 1000 weighted population (88.4-fold variation). When the seven CCGs with the highest rates and the seven CCGs with the lowest rates are excluded, the range is 0.2–5.8 per 1000 weighted population, and the variation is 30.8-fold.4
Reasons for the degree of variation observed are differences in:
› availability of the service;
› prevalence of risk factors and related conditions, such as obesity;
› symptom recognition and appropriate referral in primary care.
In localities with large sleep centres, which take many tertiary referrals, the rates of testing for sleep-related conditions tend to be higher.
Steier et al produced an overall risk map for OSA that could be used to predict relative prevalence estimates in the UK.5 They found not only significant regional variation in predicted prevalence estimates, but also a significant mismatch between areas identified as having a high predicted prevalence estimate and the distribution of existing sleep centres.
Options for actionCommissioners together with service providers need:
› to review referral and delivery models for sleep services;
› to refine understanding of expected and observed prevalence of related conditions;
› to review funding models (e.g. outcomes versus activity-based payments) to ensure the financial incentives drive improvement and increase value;
› to assess the demand and available capacity for local sleep services;
› to review models for initial diagnostic testing and triage approaches to referral management.
Commissioners need to encourage service providers to participate in the national accreditation scheme, Improving Quality in Physiological Diagnostic Services (IQIPS; see “Resources”) to assess quality and productivity.
Clinicians, especially those working in localities with a high prevalence of sleep disorders, can work to raise awareness of the need for sleep studies in the local population.
RESOURCES › Transforming Respiratory and Sleep Diagnostic Services. A Good
Practice Guide. Department of Health, February 2009. David Lefebvre
› Improving Quality in Physiological Diagnostic Services. https://www.iqips.org.uk/
› NICE. Clinical Knowledge Summaries. Obstructive sleep apnoea syndrome. Last revised in April 2015. http://cks.nice.org.uk/obstructive-sleep-apnoea-syndrome
1 British Lung Foundation. The OSA Charter. https://www.blf.org.uk/Page/The-OSA-Charter2 British Lung Foundation (2014) Obstructive sleep apnoea Project. Year 3 Report. http://www.blf.org.uk/Page/OSA-campaign-report-2014 3 Flemons WW, Douglas NJ, Kuna ST et al (2004) Access to Diagnosis and Treatment of Patients with Suspected Sleep Apnea. American Journal of
Respiratory and Critical Care Medicine 169; 668-672. doi: 10.1164/rccm200308-1124PP. http://www.atsjournals.org/doi/pdf/10.1164/rccm.200308-1124PP
4 For 2011/12 and 2012/13 data by PCT, see Diagnostics Atlas, Map 25, pages 106–107.5 Steier J, Martin A, Harris J et al. Predicted relative prevalence estimates for obstructive sleep apnoea and the associated healthcare provision across the
UK. Thorax doi:10.1136/thoraxjnl-2013-203887 http://thorax.bmj.com/content/early/2013/08/26/thoraxjnl-2013-203887.abstract
82 NHS ATLAS OF VARIATION82 NHS ATLAS OF VARIATION
Contains National Statistics data © Crown copyright and database right 2015© Crown copyright and database rights 2015 Ordnance Survey 100016969
PROBLEMS OF THE RESPIRATORY SYSTEM
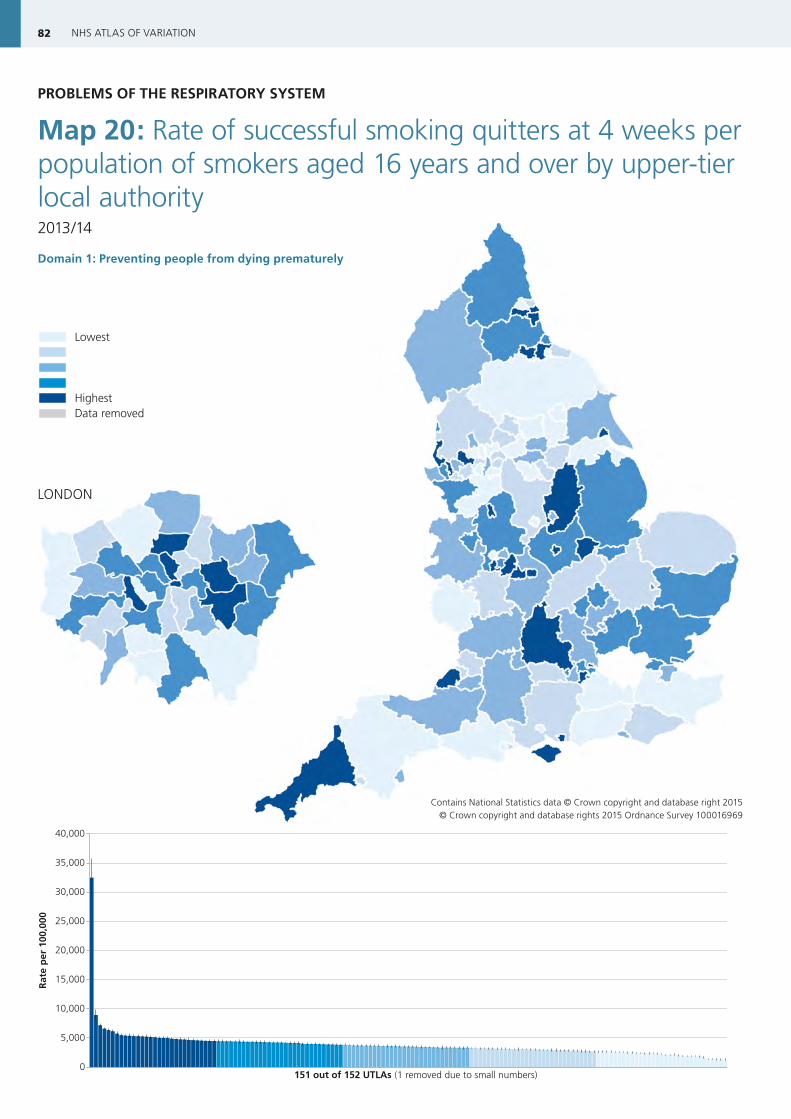
Map 20: Rate of successful smoking quitters at 4 weeks per population of smokers aged 16 years and over by upper-tier local authority2013/14
Domain 1: Preventing people from dying prematurely
0
5,000
10,000
15,000
20,000
25,000
30,000
35,000
40,000
151 out of 152 UTLAs (1 removed due to small numbers)
Rat
e p
er 1
00,0
00
LONDON
Lowest rate
Highest rateData removed

83PROBLEMS OF THE RESPIRATORY SYSTEM: MAP 20
ContextTobacco-smoking is the principal cause of preventable death and disability in England. It is the main reason for the gap in healthy life-expectancy between higher and lower socio-economic groups.
Chronic obstructive pulmonary disease (COPD) affects around 3 million people in England1, and about 90% of cases are caused by smoking2. There is a substantial socio-economic gradient in smoking prevalence and mortality from COPD. In undiagnosed COPD, there is considerable population benefit associated with stopping smoking services.3
Smoking also increases the risk of developing, and the severity of, asthma. Direct or passive exposure to cigarette smoke:
› adversely affects lung function; › reduces the effectiveness of inhaled therapy; › increases exacerbation rate and mortality risk in people
with asthma.
Smoking prevalence is much higher in people with mental health problems.
Smoking cessation is not solely a primary prevention intervention. For people who already have a respiratory condition, support to stop smoking is a core treatment because it improves lung function, and, in COPD, it increases survival (see Figure 20.1, page 258). It is also considerably more cost-effective in the management of respiratory conditions than many routine treatments, especially for mild-to-moderate COPD3.
Magnitude of variationFor upper-tier local authorities (UTLAs) in England, the rate of successful smoking quitters at 4 weeks ranged from 1251 to 32,497 per 100,000 population of smokers aged 16 years and over (26.0-fold variation).4 When the five UTLAs with the highest rates and the five UTLAs with the lowest rates are excluded, the range is 1718–6147 per 100,000 population of smokers aged 16 years and over, and the variation is 3.6-fold.5
The degree of variation observed suggests that services in some localities are more effective at supporting smoking cessation than others.
Options for actionPeople who smoke are more likely to be successful in a quit attempt if they have professional support than if they try to quit on their own. Commissioners need to specify that all service providers:
› ensure local care pathways recommend smoking cessation advice and referral to specialist smoking cessation services at key trigger points in the patient journey: e.g. routine chronic disease management review, outpatient attendance, acute exacerbation, emergency department attendance, hospital admission, and hospital discharge;
› develop and implement policies to support smoking cessation in patients and staff, and use initiatives such as smoking cessation champions (see “Resources”);
› comply with NICE guidance (see “Resources”) and take opportunities to offer smoking cessation services when people present for other reasons, especially as people with COPD, asthma and other respiratory conditions have frequent interactions with healthcare professionals – Making Every Contact Count6;
› train clinical staff in primary and emergency care to deliver brief interventions to support smoking cessation;
› include smoking-cessation support in acute care and discharge bundles.
Commissioners also need to consider population-level social marketing to ensure maximum reach of smoking-cessation interventions, for example:
› a pan-London smoking cessation and recruitment awareness campaign with the objective of driving incremental quit attempts in a cost-effective way (NHS Commissioning Support for London; see “Resources”);
› increasing the number of smokers accessing and quitting with smoking cessation services in Whitecrook, a deprived area in Scotland (NHS Health Scotland; see “Resources”).
RESOURCES › Department of Health (2011) An outcomes strategy for people
with chronic obstructive pulmonary disease (COPD) and Asthma in England. https://www.gov.uk/government/publications/an-outcomes-strategy-for-people-with-chronic-obstructive-pulmonary-disease-copd-and-asthma-in-england
› Department of Health (2012) An Outcomes Strategy for COPD and Asthma: NHS Companion Document. http://www.dh.gov.uk/en/Publicationsandstatistics/Publications/PublicationsPolicyAndGuidance/DH_134000
› Department of Health. Commissioning Toolkit for respiratory services. Toolkit for NHS commissioners and chief executives to help commission better outcomes for people with COPD. August 2012. https://www.gov.uk/government/publications/commissioning-toolkit-for-respiratory-services
› NICE. Tobacco: harm-reduction approaches to smoking. NICE Guidelines [PH45]. June 2013. http://www.nice.org.uk/guidance/ph45
› NICE. Brief interventions and referral for smoking cessation. NICE Guidelines [PH1]. March 2006. http://www.nice.org.uk/Guidance/PH1
› NICE. Smoking cessation services. NICE Guidelines [PH10]. February 2008. http://www.nice.org.uk/Guidance/PH10
› NICE. Smoking cessation services in secondary care: acute, maternity and mental health services. NICE Guidelines [PH48]. November 2013. http://www.nice.org.uk/guidance/ph48
› NHS Commissioning Support for London. “London Spring 09” Smoking Cessation. Report of the social marketing project. October 2009. http://www.londonhp.nhs.uk/wp-content/uploads/2011/03/Smoking-cessation-project-report.pdf
› NHS Health Scotland. Whitecrook Smoking Cessation project. 2009-2010. http://www.healthscotland.com/uploads/documents/15996-WhitecrookSmokingCessationProject.pdf
› National Centre for Smoking Cessation and Training. http://www.ncsct.co.uk/
› NHS East Midlands Health Trainer Hub. An Implementation Guide and Toolkit for Making Every Contact Count: Using every opportunity to achieve health and wellbeing. http://www.england.nhs.uk/wp-content/uploads/2014/06/mecc-guid-booklet.pdf
› Public Health England. INHALE – Interactive Health Atlas for Lung conditions in England. http://www.erpho.org.uk/inhale.aspx
› British Thoracic Society. BTS Stop Smoking Champions Programme. https://www.brit-thoracic.org.uk/clinical-information/smoking-cessation/
1 Healthcare Commission (2006) Clearing the air: a national study of chronic obstructive pulmonary disease. London: Commission for Healthcare Audit and Inspection.
2 http://www.nhs.uk/conditions/Chronic-obstructive-pulmonary-disease/pages/causes.aspx
3 IMPRESS – Improving and Integrating Respiratory Services. IMPRESS Guide to the relative value of COPD interventions – Executive summary. July 2012. http://www.impressresp.com/index.php?option=com_docman&Itemid=82
4 Data from one UTLA have been removed due to small numbers. 5 For data from 2010/11 by PCT, see Respiratory Disease Atlas, Map 20,
pages 58-59.6 http://www.makingeverycontactcount.co.uk/

84 NHS ATLAS OF VARIATION84 NHS ATLAS OF VARIATION
Contains National Statistics data © Crown copyright and database right 2015© Crown copyright and database rights 2015 Ordnance Survey 100016969
PROBLEMS OF THE RESPIRATORY SYSTEM
Map 21: Percentage of patients with COPD who had influenza immunisation in the preceding 1 September to 31 March by CCG (QOF COPD0061 with exception-reported patients included)2013/14
Domain 1: Preventing people from dying prematurelyDomain 2: Enhancing quality of life for people with long-term conditions
0
10
20
30
40
50
60
70
80
90
100
211 CCGs
Per
cen
t
LONDON
Lowest rate
Highest rateNo data

85PROBLEMS OF THE RESPIRATORY SYSTEM: MAP 21
ContextMost of the care for people with chronic obstructive pulmonary disease (COPD) is provided in the primary care sector. Chronic disease management by GPs and nurses is likely to have a considerable impact on patient outcomes such as symptom control, quality of life, physical and social activity, admission to hospital, and mortality. The NHS London Respiratory Team found influenza immunisation of greatest value in cost per QALY for at-risk groups2 (IMPRESS has built on this work).
Indicators in the Quality and Outcomes Framework (QOF) reflect the chronic disease management of COPD in primary care, including the percentage of patients with COPD who have had influenza immunisation in the preceding 15 months.
For each QOF indicator, GPs are rewarded for achieving an agreed level of population coverage. In calculating coverage, practices are allowed to except appropriate patients from the target population for legitimate reasons to avoid being penalised for factors beyond the GPs’ control, e.g. when patients do not attend for review despite repeated invitations, or if a medication cannot be prescribed due to a contra-indication or side-effect. This exception-adjusted population coverage is reported annually. Actual population coverage for systematic chronic disease management in people with COPD is lower than the published QOF achievement suggests.
Patients not seen for review are at high risk of not receiving appropriate pro-active long-term disease management and therefore of experiencing worse outcomes than patients who are reviewed. Many of the people with COPD not attending for regular review may be among high-risk patients in whom control is poor. Novel and creative strategies are necessary to engage these patients in order to optimise their COPD control.
This indicator shows the actual population coverage for each CCG not the published QOF achievement: excepted patients have been included in the denominator.
Magnitude of variationFor CCGs in England, the percentage of patients with COPD who had influenza immunisation in the preceding 1 September to 31 March (exception-reported patients included) ranged from 76.3% to 88.9% (1.2-fold variation). When the seven CCGs with the highest percentages and the seven CCGs with the lowest percentages are excluded, the range is 77.7–86.4%, and the variation is 1.1-fold.
The variation in exception-reporting among practices tends to be much greater than that among CCGs: some practices are more effective than others at reaching the local COPD population and influencing patient outcomes.
Options for actionTo help more practices become effective at reaching the entire local population with COPD through regular review, commissioners and service providers in partnership need:
› to calculate the actual coverage for long-term disease management of registered COPD patients by including “excepted” patients in the denominator;
› to benchmark and share local exception-reporting data;
› to identify the systems to maximise patient-reach used in the best-performing practices;
› to support practices with high exception rates implement best-practice systems and improve patient outcomes through systematic long-term disease management (see Box 21.1).
Box 21.1: Improving influenza-related COPD outcomes3
› Improve patient uptake through public-facing demonstrations, and stories of clinicians and health workers partaking in organisational ‘flu vaccination programmes
› Target and provide education for previous ‘flu-jab decliners in primary care. Look at last year’s ‘not eligible’ group and re-explore their beliefs about the vaccine using patient-centred materials
› Share personal ‘flu stories from patients with COPD or other chronic lung disease
In a cross-sectional survey of UK general practices, the following were associated with higher influenza vaccine uptake:
› lead staff member (i) to plan the influenza campaign, and (ii) to identify eligible patients (using either a modified manufacturer’s or in-house search programme to interrogate the practice IT system);
› personal invitation to all eligible patients;
› stopping vaccination only when QOF targets were met;
› lead staff member to write a report of practice performance.4
RESOURCES › Department of Health (2011) An outcomes strategy for people
with chronic obstructive pulmonary disease (COPD) and Asthma in England. https://www.gov.uk/government/publications/an-outcomes-strategy-for-people-with-chronic-obstructive-pulmonary-disease-copd-and-asthma-in-england
› Department of Health (2012) An Outcomes Strategy for COPD and Asthma: NHS Companion Document. http://www.dh.gov.uk/en/Publicationsandstatistics/Publications/PublicationsPolicyAndGuidance/DH_134000
› Department of Health. Commissioning Toolkit for respiratory services. Toolkit for NHS commissioners and chief executives to help commission better outcomes for people with COPD. August 2012. https://www.gov.uk/government/publications/commissioning-toolkit-for-respiratory-services
› Public Health England. INHALE – Interactive Health Atlas for Lung conditions in England. http://www.erpho.org.uk/inhale.aspx
› NICE. Chronic obstructive pulmonary disease: Management of chronic obstructive pulmonary disease in adults in primary and secondary care (partial update). NICE guidelines [CG101]. June 2010. http://guidance.nice.org.uk/CG101
› NICE. Chronic obstructive pulmonary disease quality standard. NICE quality standard [QS10]. July 2011. http://www.nice.org.uk/guidance/qs10
› The Primary Care Respiratory Society. http://www.pcrs-uk.org/
1 In 2013/14, the QOF ID was COPD006; for 2014/15 and 2015/16, the QOF ID changed to COPD007.2 IMPRESS – Improving and Integrating Respiratory Services. IMPRESS Guide to the relative value of COPD interventions. July 2012. Page 17.
http://www.impressresp.com/index.php?option=com_docman&Itemid=823 NHS London. London Respiratory Team (LRT) Factsheet: Protecting people with COPD from influenza. 27/09/2012. http://www.google.co.uk/url?s
a=t&rct=j&q=&esrc=s&source=web&cd=4&cad=rja&uact=8&ved=0CD8QFjAD&url=http%3A%2F%2Fwww.networks.nhs.uk%2Fnhs-networks%2Flondon-respiratory-network%2Fdocuments%2FFlu%2520and%2520COPD.pdf&ei=hZfUVKO8B4HzUpCUgoAP&usg=AFQjCNFmZZCq7ZlqgbYkQ-I_5hj3eDvzrQ
4 Dexter LJ, Teare MD, Dexter M et al. Strategies to increase influenza vaccination rates: outcomes of a nationwide cross-sectional survey of UK general practice. BMJ Open 2012;2:e000851. doi: 10.1136/bmjopen-2011-000851 http://bmjopen.bmj.com/content/2/3/e000851.full.pdf+html
86 NHS ATLAS OF VARIATION86 NHS ATLAS OF VARIATION
Contains National Statistics data © Crown copyright and database right 2015© Crown copyright and database rights 2015 Ordnance Survey 100016969
PROBLEMS OF THE RESPIRATORY SYSTEM
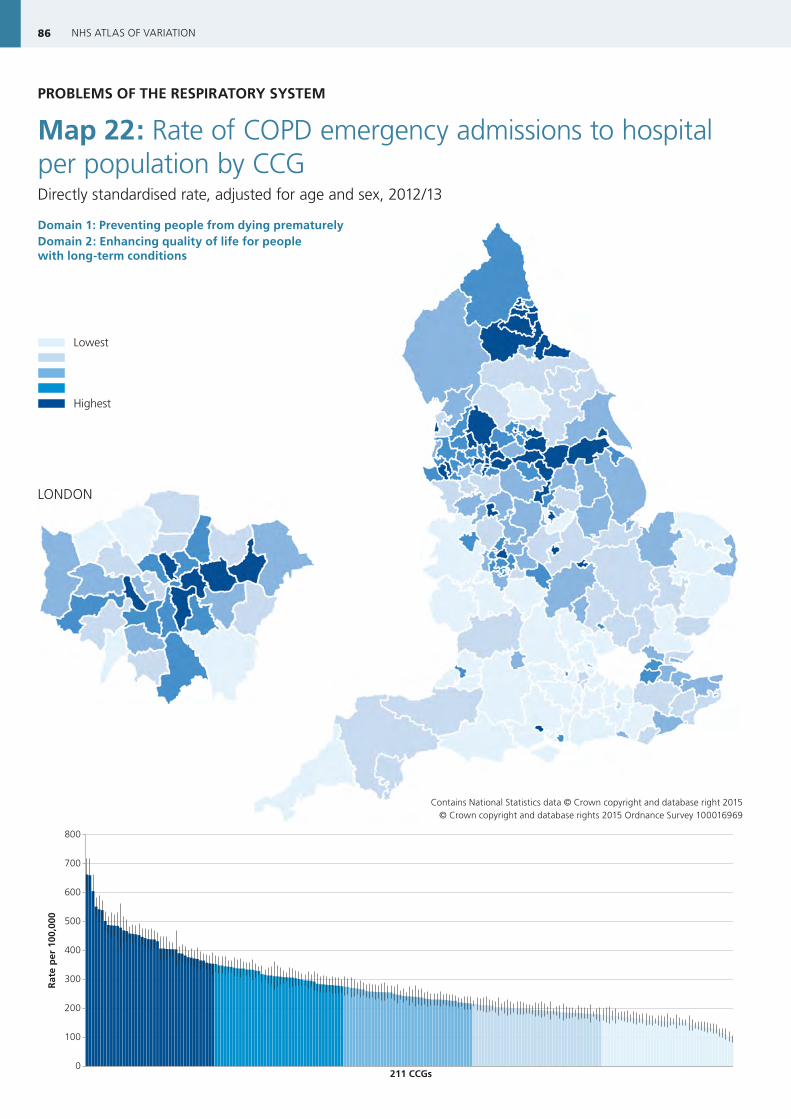
Map 22: Rate of COPD emergency admissions to hospital per population by CCGDirectly standardised rate, adjusted for age and sex, 2012/13
Domain 1: Preventing people from dying prematurely Domain 2: Enhancing quality of life for people with long-term conditions
0
100
200
300
400
500
600
700
800
211 CCGs
Rat
e p
er 1
00,0
00
LONDON
Lowest rate
Highest rateNo data
87PROBLEMS OF THE RESPIRATORY SYSTEM: MAP 22
ContextChronic obstructive pulmonary disease (COPD) is one of the main causes of preventable death and disability. In England, more than 3 million people are known to suffer from COPD, but only around 835,000 have been diagnosed.
People with COPD experience recurrent flare-ups or exacerbations that need more intensive treatment, some of which can be severe enough to require hospital admission. Indeed, COPD is the second most common reason for emergency admission to hospital, accounting for one in eight non-elective admissions. The care of people with COPD in hospital settings is costly for the NHS.
In England, COPD contributes to the death of about 26,000 people a year. Mortality is high in people with COPD who are hospitalised: one in six will die during an emergency admission; one in twelve will die within 3 months.
Admission to hospital is a major adverse outcome for people with COPD, which places considerable demands on NHS resources.
Magnitude of variationFor CCGs in England, the rate of COPD emergency admissions to hospital ranged from 94 to 662 per 100,000 population (7.0-fold variation). When the seven CCGs with the highest rates and the seven CCGs with the lowest rates are excluded, the range is 132–488 per 100,000 population, and the variation is 3.7-fold.
Thus, for people with COPD, the risk of being admitted with an acute exacerbation can vary nearly four times depending on where they live.
One possible reason for the degree of variation observed is differences in the extent to which all services providing care for people with COPD are integrated into an effective system of care.
Previous internal analysis at the Department of Health revealed similar patterns when comparing PCTs with similar populations and similar levels of deprivation.
Options for actionIn many localities, there would appear to be substantial scope for reducing emergency COPD admissions, which could not only improve outcomes for patients but also save money because expenditure on COPD admissions is high in every CCG.
In CCGs in which COPD emergency admission rates are higher, commissioners need to specify that service providers ensure the provision of pro-active clinical care and alternatives to admission by:
› reviewing admissions among primary and secondary care providers to identify people experiencing frequent exacerbations who need more pro-active management;
› establishing early discharge schemes and hospital-at-home services to support evidence-based avoidance of admissions;
› providing pro-active chronic disease management in primary and community care, including clear action plans, optimisation of therapy and support for patient self-management with home provision of standby medication, and referral for pulmonary rehabilitation when indicated;
› providing prompt support for patients when they develop new or worsening symptoms, with early access to specialist-led integrated care in the community when appropriate;
› establishing a triage service in the urgent-care system run by a multidisciplinary respiratory team to manage the diversion of people with COPD to community services using direct links between the triage service and the “pick-up” of patients in the community.1
RIGHTCARE CASEBOOK › Hardwick CCG – From Commissioning for Value insights to
delivery in seven months. Tackling the COPD pathway. http://www.rightcare.nhs.uk/index.php/resourcecentre/commissioning-for-value-best-practice-casebooks/hardwick-ccg-from-commissioning-for-value-insights-to-delivery-in-seven-months/
RESOURCES › Department of Health (2011) An outcomes strategy for people
with chronic obstructive pulmonary disease (COPD) and Asthma in England. https://www.gov.uk/government/publications/an-outcomes-strategy-for-people-with-chronic-obstructive-pulmonary-disease-copd-and-asthma-in-england
› Department of Health (2012) An Outcomes Strategy for COPD and Asthma: NHS Companion Document. http://www.dh.gov.uk/en/Publicationsandstatistics/Publications/PublicationsPolicyAndGuidance/DH_134000
› Department of Health. Commissioning Toolkit for respiratory services. Toolkit for NHS commissioners and chief executives to help commission better outcomes for people with COPD. August 2012. https://www.gov.uk/government/publications/commissioning-toolkit-for-respiratory-services
› Public Health England. INHALE – Interactive Health Atlas for Lung conditions in England. http://www.erpho.org.uk/inhale.aspx
› NICE. Chronic obstructive pulmonary disease: Management of chronic obstructive pulmonary disease in adults in primary and secondary care (partial update). NICE guidelines [CG101]. June 2010. http://guidance.nice.org.uk/CG101
› NICE. Chronic obstructive pulmonary disease quality standard. NICE quality standard [QS10]. July 2011. http://www.nice.org.uk/guidance/qs10
› NHS Improvement – Lung. National Improvement Projects. Improving adult asthma care - emerging learning from the national improvement projects. http://www.slideshare.net/NHSImprovement/improving-adult-asthma-care-emerging-learning-from-the-national-improvement-projects
› IMPRESS – Improving and integrating respiratory services. http://www.impressresp.com/
› British Lung Foundation. http://www.blf.org.uk/Home
1 McKay C, Cripps M. Delivering improved healthcare in Warrington: the NHS Right Care approach. July 2013. http://www.rightcare.nhs.uk/downloads/Casebook_warrington_respiratory_final.pdf
88 NHS ATLAS OF VARIATION88 NHS ATLAS OF VARIATION
Contains National Statistics data © Crown copyright and database right 2015© Crown copyright and database rights 2015 Ordnance Survey 100016969
PROBLEMS OF THE RESPIRATORY SYSTEM
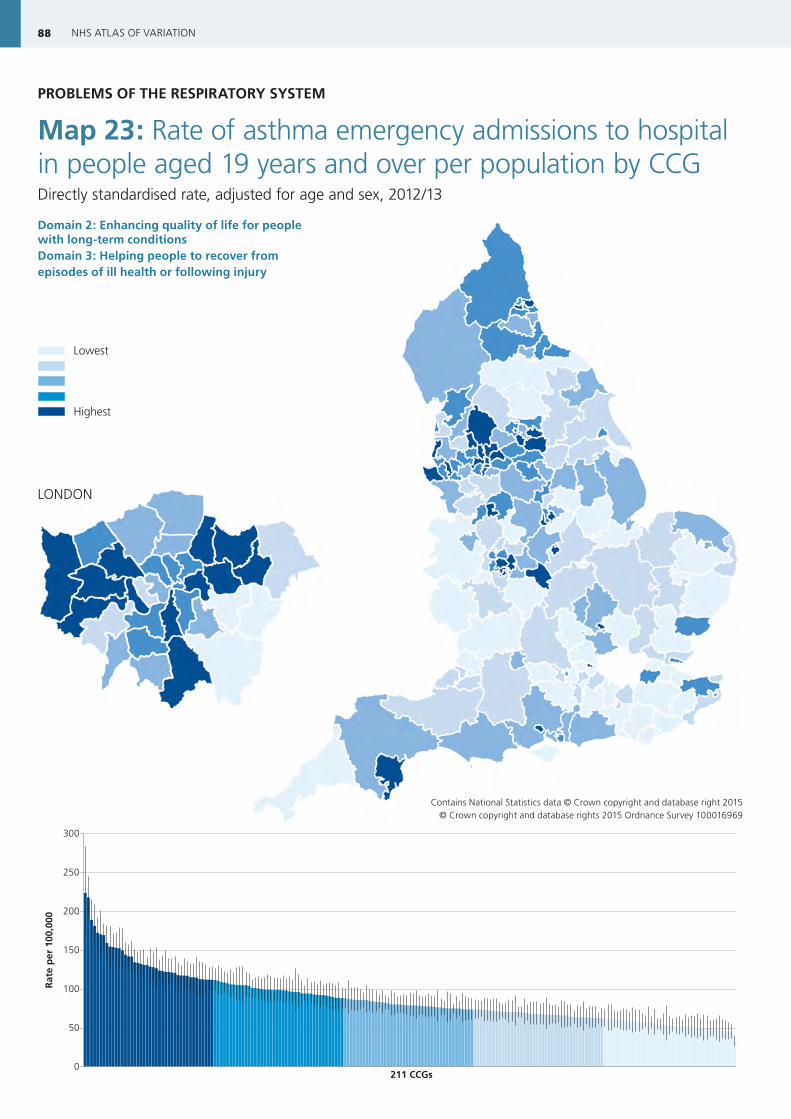
Map 23: Rate of asthma emergency admissions to hospital in people aged 19 years and over per population by CCGDirectly standardised rate, adjusted for age and sex, 2012/13
Domain 2: Enhancing quality of life for people with long-term conditionsDomain 3: Helping people to recover from episodes of ill health or following injury
0
50
100
150
200
250
300
211 CCGs
Rat
e p
er 1
00,0
00
LONDON
Lowest rate
Highest rateNo data
89PROBLEMS OF THE RESPIRATORY SYSTEM: MAP 23
ContextThe goal of asthma care is to control symptoms such that people with asthma are able to lead as normal a life as possible, which should be achievable in the majority of patients.
An emergency hospital attendance or admission represents a serious loss of control of a person’s asthma. Admissions are sometimes necessary for specialist management of severe exacerbations, but around three-quarters of admissions are preventable. Most people with asthma will have had symptoms for several days before an admission, indicating that it would have been possible to intervene to prevent admission during that time-period. Emergency admission to hospital is a major adverse outcome for patients.
Structured self-management support including an individual action plan is a key element of long-term disease management in asthma. People who have an asthma action plan have fewer hospitalisations, fewer emergency department visits, and fewer unscheduled visits to the doctor than people who do not have such a plan.1 Personalised care planning with appropriate follow-up support leads to improvements in some indicators of physical, psychological and subjective health status, and people’s capability to self-manage their condition.2
Magnitude of variationFor CCGs in England, the rate of asthma emergency admissions to hospital in people aged 19 years and over ranged from 33 to 224 per 100,000 population (6.8-fold variation). When the seven CCGs with the highest rates and the seven CCGTs with the lowest rates are excluded, the range is 49–159 per 100,000 population, and the variation is 3.3-fold.
Thus, for people with asthma, the risk of being admitted with an acute exacerbation can vary three times depending on where they live. Some of this variation can be accounted for by differences in local population characteristics, but much is unwarranted due to differences in:
› the quality of asthma care;
› the support people receive to manage their condition.
The degree of variation observed shows that in many localities there is substantial scope for reducing emergency events. What is achievable for patients in one locality should be possible in all localities if best practice is adopted in the NHS.
Options for actionAction to prevent emergency admissions will save money and improve outcomes for people with asthma. Commissioners need to specify that service providers deliver optimal long-term disease management and structured support for self-management such that patients know the appropriate action to take at the first sign of deterioration, including:
› developing an asthma action plan, in partnership with patients, as part of structured asthma education to help all patients identify deterioration and understand what actions to take;
› reviewing asthma action plans regularly and always at the time of emergency department attendance or hospital admission;
› delivering care in line with the SIGN/BTS guideline (see “Resources”);
› providing healthcare professionals responsible for managing people with asthma with training in asthma management, and with support on how best to deliver structured self-management support to patients;
› providing a structured primary care review at least once a year to all people with asthma in line with the SIGN/BTS guideline;
› conducting a review of all people attending hospital with acute exacerbations of asthma, preferably within 30 days of attendance – to be undertaken by a clinician with expertise in asthma management;
› helping practices identify people who need more active monitoring and management, and develop a register of people at risk of admission, including people who have had an admission in the previous 12 months, people identified through audit to be using excessive quantities of short-acting bronchodilators, and people who have had a course of oral steroids in the preceding 12 months.
Service providers could consider the introduction in the urgent-care system of a triage service run by a multidisciplinary respiratory team to manage the diversion of people with asthma to community services using direct links between the triage service and the “pick-up” of patients in the community.3
RESOURCES › Royal College of Physicians. Why asthma still kills. The National
Review of Asthma Deaths (NRAD). Confidential Enquiry Report. May 2014. https://www.rcplondon.ac.uk/projects/national-review-asthma-deaths
› Department of Health (2011) An outcomes strategy for people with chronic obstructive pulmonary disease (COPD) and Asthma in England. https://www.gov.uk/government/publications/an-outcomes-strategy-for-people-with-chronic-obstructive-pulmonary-disease-copd-and-asthma-in-england
› Department of Health (2012) An Outcomes Strategy for COPD and Asthma: NHS Companion Document. http://www.dh.gov.uk/en/Publicationsandstatistics/Publications/PublicationsPolicyAndGuidance/DH_134000
› British Thoracic Society (BTS) and Scottish Intercollegiate Guidelines Network (SIGN). SIGN 141: British guideline on the management of asthma. A national clinical guideline. October 2014. http://www.sign.ac.uk/guidelines/fulltext/141/index.html
› NHS Improvement – Lung. National Improvement Projects. Improving adult asthma care - emerging learning from the national improvement projects. http://www.slideshare.net/NHSImprovement/improving-adult-asthma-care-emerging-learning-from-the-national-improvement-projects
› Lindsay J, Heaney L (2013) British Thoracic Society Adult Asthma Audit Report 2012 (Audit Period – 1 September 2012 – 31 October 2012). https://www.brit-thoracic.org.uk/document-library/audit-and-quality-improvement/audit-reports/bts-adult-asthma-audit-report-2012/
› Asthma UK: resources for clinicians and patients. http://www.asthma.org.uk/
› Public Health England. INHALE – Interactive Health Atlas for Lung conditions in England. http://www.erpho.org.uk/inhale.aspx
1 Gibson PG, Powell H, Wilson A et al. Selfmanagement education and regular practitioner review for adults with asthma. Cochrane Database of Systematic Reviews 2002, Issue 3. Art. No.: CD001117. doi: 10.1002/14651858.CD001117. http://onlinelibrary.wiley.com/doi/10.1002/14651858.CD001117/full
2 Coulter A, Entwistle VA, Eccles A et al. Personalised care planning for adults with chronic or long-term health conditions. Cochrane Database of Systematic Reviews 2015, Issue 3. Art. No.: CD010523. DOI: 10.1002/14651858.CD010523.pub2. http://onlinelibrary.wiley.com/doi/10.1002/14651858.CD010523.pub2/full
3 McKay C, Cripps M. Delivering improved healthcare in Warrington: the NHS Right Care approach. July 2013. http://www.rightcare.nhs.uk/downloads/Casebook_warrington_respiratory_final.pdf

ADDITIONAL VISUALISATIONS
0.00
0.02
0.04
0.06
0.08
0.10
0.12
0.14
0.16
0.18
0.20
Jan-
07
Mar
-07
May
-07
Jul-0
7
Sep-
07
Nov
-07
Jan-
08
Mar
-08
May
-08
Jul-0
8
Sep-
08
Nov
-08
Jan-
09
Mar
-09
May
-09
Jul-0
9
Sep-
09
Nov
-09
Jan-
10
Mar
-10
May
-10
Jul-1
0
Sep-
10
Nov
-10
Jan-
11
Mar
-11
May
-11
Jul-1
1
Sep-
11
Nov
-11
Jan-
12
Mar
-12
May
-12
Jul-1
2
Sep-
12
Nov
-12
Jan-
13
Mar
-13
Rat
e p
er 1
000
Sleep studies
Linear (Sleep studies)
Figure 19.1: Rate of respiratory physiology sleep studies commissioned per 1000 population January 2007 to March 20131 [Source: Diagnostic waiting times reporting of the monthly waiting times and activity reporting (DM01)]
1 Data from June 2007, June 2008, November 2008 and December 2008 have been removed due to data quality.
0
25
50
75
100
0
Disability
Smoked regularly and susceptible to its effects
Stopped at age 45
Stopped at age 65
Never smoked or notsusceptible to smoke
Death
50 75
FEV
1 (%
of
valu
e at
ag
e 25
)
Age (years)
Figure 20.1: Potential to increase survival in people with COPD who quit smoking
261CASE STUDIES 1–4
Case-study 1: Reducing antibiotic prescribing for self-limiting respiratory tract infections in primary care
Problem:
At Churchill Medical Centre, Surrey, an average of 40% of patients with upper respiratory tract symptoms were prescribed antibiotics.
Response:
A multidisciplinary team of “champions” was established across the practice to develop evidence-based messages from NICE clinical guidelines (CG691). Staff from the medical centre were recruited as part of the campaign, and receptionists were briefed on key messages before the campaign was launched. A patient information poster was originated highlighting common illnesses that do not require treatment with antibiotics, which was displayed in waiting and consultation rooms. A one-page evidence-based information sheet was also developed which clinicians could give to their patients. This sheet included advice on:
› the usual duration of coughs and colds;
› the inefficiency of antibiotics for the treatment of coughs and colds;
› when it was appropriate to call for help.
Outcomes:
Audit results from October 2012 to January 2013 showed a reduction in antibiotic prescribing for:
› coughs and colds from 54.5% to 37.7% of patients;
› upper respiratory tract infections from 32.6% to 19.7% of patients.
Key message:
The action taken was “low-tech”, and therefore easily reproducible in many general practices.
REFERENCE:
› Smith P, McQuattie K, Hogg K. Reducing antibiotic prescribing for self-limiting respiratory tract infections in primary care: a pilot study. SelfCare 2014; 5(5): 110-114. http://www.selfcarejournal.com/view.article.php?id=10155
1 NICE. Respiratory tract infections - antibiotic prescribing: Prescribing of antibiotics for self-limiting respiratory tract infections in adults and children in primary care. NICE guidelines [CG69]. July 2008. http://www.nice.org.uk/CG069

262 NHS ATLAS OF VARIATION
Case-study 2: Multifaceted interventions to promote prudent prescribing of antibiotics in primary care
Problem
The problem was twofold:
› the prescribing behaviour of primary care clinicians in Derbyshire concerning the inappropriate and/or over-use of antibiotics, particularly cephalosporins and quinolones;
› the level of public awareness of the appropriate treatment for common illnesses, particularly coughs and colds.
Response
A systematic review of interventions for promoting prudent prescribing of antibiotics by general practitioners was undertaken, the results of which suggested that multifaceted interventions maximise acceptability.
Four main types of intervention were used:
› Education and support for GP practices, in particular GPs, non-medical prescribers, and out-of-hours and other clinical staff (see Box CS2.1);
› the development of evidence-based treatment guidelines (see Box CS2.2);
› antibiotic prescribing leads (champions) – four GPs help promote the key antibiotic prescribing messages, and promote and assist with education sessions;
› Other initiatives, including three-monthly review of prescribing data for GP practices with feedback and the facility to benchmark against peers, new antimicrobial guidance sent to community pharmacists to promote the provision of consistent advice to patients requesting treatment for common illnesses, specific education or training sessions targeted at dentists, district nurses, and community pharmacists, messages on urine sensitivity reports that co-amoxiclav, cephalosporins and ciprofloxacin may be associated with an increased risk of
Clostridium difficile infection, and circulation of a paper on reducing rates of Clostridium difficile infection in the community.
Box CS2.1: Education and support interventions for GP practices
› Education sessions on healthcare-associated infections and evidence-based antibiotic prescribing, during which prescribing rates for all GP practices were circulated, followed by group discussions
› Key resources issued to all attendees including NICE quick reference guide to prescribing for respiratory tract infections, local treatment guidelines, other evidence-based summaries, and an article on implementing change when managing infections in primary care
› GP education and support visits (based on targeted prescribing performance or at the request of the practice)
› Further assistance, e.g. antibiotic audits with feedback of results, the provision of support materials (posters, leaflets, and the provision of standard operating procedures (SOPs) for delayed prescribing in dispensing and non-dispensing practices
Box CS2.2: Topics covered by evidence-based treatment guidelines
› Antimicrobial treatment
› Appropriate antibiotic prescribing and learning from local Clostridium difficile infection cases
› Diagnosis and management of lower urinary tract infections (UTIs)
› Management of Clostridium difficile infection

263CASE STUDIES 1–4
Outcomes
Clinicians who attended the education sessions were positive in their feedback, listing actions they planned to undertake (see Box CS2.3), and outlining personal learning points (see Box CS2.4).
Box CS2.3: Examples of actions clinicians planned to undertake after education sessions
› Use delayed prescriptions
› Change prescribing for UTIs
› Be more confident about not giving antibiotics
› Use leaflets
Box CS2.4: Examples of actions clinicians planned to undertake after education sessions
› Evidence regarding the use of delayed prescriptions
› Choice of antibiotics for UTIs in pregnancy
› Urine sampling and testing
› Risk of Clostridium difficile infection with different antibiotics
Prescribing of cephalosporins and quinolones decreased over 3 years from 2009/10 to 2012/13, and in 2013 the prescribing level for cephalosporins was one-third less than the national average and that for quinolones was one-quarter less than the national average.
Key message
A local evidence-based initiative using a multifaceted approach to improve the appropriateness of antibiotic prescribing that could be readily implemented or adapted in other localities.
REFERENCE:
› Harris DJ. Initiatives to improve antibiotic prescribing in primary care. Journal of Antimicrobial Chemotherapy 2013; 68: 2424-2427. http://jac.oxfordjournals.org/content/early/2013/09/11/jac.dkt360.full.pdf