probit model of early warning system for predicting financial crisis · pdf file ·...
TRANSCRIPT

Ordered Probit model of Early Warning System for Predicting
Financial Crisis in India
Thangjam Rajeshwar Singh Reserve Bank of India, Mumbai
________________________________________________________________________ Abstract The Indian economy is facing new challenges of maintaining financial stability with
greater integration in terms of trade and finance with global economy. In the face of
present global financial crisis which was triggered by liquidity shortfall in the overseas
banking system, there is a need for developing an early warning system (EWS)
incorporating global and domestic macroeconomic indicators for monitoring and
maintaining financial stability in an economy.
The financial sector in India is still dominated by banking sector and they hold the key to
the stability of the entire financial system in the country. With this background, an
attempt has been made to predict the financial crisis (fragile situation) in India using
ordered probit model. In this paper, using index method of recognizing exact month
during which the banking sector has experience crisis, we constructed monthly banking
sector fragility index (BSF) of India and developed the ordered probit model for
predicting the banking crisis using macroeconomic indicators. The banking fragility
index of India identifies nineteen phases of medium fragility and eight phases of high
fragility during the studied sampled period, March 2000 to November 2009. The model
could classify about 94 percent of different state of the crisis viz., no distress, medium
and high fragility, in India.
JEL Classification Number: C25, C35, E44, E47, G01
Keywords: Banking Crisis, Early Warning System, Ordered Probit Model, Banking
Fragility Index
Author is a Research Officer in Department of Statistics and Information Management (DSIM), Reserve
Bank of India. The views expressed in this paper are that of the author and not of the institution to which he belong.
1. Introduction
During last two decades, the world has seen a large number of financial crises in
emerging market economies of Latin America and Asia with consequences of large cost
at both national and international financial system. However, the recent financial tsunami
which started in US during August 2007 was triggered by liquidity shortfall in the
overseas banking system and has affected directly or indirectly to almost all the countries
of the world after the collapse of Lehman Brother in September 2008. The consequence
cost of this tsunami, according to the International Monetary Fund (IMF) in March 2009,
projected the world growth to shrink by 0.5 to 1.0 per cent in 2009 in contrast to an
expansion of 3.2 per cent in 2008; while, the World Bank estimated global GDP to
contract by 1.7 per cent. The IMF also projects that the GDP growth of Emerging Market
Economies (EMEs) will decelerate to a range of 1.5 to 2.5 per cent in 2009, down from
6.1 per cent in 2008. The economic activity in India too got slowed down during the
period due to spillover effect of the global crisis. The growth decelerated sharply during
the quarter October – December 2008 following the failure of Lehman Brothers in mid-
September 2008. The growth rate during the first three quarters (April-December) of
2008-09 slowed down significantly to 6.9 per cent from 9.0 per cent in the corresponding
period of the previous year (RBI, 2009a). Even though both the public sector and private
sector of Indian banks were financially sound and were not directly exposed to the sub-
prime mortgage assets; India experienced the knock-on effects of the global crisis,
through monetary, financial and real channels. The financial markets viz., equity
markets, money markets, forex markets and credit markets have all come under pressure
mainly because of the so call 'the substitution effect'. As credit lines and credit channels
in the overseas went dry, some of the credit demand earlier met by overseas financing is
shifting to the domestic credit sector, putting pressure on domestic resources. The
reversal of capital flows which took place as a part of the global de-leveraging process
has put pressure on the forex markets. Together, the global credit crunch and de-
leveraging were reflected at the domestic, in the sharp fluctuation of overnight money
market rates in October 2008 and the depreciation of the rupee (Subbarao, 2009a). To
avert and reduce such cost and effect of crisis, the prediction of distress/crisis situation
2

has come to the fore for maintaining financial stability in a country as well as in
international financial system.
There are theoretical models of financial crises to examined crisis
(Currency, or Banking crises) and bank failure. The macro origin of financial
crises model mainly relies on three generation models viz., first-generation
models, second-generation models and third-generation models. According to
the first-generation models weak economic fundamentals are more vulnerable to
speculative attacks. While in second-generation model, it does not reject the role
of weak fundamentals, but suggests that self-fulfilling expectations appear to be
the main cause of crises. These two generation models are commonly known as
currency crisis models. On the other hand, the third generation models combine
weaknesses in the economic fundamentals of early generation models with
weaknesses in the banking sectors, to the analysis of financial crises. For this
reason, the third generation models are also known as twin crises, i.e. banking
and currency crisis models. While according to the micro origin, financial crisis
may be categorized by different groups of bank failure models, such as random
withdrawal models, asymmetric information models, adverse shock/credit
channel models and moral hazard models.
As an aftermath of the East Asian Crisis in 1990s, central banks across the globe
pursue financial stability as its one of their goal. India too pursues it as one of its
monetary policy objective. In India, the financial system is dominated by banking sector
and commercial banks of the Indian banking system accounts for more than 90 percent of
the banking system’s assets (RBI, 2007). A significant aspect of banking trend in India is
that so far it has never witnessed a banking crisis. However, the continuous liberalization
3
and its greater integration with the global economy have opened up fresh challenges for
the Indian banking sector. According to Arestis and Glickman (2002), the primary impact
of openness in an emerging economy is to import the drive towards financial innovation,
as foreign investors seek out investment opportunities and local households, firms and
banks begin to look abroad for finance. Sooner or later, the economy falls into state of
international financial fragility. It then become prone to crisis that is domestic in origin
but impacts on its external situation or to crisis that is external in origin but impact on the
domestic situation and combining the two, it identify the crisis (Anastasia, 2007).
In recent years, India’s integration with the global economy is being witnessed
distinctly by the growth of its merchandise export plus imports as a proportion of GDP
growing from 21.2 per cent in 1997-98, the year of the Asian crisis, to 34.7 per cent in
2007-08. While the India’s financial integration with the world measured in terms of ratio
of total external transactions (gross current account flows plus gross capital flows) to
GDP, has more than doubled from 46.8 per cent in 1997-98 to 117.4 per cent in 2007-08
(Subbarao, 2009b). With such degree of gradual openness and integration, it is important
that India needs to keep a watch to capture the developments in international markets and
apprehend the implications for the domestic economic and financial systems. This
emerging scenario of India’s integration with the global economy and in the light of
current global financial crisis, a need is being felt for developing an early warning model
incorporating global and domestic macroeconomic indicators which may effectively
signal future banking vulnerability in India and enable the authorities to take pre-emptive
policy measures and avoid a banking disaster.
An early warning system (EWS) aim at anticipating whether and when individual
country may be affected by a financial crisis by developing a framework that allows
predicting financial crisis in relatively open economy. There are basically three
approaches to the development of predicting financial crisis, particularly the banking
crisis, viz., Bottom-up approach, Aggregate approach and Macroeconomic approach1. In
the bottom-up approach, the probability of insolvency is estimated for each individual
bank and the concern for systemic instability is warranted when the probability of
insolvency become significant for large proportion of country’s banking assets (i.e for
sum of all banks in the country); while the model is applied to the aggregate bank data to
1 See Lindgren, Garcia and Saal (1996)
4

determine the probability of systemic insolvency in the aggregate approach. In the third
approach, instead of looking at bank balance sheet data for internal sources of
unsoundness, it established systemic relationships between economy wide variables and
indicators of bank soundness. A number of macroeconomic variables are expected to
affect the banking system or reflect its condition. With the above background, an attempt
has been made in this paper to develop a model of EWS base on ordered probit approach
for monitoring and predicting banking distress or crisis in India2 using macroeconomic
indicators
The rest of the paper is organized as follows. Section 2, gives a brief description
about financial crisis and their associated features. Section 3, provides a review of the
literature on methodological development of early warning system for predicting crisis.
Section 4, describes the method of constructing monthly banking sector fragility index
for India. Section 5, deal with identification of some potential macroeconomic indicators
for predicting crisis. In section 6, we give a brief description on the methodology
developed for predicting banking crisis in India. While, section 7, describes the data and
its sources used in developing the EWS model. Section 8, present the empirical results of
the model and concluded the paper with summary of observations in section 9.
2. Definition and Features of Financial crisis
The term financial crisis is applied broadly to a variety of situations in which
some financial institutions or assets suddenly lose a large part of their value. In the 19th
and early 20th centuries, many financial crises were associated with banking panics, and
many recessions coincided with these panics. Other situations that are often called
financial crises include stock market crashes and the bursting of financial bubbles,
currency crises, and sovereign defaults3. Financial crises directly result in a loss of paper
wealth4; they do not directly result in changes in the real economy, however may
2 Indian has a well diversified financial system which is still dominated by bank intermediation. Commercial banks together with cooperative banks account for nearly 70 percent of the total assets of Indian financial institutions (RBI, 2009b). 3 See Laeven, Luc and Fabian Valencia (2008) 4 Paper wealth means wealth as measured by monetary value, as reflected in the price of assets – how much money one's assets could be sold for. Paper wealth is contrasted with real wealth, which refers to one's actual physical assets.
5

indirectly do so, notably if a recession or depression follows. A financial crisis is a
disturbance to financial markets that disrupts the market’s capacity to allocate capital –
financial intermediation and hence investments come to a halt (Richard Portes, 1998).
Financial crisis may be accompanied by some of the features, which are highlighted
below5:
i. A demand for reserve money so intense that the demand could not be satisfied for
all parties simultaneously in the short run.
ii. A liquidation of credit that has been builds up in a boom.
iii. A condition in which borrowers who in other situations were able to borrow
without difficulty become unable to borrow on any terms-a credit crunch or credit
market collapse.
iv. A forced sale of assets because liability structures are out of line with market-
determined asset values, causing further decline in asset values-the bursting of a
price “bubble’.
v. A sharp reduction in the value of banks’ assets resulting in the apparent or real
insolvency of many banks and accompanied by some bank collapses and possibly
some run.
All of the elements emphasized above could be present in a financial crisis and some may
be more important than the other in a given situation of the crisis.
3. Literature Review on Early Warning System for Financial crisis
The first method used in the development of EWS is the signal approach to
predict financial crisis, in particular currency crisis was the effort of the Kaminsky,
Lizondo and Reinhart (1998) who monitor the evolution of several indicators. If any of
the macro-financial variables of a specific country tends to exceed a given threshold
during the period preceding a crisis, then this is interpreted as a warning signal indicating
that a currency crisis in that specific country may take place within the following months.
The threshold is then adjusted to balance type I errors (that the model fails to predict
crises when they actually take place) and type II errors (that the model predicts crises
which do not occur). Kaminsky (1999) and Goldstein et al. (2000) base their prediction of 5 See Sundararajan and Balino, (1998)
6

a crisis occurring in a specific country by monitoring the evolution not only of a single
macro-indicator, but also on a composite leading indicator, which aggregates different
macro-variables, with weights given by inverse of the noise to signal ratio.
The alternative method in the EWS literature is to use limited dependent variable
regression models to estimate the probability of a currency crisis. The currency crisis
indicator is modeled as a zero-one variable, as in the signal approach, and the prediction
of the model is interpreted as the probability of a crisis. More specifically, in line with the
probit regression analysis put forward by Frenkel and Rose (1996), Berg et al. (1999) use
this model specification with the explanatory variables measured in percentile terms. The
study of Van Rijckeghem and Weder (2003) uses probit regression to examine the role of
a common lender channel in triggering crisis events. They rely on disaggregate data on
external debt produced by the Bank for International Settlements (BIS) to construct
measures of competition for fund in order to explore the role played by a common lender
channel.
Further, Fuertes and Kalotychou (2004) consider not only logit regression but also
a non parametric method based upon K-means clustering to predict crisis events. They
find that combinations of forecasts from the different methods generally outperform both
the individual and naive forecasts. The empirical analysis reveals that the best combining
scheme depends on the decision-makers preferences regarding the desired trade-off
between missed defaults and false alarms6.
There are also some studies which have constructed composite leading indicators
of currency crisis events using diffusion indices rather than the weighting scheme
suggested by Kaminsky (1999) and by Goldstein et al. (2000). The studies which rely
upon the construction of diffusion indices using principal component analysis fitted to a
large dataset. Mody and Taylor (2003) uses Kalman filter estimation of state space
models in order to extract a measure of regional vulnerability in a number of emerging
market countries, and, in order to produce in-sample prediction of the currency market
turbulence. Another diffusion index is the one constructed by Chauvet and Dong (2004)
who develops a factor model with Markov regime switching dynamics in order to
6 See also the study of Bussiere and Fratzscher (2002), on the issue of designing the features of
their EWS model according to the preferences and to the degree of risk-aversion of policymakers.
7

produce in-sample and out-of-sample prediction of nominal exchange rates in a number
of the East Asian countries.
4. Monthly Banking Sector Fragility Index for India.
For predicting financial crisis, period of the crisis needs to be identified and dated.
There are two commonly used approached for identifying the period of banking crisis
viz., event-based method and the index method. The event-based method of crisis
identification recognizes a systemic banking crisis only after the occurrence of certain
events like bank runs, closures, mergers, recapitalization and huge Non-Performing
Assets (Demirguc Kunt and Detragiache, 1998; Kaminsky and Reinhart, 1999; Caprio
and Klingibiel, 2003 and IMF, 1998). This method however has several limitations.
Identification of the crisis when it has becomes severe enough to trigger certain events
can lead to delayed recognition of a crisis (Hagen and Ho, 2003a). Moreover, there is also
certain amount of randomness inherent in the definitions. This method thus does not
identify the different degrees of crisis severity. Further the event-based method does not
clearly identify the beginning and end of a crisis. Finally, an event-based study which
usually uses annual data, label an entire year as crisis even though the crisis may have
occurred in just a few months of that year. However, the index method used for
identification of banking crisis which is built on the lines of Exchange Market Pressure
(EMP) index for dating currency crisis, has several advantages over the event-based
approach. The index method requires no apriori knowledge of events to identify a
banking crisis and there is thus a lower probability of recognizing a crisis too late. The
most attractive feature of the index method is that it is based on monthly time series
which implies more specific crisis timings. Recently some economists have developed
their own index approach to date banking crisis (Hawkins and Klau, 2000; Kibritciouglu,
2002; Hagen and Ho, 2003a, 2003b).
Thus to identify and date the experiences of different state of distress or crisis by
the Indian banking sector7, we adopt the index method developed in Kibritciouglu
(2002). According to Kibritciouglu (2002), a bank is potentially exposed to various types
of economic risks such as liquidity risk, credit risk and exchange rate risk due to change
7 In this paper, the banking sector means banking sector of a country excluding the Central Bank.
8

in the value of its asset and or liability in the financial markets. Therefore, a bank net
worth8 and hence a bank failure can be associated with excessive risk taking by the bank
managers. A slightly modified version of Kibritciouglu (2002) has been considered in
this study to recognize the dates during which the banking system in India has
experienced a distress/crisis situation. The monthly banking sector fragility index of India
was constructed by considering the risk taking behaviour of commercial banks in terms
of its liquidity risk, credit risk and interest rate risk9. The variables considered in the
construction of this index are aggregate time deposits, non-food credit, investment in
other approved and non-Statutory Liquidity Ratio (non-SLR) securities, foreign currency
assets and liabilities and the net reserves of Commercial Banks10 in India. The banking
fragility index is constructed by taking the weighted average of annual growth in real
time deposits (Dep), real non-food credits (Cred), real investments in approved and non-
SLR securities (Inv), real foreign currency assets (FCA) and liabilities (FCL) and the real
net reserves (Resv) of commercial banks and weights are the inverse of their standard
deviation. The constructed BSF index for India is defined as follows:
- - - - - Re - Re-1 6Re
Dep Cred Inv FCA FCL svt Dep t Cred t Inv t FCA t FCL t svBSFDep Cred Inv FCA FCL sv
Re Re2 5Re
Cred Inv FCA FCL svt Cred t Inv t FCA t FCL t svBSFCred Inv FCA FCL sv
8 The difference between the assets and liabilities of a bank equal its net worth, which in fact shows the bank’s remaining values or equity capital after it has met all of its liabilities. The bank’s net worth includes the capital contributed by the bank’s shareholders and accumulated profits from doing business as intermediary in financial markets.
9 Liquidity risk is the current and prospective risk to earnings or capital arising from a bank’s inability to meet its obligations when they come due without incurring unacceptable losses. Credit risk is defined as the possibility losses associated with diminution in the credit quality of borrowers or counterparties due to inability of customers or counterparty to meet obligation. While, the interest rate risk is the risk in which the changes in the market interest rate might adversely affect the bank financial condition.
10 According to Kibritciouglu (2002), bank failure is refer to a situation in which the excessively rising liquidity, credit, interest rate or exchange rate risk pushes the bank to suspend the internal convertibility of its liability.
9

where , , tDep tCred tInv , , and are the annual growth rate of real
deposits, real credit, real investment, real foreign currency assets and liabilities and real
reserves of Commercial Banks
tFCA tFCL Re tsv
11. The BSF-2 index has also been constructed to implies
and conclude that if the time path of both the indices moves in similar pattern, then the
domestic bank run has not played any prominent role during the fragile period of the
banking sector in India.
The dates of the crisis period are identified based on threshold level. When value of BSFs
is greater than 0, it is a no-crisis zone. However, when the value is below 0, it represents
fragile situation. Based on the threshold value , which is taken to be the standard
deviation12 of BSF index, medium and high fragility episodes are distinguished as
follows.
Medium Fragility (MF): 0BSF
High Fragility (HF): BSF
In this paper continuously alternating phases of medium and high fragility before the full
recovery from the distress situation is considered as a systemic banking crisis. Isolated
phases of MF not associated with HF do not constitute systemic banking crisis. A
banking system is considered to have fully recovered from crisis when the value of BSF
index is equal zero.
The constructed BSF indices for Indian are presented in Figure 1 with identified
dates of high fragility shown by the shaded region. From the figure, it is observed that the
movement patterns of both the indices (BSF-1 and BSF-2) are similar. Hence, we may
say that the bank run does not contribute much to the experience of distress condition in
the banking sector of India. This might have been due to coverage of deposit insurance13.
11 The real time series of deposits, credit, investment, foreign currency assets and liabilities and reserves are obtained by deflating the corresponding time series with Wholesale Price Index (Base: 1993-94). The annual growth rate (same month-month a year ago) has been taken to remove any seasonality variation and also to indicate that the difficulties in the banking sector are signal by longer term variation in the indicators and not by short term fluctuations.
12 In Kibritciouglu (2002), the threshold value is taken to be 0.5 for classifying medium and high fragility period. 13 The deposit insurance provided by the Deposit Insurance and Credit Guarantee Corporation (DICGC) provides a safety net for the depositors. Deposit insurance in India is mandatory for all banks (commercial/co-operative/RRBs/LABs) and covers all deposits (upto a limit of Rupees one
10

The threshold values considered for BSF-1 and BSF-2 index in identifying the dates of
distress/crisis in India are 0.43 and 0.39 respectively.
Figure 1: Banking Sector Fragility (BSF) index for India (Mar-00 to Nov-09. (The high fragile period is indicated by the shaded region.)
May, 01
Nov, 03
Jan, 08
Jul, 08-1.00
-0.50
0.00
0.50
1.00
1.50
Mar
-00
Sep-
00
Mar
-01
Sep-
01
Mar
-02
Sep-
02
Mar
-03
Sep-
03
Mar
-04
Sep-
04
Mar
-05
Sep-
05
Mar
-06
Sep-
06
Mar
-07
Sep-
07
Mar
-08
Sep-
08
Mar
-09
Sep-
09High Fragility BSF-1 BSF-2
Source: Author’s computation
The constructed BSF index reveals that the banking sector in India experiences 19 phases
of medium fragility and 8 phases of high fragility (including the recent global crisis
period) during the study period. The dates of medium and high fragility situation
experienced by the banking sector of India are presented in Table 1. Based on dates of
fragile period, we may classify the period March 2000 – October 2000, December 2001-
lakh), except those of foreign governments, Central/State Governments, inter-bank deposits, deposits received abroad and those specifically exempted by DICGC with the prior approval of the Reserve Bank (RBI, 2010).
11

June 2002, August 2002 – September 2004 and June 2008 – November 2008 as systemic
banking crisis.
Medium High Medium High------- Mar 00 - Jul 00Aug 00 Sep 00Oct 00 -------
Dec 01 - Jan 02 Feb 02Mar 02 - Apr 02 -------
Jun 02 ------- Jun 02 -------Aug 02 - Apr 03 May 03
Jun 03 Jul 03 - Feb 04Mar 04 - Apr 04 May 04 - Sep 04 Mar 04 - Apr 04 May 04 - Jul 04Oct 04 - Dec 04 ------- Aug 04 Sep 04
Mar 05 - May 05 ------- ------- -------
Jan 06 - Feb 06 ------- Jan 06 - Feb 06 -------Oct 06 ------- Oct 06 -------------- ------- Dec 06 -------------- ------- Apr 07 -------Mar 08 ------- Mar 08 -------Jun 08 July 08 - Oct 08 Jun 08 Jul 08 - Oct 08
Nov 08 ------- Nov 08 -------------- ------- Jan 09 -------------- ------- Sep 09 -------Nov 09 ------- Nov 09 -------
Sep 02 - Apr 03 May 03 - Feb 04
Table 1: Medium and high Fragile period in Indian Banking Sector
BSF-1 BSF-2
------- Mar 00 - Oct 00
Dec 01 - Apr 02 -------
Source: Author’s computation
5. Some Potential Macroeconomic Indicators for Predicting Banking Crisis in
India
In the early 1990s, banking system in India was saddled with huge NPAs, largely
due to the socially directed credit programs pursued by the government. Several measures
were initiated and asset qualities were largely improved in due course of time. Based on
the available literature and empirical evidence on financial crisis, some of the potential
indicators for predicting financial crisis are described as follows.
Based on the EWS framework of Kaminsky (1999), the first procedure of selecting useful
indicators applied in EWS is to identify economic symptoms which usually come to
12

surface prior to financial crisis. Past experiences in some of the crisis-hit economies show
that both banking and currency crises are linked to overborrowing cycles. In some cases,
the substantial credit growth could be fueled by financial liberalisation and elimination of
capital and financial account restrictions, which, however, are not quantifiable. The
mirroring indicators include M3 multiplier.
Banking and currency crises can be preceded by bank runs. As depositors
withdraws massively their deposits, the likelihood of bank default increases. The
phenomenon has a destabilising effect, and the mirroring indicator is bank deposits,
which correspondingly exhibit dramatic negative movements during bank panic. But as
indicated earlier, bank run does not have much contribution to the banking distress/ crisis
in India.
Current account problems are considered as one of the symptoms for financial
crisis. Those problems could be reflected in the performances of external trade, terms of
trade and real exchange rate. Real exchange rate overvaluation and a weak external sector
are potential factors for currency crisis. A loss of competitiveness and weak external
markets could lead to recession, business failure, and deterioration in loan quality.
Capital account problems become more severe in the context of enlarging foreign debt
and increasing capital flight, which raise concern for debt unsustainability. Vulnerability
of a country to external shocks is more likely to increase if foreign debt is dominantly
concentrated in short maturities. The selected indicators of this area include foreign
exchange reserves, ratio of M3 to foreign exchange reserves.
Reflecting the external positions of the banking sector, the ratio of foreign
currency assets to foreign currency liabilities could be applied in a EWS to highlights the
risk of currency mismatch in view of international exposure.
While considering the liquidity position of the banking sector, we may also
consider the ratio of banks credit to the commercial sector to aggregate deposits of
residents as it would depicts growth prospect of the corporate sector in the economy.
Severe slowdown in economic growth or recession as well as the burst of asset
price bubbles could precede financial crises. Kaminsky (1999) argues that high real
interest rates could be a sign of liquidity crunch, which leads to an economic slowdown
and banking fragility. The mirroring indicators included output, real domestic interest
rate, and stock prices.
13

Banking crises may be preceded by a wide range of economic problems. To design an
effective EWS and identify future banking crisis, a broad variety of macroeconomic
indicators representing different sectors of the economy may be chosen.
6. Description of Methodology
Based on the proxy series for crisis (BSF index) which identifies different phases
of banking sector distress in India, we use ordered probit model which is a limited
dependent variable model to predict these different phases of banking distress. In the
limited dependent variable models, the dependent variable is categorized as 0, 1 and 2
corresponding to banking distress/crisis situation of ‘no distress’, ‘medium fragility’ and
‘high fragility’ respectively in Indian banking sector. The explanatory variables are not
transformed into dummy variables but are included in a linear fashion. The probability
that crisis occurs is assumed to be a function of the vector of explanatory variables. The
model is based on the latent regression utility function *y x , where follows a
normal distribution and utility function *y is unobserved, but what is observed is their
classified category . The observed is determined by using y y *y which is provided as
follows
*1
*1 2
*2
0, y
1, <y
2, y
i f
y if
i f
where, 1 and 2 are the classifying thresholds values.
The ordered probit equation takes the form y x , with probabilities of classifying
different categories given as
1
2 1
2
Pr( 0 | , ) (( ))
Pr( 1| , ) (( )) ( )
Pr( 2 | , ) 1 ( )
y x F x
y x F x F x
y x F x
where, is the crisis dummy series, y x a set of explanatory variables, is a vector of free
parameters to be estimated and is the normal cumulative distribution function which
ensures that the predicted outcome of the model always lies between 0 and 1. The z-
statistics reveal the significance of the estimated individual coefficients in the model by
testing the null hypothesis
F
0H : i 0 , that is i the estimated coefficient of the
14

ith variable is zero. If is rejected as a result of the z-statistic, we conclude that the
variable affects the crisis dummy significantly.
0H
The direction of the effect of a change in jx depends on the sign of the
j coefficient. The coefficients estimated by these models cannot be interpreted as the
marginal effect of the independent variable on the dependent variable as j is weighted
by the factor f i.e.normal density function, that depends on all the regressors. However, a
fair amount of interpretation can be readily provided to assess the effect of explanatory
variables on the probability of getting the specified state of crisis by considering the
marginal effect which is defined as
Pr
Pr
Pr
1
2 1
2
( 0 / ) ( )
( 1/ ) ( ) ( )
( 2 / ) )
y x x f x
y x x f x f x
y x x f x(
Thus the sign of j shows the direction of the change in the probability of falling in the
lowest endpoint ranking i.e Pr( 0)y , when jx changes. Pr( 0)y changes in the opposite
direction of the sign of j ; while Pr( 2y ) changes in the same direction as that of the
sign of j . Hence a positive coefficient in the model may be interpreted that the
corresponding variable has potential in raising the predictive probability of high fragility
i.e. . Pr( 2)y
There are several diagnostic tests for order probit models; one of the measures of
goodness-of-fit for non-linear estimators is the Pseudo- 2R statistic which is defined as,
Pseudo- 2
0
log1
lo
g
LR
L
where is the average of the Log-Likelihood(LL) function without any restriction
and represents the maximized value of LL function under the restricted case that
all the slope coefficients except the intercept are restricted to 0. Value of Pseudo
log L
0g Llo
2R always lies between 0 and 1.
The Likelihood Ratio (LR) statistic is used to test the joint null hypothesis of all the
coefficients except the intercept is 0, i.e. 0 1 2: 0iH
02(log logL L )LR
15
This statistic used is to test the overall significance of the model. Under null hypothesis,
LR statistic is asymptotically distributed as a 2 variable with degree of freedom equal to
the number of restrictions under test.
7. Description of Data and Sources
Since Indian financial system is dominated by banking sector and commercial
banks accounts for more than 90 percent of the banking system’s assets, we have
constructed BSF index to date the experienced of distress/crisis in banking sector using
the monthly data related to commercial banks in India. The variables considered for
constructing the BSF index are time deposits of resident, Non-Food credit, Investment of
banks in approved and non-SLR securities, Foreign currency assets and liability (which
include non-resident foreign currency repatriable fixed deposits and overseas foreign
currency borrowings) and net bank reserves (which includes balances with RBI, Cash in
hand, loans and advances from the bank) of commercial banks. These variables are
deflated by WPI index (base year 1993-94). While the indicators used for predicting the
banking sector distress/crisis in India covered real sector, financial and banking sector
and external sector of India. The variables considered are yield on 91 days treasury bills,
weighted average call money rate, stock price index, aggregate deposits of resident,
banks credit to commercial sector, M3-money supply, reserve money, foreign exchange
reserves, export, import, real effective exchange rate, inflation and output (measured by
IIP-Base year 1993-94). These indicators used in this study were based on the availability
of their data during the period March 1999 to November 2009 at monthly frequency. All
these data are taken from the ‘Handbook of Statistics on Indian Economy’ and various
issues of Reserve Bank of India, Monthly Bulletin (i.e. September 2009, October 2009,
November 2009, December 2009, January 2010 and February 2010 issues of Monthly
Bulletin).
8. Empirical Results
The indicators are transformed so that they are stationary and free from seasonal
effects. Except for interest rates, deviation of REER from trend14; all other variables on a
given month was defined as the percentage change in the level of the variable with
14 The deviation of REER from its trend was estimated using Hodrick-Prescott filter.
16

respect to its value a year earlier. The probabilities estimated by ordered probit model can
give a fair idea about the possible onset of different phases of distress situation (including
both the phases of high and medium fragility condition) in the banking system. An
increasing trend in the estimated probabilities of each categories/state of the distress
condition, signals the possibility of distress/crisis in the banking sector.
The time horizon within which the indicator is expected to give signal anticipating
a banking sector distress or crisis situation is called the ‘signaling horizon’ and is taken
apriori as 6 months in this study considering the policy prospect of 6 months ahead
forecast.
Based on available data at monthly frequency, an ordered probit model is being
developed to predict the different phases of banking sector distress/crisis in India within
the time horizon of 6 months. The optimum model is obtained after an exploration
through the model goodness of fit criteria viz., Akaike information Criterion (AIC)15 and
Pseudo- 2R statistic, where the optimum model is chosen with minimum AIC and
maximum Pseudo- 2R statistic. The optimum model with significant coefficients at 5 per
cent level of significance is obtained at AIC and Pseudo- 2R value of 0.64 and 0.87
respectively. The estimated ordered probit model of the leading indicators with their lags
is presented in Table 2. All the indicators except the REER deviation are found to be
significant at 5 per cent level of significance. From the model, it is seen that increased in
the ratio of foreign currency asset to foreign currency liability (FCA-FCL ratio), import,
M3-multiplier, call money rate, real interest rate (91 days treasury bill), rise in stock price
index and inflation increases the probability of high fragility in the banking sector; while
decreased in ratio of money supply (M3) to forex reserve, output, export, forex and ratio
between credit to commercial sector and domestic deposits, also increases the probability
of high fragility in the banking sector.
15 The AIC is given by 2 2l kA IC T T , where l is the log-likelihood function with k
parameters estimated using T observations.
17

Table 2 : Estimated Ordered probit Model for Predicting Banking Crisis in India (6 month signal window)16
Variable Coefficient Std. Error Z-Statistic Prob.
FOREX RESERVES -2.22 0.98 -2.26 0.0237FOREX RESERVES(-5) 3.47 1.55 2.24 0.0249FCA/FCL RATIO(-6) 57.31 25.78 2.22 0.0262EXPORT(-2) -0.47 0.22 -2.08 0.0373EXPORT(-4) -0.27 0.11 -2.39 0.0170IMPORT(-4) 0.15 0.07 2.30 0.0213M3/FOREX RESERVE RATIO -32.00 14.34 -2.23 0.0256M3-MULTIPLIER 62.83 29.09 2.16 0.0307M3-MULTIPLIER(-1) 15.36 7.26 2.12 0.0344CREDIT/DEPOSIT RATIO17 -1404.54 617.70 -2.27 0.0230CREDIT/DEPOSIT RATIO(-2) 711.55 312.14 2.28 0.0226OUTPUT(-2) -4.10 1.71 -2.40 0.0164CALL MONEY RATE 10.23 4.58 2.23 0.0255CALL MONEY RATE(-1) 2.58 1.31 1.97 0.0484REAL YIELD 91TB(-1) 14.73 6.71 2.20 0.0280STOCK PRICE INDEX 0.38 0.17 2.16 0.0306STOCK PRICE INDEX (-1) 0.20 0.09 2.22 0.0263INFLATION 11.91 5.35 2.23 0.0260INFLATION(-5) -5.51 2.38 -2.31 0.0207
Limit Points
LIMIT-1( 1 ) -139.73 LIMIT-2( 2 ) -104.73
Pseudo R-squared 0.87 Akaike info. criterion 0.64 LR statistic 190.25 Prob (LR statistic) 0.0000
Source: Author’s Computation
It is observed that model predicted about 104 data point of different categories of banking
crisis out of the total 111 data point series. The model could correctly predicts about 97
percent of no distress situation, 90 percent of medium fragility and about 89 percent of
16 The deviation of REER from its trend is found to be insignificant at 5 per cent level of significance and hence it is not included in the estimated model. 17 The credit and deposits are respectively the credit to commercial sector by banks and aggregate deposits of resident in India.
18

high fragility condition of the Indian banking sector. The overall predictive power of the
model in classifying the different state of the crisis viz., no distress, medium and high
fragility in India is about 94 percent. The predictive performance of the model in
classifying different phases of the crisis is presented in Table 3.
Table 3: Prediction Performance of Ordered Probit Model
Dep. Value Obs. Correct Incorrect % Correct % Incorrect
0 61 59 2 96.72 3.28 1 31 28 3 90.32 9.68 2 19 17 2 89.47 10.53
Total 111 104 7 93.69 6.31
Source: Author’s computation
One of the significant aspects of the proposed model is that it could also predict the
recent global financial crisis prior to 6 months quite accurately. The probabilities of 6
months ahead in-sample prediction of different phases of banking sector crisis by the
model is presented in Figure 2. From the figures, it can be observed that the model has
been able to forecast the probability of various phases of banking crisis quite accurately.
It is also seen that during the period of medium and high fragility condition in the
banking sector, the probability of no distress during the period forecasted by the model is
very low. Similarly, during non fragile period, the forecasted probabilities of fragile state
are found to be reasonably quite low.
19
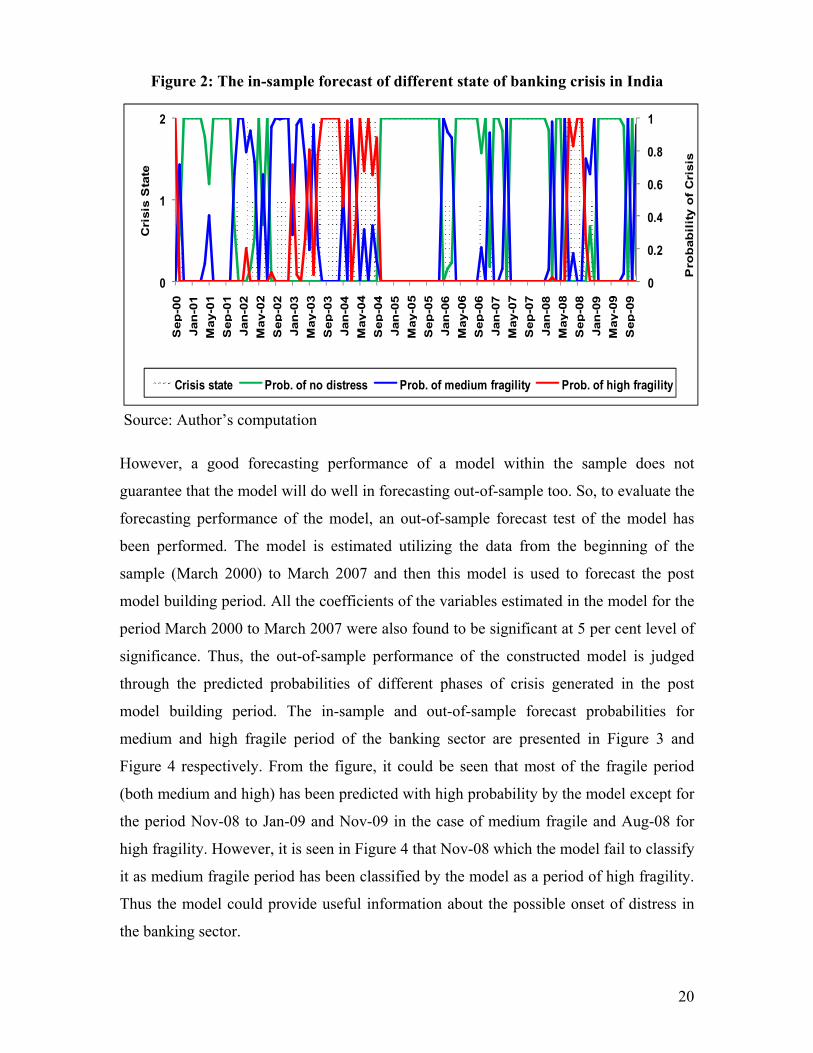
Figure 2: The in-sample forecast of different state of banking crisis in India
0
0.2
0.4
0.6
0.8
1
0
1
2
Sep
-00
Jan
-01
May
-01
Sep
-01
Jan
-02
Ma y
-02
Sep
-02
Jan
-03
Ma y
-03
Sep
-03
Jan
-04
May
-04
Se p
-04
Jan
-05
Ma y
-05
Se p
-05
Jan
-06
Ma y
-06
Se p
-06
Jan
-07
Ma y
-07
Sep
-07
Jan
-08
Ma y
-08
Se p
-08
Jan
-09
May
-09
Sep
-09
Pro
bab
ilit
y o
f C
risi
s
Cri
sis
Sta
te
Crisis state Prob. of no distress Prob. of medium fragility Prob. of high fragility
Source: Author’s computation
However, a good forecasting performance of a model within the sample does not
guarantee that the model will do well in forecasting out-of-sample too. So, to evaluate the
forecasting performance of the model, an out-of-sample forecast test of the model has
been performed. The model is estimated utilizing the data from the beginning of the
sample (March 2000) to March 2007 and then this model is used to forecast the post
model building period. All the coefficients of the variables estimated in the model for the
period March 2000 to March 2007 were also found to be significant at 5 per cent level of
significance. Thus, the out-of-sample performance of the constructed model is judged
through the predicted probabilities of different phases of crisis generated in the post
model building period. The in-sample and out-of-sample forecast probabilities for
medium and high fragile period of the banking sector are presented in Figure 3 and
Figure 4 respectively. From the figure, it could be seen that most of the fragile period
(both medium and high) has been predicted with high probability by the model except for
the period Nov-08 to Jan-09 and Nov-09 in the case of medium fragile and Aug-08 for
high fragility. However, it is seen in Figure 4 that Nov-08 which the model fail to classify
it as medium fragile period has been classified by the model as a period of high fragility.
Thus the model could provide useful information about the possible onset of distress in
the banking sector.
20

Figure 3: In-sample and out-of-sample probabilities of medium fragility
0
0.2
0.4
0.6
0.8
1
Mar
-07
May
-07
Jul-0
7
Sep-
07
Nov
-07
Jan-
08
Mar
-08
May
-08
Jul-0
8
Sep-
08
Nov
-08
Jan-
09
Mar
-09
May
-09
Jul-0
9
Sep-
09
Nov
-09
Prob
abili
ty o
f med
ium
frag
ility
Medium fragility in-sample out-of-sample
Source: Author’s computation
Figure 4: In-sample and out-of-sample probabilities of high fragility
0
0.2
0.4
0.6
0.8
1
Mar
-07
May
-07
Jul-
07
Sep-
07
Nov
-07
Jan-
08
Mar
-08
May
-08
Jul-
08
Sep-
08
Nov
-08
Jan-
09
Mar
-09
May
-09
Jul-
09
Sep-
09
Nov
-09
Prob
abili
ty o
f hig
h fr
agili
ty
High fragility in-sample out-of-sample
Source: Author’s computation
21

9. Conclusions
In the face of the recent global financial crisis, monitoring and predicting of such event
using the early warning system has become essential as it causes huge loss both at
national and international level. The early warning system (EWS) aim at anticipating
whether and when individual country may be affected by a financial crisis by developing
a framework that allows predicting financial crisis in relatively open economy.
In order to identify and date the different state of distress situation in the banking
sector of India, a banking sector fragility index (BSF) has been developed. Based on BSF
index, we have identified and dated 19 medium and 8 high fragility situations in the
Indian banking sector. These phases of distress in the banking sector are identified based
on some chosen threshold level and are categorized into three state as no distress,
medium and high fragility. The ordered probit model is being developed and is used to
predict these different phases of banking crisis in India. The signaling window for
predicting the crisis is taken to be 6 months in this study. This model would help the
policy maker to take corrective action to avert the onset of a potential distress/crisis by
generating signals about an impending distress/crisis situation. The model indicate that
increased in the ratio of foreign currency asset-foreign currency liability (FCA-FCL
ratio), import, M3-multiplier, call money rate, real interest rate (91 days treasury bill),
rise in stock price index , high inflation raises the probability of high fragility in the
banking sector; while decreased in M3-forex reserve ratio, output, export, forex and the
ratio between credit to commercial sector and domestic deposits also increases the
probability of occurring high fragility in the banking sector.
The model could predict about 104 data point of different categories of banking
crisis out of the total 111 data point series. The model could correctly predicts about 97
percent of no distress situation, 90 percent of medium fragility and about 89 percent of
high fragility condition in the Indian banking sector. Thus the model could classify about
94 per cent of different phases of the fragile periods. The model developed in this study
also captured the effect recent global financial crisis felt in India. The proposed model
could be used to monitor the development in the banking sector of India as indicators
used is this model are available with lags of about two months. While calibrating the
22

model, it is also observed that the ordered probit model could generate reliable
probabilities of out-of-sample for different phases of fragile condition in India.
In this paper banking crisis prediction is based on BSF index. However, newer
crisis may emerge from newer characteristics. Thus the proposed early warning model
has to be updated continuously as the global and domestic macroeconomic conditions are
dynamic and keep changing. The EWS devised in this paper to forecast different phases
banking distress/crises in India is just a preliminary step in the direction of exploring
alternative methods on predicting banking crisis.
23

References:
Allen F and Gale D (2007), “Understanding Financial Crises”, Oxford University
Press, 2007
Anastasia N (2007), “Fragile Finance: Debt Speculation and Crisis in the age of Global
credit”, Pelgrave Macmillan Publication, 2007.
Arestis Philip and Murray Glickman (2002), “Financial Crisis in Southeast Asia:
Dispelling Illusion the Minskyan Way”, Cambridge Journal of Economics, Vol. 26, No. 2,
pp. 237-260.
Berg Andrew and Catherine Patillo (1999), “Are Currency Crises Predictable? A Test”,
IMF Staff Papers, Volume 46, No. 2.
Bussiere Matthieu and Fratzscher Marcel (2002), “Towards a new early warning
system of financial crises”, Working Paper Series 145, European Central Bank.
Caprio Gerard and Daniela Klingibiel (2003), “Episodes of Systemic and Borderline
Financial Crises” World Bank, January 2003.
Chauvet Marcelle and Dong Fang (2004), “Leading indicators of country risk and
currency crises: the Asian experience”, Economic Review, Federal Reserve Bank of
Atlanta, issue Q 1, pages 25 - 37.
Demirguc-Kunt Asli and Enrica Detragiache (1998), “The Determinants of Banking
Crises in Developing and Developed Countries”, IMF Staff Papers, Volume 45, No. 1.
Demirguc-Kunt Asli and Enrica Detragiache (2000), “Monitoring Banking Sector
Fragility: a Multivariate Logit Approach”, World Bank Economic Review, Oxford
University Press, 14(2), 287–307.
Duttagupta Rupa and Paul Cashin (2008), “The Anatomy of Banking Crisis”, IMF
Working Paper, No. 93
24

Frankel, Jeffrey and Andrew Rose (1996), “Currency Crashes in Emerging Markets: An
Empirical Treatment”, International Finance Discussion Papers, No. 534, Board of
Governors of the Federal Reserve System.
Fuertes Ana-Maria and Kalotychou Elena (2004), “Elements in the Design of an Early
Warning System for Sovereign Default”, Computing in Economics and Finance 2004
231, Society for Computational Economics.
Fuertes Ana-Maria and Kalotychou Elena (2006), “Early warning systems for
sovereign debt crises: The role of heterogeneity”, Computational Statistics & Data
Analysis, Elsevier, vol. 51(2), pages 1420-1441, November.
Gavin Michael and Ricardo Hausman (1996), “The Roots of Banking Crises: The
Macroeconomic Context”, in Banking Crises in Latin America, Washington, DC: Inter-
American Development Bank, 27-63.
Glick Reuven and Michael M. Hutchinson ( 2001), “Banking and Currency Crises:
How Common are Twins” in Glick Reuven, Ramon Moreno and Mark M. Spiegel (eds)
Financial Crises in Emerging Markets, 467 pages, Cambridge University Press,
Cambridge
Goldstein M, Graciela Laura Kaminsky and Carmen M. Reinhart (2000), “Assessing
Financial Vulnerability: An Early Warning System for Emerging Markets”, 134 pages,
Published by Peterson Institute, 2000.
Hagen Jurgen von and Tai–Kuang Ho (2003a), “Twin Crises: A Re-examination of
Empirical Links”, Presented at the 6th Annual Conference on Global Economic Analysis,
The Hague, The Netherlands.
Hagen Jurgen von and Tai–Kuang Ho (2003b), “Money Market Pressure and the
Determinants of Banking Crisis”,1-35,
Hardy Daniel C and Ceyla Pazarbasioglu (1999), “ Determinants and Leading
Indicators of Banking Crises : Further Evidence .Washington DC , IMF Staff Papers,
Volume 46, No. 3, 1- 12
25

Hawkins John and M Klau (2000), “Measuring Potential Vulnerabilities in Emerging
Market Economies” BIS Working Papers, No. 91, October, 1-46
International Monetary Fund (IMF) (1998), “Financial Crises: Characteristics and
Indicators of Vulnerability”, World Economic Outlook, Chapter IV, 74-97,
Kaminsky Graciela, Saul Lizondo and Carmen Reinhart (1998), "Leading Indicators of
Currency Crises," International Monetary Fund Staff Papers, 45(1), 1-48.
Kaminsky Graciela L and Carmen M. Reinhart (1999), “The Twin Crises: The Causes
of Banking and Balance-of-Payments Problems”, American Economic Review 89 (3),
473-500
Kaminsky Graciela L (1999), “Currency and Banking Crises: The Early Warnings of
Distress”, IMF Working Paper, 99/178, 1-38
Kibritciouglu Aykut (2002), “Excessive Risk–Taking, Banking Sector Fragility and
Banking Crises” Unmiversity of Illinois at Urbana Champaign, Research Working Paper
No. 62-0114, 1-48
Laeven, Luc and Fabian Valencia (2008), “Systemic Banking Crises: a New Database”,
1-78, IMF Working Paper No. 08/224
Lindgran C. J, Garcia G and M. I. Saal (1996), “Bank Soundness and Macroeconomic
Policy”, International Monetary Fund (IMF) publication, 1996.
Mody Ashoka and Taylor Mark P (2003), “Common Vulnerabilities”, Centre for
Economic Policy Research (CEPR) Discussion Papers 3759.
Richard Portes (1998), “An Analysis of Financial Crisis: Lessons for the International
Financial System”, IMF Conference Chicago, 8-10 October 1998.
Reserve Bank of India (RBI) (2007), “Manual on Financial and Banking Statistics”,
March 2007.
Reserve Bank of India (RBI) (2009a), “Annual Policy Statement for the Year 2009-10”,
Reserve Bank of India, Monthly Bulletin, May 2009.
26

27
Reserve Bank of India (RBI) (2009b), “Report on Trend and Progress of banking in
India 2008-09”, October 2009.
Reserve Bank of India (RBI) (2010), “Financial Stability Report”, March 2010.
Subbarao Divyuri (2009a), “Mitigating Spillovers and Contagion: Lessons from the
Global Financial Crisis”, Reserve Bank of India, Monthly Bulletin, January 2009.
Subbarao Divyuri (2009b), “Impact of the Global Financial Crisis on India Collateral
Damage and Response”, Reserve Bank of India, Monthly Bulletin, March 2009.
Sundararajan V and Tomas J.T. Balino (1998), “Banking Crises: Cases and Issues”
International Monetary Fund (IMF) publication.
Van Rijckeghem, Caroline and Beatrice Weder (1999), “Sources of Contagion: Finance
or Trade?” International Monetary Fund Working Paper No. 146.