probing the stochastic, motor-driven properties of … · probing the stochastic, motor-driven...
TRANSCRIPT

Probing the Stochastic, Motor-DrivenProperties of the Cytoplasm UsingForce SpectrumMicroscopyMing Guo,1 Allen J. Ehrlicher,1,2,8 Mikkel H. Jensen,1,3 Malte Renz,4 Jeffrey R. Moore,3 Robert D. Goldman,5
Jennifer Lippincott-Schwartz,4 Frederick C. Mackintosh,6 and David A. Weitz1,7,*1School of Engineering and Applied Sciences, Harvard University, Cambridge, MA 02138, USA2Beth Israel Deaconess Medical Center, Boston, MA 02115, USA3Department of Physiology and Biophysics, Boston University, Boston, MA 02118, USA4Eunice Kennedy Shriver National Institute of Child Health and Human Development, National Institutes of Health, Bethesda, MD 20892, USA5Department of Cell and Molecular Biology, Northwestern University Feinberg School of Medicine, Chicago, IL 60611, USA6Department of Physics and Astronomy, VU University, 1081 HV Amsterdam, The Netherlands7Department of Physics, Harvard University, Cambridge, MA 02138, USA8Present address: Department of Bioengineering, McGill University, Montreal, H3A 0C3 Canada
*Correspondence: [email protected]
http://dx.doi.org/10.1016/j.cell.2014.06.051
SUMMARY
Molecular motors in cells typically produce highlydirected motion; however, the aggregate, incoherenteffect of all active processes also creates randomlyfluctuating forces, which drive diffusive-like, non-thermal motion. Here, we introduce force-spec-trum-microscopy (FSM) to directly quantify randomforces within the cytoplasm of cells and therebyprobe stochastic motor activity. This technique com-bines measurements of the random motion of probeparticles with independent micromechanical mea-surements of the cytoplasm to quantify the spectrumof force fluctuations. Using FSM, we show thatforce fluctuations substantially enhance intracellularmovement of small and large components. The fluc-tuations are three times larger in malignant cells thanin their benign counterparts. We further demonstratethat vimentin acts globally to anchor organellesagainst randomly fluctuating forces in the cytoplasm,with no effect on their magnitude. Thus, FSM hasbroad applications for understanding the cytoplasmand its intracellular processes in relation to cell phys-iology in healthy and diseased states.
INTRODUCTION
The cytoplasm of living cells is not a static environment but is
instead subjected to a wide variety of forces (Howard, 2001).
For example, molecular motors such as kinesin and dynein
generate forces that directionally transport cargo along micro-
tubule tracks, while myosin II motors actively contract actin fil-
aments (Vale, 2003). These active processes all have clearly
established functions in the cell, and their individual forces
have been precisely quantified (Svoboda and Block, 1994;
822 Cell 158, 822–832, August 14, 2014 ª2014 Elsevier Inc.
Vale, 2003). Collectively, these forces have important conse-
quences in the cytoplasm: several motors operating coher-
ently can generate large forces for directional transport
(Hendricks et al., 2012; Rai et al., 2013). On an even larger
scale, the cooperative activity of a large number of motors
and other active processes collectively drive critical functions
at the level of the whole cell, such as division, migration, and
contraction (Doyle and Yamada, 2010; Dufrene et al., 2011;
Grashoff et al., 2010; Gundersen and Worman, 2013; Heisen-
berg and Bellaıche, 2013). However, the aggregate effect of
all the motors and active processes also contribute an inco-
herent background of fluctuating forces, and the ensemble
aggregate of the forces from the incoherent effects of all
cellular activities is directly associated with the functional effi-
ciency and the overall metabolic state of the cell (Doyle and
Yamada, 2010). In the cytoplasm, these fluctuating forces
can give rise, for instance, to random motion of vesicles, mito-
chondria, and signaling proteins (Ananthanarayanan et al.,
2013; Brangwynne et al., 2008a; del Alamo et al., 2008; Ham-
mar et al., 2012; Han et al., 1999; Jaqaman et al., 2011;
Kyoung and Sheets, 2008) and may drive an even broader
range of intracellular dynamics.
Because the motion that arises from fluctuating forces in the
cytoplasm is random, little previous effort has been made to
quantify these forces. Indeed, many researchers have inter-
preted random cytoplasmic motion as arising primarily from
thermally-induced diffusion, not recognizing the role of overall,
aggregate forces. The ensemble forces from overall cellular ac-
tivity are likely to have a large effect on overall motion within the
cytoplasm and would change as the biochemical processes
giving rise to these forces are altered during different cell condi-
tions. These forces could thus be a critical readout of the dy-
namic state of the cell. Because of this, we sought out a direct
way to measure aggregate forces within the cytoplasm, aiming
to devise methodology for quantifying these forces and testing
how they impact different cell states and control motion of cyto-
plasmic components.

A B
C
Figure 1. Movements of Microinjected
Tracer Particles in Living Cells
(A) Bright-field image of anA7 cellwithmicroinjected
200-nm-diameter fluorescence particles (green) and
2min trajectories (black) superimposedontop.PEG-
coated particles are microinjected into cells grown
on collagen-I-coated, glass-bottom dishes. Particle
trajectories in the cytoplasm look very similar to
thermal Brownian motion. Scale bar, 5 mm.
(B) Two-dimensional ensemble-averaged mean-
square displacement (MSD) < Dr2(t) > of PEG-
coated tracer particles of various sizes are plotted
against lag time on a log-log scale, in living A7
cells. Red, green, and blue symbols and lines
represent particles that are 100, 200, and 500 nm
in diameter, respectively. Dashed lines indicate a
logarithmic slope of 1. Measurements are done
with more than 200 tracer particles in about 25
individual cells for each particle size.
(C) Ensemble-averaged MSD scaled with particle
diameter, in untreated (solid symbols), blebbistatin
treated (open symbols), and ATP-depleted (solid
lines) A7 cells.
See also Figure S1 and Movie S1.
Toward this end, we introduce force spectrum microscopy
(FSM), an approach that probes the frequency dependence of
the aggregate, incoherent cytoplasmic forces within a cell. To
accomplish this, we combine independent measurements of
the intracellular fluctuating movement of injected particles with
measurements of the mechanics of the cytoplasm performed
with active microrheology using laser tweezers. With these
measurements, we determine the temporal spectrum of the
ensemble of the random, fluctuating forces, demonstrating that
this ubiquitous fluctuating motion in cells is not thermally
induced, but is instead a consequence of random forces. We
then exploit FSM to probe the intracellular micromechanical
behavior of malignant and benign cells, and show that cancer
cells exhibit a significantly enhanced level of forces, albeit with
the same frequency dependence, as predicted by our model.
Moreover, we show that these active forces strongly dominate
thermal Brownian forces in the cellular interior, impacting motion
of objects from nanometers to microns in scale, and providing a
fundamental mechanism for transport of objects of all scales.
Thus, FSM is a valuable new tool for characterizing the dynamic
state of a cell.
RESULTS
Random Intracellular Movement Appears DiffusiveTomeasure the fluctuatingmotion in the cytoplasm of eukaryotic
cells, wemicroinjected submicron colloidal particles into A7mel-
anoma cells (Cunningham et al., 1992) and measured their time-
dependent motion with confocal microscopy. The particles were
rendered inert by attaching a short polyethylene-glycol (PEG)
brush layer to their surface to eliminate interactions with biopoly-
mers or proteins (Valentine et al., 2004). Moreover, because they
were microinjected, the particles were not surrounded by a lipid
membrane. Unlike smaller tracers that travel freely through the
cytoskeletal network, the injected submicron particles were
larger than the typical cytoskeletal mesh size, which is about
50 nm (Luby-Phelps, 2000; Luby-Phelps et al., 1987). Thus, their
motion reflects the fluctuations of the cytoplasm itself. To avoid
cell-boundary effects, we imaged particles that are greater than
�1 mm deep within the cell; we also imaged particles away from
both the thin lamellar region and the nucleus to avoid any inter-
actions with the mechanically distinct cell cortex and nucleus
(Extended Results). Particle centers were determined in each im-
age with an accuracy of 22 nm. We tracked their trajectories and
calculated the time- and ensemble-averaged mean-square
displacement (MSD), < Dr2(t) >, where Dr(t) = r(t+t)-r(t).
At shorter timescales (t % 0.1 s), the MSD of the probe parti-
cles was nearly constant in time; however, the fluctuations
were always at least five times larger than the noise floor. At
longer timescales (t R 0.1 s), the MSD increased approximately
linearly with time, as shown in Figure 1 and Figure S1, available
online. Particles of different size, d, exhibited a similar time
dependence, as shown in Figure 1B. Moreover, the amplitude
of the fluctuations scaled as 1/d, as shown in Figure 1C; this is
consistent with motion in the continuum viscoelastic environ-
ment of the cytoplasm (Hoffman et al., 2006). Such motion is
often interpreted as thermal Brownian motion (Baker et al.,
2010; del Alamo et al., 2008; Gupton et al., 2005; Hale et al.,
2009; Wu et al., 2012; Yamada et al., 2000). However, a MSD
that increases linearly with time is only consistent with Brownian
motion in a purely viscous liquid and at thermal equilibrium,
neither of which applies to the cytoplasm (Brangwynne et al.,
2008a; Bursac et al., 2005; Hoffman et al., 2006; MacKintosh,
2012; Wilhelm, 2008). As the cytoplasm is neither a pure viscous
liquid or at thermal equilibrium, we concluded that the observed
cytoplasmic fluctuations must derive from some other sources
other than thermal-based diffusion.
Cytoplasmic Diffusive-like Movement Results fromActive ProcessesTo clarify the active character of the cytoplasmic fluctuating
motion, we examined the effect of inhibiting myosin II activity
Cell 158, 822–832, August 14, 2014 ª2014 Elsevier Inc. 823

A C
B optical trap positiontrapped bead position
300200100
0-100-200
0 1 2Time (sec)
3 4
Trap
and
bea
ddi
spla
cem
ents
(nm
)
100
101
Sprin
gCo
nsta
ntK
(Paµm
)
10-1 100 101 102
Frequency (Hz)
K'K'' K' K''
Figure 2. Optical-Tweezer Active Micro-
rheology Measurement Shows that the
Cytoplasm Is a Weak Elastic Gel
(A) Schematic showing the experimental setup
used to measure the intracellular mechanics.
(B) Typical displacements of the trapped bead and
the optical trap oscillating at 1 Hz.
(C) Effective spring constant K0 of the intracellular
environment measured directly with active micro-
rheology using optical tweezers shows that the
intracellular elastic stiffness (solid symbols) domi-
natesover thedissipative resistance (opensymbols).
Blue circles, gray squares, and light gray triangles
represent untreated, 10 mM blebbistatin-treated,
and ATP-depleted A7, respectively. Both the
blebbistatin treatment and ATP depletion reduce
the cytoplasmic stiffness by about 2-fold. Error
bars represent standard deviation (n = 15). The
corresponding shear moduli of the cytoplasm are
shown in Figure S2. See also Figures S2 and S3A.
in cells. Myosin II is a nonprocessive motor protein that binds to
actin filaments and undergoes a power stroke upon ATP hydro-
lysis (Howard, 2001). We treated cells with 10 mM blebbistatin,
which inhibits myosin II motor activity. After inhibition, we
observed a marked decrease in the MSD of injected particles
in the diffusive-like regime (tR 0.1 s), while the shorter timescale
movement remained essentially unchanged. When we inhibited
general motor and polymerization activity by depleting cells of
ATP using 2 mM sodium azide and 10 mM 2-deoxyglucose,
theMSD became nearly time independent over our experimental
timescales (Figure 1C; Figure S1A; Movie S1). Thus, the motion
of the particles is driven by active, ATP-dependent processes.
Such active behavior is not limited to the cytoplasm or to eukary-
otic cells; ATP-dependent random fluctuating motion has
also been observed in prokaryotic cells and yeast (Parry et al.,
2014; Weber et al., 2012).
To account for this active behavior, we adapted recent theo-
retical work suggesting that diffusive motion in the cytoskeleton
can arise from random motor activity (Lau et al., 2003; MacKin-
tosh and Levine, 2008): In a filamentous actin network, acto-
myosin contractile forces exerted by myosin II motors can drive
fluctuating deformations. These myosin motors do not act indi-
vidually but form aggregates, or minifilaments, which bind
to the actin network and act as ‘‘disordered muscle fibers,’’
applying random contractile forces in the network (Koenderink
et al., 2009). These forces can result in random fluctuations of
the network, similar to that observed in reconstituted networks
(Brangwynne et al., 2008b; Mizuno et al., 2009; Mizuno et al.,
2007). However, the theoretical framework of actively driven
fluctuations requires a network to be nearly elastic, rather than
viscous, to account for the diffusive-like motion observed for t
R 0.1 s. Thus, a direct measure of the intracellular mechanics
is essential to ascertain whether the observed particle motion
is due to thermal or active effects (MacKintosh, 2012).
The Cytoplasm Is a Weak Elastic SolidTo directly measure the micromechanical properties of the cyto-
plasm, we performed active microrheology measurements using
optical tweezers to impose a sinusoidal oscillation as a function
824 Cell 158, 822–832, August 14, 2014 ª2014 Elsevier Inc.
of frequency, y, on a 500-nm-diameter probe particle within a
cell. The trap stiffness was 0.05 pN/nm as determined using
the equipartition theorem to describe Brownian motion of a
bead trapped in water (Veigel et al., 1998). By measuring the
resultant displacement of the bead, x(y), subjected to an applied
sinusoidal trap oscillation with a force F at frequency y, we ex-
tracted the effective spring constant, K(y) = F(y)/x(y), for the intra-
cellular environment (Guo et al., 2013; Mizuno et al., 2007). The
complex shear modulus G = G’+iG’’ is related to the spring con-
stant through a generalization of the Stokes relation K = 3pGd.
Thus, we can determine the full frequency-dependent modulus
of the cytoplasm.
Our active measurements yielded a resultant displacement
that was almost in phase with the applied force; therefore, the
micromechanical response of A7 cells was predominantly elastic
rather than viscous (Figure 2). Consistent with this, themeasured
elastic modulusG’was significantly larger than the loss modulus
G’’ over the frequency range from 0.3 to 70 Hz (Figure S2). The
elastic modulus follows a power-law form, jG(y)j�yb, with b
z0.15, in agreement with other measurements (Fabry et al.,
2001; Guo et al., 2013). We also noted that the measured cyto-
plasmic modulus is approximately 1 Pa (Figure S2), much lower
than that measured on the actin cortex (Fabry et al., 2001); pre-
sumably this reflects the denser crosslinked actin structure in the
cell cortex, whereas the beads probe the cytoplasm which is
much more dilute and hence lower in elasticity. Thus, our twee-
zers measurements confirmed that the cytoplasm is an elastic
solid across the measured timescales.
Model of Diffusive-like Motion in a NearlyElastic MediumThe motion of tracer particles directly reflects the fluctuations
driven by random motor activity throughout the cell. This pro-
vides a basis for an assay that characterizes the average effect
of all motor forces; this cannot be done with any other existing
technique. To develop this assay, a quantitative description of
the random fluctuating motion is required. To do this, we adop-
ted the fundamental force-displacement relationship of any me-
dium, Hooke’s law, f = Kx, where f and x are the driving force and

Figure 3. Conceptual Basis of FSM
(A) Schematic illustration of cytoplasmic fluctuating forces enhancing in-
tracellular motion. The aggregate effect of all the motors and active processes
working at random directions and random times contribute an incoherent
background of fluctuating forces. These active forces drive fluctuating de-
formations of the cytoplasmic network and substantially enhance intracellular
movement over a broad range of length scales, from submicron organelles to
nanometer-sized proteins.
(B) Basic procedure of FSM. (i) A sound wave in the time domain can be
represented in the frequency domain by taking its Fourier transform, thereby
revealing its frequency composition. (ii) By analogy to the sound wave, we
Fourier transform the MSD and express it in the frequency domain. (iii) The
cytoplasmic material property, specifically the spring constant, is measured
directly using optical tweezers, also in the frequency domain. (iv) Analogous to
a stretched spring, if the spring deformation and spring constant are known,
the stretching force can be calculated; in cells, the randomly fluctuating force
at each frequency is calculated as < f2(y) > = jK(y)j2 < x2(y) >.
the resulting displacement. The material properties are fre-
quency dependent, and the forces are stochastic; thus we
consider the quadratic form of the averaged quantities in the fre-
quency domain, < x2(y) > = < f2(y) > /jK(y)j2. The MSD, < Dx2(t) >,
is obtained through the Fourier transform of < x2(y) >.
To illustrate the application of the formalism, we consider the
simple case of thermally induced Brownian motion in a viscous
fluid. In this case, the stochastic thermal forces exerted on the
particle are equivalent to white noise and independent of fre-
quency. Furthermore, for a viscous fluid jKj2 f y2, since K’’ f
hy, with h denoting the fluid viscosity. Therefore, < x2(y) > f y-2;
after Fourier transform, the MSD becomes < Dx2(t) > f t, as ex-
pected for thermally driven Brownian diffusion in a viscous fluid.
However, the laser-tweezer measurements reveal that the
cytoplasm is not a simple fluid, but is instead a weak elastic
gel; thus, the tracer particle movement directly reflects the
average motor activity. Within this picture, the effect of uncorre-
lated molecular motors, such as those of myosin filament con-
tractions, is to generate random intracellular forces; these drive
fluctuating deformations of the elastic network. This in turn
drives the fluctuating motion of objects embedded within the
network, as illustrated schematically in Figure 3A. Molecular mo-
tors generate force during their processivity time, tp, which char-
acterizes the typical period of binding and coherent motion of a
motor; at times longer than this, the motor unbinds, and the ten-
sion is instantaneously released, as sketched by the time evolu-
tion of the force, f(t), in the inset of Figure S1B. A force with this
step-like behavior in time leads to a power spectrum of force
fluctuations, < f2(y) >, that varies with frequency as y-2 (Lau
et al., 2003; MacKintosh and Levine, 2008). For a purely elastic
medium, K is independent of frequency, leading to < x2(y) > f
y-2, which again becomes < Dx2(t) > f t. Interestingly, this tem-
poral dependence of x is the same as that of thermal motion in
a viscous fluid; however, in this case, the motion reflects the
random active motor forces in an elastic medium, rather than
stochastic thermal agitation in a viscous fluid.
The laser-tweezer measurements of the elastic modulus (Fig-
ures 2, S2 and S3A) show that the local micromechanical envi-
ronment experienced by probe particles is in fact not purely
elastic, but is instead viscoelastic, with a frequency-dependent
spring constant jK(y)j = K0yb, where bz0.15. Furthermore, in
the measured frequency range, we find no apparent change
in the time behavior of the spring constant; therefore, we assume
the same time dependence persists. In this case, the frequency-
and force-dependent displacement spectrum becomes < x2(y) >
f y-2(1+b). Thus, for times less than the processivity time tp, the
MSD becomes < Dx2(t) > f t1+2b/K02. This is in stark contrast
to the thermal motion expected in such a viscoelastic environ-
ment as < Dx2(t) > f tbkT/K0. Indeed, the observed plateau in
the MSD at short timescales (Figure 1B) is consistent with <
Dx2(t) >f t b with bz0.15, indicating that the short time regime
can be understood as thermal motion in a nearly elastic medium.
Force Spectrum Microscopy Probes EnsembleAggregate Intracellular ForcesThe fluctuatingmotion of the tracer particles is a direct readout of
the average random fluctuations due to the aggregate motor ac-
tivity in the cell. If both the particle motion and the cytoplasmic
Cell 158, 822–832, August 14, 2014 ª2014 Elsevier Inc. 825

-2
Tracer particleVesicle and protein complexMitochondria
Untreated cells
-0.85
-2
10-29
10-28
10-27
10-26
10-25
10-24
10-29
10-28
10-27
10-26
10-25
10-24
<f2 >
(N2 s
)
Frequency (Hz)10010-1 101 102
A
<f2 >
(N2 s
)Frequency (Hz)
10010-1 101
BTheory
UntreatedMyosin II inhibitedATP depletedActive fluctuations only, thermal effect excluded
Exp.Figure 4. Ensemble Aggregate Intracellular
Force Spectrum Probed by FSM
(A) Cytoplasmic force spectrum calculated from
spontaneous fluctuations of tracer particles and
the active microrheology measurement, through
< f2(y) > = jK(y)j2 < x2(y) >, inside control untreated
(red), myosin II inhibited (blue) and ATP-depleted
(black) A7 cells. For comparison, theoretical pre-
dictionsareshownforanelasticmediumwithashear
modulus as shown in Figure S2, with three levels of
activities; the red solid line corresponds to about
1/mm3 density of myosin II filaments applying a force
�10 pN, the blue solid line corresponds to a 90%
reduction of myosin motor activity by 10 mM bleb-
bistatin (Kovacs et al., 2004), and the black solid line
corresponds to no active motors. The yellow dash
dotted line represents the theoretical prediction
of only active contributions and excludes thermal effects. Dashed lines indicate logarithmic slopes of�0.85 and �2. Vertical bars represent standard error (n = 15).
(B) Comparison of force spectra probed by FSM in untreated A7 cells, using the spontaneous fluctuations of injected tracer particles (red dotted line, same as
that in Figure 4A), endogenous vesicles and protein complexes (black circle), and mitochondria (blue triangle). The spring constant is measured by active
microrheology with probe particles, as shown in Figure 2. The force spectrum measured with vesicles and protein complexes is in excellent accord with that
measured for probe particles. The force spectrum for mitochondria exhibits the same frequency dependence as that for probe particles, but is larger in
amplitude; this is consistent with mitochondria are also occasionally directly transported by specific motors within the cell.
viscoelasticity aremeasured, the spectrum of the average fluctu-
ating force due to these motors, which drives this motion, can be
directly determined, through < f2(y) > = jK(y)j2 < x2(y) >. This pro-
vides a new tool for characterizing the frequency-dependent
spectrum of the average force, which is due to the aggregate,
yet random effects of all active processes in the cell. While these
forces are inherently time-dependent, it is more convenient to
describe their frequency-dependent spectrum. We call this
new assay Force Spectrum Microscopy (FSM), as summarized
schematically in Figure 3B.
To demonstrate the applicability of FSM, we quantified the
average aggregate cytoplasmic forces due to active processes
in A7 cells. The resultant force spectrum exhibited two distinct
frequency regimes, as shown by the red data in Figure 4A: In
the low-frequency range, corresponding to timescales t R
0.1 s, < f2(y) > is proportional to y�2; by contrast, in the high-fre-
quency range, corresponding to t% 0.1 s, < f2(y) > has a weaker
frequency dependency. These observations are consistent with
a low-frequency regime dominated by active forces and a high-
frequency regime dominated by thermal forces (Brangwynne
et al., 2008a; Lau et al., 2003;MacKintosh and Levine, 2008;Miz-
uno et al., 2007). Moreover, based on our model, we estimate
that a density of myosin filaments of �1/mm3, each generating
a force of order 10 pN, can account for the observed force spec-
trum (see details in Extended Results). This is the first experi-
mental assessment of this important global measurement of
the overall enzymatic activity in the cell.
To further establish the applicability of FSM in quantifying
active forces in the cell, we suppressed the level of actin-based
cytoskeletal forces by inhibiting myosin II motors through the
addition of 10 mM blebbistatin to the cell culture medium. As a
result, the low-frequency, active component of the force spec-
trum was suppressed, although the same overall y-2 dependence
remained, as shown by the blue data in Figure 4A. Furthermore,
when we depleted cells of ATP through addition of 2 mM sodium
azide and 10mM2-deoxyglucose, we observed a force spectrum
826 Cell 158, 822–832, August 14, 2014 ª2014 Elsevier Inc.
that is consistent with purely thermal fluctuations over the full fre-
quency range for the viscoelasticy medium measured directly for
these cells, as shown by the black data in Figure 4A. This sug-
gested that, while actomyosin contractions are a significant
source of intracellular forces, other enzymatic activities also
contribute to the forces and hence the motion experienced by
intracellular objects. Moreover, above 10 Hz, the force spectra
measured in all cases had the same time dependence and nearly
the same amplitudes, consistent with a common thermal origin
of the motion in this regime (Figure 4A). These results demon-
strate the ability of FSM to quantify the degree of motor activity
in a cell and to distinguish these active forces from thermal forces.
To further explore the utility and sensitivity of FSM, we
increased the cytoplasmic stiffness by applying osmotic stress
to compress cells (Zhou et al., 2009). We observe a marked
reduction in the amplitude of particle fluctuations, although the
frequency dependence remains unchanged, reflecting the con-
sequences of the increased cytoplasmic stiffness (Figure S3).
Surprisingly, however, when the force spectrum was calculated,
we found that the amplitude of intracellular forces did not
change, at least within the range of osmotic pressures applied
(see details in Extended Results).
FSM Reveals Differences in the Intracellular Forceswithin Benign and Malignant CellsSince FSMprobes the consequences of the aggregate forces due
to active processes in the cell, it can be used to directly quantify
changes in intracellular activity and the dynamic state of the
cytoplasm in response to changes in conditions such as drug
treatment, external stimuli, or even the disease state of a cell.
To illustrate this, we compared the force spectrum of malignant
and benign cells. Malignant cells exhibit reduced cell stiffness
(Cross et al., 2007; Plodinec et al., 2013) and increased traction
forces (Kraning-Rush et al., 2012), which may provide potential
biophysical markers for metastatic progression. Using FSM, we
compared the force spectrum in benign (MCF-10A) to that in

A C
B
Figure 5. Intracellular Mechanics, Dy-
namics and Forces in Benign and Malignant
Tumor Cells
(A) Two-dimensional MSD < Dr2(t) > of 500 nm
tracer particles are plotted against lag time on
a log-log scale, in the benign breast cells MCF-
10A (red circle) and malignant breast tumor
cells MCF-7 (black triangle), respectively. The
fluctuating movement of tracer particles is stron-
ger in the malignant cells, as compared to the
benign cells.
(B) Cytoplasmic mechanics measured by active
microrheology using optical tweezers. The effec-
tive spring constant of the cytoplasm is larger in
the MCF-10A (red circle), as compared to the
MCF-7 (black triangle); this suggests that the
cytoplasm of benign cells is stiffer than malignant
cells.
(C) The spectrum of intracellular forces calcu-
lated based on the fluctuating movement of tracer particles and the cytoplasmic mechanics measurement. The intracellular forces are stronger in the
malignant tumor cells MCF-7 (black triangle), than the benign cells MCF-10A (red circle).
Error bars represent standard deviation (n = 6). See also Figures S4 and S5.
malignant (MCF-7) breast cancer cells, which are known to
exhibit enhanced motility (Chan et al., 2008; Nagaraja et al.,
2006). Tracer-particle motion is significantly enhanced in malig-
nant MCF-7 cells relative to benign cells, as shown in Figure 5A,
whereas the cytoplasmic stiffness was only �30% smaller in the
malignant MCF-7 cells (Figure 5B). When we calculated the force
spectrum, we indeed found a significant difference between ma-
lignant and benign cells, with malignant cells having a force spec-
trum with approximately three times larger magnitude than the
benign cells; however, the frequency dependence of the spectra
remained unchanged (Figure 5C). A similar behavior was
observed for another pair of malignant and benign cells, M6C
and M28 (Holzer et al., 2003), as shown in Figure S4. The results
suggested, therefore, that highly motile cancer cells have a more
active cytoplasm. The enhanced motor activity reflected by the
larger magnitude in the force spectrum measured with FSM is
consistent with cancer cells exerting increased traction force on
the extracellular matrix (Agus et al., 2013), despite their
decreased stiffness; this observation also fits well with biochem-
ical studies showing changes in metabolic and proliferative rates
of cancer cells (Deberardinis et al., 2008; Sherr, 1996). Therefore,
FSM provides a tool to identify changes in ensemble intracellular
forces and dynamic states of the cytoplasm, even though the
origin of these changes is complex. Moreover, our results with
malignant cells provide an additional metastatic signature at the
subcellular scale and may help elucidate the physical and chem-
ical forces that shape and govern the progression of cancer.
Force Spectrum Microscopy Reveals that Expression ofVimentin Intermediate Filaments Does Not AffectIntracellular ForcesForce spectrum microscopy can identify the contribution of
specific cellular components to the overall level of intracellular
activity. To demonstrate this, we apply FSM to measure the ef-
fect of vimentin intermediate filaments (VIFs) in mesenchymal
cells. Vimentin is a type III IF protein that is typically expressed
in cells of mesenchymal origin and is widely used as a marker
of the epithelial to mesenchymal transition (EMT). VIFs have
been shown to induce changes in cell shape, motility, and adhe-
sion during EMT (Mendez et al., 2010); however, the role of VIFs
in the level of aggregate intracellular forces is unknown because
no technique has been able to quantify this property. We used
FSM to probe intracellular force spectrum in mouse embryonic
fibroblasts (mEFs) from wild-type (WT) and vimentin knockout
(Vim�/�) mice; we found no significant difference in the intracel-
lular force spectrum betweenWT and Vim�/�mEFs, as shown in
Figure S5. In contrast, the force spectrumwasmarkedly reduced
when we depolymerize actin filaments with 5 mg/ml cytochalasin
D in WT mEFs. These results suggested that vimentin IFs are
mainly structural polymers that are an important contributor to
the internal stiffness of cells, but do not affect the aggregate
intracellular forces.
Force Spectrum Reveals Motor Processivity TimeThe frequency spectrum can quantify additional important, but
heretofore unresolved, features of motor activity. This is seen in
a more precise investigation of the time dependence of the
MSD.At long times, tR 0.1 s,we observe an approximately linear
time dependence in the MSD averaged over many particles. By
contrast, our model predicts a stronger time dependence, as
given by < Dx2(t) > f t1+2b/K02. This difference arises from the
ensemble averaging over different trajectories; indeed when we
examine the MSDs of individual particles, we find that most tra-
jectories exhibit amarkedly largermaximum local slope reflecting
a stronger time dependence. However, they also exhibit clear ev-
idence of a roll-off or saturation at the longest times, on the order
of 10 s, as shown in Figures 6A and S1B. This roll-off behavior is
consistent with the finite processivity of motor contractions, at a
processivity time, tp; processive forces are generated by motors
with an average duration, tp, and result in finite displacements in
the cytoplasm over corresponding timescales. To quantify this,
we measure the distribution of logarithmic slopes of the MSD
and find a peak near 1.2, as shown in Figure 6B; this is in excellent
agreement with the prediction of < Dx2(t) >f t1+2b with bz0.15.
Moreover, the distribution of processivity times is peaked around
5 s, as shown in Figure 6C; this is an experimental measure of
Cell 158, 822–832, August 14, 2014 ª2014 Elsevier Inc. 827
A B C
D E F
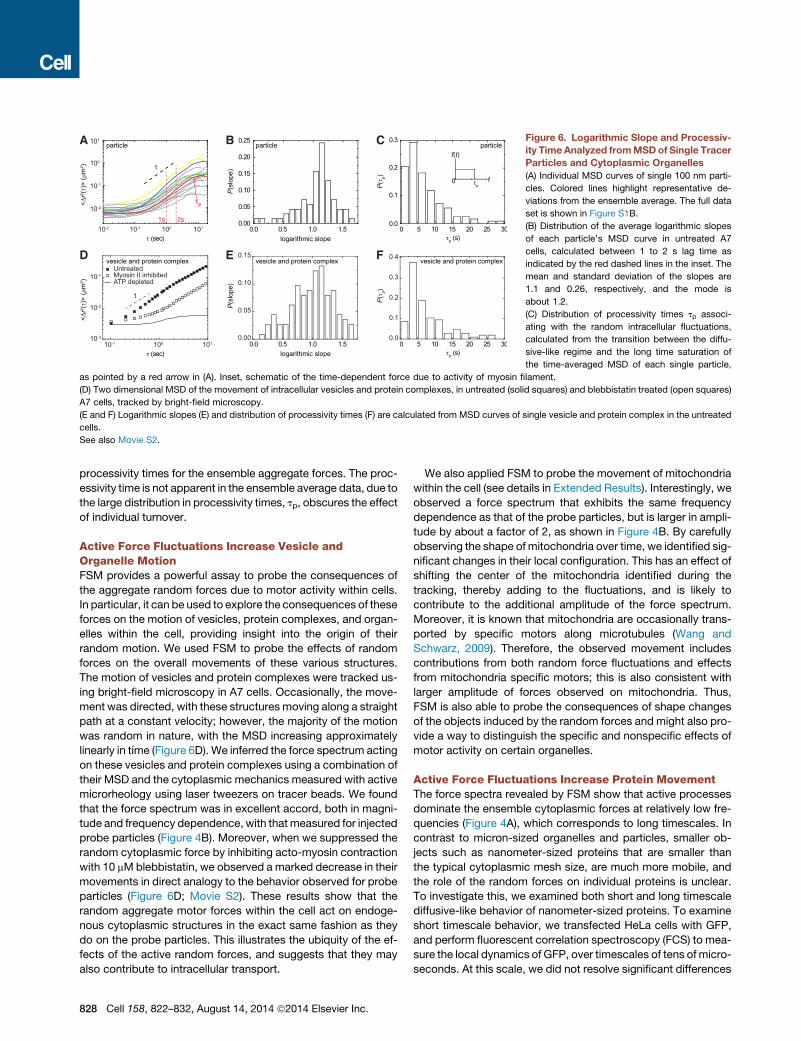
Figure 6. Logarithmic Slope and Processiv-
ity Time Analyzed fromMSDof Single Tracer
Particles and Cytoplasmic Organelles
(A) Individual MSD curves of single 100 nm parti-
cles. Colored lines highlight representative de-
viations from the ensemble average. The full data
set is shown in Figure S1B.
(B) Distribution of the average logarithmic slopes
of each particle’s MSD curve in untreated A7
cells, calculated between 1 to 2 s lag time as
indicated by the red dashed lines in the inset. The
mean and standard deviation of the slopes are
1.1 and 0.26, respectively, and the mode is
about 1.2.
(C) Distribution of processivity times tp associ-
ating with the random intracellular fluctuations,
calculated from the transition between the diffu-
sive-like regime and the long time saturation of
the time-averaged MSD of each single particle,
as pointed by a red arrow in (A). Inset, schematic of the time-dependent force due to activity of myosin filament.
(D) Two dimensional MSD of the movement of intracellular vesicles and protein complexes, in untreated (solid squares) and blebbistatin treated (open squares)
A7 cells, tracked by bright-field microscopy.
(E and F) Logarithmic slopes (E) and distribution of processivity times (F) are calculated from MSD curves of single vesicle and protein complex in the untreated
cells.
See also Movie S2.
processivity times for the ensemble aggregate forces. The proc-
essivity time is not apparent in the ensemble average data, due to
the large distribution in processivity times, tp, obscures the effect
of individual turnover.
Active Force Fluctuations Increase Vesicle andOrganelle MotionFSM provides a powerful assay to probe the consequences of
the aggregate random forces due to motor activity within cells.
In particular, it can be used to explore the consequences of these
forces on the motion of vesicles, protein complexes, and organ-
elles within the cell, providing insight into the origin of their
random motion. We used FSM to probe the effects of random
forces on the overall movements of these various structures.
The motion of vesicles and protein complexes were tracked us-
ing bright-field microscopy in A7 cells. Occasionally, the move-
ment was directed, with these structures moving along a straight
path at a constant velocity; however, the majority of the motion
was random in nature, with the MSD increasing approximately
linearly in time (Figure 6D). We inferred the force spectrum acting
on these vesicles and protein complexes using a combination of
their MSD and the cytoplasmic mechanics measured with active
microrheology using laser tweezers on tracer beads. We found
that the force spectrum was in excellent accord, both in magni-
tude and frequency dependence, with that measured for injected
probe particles (Figure 4B). Moreover, when we suppressed the
random cytoplasmic force by inhibiting acto-myosin contraction
with 10 mMblebbistatin, we observed a marked decrease in their
movements in direct analogy to the behavior observed for probe
particles (Figure 6D; Movie S2). These results show that the
random aggregate motor forces within the cell act on endoge-
nous cytoplasmic structures in the exact same fashion as they
do on the probe particles. This illustrates the ubiquity of the ef-
fects of the active random forces, and suggests that they may
also contribute to intracellular transport.
828 Cell 158, 822–832, August 14, 2014 ª2014 Elsevier Inc.
We also applied FSM to probe the movement of mitochondria
within the cell (see details in Extended Results). Interestingly, we
observed a force spectrum that exhibits the same frequency
dependence as that of the probe particles, but is larger in ampli-
tude by about a factor of 2, as shown in Figure 4B. By carefully
observing the shape of mitochondria over time, we identified sig-
nificant changes in their local configuration. This has an effect of
shifting the center of the mitochondria identified during the
tracking, thereby adding to the fluctuations, and is likely to
contribute to the additional amplitude of the force spectrum.
Moreover, it is known that mitochondria are occasionally trans-
ported by specific motors along microtubules (Wang and
Schwarz, 2009). Therefore, the observed movement includes
contributions from both random force fluctuations and effects
from mitochondria specific motors; this is also consistent with
larger amplitude of forces observed on mitochondria. Thus,
FSM is also able to probe the consequences of shape changes
of the objects induced by the random forces and might also pro-
vide a way to distinguish the specific and nonspecific effects of
motor activity on certain organelles.
Active Force Fluctuations Increase Protein MovementThe force spectra revealed by FSM show that active processes
dominate the ensemble cytoplasmic forces at relatively low fre-
quencies (Figure 4A), which corresponds to long timescales. In
contrast to micron-sized organelles and particles, smaller ob-
jects such as nanometer-sized proteins that are smaller than
the typical cytoplasmic mesh size, are much more mobile, and
the role of the random forces on individual proteins is unclear.
To investigate this, we examined both short and long timescale
diffusive-like behavior of nanometer-sized proteins. To examine
short timescale behavior, we transfected HeLa cells with GFP,
and perform fluorescent correlation spectroscopy (FCS) to mea-
sure the local dynamics of GFP, over timescales of tens of micro-
seconds. At this scale, we did not resolve significant differences
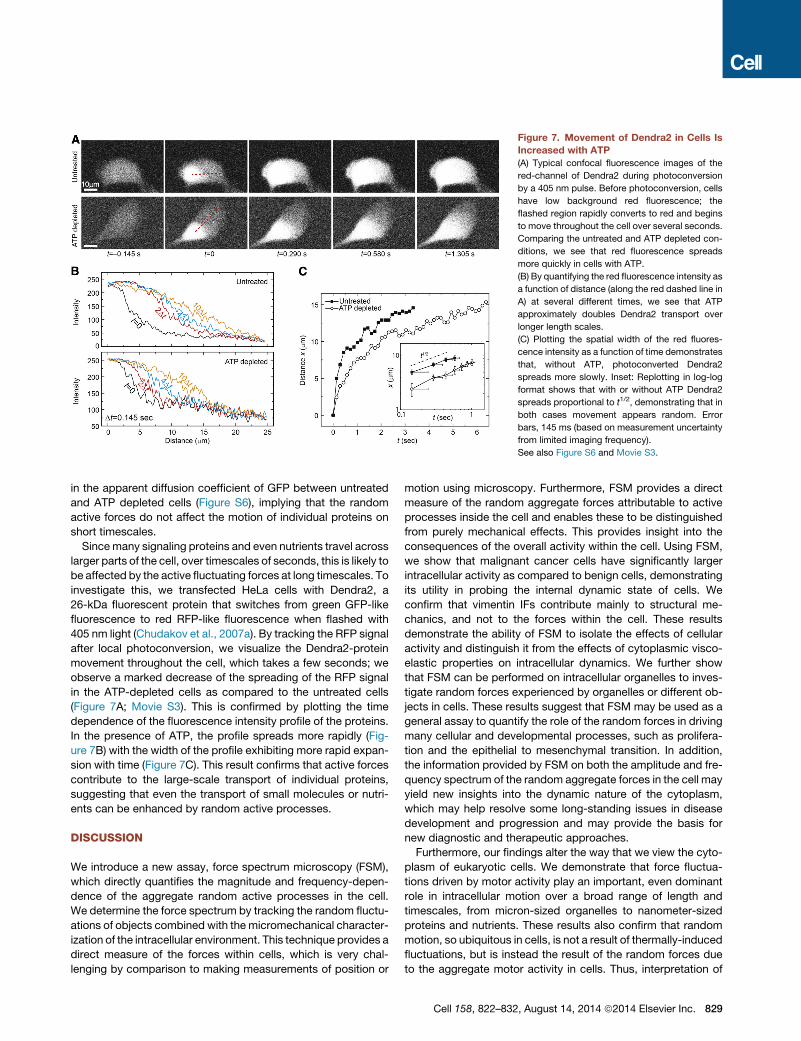
Figure 7. Movement of Dendra2 in Cells Is
Increased with ATP
(A) Typical confocal fluorescence images of the
red-channel of Dendra2 during photoconversion
by a 405 nm pulse. Before photoconversion, cells
have low background red fluorescence; the
flashed region rapidly converts to red and begins
to move throughout the cell over several seconds.
Comparing the untreated and ATP depleted con-
ditions, we see that red fluorescence spreads
more quickly in cells with ATP.
(B) By quantifying the red fluorescence intensity as
a function of distance (along the red dashed line in
A) at several different times, we see that ATP
approximately doubles Dendra2 transport over
longer length scales.
(C) Plotting the spatial width of the red fluores-
cence intensity as a function of time demonstrates
that, without ATP, photoconverted Dendra2
spreads more slowly. Inset: Replotting in log-log
format shows that with or without ATP Dendra2
spreads proportional to t1/2, demonstrating that in
both cases movement appears random. Error
bars, 145 ms (based on measurement uncertainty
from limited imaging frequency).
See also Figure S6 and Movie S3.
in the apparent diffusion coefficient of GFP between untreated
and ATP depleted cells (Figure S6), implying that the random
active forces do not affect the motion of individual proteins on
short timescales.
Sincemany signaling proteins and even nutrients travel across
larger parts of the cell, over timescales of seconds, this is likely to
be affected by the active fluctuating forces at long timescales. To
investigate this, we transfected HeLa cells with Dendra2, a
26-kDa fluorescent protein that switches from green GFP-like
fluorescence to red RFP-like fluorescence when flashed with
405 nm light (Chudakov et al., 2007a). By tracking the RFP signal
after local photoconversion, we visualize the Dendra2-protein
movement throughout the cell, which takes a few seconds; we
observe a marked decrease of the spreading of the RFP signal
in the ATP-depleted cells as compared to the untreated cells
(Figure 7A; Movie S3). This is confirmed by plotting the time
dependence of the fluorescence intensity profile of the proteins.
In the presence of ATP, the profile spreads more rapidly (Fig-
ure 7B) with the width of the profile exhibiting more rapid expan-
sion with time (Figure 7C). This result confirms that active forces
contribute to the large-scale transport of individual proteins,
suggesting that even the transport of small molecules or nutri-
ents can be enhanced by random active processes.
DISCUSSION
We introduce a new assay, force spectrum microscopy (FSM),
which directly quantifies the magnitude and frequency-depen-
dence of the aggregate random active processes in the cell.
We determine the force spectrum by tracking the random fluctu-
ations of objects combined with the micromechanical character-
ization of the intracellular environment. This technique provides a
direct measure of the forces within cells, which is very chal-
lenging by comparison to making measurements of position or
motion using microscopy. Furthermore, FSM provides a direct
measure of the random aggregate forces attributable to active
processes inside the cell and enables these to be distinguished
from purely mechanical effects. This provides insight into the
consequences of the overall activity within the cell. Using FSM,
we show that malignant cancer cells have significantly larger
intracellular activity as compared to benign cells, demonstrating
its utility in probing the internal dynamic state of cells. We
confirm that vimentin IFs contribute mainly to structural me-
chanics, and not to the forces within the cell. These results
demonstrate the ability of FSM to isolate the effects of cellular
activity and distinguish it from the effects of cytoplasmic visco-
elastic properties on intracellular dynamics. We further show
that FSM can be performed on intracellular organelles to inves-
tigate random forces experienced by organelles or different ob-
jects in cells. These results suggest that FSM may be used as a
general assay to quantify the role of the random forces in driving
many cellular and developmental processes, such as prolifera-
tion and the epithelial to mesenchymal transition. In addition,
the information provided by FSM on both the amplitude and fre-
quency spectrum of the random aggregate forces in the cell may
yield new insights into the dynamic nature of the cytoplasm,
which may help resolve some long-standing issues in disease
development and progression and may provide the basis for
new diagnostic and therapeutic approaches.
Furthermore, our findings alter the way that we view the cyto-
plasm of eukaryotic cells. We demonstrate that force fluctua-
tions driven by motor activity play an important, even dominant
role in intracellular motion over a broad range of length and
timescales, from micron-sized organelles to nanometer-sized
proteins and nutrients. These results also confirm that random
motion, so ubiquitous in cells, is not a result of thermally-induced
fluctuations, but is instead the result of the random forces due
to the aggregate motor activity in cells. Thus, interpretation of
Cell 158, 822–832, August 14, 2014 ª2014 Elsevier Inc. 829
intracellular motion based on equilibrium thermal fluctuations,
such as is done for passive microrheology (Baker et al., 2010;
del Alamo et al., 2008; Wu et al., 2012; Yamada et al., 2000) is
incorrect. Moreover, this random motion driven by intracellular
force fluctuations can have important consequences for many
aspects of cell physiology. For example, many cellular compo-
nents, such as protein filaments and complexes, storage gran-
ules, and intracellular organelles, will be impacted by these
active fluctuations in the cytoplasm; these components are
involved in processes that are essential for life in natural environ-
ments, and their functions depend on their ability to move in the
cytoplasm. More specifically, these random fluctuations are
likely to be crucial for spatially distributing key cellular machin-
eries, such as ribosomes and proteasomes, to facilitate efficient
translation and degradation of proteins. They also could be vital
for quick removal of enzyme products from their site of synthesis
in metabolic reactions to avoid local concentration effects.
Finally, growth and remodeling of the cytoskeleton may depend
on these random force fluctuations, which may help ensure, for
example, that actin monomers are in continual supply to rapidly
growing filaments in the cell periphery.
EXPERIMENTAL PROCEDURES
Cell Culture, Microinjection, and Pharmacological Interventions
Cells are maintained under 5% CO2 at 37�C in a humidified incubator. A7 cells
(Cunningham et al., 1992) (gift from Tom Stossel’s lab at Harvard Medical
School) are cultured in Dulbecco’s minimal essential medium (DMEM) supple-
mented with 2% fetal calf serum, 8% newborn calf serum (Invitrogen), 10 mM
HEPES buffer, 100 U/ml penicillin, and 100 mg/ml streptomycin. WT and
Vim�/� mEFs (Guo et al., 2013) are cultured in DMEM with 10% fetal calf
serum, 5 mM nonessential amino acids, 100 U/ml penicillin, and 100 mg/ml
streptomycin. MCF-10A cells are cultured in 1:1 DMEM:F12media (Invitrogen)
with 5% house serum (Invitrogen), 20 mM HEPES, 10 mg/ml insulin, 0.1 mg/ml
Cholera Toxin, 500 ng/ml hydrocortisone, 100 U/ml penicillin, and 100 mg/ml
streptomycin. MCF-7 cells andHeLa cells are cultured in DMEMwith 10% fetal
calf serum. Cells are plated on collagen I coated MatTek dishes at a density of
20 per mm2 overnight before experiment.
Microinjection is performed using a glass needle and a FemtoJetmicroinjec-
tor (Eppendorf) mounted on a bright-field microscope. About 50 cells are
injected per dish; each cell is injected up to 50 tracer particles to eliminate
the interference to cell function. Cells are then allowed to recover in culture
medium for 6 hr, and are imaged on a confocal microscope at 37 �C and
5% CO2. Organelles and injected tracer particles are imaged with bright-field
or confocal microscopy using a 633/1.2NA water immersion lens on a Leica
TSC SP5. Please refer to Extended Experimental Procedures for more details.
To inhibit myosin II motor activity, blebbistatin (Toronto Research Chemi-
cals) is dissolved in DMSO and added to cell culture media to a 10 mM final
concentration, incubating for 30 min. ATP depletion is achieved by incubating
cells with 2 mM NaN3 and 10 mM 2-deoxyglucose in PBS for 1 hr.
Particle Surface Chemistry
Fluorescent carboxylate-modified polystyrene spherical particles (100, 200,
and 500 nm, from Molecular Probes) are rendered inert by grafting short
amine-terminated methoxy-poly(ethylene glycol) to the surface of carboxyl-
ated microspheres, as described previously (Valentine et al., 2004). PEG
coated particles are stored at 4�C and used within 2 weeks. Both yellow-green
and far red particles for each size are used in this study.
Particle Tracking and Analysis
The trajectories of the fluorescent particles are recorded every 10ms for about
2 min. The images are processed with particle tracking software written by
J. Crocker, D. Grier and E. Weeks, in IDL (http://www.physics.emory.edu/
830 Cell 158, 822–832, August 14, 2014 ª2014 Elsevier Inc.
�weeks/idl/). Particle centers are found in each image with an accuracy of
22 nm. The MSD of the probe particles is nearly constant in time at short time-
scales (t % 0.1 s), and is about an order of magnitude greater than the noise
floor, as shown in Figure S1A. Please refer to Extended Experimental Proce-
dures for more details.
Optical Tweezers Setup
To optically trap and manipulate 500 nm beads in the cytoplasm of living cells,
the beam from a variable-power Nd:YAG solid-state laser (4 W, 1064 nm;
Spectra Physics) is steered through a series of Keplerian beam expanders to
overfill the back aperture of a 1003 1.3 numerical aperture microscope objec-
tive (Nikon S-fluor; Nikon). To steer the beam and manipulate the trapped
bead, two acousto-optic deflectors (NEOS Technologies) are used to manip-
ulate the beam in the plane of the microscope glass slide. For detection, the
bead is centered on a high-resolution position detection quadrant detector
(MBPS; Spectral Applied Research) and illuminated using brightfield illumina-
tion from a 75WXe lamp. The linear region of the detector is calibrated by trap-
ping a bead identical to those used in the cells in water and moving it across
the detector using the acousto-optic deflectors in known step sizes. The
trap stiffness is calibrated to 0.05 pN/nm using the mean-squared Brownian
motion of a trapped bead in water at various laser power settings using the
principle of energy equipartition as previously described (Veigel et al., 1998).
A trapped bead is oscillated across a frequency range of 0.3–70 Hz using
the acousto-optic deflectors, and the laser position and bead displacement
are recorded simultaneously, from which the elastic and viscous shear moduli
are determined.
Osmotic Stress
Hyperosmotic stress is applied by adding polyethylene glycol 300 (PEG300) to
isotonic culture medium. Cells are then allowed to equilibrate for 10 min at
37 �C and 5% CO2, before we perform the imaging or optical-tweezer mea-
surement. The cell size and mechanics equilibrate in 2 min after adding
PEG, based on our imaging and previous studies (Zhou et al., 2009).
Measurement of Protein Movement with Photoconvertable Dendra2
To measure the large length scale movement of small proteins, we use the
photonically switchable fluorescent proteins Dendra2, a photoconvertible
fluorescent protein which irreversibly switches from green (GFP-like) to red
(RFP-like) when exposed to a brief flash of 405 nm light (Chudakov et al.,
2007a). We transfect HeLa cells with Dendra2 (Evrogen), then perform fluores-
cence loss after photoconversion (FLAC) measurements as described previ-
ously (Ehrlicher et al., 2011). In FLAC measurements using Dendra2, we start
with the green fluorescence of unconverted Dendra2, which allows us to iden-
tify cells with high expression that are bright. We then flash the cell with a brief
(�50ms) flash of 405 nm light, while monitoring both the green and red fluores-
cence. A dip in the green fluorescence is observed, but a bright spot of red
fluorescence in the pulsed region is clearly visible. By monitoring the increase
of red fluorescence at different distances from the pulsed region, we can quan-
tify the movement of the Dendra2 probe throughout the cell. Please refer to
Extended Experimental Procedures for more details.
SUPPLEMENTAL INFORMATION
Supplemental Information includes Extended Results, Extended Experimental
Procedures, six figures, and three movies and can be found with this article
online at http://dx.doi.org/10.1016/j.cell.2014.06.051.
ACKNOWLEDGMENTS
We thank A. Rowat, S. Lindstrom, K. Kasza for helpful discussions; we thank
F. Deng and A. Pegoraro for comments on the manuscript. This work was
supported by the NIH (PO1GM096971), the Harvard Materials Research Sci-
ence and Engineering Center (DMR-0820484), the NSF (DMR-1310266).
A.J.E. was supported by NIH grant DK083592; M.H.J. and J.R.M. were sup-
ported by NIH grants HL86655 and HL077280; F.C.M. was supported in part
by FOM/NWO. R.D.G. was supported by NIH PO1GM096971 and Hannah’s
Hope Fund.

Received: December 17, 2013
Revised: April 28, 2014
Accepted: June 29, 2014
Published: August 14, 2014
REFERENCES
Agus, D.B., Alexander, J.F., Arap, W., Ashili, S., Aslan, J.E., Austin, R.H.,
Backman, V., Bethel, K.J., Bonneau, R., Chen, W.C., et al.; Physical Sciences -
Oncology Centers Network (2013). A physical sciences network characteriza-
tion of non-tumorigenic and metastatic cells. Sci Rep 3, 1449.
Ananthanarayanan, V., Schattat, M., Vogel, S.K., Krull, A., Pavin, N., and Toli�c-
Nørrelykke, I.M. (2013). Dynein motion switches from diffusive to directed
upon cortical anchoring. Cell 153, 1526–1536.
Baker, E.L., Lu, J., Yu, D.H., Bonnecaze, R.T., and Zaman,M.H. (2010). Cancer
cell stiffness: integrated roles of three-dimensional matrix stiffness and trans-
forming potential. Biophys. J. 99, 2048–2057.
Brangwynne, C.P., Koenderink, G.H., MacKintosh, F.C., and Weitz, D.A.
(2008a). Cytoplasmic diffusion: molecular motors mix it up. J. Cell Biol. 183,
583–587.
Brangwynne, C.P., Koenderink, G.H., Mackintosh, F.C., and Weitz, D.A.
(2008b). Nonequilibrium microtubule fluctuations in a model cytoskeleton.
Phys. Rev. Lett. 100, 118104.
Bursac, P., Lenormand, G., Fabry, B., Oliver, M., Weitz, D.A., Viasnoff, V., But-
ler, J.P., and Fredberg, J.J. (2005). Cytoskeletal remodelling and slow dy-
namics in the living cell. Nat. Mater. 4, 557–561.
Chan, S.W., Lim, C.J., Guo, K., Ng, C.P., Lee, I., Hunziker, W., Zeng, Q., and
Hong, W.J. (2008). A role for TAZ in migration, invasion, and tumorigenesis
of breast cancer cells. Cancer Res. 68, 2592–2598.
Chudakov, D.M., Lukyanov, S., and Lukyanov, K.A. (2007a). Tracking intracel-
lular protein movements using photoswitchable fluorescent proteins PS-CFP2
and Dendra2. Nat. Protoc. 2, 2024–2032.
Cross, S.E., Jin, Y.S., Rao, J., and Gimzewski, J.K. (2007). Nanomechanical
analysis of cells from cancer patients. Nat. Nanotechnol. 2, 780–783.
Cunningham, C.C., Gorlin, J.B., Kwiatkowski, D.J., Hartwig, J.H., Janmey,
P.A., Byers, H.R., and Stossel, T.P. (1992). Actin-binding protein requirement
for cortical stability and efficient locomotion. Science 255, 325–327.
Deberardinis, R.J., Sayed, N., Ditsworth, D., and Thompson, C.B. (2008). Brick
by brick: metabolism and tumor cell growth. Curr. Opin. Genet. Dev. 18, 54–61.
del Alamo, J.C., Norwich, G.N., Li, Y.S.J., Lasheras, J.C., and Chien, S. (2008).
Anisotropic rheology and directional mechanotransduction in vascular endo-
thelial cells. Proc. Natl. Acad. Sci. USA 105, 15411–15416.
Doyle, A.D., and Yamada, K.M. (2010). Cell biology: Sensing tension. Nature
466, 192–193.
Dufrene, Y.F., Evans, E., Engel, A., Helenius, J., Gaub, H.E., and Muller, D.J.
(2011). Five challenges to bringing single-molecule force spectroscopy into
living cells. Nat. Methods 8, 123–127.
Ehrlicher, A.J., Nakamura, F., Hartwig, J.H., Weitz, D.A., and Stossel, T.P.
(2011). Mechanical strain in actin networks regulates FilGAP and integrin bind-
ing to filamin A. Nature 478, 260–263.
Fabry, B., Maksym, G.N., Butler, J.P., Glogauer, M., Navajas, D., and Fred-
berg, J.J. (2001). Scaling the microrheology of living cells. Phys. Rev. Lett.
87, 148102.
Grashoff, C., Hoffman, B.D., Brenner, M.D., Zhou, R.B., Parsons, M., Yang,
M.T., McLean, M.A., Sligar, S.G., Chen, C.S., Ha, T., and Schwartz, M.A.
(2010). Measuring mechanical tension across vinculin reveals regulation of
focal adhesion dynamics. Nature 466, 263–266.
Gundersen, G.G., and Worman, H.J. (2013). Nuclear positioning. Cell 152,
1376–1389.
Guo, M., Ehrlicher, A.J., Mahammad, S., Fabich, H., Jensen, M.H., Moore,
J.R., Fredberg, J.J., Goldman, R.D., and Weitz, D.A. (2013). The role of vimen-
tin intermediate filaments in cortical and cytoplasmic mechanics. Biophys. J.
105, 1562–1568.
Gupton, S.L., Anderson, K.L., Kole, T.P., Fischer, R.S., Ponti, A., Hitchcock-
DeGregori, S.E., Danuser, G., Fowler, V.M., Wirtz, D., Hanein, D., and
Waterman-Storer, C.M. (2005). Cell migration without a lamellipodium: trans-
lation of actin dynamics into cell movement mediated by tropomyosin.
J. Cell Biol. 168, 619–631.
Hale, C.M., Sun, S.X., and Wirtz, D. (2009). Resolving the role of actoymyosin
contractility in cell microrheology. PLoS ONE 4, e7054.
Hammar, P., Leroy, P., Mahmutovic, A., Marklund, E.G., Berg, O.G., and Elf, J.
(2012). The lac repressor displays facilitated diffusion in living cells. Science
336, 1595–1598.
Han, W.P., Ng, Y.K., Axelrod, D., and Levitan, E.S. (1999). Neuropeptide
release by efficient recruitment of diffusing cytoplasmic secretory vesicles.
Proc. Natl. Acad. Sci. USA 96, 14577–14582.
Heisenberg, C.-P., and Bellaıche, Y. (2013). Forces in tissue morphogenesis
and patterning. Cell 153, 948–962.
Hendricks, A.G., Holzbaur, E.L.F., and Goldman, Y.E. (2012). Force measure-
ments on cargoes in living cells reveal collective dynamics of microtubule mo-
tors. Proc. Natl. Acad. Sci. USA 109, 18447–18452.
Hoffman, B.D., Massiera, G., Van Citters, K.M., and Crocker, J.C. (2006). The
consensusmechanics of culturedmammalian cells. Proc. Natl. Acad. Sci. USA
103, 10259–10264.
Holzer, R.G., MacDougall, C., Cortright, G., Atwood, K., Green, J.E., and Jor-
cyk, C.L. (2003). Development and characterization of a progressive series of
mammary adenocarcinoma cell lines derived from the C3(1)/SV40 Large T-an-
tigen transgenic mouse model. Breast Cancer Res. Treat. 77, 65–76.
Howard, J. (2001). Mechanics of motor proteins and the cytoskeleton (Sunder-
land, MA: Sinauer Associates).
Jaqaman, K., Kuwata, H., Touret, N., Collins, R., Trimble, W.S., Danuser, G.,
and Grinstein, S. (2011). Cytoskeletal control of CD36 diffusion promotes its
receptor and signaling function. Cell 146, 593–606.
Koenderink, G.H., Dogic, Z., Nakamura, F., Bendix, P.M., MacKintosh, F.C.,
Hartwig, J.H., Stossel, T.P., and Weitz, D.A. (2009). An active biopolymer
network controlled by molecular motors. Proc. Natl. Acad. Sci. USA 106,
15192–15197.
Kovacs, M., Toth, J., Hetenyi, C., Malnasi-Csizmadia, A., and Sellers, J.R.
(2004). Mechanism of blebbistatin inhibition of myosin II. J. Biol. Chem. 279,
35557–35563.
Kraning-Rush, C.M., Califano, J.P., and Reinhart-King, C.A. (2012). Cellular
traction stresses increase with increasing metastatic potential. PLoS ONE 7,
e32572.
Kyoung, M., and Sheets, E.D. (2008). Vesicle diffusion close to a membrane:
intermembrane interactionsmeasured with fluorescence correlation spectros-
copy. Biophys. J. 95, 5789–5797.
Lau, A.W.C., Hoffman, B.D., Davies, A., Crocker, J.C., and Lubensky, T.C.
(2003). Microrheology, stress fluctuations, and active behavior of living cells.
Phys. Rev. Lett. 91, 198101.
Luby-Phelps, K. (2000). Cytoarchitecture and physical properties of cyto-
plasm: volume, viscosity, diffusion, intracellular surface area. Int. Rev. Cytol.
192, 189–221.
Luby-Phelps, K., Castle, P.E., Taylor, D.L., and Lanni, F. (1987). Hindered diffu-
sion of inert tracer particles in the cytoplasm of mouse 3T3 cells. Proc. Natl.
Acad. Sci. USA 84, 4910–4913.
MacKintosh, F.C. (2012). Active diffusion: the erratic dance of chromosomal
loci. Proc. Natl. Acad. Sci. USA 109, 7138–7139.
MacKintosh, F.C., and Levine, A.J. (2008). Nonequilibrium mechanics and dy-
namics of motor-activated gels. Phys. Rev. Lett. 100, 018104.
Mendez, M.G., Kojima, S.I., and Goldman, R.D. (2010). Vimentin induces
changes in cell shape, motility, and adhesion during the epithelial to mesen-
chymal transition. FASEB J. 24, 1838–1851.
Mizuno, D., Tardin, C., Schmidt, C.F., and Mackintosh, F.C. (2007). Nonequi-
librium mechanics of active cytoskeletal networks. Science 315, 370–373.
Cell 158, 822–832, August 14, 2014 ª2014 Elsevier Inc. 831

Mizuno, D., Bacabac, R., Tardin, C., Head, D., and Schmidt, C.F. (2009).
High-resolution probing of cellular force transmission. Phys. Rev. Lett.
102, 168102.
Nagaraja, G.M., Othman, M., Fox, B.P., Alsaber, R., Pellegrino, C.M., Zeng, Y.,
Khanna, R., Tamburini, P., Swaroop, A., and Kandpal, R.P. (2006). Gene
expression signatures and biomarkers of noninvasive and invasive breast can-
cer cells: comprehensive profiles by representational difference analysis, mi-
croarrays and proteomics. Oncogene 25, 2328–2338.
Parry, B.R., Surovtsev, I.V., Cabeen, M.T., O’Hern, C.S., Dufresne, E.R., and
Jacobs-Wagner, C. (2014). The bacterial cytoplasm has glass-like properties
and is fluidized by metabolic activity. Cell 156, 183–194.
Plodinec,M., Loparic, M., Monnier, C.A., Obermann, E.C., Zanetti-Dallenbach,
R., Oertle, P., Hyotyla, J.T., Aebi, U., Bentires-Alj, M., Schoenenberger, C.A.,
et al. (2013). The Nanomechanical Signature of Breast Cancer. Biophys. J.
104, 321A–321A.
Rai, A.K., Rai, A., Ramaiya, A.J., Jha, R., and Mallik, R. (2013). Molecular ad-
aptations allow dynein to generate large collective forces inside cells. Cell 152,
172–182.
Sherr, C.J. (1996). Cancer cell cycles. Science 274, 1672–1677.
Svoboda, K., and Block, S.M. (1994). Force and velocity measured for single
kinesin molecules. Cell 77, 773–784.
Vale, R.D. (2003). The molecular motor toolbox for intracellular transport. Cell
112, 467–480.
832 Cell 158, 822–832, August 14, 2014 ª2014 Elsevier Inc.
Valentine, M.T., Perlman, Z.E., Gardel, M.L., Shin, J.H., Matsudaira, P., Mitch-
ison, T.J., and Weitz, D.A. (2004). Colloid surface chemistry critically affects
multiple particle tracking measurements of biomaterials. Biophys. J. 86,
4004–4014.
Veigel, C., Bartoo, M.L., White, D.C.S., Sparrow, J.C., and Molloy, J.E. (1998).
The stiffness of rabbit skeletal actomyosin cross-bridges determined with an
optical tweezers transducer. Biophys. J. 75, 1424–1438.
Wang, X., and Schwarz, T.L. (2009). The mechanism of Ca2+ -dependent
regulation of kinesin-mediated mitochondrial motility. Cell 136, 163–174.
Weber, S.C., Spakowitz, A.J., and Theriot, J.A. (2012). Nonthermal ATP-
dependent fluctuations contribute to the in vivo motion of chromosomal loci.
Proc. Natl. Acad. Sci. USA 109, 7338–7343.
Wilhelm, C. (2008). Out-of-equilibrium microrheology inside living cells. Phys.
Rev. Lett. 101, 028101.
Wu, P.H., Hale, C.M., Chen, W.C., Lee, J.S.H., Tseng, Y., and Wirtz, D. (2012).
High-throughput ballistic injection nanorheology to measure cell mechanics.
Nat. Protoc. 7, 155–170.
Yamada, S., Wirtz, D., and Kuo, S.C. (2000). Mechanics of living cells
measured by laser tracking microrheology. Biophys. J. 78, 1736–1747.
Zhou, E.H., Trepat, X., Park, C.Y., Lenormand, G., Oliver, M.N., Mijailovich,
S.M., Hardin, C., Weitz, D.A., Butler, J.P., and Fredberg, J.J. (2009). Universal
behavior of the osmotically compressed cell and its analogy to the colloidal
glass transition. Proc. Natl. Acad. Sci. USA 106, 10632–10637.