probing the severe haze pollution in three typical regions
TRANSCRIPT
lable at ScienceDirect
Atmospheric Environment 120 (2015) 76e88
Contents lists avai
Atmospheric Environment
journal homepage: www.elsevier .com/locate/atmosenv
Probing the severe haze pollution in three typical regions of China:Characteristics, sources and regional impacts
Qiongzhen Wang a, d, Guoshun Zhuang a, *, Kan Huang b, **, Tingna Liu a, Congrui Deng a,Jian Xu a, Yanfen Lin c, Zhigang Guo a, Ying Chen a, Qingyan Fu c, Joshua S. Fu b,Jiakuan Chen d
a Center for Atmospheric Chemistry Study, Department of Environmental Science and Engineering, Fudan University, Shanghai, 200433, PR Chinab Department of Civil and Environmental Engineering, University of Tennessee, Knoxville, TN, 37996, USAc Shanghai Environmental Monitoring Center, Shanghai, 200030, PR Chinad School of Life Sciences, Fudan University, Shanghai, 200433, PR China
h i g h l i g h t s
� Contrasting characteristics of aerosol at three regions in a severe haze event.� First observation of aerosol over East China Sea impacted by inland emissions.� Important role of vehicular emission in triggering the heavy haze.
a r t i c l e i n f o
Article history:Received 22 February 2015Received in revised form12 August 2015Accepted 25 August 2015Available online 28 August 2015
Keywords:HazeSourcesFormation processRegional transport
* Corresponding author.** Corresponding author.
E-mail addresses: [email protected] (G.(K. Huang).
http://dx.doi.org/10.1016/j.atmosenv.2015.08.0761352-2310/© 2015 Elsevier Ltd. All rights reserved.
a b s t r a c t
PM2.5 with its major chemical components were measured and analyzed during a concurrent haze in Jan.1e19, 2013 at three sites (Shanghai, Beijing, and Huaniao, a remote isle over the East China Sea) to probethe sources and formation process of such a severe haze over three typical regions in China. The meanPM2.5 concentrations during the severely polluted days reached 180.8 mg m�3, 299.2 mg m�3, and131.1 mg m�3 in Shanghai, Beijing, and the Huaniao Isle, respectively. The mass ratio of the sum of SO4
2�,NO3
�, and NH4þ to PM2.5 were over 1/3 during the polluted days at all the three sites. Promoted gas-to-
particle transformations from acidic SO2 and NOx to SO42� and NO3
� under high relative humidityconditions played a major role in the formation of this severe haze. Significant contribution of trafficemissions to the haze formation over China was suggested to be one of the major sources in triggeringthe heavy haze over China. Specifically, there was a more contribution from traffic in Shanghai than inBeijing as indicated by the higher NO3
�=SO42� ratio in Shanghai. In Beijing, the enhanced coal com-
bustion for winter heating along with the traffic emission was suggested to be the major two sources ofthis haze episode. Typical pollution elements such as As, Cd, and Pb as well as Cl� and Kþ were sub-stantially enhanced in the severely polluted days. Although the Huaniao Isle is located in the remoteoceanic area as a background site, pollution elements, secondary ions, and Kþ all increased substantiallyduring the polluted days. As visualized by the backward air mass trajectories associated with the po-tential source region identification technique, air masses that passed over Northern China and YangtzeRiver Delta evidently invaded the offshore areas of Eastern China. The ratios of As, Cd, Cu, Zn, and Kþ to Alat the Huaniao Isle were closer to those of Beijing rather than Shanghai, indicating that the marineaerosol over the East China Sea had been significantly polluted via the long-range transport of anthro-pogenic pollutants originating from Northern China.
© 2015 Elsevier Ltd. All rights reserved.
Zhuang), [email protected]
1. Introduction
Haze, mostly caused by high concentrations of fine particles inatmosphere, has attracted worldwide attention in recent years due

Q. Wang et al. / Atmospheric Environment 120 (2015) 76e88 77
to its adverse effects on visibility (Chen et al., 2003), public health(Zhang et al., 2014b), and climate change (Menon et al., 2002). Dueto the rapid economic development, urbanization, and motoriza-tion, haze frequently occurred in China during the past decade,especially in those densely populated regions such as the Bei-jingeTianjineHebei region (BTH), the Yangtze River Delta (YRD),and the Pearl River Delta (PRD). Since January 2013, several severehaze episodes occurred over Northern and Eastern China. PM2.5concentrations in these episodes were in hazardous levels thatdirectly threatened transportation and public health. Thus, itshould be urgent to understand the sources and formation mech-anisms of haze and assess its impacts on human health and climatechange for the purpose of sound emissions control strategies.
Haze is closely related to the large emissions of sulfur dioxide(SO2), nitrogen oxides (NOx), volatile organic compounds (VOCs),and particulate matter (PM) from anthropogenic activities such asindustries, traffic transportation, power plants, and biomassburning. In China, coal is the dominant fuel used for energy pro-duction, and coal combustion is the major source of SO2 emissions.Meanwhile, the rapid increase of motor vehicles has become amoreand more significant contributor to the NOx and PM emissions inurban areas (Lang et al., 2012). The dominant sources and formationmechanisms of haze vary among different seasons. The openburning of biomass contributes significantly to the haze pollutionduring the post-harvest seasons, i.e., MayeJune and OctobereNo-vember (Cheng et al., 2014; Huang et al., 2012), while coal com-bustion plays a major role in the formation of haze in winter,particularly in those areas where coal is largely used for heating(Sun et al., 2013b; Zhao et al., 2013b). The gas-to-particle trans-formation of those pollution gases SO2, NOx, and VOCs is anothermajor factor influencing the formation of haze. During haze epi-sodes, secondary components NO3
�, SO42�, NH4
þ together withorganic matter always substantially increase (Zhao et al., 2013c),and become the most abundant components in aerosols (Kanget al., 2004; Tan et al., 2009). The sum of NO3
�, SO42�, and NH4
þ
can even account for 77% of the total PM2.5 mass during haze days(Huang et al., 2012). Over the North China Plain, it is found that thereaction of photo-excited NO2
* with water vapor, the NO2 hetero-geneous reactions on aerosol surfaces, and direct emissions ofnitrous acid (HONO) play an important role in the formation ofNO3
� and NH4þ (An et al., 2013) and visibility degradation (Li et al.,
2014). Heterogeneous chemical processing could change theoxidizing capacity of the atmosphere, aerosol chemical composi-tion as well as optical properties (Zhu et al., 2010). In addition,unfavorable meteorological conditions can easily trigger the for-mation of haze (Meng et al., 2000; Sun et al., 2006). Haze frequentlyoccurs under stagnant weather conditions where atmosphericpollutants are trapped and substantially increased (Zhang et al.,2014a; Zhao et al., 2013c). Meanwhile, high relative humidity fa-vors the gas-to-particle transformation of pollution gases (Sunet al., 2013a), which contributes significantly to haze pollution.
Haze pollution is not a local environmental issue. Both localemission and regional transport contribute to haze formation. Dueto the East Asian monsoon, air pollutants can be transported faraway and impact greatly on the air quality of those downstreamareas (Hsu et al., 2009). Along with the regional transport of airpollutants, haze pollution can be geographically extended even tothose areas with few local pollution emissions (Zhao et al., 2013c).
In January 2013, an extremely severe haze shrouded overnorthern and eastern China, which lasted for about a week fromJan. 9 to 16. During this episode, the hourly PM2.5 concentrations inmany cities much exceeded the upper limit of the Air Quality Index,and the visibility was extremely low that caused cancellation offlights (http://www.theguardian.com/world/2013/feb/16/chinese-struggle-through-airpocalypse-smog). This severe haze pollution
has attracted great attentions of the public, government, and at-mospheric researchers in China. Zhang et al. (2014a) studied themeteorological conditions during this haze pollution, and the re-sults showed that a weak East Asian winter monsoon existed inJanuary and the weakened surface winds favored the formation offog and haze in eastern China. Based on an intensive aerosol andtrace gases observation at eleven sites, Wang et al. (2014c) identi-fied this haze episode over BTH. The quick transformation ofpollution gases to aerosols was suggested to be the internal cause ofthis severe haze pollution. In Beijing, high sulfur and nitrogenoxidation ratios were found, further indicating that the secondarytransformation was a major contributor to the haze formation (Jiet al., 2014). With ACSM (Aerosol Chemical Speciation Monitor)observation, Sun et al. (2014) investigated the sources and chemicalevolution of this haze over Beijing, and the results showed coalcombustionwas the largest source of primary organic aerosol (OA),which on average accounted for 20e32% of OA, and regionaltransport contributed significantly to the formation of this haze.Model simulation also indicated that regional transport played animportant role in the formation of this regional haze over BTH(Wang et al., 2014b, 2014d). During Jan. 14e16, 2013, about 25% ofthe elemental carbon particles in Nanjing were from the regionaltransport (Wang et al., 2014a).
Most studies related to this notorious haze focused on onespecific site, e.g. Beijing. However, this haze was evidently not alocal phenomenon but had much more profound influences in awidespread regional scale that the coverage of this haze reachedover 1.4 million km2 of China's territory. The extent of the regionalimpacts of such a haze and how this severe haze could impact onsuch a wide region has been rarely reported. In this regard, weinvestigate this notorious haze that hovered over a large geographicregion at three monitoring sites, including two urban sites, i.e.Beijing, Shanghai, and a remote site over the East China Sea, theHuaniao Isle. PM2.5 with its major chemical components weremeasured and analyzed during this concurrent severe haze in Jan.1e19, 2013 synchronously at these three sites to reveal the sourceand formation process of such a severe haze in the three typicalregions in China. In particular, the relative contributions of sta-tionary vs. mobile sources and regional transport of air pollutantswere explored.
2. Method
2.1. Field observation
PM2.5 samples were collected in Shanghai (a representative siteof the Yangtze River Delta region), Beijing (a representative site ofthe BeijingeTianjineHebei region), and the Huaniao Isle over theEast China Sea (a representative site of the remote areas over theocean) during Jan. 1e19, 2013. The locations and the detailed in-formation of the three sampling sites are marked in Fig. 1 andpresented in Table 1. Aerosol samples were collected for 24 h(normally from 10:00 AM to 10:00 AM of the next day) on What-man 41 filters (Whatman Inc., Maidstone, UK) by medium-volumesamplers (Qingdao Hengyuan Science &Technology DevelopmentCo., Ltd.; model: HY-100 PM2.5; flow rate: 100 l min�1). Moresamples were collected in those severe haze days. All the sampleswere put in polyethylene plastic bags immediately after samplingand then reserved in a refrigerator. All the filters were weighedbefore and after sampling using an analytical balance (model:Sartorius 2004MP; reading precision: 10 mg) after stabilizing underconstant temperature (20 ± 1 �C) and humidity (40 ± 2%) in achamber for over 48 h. All the procedures were strictly qualitycontrolled to avoid the possible contamination of the samples.
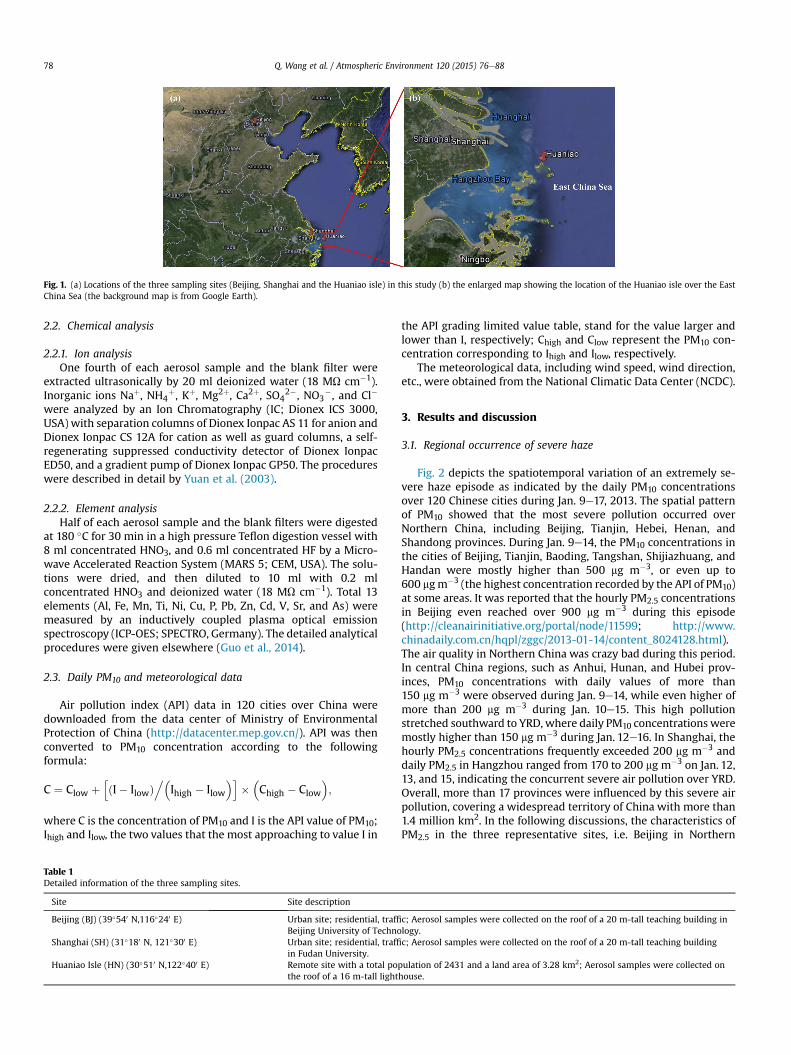
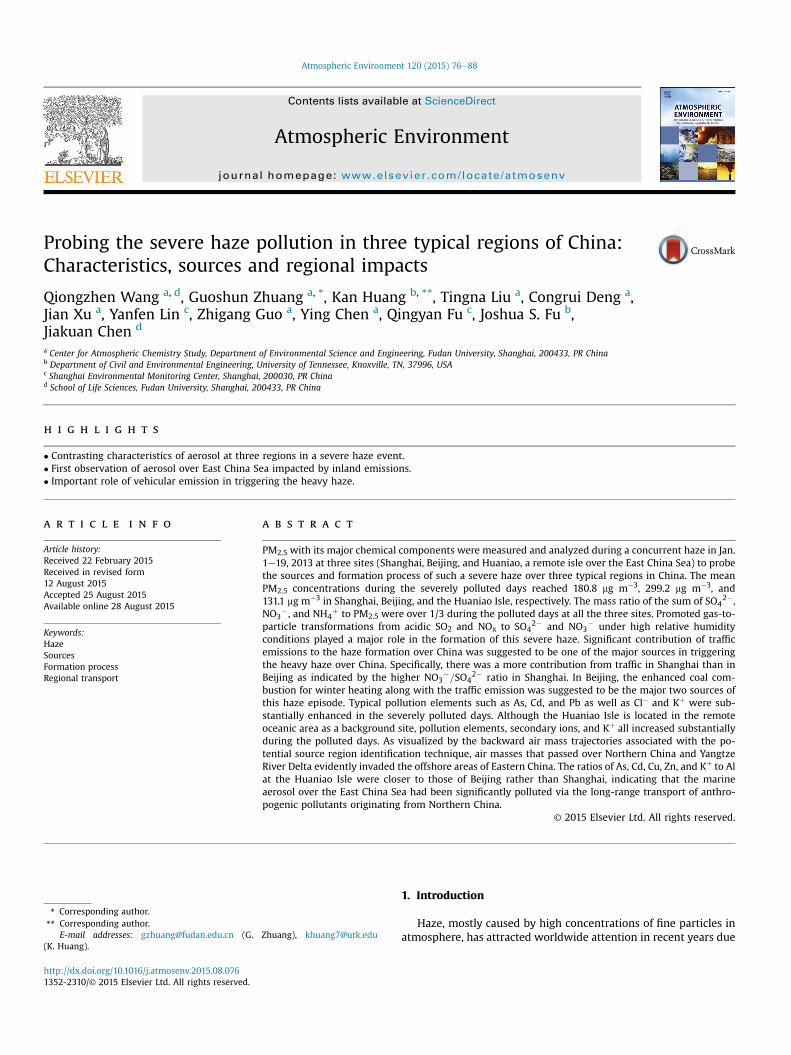
Fig. 1. (a) Locations of the three sampling sites (Beijing, Shanghai and the Huaniao isle) in this study (b) the enlarged map showing the location of the Huaniao isle over the EastChina Sea (the background map is from Google Earth).
Q. Wang et al. / Atmospheric Environment 120 (2015) 76e8878
2.2. Chemical analysis
2.2.1. Ion analysisOne fourth of each aerosol sample and the blank filter were
extracted ultrasonically by 20 ml deionized water (18 MU cm�1).Inorganic ions Naþ, NH4
þ, Kþ, Mg2þ, Ca2þ, SO42�, NO3
�, and Cl�
were analyzed by an Ion Chromatography (IC; Dionex ICS 3000,USA) with separation columns of Dionex Ionpac AS 11 for anion andDionex Ionpac CS 12A for cation as well as guard columns, a self-regenerating suppressed conductivity detector of Dionex IonpacED50, and a gradient pump of Dionex Ionpac GP50. The procedureswere described in detail by Yuan et al. (2003).
2.2.2. Element analysisHalf of each aerosol sample and the blank filters were digested
at 180 �C for 30 min in a high pressure Teflon digestion vessel with8 ml concentrated HNO3, and 0.6 ml concentrated HF by a Micro-wave Accelerated Reaction System (MARS 5; CEM, USA). The solu-tions were dried, and then diluted to 10 ml with 0.2 mlconcentrated HNO3 and deionized water (18 MU cm�1). Total 13elements (Al, Fe, Mn, Ti, Ni, Cu, P, Pb, Zn, Cd, V, Sr, and As) weremeasured by an inductively coupled plasma optical emissionspectroscopy (ICP-OES; SPECTRO, Germany). The detailed analyticalprocedures were given elsewhere (Guo et al., 2014).
2.3. Daily PM10 and meteorological data
Air pollution index (API) data in 120 cities over China weredownloaded from the data center of Ministry of EnvironmentalProtection of China (http://datacenter.mep.gov.cn/). API was thenconverted to PM10 concentration according to the followingformula:
C ¼ Clow þhðI� IlowÞ
.�Ihigh � Ilow
�i��Chigh � Clow
�;
where C is the concentration of PM10 and I is the API value of PM10;Ihigh and Ilow, the two values that the most approaching to value I in
Table 1Detailed information of the three sampling sites.
Site Site description
Beijing (BJ) (39�540 N,116�240 E) Urban site; residential, traffiBeijing University of Techno
Shanghai (SH) (31�180 N, 121�300 E) Urban site; residential, traffiin Fudan University.
Huaniao Isle (HN) (30�510 N,122�400 E) Remote site with a total popthe roof of a 16 m-tall light
the API grading limited value table, stand for the value larger andlower than I, respectively; Chigh and Clow represent the PM10 con-centration corresponding to Ihigh and Ilow, respectively.
The meteorological data, including wind speed, wind direction,etc., were obtained from the National Climatic Data Center (NCDC).
3. Results and discussion
3.1. Regional occurrence of severe haze
Fig. 2 depicts the spatiotemporal variation of an extremely se-vere haze episode as indicated by the daily PM10 concentrationsover 120 Chinese cities during Jan. 9e17, 2013. The spatial patternof PM10 showed that the most severe pollution occurred overNorthern China, including Beijing, Tianjin, Hebei, Henan, andShandong provinces. During Jan. 9e14, the PM10 concentrations inthe cities of Beijing, Tianjin, Baoding, Tangshan, Shijiazhuang, andHandan were mostly higher than 500 mg m�3, or even up to600 mgm�3 (the highest concentration recorded by the API of PM10)at some areas. It was reported that the hourly PM2.5 concentrationsin Beijing even reached over 900 mg m�3 during this episode(http://cleanairinitiative.org/portal/node/11599; http://www.chinadaily.com.cn/hqpl/zggc/2013-01-14/content_8024128.html).The air quality in Northern China was crazy bad during this period.In central China regions, such as Anhui, Hunan, and Hubei prov-inces, PM10 concentrations with daily values of more than150 mg m�3 were observed during Jan. 9e14, while even higher ofmore than 200 mg m�3 during Jan. 10e15. This high pollutionstretched southward to YRD, where daily PM10 concentrations weremostly higher than 150 mg m�3 during Jan. 12e16. In Shanghai, thehourly PM2.5 concentrations frequently exceeded 200 mg m�3 anddaily PM2.5 in Hangzhou ranged from 170 to 200 mg m�3 on Jan. 12,13, and 15, indicating the concurrent severe air pollution over YRD.Overall, more than 17 provinces were influenced by this severe airpollution, covering a widespread territory of China with more than1.4 million km2. In the following discussions, the characteristics ofPM2.5 in the three representative sites, i.e. Beijing in Northern
c; Aerosol samples were collected on the roof of a 20 m-tall teaching building inlogy.c; Aerosol samples were collected on the roof of a 20 m-tall teaching building
ulation of 2431 and a land area of 3.28 km2; Aerosol samples were collected onhouse.

Fig. 2. PM10 concentration (mg m�3) in 120 cities over China during Jan. 9e17 (PM10 concentration and the corresponding air pollution level are presented in color. Blue, green,yellow, cyan, khaki, red, and purple present excellent, good, slightly polluted, lightly polluted, moderately polluted, heavily polluted, and severely polluted day, respectively, whenthe PM10 concentrations are in the range of 0e0.05 mg m�3, 0.05e0.15 mg m�3, 0.15e0.25 mg m�3, 0.15e0.35 mg m�3, 0.35e0.385 mg m�3, 0.385e0.42 mg m�3, >0.42 mg m�3,according to the air pollution index.). (For interpretation of the references to color in this figure caption, the reader is referred to the web version of this article.)
Q. Wang et al. / Atmospheric Environment 120 (2015) 76e88 79
China, Shanghai in Eastern China, and a remote site, the HuaniaoIsle over the East China Sea, were analyzed to reveal the sourcesand formation processes of this severe episode.
Fig. 3 shows the time series of daily PM2.5 and major meteoro-logical parameters from Jan.1e19 in Shanghai (SH), Beijing (BJ), andthe Huaniao Isle (HN), respectively. According to the Chinese Na-tional Air Quality Standards II (the daily average of 75 mg m�3 is thethreshold), daily PM2.5 concentrations lower than 75 mg m�3 wereregarded as normal days (ND), i.e. Jan. 3e10 (excluding the rainydays on Jan. 6e7) in Shanghai (ND_SH), Jan. 1e5 in Beijing (ND_BJ),and Jan. 1e11 (excluding the rainy days on Jan 6e7 and 9) at theHuaniao Isle (ND_HN). In Shanghai, Jan. 12e15 was identified as themost severe air pollution days (PD_SH), when the visibility wasmostly below 5 kmwith themean PM2.5 concentration of as high as180.8 mg m�3 (Fig. 3a), more than twice of Chinese National AirQuality Standards II. On the first day of SH_PD (Jan. 12), weak wind(2.0 ± 1.0 m s�1) was observed and PM2.5 concentration reached201.2 mg m�3. On Jan. 14 when the wind speed increased to3.1 ± 1.3m s�1, PM2.5 showed a corresponding drop to 129.1 mgm�3.During these days, winds mainly prevailed from the north, north-west and northeast. On Jan. 16 when the wind direction changedfrom the south with increased wind speed of 4.8 ± 0.7 m s�1, hourlyPM2.5 increased again to be higher than 200 mg m�3, implyingdifferent sources for haze among the days during PD_SH. Overall,the mean relative humidity, wind speed, and mixing height duringPD_SH reached 79.9%, 3.0 m s�1, and 386 m, indicating more
unfavorable synoptic condition as compared to those of 70.1%, 3.8m s�1, and 652 m during ND_SH.
In Beijing (Fig. 3b), the wind speed decreased from4.4 ± 2.3m s�1 on Jan. 8 to 2.1 ± 1.2 m s�1 on Jan. 9, correspondinglythe PM2.5 concentration increased from 40.1 mgm�3 to 92.7 mg m�3.In the meantime, wind direction changed from north and northeastto southwest, potentially bringing air pollutants from Beijing'sneighboring Hebei province, which had been highly polluted due tointense local industrial activities (Wang et al., 2014d). On the earlymorning of Jan.10, visibility rapidly degraded to be lower than 5 km(mostly lower than 2 km) with greatly enhanced humidity.Accordingly, the PM2.5 concentration sharply increased to be286.9 mg m�3, and stayed at high concentrations of more than200 mg m�3 until Jan. 13, with a maximum of 413.0 mg m�3 on Jan.12. Jan. 10e13 was identified as the most severely polluted days inBeijing (PD_BJ). During this period, the mean mixing layer heightwas only 133 m with high relative humidity of 77.6%, which wasattributed to the frequent occurrences of fog events (Sun et al.,2014; Huang et al., 2014). The mean PM2.5 concentration duringPD_BJ reached 299.2 mg m�3, which was about 7 times of thatduring ND_BJ (43.3 mgm�3), andmore than 8 times of U.S. EPA dailystandard (35 mg m�3) and 4 times of Chinese National Air QualityStandards II, revealing the air quality was extremely severe duringthis period.
Compared to the severe air pollution of these mega-cities, theHuaniao Isle evidently showed much better air quality considering
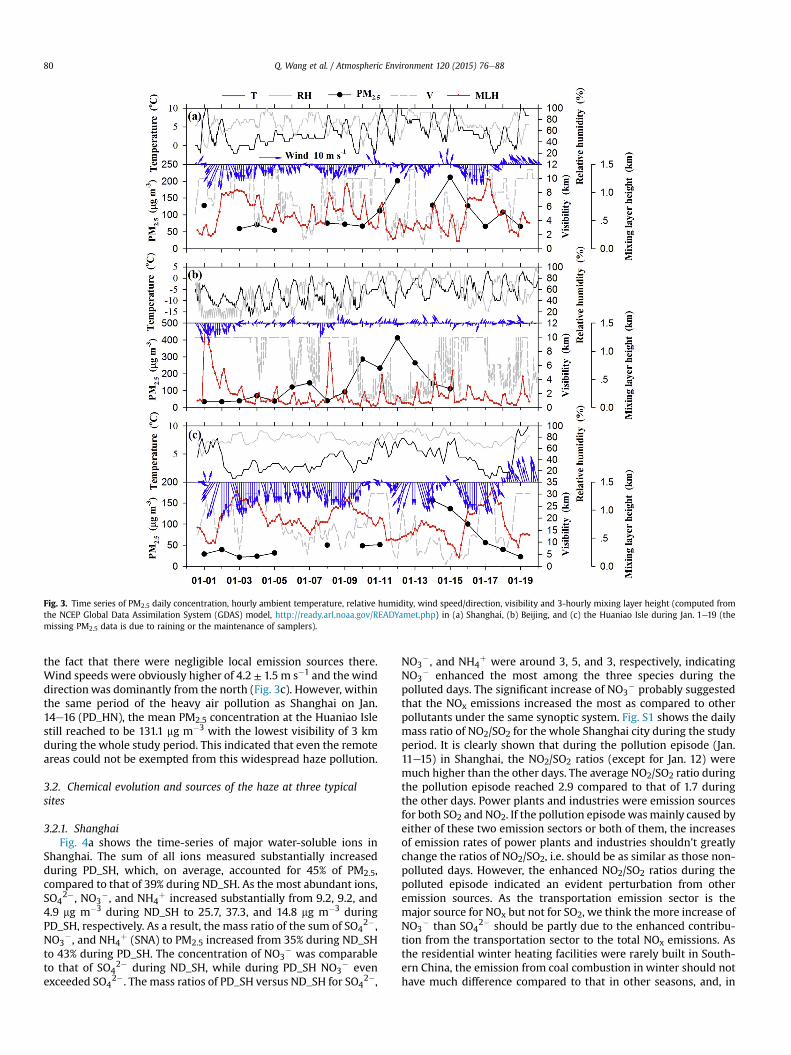
Fig. 3. Time series of PM2.5 daily concentration, hourly ambient temperature, relative humidity, wind speed/direction, visibility and 3-hourly mixing layer height (computed fromthe NCEP Global Data Assimilation System (GDAS) model, http://ready.arl.noaa.gov/READYamet.php) in (a) Shanghai, (b) Beijing, and (c) the Huaniao Isle during Jan. 1e19 (themissing PM2.5 data is due to raining or the maintenance of samplers).
Q. Wang et al. / Atmospheric Environment 120 (2015) 76e8880
the fact that there were negligible local emission sources there.Wind speeds were obviously higher of 4.2 ± 1.5 m s�1 and the winddirectionwas dominantly from the north (Fig. 3c). However, withinthe same period of the heavy air pollution as Shanghai on Jan.14e16 (PD_HN), the mean PM2.5 concentration at the Huaniao Islestill reached to be 131.1 mg m�3 with the lowest visibility of 3 kmduring the whole study period. This indicated that even the remoteareas could not be exempted from this widespread haze pollution.
3.2. Chemical evolution and sources of the haze at three typicalsites
3.2.1. ShanghaiFig. 4a shows the time-series of major water-soluble ions in
Shanghai. The sum of all ions measured substantially increasedduring PD_SH, which, on average, accounted for 45% of PM2.5,compared to that of 39% during ND_SH. As the most abundant ions,SO4
2�, NO3�, and NH4
þ increased substantially from 9.2, 9.2, and4.9 mg m�3 during ND_SH to 25.7, 37.3, and 14.8 mg m�3 duringPD_SH, respectively. As a result, the mass ratio of the sum of SO4
2�,NO3
�, and NH4þ (SNA) to PM2.5 increased from 35% during ND_SH
to 43% during PD_SH. The concentration of NO3� was comparable
to that of SO42� during ND_SH, while during PD_SH NO3
� evenexceeded SO4
2�. The mass ratios of PD_SH versus ND_SH for SO42�,
NO3�, and NH4
þ were around 3, 5, and 3, respectively, indicatingNO3
� enhanced the most among the three species during thepolluted days. The significant increase of NO3
� probably suggestedthat the NOx emissions increased the most as compared to otherpollutants under the same synoptic system. Fig. S1 shows the dailymass ratio of NO2/SO2 for the whole Shanghai city during the studyperiod. It is clearly shown that during the pollution episode (Jan.11e15) in Shanghai, the NO2/SO2 ratios (except for Jan. 12) weremuch higher than the other days. The average NO2/SO2 ratio duringthe pollution episode reached 2.9 compared to that of 1.7 duringthe other days. Power plants and industries were emission sourcesfor both SO2 and NO2. If the pollution episodewasmainly caused byeither of these two emission sectors or both of them, the increasesof emission rates of power plants and industries shouldn't greatlychange the ratios of NO2/SO2, i.e. should be as similar as those non-polluted days. However, the enhanced NO2/SO2 ratios during thepolluted episode indicated an evident perturbation from otheremission sources. As the transportation emission sector is themajor source for NOx but not for SO2, we think the more increase ofNO3
� than SO42� should be partly due to the enhanced contribu-
tion from the transportation sector to the total NOx emissions. Asthe residential winter heating facilities were rarely built in South-ern China, the emission from coal combustion in winter should nothave much difference compared to that in other seasons, and, in
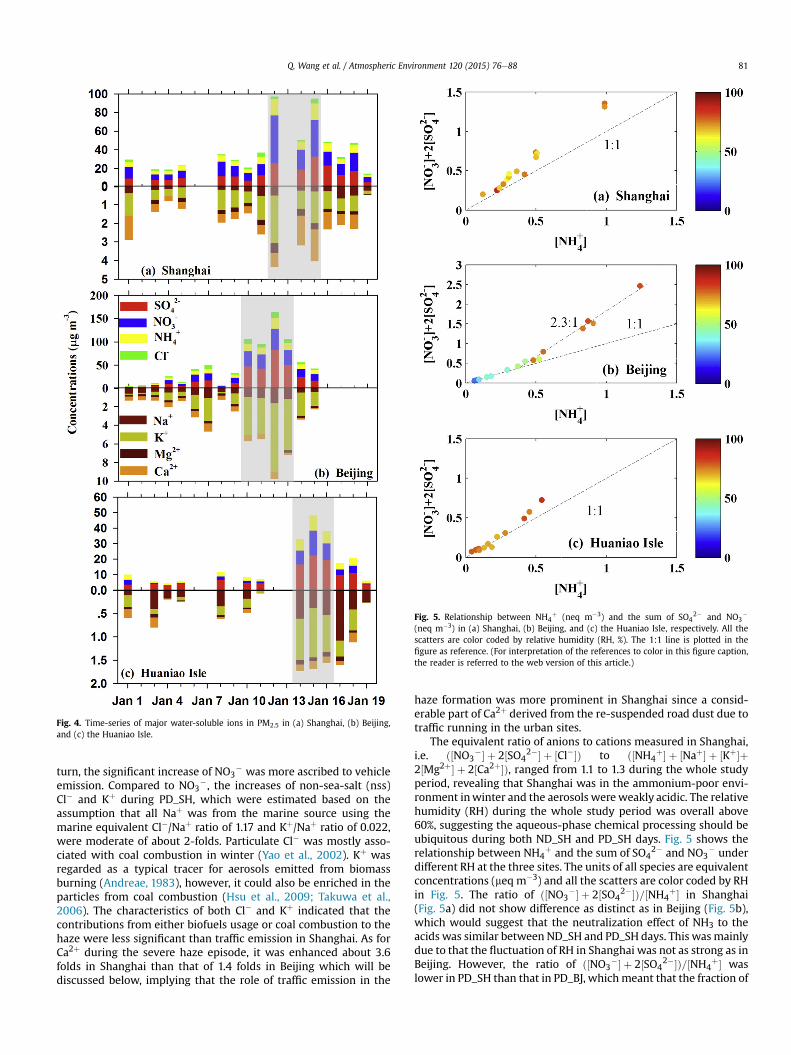
Fig. 4. Time-series of major water-soluble ions in PM2.5 in (a) Shanghai, (b) Beijing,and (c) the Huaniao Isle.
Fig. 5. Relationship between NH4þ (neq m�3) and the sum of SO4
2� and NO3�
(neq m�3) in (a) Shanghai, (b) Beijing, and (c) the Huaniao Isle, respectively. All thescatters are color coded by relative humidity (RH, %). The 1:1 line is plotted in thefigure as reference. (For interpretation of the references to color in this figure caption,the reader is referred to the web version of this article.)
Q. Wang et al. / Atmospheric Environment 120 (2015) 76e88 81
turn, the significant increase of NO3� was more ascribed to vehicle
emission. Compared to NO3�, the increases of non-sea-salt (nss)
Cl� and Kþ during PD_SH, which were estimated based on theassumption that all Naþ was from the marine source using themarine equivalent Cl�/Naþ ratio of 1.17 and Kþ/Naþ ratio of 0.022,were moderate of about 2-folds. Particulate Cl� was mostly asso-ciated with coal combustion in winter (Yao et al., 2002). Kþ wasregarded as a typical tracer for aerosols emitted from biomassburning (Andreae, 1983), however, it could also be enriched in theparticles from coal combustion (Hsu et al., 2009; Takuwa et al.,2006). The characteristics of both Cl� and Kþ indicated that thecontributions from either biofuels usage or coal combustion to thehaze were less significant than traffic emission in Shanghai. As forCa2þ during the severe haze episode, it was enhanced about 3.6folds in Shanghai than that of 1.4 folds in Beijing which will bediscussed below, implying that the role of traffic emission in the
haze formation was more prominent in Shanghai since a consid-erable part of Ca2þ derived from the re-suspended road dust due totraffic running in the urban sites.
The equivalent ratio of anions to cations measured in Shanghai,i.e. ð½NO3
�� þ 2½SO42�� þ ½Cl��Þ to ð½NH4
þ� þ ½Naþ� þ ½Kþ�þ2½Mg2þ� þ 2½Ca2þ�Þ, ranged from 1.1 to 1.3 during the whole studyperiod, revealing that Shanghai was in the ammonium-poor envi-ronment inwinter and the aerosols were weakly acidic. The relativehumidity (RH) during the whole study period was overall above60%, suggesting the aqueous-phase chemical processing should beubiquitous during both ND_SH and PD_SH days. Fig. 5 shows therelationship between NH4
þ and the sum of SO42� and NO3
� underdifferent RH at the three sites. The units of all species are equivalentconcentrations (meq m�3) and all the scatters are color coded by RHin Fig. 5. The ratio of ð½NO3
�� þ 2½SO42��Þ=½NH4
þ� in Shanghai(Fig. 5a) did not show difference as distinct as in Beijing (Fig. 5b),which would suggest that the neutralization effect of NH3 to theacids was similar between ND_SH and PD_SH days. This wasmainlydue to that the fluctuation of RH in Shanghai was not as strong as inBeijing. However, the ratio of ð½NO3
�� þ 2½SO42��Þ=½NH4
þ� waslower in PD_SH than that in PD_BJ, whichmeant that the fraction of

Fig. 6. Enrichment factors (EFs) of elements in normal days (ND) and in the severelypolluted days (PD) in Shanghai (SH), Beijing (BJ), and the Huaniao Isle (HN).
Q. Wang et al. / Atmospheric Environment 120 (2015) 76e8882
those acidic components, e.g. HNO3 and H2SO4, the oxidationproducts from NOx and SO2, neutralized by NH3 was greater inShanghai than in Beijing during the severe haze period. For SO2 ismostly from coal combustion, less emission from coal combustionin winter in Shanghai than in Beijing should be mainly responsiblefor the lower ratio of ð½NO3
�� þ 2½SO42��Þ=½NH4
þ� in Shanghai.Enrichment factors (EFs) of trace elements are good indicators
pinpointing the extent of air pollutants accumulation as elements
Fig. 7. Ratios of mean concentrations of ions and elements in the severely polluted d
are almost all subject to primary emissions. EF is defined as EF¼ (X/XRef)aerosol/(X/XRef)crust, where (X/XRef)aerosol and (X/XRef)crust are themass concentration ratios of an element interested, X, to a refer-ence element, XRef, in aerosol and in crust (Lida, 2006), respectively.Al is the reference element used in this study. Fig. 6 shows theaverage EFs in the normal days (ND) and in the severely polluteddays (PD). Those typical elements measured could be classified intotwo categories: 1) The EFs of Fe, Ti, and Sr weremostly lower than 5during both ND and PD days at all the three sites. These elements,together with Al, were classified to be crustal elements. 2) The EFsof elements As, Cd, Cu, Mn, Ni, Pb, V, and Zn, were higher than 10,suggesting these elements were moderately or severely influencedby anthropogenic sources and these eight elements were classifiedto be pollution elements.
Fig. 7 shows the ratios of the mean concentrations of ions andelements in PD to those in ND, i.e. PD/ND. In Shanghai, the meanconcentrations of pollution elements As, Cd, Cu, Mn, Pb, and Znreached 21.0 ng m�3, 2.1 ng m�3, 31.3 ng m�3, 0.1 mg m�3,0.2 mg m�3, and 0.5 mg m�3 in PD_SH, 3e6 times of those in ND_SH(Fig. 7a). The EFs of As, Cd, Cu, Pb, and Zn also increased to 50e5000(Fig. 6). Coal combustion was the major source of As, Cd, and Pb(Duan and Tan, 2013; Tian et al., 2012, 2010), while Zn and Cu weremostly associated with traffic emission (Tanner et al., 2008) andindustrial emission (Cheng et al., 2012), and Mn was associatedwith metallurgical process (Sun et al., 2004). Thus, the enhance-ments of these pollution elements were indicative of emissionsources from coal combustion, vehicles, and industries. The crustalelements, Al, Fe, Ti, and Sr, in Shanghai were also enhanced during
ays to those in normal days in (a) Shanghai, (b) Beijing, and (c) the Huaniao Isle.

Q. Wang et al. / Atmospheric Environment 120 (2015) 76e88 83
those severely polluted days. This would further corroborate thatthe traffic emissionwas indeed a significant source as traffic activitycould re-suspend the road dust and in turn increase the level ofthese crustal elements in the aerosols. Ni and V also increased inPD_SH with the moderate EFs of 10e25. It must be noted that themean concentrations of Ni and V in PD_SH were 8.9 and14.7 ng m�3, even higher than those of 6.7 and 6.7 ng m�3 in PD_BJ.This was probably due to the contribution from the ship emission,as Ni and V were its typical tracers (Zhao et al., 2013a). TheShanghai Port has become the world's busiest container port since2010 and ship emissions acted potentially as one of the majorsources of the air pollution in Shanghai (Yang et al., 2007). Themassratios of V/Ni were ~1.5 in both ND_SH and PD_SH, close to that(1.9) in heavy fuel oil used mostly in the domestic ships (Zhao et al.,2013a), suggesting the additional contribution from ship emissionsto the haze over Shanghai.
3.2.2. BeijingIn Beijing, in consistent with the sharp increase of PM2.5 during
PD_BJ, the sum of all ions measured substantially increased to125.0 mg m�3 on average, accounting for 42% of PM2.5, comparedto that of 14.3 mg m�3 during ND_BJ accounting for 31% of PM2.5. Inparticular, secondary inorganic species SO4
2�, NO3�, and NH4
þ
were significantly enhanced during PD_BJ (Fig. 4b) with meanconcentrations of 56.1, 34.9, and 17.3 mg m�3, respectively, about12, 9, and 6 times of those during ND_BJ. In the meantime, themass ratio of SNA to PM2.5 also increased significantly from 24%during ND_BJ to 36% during PD_BJ. It was apparent that enhancedgas-to-particle transformation from SO2 and NOx to SO4
2� andNO3
� was one of the major causes of the extremely high PM2.5concentrations. As the most abundant species among SNA, SO4
2�
contributed about 50% to SNA and 19% to PM2.5 during PD_BJ. Evenduring ND_BJ, SO4
2� could contribute 44% to SNA and 10% toPM2.5. Winter is the heating season in Northern China, thus, theenhanced coal combustion for residential heating was responsiblefor the high yields of SO2 and NOx. Significant increase of Cl� wasalso observed from 1.5 mg m�3, on average, during ND_BJ to9.5 mg m�3 during PD_BJ, indicating that coal combustion playedan important role in the haze formation during PD_BJ. It is notedthat Cl� in Beijing during PD_BJ was more than 3 times of nss-Cl�
in Shanghai during PD_SH (2.1 mg m�3). In the meantime, the massratio of nss-Cl� to PM2.5 in Beijing reached ~4% during PD_BJ and~3% during ND_BJ, much higher than that of ~1% in Shanghai.These were attributed to the larger coal consumption for resi-dential heating in Northern China.
Kþ was also substantially enhanced during PD_BJ (Fig. 4b). Theratio of Kþ in PD_BJ to that in ND_BJ reached up to 14, even higherthan the ratio of SNA between the two periods (Fig. 7b). Kþ reached7.4 mg m�3 on Jan. 12, the highest daily concentration in the wholestudy period, which was comparable to the Kþ concentration in apollution episode dominated by biomass burning (Huang et al.,2012). As mentioned above, particle Kþ was could be enriched inthe particles either from biomass burning or coal combustion, thusthe high Kþ concentrations during PD_BJ might be attributed tothese two emission sources. The biofuels were widely used forresidential cooking and heating in the rural areas of China (Mestlet al., 2007), thus biomass burning might be one of the sources ofthe severe haze in this period. However, due to the intense foggyweather (Sun et al., 2014; Huang et al., 2014), the fire spots causedby biomass burning couldn't be detected from the remote sensingtechnique in this case.
The equivalent ratios of ð½NO3�� þ 2½SO4
2��Þ=½NH4þ� were
around 1.0 during ND_BJ (Fig. 5b), indicating sulfate and nitratewere almost fully neutralized by ammonium. During this period,
RHwasmostly below 50%. As RHwas elevated to be above 70%with
an average of (78 ± 3) % during PD_BJ, SO42�, NO3
�, and NH4þ were
consistently enhanced as shown in Fig. 5b. However, the ratio of
ð½NO3�� þ 2½SO4
2��Þ=½NH4þ� largely deviated away from the 1:1 line
but substantially increased to 2.3 during PD_BJ, which indicatedthat in this severe haze episode sulfate and nitrate were far fromfully neutralized due to the ammonium-poor environment in Bei-jing and the aerosol acidity could be much greater than in the
normal days. The ratio of ð½NO3�� þ 2½SO4
2�� þ ½Cl��Þ=ð½NH4
þ� þ ½Naþ� þ ½Kþ� þ 2½Mg2þ� þ 2½Ca2þ�Þ during PD_BJ wascalculated to be (1.7 ± 0.1), much greater than 1.0. This indicatesthat there was indeed a large deficit of cations, which should beattributed to the unmeasured hydrogen ions (Hþ). High amounts ofSO2 and NOx were emitted due to residential heating in winter inNorthern China. In addition, this severe haze episode in Beijing wasassociated with abnormal high humidity (Zhang et al., 2014a),which could accelerate the aqueous-phase chemical process whichwas an effective pathway facilitating the transformation of SO2 andNOx, to be free acids, i.e. H2SO4 and HNO3, via the H2O2/O3 oxida-tion and metal catalysis (e.g. Fe3þ and Mn2þ) (Jacobson, 1997). Byapplying the E-AIM model (Extended Aerosol ThermodynamicsModel, http://www.aim.env.uea.ac.uk/aim/aim.php) which con-
siders a Hþ e NH4þ e Naþ e SO4
2� e NO3� e Cl� e H2O system,
aerosol LWC (Liquid Water Content) could be estimated based onthe aerosol chemistry data measured in this study with the corre-sponding temperature and relative humidity. Fig. S2 shows thetemporal variation of LWC and aerosol acidity ðHþ
AerÞ. HþAer is
calculated from the difference between total equivalent
concentrations of anions and that of cations: HþAer
� � ¼ 2 SO42�
h iþ
NO3�½ � þ Cl�½ � � NH4
þ� �� Naþ� �� Kþ� �� 2 Ca2þ
h i� 2 Mg2þ
h i, the
units of all ions are in molar concentrations (mmol/m3). As shown inFig. S2, LWCs were negligible before Jan. 10 due to that the daily RHvalues were mostly below 50%. The values of Hþ
Aer were alsorelatively low and sometimes were zero (i.e. fully neutralized). Incontrast, LWCs were significantly enhanced since Jan. 10. Thiswould certainly promote the increase of SO2 and NOx uptake, aswell as acceleration of the gaseliquidesolid reactions of SO2 andNO2 on particles, which could further lead to the increased hygro-scopicity of particles. This was corroborated by the sharp increaseof aerosol acidity as shown in Fig. S2 that Hþ
Aer increased 2e10times compared to the less polluted days. In this regard, we thinkthe aqueous-phase reactions associatedwith enhanced LWC shouldhave played an important role in promoting the formation sulfateand nitrate at elevated RH levels.
On the other hand, other meteorological parameters may alsoplay crucial roles in the high yields of secondary aerosols. Fig. S3shows the variations of hourly wind speed and temperature as afunction of relative humidity (RH) during the whole study period inBeijing. All data are binned according to RH (10% increment). It isshown that temperature was relatively constant across different RHlevels, while wind speed showed an evident decrease at higher RHlevels. This probably indicated that the photochemistry was not themajor driver influencing the formation of NO3
� and SO42� during
this period. On the other hand, at higher RH, wind speeds weremuch lower than those at lower RH. The average wind speed at RHof 70e80%, 80e90%, and 90e100% was only 0.8, 0.6, and 0.6 m s�1,respectively, much lower than those under the low RH conditions.It is well known that higher wind speed is especially efficient forcleansing the pollutants. This indicated that the atmospheric con-dition was very stagnant at higher RH, partly accounting for thehigh concentrations of NO3
� and SO42� during the polluted
episode.

Q. Wang et al. / Atmospheric Environment 120 (2015) 76e8884
Finally, as the major neutralizer of acidic species, the NH3emission was at its lowest level as agricultural activities weremostly inactive in winter in Northern China. High yields of sulfateand nitrate far exceeded the amount that the ambient NH3 couldneutralize, resulting in a significant excess of free acids. Hence, theaerosols during this severe air pollution episode in Beijing wereexpected to be highly acidic.
As shown in Fig. 7b, the concentrations of the pollution ele-ments significantly increased in PD_BJ compared to those in ND_BJ.For instance, themean concentrations of As, Cd, Cu, Pb, and Znwere54.8 ng m�3, 4.8 ng m�3, 57.7 ng m�3, 0.5 mg m�3, and 0.8 mg m�3 inPD_BJ, 5e13 times of those in ND_BJ, with the highest daily con-centrations up to 88.9 ng m�3, 6.5 ng m�3, 88.7 ng m�3, 0.7 mg m�3,and 1.1 mg m�3 on Jan. 12, respectively. EFs of As, Cd, Pb, and Znincreased from 200e850 in ND_BJ to 1500e8000 in PD_BJ (Fig. 6),while EF of Cu increased from 31 to 136. Evidently, the pollutionelements in PD_BJ were much more enriched in the severe hazedays. Asmentioned above, coal combustionwas themajor source ofAs, Cd, and Pb, the enhancement of these elements further sug-gested that the residential heating in winter was one of the causesof the highly enriched elements.While the enrichment of Zn and Cuin PD_BJ implied that traffic and industrial emissions were also twoof the possible sources triggering the haze.
3.2.3. Huaniao IsleThe Huaniao Isle is the most eastward site over the East China
Sea as shown in Fig.1b. During ND_HN, the mean concentrations ofSO4
2�, NO3�, and NH4
þ were at low levels of 4.3, 1.3, and1.9 mg m�3, demonstrating the remote characteristics of this site.During PD_HN, significant increases of SO4
2�, NO3�, and NH4
þ
were observed with mean concentrations of 19.5, 11.9, and8.5 mg m�3, respectively. Compared to ND_HN, these three specieswere enhanced over 4, 9, and 4 times, respectively. The enhancedfolds were even higher than that in Shanghai. As a remote oceanicregion where the local emissions were negligible, the abrupt in-crease of secondary aerosols provides strong evidence of invadedpollutants from long/medium-range transport. To exclude thecontribution from marine source to SO4
2� in the aerosols over theHuaniao Isle, nss� SO4
2� could be estimated based on theassumption that all Naþ was from the marine source using themarine SO4
2�=Naþ ratio of 0.25. It was calculated that nss� SO42�
accounted for 99% of the total SO42� during both ND_HN and
PD_HN, indicating that SO42� of the Huaniao Isle was dominantly
contributed by anthropogenic sources. This meant that the marineaerosol at the remote areas over the East China Sea was highlyrelated to the regional and/or long-range transport. SNA accountedfor 24% of PM2.5 during ND_HN and 31% during PD_HN, respec-tively. The mass ratio of SNA to PM2.5 at the Huaniao Isle was closeto that in Beijing, a city far away from the isle, but much lower thanthat in Shanghai, the adjacent city to the isle, which suggested thatthe marine aerosol over the East China Sea was more influenced bythe long-range transport (more discussion in Section 3.3). Also, themean Kþ concentration increased from 0.1 mg m�3 in ND_HN to0.9 mg m�3 in PD_HN, and the nss-Kþ accounted for ~96% of thetotal Kþ in both ND_HN and PD_HN, which indicated that Kþ at theHuaniao Isle was mostly from the regional/long-range transport ofthe anthropogenic emissions in the mainland China.
RH showed the highest values at the Huaniao Isle among thethree sites, ranging from 69% to 86% during the study period andaveraged (80 ± 14)% in PD_HN. The correlation between NH4
þ andð½NO3
�� þ 2½SO42��Þ as a function of RH was as similar as Shanghai
while differed a lot from Beijing (Fig. 5c). During ND_HN, the ratioof ð½NO3
�� þ 2½SO42��Þ=½NH4
þ� was close to 1.0, indicating thatsulfate and nitrate were almost fully neutralized by ammonium inthe normal days at this isle. While during PD_HN, this ratio slightly
increased to 1.3, indicating that the marine aerosol over this islewas weakly acidic and it was evidently from the regional/long-range transport of the anthropogenic emissions in the mainlandof China.
EFs of the pollution elements at the Huaniao Isle were as high asthose in Beijing and Shanghai (Fig. 6), indicating that the marineaerosol over this isle had evident anthropogenic origin. The meanconcentrations of As, Cd, Cu, Mn, Pb, and Zn increased 2e5 foldsfrom 3.0 ng m�3, 0.4 ng m�3, 7.5 ng m�3, 9.9 ng m�3, 3.1 ng m�3,and 0.04 mg m�3 in ND_HN to 7.7 ng m�3, 1.8 ng m�3, 14.8 ng m�3,41.9 ng m�3, 7.4 ng m�3, and 0.2 mg m�3 in PD_HN, respectively.Specifically, EFs of Ni and V at the Huaniao Isle were the highestamong all three sites (Fig. 6). As a remote site approximately 60 kmaway from a large and busy container port (Yangshan port), thesignificant enrichment of Ni and V was evidently due to thecontribution from those busy ship activities over the Eastern ChinaSea (Lin et al., 2013). Themean ratio of V/Ni was ~2.2 at the HuaniaoIsle, very close to that in heavy fuel oil used by domestic ships (Zhaoet al., 2013a), which further corroborated the characteristics of shipemission origin over the remote East China Sea.
3.3. Impact of the long/medium-range transport on the heavy hazeformation
Fig. 8 shows the 48-h air masses backward trajectories ending inShanghai, Beijing, and the Huaniao Isle, respectively, during theseverely polluted days. In Shanghai (Fig. 8a), the air masses duringPD_SH were mainly limited within the YRD region, e.g. Jiangsu andZhejiangprovinces andoccasionally extended to Shandongprovince.This type of transport is referred as themedium-range transport. Theratio of NO3
�=SO42� was in the range of 1.1e2.0 during Jan. 12e15,
close to that (1.2) of the previous studies on the haze occurred overShanghai, in which the haze was dominated by local and YRDemissions (Huang et al., 2013b). On Jan.16, the backward trajectoriesstarting fromShanghai tracedback to theNorth ChinaPlain. Thiswascorroborated by a significant drop of the ratio of NO3
�=SO42� to be
0.6, which was close to that observed in Beijing, confirming theimpact of the long-range transport from Northern China on the se-vere haze formation in Shanghai, the downstream regions of thetransport. The Potential Source Contribution Function (PSCF, seeAppendix in Supplementary Materials) facilitated a more clearvisualization of the extent of transport. Based on the hourly PM2.5concentrations at one SEMC (Shanghai Environmental MonitoringCenter) site (Yangpu Sipiao, about 5 km from our sampling site)during Jan. 12e15, 2013, weighted PSCF is plotted in Fig. 8b. It isclearly shown that the potential source regions of particulate pollu-tion in Shanghai were constrained in limited areas. Local Shanghai,the southern tip of Jiangsu province and the northern tip of Zhejiangprovince showed relatively high PSCF values. It is noted that therewere also high probabilities of drifting from the north over the EastChina Sea. This was likely the continental outflow from Jiangsuprovince and indicated that the high particulate pollution ofShanghai was partly ascribed to regional transport.
In Beijing, the air masses on Jan. 10 and Jan. 12e13 mostlytravelled through Beijing at low altitudes and passed over thoseneighboring areas around Beijing with intense emission rates, suchas Hebei, Shanxi provinces and Tianjin (Fig. 8c). For example, on Jan.12 which was the severest pollution day, SO4
2� increased 92% ascompared to Jan. 11, while NO3
� increased ~51%, resulting in a ratioof DNO3
�=DSO42� of as low as 0.4. Based on the emission inventory
data (Zhao et al., 2012), the emission rate ratio of NOx/SO2 of Beijingwas more than 1.5, while the emission rate of SO2 was almost twiceof NOx for the entire North China Plain. The measured NO3
�=SO42�
ratio in aerosol of Beijing was more consistent with the NOx/SO2emission rate ratio of the North China Plain rather than Beijing
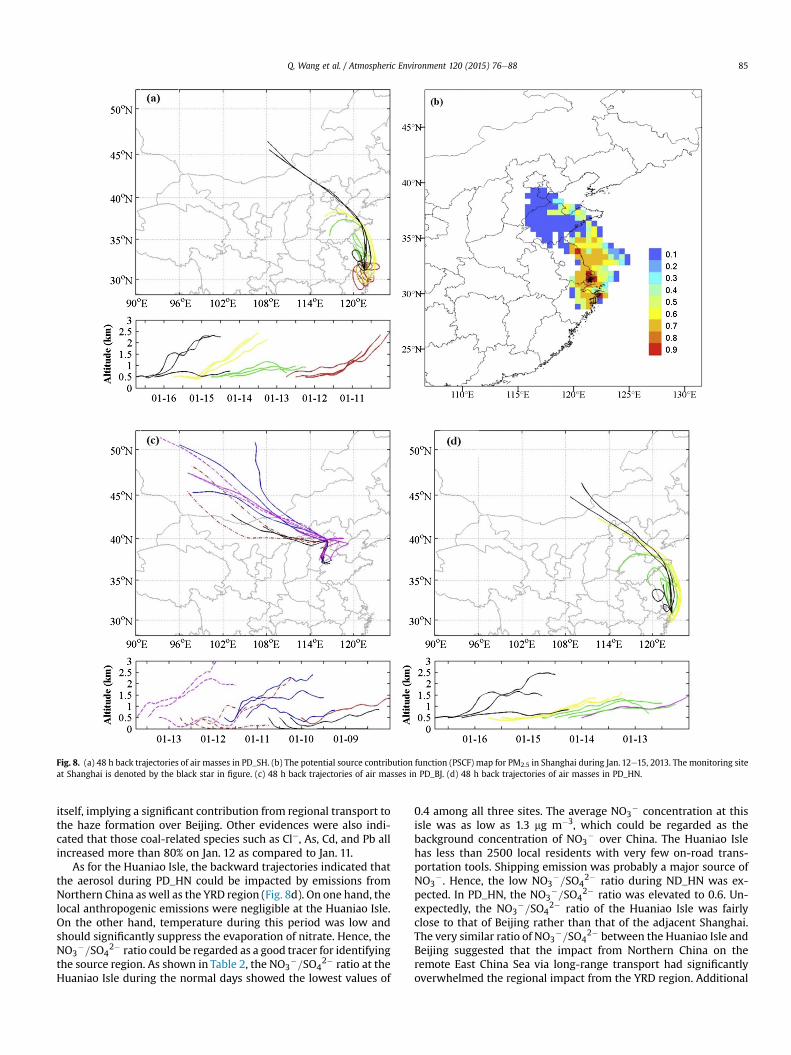
Fig. 8. (a) 48 h back trajectories of air masses in PD_SH. (b) The potential source contribution function (PSCF) map for PM2.5 in Shanghai during Jan. 12e15, 2013. The monitoring siteat Shanghai is denoted by the black star in figure. (c) 48 h back trajectories of air masses in PD_BJ. (d) 48 h back trajectories of air masses in PD_HN.
Q. Wang et al. / Atmospheric Environment 120 (2015) 76e88 85
itself, implying a significant contribution from regional transport tothe haze formation over Beijing. Other evidences were also indi-cated that those coal-related species such as Cl�, As, Cd, and Pb allincreased more than 80% on Jan. 12 as compared to Jan. 11.
As for the Huaniao Isle, the backward trajectories indicated thatthe aerosol during PD_HN could be impacted by emissions fromNorthern China as well as the YRD region (Fig. 8d). On one hand, thelocal anthropogenic emissions were negligible at the Huaniao Isle.On the other hand, temperature during this period was low andshould significantly suppress the evaporation of nitrate. Hence, theNO3
�=SO42� ratio could be regarded as a good tracer for identifying
the source region. As shown in Table 2, the NO3�=SO4
2� ratio at theHuaniao Isle during the normal days showed the lowest values of
0.4 among all three sites. The average NO3� concentration at this
isle was as low as 1.3 mg m�3, which could be regarded as thebackground concentration of NO3
� over China. The Huaniao Islehas less than 2500 local residents with very few on-road trans-portation tools. Shipping emission was probably a major source ofNO3
�. Hence, the low NO3�=SO4
2� ratio during ND_HN was ex-pected. In PD_HN, the NO3
�=SO42� ratio was elevated to 0.6. Un-
expectedly, the NO3�=SO4
2� ratio of the Huaniao Isle was fairlyclose to that of Beijing rather than that of the adjacent Shanghai.The very similar ratio of NO3
�=SO42� between the Huaniao Isle and
Beijing suggested that the impact from Northern China on theremote East China Sea via long-range transport had significantlyoverwhelmed the regional impact from the YRD region. Additional
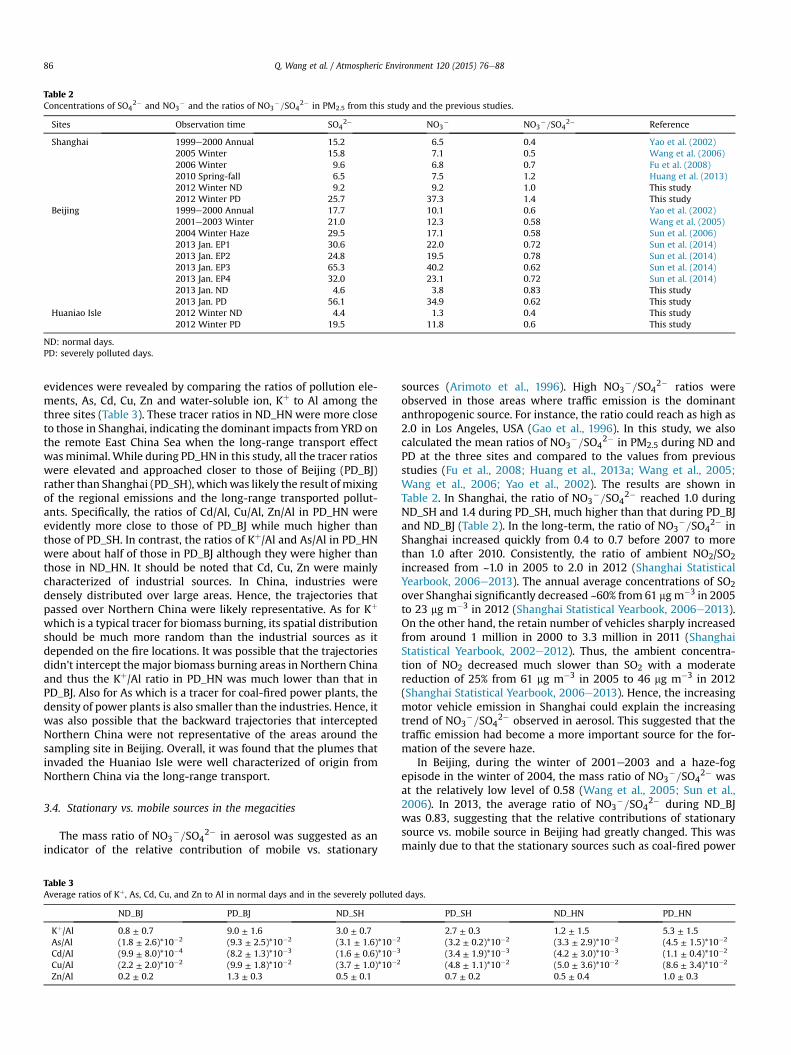
Table 2Concentrations of SO4
2� and NO3� and the ratios of NO3
�=SO42� in PM2.5 from this study and the previous studies.
Sites Observation time SO42� NO3
� NO3�=SO4
2� Reference
Shanghai 1999e2000 Annual 15.2 6.5 0.4 Yao et al. (2002)2005 Winter 15.8 7.1 0.5 Wang et al. (2006)2006 Winter 9.6 6.8 0.7 Fu et al. (2008)2010 Spring-fall 6.5 7.5 1.2 Huang et al. (2013)2012 Winter ND 9.2 9.2 1.0 This study2012 Winter PD 25.7 37.3 1.4 This study
Beijing 1999e2000 Annual 17.7 10.1 0.6 Yao et al. (2002)2001e2003 Winter 21.0 12.3 0.58 Wang et al. (2005)2004 Winter Haze 29.5 17.1 0.58 Sun et al. (2006)2013 Jan. EP1 30.6 22.0 0.72 Sun et al. (2014)2013 Jan. EP2 24.8 19.5 0.78 Sun et al. (2014)2013 Jan. EP3 65.3 40.2 0.62 Sun et al. (2014)2013 Jan. EP4 32.0 23.1 0.72 Sun et al. (2014)2013 Jan. ND 4.6 3.8 0.83 This study2013 Jan. PD 56.1 34.9 0.62 This study
Huaniao Isle 2012 Winter ND 4.4 1.3 0.4 This study2012 Winter PD 19.5 11.8 0.6 This study
ND: normal days.PD: severely polluted days.
Q. Wang et al. / Atmospheric Environment 120 (2015) 76e8886
evidences were revealed by comparing the ratios of pollution ele-ments, As, Cd, Cu, Zn and water-soluble ion, Kþ to Al among thethree sites (Table 3). These tracer ratios in ND_HN were more closeto those in Shanghai, indicating the dominant impacts from YRD onthe remote East China Sea when the long-range transport effectwasminimal. While during PD_HN in this study, all the tracer ratioswere elevated and approached closer to those of Beijing (PD_BJ)rather than Shanghai (PD_SH), whichwas likely the result ofmixingof the regional emissions and the long-range transported pollut-ants. Specifically, the ratios of Cd/Al, Cu/Al, Zn/Al in PD_HN wereevidently more close to those of PD_BJ while much higher thanthose of PD_SH. In contrast, the ratios of Kþ/Al and As/Al in PD_HNwere about half of those in PD_BJ although they were higher thanthose in ND_HN. It should be noted that Cd, Cu, Zn were mainlycharacterized of industrial sources. In China, industries weredensely distributed over large areas. Hence, the trajectories thatpassed over Northern China were likely representative. As for Kþ
which is a typical tracer for biomass burning, its spatial distributionshould be much more random than the industrial sources as itdepended on the fire locations. It was possible that the trajectoriesdidn't intercept the major biomass burning areas in Northern Chinaand thus the Kþ/Al ratio in PD_HN was much lower than that inPD_BJ. Also for As which is a tracer for coal-fired power plants, thedensity of power plants is also smaller than the industries. Hence, itwas also possible that the backward trajectories that interceptedNorthern China were not representative of the areas around thesampling site in Beijing. Overall, it was found that the plumes thatinvaded the Huaniao Isle were well characterized of origin fromNorthern China via the long-range transport.
3.4. Stationary vs. mobile sources in the megacities
The mass ratio of NO3�=SO4
2� in aerosol was suggested as anindicator of the relative contribution of mobile vs. stationary
Table 3Average ratios of Kþ, As, Cd, Cu, and Zn to Al in normal days and in the severely polluted
ND_BJ PD_BJ ND_SH
Kþ/Al 0.8 ± 0.7 9.0 ± 1.6 3.0 ± 0.7As/Al (1.8 ± 2.6)*10�2 (9.3 ± 2.5)*10�2 (3.1 ± 1.6)*10�2
Cd/Al (9.9 ± 8.0)*10�4 (8.2 ± 1.3)*10�3 (1.6 ± 0.6)*10�3
Cu/Al (2.2 ± 2.0)*10�2 (9.9 ± 1.8)*10�2 (3.7 ± 1.0)*10�2
Zn/Al 0.2 ± 0.2 1.3 ± 0.3 0.5 ± 0.1
sources (Arimoto et al., 1996). High NO3�=SO4
2� ratios wereobserved in those areas where traffic emission is the dominantanthropogenic source. For instance, the ratio could reach as high as2.0 in Los Angeles, USA (Gao et al., 1996). In this study, we alsocalculated the mean ratios of NO3
�=SO42� in PM2.5 during ND and
PD at the three sites and compared to the values from previousstudies (Fu et al., 2008; Huang et al., 2013a; Wang et al., 2005;Wang et al., 2006; Yao et al., 2002). The results are shown inTable 2. In Shanghai, the ratio of NO3
�=SO42� reached 1.0 during
ND_SH and 1.4 during PD_SH, much higher than that during PD_BJand ND_BJ (Table 2). In the long-term, the ratio of NO3
�=SO42� in
Shanghai increased quickly from 0.4 to 0.7 before 2007 to morethan 1.0 after 2010. Consistently, the ratio of ambient NO2/SO2increased from ~1.0 in 2005 to 2.0 in 2012 (Shanghai StatisticalYearbook, 2006e2013). The annual average concentrations of SO2over Shanghai significantly decreased ~60% from 61 mgm�3 in 2005to 23 mg m�3 in 2012 (Shanghai Statistical Yearbook, 2006e2013).On the other hand, the retain number of vehicles sharply increasedfrom around 1 million in 2000 to 3.3 million in 2011 (ShanghaiStatistical Yearbook, 2002e2012). Thus, the ambient concentra-tion of NO2 decreased much slower than SO2 with a moderatereduction of 25% from 61 mg m�3 in 2005 to 46 mg m�3 in 2012(Shanghai Statistical Yearbook, 2006e2013). Hence, the increasingmotor vehicle emission in Shanghai could explain the increasingtrend of NO3
�=SO42� observed in aerosol. This suggested that the
traffic emission had become a more important source for the for-mation of the severe haze.
In Beijing, during the winter of 2001e2003 and a haze-fogepisode in the winter of 2004, the mass ratio of NO3
�=SO42� was
at the relatively low level of 0.58 (Wang et al., 2005; Sun et al.,2006). In 2013, the average ratio of NO3
�=SO42� during ND_BJ
was 0.83, suggesting that the relative contributions of stationarysource vs. mobile source in Beijing had greatly changed. This wasmainly due to that the stationary sources such as coal-fired power
days.
PD_SH ND_HN PD_HN
2.7 ± 0.3 1.2 ± 1.5 5.3 ± 1.5(3.2 ± 0.2)*10�2 (3.3 ± 2.9)*10�2 (4.5 ± 1.5)*10�2
(3.4 ± 1.9)*10�3 (4.2 ± 3.0)*10�3 (1.1 ± 0.4)*10�2
(4.8 ± 1.1)*10�2 (5.0 ± 3.6)*10�2 (8.6 ± 3.4)*10�2
0.7 ± 0.2 0.5 ± 0.4 1.0 ± 0.3

Q. Wang et al. / Atmospheric Environment 120 (2015) 76e88 87
plants and steel/cement industries in Beijing had been largelyreduced in recently years. In contrast, during PD_BJ, the ratio ofNO3
�=SO42� wasmuch lower of 0.62. As shown in Table 2, Sun et al.
(2014) found the ratios of NO3�=SO4
2� ranged from 0.62 to 0.78during different pollution episodes in Beijing in January, 2013.Considering that the study by Sun et al. (2014) measured PM1 andtheir sampling site is around 18 km from ours, their results werecomparable to this study. It seemed that the ratio of NO3
�=SO42�
during the polluted episode did not vary significantly, as comparedto the early years. The coal combustion and traffic emission weretwo of the dominated sources in this severe haze over Beijing. Itmust be noted that the aerosol over a city was not only from thelocal emission but also from the long- or medium-range transportas discussed above. The regional transport contributed quite a lot tothe aerosol over Beijing. As for SO2 and its oxidation product sulfate,coal-fired power plants and steel/cement industries are their majoremission sources. For example, Hebei province that surrounds thewhole Beijing produced over 1/3 of the steel of the entire China inrecent years and the coal consumption increased 34% from 546,882tons of standard coal equivalent (SCE) per day in 2006 to 735,958tons of SCE per day in 2012 (Hebei Economic Yearbook,2007e2013). It was reported that the annual average ratio ofNO2/SO2 was in low levels of 0.5e0.7 in Hebei (Hebei ProvinceEnvironment Condition Bulletin, 2007e2013). This meant that theSO4
2� produced in Hebei should be much greater than NO3�. Thus,
if the great part of SO42� from the regional transport to Beijing was
considered, the ratio of NO3�=SO4
2� in the severely polluted daysin January 2013 in Beijing should be lower than 0.58 as compared tothat in the 2001e2004 (Table 2). However, this ratio ofNO3
�=SO42� in this heavy haze episode was not lower than that of
ten years ago, instead, it was as high as 0.62. This meant that whileSO4
2� increased, NO3� in the aerosol increased even more than
SO42� did in this severe haze episode. The traffic exhaust is one of
the major sources of NOx and the number of vehicles in Beijingincreased rapidly from ~1.4 million in 2000 to ~5.2 million in 2012(Beijing Statistical Yearbook, 2001e2013), thus, the increased NO3
�
could be more attributed to the traffic emission. According to thesource apportionment results (Beijing EPB, 2014), even withoutconsidering the regional transport, the contribution from localtraffic emission to PM2.5 in Beijing was over 30%. The combiningevidence indicated that the traffic emission has also been one of themajor sources in triggering the severe haze formation in Beijing.
4. Conclusion
An extremely severe haze shrouded over northern and easternChina in Jan. 1e19, 2013, which even extended to those remoteareas over the East China Sea. Considering the high relative hu-midity conditions during the severely polluted days, this worksuggests that the promoted gas-to-particle transformations fromacidic SO2 and NOx to SO4
2� and NO3� play a major role in the
formation of this severe haze. Significant contribution of trafficemissions to the haze formation over China was suggested to beone of the major sources in triggering the heavy haze over China.The much higher NO3
�=SO42� ratio in Shanghai suggest a more
significant contribution of traffic emissions to the haze formationthan in Beijing where coal combustion and traffic emissions weretwo of the major contributors in triggering the haze. However,traffic emission was still an important contributor to this heavyhaze in Beijing during some specific episodes (Wang et al., 2014c).
Impacts of the long/medium-range transport on the formationof this severe haze were significant, as indicated in the remote site,the Huaniao Isle. The substantial increases of pollution elements,secondary ions, and Kþ during the severely polluted days wereattributed to the transport of air pollutants. The ratios of As, Cd, Cu,
Zn, and Kþ to Al at the Huaniao Isle were much more close to theratios in Beijing rather than in Shanghai, indicating that the marineaerosol over the East China Sea had been significantly polluted bythe long-range transport of anthropogenic pollutants originatingfrom Northern China.
Acknowledgment
This work was supported by National Natural Science Founda-tion of China (Grant Nos. 21277030, 41429501 (fund for collabo-ration with overseas scholars), and 41405115), Environmentalcharity project of Ministry of Environmental Protection of China(201409022), and the open project of Shanghai key laboratory ofatmospheric particle pollution prevention (FDLAP13005).
Appendix A. Supplementary data
Supplementary data related to this article can be found at http://dx.doi.org/10.1016/j.atmosenv.2015.08.076.
References
An, J.L., Li, Y., Chen, Y., Li, J., Qu, Y., Tang, Y.J., 2013. Enhancements of major aerosolcomponents due to additional HONO sources in the North China Plain andimplications for visibility and haze. Adv. Atmos. Sci. 30 (1), 57e66. http://dx.doi.org/10.1007/s00376-012-2016-9.
Andreae, M.O., 1983. Soot carbon and excess fine potassium: long-range transportof combustion-derived aerosols. Sci. (New York, NY) 220, 1148.
Arimoto, R., Duce, R.A., Savoie, D.L., Prospero, J.M., Talbot, R., Cullen, J.D., Tomza, U.,Lewis, N.F., Ray, B.J., 1996. Relationships among aerosol constituents from Asiaand the North Pacific during PEM-West A. J. Geophys. Res. Atmos. 101,2011e2023.
Beijing EPB, 2014. Environmental Protection Bureau (in Chinese). http://tech.sina.com.cn/d/2014-10-31/14329750274.shtml.
Beijing Statistical Yearbook, 2001e2013. China Statistics Press, Beijing.Chen, L.W.A., Chow, J.C., Doddridge, B.G., Dickerson, R.R., Ryan, W.F., Mueller, P.K.,
2003. Analysis of a summertim PM2.5 and haze episode in the mid-Atlanticregion. J. Air Waste Manag. Assoc. 53, 946e956.
Cheng, M.C., You, C.F., Cao, J., Jin, Z., 2012. Spatial and seasonal variability of water-soluble ions in PM2.5 aerosols in 14 major cities in China. Atmos. Environ. 60,182e192.
Cheng, Z., Wang, S., Fu, X., Watson, J.G., Jiang, J., Fu, Q., Chen, C., Xu, B., Yu, J.,Chow, J.C., Hao, J., 2014. Impact of biomass burning on haze pollution in theYangtze River delta, China: a case study in summer 2011. Atmos. Chem. Phys. 14,4573e4585.
Duan, J.C., Tan, J.H., 2013. Atmospheric heavy metals and arsenic in China: situation,sources and control policies. Atmos. Environ. 74, 93e101.
Fu, Q.Y., Zhuang, G.S., Wang, J., Xu, C., Huang, K., Li, J., Hou, B., Lu, T., Streets, D.G.,2008. Mechanism of formation of the heaviest pollution episode ever recordedin the Yangtze River Delta, China. Atmos. Environ. 42, 2023e2036.
Gao, Y., Arimoto, R., Duce, R.A., Chen, L.Q., Zhou, M.Y., Gu, D.Y., 1996. Atmosphericnon-sea-salt sulfate, nitrate and methanesulfonate over the China Sea.J. Geophys. Res. Atmos. 101, 12601e12611.
Guo, L., Chen, Y., Wang, F.J., Meng, X., Xu, Z.F., Zhuang, G.S., 2014. Effects of Asiandust on the atmospheric input of trace elements to the East China Sea. Mar.Chem. 163, 19e27.
Hebei Economic Yearbook, 2007e2013. China Statistics Press, Beijing.Hebei Province Environment Condition Bulletin, 2007-2013. Hebei Provincial
Environmental Protection Hall. http://www.hb12369.net/hjzlzkgb/.Hsu, S.C., Liu, S.C., Huang, Y.T., Chou, C.C.K., Lung, S.C.C., Liu, T.H., Tu, J.Y., Tsai, F.J.,
2009. Long-range southeastward transport of Asian biosmoke pollution:signature detected by aerosol potassium in Northern Taiwan. J. Geophys. Res.Atmos. 114.
Huang, K., Zhuang, G., Lin, Y., Fu, J.S., Wang, Q., Liu, T., Zhang, R., Jiang, Y., Deng, C.,Fu, Q., Hsu, N.C., Cao, B., 2012. Typical types and formation mechanisms of hazein an Eastern Asia megacity. Shanghai. Atmos. Chem. Phys. 12, 105e124.
Huang, K., Zhuang, G., Lin, Y., Wang, Q., Fu, J.S., Fu, Q., Liu, T., Deng, C., 2013a. How toimprove the air quality over mega-cities in China? e pollution characterizationand source analysis in Shanghai before, during, and after the 2010 World Expo.Atmos. Chem. Phys. Discuss. 13, 3379e3418.
Huang, K., Zhuang, G., Lin, Y., Wang, Q., Fu, J.S., Fu, Q., Liu, T., Deng, C., 2013b. How toimprove the air quality over megacities in China: pollution characterization andsource analysis in Shanghai before, during, and after the 2010 World Expo.Atmos. Chem. Phys. 13, 5927e5942.
Huang, K., Zhuang, G., Wang, Q., Fu, J.S., Lin, Y., Liu, T., Han, L., Deng, C., 2014.Extreme haze pollution in Beijing during January 2013: chemical characteris-tics, formation mechanism and role of fog processing. Atmos. Chem. Phys.Discuss. 14, 7517e7556.
Q. Wang et al. / Atmospheric Environment 120 (2015) 76e8888
Jacobson, M.Z., 1997. Development and application of a new air pollution modelingsystem .2. Aerosol module structure and design. Atmos. Environ. 31, 131e144.
Ji, D., Li, L., Wang, Y., Zhang, J., Cheng, M., Sun, Y., Liu, Z., Wang, L., Tang, G., Hu, B.,Chao, N., Wen, T., Miao, H., 2014. The heaviest particulate air-pollution episodesoccurred in northern China in January, 2013: insights gained from observation.Atmos. Environ. 92, 546e556.
Kang, C.M., Lee, H.S., Kang, B.W., Lee, S.K., Sunwoo, Y., 2004. Chemical characteristicsof acidic gas pollutants and PM2.5 species during hazy episodes in Seoul, SouthKorea. Atmos. Environ. 38, 4749e4760.
Lang, J.L., Cheng, S.Y., Wei, W., Zhou, Y., Wei, X., Chen, D.S., 2012. A study on thetrends of vehicular emissions in the Beijing-Tianjin-Hebei (BTH) region, China.Atmos. Environ. 62, 605e614.
Li, Y., An, J.L., Gultepe, I., 2014. Effects of additional HONO sources on visibility overthe North China Plain. Adv. Atmos. Sci. 31 (5), 1221e1232. http://dx.doi.org/10.1007/s00376-014-4019-1.
Lida, D.R., 2006. Handbook of Chemistry and Physics: a Ready-Reference Book ofChemical and Physical Data, 86th ed. CRC Press, New York, pp. 14e17.
Lin, Y., Huang, K., Zhuang, G., Fu, J., Xu, C., Shen, J., Chen, S., 2013. Air quality over theYangtze River Delta during the 2010 Shanghai expo. Aerosol Air Qual. Res. 13,1655e1666.
Meng, Y.J., Wang, S.Y., Zhao, X.F., 2000. An analysis of air pollution and weatherconditions during heavy fog days in Beijing area (in Chinese). Weather 26.
Menon, S., Hansen, J., Nazarenko, L., Luo, Y.F., 2002. Climate effects of black carbonaerosols in China and India. Science 297, 2250e2253.
Mestl, H.E.S., Aunan, K., Seip, H.M., Wang, S., Zhao, Y., Zhang, D., 2007. Urban andrural exposure to indoor air pollution from domestic biomass and coal burningacross China. Sci. Total Environ. 377, 12e26.
Shanghai Statistical Yearbook, 2002-2013. China Statistics Press, Beijing.Sun, Y.L., Jiang, Q., Wang, Z.F., Fu, P.Q., Li, J., Yang, T., Yin, Y., 2014. Investigation of the
sources and evolution processes of severe haze pollution in Beijing in January2013. J. Geophys. Res. Atmos. 119, 4380e4398.
Sun, Y.L., Wang, Z.F., Fu, P.Q., Jiang, Q., Yang, T., Li, J., Ge, X.L., 2013a. The impact ofrelative humidity on aerosol composition and evolution processes duringwintertime in Beijing, China. Atmos. Environ. 77, 927e934.
Sun, Y.L., Wang, Z.F., Fu, P.Q., Yang, T., Jiang, Q., Dong, H.B., Li, J., Jia, J.J., 2013b.Aerosol composition, sources and processes during wintertime in Beijing,China. Atmos. Chem. Phys. 13, 4577e4592.
Sun, Y.L., Zhuang, G.S., Tang, A.H., Wang, Y., An, Z.S., 2006. Chemical characteristicsof PM2.5 and PM10 in haze-fog episodes in Beijing. Environ. Sci. Technol. 40,3148e3155.
Sun, Y.L., Zhuang, G.S., Ying, W., Han, L.H., Guo, J.H., Mo, D., Zhang, W.J., Wang, Z.F.,Hao, Z.P., 2004. The air-borne particulate pollution in Beijing e concentration,composition, distribution and sources. Atmos. Environ. 38, 5991e6004.
Takuwa, T., Mkilaha, I.S.N., Naruse, I., 2006. Mechanisms of fine particulates for-mation with alkali metal compounds during coal combustion. Fuel 85,671e678.
Tan, J.H., Duan, J.C., Chen, D.H., Wang, X.H., Guo, S.J., Bi, X.H., Sheng, G.Y., He, K.B.,Fu, J.M., 2009. Chemical characteristics of haze during summer and winter inGuangzhou. Atmos. Res. 94, 238e245.
Tanner, P.A., Ma, H.-L., Yu, P.K.N., 2008. Fingerprinting metals in urban street dust ofBeijing, Shanghai, and Hong Kong. Environ. Sci. Technol. 42, 7111e7117.
Tian, H., Cheng, K., Wang, Y., Zhao, D., Lu, L., Jia, W., Hao, J., 2012. Temporal andspatial variation characteristics of atmospheric emissions of Cd, Cr, and Pb fromcoal in China. Atmos. Environ. 50, 157e163.
Tian, H.Z., Wang, Y., Xue, Z.G., Cheng, K., Qu, Y.P., Chai, F.H., Hao, J.M., 2010. Trend
and characteristics of atmospheric emissions of Hg, As, and Se from coalcombustion in China, 1980e2007. Atmos. Chem. Phys. 10, 11905e11919.
Wang, H., An, J., Shen, L., Zhu, B., Pan, C., Liu, Z., Liu, X., Duan, Q., Liu, X., Wang, Y.,2014a. Mechanism for the formation and microphysical characteristics of sub-micron aerosol during heavy haze pollution episode in the Yangtze River Delta,China. Sci. Total Environ. 490, 501e508.
Wang, L.T., Wei, Z., Yang, J., Zhang, Y., Zhang, F.F., Su, J., Meng, C.C., Zhang, Q., 2014b.The 2013 severe haze over southern Hebei, China: model evaluation, sourceapportionment, and policy implications. Atmos. Chem. Phys. 14, 3151e3173.
Wang, Y., Zhuang, G.S., Tang, A.H., Yuan, H., Sun, Y.L., Chen, S.A., Zheng, A.H., 2005.The ion chemistry and the source of PM2.5 aerosol in Beijing. Atmos. Environ.39, 3771e3784.
Wang, Y., Zhuang, G.S., Zhang, X.Y., Huang, K., Xu, C., Tang, A.H., Chen, J.M., An, Z.S.,2006. The ion chemistry, seasonal cycle, and sources of PM2.5 and TSP aerosolin Shanghai. Atmos. Environ. 40, 2935e2952.
Wang, Y.S., Yao, L., Wang, L.L., Liu, Z.R., Ji, D.S., Tang, G.Q., Zhang, J.K., Sun, Y., Hu, B.,Xin, J.Y., 2014c. Mechanism for the formation of the January 2013 heavy hazepollution episode over central and eastern China. Sci. China Earth Sci. 57, 14e25.
Wang, Z.F., Li, J., Wang, Z., Yang, W.Y., Tang, X., Ge, B.Z., Yan, P.Z., Zhu, L.L., Chen, X.S.,Chen, H.S., Wang, W., Li, J.J., Liu, B., Wang, X.Y., Wang, W., Zhao, Y.L., Lu, N., Su, D.,2014d. Modeling study of regional severe hazes over mid-eastern China inJanuary 2013 and its implications on pollution prevention and control. Sci.China Earth Sci. 57, 3e13.
Yang, D.-q., Kwan, S.H., Lu, T., Fu, Q.-y., Cheng, J.-m., Streets, D.G., Wu, Y.-m., Li, J.-j.,2007. An emission inventory of marine vessels in shanghai in 2003. Environ. Sci.Technol. 41, 5183e5190.
Yao, X., Chan, C.K., Fang, M., Cadle, S., Chan, T., Mulawa, P., He, K., Ye, B., 2002. Thewater-soluble ionic composition of PM2.5 in Shanghai and Beijing, China.Atmos. Environ. 36, 4223e4234.
Yuan, H., Wang, Y., Zhuang, G., 2003. The simultaneous determination of organicacid, MSA with inorganic anions in aerosol and rainwater by ion chromatog-raphy (in Chinese). J. Instrum. Analysis 6, 6e12.
Zhang, R.H., Li, Q., Zhang, R.N., 2014a. Meteorological conditions for the persistentsevere fog and haze event over eastern China in January 2013. Sci. China EarthSci. 57, 26e35.
Zhang, Z.L., Wang, J., Chen, L.H., Chen, X.Y., Sun, G.Y., Zhong, N.S., Kan, H.D., Lu, W.J.,2014b. Impact of haze and air pollution-related hazards on hospital admissionsin Guangzhou, China. Environ. Sci. Pollut. Res. 21, 4236e4244.
Zhao, B.A., Wang, P.A., Ma, J.Z.A., Zhu, S.A., Pozzer, A.A., Li, W.T., 2012. A high-res-olution emission inventory of primary pollutants for the Huabei region, China.Atmos. Chem. Phys. 12, 481e501.
Zhao, M., Zhang, Y., Ma, W., Fu, Q., Yang, X., Li, C., Zhou, B., Yu, Q., Chen, L., 2013a.Characteristics and ship traffic source identification of air pollutants in China'slargest port. Atmos. Environ. 64, 277e286.
Zhao, P.S., Dong, F., He, D., Zhao, X.J., Zhang, X.L., Zhang, W.Z., Yao, Q., Liu, H.Y.,2013b. Characteristics of concentrations and chemical compositions for PM2.5in the region of Beijing, Tianjin, and Hebei, China. Atmos. Chem. Phys. 13,4631e4644.
Zhao, X.J., Zhao, P.S., Xu, J., Meng, W., Pu, W.W., Dong, F., He, D., Shi, Q.F., 2013c.Analysis of a winter regional haze event and its formation mechanism in theNorth China Plain. Atmos. Chem. Phys. 13, 5685e5696.
Zhu, T., Shang, J., Zhao, D.F., 2010. The roles of heteorogeneous chemical processesin the formation of an air pollution complex and gray haze. Sci. Sin. Chim. 40(12), 1731e1740 (in Chinese).