probing rna structural dynamics and - university of...
TRANSCRIPT

UNIT 11.10Probing RNA Structural Dynamics andFunction by Fluorescence Resonance EnergyTransfer (FRET)
RNA is a ubiquitous biopolymer with complex functions in the maintenance, transfer,processing, and regulation of genetic information. Its secondary structure provides acomparably stable scaffold onto which long-range tertiary interactions are built. RNAfolding pathways describe the possible trajectories by which an RNA molecule mayacquire a functional tertiary structure. Often, biological function of RNA is mediated bycyclic switching between two or more (meta-)stable arrangements of tertiary structure.Fluorophore labeling of RNA offers a unique view into these folding and conformationalswitching events, since a fluorescence signal is sensitive to its molecular environment andcan be continuously monitored in real time to produce kinetic rate information. Many ofthese general aspects are discussed in UNIT 11.8. The current chapter complements UNIT 11.8
by focusing on the practical implications of using fluorescence resonance energy transfer(FRET) to probe RNA structural dynamics and function. FRET is a particularly powerfulfluorescence technique since, in addition to kinetic data, it provides insights into thestructural basis of a conformational rearrangement.
The current unit provides protocols that describe how to postsynthetically label RNA forFRET (see Basic Protocol 1) and how to acquire and analyze FRET data (see BasicProtocol 2). Support Protocols describe methods for deprotecting synthetic RNA (seeSupport Protocols 1 and 2) and for purifying RNA by gel electrophoresis and HPLC (seeSupport Protocols 3 and 4, respectively). Considerations for selecting appropriate RNA,fluorophores, and labeling strategies are discussed in detail in the Commentary (seeCritical Parameters).
NOTE: As for any experiments with RNA, care must be taken to avoid introducingribonucleases (RNases) into the samples. Since most techniques described here involvecommercially available synthetic RNA, the major source of RNases is postsyntheticcontamination. This can be avoided by wearing gloves to avoid skin contact whenhandling samples and solutions; by using nuclease-free sterilized pipet tips, sample tubes,and other disposable plasticware (stored in clean, autoclaved, dust-free containers); bypreparing all solutions from the highest purity (e.g., molecular-biology grade) compo-nents in doubly deionized water (18 MΩ conductivity); and by sterile filtering (0.22 µm)or autoclaving all solutions. When these suggestions are followed, inactivation of RNasesusing DEPC is not necessary and not particularly recommended because contaminatingdecay products may lead to fungal growth.
BASICPROTOCOL 1
POSTSYNTHETIC LABELING OF AMINO- OR THIOL-MODIFIED RNA
To perform FRET experiments, the RNA sample must be labeled with both a donor andan acceptor fluorophore. This can be accomplished by a variety of strategies that arediscussed in detail in the Commentary (see Critical Parameters). In short, fluorophorescan be added either during oligoribonucleotide synthesis or by postsynthetic conjugationto a modified oligoribonucleotide. This protocol describes a method for postsyntheticlabeling of a modified RNA.
RNA modified with primary or secondary amino and thiol functionalities can be conven-iently labeled under mild conditions with succinimidyl ester and maleimide derivativesof a fluorophore, respectively, available from companies such as Molecular Probes,
Supplement 11
Contributed by Nils G. WalterCurrent Protocols in Nucleic Acid Chemistry (2002) 11.10.1-11.10.23Copyright © 2002 by John Wiley & Sons, Inc.
11.10.1
RNA FoldingPathways
Sigma-Aldrich, or Amersham Pharmacia Biotech. Since RNA purified by reversed-phaseHPLC contains trace amounts of triethylamine that hydrolyze succinimidyl esters and, toa lesser extent, maleimides in a catalytic fashion, the labeling protocol consists of twosteps: (1) chloroform extraction and ethanol precipitation to remove triethylamine and (2)coupling of the fluorophore derivative to the amino- or thiol-modified RNA. Excessfluorophore is then removed by C8-reversed phase HPLC purification (see SupportProtocol 4).
This method can be used for single or double labeling of an RNA. Only one fluorophoreneed be added, for instance, if the other fluorophore was added during synthesis or if thedonor and acceptor are conjugated to opposite strands of the RNA (see Critical Parame-ters). If the RNA already contains a fluorophore, it should be protected from light at alltimes to prevent photobleaching. If both donor and acceptor are to be added postsyntheti-cally to the same strand, the RNA must contain both an amino and a thiol modification.In this case, the thiol functionality should be reacted first, since maleimides provide forhigher selectivity than succinimidyl esters.
Materials
Gel- and HPLC-purified RNA sample with amino or thiol functionality (seeSupport Protocol 4)
Chloroform, buffered (see recipe)3 M sodium acetate, pH 5.2 (APPENDIX 2A)100% and 80% (v/v) ethanolSuccinimidyl ester (for amino-modified RNA) or maleimide derivative (for
thiol-modified RNA) of fluorophore of choice (e.g., Molecular Probes,Sigma-Aldrich, Amersham Pharmacia Biotech; for selection of fluorophores,see Critical Parameters)
Dimethylsulfoxide (DMSO), anhydrous (e.g., Fisher)100 mM sodium tetraborate, pH 8.5 (for amino-modified RNA, see recipe) or 100
mM HEPES-KOH, pH 7.0 (for thiol-modified RNA, see recipe)100 mM ATP or GTP (APPENDIX 2A; recipe for dNTPs)
Speedvac evaporator (e.g., Savant)Aluminum foilTube shaker (e.g., Fisher)
Chloroform extract and precipitate RNA1. Bring the RNA sample to be labeled up to 100 µL with water.
This volume is large enough to handle easily and small enough to ensure a goodprecipitation yield. Up to 100 g RNA can be labeled in one reaction using this protocol.It is wise to keep 50% of the original material for a second labeling in case of unexpectedloss.
2. Extract RNA solution with 1 vol buffered chloroform, microcentrifuge briefly atmaximum speed to separate phases, and transfer the top (aqueous) phase to a freshtube.
3. Add 1⁄10 vol (10 µL) 3 M sodium acetate, pH 5.2, and 2.5 vol (250 µL) 100% ethanol,vortex, and precipitate at −70°C for 1 hr.
4. Microcentrifuge 30 min at maximum speed, 4°C, to collect RNA. Decant supernatant,wash with 80% ethanol, decant supernatant, and dry RNA in a Speedvac evaporator.Cover the evaporator with aluminum foil if the RNA already contains a fluorophore.
Supplement 11 Current Protocols in Nucleic Acid Chemistry
11.10.2
Probing RNAStructural
Dynamics andFunction by
FRET
Label RNA5. Dissolve 200 µg fluorophore succinimidyl ester or maleimide in 14 µL DMSO. If
both an amino- and a thiol-modification will be used to attach two fluorophores,perform the reaction at the thiol functionality first.
In many cases it is easier to dissolve a whole vial of the fluorophore derivative at once thanto weigh out a small amount of fluorophore. In this case, dispense fluorophore solution in14-L aliquots and store up to 6 months at –20°C wrapped in aluminum foil. For long-termstorage, dissolve fluorophore derivative in methanol or acetonitrile, dispense in 200-galiquots per tube, dry in a Speedvac evaporator, and store up to 2 years at –20°C wrappedin aluminum foil.
6a. For amino-modified RNA: Dissolve RNA pellet from step 4 in 11 µL water, add 75µL of 100 mM sodium tetraborate, pH 8.5, and transfer to the tube containing thefluorophore succinimidyl ester stock solution from step 5.
6b. For thiol-modified RNA: Dissolve RNA pellet from step 4 in 11 µL water, add 75 µLof 100 mM HEPES-KOH, pH 7.0, and transfer to the tube containing the fluorophoremaleimide stock solution from step 5.
7. Vortex tube, wrap in aluminum foil, and tumble on a tube shaker overnight (16 to 20hr) at room temperature.
The exact incubation time and temperature may have to be optimized for a given reaction.For example, sterically hindered secondary amines (such as a 2′-amino modification on aribose) tend to give higher labeling yields when incubated overnight at 4°C.
8. Add 1⁄10 volume (10 µL) 3 M sodium acetate, pH 5.2, 1⁄40 volume (2.5 µL) 100 mMATP or GTP as carrier, and 2.5 volumes (250 µL) ethanol, vortex, and precipitate at–70°C for 1 hr.
9. Microcentrifuge 30 min at maximum speed, 4°C, to collect RNA. Decant supernatant,wash twice with 80% ethanol, decant supernatant, and dry RNA in a Speedvacevaporator covered with aluminum foil.
10. Resuspend dried RNA in 90 µL water and store in the dark at –20°C (stable at least2 years). Before use for FRET (see Basic Protocol 2), remove excess fluorophore byC8 reversed-phase HPLC (see Support Protocol 4).
11. Optional: For attachment of a second fluorophore at the amino functionality, repeatsteps 5 to 10.
SUPPORTPROTOCOL 1
MILD DEPROTECTION OF STANDARD RNA OLIGONUCLEOTIDES WITHNH4OH/ETHANOL AND TRIETHYLAMINE TRIHYDROFLUORIDEThis protocol describes a mild deprotection scheme for RNA oligonucleotides synthe-sized using standard β-cyanoethyl phosphoramidites. Synthesis is as described in UNIT 3.5
and APPENDIX 3C; phosphoramidites can be purchased from companies such as GlenResearch, ChemGenes, Amersham Pharmacia Biotech, BD Biosciences (Clontech), CPG,Cruachem, Dalton Chemical Laboratories, or PE Applied Biosystems. This scheme iscompatible with fluorophores (particularly fluorescein and the cyanine dyes) or linkermodifications incorporated during synthesis. It uses a 3:1 mixture of concentratedammonium hydroxide and ethanol to cleave the RNA from the solid support, perform aβ-elimination of the cyanoethyl phosphodiester-protecting group, and remove the exocy-clic N-acyl base-protecting groups. A second deprotection with triethylamine trihy-drofluoride removes the tert-butyldimethylsilyl group on the 2′-hydroxyl functionality(also see UNIT 3.6). Many commercially available RNAs have already been cleaved fromthe support and deprotected at the base and phosphodiester moiety. If this is the case, thedesilylation reaction is all that needs to be performed. If a fluorophore was already
Current Protocols in Nucleic Acid Chemistry Supplement 11
11.10.3
RNA FoldingPathways
attached during synthesis, the RNA should be kept protected from light as much aspossible to avoid photobleaching.
Materials
RNA oligonucleotide attached to solid synthesis support (1-µmol scale), madeusing standard β-cyanoethyl phosphoramidites (see above for suggestedsuppliers and UNIT 3.5 for synthesis protocols)
29% (v/v) ammonium hydroxide (e.g., Fisher)100% and 80% (v/v) ethanol (e.g., Fisher)Triethylamine trihydrofluoride (Aldrich or Acros)N,N-Dimethylformamide (e.g., Fisher; optional)1-Butanol (e.g., Fisher)
1.7-mL screw-top tube (e.g., Eppendorf Safe-Twist)Parafilm (e.g., Fisher)Aluminum foilHeating block (e.g., Fisher)14-mL Falcon centrifuge tube (e.g., Fisher)Speedvac evaporator (e.g., Savant)Tube shaker (e.g., Fisher)
Cleave from support and remove cyanoethyl and N-acyl protecting groups1. Transfer the dried solid support beads with the attached RNA oligonucleotide from
the synthesis cartridge to a 1.7-mL Safe-Twist screw-top tube.
Most commercial suppliers of RNA provide material that already has undergone steps 1through 6. In this case, proceed directly to desilylation in step 7.
2. Add 750 µL of 29% ammonium hydroxide and 250 µL 100% ethanol to the tube,screw the cap on tightly, wrap the top with Parafilm, and place in a heating block for4 hr at 65°C. If a fluorophore is already attached to the RNA, cover with aluminumfoil to protect from light. For RNA containing cyanine dyes, an even milder incuba-tion (20 hr at 25oC) is preferable.
Due to its high vapor pressure, the concentrated ammonium hydroxide solution is easiestto pipet when stored in the freezer at –20°C until use. This precaution also minimizes agradual decrease over time in ammonia concentration due to degassing.
3. Remove the tube from the heating block, place it on ice, and wait 10 min for it to cooldown.
This procedure avoids loss of contents when opening the tube.
4. Microcentrifuge the tube 30 sec at maximum speed to compact the solid supportbeads, then pipet the supernatant into a 14-mL Falcon tube.
5. Add 1 mL water to the beads, vortex thoroughly, microcentrifuge for 30 sec, and addthe supernatant to the Falcon tube. Repeat this wash a second time and again add thesupernatant to the Falcon tube.
6. Evaporate the combined supernatants in a Speedvac evaporator. Cover the evaporatorwith aluminum foil if the RNA contains a fluorophore.
To avoid subsequent solubility problems, be careful not to overdry the RNA.
Supplement 11 Current Protocols in Nucleic Acid Chemistry
11.10.4
Probing RNAStructural
Dynamics andFunction by
FRET

Remove tert-butyldimethylsilyl protecting group7. Add 800 µL triethylamine trihydrofluoride to the Falcon tube, wrap the top with
Parafilm, and tumble on a tube shaker overnight (16 to 20 hr) at room temperature.Wrap in aluminum foil if the RNA contains a fluorophore.
To increase the solubility of long RNA (>30 nt), 25% dimethylformamide may be added tothe reaction.
8. Quench the desilylation reaction by adding 160 µL water to the Falcon tube.
9. Add 8 mL of 1-butanol and chill the solution at –20°C for 45 min.
10. Microcentrifuge 5 min at 3000 rpm, 4°C, and gently decant the 1-butanol from theprecipitated RNA.
11. Wash RNA pellet with 80% ethanol, decant, and repeat wash. Evaporate remainingliquid from the Falcon tube in a Speedvac evaporator. Cover the evaporator withaluminum foil if the RNA contains a fluorophore.
Completely removing the 1-butanol by ethanol washes and evaporation is important toimprove the separation during subsequent gel purification (see Support Protocol 3).
If necessary, the dried RNA can be stored at −20°C until gel purification (stable at least 1month). RNA recovery at this stage should be at least 50% of the total synthesis scale.
SUPPORTPROTOCOL 2
MILD DEPROTECTION OF 2′-ACE-PROTECTED RNAOLIGONUCLEOTIDES WITH ACETIC ACID
This protocol describes a specific deprotection scheme required for RNA oligonucleotidespurchased from Dharmacon Research. Dharmacon uses a very different 5′-silyl-2′-or-thoester protection chemistry, and typically supplies RNA after the support cleavage andbase deprotection step. Mildly acidic conditions are then used to remove the 2′-orthoesterprotecting groups. Dharmacon provides a limited but increasing number of modifications(including 5′ fluorescein and cyanine dyes) that are all compatible with the deprotectionprotocol outlined below. Again, if a fluorophore was already attached during the synthesis,the RNA should be kept protected from light as much as possible to avoid photobleaching.
Additional Materials (see Support Protocol 1)
RNA oligonucleotide made using 5′-silyl-2′-orthoester protection chemistry,already cleaved from solid support and base deprotected (Dharmacon Research)
100 mM acetic acid/TEMED, pH 3.8 (see recipe)
1. Briefly microcentrifuge the tube containing the RNA oligonucleotide to ensure thatthe RNA pellet is at the bottom.
2. Add 400 µL of 100 mM acetic acid/TEMED, pH 3.8, per 0.1 µmol synthesis material.Dissolve the pellet by pipetting up and down and vortexing. Centrifuge the solutionto the bottom of the tube.
3. Wrap tube top with Parafilm and place the tube in a heating block for 30 min at 60°C.If a fluorophore is already attached to the RNA, cover tube with aluminum foil toprotect from light.
4. Remove the tube from the heating block, place it on ice, and wait 10 min for it to cooldown.
This procedure avoids loss of contents when opening the tube.
Current Protocols in Nucleic Acid Chemistry Supplement 11
11.10.5
RNA FoldingPathways

5. Evaporate buffer in a Speedvac evaporator. Cover the evaporator with aluminum foilif the RNA contains a fluorophore.
If necessary, the dried RNA can be stored at −20°C until gel purification (stable at least 1month). RNA recovery at this stage should be at least 50% of the total synthesis scale.
SUPPORTPROTOCOL 3
GEL PURIFICATION OF RNA OLIGONUCLEOTIDES
Polyacrylamide gel electrophoresis (PAGE) is the most effective way of purifying afull-length synthetic RNA oligonucleotide from shorter synthesis byproducts. SincePAGE in general is described in UNIT 10.4 and APPENDIX 3B, the following procedure focuseson a streamlined standard purification of a synthetic RNA oligonucleotide (up to 80 nt inlength). The steps in preparative PAGE are: (1) preparation of the gel and gel apparatus,(2) electrophoretic separation, and (3) detection of the RNA by UV shadowing and elutionfrom the gel.
CAUTION: Acrylamide is a known neurotoxin and should be handled with care. Wearsafety goggles and gloves when handling solutions or a solidified gel. Work in a fumehood when weighing powdered acrylamide. To avoid the health risk from working withpowdered acrylamide, it is advisable to purchase a premade acrylamide solution.
Materials
Urea (e.g., Fisher)38% (w/v) acrylamide/2% (w/v) bisacrylamide (e.g., Fisher; UNIT 10.4)10× TBE electrophoresis buffer (APPENDIX 2A)50% (w/v) APS (see recipe)N,N,N′,N′-Tetramethylethylenediamine (TEMED; Fisher)Deprotected RNA sample (see Support Protocol 1 or 2)2× formamide loading buffer (see recipe)Elution buffer (see recipe)Chloroform, buffered (see recipe)100 mM ATP or GTP (APPENDIX 2A; recipe for dNTPs)100% and 80% (v/v) ethanol
Vertical slab gel electrophoresis apparatus (e.g., 20 × 16–cm system from CBSScientific), including glass plates, 1-mm spacers, fitting seal, 1-mm one- ortwo-well comb, clamps, and aluminum plate
Power supply (e.g., Fisher)60-mL syringe with bent 18-G needle (e.g., Fisher)Heating compartment (e.g., Fisher) filled with copper shot (e.g., Fisher), or other
temperature-controlled heating block, set at 95oCLarge-volume gel-loading pipet tips (e.g., Fisher)Aluminum foilPlastic wrap (e.g., Saran wrap)20 × 20–cm TLC plate with fluorescent indicator (e.g., Fisher)312- or 254-nm hand-held UV lamp (e.g., Fisher)Empty Poly-Prep chromatography column (Bio-Rad)Tube shaker (e.g., Fisher)14-mL Falcon centrifuge tube (e.g., Fisher)Speedvac evaporator (e.g., Savant)
Supplement 11 Current Protocols in Nucleic Acid Chemistry
11.10.6
Probing RNAStructural
Dynamics andFunction by
FRET

Prepare gel1. Assemble the gel plates, spacers, and seal following the manufacturer’s instructions
(see also APPENDIX 3B).
2. Combine in a beaker in the following order:
24 g urea25 mL 38% acrylamide/2% bisacrylamide5 mL 10× TBE electrophoresis buffer5 mL water.
Stir, heat in a microwave oven for 20 to 30 sec (not longer), and continue stirringuntil urea is dissolved.
This recipe produces a 20% acrylamide/8 M urea solution that should be prepared freshfor each gel. It can be scaled up for a larger gel or for several normal-sized gels. Degassingmay be performed, if desired.
If hexachlorofluorescein has been incorporated during RNA synthesis, urea should be leftout of the gel mixture and 10 mL water added instead, as urea leads to loss of the chlorinesubstituents on the fluorophore.
3. Make sure that acrylamide solution is stirring at room temperature. In quick succes-sion add 35 µL of 50% APS and 35 µL TEMED to the solution and continue stirringfor 10 sec.
4. Immediately pour gel solution between glass plates either from the beaker or usinga syringe as described in APPENDIX 3B. With notched glass plate on top, hold platesandwich at a 45° angle from the benchtop and slowly pour acrylamide solutionbetween the plates down one side. Adjust angle of plates such that gel solution flowsslowly and continuously without forming bubbles.
5. When solution reaches top of notched plate, lower gel sandwich to lie flat on an emptydisposable pipet tip rack. Insert thin side of a 1-mm one- or two-well comb into thesolution and slowly push in until it fits snugly with the notch of the upper glass plate.Be careful to avoid introducing bubbles. Let sit for 1 hr to polymerize.
For a typical 1-mol standard RNA synthesis (see Support Protocol 1) or a 0.2-molsynthesis from Dharmacon (see Support Protocol 2), one well of a two-well comb issufficient for good separation. If more material is expected, use a one-well comb instead.
Before continuing, make sure that the remaining acrylamide solution in the beaker, tiltedfor easier subsequent removal of polyacrylamide, has indeed polymerized.
Set up electrophoresis apparatus6. Once acrylamide is polymerized, remove seal or bottom spacer of gel sandwich.
Thoroughly clean outside of glass plates under running tap water to remove anypolyacrylamide and urea residue. Remove comb gently without tearing top of gel.
7. Place gel sandwich in electrophoresis apparatus and clamp plates to upper reservoir.Clamp aluminum plate for heat distribution on front plate.
8. Tilt gel apparatus and fill bottom reservoir with 1× TBE buffer. Adjust tilt of gelapparatus so that no buffer is spilled while air is displaced from bottom of gel. Filllower reservoir so that gel plates are submerged 2 to 3 cm. Remove any air bubblesat bottom of gel by squirting buffer between plates from one side using a 60-mLsyringe with a bent 18-G needle.
9. Fill upper reservoir of gel apparatus with 1× TBE buffer to ∼1 cm from rim.
10. Prerun gel ∼15 to 30 min at 25 W constant power.
In general, gels should be electrophoresed at ∼40 V/cm.
Current Protocols in Nucleic Acid Chemistry Supplement 11
11.10.7
RNA FoldingPathways
Load and run gel11. Turn off power. Rinse well(s) with 1× TBE buffer just prior to loading gel to remove
urea that has leached into the well. Use the same 60-mL syringe and bent 18-G needleused to remove bubbles from bottom of gel.
12. Dissolve the dried, deprotected RNA sample in 200 µL water and add an equal amountof 2× formamide loading buffer. Heat 1 min at 95°C, place in an ice water bath, andlet chill.
13. Load whole sample in a single well using a gel-loading tip. Use a fresh tip for eachsample to avoid cross-contamination.
If two samples are run on a two-well gel, mark them by placing labeled sticky tape on theoutside glass plate. Fold an edge of the tape over so that it can be removed easily.
14. Fill upper reservoir of gel apparatus with 1× TBE buffer to ∼1 cm from rim. If theRNA contains a fluorophore, cover gel apparatus with aluminum foil to protect thefluorophore from light.
CAUTION: Obviously, the aluminum foil must not contact the electrophoresis buffer;modern buffer reservoirs have covers to prevent that.
15. Run gel at 25 W constant power until bromphenol blue has reached an appropriatedistance (typically ∼1 to 3 cm) from the bottom of the gel (∼90 to 120 min).
Bromphenol blue co-migrates with ∼8-mer RNA.
Visualize RNA by UV shadowing16. Turn off power. Disassemble the gel apparatus and carefully open the gel sandwich
from an unnotched corner using a spatula. Place gel on one end of a piece of plasticwrap and wrap the gel completely.
If labeled sticky tape is used to mark the sample(s), transfer it onto the plastic wrap.
17. Wrap a 20 × 20–cm TLC plate with fluorescent indicator in plastic wrap. Place thewrapped gel on top of the TLC plate and visualize the RNA oligonucleotide under a312-nm UV lamp held directly over the TLC plate.
The UV-absorbing RNA blocks excitation and thus fluorescence emission of the indicatorand appears as a shadow.
If sensitivity is not high enough, switch to a 254-nm UV lamp; minimize exposure toshort-wavelength UV light to avoid photo-induced cross-linking. When RNA contains afluorophore, its absorbance (color) and fluorescence emission will indicate the location oflabeled RNA.
18. Mark desired RNA band on the plastic wrap with a permanent marker. Remove fromunder the UV lamp.
Normally, the slowest migrating band will be the most prevalent main product. Sometimes,however, there are branched oligonucleotides present that migrate even more slowly.Depending on the coupling efficiency of the modifications introduced, there may beexceptionally strong bands that migrate faster than the main product.
Supplement 11 Current Protocols in Nucleic Acid Chemistry
11.10.8
Probing RNAStructural
Dynamics andFunction by
FRET

Elute RNA from gel19. Slice the gel on the perimeter of the product band with a clean razor blade. Cut into
∼2 × 2–mm pieces.
20. Transfer the excised gel fragments into an empty Poly-Prep chromatography column,add 4 mL elution buffer, and close tightly. If a fluorophore is already attached to theRNA, wrap column in aluminum foil.
If labeled sticky tape was used to mark the sample(s), transfer it onto the column.
21. Tumble on a tube shaker overnight (16 to 20 hr) at 4°C.
22. Invert the Poly-Prep column, break off the bottom seal, uncap, and transfer the elutionbuffer into a 14-mL Falcon tube by gravity flow.
If yield is critical, a second gel elution typically yields an additional ∼20% of the firstelution.
23. Extract SDS from the elution buffer by thoroughly vortexing with an equal volumeof buffered chloroform and centrifuge 10 min at 13,000 × g, 4°C, to separate thephases. Transfer the top (aqueous) phase to a fresh Falcon tube.
If a pronounced interphase is carried over, a second chloroform extraction may be used tominimize it.
24. Add 100 mM ATP or GTP to a final concentration of 1 mM, then add 2 to 2.5 vol of100% ethanol, and precipitate RNA overnight at –20°C or 2 hr at −70°C.
Using ATP or GTP as a carrier increases the precipitation yield.
25. Centrifuge 30 min at 13,000 × g, 4oC, to collect RNA precipitate. Decant supernatant,wash with 80% ethanol, decant supernatant, and dry RNA in a Speedvac evaporatorcovered with aluminum foil.
Dried RNA can be stored in a freezer at −20°C until HPLC purification (stable at least 1month). Typical yields at this point are 20 to 100 nmol RNA from a 1-mol scale synthesis.
Save all supernatants until you know that RNA has been recovered.
26. Resuspend dried RNA in 90 µL water for subsequent C8 reversed-phase HPLC (seeSupport Protocol 4).
SUPPORTPROTOCOL 4
C8 REVERSED-PHASE PURIFICATION OF RNA OLIGONUCLEOTIDES
C8 reserved-phase HPLC is an efficient way to separate the desired RNA from not fullydeprotected material and small organic molecule contaminants from previous steps.Reversed-phase HPLC of synthetic nucleic acids is described in general in UNIT 10.5. Thisprotocol therefore focuses on the specific parameters optimized and streamlined formodified RNA.
Materials
Gel-purified RNA sample (see Support Protocol 3)100 mM TEAA buffer, pH 7 (see recipe)Acetonitrile (see recipe)
Centrifugal filtration unit (0.45-µm; Amicon)HPLC system (UNIT 10.5) with 4.6 × 250–mm Microsorb 100 C8 analytical column
(5-µm particle size; Varian) and optional guard columnSpeedvac evaporator (e.g., Savant)Aluminum foilSpectrophotometer (220 to 800 nm)
Additional reagents and equipment for reversed-phase HPLC (UNIT 10.5)
Current Protocols in Nucleic Acid Chemistry Supplement 11
11.10.9
RNA FoldingPathways

1. For an analytical run, dilute 5 µL gel-purified RNA in 50 µL of 100 mM TEAA buffer,pH 7. For a preparative run, use 50% of the gel-purified RNA sample directly. Removeany particles with a centrifugal filtration unit.
It is always wise to first perform an analytical run to determine the elution volume of anewly synthesized RNA so that the fraction collector can be properly programmed for thepreparative run. Keeping 50% of the RNA sample for a second preparative run is advisedin case of unexpected loss.
2. Start and equilibrate the HPLC system with 100% mobile phase A (100 mM TEAAbuffer) according to manufacturer’s instructions. Program the gradient system (seestep 4) and fraction collector (see step 5).
A guard column may be used to prolong the life of the separation column.
3. Inject the RNA sample, making sure that the sample loop volume is sufficiently large(typically 100 µL).
4. Increase the percentage of mobile phase B (acetonitrile) with time according to oneof the gradients listed in Table 11.10.1, depending on the particular sample.
Eluted RNA is detected by UV absorbance at 254 nm. Using the gradients listed in Table11.10.1 on a Microsorb C8 column leads to typical elution volumes between 12 and 18 minat a flow rate of 1 mL/min. If ATP or GTP was used as carrier for the ethanol precipitation,an additional peak is expected at ∼10 min.
An attached fluorophore considerably retards elution of an RNA (by several min) comparedto the unlabeled control. If RNA is purified after a fluorophore labeling reaction, additionalpeaks at high elution times (typically >18 min) will originate from excess free fluorophore.
5. Collect peak fractions and dry in a Speedvac evaporator. Cover the evaporator withaluminum foil if the RNA contains a fluorophore.
At a flow rate of 1 mL/min, three to four fractions should be collected per min.
6. Dissolve each fraction in a suitable volume of water (20 to 200 µL) and combine allfractions that originate from the same HPLC elution peak.
Table 11.10.1 Common Mobile Phase Gradients for Reversed-Phase HPLC Purification ofRNAa
Sample Elapsed time (min) % Mobile phase B at elapsed time
RNA without fluorophores 0 024 2034 40
RNA with fluorophores 0 050 60
RNA with Cy5 and Cy3 0 020 2060 4070 60
aGradient conditions are based on a flow rate of 1 mL/min using a 4.6 × 250–mm Microsorb 100 C8 column (5-µm particlesize; Varian) at ambient temperature, and should be similar on other C8 reversed-phase columns.
Supplement 11 Current Protocols in Nucleic Acid Chemistry
11.10.10
Probing RNAStructural
Dynamics andFunction by
FRET

7. Obtain a UV absorption spectrum of a 1:100 (v/v) diluted sample from 220 to 800nm and calculate concentration from the peak absorption at 260 nm (1 A260 unit =0.037 mg/mL RNA).
Typical yields are 10% to 50% of the starting material.
Alternatively, the molar extinction coefficient at 260 nm (ε260) of an RNA of given sequencecan be estimated as the sum of extinction coefficients of the composing nucleotides, whereε260 (U) = 9,900 L mol−1 cm−1, ε260 (A) = 15,200 L mol−1 cm−1, ε260 (C) = 7,050 L mol−1
cm−1, and ε260 (G) = 12,010 L mol−1 cm−1.
To calculate the concentration of a fluorophore-containing RNA, the additional absorbanceof the fluorophore(s) at 260 nm should be subtracted. For fluorescein, A260/A492 = 0.3; forhexachlorofluorescein, A260/A535 = 0.3; for tetramethylrhodamine, A260/A554 = 0.49.
8. Store purified RNA (stable at least 2 years) at –20°C. If a fluorophore is alreadyattached to the RNA, wrap tube in aluminum foil to protect from light.
BASICPROTOCOL 2
DATA ACQUISITION AND ANALYSIS FOR STEADY-STATE FRETSuccessful application of fluorescence methods in general hinges on paying closeattention to experimental detail. There are numerous artifacts that can distort results anddistract from obtaining meaningful results. Erroneous signals may arise from backgroundfluorescence of solvents, stray light through the fluorometer, Raleigh and Raman scatter,higher-order light diffraction by the monochromator, and others. For more informationon the origin of these artifacts, see Lakowicz (1999). In order to avoid these potentialpitfalls, it is important to prepare samples and buffer solutions carefully, implement propermeasurement and sample controls, and analyze data thoughtfully and on a case-by-casebasis for each new RNA system. The following protocol describes generalized guidelinesfor: (1) preparation of samples and buffers, (2) getting started (the first steady-statefluorescence experiments), and (3) steady-state FRET data analysis.
To observe a conformational change by steady-state FRET, the system needs to beperturbed in a way that results in a distance change between the fluorophore pair. Steps4 through 10 describe how this can be accomplished. Steady-state FRET refers to acontinuous excitation of the donor as well as continuous recording of the donor andacceptor fluorescence signals. Such measurements can be done with widely availableequipment to yield kinetic rate information, and should be the first experiments to beperformed on a new RNA system. For analysis strategies in more sophisticated applica-tions such as nanosecond time-resolved FRET for measurements of fluorophore distancedistributions, please see Klostermeier and Millar (2001b).
Materials
Fluorophore-labeled RNA sample of choice (see Basic Protocol 1)Buffer of choiceArgon gas (optional)Contrad 70 detergent (e.g., Fisher)
Water or oil pump connected to side-arm Erlenmeyer flask (optional)Luer-tip syringe (e.g., Fisher)Centrifugal filtration unit (0.45-µm; Amicon)Quartz microcuvette (fill volume 120 to 150 µL; e.g., Starna)Research-type spectrofluorometer (e.g., Thermo Spectronic AMINCO-Bowman
Series 2 or equivalent instrument from Jobin Yvon, Hitachi, or others), ideallywith temperature control and stopped-flow equipment for fast kinetics
Large-volume gel-loading tips (e.g., Fisher)
Current Protocols in Nucleic Acid Chemistry Supplement 11
11.10.11
RNA FoldingPathways
NOTE: If a circulating water bath is used with the spectrofluorometer, the temperaturedifference between the bath and the cuvette content should be calibrated.
Prepare samples and buffers1. Use only highly purified RNA(s) (see Support Protocols 3 and 4) with fluorophores
of choice attached (see Basic Protocol 1 and Commentary).
2. Choose the buffer of interest for the particular experiment. Prepare buffers using onlyhigh-quality nonfluorescent components.
Most buffer components will be compatible with fluorescence experiments. Exceptionsinclude (1) high concentrations of transition metal ions, iodide, and some aromaticcompounds that quench fluorophores; (2) components that themselves are fluorescent; or(3) components that make the solution very viscous or turbid. High viscosity complicatesmixing and lowers fluorophore mobility, thus increasing fluorescence anisotropy. Highturbidity leads to strong light scattering.
3. Carefully remove oxygen from all buffer stock solutions used to make up the finalsample by one or several of the following methods:
a. Loosen container cap and heat solution in a microwave oven until close to boiling.Tighten cap, shake, loosen cap to release pressure, and repeat until no more bubblesemanate from the solution.
b. Degas solution under partial vacuum by applying a water or oil pump to a side-armErlenmeyer flask that contains the solution in a bottle or tube with loose cap.
c. For smaller volumes (e.g., up to 30 mL), load a luer-tip syringe with the solution,place Parafilm over the tip, and pull the plunger, allowing released air bubbles tomove to the syringe tip. Remove the Parafilm and release all of the air. Repeat twoto three times until no more air bubbles form.
d. Bubble clean argon gas from a gas cylinder through the solution for 30 min.
Get started: perform the first steady-state fluorescence experiments4. Anneal the fluorophore-labeled RNA in 145 µL buffer of choice by heating to 70°C
for 2 min and cooling to room temperature over 5 min.
Fluorophore concentrations of 20 to 50 nM typically give a good signal-to-noise ratio. Ifseparate RNA strands are annealed, unlabeled strands should be kept at an excess sufficientto saturate the labeled one. If donor and acceptor are coupled to two different segments ofan RNA, the complex should be purified from any excess of the individual strands (seeCommentary).
Most standard fluorophores tolerate denaturation temperatures of 70°C. To anneal highlybase-paired RNAs, higher temperatures may be necessary.
5. Centrifuge filter to remove all particles that may scatter light.
6. Clean a quartz microcuvette with 5% (v/v) Contrad 70 or other detergent and rinsethoroughly with clean, autoclaved RNase-free water. Transfer RNA solution into thecuvette. Equilibrate at temperature of choice for 15 min.
7. Measure emission and excitation spectra of the sample. For the emission spectrum,excite the donor at its peak absorbance and scan emission from 10 to 150 or 200 nmabove this wavelength. For the excitation spectrum, detect at the acceptor peakemission and scan the excitation from 150 or 200 to 10 nm below this wavelength.Make sure that emission and excitation peaks for the specific fluorophore pair appearat the expected wavelengths.
If the signal is too weak, adjust excitation and emission slit widths and signal amplification;if this is insufficient, raise the RNA concentration.
Supplement 11 Current Protocols in Nucleic Acid Chemistry
11.10.12
Probing RNAStructural
Dynamics andFunction by
FRET

If a strong signal is observed where it is not expected, make sure that it is not due to straylight (from light leaks in the fluorometer), Raleigh scattering (from a turbid solution),Raman scattering (will also be observed in a fluorophore-free control), or a second-orderlight diffraction in the monochromator (will have double the excitation wavelength). If aphotomultiplier tube is used for detection, make sure it is not overloaded and damaged. Ifeffects from the dependence of the monochromator transmission efficiency on samplepolarization are to be avoided, e.g., for accurate donor-acceptor distance measurements,magic angle polarizer conditions need to be chosen at the expense of emission signal(Lakowicz, 1999).
8. Excite the donor at its excitation peak wavelength, and record its fluorescence traceat the emission peak wavelength over a sufficient time course (initially this may be10 to 30 min at 1 datum per second). Ideally, record the acceptor signal simultane-ously. Make sure that both signals are stable over time.
If the signals are not stable, make sure that the solution is not visibly changing (i.e., forminga precipitate, evaporating), or ensure that a dust particle is not drifting through the lightpath. If one or both signals slowly decrease, fluorophore photobleaching may be the cause.This can be tested by decreasing the excitation slit width, i.e., lowering the excitationintensity. If the signal decrease becomes slower or less pronounced, photobleaching islikely the cause. In many cases photobleaching can be reduced by using a lower excitationintensity, by more completely removing oxygen (see above), or by adding a radicalquencher and singlet oxygen scavenger such as 25 mM dithiothreitol.
9. Start a new time course, wait for 100 sec to ensure that the fluorescence signal isindeed stable, then close the emission shutter and access the sample to add 5 µL ofan additive that perturbs the RNA system. To achieve fast manual mixing, use asmall-volume pipet with a sequencing gel-loading tip to add the additive to the bottomof the cuvette and quickly pipet up and down twice with a large-volume (200-µL)pipet with gel-loading tip. Be sure not to place air bubbles in the cuvette. Close thefluorometer and open the emission shutter to continue recording.
Possible additives include an additional RNA strand that binds to the fluorophore-labeledRNA (e.g., a substrate binding to a catalytic RNA), Mg2+ to assist RNA folding, or EDTAto chelate Mg2+ already present. The concentration of the additive should be in saturatingexcess so that simplified (i.e., pseudo-first order) reaction kinetics can be expected.
If the FRET change is too fast for manual mixing, employ stopped-flow fluorescenceequipment. This consumes considerably larger quantities of material, due to increasedrequirements both in concentration and volume.
10. Record the complete time course for both donor and acceptor emission and repeatexperiment to acquire multiple data sets for calculating a standard deviation.
Since all RNA molecules are synchronized with respect to the time of disturbance, anychange in fluorophore distance and FRET in response to mixing will be observed as anensemble-averaged relaxation to the new equilibrium.
Analyze steady-state FRET data11. A meaningful steady-state FRET change is characterized by donor and acceptor
signal changes in opposite directions. For a simple way to analyze these changes,calculate the ratio of acceptor to donor fluorescence over time as a relative measurefor FRET efficiency. Discard any traces that contain artifacts or are particularlydifferent from the majority. To extract rate constants, follow the procedure outlinedin UNIT 11.7 (protocol for determination of tertiary folding rates and activationparameters).
12. To understand the origin of the observed FRET change(s), design control experimentsin which specific experimental parameters are systematically altered, such as con-centration or nature of additive, temperature, sequence of the RNA, and so on. SeeCommentary for explicit examples that can be found in the literature.
Current Protocols in Nucleic Acid Chemistry Supplement 11
11.10.13
RNA FoldingPathways

REAGENTS AND SOLUTIONS
Use deionized, distilled, RNase-free water in all recipes and protocol steps. For common stock solutions,see APPENDIX 2A; for suppliers, see SUPPLIERS APPENDIX.
Acetic acid/TEMED, 100 mM, pH 3.857.8 µL glacial acetic acid5 mL waterAdjust to pH 3.8 with N,N,N′,N′-tetramethylethylenediamine (TEMED)Bring to 10 mL with waterStore up to 1 year at –20°C
AcetonitrileSterile filter and degas HPLC-grade acetonitrile through a 0.2-µM, organic-solvent-resistant bottletop filter (e.g., Millipore Millicup HV). Store up to 1 year at roomtemperature.
Ammonium persulfate (APS), 50% (w/v)5 g ammonium persulfateBring up to 10 mL with waterStore up to 1 year at –20°C
Chloroform, bufferedMix 96 mL chloroform with 4 mL isoamyl alcohol. Overlay with 1⁄5 vol of 1× TEbuffer (APPENDIX 2A) and mix again. Store up to 1 year at room temperature. Forchloroform extraction, use organic (lower) phase.
Elution buffer6.67 mL 7.5 M ammonium acetate (final 500 mM)
1 mL 10% (w/v) SDS (APPENDIX 2A; final 0.1%)20 µL 0.5 M EDTA, pH 8.0 (APPENDIX 2A; final 0.1 mM)Bring to 100 mL with waterSterilize by filtrationStore up to 6 months at room temperature
Formamide loading buffer, 2×9 mL deionized formamide1 mL 1× TBE electrophoresis buffer (APPENDIX 2A)100 µL 2.5% (w/v) bromphenol blueStore up to 1 year at –20°C
HEPES-KOH, 100 mM, pH 7.0238.3 mg HEPES8 mL waterAdjust to 7.0 pH with 1 M KOHBring to 10 mL with waterStore up to 1 year at –20°C
Sodium tetraborate, 100 mM, pH 8.5381 mg sodium tetraborate decahydrate8 mL waterAdjust to 8.5 pH with half-concentrated HClBring to 10 mL with waterStore up to 1 year at –20°C
Supplement 11 Current Protocols in Nucleic Acid Chemistry
11.10.14
Probing RNAStructural
Dynamics andFunction by
FRET

Triethylammonium acetate (TEAA) buffer, 100 mM, pH 71.8 L water12.6 mL glacial acetic acid28 mL triethylamineAdjust to pH 7.0; when approaching pH 7.0, proceed slowly with addition of ace-
tic acid or triethylamine so as not to overshootBring to 2 L with waterSterile filter and degas through a 0.22-µm bottletop filterStore up to 1 year at room temperature
COMMENTARY
Background InformationThe structure, dynamics, and function of
several catalytic RNAs have been studied re-cently by FRET, including the hammerhead(Tuschl et al., 1994; Perkins et al., 1996; Bassiet al., 1997, 1999; Singh et al., 1999), hairpin(Murchie et al., 1998; Walter et al., 1998b,1999, 2000, 2001; Pinard et al., 1999; Kloster-meier and Millar, 2000, 2001a; Zhuang et al.,2002), hepatitis delta virus (Pereira et al.,2002), Varkud Satellite (Lafontaine et al.,2001a,b, 2002), and Tetrahymena ribozymes(Zhuang et al., 2000), as well as tRNA (Chanet al., 1999), a three-helix junction from E. coli16S rRNA (Ha et al., 1999), and the RNAfour-helix junction of U1 snRNA (Walter et al.,1998a). FRET techniques are applicable to anynumber of RNAs or RNA-protein complexes,and literature examples of their applications areincreasing rapidly.
FRET is the nonradiative transfer throughspace of the excited-state energy of an exciteddonor fluorophore to an acceptor fluorophore.When the two fluorophores are covalently teth-ered to defined sites on a biopolymer or amacromolecular complex, FRET can be usedas a molecular ruler to estimate the distancebetween them. The donor normally emits at ashorter wavelength (higher energy) than theacceptor, which makes it easy to optically dis-tinguish and quantify their relative emissions.The energy transfer efficiency (ET) stronglydepends on the distance R between the twointeracting fluorophores:
where R0 is the Förster distance at which 50%of the donor energy is transferred. R0 accountsfor all factors besides distance that influencethe rate of energy transfer, including the overlap
of the emission spectrum of the donor with theabsorption spectrum of the acceptor, the donorquantum yield, and the relative orientation ofthe donor and acceptor transition dipole mo-ments:
where ΦD is the donor fluorescence quantumyield in the absence of acceptor, κ2 is the ori-entation factor of the interacting transition di-pole moments, n is the refractive index of themedium, and J(λ) is the spectral overlap inte-gral of donor emission and acceptor absorption.
For most donor-acceptor pairs R0 has a valueof 15 to 90 Å. FRET can be used to estimatethe distance between the two fluorophoreswhen that distance is in the range of ∼0.5 to 2times R0. This feature makes FRET an ideal toolto complement other techniques that are ap-plied to biological macromolecules to measureglobal architectures and their changes, such asNMR spectroscopy and electron microscopy,which are most sensitive at smaller and largerdistances, respectively.
The accessible range of rate constants thatcan be measured by FRET is limited only bythe available fluorometer equipment and itsdead time. Manual mixing has a typical deadtime of 5 sec, limiting the measurable rateconstants to less than ∼5 min–1. Rapid-mixing(stopped-flow) techniques reach dead times of2 msec and below. Continuous-flow mixingtechniques reach microsecond dead times. Re-laxation techniques such as laser-induced tem-perature jumps can reach nanosecond deadtimes. All of these techniques can be coupledwith FRET detection of structural changes.
60
T 6 60
RE
R R=
+Equation 11.10.1
286 2 40 D
6
8.79 10 ( )
(in Å )
R n J− −= × × Φ × κ × × λ
Equation 11.10.2
Current Protocols in Nucleic Acid Chemistry Supplement 11
11.10.15
RNA FoldingPathways

Critical ParametersStrategic planning is critical for a successful
application of FRET to RNA, since each systemis quite idiosynchratic, making generalizationsdifficult. The effort invested in planning is oftenmore than compensated by the unique insightsgained from a successful experiment. Figure11.10.1 summarizes a practical strategy toadapt a new RNA system to the use of FRETtechniques.
Selection of RNA sequenceFirst, one has to decide on the RNA sequence
to study. Often, it might be useful to start witha wild-type or previously characterized se-quence, but it is advisable to computationallycheck whether this sequence is predicted to foldhomogeneously, e.g., by using Michael Zuker’sonline RNA folding software mfold version3.1 (http://www.bioinfo.rpi.edu/applications/mfold/old/rna/form1.cgi) or Douglas Turner’sPC version RNAstructure (http://rna.chem.rochester.edu; see UNIT 11.2; Mathews et al.,
design RNA of interestwith two fluorophores
attached
synthesizedeprotect,
purify, label RNA
introduce mutationsexpected to inducestructural changes
Absence ofsterical clash of fluorophores
with known structuralelements?
Does RNA± fluorophores structurallyand functionally behave
the same?
Are the alternativestructures likely part of the
folding pathway?
Do co-factorsinduce structural
changes?
Does the RNAfold homogeneously by
steady-state FRET,gel shift, etc.?
characterize isomersstructurally, kinetically,
thermodynamically
yes
yes
yes
yes
no
no
no
no
no
Figure 11.10.1 Iterative procedure to adapt a new RNA system to the use of FRET for studyingstructural dynamics. Adapted from Walter (2001) with permission from Academic Press.
Supplement 11 Current Protocols in Nucleic Acid Chemistry
11.10.16
Probing RNAStructural
Dynamics andFunction by
FRET

1999). In case of the hairpin ribozyme, forexample, self-complementarity of the wild-type substrate was discovered and could beeliminated by careful redesign of the substrateand substrate-binding strands, under retentionof all conserved base positions (Butcher et al.,1995; Walter and Burke, 1997). This modifica-tion led to improved catalytic (Esteban et al.,1997) and structural behavior (Hampel et al.,1998), which, in turn, allowed for a detailedcharacterization by FRET (Walter et al., 1998b,1999; Zhuang et al., 2002). A simple computa-tional check of all RNA strands for undesiredsecondary structures becomes particularly im-portant when dividing a large RNA into severalsmaller strands that are synthesized to site-spe-cifically introduce fluorophores.
Fluorescent labeling strategies:Labeling during or after synthesis
Unlike proteins, most RNAs do not containintrinsic fluorophores (Walter and Burke,2000). The most efficient way to site-specifi-cally introduce the two fluorophores necessaryfor FRET is by synthesizing the fluorophore-containing RNA strand(s). The fluorophore canbe added during or after synthesis; in the lattercase, a functional group is introduced duringsynthesis that allows for subsequent couplingto a reactive fluorophore derivative. Detaileddescriptions of the many possible syntheticstrategies are given elsewhere (Qin and Pyle,1999; Walter and Burke, 2000). In general,solid-phase RNA synthesis in the 3′→5′ direc-tion based on phosphoramidite chemistry (UNIT
3.5 and APPENDIX 3B) can be modified to intro-duce:
1. On the 5′ end: Fluorophore derivativesthat are resistant to RNA deprotection chemis-try (e.g., fluorescein or cyanine phos-phoramidites).
2. On the 3′ end or internally: Fluorophoresthat are resistant to both the coupling and de-protection chemistries (e.g., fluorescein), usingcolumn supports and nucleotide phos-phoramidites, respectively, modified with link-ers carrying the fluorophore.
3. On the 5′ or 3′ ends or internally: Ali-phatic amino or thiol linkers that can be post-synthetically coupled under mild conditionswith derivatives (e.g., amino-reactive succin-imidyl esters or thiol-reactive maleimides) ofchemically sensitive fluorophores (e.g., rho-damines).
New variations of these themes are continu-ously being developed, for example, the use ofa site-specific phosphorothioate modification
for internal labeling (Konarska, 1999). Assem-bling the RNA on an automated DNA/RNAsynthesizer (e.g., PE Applied Biosystems;http://www.appliedbiosystems.com) is quitestraightforward using β-cyanoethyl phos-phoramidites supplied by companies such asGlen Research (http://www.glenres.com),ChemGenes (http://www.chemgenes.com),Amersham Pharmacia Biotech (http://www.apbiotech.com), BD Biosciences (http://www.clontech.com), CPG (http://www.cpg-biotech.com), Cruachem (http://www.cruachem.com),Dalton Chemical Laboratories (http://www.dalton.com), or PE Applied Biosystems. Moreexpensive, yet very convenient, is the option tobuy from commercial suppliers of syntheticRNA such as Dharmacon Research(http://www.dharmacon.com), Xeragon (http://www.xeragon.com), Midland Certified Re-agent Co. (http://www.mcrc.com), IBA GmbH(http://www.iba-go.com), the Keck Founda-tion’s Biotechnology Resource Laboratory atthe Yale University School of Medicine(http://www.info.med.yale.edu/wmkeck/oligos),Oligos Etc. (http:// www.oligosetc.com), CPG,or Cruachem. Some of these suppliers, such asDharmacon and Xeragon, use alternative 2′-OH protection chemistries to increase synthesisyield and maximum length of the synthesizedRNA. Many reactive fluorophore derivativesfor postsynthetic labeling of RNA are availablefrom Molecular Probes (http://www.probes.com) or Sigma-Aldrich (http://www.sigma-aldrich.com). Succinimidyl esters of the cyan-ine dyes may be currently obtained only fromAmersham Pharmacia Biotech.
Fluorophore labeling strategies:Coupling sites and fluorophores
At present, the length of a synthetic RNA isrestricted to ∼50 to 80 nt due to limited couplingefficiency per nucleotide cycle. One way toovercome this limitation is to change the RNAstrand connectivity; in the case of the hairpinribozyme, this led to the use of a two-partiteribozyme with fluorophores on the 5′ and 3′ends of the 32-nt 5′ segment. The ribozymeassembles by hybridization with a 21-nt 3′segment and a 14-nt substrate (Walter et al.,1998b). Other approaches have used donor andacceptor on two different hybridized segmentsof an RNA; in this case, either the complex mustbe purified from any excess of individualstrands (Bassi et al., 1997; Murchie et al., 1998;Lafontaine et al., 2001a) or the analysis mustdiscriminate against an excess of (typically) theacceptor-labeled strand (Klostermeier and Mil-
Current Protocols in Nucleic Acid Chemistry Supplement 11
11.10.17
RNA FoldingPathways

lar, 2000, 2001a). In an elegant single-moleculeFRET study, the donor fluorophore was cou-pled to an external substrate, while the acceptorwas introduced through a DNA oligonucleotidecomplementary to a 3′ extension of the Tetra-hymena ribozyme (Zhuang et al., 2000). TheDNA oligonucleotide was also surface bound,which allowed any excess donor-labeled sub-strate to be washed away. Alternatively, a longcontiguous RNA strand bearing an internalFRET fluorophore pair can be constructed byligating, e.g., a synthetic fluorophore-labeledstrand with one or two RNAs derived fromnatural sources or by in vitro transcription usingT4 DNA ligase and a DNA splint (for reviewssee Moore, 1999; Qin and Pyle, 1999). Addi-tional enzymatic and chemical ligation meth-ods are currently being developed.
The choice of the two labeling sites, fluoro-phores, tether lengths, and adjacent RNA se-quences depends on the unique features of thesystem to be studied. In general, the followingconsiderations should be taken into account:
1. Available information on folding path-ways and three-dimensional structures shouldbe used to choose labeling sites expected tominimally interfere with biological function.
2. If structural transitions are to be ob-served, the attachment sites of the two fluoro-phores should be chosen to maximize the ex-pected distance changes.
3. Each donor-acceptor pair is charac-terized by a specific Förster distance, R0 (Wuand Brand, 1994; Lakowicz, 1999). Accordingto Equation 11.10.1, changes in FRET effi-ciency are at a maximum for distance changesthat approximate R0. Hence, choosing a fluoro-phore pair whose R0 is close to the measureddistance (e.g., within approximately two fold)will increase the sensitivity toward distancechanges.
4. For certain requirements, specific donor-acceptor pairs may be better suited than others.The following criteria need to be weighedagainst each other to choose fluorophores for agiven problem. If quantity is an issue, highlabeling yields can be obtained with fluoropho-res incorporated during synthesis. A large sepa-ration of the donor and acceptor emission peakssimplifies their optical distinction, if requiredby the available detection filters. High absorp-tion, fluorescence quantum yield, and photo-stability lead to enhanced sensitivity, as re-quired, e.g., for single-molecule FRET appli-cations. Some fluorophore pairs that have beensuccessfully used are listed below (see discus-sion of fluorophore pairs for FRET).
5. The labeling chemistry has to allow forsite-specific incorporation of the two fluoro-phores. There are four options to accomplishsuch specificity. (1) Both fluorophores can beincorporated during the synthesis of a singleRNA strand. (2) One fluorophore can be incor-porated during and one after synthesis of asingle RNA strand. (3) Both fluorophores canbe incorporated after synthesis of a single RNAstrand that carries two modifications allowingfor distinct and specific (orthogonal) labelingchemistries, such as one thiol and one aminofunctionality. (4) The fluorophores can be in-corporated into separate RNA strands that areassembled by hybridization or ligation. Thechoice of approach depends in part on thefluorophores used (see discussion of fluoro-phore pairs for FRET below).
6. A sufficient length of the fluorophoretether is necessary to assure high conforma-tional dynamics. Such fast isotropic motion ofthe fluorophores is important for absolute dis-tance measurements between donor and ac-ceptor from Equation 11.10.1, since the Försterdistance, R0, depends on the orientation factorκ2 of the interacting transition dipole moments(see Equation 11.10.2).
The following values are normally well de-fined for a given system: ΦD, the donor fluo-rescence quantum yield in the absence of ac-ceptor; n, the refractive index of the medium;and J(λ), the spectral overlap integral of donoremission and acceptor absorption. In principle,κ2 can range from 0 to 4 and is defined for afixed relative fluorophore orientation; however,this is difficult to achieve in a dynamic solu-tion-based system. The only other case in whichκ2 adopts a well-defined value (of 2⁄3) is if thetransition dipole moments of the two interact-ing fluorophores have an isotropic (random)relative orientation, i.e., show low fluorescenceanisotropy after excitation with polarized lightdue to high conformational dynamics (Lak-owicz, 1999; Klostermeier and Millar, 2001b;Parkhurst et al., 2001). In this case, R0 for agiven FRET pair can be determined from Equa-tion 11.10.2 so that Equation 11.10.1 yields thefluorophore distance.
7. Often, the emission of an excited fluoro-phore is quenched by a proximal nucleobasethrough an outer-sphere electron transfer be-tween the two species. According to Marcustheory (Marcus, 1964), the rate of quenching isgoverned by the frequency of diffusional en-counters of the excited fluorophore with thequenching base, as well as the activation barrierof their redox chemistry (Seidel et al., 1996).
Supplement 11 Current Protocols in Nucleic Acid Chemistry
11.10.18
Probing RNAStructural
Dynamics andFunction by
FRET

Therefore, the RNA sequence immediately ad-jacent to the fluorophore (and, to some extent,the fluorophore tether length; Dapprich et al.,1997) has an influence on the extent of quench-ing. For example, both fluorescein (Walter andBurke, 1997) and tetramethylrhodamine(Widengren et al., 1997), which constitute apopular FRET pair, are quenched by guanine.Such nucleobase-specific quenching has beenutilized to observe RNA secondary structureformation (Walter and Burke, 1997; Walter etal., 1998b), yet it is best avoided to allow forabsolute distance measurements by time-re-solved FRET (Walter et al., 1999; Walter andBurke, 2000).
Fluorophore pairs for FRETTypical examples for fluorophore pairs used
on RNA are:1. Fluorescein (exmax = 490 nm; emmax =
520 nm; quantum yield, qy = 71%) and hexa-chlorofluorescein (exmax = 538 nm; emmax =551 nm). Both can be incorporated during orafter synthesis. Pinard et al. (1999); Walter etal. (1998b, 2000, 2001).
2. Fluorescein and tetramethylrhodamine(exmax = 554 nm; emmax = 573 nm; qy = 28%).Any of a number of other rhodamines can alsobe used, but this is probably the most widelyused and photophysically best understoodFRET pair. Tetramethylrhodamine should beincorporated after synthesis. Clegg (1992);Tuschl et al. (1994); Perkins et al. (1996); Chanet al. (1999); Singh et al. (1999); Walter et al.(1999); Klostermeier and Millar (2000).
3. Fluorescein and cyanine 3 (Cy3; exmax =554 nm; emmax = 573 nm; qy = 14%). Cy3 canbe incorporated on the 5′ end during synthesisor anywhere after synthesis. Bassi et al. (1997,1999); Murchie et al. (1998); Ha et al. (1999);Lafontaine et al. (2001a,b, 2002).
4. Tetramethylrhodamine and Cy5 (exmax =652 nm; emmax = 672 nm; qy = 18%). Cy5 canbe incorporated on the 5′ end during synthesisor anywhere after synthesis. The photophysicsof Cy5 seem to involve fast photobleaching anddark states that are not yet well understood.Deniz et al. (1999).
5. Cy3 and Cy5 (Klostermeier and Millar,2001a). This FRET pair is particularly usefulfor single-molecule experiments (Zhuang et al.,2000, 2002).
Preparation of RNA and initial experimentsOnce the RNA sequence, strand connectiv-
ity, and modifications are chosen, the RNA issynthesized, deprotected, and purified. Post-
synthetically attached fluorophores are cou-pled at this stage. After a final HPLC purifica-tion step, the fluorophore-labeled RNA shouldbe compared to unlabeled RNA to ensure thatthe fluorophore modification does not interferewith biological function (Fig. 11.10.1). If thereare specific activity assays available, such asthose for catalytic RNAs, they should be per-formed and compared in the presence and ab-sence of the fluorophores. In principle, anybiophysical or biochemical technique that gen-erates a signature of proper folding and func-tion may be used. As a broadly applicablemethod, unimpaired native folding may betested on a nondenaturing polyacrylamide gelas described in UNIT 11.4, and may be detectedeither by autoradiography of radiolabeled RNAand/or by gel-based FRET analysis of fluoro-phore-labeled RNA (Ramirez-Carrozzi andKerppola, 2001; Pereira et al., 2002). Suchinitial experiments may well yield the firstevidence for RNA structural changes. For ex-ample, native gels may reveal alternate tertiarystructures as part of an RNA folding pathway,if their interconversion rate is slow (Emerickand Woodson, 1994; Juneau and Cech, 1999;Pan et al., 2000; Pinard et al., 2001). Suchstructures may then be further characterized byFRET. Alternatively, RNA structural changesmay be induced by the addition of co-factors(Emerick and Woodson, 1994) or substrates(Walter et al., 1998b), or by the introduction ofmutations known to interfere with activity(Bassi et al., 1996; Pinard et al., 2001). Byfollowing the strategic plan in Figure 11.10.1and combining complementary biochemicaland biophysical techniques with FRET, one islikely to capture the most relevant and function-ally important RNA structural changes.
Anticipated ResultsA typical result for a steady-state FRET
assay is exemplified in Figure 11.10.2 for thehairpin ribozyme-substrate complex. A mini-mal reaction pathway of this ribozyme thatcleaves an external substrate is composed ofthree reversible steps: substrate binding, cleav-age, and product dissociation (Hegg and Fedor,1995; Esteban et al., 1997; Walter et al., 1997).Previous linker insertion studies of the junctionbetween the two independently folding do-mains A and B of the hairpin ribozyme-sub-strate complex (Feldstein and Bruening, 1993;Komatsu et al., 1994) suggested that a confor-mational change, docking of the two domains,occurred after binding and before the chemicalstep of the reaction. To observe this structural
Current Protocols in Nucleic Acid Chemistry Supplement 11
11.10.19
RNA FoldingPathways
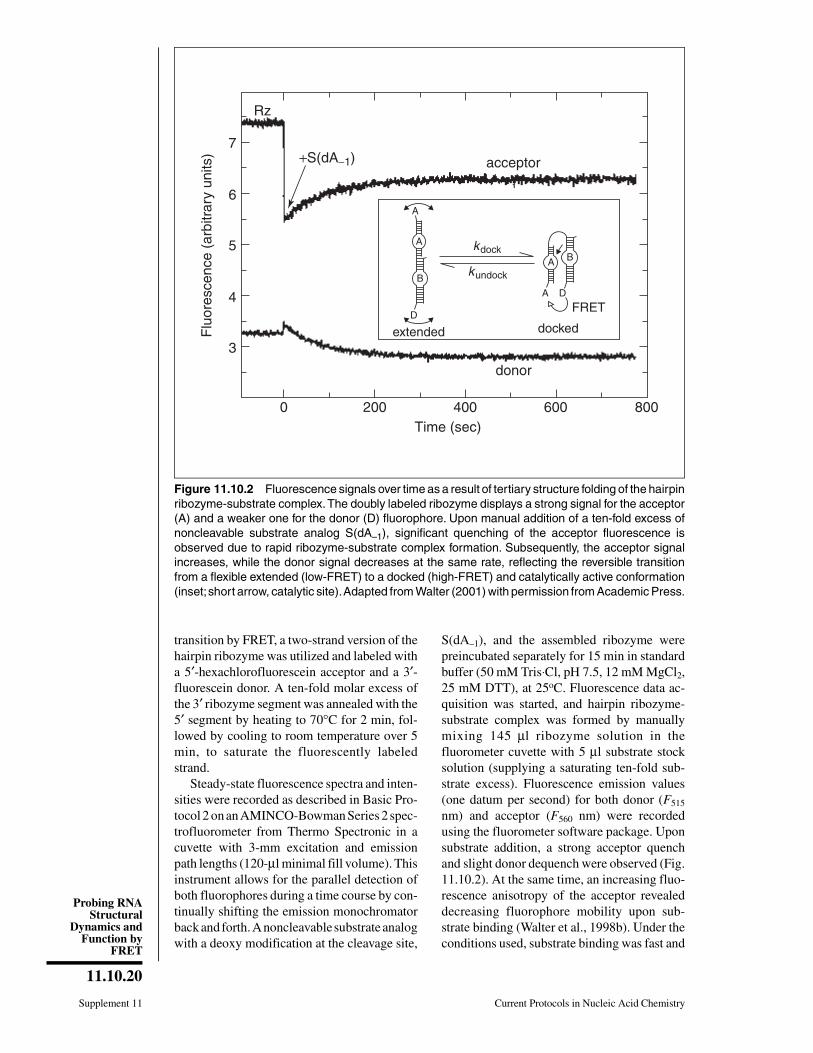
transition by FRET, a two-strand version of thehairpin ribozyme was utilized and labeled witha 5′-hexachlorofluorescein acceptor and a 3′-fluorescein donor. A ten-fold molar excess ofthe 3′ ribozyme segment was annealed with the5′ segment by heating to 70°C for 2 min, fol-lowed by cooling to room temperature over 5min, to saturate the fluorescently labeledstrand.
Steady-state fluorescence spectra and inten-sities were recorded as described in Basic Pro-tocol 2 on an AMINCO-Bowman Series 2 spec-trofluorometer from Thermo Spectronic in acuvette with 3-mm excitation and emissionpath lengths (120-µl minimal fill volume). Thisinstrument allows for the parallel detection ofboth fluorophores during a time course by con-tinually shifting the emission monochromatorback and forth. A noncleavable substrate analogwith a deoxy modification at the cleavage site,
S(dA–1), and the assembled ribozyme werepreincubated separately for 15 min in standardbuffer (50 mM Tris⋅Cl, pH 7.5, 12 mM MgCl2,25 mM DTT), at 25oC. Fluorescence data ac-quisition was started, and hairpin ribozyme-substrate complex was formed by manuallymixing 145 µl ribozyme solution in thefluorometer cuvette with 5 µl substrate stocksolution (supplying a saturating ten-fold sub-strate excess). Fluorescence emission values(one datum per second) for both donor (F515
nm) and acceptor (F560 nm) were recordedusing the fluorometer software package. Uponsubstrate addition, a strong acceptor quenchand slight donor dequench were observed (Fig.11.10.2). At the same time, an increasing fluo-rescence anisotropy of the acceptor revealeddecreasing fluorophore mobility upon sub-strate binding (Walter et al., 1998b). Under theconditions used, substrate binding was fast and
400 600 800200
Rz
7
6
5
4
3
+S(dA−1)
A
A
acceptor
FRET
extended
donor
docked
kdock
kundock
0Time (sec)
Flu
ores
cenc
e (a
rbitr
ary
units
)
B
D
BA
A D
Figure 11.10.2 Fluorescence signals over time as a result of tertiary structure folding of the hairpinribozyme-substrate complex. The doubly labeled ribozyme displays a strong signal for the acceptor(A) and a weaker one for the donor (D) fluorophore. Upon manual addition of a ten-fold excess ofnoncleavable substrate analog S(dA–1), significant quenching of the acceptor fluorescence isobserved due to rapid ribozyme-substrate complex formation. Subsequently, the acceptor signalincreases, while the donor signal decreases at the same rate, reflecting the reversible transitionfrom a flexible extended (low-FRET) to a docked (high-FRET) and catalytically active conformation(inset; short arrow, catalytic site). Adapted from Walter (2001) with permission from Academic Press.
Supplement 11 Current Protocols in Nucleic Acid Chemistry
11.10.20
Probing RNAStructural
Dynamics andFunction by
FRET

occurred within the manual mixing time (Wal-ter and Burke, 1997). Because the fluorescencedecrease was observed only with cognate sub-strate, the authors concluded that the rapidacceptor quench is mostly due to quenching ofhexachlorofluorescein in the ribozyme-sub-strate complex, presumably by a base-specificelectron transfer mechanism involving the 3′-terminal uracils of the substrate (Walter andBurke, 1997).
Subsequently, the donor fluorescence de-creased over several minutes, while the ac-ceptor fluorescence increased at the same rate.This observation strongly suggested that theunderlying molecular process involves increas-ing FRET between the two fluorophores, asexpected for their approach upon domain dock-ing in the ribozyme-substrate complex (inset ofFig. 11.10.2). From the temporal change of theratio Q = F560/F515, the rate constant of thetransition between the extended and dockedconformations was extracted and its depend-ence on RNA and buffer modifications wasstudied (Walter et al., 1998b). It should be notedthat for a reversible docking step, the observeddocking rate constant kdock,obs of 0.64 ± 0.04min−1 under standard conditions is a linearcombination of the elementary docking andundocking rate constants: kdock,obs = kdock +kundock × kdock,obs can only be dissected furtherby an independent measurement of either thedocking equilibrium constant (possible bytime-resolved FRET; Klostermeier and Millar,2001b) or the undocking rate constant (possiblein single-molecule experiments; Zhuang et al.,2002).
These studies on the hairpin ribozyme illus-trate some of the principles that can be utilizedto probe RNA structural dynamics and functionby FRET. Each unique RNA system will re-quire specific modification of these proceduresto provide novel and often unanticipated re-sults.
Time ConsiderationsTypically, 2 to 3 weeks are needed from the
design of an RNA construct to beginning thefirst steady-state FRET experiments with thedeprotected, purified, and fully labeled mate-rial. Most of this initial work will require onlya few hours of effort each day. Steady-stateFRET experiments, once they are set up, willbe more time consuming and will be best ac-complished in 4- to 6-hr time blocks.
Literature CitedBassi, G.S., Murchie, A.I., and Lilley, D.M. 1996.
The ion-induced folding of the hammerhead ri-bozyme: Core sequence changes that perturbfolding into the active conformation. RNA 2:756-768.
Bassi, G.S., Murchie, A.I., Walter, F., Clegg, R.M.,and Lilley, D.M. 1997. Ion-induced folding ofthe hammerhead ribozyme: A fluorescence reso-nance energy transfer study. EMBO J. 16:7481-7489.
Bassi, G.S., Mollegaard, N.E., Murchie, A.I., andLilley, D.M. 1999. RNA folding and misfoldingof the hammerhead ribozyme. Biochemistry38:3345-3354.
Butcher, S.E., Heckman, J.E., and Burke, J.M. 1995.Reconstitution of hairpin ribozyme activity fol-lowing separation of functional domains. J Biol.Chem. 270:29648-29651.
Chan, B., Weidemaier, K., Yip, W.T., Barbara, P.F.,and Musier-Forsyth, K. 1999. Intra-tRNA dis-tance measurements for nucleocapsid protein-dependent tRNA unwinding during priming ofHIV reverse transcription. Proc. Natl. Acad. Sci.U.S.A. 96:459-464.
Clegg, R.M. 1992. Fluorescence resonance energytransfer and nucleic acids. Methods Enzymol.211:353-388.
Dapprich, J., Walter, N.G., Salingue, F., and Staerk,H. 1997. Base-dependent pyrene fluorescenceused for in-solution detection of nucleic acids. J.Fluor. 7:87S-89S.
Deniz, A.A., Dahan, M., Grunwell, J.R., Ha, T.,Faulhaber, A.E., Chemla, D.S., Weiss, S., andSchultz, P.G. 1999. Single-pair fluorescenceresonance energy transfer on freely diffusingmolecules: Observation of Forster distance de-pendence and subpopulations. Proc. Natl. Acad.Sci. U.S.A. 96:3670-3675.
Emerick, V.L. and Woodson, S.A. 1994. Finger-printing the folding of a group I precursor RNA.Proc. Natl. Acad. Sci. U.S.A. 91:9675-9679.
Esteban, J.A., Banerjee, A.R., and Burke, J.M. 1997.Kinetic mechanism of the hairpin ribozyme.Identification and characterization of two nonex-changeable conformations. J. Biol. Chem.272:13629-13639.
Feldstein, P.A. and Bruening, G. 1993. Catalyticallyactive geometry in the reversible circularizationof ‘mini-monomer’ RNAs derived from the com-plementary strand of tobacco ringspot virus sat-ellite RNA. Nucl. Acids Res. 21:1991-1998.
Ha, T., Zhuang, X., Kim, H.D., Orr, J.W., William-son, J.R., and Chu, S. 1999. Ligand-inducedconformational changes observed in single RNAmolecules. Proc. Natl. Acad. Sci. U.S.A.96:9077-9082.
Hampel, K.J., Walter, N.G., and Burke, J.M. 1998.The solvent-protected core of the hairpin ri-bozyme-substrate complex. Biochemistry37:14672-14682.
Current Protocols in Nucleic Acid Chemistry Supplement 11
11.10.21
RNA FoldingPathways

Hegg, L.A. and Fedor, M.J. 1995. Kinetics andthermodynamics of intermolecular catalysis byhairpin ribozymes. Biochemistry 34:15813-15828.
Juneau, K. and Cech, T.R. 1999. In vitro selectionof RNAs with increased tertiary structure stabil-ity. RNA 5:1119-1129.
Klostermeier, D. and Millar, D.P. 2000. Helical junc-tions as determinants for RNA folding: Origin oftertiary structure stability of the hairpin ri-bozyme. Biochemistry 39:12970-12978.
Klostermeier, D. and Millar, D.P. 2001a. Tertiarystructure stability of the hairpin ribozyme in itsnatural and minimal forms: Different energeticcontributions from a ribose zipper motif. Bio-chemistry 40:11211-11218.
Klostermeier, D. and Millar, D.P. 2001b. Time-resolved fluorescence resonance energy transfer:A versatile tool for the analysis of nucleic acids.Biopolymers 61:159-179.
Komatsu, Y., Koizumi, M., Nakamura, H., and Oht-suka, E. 1994. Loop-size variation to probe abent structure of a hairpin ribozyme. J. Am.Chem. Soc. 116:3692-3696.
Konarska, M.M. 1999. Site-specific derivatizationof RNA with photocrosslinkable groups. Meth-ods 18:22-28.
Lafontaine, D.A, Norman, D.G., and Lilley, D.M.2001a. Structure, folding and activity of the VSribozyme: Importance of the 2-3-6 helical junc-tion. EMBO J. 20:1415-1424.
Lafontaine, D.A., Wilson, T.J., Norman, D.G., andLilley, D.M. 2001b. The A730 loop is an impor-tant component of the active site of the VS ri-bozyme. J. Mol. Biol. 312:663-674.
Lafontaine, D.A., Norman, D.G., and Lilley, D.M.2002. The global structure of the VS ribozyme.EMBO J. 21:2461-2471.
Lakowicz, J.R. 1999. Principles of FluorescenceSpectroscopy, 2nd ed. Kluwer Academic/Ple-num Publishers, New York.
Marcus, R.A. 1964. Chemical and electrochemicalelectron-transfer theory. Annu. Rev. Phys. Chem.15:155-196.
Mathews, D.H., Sabina, J., Zuker, M., and Turner,D.H. 1999. Expanded sequence dependence ofthermodynamic parameters improves predictionof RNA secondary structure. J. Mol. Biol.288:911-940.
Moore, M.J. 1999. Joining RNA molecules with T4DNA ligase. Methods Mol. Biol. 118:11-19.
Murchie, A.I., Thomson, J.B., Walter, F., and Lilley,D.M. 1998. Folding of the hairpin ribozyme inits natural conformation achieves close physicalproximity of the loops. Mol. Cell 1:873-881.
Pan, J., Deras, M.L., and Woodson, S.A. 2000. Fastfolding of a ribozyme by stabilizing core inter-actions: Evidence for multiple folding pathwaysin RNA. J. Mol. Biol. 296:133-144.
Parkhurst, L.J., Parkhurst, K.M., Powell, R., Wu, J.,and Williams, S. 2001. Time-resolved fluores-cence resonance energy transfer studies of DNAbending in double-stranded oligonucleotidesand in DNA-protein complexes. Biopolymers61:180-200.
Pereira, M.J., Harris, D.A., Rueda, D., and Walter,N.G. 2002. Reaction pathway of the trans-actinghepatitis delta virus ribozyme: A conformationalchange accompanies catalysis. Biochemistry41:730-740.
Perkins, T.A., Wolf, D.E., and Goodchild, J. 1996.Fluorescence resonance energy transfer analysisof ribozyme kinetics reveals the mode of actionof a facilitator oligonucleotide. Biochemistry35:16370-16377.
Pinard, R., Lambert, D., Walter, N.G., Heckman,J.E., Major, F., and Burke, J.M. 1999. Structuralbasis for the guanosine requirement of the hair-pin ribozyme. Biochemistry 38:16035-16039.
Pinard, R., Hampel, K.J., Heckman, J.E., Lambert,D., Chan, P.A., Major, F., and Burke, J.M. 2001.Functional involvement of G8 in the hairpinribozyme cleavage mechanism. EMBO J.20:6434-6442.
Qin, P.Z. and Pyle, A.M. 1999. Site-specific labelingof RNA with fluorophores and other structuralprobes. Methods 18:60-70.
Ramirez-Carrozzi, V.R. and Kerppola, T.K. 2001.Gel-based fluorescence resonance energy trans-fer (gelFRET) analysis of nucleoprotein com-plex architecture. Methods 25:31-43.
Seidel, C.A.M., Schulz, A., and Sauer, M.H.M.1996. Nucleobase-specific quenching of fluores-cent dyes. 1. Nucleobase one-electron redox po-tentials and their correlation with static and dy-namic quenching efficiencies. J. Phys. Chem.100:5541-5553.
Singh, K.K., Parwaresch, R., and Krupp, G. 1999.Rapid kinetic characterization of hammerheadribozymes by real-time monitoring of fluores-cence resonance energy transfer (FRET). RNA5:1348-1356.
Tuschl, T., Gohlke, C., Jovin, T.M., Westhof, E., andEckstein, F. 1994. A three-dimensional modelfor the hammerhead ribozyme based on fluores-cence measurements. Science 266:785-789.
Walter, N.G. 2001. Structural dynamics of catalyticRNA highlighted by fluorescence resonance en-ergy transfer. Methods 25:19-30.
Walter, N.G. and Burke, J.M. 1997. Real-time moni-toring of hairpin ribozyme kinetics through base-specific quenching of fluorescein-labeled sub-strates. RNA 3:392-404.
Walter, N.G. and Burke, J.M. 2000. Fluorescenceassays to study structure, dynamics, and functionof RNA and RNA-ligand complexes. MethodsEnzymol. 317:409-440.
Walter, N.G., Albinson, E., and Burke, JM. 1997.Probing structure formation in the hairpin ri-bozyme using fluorescent substrate analogs.Nucl. Acids Symp. Ser. 36:175-177.
Supplement 11 Current Protocols in Nucleic Acid Chemistry
11.10.22
Probing RNAStructural
Dynamics andFunction by
FRET

Walter, F., Murchie, A.I., Duckett, D.R., and Lilley,D.M. 1998a. Global structure of four-way RNAjunctions studied using fluorescence resonanceenergy transfer. RNA 4:719-728.
Walter, N.G., Hampel, K.J., Brown, K.M., andBurke, J.M. 1998b. Tertiary structure formationin the hairpin ribozyme monitored by fluores-cence resonance energy transfer. EMBO J.17:2378-2391.
Walter, N.G., Burke, J.M., and Millar, D.P. 1999.Stability of hairpin ribozyme tertiary structure isgoverned by the interdomain junction. Nat.Struct. Biol. 6:544-549.
Walter, N.G., Yang, N., and Burke, J.M. 2000. Prob-ing non-selective cation binding in the hairpinribozyme with Tb(III). J. Mol. Biol. 298:539-555.
Walter, N.G., Chan, P.A., Hampel, K.J., Millar, D.P.,and Burke, J.M. 2001. A base change in thecatalytic core of the hairpin ribozyme perturbsfunction but not domain docking. Biochemistry40:2580-2587.
Widengren, J., Dapprich, J., and Rigler, R. 1997.Fast interactions between Rh6G and dGTP inwater studied by fluorescence correlation spec-troscopy. Chem. Phys. 216:417-426.
Wu, P. and Brand, L. 1994. Resonance energy trans-fer: Methods and applications. Anal. Biochem.218:1-13.
Zhuang, X., Bartley, L.E., Babcock, H.P., Russell,R., Ha, T., Herschlag, D., and Chu, S. 2000. Asingle-molecule study of RNA catalysis andfolding. Science 288:2048-2051.
Zhuang, X., Kim, H., Pereira, M.J., Babcock, H.P.,Walter, N.G., and Chu, S. 2002. Correlatingstructural dynamics and function in single ri-bozyme molecules. Science 296:1473-1476.
Contributed by Nils G. WalterUniversity of MichiganAnn Arbor, Michigan
Current Protocols in Nucleic Acid Chemistry Supplement 11
11.10.23
RNA FoldingPathways