probabilistic seismic hazard maps in dam foundation · probabilistic seismic hazard maps in dam...
TRANSCRIPT

1
Probabilistic Seismic Hazard Maps in Dam Foundation
by
Hideaki Kawasaki1, Masafumi Kondo2, Akira Nakamura3, Kenji Inagaki4 ABSTRACT Because Japan is one of the world’s most earthquake prone countries, improving seismic resistance to guarantee safety and a sense of security is an important challenge. The Kobe Earthquake disaster in 1995 severely damaged many infrastructures and buildings. In response to this disaster, advanced research on seismic design methods, seismic diagnosis, and seismic strengthening has been carried out to reduce earthquake damage. It is difficult to completely prevent earthquake disasters, however in earthquake-prone Japan, earthquake damage prediction and disaster prevention measures are implemented widely. In case of dams also, it is quite important to evaluate the strength of predicted earthquake motion, and implement the suitable seismic design and seismic diagnosis. This paper describes the preparation of seismic hazard maps in dam foundations, considering earthquake records and earthquakes that occur cyclically on active faults and at plate boundaries, to establish a efficient method of predicting the earthquake motion necessary to the seismic design of dams. KEYWORDS: Dam Foundation, Probabilistic Seismic Hazard Maps, Seismic Design 1. INTRODUCTION To perform seismic design or seismic diagnosis, it is very important to evaluate the earthquake hazard predicted for a dam site in order to predict earthquake damage and propose disaster prevention measures. There are two methods of evaluating the seismic hazard: deterministic methods (hypothetical earthquake) and probabilistic methods (earthquake hazard analysis). A deterministic method is a method of hypothesizing the earthquake that will have a
great impact on the site and either theoretically or empirically evaluating earthquake motion caused by the hypothetical earthquake. The benefit of this method is that it evaluates earthquake motion in a clear visible form of a time history wave form or response spectrum, but it lacks the general applicability needed to set hypothetical earthquakes. A probabilistic method on the other hand is a method of evaluating the anticipated recurrence value of earthquake motion strength based on probability according to statistical data of disastrous earthquakes. A merit of this method is that it evaluates risk as anticipated recurrence value of earthquake motion that should essentially be treated as a risk, but it is difficult to present its results in clear visible form. This report proposes a probabilistic statistical method to estimate the earthquake motion accounting for scattering caused by the earthquake frequency and distance attenuation, for the solid rock foundation in dam sites. Further, in order to predict earthquake motion throughout Japan, this report shows the distribution of the earthquake motion strength based on earthquake prediction models. 2. PREPARATION OF AN EARTHQUAKE CATALOG AND FAULT PARAMETERS An earthquake catalog and fault parameters are the base of seismic information. Especially, an earthquake catalog model uses past earthquake data without modification.
1 Head, Water Management and Dam Division, River Department, National Institute for Land and Infrastructure Management, Ministry of Land, Infrastructure and Transport, Tsukuba-shi, Ibaraki 305-8040, Japan
[email protected] Senior Researcher, ditto [email protected] 3 Former Director, River Department, ditto 4 Former Researcher, ditto

2
2.1 Seismic sources data Seismic sources data are based on the Uzu Catalog from 1885 to 1922, and on Meteorological Agency data from 1923 until 2002. Earthquakes with magnitude of 5.0 or more, and earthquakes with epicentral depth of 200km or less are selected. Further, based on the assumption that an earthquake occurs independently, fore shocks and after shocks of major earthquakes, and earthquake swarms other than the largest one are excluded from the catalog data. Figure 1 shows the epicenter distribution of a total of 5,236 catalog earthquakes judged to be independent. Because the properties of earthquakes differ according to their type, catalog earthquakes are classified in three types (shallow crustal, inter-plate, and deep intra-slab). An epicenter of an inter-plate type is located in the ocean and the focus depth is usually less than 60km. A shallow crustal type is an earthquake that occurs in a shallow crustal dislocation. A deep intra-slab type means what occurs in the depths, usually 60km or more, although an epicenter is located in inland. 2.2 Seismic fault parameters As for large scale earthquakes, the widening of a fault plane is considered. Therefore, fault parameters are organized for 74 earthquakes for which a fault model had been set based on past earthquakes. Figure 2 shows the distribution of fault planes used for the study. As in the case of point epicenters, these seismic faults are classified into three types (shallow crustal, inter-plate, and deep intra-slab). 3. SEISMIC PREDICTION MODELS To estimate the scale of earthquake motion, we set three seismic prediction models (earthquake catalog model, seismic source zone model, and BPT seismic source zone model). *BPT: Brownian Passage Time The earthquake catalog model is model that hypothesizes that past earthquake activity during a specified period that are provided in the earthquake catalog occur cyclically.
The seismic source zone model hypothesizes seismic source zones based on past earthquake data and active fault data to model earthquake activity [1]. The Seismic source zones are classified as follows. • Seismic source zone: Case where it is possible to almost specify the location of earthquakes that occur in an active fault zone or of earthquakes such as large earthquakes that have occurred cyclically in the same part of a plate boundary (fault plane). • Background zones: Case other than the above where, even when an earthquake can be predicted to occur within a certain range, it is difficult to clearly specify the location in advance. • Hypocentral type: Classified into three types based on the category of earthquake (shallow crustal earthquake, intra-plate earthquake, deep intra-slab earthquake). Figure 3 to Figure 6 shows examples of the classification of seismic source zone distributions. The BPT seismic source zone model is a model using the BPT distribution to evaluate the probability of a large earthquake occurring from the present time in addition to the seismic source zone model. 4. DISTANCE ATTENUATION FORMULA To calculate seismic motions in every mesh point from every seismic source in Japan, the distance attenuation formula [2] set based on earthquake observation records in foundations of dams is adopted. There are two types of distance attenuation formula. One is the shortest distance equation and another is the equivalent hypocentral distance equation. The form of the distance attenuation formula using the shortest distance can be written as:
( )( ) )(653.0exp334.0log)()()()(log
TCoMRTCdHcTChMTCmTSA
++−+=
(1)

3
Where: T is the period, SA(T) is the horizontal 2-component average response spectrum, M is the Japan Meteorological Agency magnitude, at HC=H (100km), HC =100 (100km<H<200km), H is the depth at the center of the fault plane, and R is the shortest distance to the fault plane. The equation using the equivalent hypocentral distance can be written as:
)(log)()()()(log
TCoXeqXeqTCdHcTChMTCmTSA
+−−+=
(2) Where: Xeq is the equivalent hypocentral distance, and the others represent the same values as in the shortest distance case. 5. CALCULATION OF THE HAZARD CURVE The evaluation points were set by dividing Japan into 1,289 meshes in mesh units that are squares with sides of 20km by 20km and the earthquake hazard was calculated for each mesh. The earthquake hazard curve is calculated using the seismic prediction model and the distance attenuation equation. Using the earthquake catalog model, the hazard curve for every earthquake in the catalog is calculated by the Eq.(3). The occurrence frequency for each earthquake was assumed to be 1/T (T is the period of the data set).
[ ]⎭⎬⎫
⎩⎨⎧
≥−−=≥ ∑k
k RHMaAPaAp ,,exp1][ ν
(3) Where, k is the earthquake, vk is the number of earthquakes k that occurs each year (if the period of the earthquake catalog is T it is 1/T), P[A ≥α |M,H,R] is the probability that the earthquake motion strength will exceed a in a case where earthquake k with magnitude M has occurred at epicenter depth H and distance R. The probability is calculated considering scattering of the estimation equation to be a logarithmic normal distribution. For the
earthquake set by the fault model, the distance R (shortest distance or equivalent hypocentral distance) is evaluated accounting for the expanse of the fault plane, while the earthquake for which the fault plane has not been set, the distance from the point epicenter is evaluated. Similarly, in the case of the seismic source zone model, the hazard curve is calculated by the Eq.(4) in considering the earthquake motion strength for each mesh caused by the entire hypothesized earthquakes for each seismic source zone.
⎭⎬⎫
⎩⎨⎧
≥−
−=≥
∫ ∫∫∑ dMdHdRMPMHPHMRPRHMaAP
aAp
kk ][][],[],,[exp
1][
ν
(4) Where k is the seismic source zone, vk is the frequency that earthquakes occur in the seismic source zone k, and P[A ≥α |M,H,R] is the probability that the earthquake strength will exceed a when an earthquake of magnitude M has occurred at hypocentral depth H at distance R, P[M] is the probability that an earthquake of magnitude M will occur, P[H|M] is the conditional probability that the hypocentral depth will be H in a case where earthquake with magnitude M has occurred, and P[R|M,H] is the conditional probability that the distance will be R in a case where an earthquake with magnitude M has occurred at hypocentral depth H. In the seismic source zone model, the average occurrence frequency over the long term was used as the earthquake occurrence frequency to obtain the annual exceedence probability hypothesizing the Poison’s process. 6. CALCULATION RESULTS As examples of the earthquake hazard map, Figures 7 to 9 show the distribution of peak ground acceleration (PGA) for the return period of 100 years based on each predictive model. Figure 10 shows a PGA distribution map for the return period of 200 years based on the earthquake catalog model, and Figure 11 compares the maps obtained by each model.

4
7. CONCLUSIONS This report has obtained the following conclusions. 1. A method of preparing the earthquake hazard maps useful to set input earthquake motion is proposed. 2. The PGA distribution shows that in all seismic prediction models, the hazard on the Pacific Coast of Japan tends to be relatively high and the hazard on the Japan Sea Coast tends to be relatively low. 3. The PGA based on the seismic source zone model tends to be lower in Hokkaido and higher in other regions than the earthquake catalog model. 4. Differences in return period have a large effect particularly on the acceleration distribution on the Pacific Coast. This is presumably a result of the fact that the inter-plate earthquakes with shorter interval than shallow crustal earthquake on active faults occur mainly on the Pacific side.
5. There is almost no difference between distribution of predicted PGA with return period of 100 years based on a model that considers BPT and a model that does not consider BPT. This is presumably a result of the fact that the interval of shallow crustal earthquakes on active faults ranges from several thousands of years to several tens of thousands of years: periods that have little impact over a period of 100 years. 8. REFERENCES 1. Annaka, T., and Yashiro, H.: Temporal
Dependence of Seismic Hazard in Japan, 12th World Conference on Earthquake Engineering, New Zealand, 2000.
2. Matsumoto, N., Yoshida, H., Sasaki, T. and Annaka, T.: Response Spectra of Earthquake Motion at Dam Foundations, Proc. Twenty-first International Congress on Large Dams, 2003.
Fig.1 Distribution of Earthquakes Judged to be Independent

5
Fig.2 Distribution of Major Earthquake Occurrence Zones (74 planes)
Fig.3 Fault Source Zones organized by Historical Earthquake Data (28 planes)
6
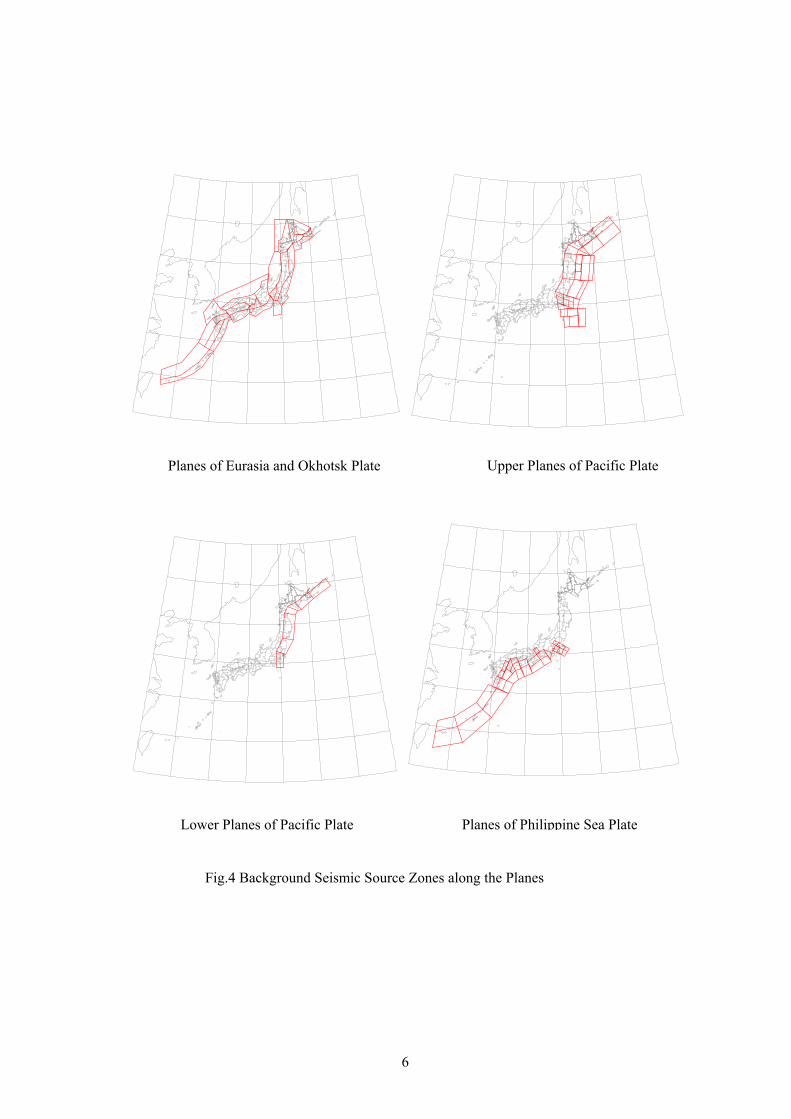
Planes of Philippine Sea Plate Lower Planes of Pacific Plate
Upper Planes of Pacific Plate Planes of Eurasia and Okhotsk Plate
Fig.4 Background Seismic Source Zones along the Planes

7
Inter-plate type Deep Intra-slab type
Fig.6 Distribution of Background Seismic Source Zones
Shallow crustal type Inter-plate type
Fig.5 Distribution of Seismic Source Zones

8
Fig.7 Distribution of Peak Ground Acceleration (PGA) with Return Period of 100 Years (Earthquake Catalog Model)
Fig.8 Distribution of Peak Ground Acceleration (PGA) with Return Period of 100 Years (Seismic Source Zone Model)
130.0E 135.0E 140.0E 145.0E
35.0N
40.0N
45.0N
0 - 8080 - 120120 - 160160 - 200200 - 240240 -
130.0E 135.0E 140.0E 145.0E
35.0N
40.0N
45.0N
0 - 8080 - 120120 - 160160 - 200200 - 240240 -
130.0E 135.0E 140.0E 145.0E
35.0N
40.0N
45.0N
0 - 8080 - 120120 - 160160 - 200200 - 240240 -
130.0E 135.0E 140.0E 145.0E
35.0N
40.0N
45.0N
0 - 8080 - 120120 - 160160 - 200200 - 240240 -
Shortest distanceequation
Equivalent hypocentraldistance equation
Equivalent hypocentraldistance equation
Shortest distanceequation
[gal] [gal]
[gal][gal]

9
Fig.9 Distribution of Peak Ground Acceleration (PGA) Expected to Recur Once in the next 100 Years (BPT Seismic Source Zone Model)
Fig.10 Distribution of Peak Ground Acceleration (PGA) with Return Period of 200 Years (Earthquake Catalog Model)
130.0E 135.0E 140.0E 145.0E
35.0N
40.0N
45.0N
0 - 8080 - 120120 - 160160 - 200200 - 240240 -
130.0E 135.0E 140.0E 145.0E
35.0N
40.0N
45.0N
0 - 8080 - 120120 - 160160 - 200200 - 240240 -
130.0E 135.0E 140.0E 145.0E
35.0N
40.0N
45.0N
0 - 8080 - 120120 - 160160 - 200200 - 240240 -
130.0E 135.0E 140.0E 145.0E
35.0N
40.0N
45.0N
0 - 8080 - 120120 - 160160 - 200200 - 240240 -
Equivalent hypocentral distance equation
Equivalent hypocentral distance equation
Shortest distanceequation
Shortest distanceequation
[gal] [gal]
[gal][gal]

10
130.0E 135.0E 140.0E 145.0E
35.0N
40.0N
45.0N
-210 --100-100 - -50-50 - -10-10 - 1010 - 5050 - 100100 - 210
130.0E 135.0E 140.0E 145.0E
35.0N
40.0N
45.0N
-200 --100-100 - -50-50 - -10-10 - 1010 - 5050 - 100100 - 200
130.0E 135.0E 140.0E 145.0E 35.0N
40.0N
45.0N
-17 - -15-15 - -10-10 - -5-5 - 55 - 1010 - 1515 - 40
(c) Earthquake catalog model – BPT Seismic source zone model
(b) BPT Seismic source zone model– Seismic source zone model
(a) Earthquake catalog model – Seismic source zone model
Fig.11. Differences between PGA based on Different Models
(Return Period of 100 years)
[gal][gal]
[gal]