proactive risk assessment of surgical site infections in
TRANSCRIPT

Final Contract Report
Proactive Risk Assessment ofSurgical Site Infections inAmbulatory Surgery Centers


Final Contract Report
Proactive Risk Assessment of Surgical Site Infections in Ambulatory Surgery Centers Prepared for:
Agency for Healthcare Research and Quality U.S. Department of Health and Human Services 540 Gaither Road Rockville, MD 20850 www.ahrq.gov Contract No.: 290-06-00019i-12 Prepared by: American Institutes of Research Washington, DC Laura A. Steighner, Ph.D.— Project Director Rachel Crossno Anthony D. Slonim, M.D., Dr.P.H.—Principal Investigator SAMIKE, LLC and Barnabas Health, West Orange, NJ Virginia Tech–Carilion School of Medicine, Roanoke, VA Ebru K. Bish, Ph.D. Xin Zeng, M.S. Graduate Department of Industrial and Systems Engineering Virginia Tech, Blacksburg, VA AHRQ Publication No. 12-0045-EF March 2012

ii
This document is in the public domain and may be used or reprinted without permission, except those copyrighted materials that are clearly noted in the document. Further reproduction of those copyrighted materials is prohibited without the specific permission of the copyright holders. Suggested Citation:
Slonim, AD, Bish, EK, Steighner, LA, Zeng, X, & Crossno, R. Proactive Risk Assessment of Surgical Site Infections in Ambulatory Surgery Centers. Final Report (Prepared by the American Institutes of Research under Contract No. 290-06-00019i-12). AHRQ Publications No. 12-0045-EF. Rockville, MD: Agency for Healthcare Research and Quality. March 2012. The opinions presented here are those of the authors and do not necessarily reflect the position of the U.S. Department of Health and Human Services or the Agency for Healthcare Research and Quality.

iii
Acknowledgements We gratefully acknowledge the four local ambulatory surgery centers who took time out of their busy schedules to give our team a tour of their facilities and to answer a few questions about the “day in the life of a surgical patient.” In addition, we would like to acknowledge Alex Alonso, PhD, for his guidance and support throughout the project, as well as Janan Musa for her quality assurance review of the final report.
iv
Contents
Executive Summmary ..................................................................................................................... 1
Chapter 1. Introduction .................................................................................................................. 5
Chapter 2. ST-PRA Development ................................................................................................. 7 Overview of Sociotechnical Probabilistic Risk Assessment ....................................................... 7 Data Sources ................................................................................................................................ 8 Development of the Fault Tree Model ....................................................................................... 17 Chapter 3. Risk-Informed Interventions ....................................................................................... 25 Importance Measures ................................................................................................................. 25 Event(s) Targeted for Intervention ............................................................................................. 27 Proposed Intervention ................................................................................................................ 29 Intervention Implementation ...................................................................................................... 32
Chapter 4. Conclusions and Next Steps ........................................................................................ 33 Study Strengths and Limitations ................................................................................................ 33 Next Steps .................................................................................................................................. 33 References ..................................................................................................................................... 37
Appendixes [Note: the Appendixes are available as individual files on the AHRQ Web site.]
Appendix A. Literature Review Appendix B. Database Analysis Appendix C. Site Visit Protocol Appendix D. Site Visit Process Comparison Appendix E. Study Parameters Appendix F. ST-PRA Fault Tree Model With Probability Estimates Appendix G. References for Fault Tree Model Probability Estimates
Exhibits
Exhibit 1. Relationship of data sources to the development of the ST-PRA ............................................. 9 Exhibit 2. Literature review search terms by category ............................................................................ 10 Exhibit 3. Inclusion and exclusion criteria for literature review .............................................................. 11 Exhibit 4. Roles of staff interviewed at each site visit ............................................................................. 15 Exhibit 5. List of Expert Panel members ................................................................................................. 16 Exhibit 6. Steps involved in developing the fault tree model .................................................................. 17 Exhibit 7. Example of an AND gate ........................................................................................................ 20 Exhibit 8. Example of an OR gate ........................................................................................................... 20 Exhibit 9. Top five minimal cut sets for the Basic Case .......................................................................... 23

v
Exhibit 10. Probability variations used in the sensitivity analyses ............................................................ 24 Exhibit 11. Importance measures on events in rank order of criticality .................................................... 26 Exhibit 12. Probability of intervention reducing risk of SSI by interventions targeting component failure
points individually ................................................................................................................... 28 Exhibit 13. Probability of intervention reducing risk of SSI by multiple concurrent interventions at
various reductions of noncompliance rates (25 percent, 50 percent, and 75 percent) ............. 29

vi
[Page Left Purposely Blank]

1
Executive Summary
In August 2010, the Agency for Healthcare Research and Quality (AHRQ) commissioned a study to conduct a proactive risk assessment of surgical site infections (SSIs) within the ambulatory surgery setting. The American Institutes for Research (AIR) and its partners, Anthony D. Slonim, M.D., Dr.P.H., and the Virginia Polytechnic Institute and State University’s College of Engineering, were selected to conduct the study, which had two primary objectives: (1) using proactive risk assessment, identify the realm of risk factors associated with SSIs that result from procedures performed at ambulatory surgery centers (ASCs); and (2) based on a particular set of events identified by the proactive risk assessment, design an intervention to mitigate the probability of SSIs due to the most common risk factors.
To achieve a better understanding of how structural and process elements may affect the risk for SSIs in the ASC environment, we used a tool known as sociotechnical (or socio-technical) probabilistic risk assessment (ST-PRA) This approach incorporates risk estimates from the evidence-based literature and also uses experiential estimates from health care providers. ST-PRA is particularly helpful for estimating risks in outcomes that are very rare, such as the risk of SSI in the ambulatory surgery environment, and examining single-point failures as well as combinations of events that lead to the outcome of interest.
As a preliminary step, the team examined several data sources, both quantitative and qualitative in nature, including databases, peer-reviewed and grey literature, site visits to four local ASCs, and technical expert opinion.
Developing the ST-PRA Model: Steps
• Step 1—Identify all factors (also known as basic events) contributing to an SSI. An initial list of basic events was created based on the major risk factors recognized in the extant literature as contributing to an SSI.
• Step 2—Identify the dependencies and interactions among risk points. The research team separated the basic events into components of the operative process (i.e., preoperative, operative, and postoperative) and examined the relationships (i.e., dependencies and interactions) among the multiple risk points to understand how they collectively lead to an SSI.
• Step 3—Validate the fault tree model. The underlying logic of the model was validated by obtaining feedback from technical experts on the model’s representation of the real system and processes under study (e.g., the preoperative, operative, and postoperative processes for an arthroscopic knee surgery at the ASC).
• Step 4—Identify the likelihood of the basic events in the fault tree. We assigned probabilities to each basic event in the fault tree, using information available from the

2
literature and interviews. This process resulted in a probability of occurrence of the top-level event, along with the major risk points in the process (also known as cut sets) that were developed as the next step of this project.
• Step 5—Conduct sensitivity analyses of the fault tree model. We conducted a series of sensitivity analyses to improve the reliability of the modeling exercise due to variable or imprecise information available from the databases, variable information in the literature, and expert estimates. These analyses involved identifying the minimal cut sets for the base case and for each variation of the base case (obtained by modifying the probabilities) in order to study the robustness of the fault tree model.
Designing a Risk-informed Intervention
Next, we examined the events from the ST-PRA model ranked in order of criticality, finding that Event 642 [Fail to protect the patient effectively] ranked as the most critical unique event, with the highest independent contribution to the occurrence of SSIs of 0.5187. Based on this finding, we propose an intervention aimed at Event 642 [Fail to protect patient effectively] that focuses on all five major components of this cut set. Specifically, the intervention is designed to target: skin preparation practices; proper administration of antibiotics; staff training in infection control practices; practices to prevent glove punctures; and procedures to ensure removal of watches, jewelry, and fake nails.
The proposed intervention targets two important processes of patient care:
• Infection control practices. A major aspect of the intervention involves integrating better standards for infection prevention practices into the daily care provided at ASCs. We recommend that guidelines for infection control practices at ASCs be modeled after the guidelines provided to hospitals and incorporated into processes of care as a bundle of procedures and/or checklist of steps.
• Communications between health care providers. The next piece of the intervention involves improving the communications across the various providers, including the physicians, surgeons, and ASC preoperative, operative, and postoperative staff. We propose that efforts also be directed to improve the communications between health care teams to more readily identify those patients who would receive more appropriate care in an alternative environment, such as the hospital, where they have the tools and techniques in place to better care for patients such as the morbidly obese.
Next Steps
The use of ST-PRA as a modeling tool to identify risks in the ASC environment is an important outcome of this work. This model can be refined as new information becomes available in the literature and as improvements in care in the ASC environment are realized through interventions such as those proposed in this report. AHRQ should consider the following

3
suggestions for next steps to continue this work: developing the proposed intervention, conducting a followup study to determine the impact of the intervention, developing an integrated database to track patients across care settings, and examining ways to make the ST-PRA methodology more accessible.

4
[Page Left Purposely Blank]

5
Chapter 1. Introduction
Ambulatory surgery is a viable alternative to inpatient hospitalization for a range of invasive procedures. The volume and types of ambulatory surgery procedures continue to expand, providing testament to the overall safety and efficiency of surgery performed in these settings. Considering the authorization of Medicare payments for procedures performed in the ambulatory setting, it is not surprising that the number of ambulatory surgery centers (ASCs) also continues to expand. However, ASCs differ in their clinical organization, structure, and processes, potentially resulting in differences in patient care outcomes. Thus, despite their growing prevalence, there remain differences in ASC settings that may lead to the potential introduction of risk and subsequent harm to patients.
The performance of surgery involves risk regardless of the setting, personnel, and procedure. These risks can result in surgical mishaps, ranging from infections to wrong site surgeries. The risk for such adverse events increases when surgery is performed in an environment that is less regulated, more variable in its policies and procedures, and relatively understaffed. This occurs not only because the rates of known risks may be increased, but also because additional, perhaps unknown, risks resulting from a less regulated practice setting can be introduced into the performance of care.
Given that one of the greatest risks during the perioperative period is infection, infection control offers opportunity for potential mitigation of this risk. Infection control policies and procedures provide a basic set of principles governing the processes for surgical care. These principles are founded on evidence-based practices that are ritualistically performed before, during, and after every surgical procedure to ensure that infection risks are minimized. They include the surgical scrub, patient draping, sterilization, and patient preoperative risk factor management. Other important principles that contribute to an infection control plan include complex care practices such as appropriate patient selection and operative techniques; however, these additional principles may not be as well prescribed or “hardwired” into the patient care processes in ASCs because staff training, experience, and orientation vary across them and because these plans are not required by any licensing or accrediting body over ASCs. As a result, additional risk for infections may be inadvertently incorporated into the patient’s care without a thorough understanding of how they contribute to surgical site infections (SSIs).
In August 2010, the Agency for Healthcare Research and Quality (AHRQ) commissioned a study to conduct a proactive risk assessment of SSIs within the ambulatory surgery setting. The American Institutes for Research (AIR) and its partners, Anthony M. Slonim, M.D., Dr.P.H., and the Virginia Polytechnic Institute and State University’s (“Virginia Tech’s”) College of Engineering, were selected to conduct the study, which had two primary objectives:
• Using a proactive risk assessment, identify the realm of risk factors associated with SSIs resulting from procedures performed at ASCs

6
• Design an intervention to mitigate the probability of SSIs for the most common risk factors for a particular surgical procedure, as identified by the proactive risk assessment
To achieve a better understanding of how structural and process elements may affect the risk
for SSIs in the ASC environment, we used a tool known as sociotechnical probabilistic risk assessment (ST-PRA). This tool allows us to incorporate risk estimates from the evidence-based literature and also to use experiential estimates from health care providers knowledgeable of the issues under consideration. ST-PRA is particularly helpful for estimating risks in outcomes that are very rare, such as the risk of SSI in the ambulatory surgery environment. Also important is the tool’s utility in examining single-point failures, as well as combinations of events that lead to the outcome of interest (i.e., SSIs), thereby allowing the investigators to design interventions aimed at reducing the risks associated with failures in the performance of risk mitigation procedures.
This report highlights information presented in the previous interim report and all aspects of the project, including data collection through a literature review, analysis of existing databases, establishment of a technical expert panel (TEP), the development of the ST-PRA fault tree models, sensitivity analyses to determine the most important risks and combinations of risks, and the design of an intervention aimed at reducing the risk of SSIs. Finally, the report concludes with a discussion of the study’s strengths and limitations and how the adoption of the intervention can contribute to improved patient safety. The report is divided into the following chapters:
• ST-PRA Development • Risk-Informed Intervention • Conclusions and Next Steps

7
Chapter 2. ST-PRA Development
To achieve project objectives, the AIR team designed a study that leveraged information gleaned through four unique and important quantitative and qualitative data sources:
• Known risk factors and their rate estimates from the extant literature on SSIs • National databases of inpatient care, ambulatory surgical care, and emergency
department care to provide procedure volumes, institutional characteristics, patient demographics, and complication estimates
• Site visits to four local ASCs with different organizational arrangements, to provide contextual elements for the sociotechnical component of the risk modeling
• Technical experts’ input to further enhance the models and provide additional expertise on the sociotechnical elements of the risk models
In this chapter, we begin with an overview of ST-PRA followed by the methods involved in
collecting information from each data source. The final section of this chapter focuses on the methodology employed for building the fault tree model, how probability estimates from the literature and other sources were utilized in the model, and the resulting fault tree model.
Overview of Sociotechnical Probabilistic Risk Assessment
Probabilistic Risk Assessment (PRA) is an engineering tool that was developed in the 1970s to quantify risks and identify threats to the safety of nuclear power plants.1 Subsequently, it has been applied in a variety of settings, which range from aerospace to manufacturing to natural disasters.2 PRA is a systematic methodology that proactively identifies the major risk points in a system. It utilizes both quantitative and qualitative data to “map” the risks associated with adverse outcomes.1-2
PRA is a hybrid between qualitative process analysis techniques and quantitative decision-support models.1-3 PRA involves a detailed “deductive” process analysis method that utilizes logical relationships and probability theory to construct a model (a “fault tree”) of how the various risk points interact with one another and either individually or collectively combine to contribute to the overall adverse outcome. PRA has several major strengths, because it:4
• Represents a broad perspective and includes contextual elements, such as operating procedures, system factors, and human factors, in the risk model
• Is proactive, identifying the possible adverse events before they actually occur, thus enabling the decision maker to make targeted interventions for preventing those events
• Allows, through the use of logical relationships and Bayesian probabilities, the modeling of complex interactions and dependencies among the multiple risk points that may lead to the adverse outcome
• Allows the uncertainty associated with error rate estimates to be incorporated into the model through sensitivity analysis
8
• Allows an assessment of risk and a prioritization of risk reduction interventions based on sequences that have the highest probability of occurrence, thus providing a roadmap of targeted interventions
• Is dynamic, in that PRA can incorporate new estimates of probability based on uncertainty using Bayes’ theorem
ST-PRA expands the basic PRA model by accounting for human performance.3-4 Most work
involves the interactions of people, systems, and technology, and ST-PRA accounts for each of these elements. The challenge in this approach is determining the probabilities associated with human breakdowns that contribute to adverse outcomes.
The process mapped by a ST-PRA model incorporates factors that are internal to the process
and factors that are external to the process.4-5 For example, in the setting of infection prevention in the operating room, internal process factors include choosing the incorrect disinfectant or not using appropriate skin disinfection procedures. Factors external to the process include the ability of policies and procedures to direct best practices, the safety norms for following such policies, and the ability of team members to give and understand crucial communications. Consequently, ST-PRA can disentangle the impact of factors that are related to individuals from the impact of factors that are related to institutions or to the system. In this way, ST-PRA addresses what has previously been described as a major limitation of isolated database analyses in which the interactions of different-level processes occur simultaneously. To ensure that ST-PRA captures all possible process factors, it is important to scour several sources of data with the aim of building a process map. In the next section, we describe the sources of data scanned for this purpose.
Data Sources
Exhibit 1 depicts the data types (i.e., quantitative or qualitative) and the sources used in the development of the ST-PRA fault tree model for this study. Each data source informed the data collection effort for the other sources in an iterative fashion. That is, information gleaned during the literature review informed ways to analyze the databases; information collected during the site visits or during the TEP meeting informed additional data analyses and literature searches.

9
Exhibit 1. Relationship of data sources to the development of the ST-PRA
* The following three datasets from AHRQ’s Healthcare Cost and Utilization Project (HCUP) were used during this study:
(1) the State Ambulatory Surgery Databases (SASD), (2) the State Emergency Department Databases (SEDD), and (3) the Nationwide Inpatient Sample (NIS).
Literature Review The AIR team first conducted an extensive literature review of peer-reviewed and grey
literature regarding the potential risk factors associated with the development of an SSI in surgical procedures generally and for arthroscopy specifically. As noted in an earlier, unpublished interim report for this project, arthroscopy of the knee was identified as the surgical procedure that would serve as the focal point for this project. In addition to helping establish the risks and finalize the inputs to the ST-PRA models, the literature also provided discrete probability estimates and ranges for inclusion in the models and for the sensitivity testing, which is the final step in model development. In this section, we describe the process for searching and abstracting both peer-reviewed and grey literature.
Peer-reviewed literature. The peer-reviewed literature search was limited to the literature published in English and, initially, only that published since 2000. The date limit was amended to include literature published as early as 1985, because it quickly became clear that important work related to the estimates of risk dictating current clinical practices dates as far back as the late 1980s. Similarly, the search was expanded to include research conducted beyond the United States, to include important work related to the risks of SSI conducted in Europe, the United Kingdom, and Australia.
Quantitative Data Sources:SASD, SEDD, and NIS Databases*,
Literature Review,Expert Panel
Qualitative Data Sources:
Site Visits, Process Flows, Expert Panel
Socio-Technical
Probabilistic Risk
Assessment
10
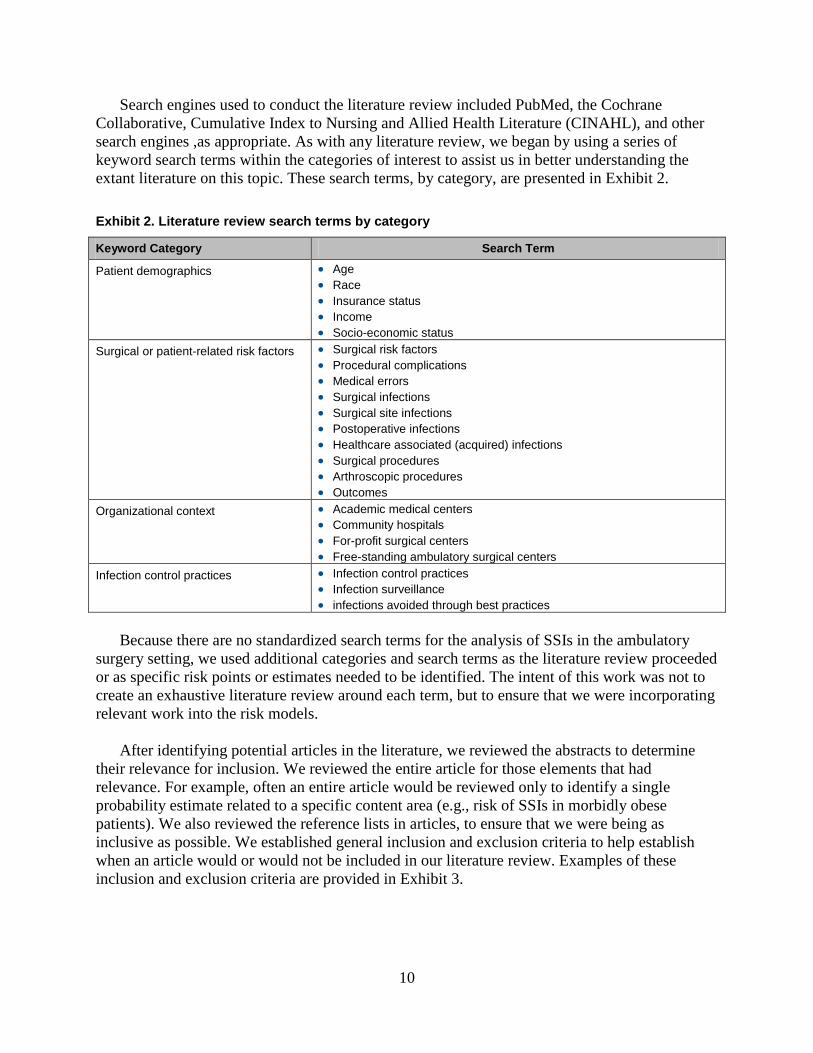
Search engines used to conduct the literature review included PubMed, the Cochrane Collaborative, Cumulative Index to Nursing and Allied Health Literature (CINAHL), and other search engines ,as appropriate. As with any literature review, we began by using a series of keyword search terms within the categories of interest to assist us in better understanding the extant literature on this topic. These search terms, by category, are presented in Exhibit 2. Exhibit 2. Literature review search terms by category
Keyword Category Search Term
Patient demographics • Age • Race • Insurance status • Income • Socio-economic status
Surgical or patient-related risk factors • Surgical risk factors • Procedural complications • Medical errors • Surgical infections • Surgical site infections • Postoperative infections • Healthcare associated (acquired) infections • Surgical procedures • Arthroscopic procedures • Outcomes
Organizational context • Academic medical centers • Community hospitals • For-profit surgical centers • Free-standing ambulatory surgical centers
Infection control practices • Infection control practices • Infection surveillance • infections avoided through best practices
Because there are no standardized search terms for the analysis of SSIs in the ambulatory
surgery setting, we used additional categories and search terms as the literature review proceeded or as specific risk points or estimates needed to be identified. The intent of this work was not to create an exhaustive literature review around each term, but to ensure that we were incorporating relevant work into the risk models.
After identifying potential articles in the literature, we reviewed the abstracts to determine their relevance for inclusion. We reviewed the entire article for those elements that had relevance. For example, often an entire article would be reviewed only to identify a single probability estimate related to a specific content area (e.g., risk of SSIs in morbidly obese patients). We also reviewed the reference lists in articles, to ensure that we were being as inclusive as possible. We established general inclusion and exclusion criteria to help establish when an article would or would not be included in our literature review. Examples of these inclusion and exclusion criteria are provided in Exhibit 3.

11
Exhibit 3. Inclusion and exclusion criteria for literature review
Inclusion Criteria
• ASC specific studies on complications • Studies on complications from surgery in different contexts (e.g., academic medical centers) • Specific studies on hospital and care related infections and their risks • Studies providing risk estimates related to demographics, conditions, or procedures • Studies to support or refute information from the site visit estimates • Studies containing risk factor estimates related to the patients, providers, structures, or teams
Exclusion Criteria
• Studies on surgery complications without specific information • Studies that focus only on hospital and not surgical infections • Studies that do not address interventions • Studies that were opinion and not empirically based
Grey literature. To enhance the review of extant peer-reviewed literature, we included a
review of grey literature to provide important information for inclusion in the risk models. This category of literature includes Web-based presentations, articles, and white papers. For this part of the literature search, we used Google™, Google Scholar™, and Bing Internet search engines. We also surveyed the project team and our technical experts to identify additional sources of information not contained within the peer-reviewed literature.
As a final step in this part of the review, we conducted a targeted search of Web sites known for their independent contribution to improvement efforts or standards of care, to see whether they had contributed any information on general or ambulatory surgical risks. Examples of the organizations included in this part of the review are:
• Agency for Healthcare Research and Quality • Institute for Healthcare Improvement • American College of Surgeons • Ambulatory Surgery Center Association • Robert Wood Johnson Foundation • Association of Perioperative Registered Nurses • Centers for Medicare and Medicaid Services • The Joint Commission on Accreditation of Healthcare Organizations
We entered all relevant literature into a database to assist with creation of a bibliography and
to support the specific risk estimates in model building. The resulting literature review is presented in Appendix A.
Database Analysis The next source of process factor information was AHRQ’s national databases for surgery
and inpatient admissions. Discharge databases play an important role in studying SSIs in the ASC environment. Although ASCs provide an important setting for the performance of ambulatory procedures, they are constrained in that complications, particularly infections that occur in these settings, may receive followup care in the physician’s office, in the emergency department, or, for severe cases, in the hospital. Hence, ASC databases themselves may provide only limited information on complication or infection rates, because the treatment for these

12
complications and infections often occurs outside the ASC setting. To assist with modeling the risks associated with SSIs in the ambulatory surgery setting, it was necessary to analyze important, publicly available extant databases to see whether relevant probability estimates for complications originating in the ASC environment could be obtained.
First, we sought to gather quantitative information from the different types of locations that might care for complications originating in the outpatient surgery environment (i.e., private physician offices, ASCs, emergency departments, and hospitals).
Private Physician Offices. There are currently no publicly available datasets for analysis from physician’s offices. Thus we were unable to identify patients who received surgery in an ASC, experienced a complication, and returned to their private surgeon/physician for followup on the complication. This is a major limitation to the analysis of surgical complications, including SSIs, stemming from surgeries conducted in the ambulatory setting.
Ambulatory Surgery Centers. AHRQ’s Healthcare Cost and Utilization Project (HCUP) State Ambulatory Surgery Databases (SASD) were analyzed to identify the most common surgeries, the demographic profile of individuals receiving them, and the institutional profile of locations in which they are performed. Specifically, the 2006-2008 SASDs for Maryland, New Jersey, and California were used in this study. Because the SASDs for California had data on both hospital-based and free-standing ASCs, and included many variables that were of interest to this study, we analyzed the 2008 California SASD extensively.*
We then extended this analysis to years 2006 and 2007, which produced results similar to those for 2008. This analysis resulted in a list of the top 10 procedures for hospital-based and free-standing ASCs. We then analyzed the distribution of these procedures for hospital-based ASCs by the type of ownership (i.e., for-profit or not-for-profit) and by demographic characteristics. We repeated the same analysis for the top five surgical procedures requiring an incision for both hospital-based and free-standing ASCs.
Emergency Departments. When physicians are unavailable or the complication originating in the ASC is severe, patients will often seek care from an Emergency Department (ED). For these analyses, we used the State Emergency Department Databases (SEDD) from AHRQ’s HCUP family of databases for California, Maryland, and New Jersey. Specifically, we used the years 2006–2008 to be consistent with the period of time used for the SASD analyses. We identified all patients with infectious complications having their first encounter (without a diagnosis of infection) in the SASD and a successive encounter (with a diagnosis of infection) in the SEDD. Unfortunately, we identified very few surgical complications presenting to the EDs from ASCs, highlighting another limitation in identifying complications originating in the ambulatory surgery environment.
Hospitals. Hospitals provide a useful venue to further understand the scope and magnitude of the problem for two reasons. First, patients experiencing complications from an ASC may
* Note that the New Jersey SASD did not contain data on free-standing ASCs, whereas both the Maryland and California SASDs did. However, the California SASD included more variables that were of interest to this study and also included many more records than the Maryland database.

13
receive followup care for that complication in the hospital. Second, hospitals perform a large number of surgical procedures themselves and can, therefore, help inform the ambulatory environment, because greater than 80 percent of medical complications occur in the hospital setting. In addition, current administrative datasets provide extensive information on hospital encounters, patient characteristics, organizational structures, and resource utilization associated with each diagnosis.
For this study, we analyzed the Nationwide Inpatient Sample (NIS) databases for the States of California, Maryland, and New Jersey for the same period (2006–2008) to capture information about infection rates related to specific procedures. These infection rates were found to be below the infection rates reported in the literature for similar procedures, a result possibly due to underreporting and/or missing data points in the databases.
The study participants included all discharges in the SASD and NIS datasets. The proportion of discharges with a surgical complication with an ICD-9 (International Statistical Classification of Diseases and Related Health Problems) code was determined in each dataset. Next, specific patient and organizational characteristics were examined for their association with surgical complications. These characteristics broadly fall into the following categories:
• Patient sociodemographic characteristics (age, gender, race, payer) • Health status and comorbidity (APR-DRG-defined severity and specific co-
morbidities suggestive of chronic conditions) • Utilization (admission type, length of stay, and hospital characteristics—such as
hospital bed size†, teaching status, urbanicity, ownership, and location)
The results of the data analyses for the California 2008 SASD are included in Appendix B and are being incorporated into the risk models, as appropriate. ‡ Of particular importance, additional targeted analyses were performed to assist with specific probability estimates to inform the risk models, as necessary, to ensure the comprehensiveness of the model. For example, if Hispanic patients were identified as a particular risk group from the literature, the proportion of Hispanic patients with an SSI would be analyzed and compared to non-Hispanic white and non-Hispanic black patients, to permit a more focused analysis of the risk as it relates to ethnicity and race.
Site Visits The third source of process factor information comprised site visits to actual ASCs. AIR
conducted site visits to four local centers to explore patient throughput variables of interest and to determine boundaries of the risk modeling exercise. Each site visit represented a different context in which SSIs can occur within the ambulatory surgery setting: an academic hospital-associated ASC; a community hospital-associated ASC; a free-standing, for-profit ASC; and a free-standing, hospital-associated pediatric ASC. Site visits were conducted between January and
† That is, the number of beds in use or available for use. ‡ The results for the California 2006 and 2007 SASD are similar to those of the 2008 database and have not been included in Appendix B.

14
March 2011. Any differences in the context of care identified during the site visits helped inform the probabilistic risk assessment models about the risks for acquiring an SSI in these settings and created the opportunity for cross-fertilization and learning when these settings were compared. For example, a pediatric-specific ASC may have procedures to reduce risk in place for children undergoing surgery that can then be incorporated in ASCs that care for both children and adults.
To conduct the site visits, AIR prepared a semistructured interview protocol to use at each site, targeting questions based on the ASC staff member’s roles and responsibilities. AIR submitted the protocol and methodology for review by AIR’s Internal Review Board (IRB) and received approval on December 7, 2010. The protocol is presented in Appendix C.
For each site visit, the AIR team identified a key contact who would coordinate the visit for each organization. Site visits included three major activities that served as the basis for the sociotechnical element of the ST-PRA models:
• A review and comparison of policies and procedures related to the occurrence and prevention of SSIs, including policies governing patient care, room cleaning, disinfection, and equipment disinfection and sterilization. This review also encompassed policies for procedures prior to surgery, during surgery, and after surgery
• Informal exploratory interviews with a selection of six staff, on average, from each participating ASC to learn about infection prevention policies and procedures in place
• Comparison of the process flow across sites, noting differences in policies and procedures, facility characteristics, and other relevant issues, as necessary
Exhibit 4 identifies the different types of staff interviewed at each ASC. Specific names have
not been included to ensure interviewee confidentiality, as established in the informed consent agreements. Please note that many site visit participants served in more than one role at the ASC.
Once the site visits had been completed, we created a series of tables for each surgical phase (i.e., preoperative, operative, and postoperative phases), to enable the comparison of policies, procedures, and practices across the four sites. In sum, interviewees discussed the steps involved from the preoperative call through patient discharge. Some of the similarities and differences found across the sites involved differences in the capacity and layout of the facility. For example, some ASCs are equipped with isolation bays reserved for patients with methicillin-resistant Staphylococcus aureus (MRSA) infections, whereas others are not. Although policies and procedures for handwashing were variable across the ASCs, the sites were consistent in requiring at least 15 seconds of handwashing between patients. The operative phase demonstrated the most consistency across study sites with respect to the surgical scrub, patient draping, and room preparation. The mapping of the typical patient’s flow through the ASC, as well as facility structural factors, served as the foundation for building the process component of the fault tree model. The site visit comparison tables may be found in Appendix D.

15
Exhibit 4. Roles of staff interviewed at each site visit
Outpatient Surgery Center Roles of Staff Interviewed§
Pediatric hospital, off-site ASC
• Administrator • Infection control specialist • Pre-op, OR, PACU nurses • Instrument technician
Community hospital, co-located ASC • Administrator • Clinical nurse managers • Environmental services specialist • Infection control specialist • General surgery hospitalist • Anesthesiologist • Pre-op, OR, PACU nurses
Academic hospital, off-site ASC • Administrator • Pre-op, OR, PACU nurses • Sterile processing technician
Free-standing ASC • Administrator • Infection control specialist • Pre-op, OR, PACU nurses • Quality improvement nurse • Scrub technician • Instrument technician
Note: ASC = ambulatory surgery center; OR = operating room; PACU = pediatric acute care unit; pre-op = preoperative;
Technical Expert Panel (TEP) In addition to the other three data sources, AIR convened a panel of technical experts to
guide the ST-PRA modeling. Members of the TEP were identified and selected to represent an array of expertise to ensure comprehensive coverage of the relevant issues. During the course of the project, AIR, in collaboration with AHRQ, added two additional experts to the panel, thereby increasing the comprehensive coverage of expertise represented on the TEP. Throughout the project, TEP input has helped shape the design of the fault tree model and the final intervention presented in this report. The members of the TEP, their specialties, and their affiliations are shown in Exhibit 5 (below).
The initial TEP meeting was conducted on January 14, 2011. Participants at this meeting
included the listed TEP members, except Drs. Martin and Song, who were subsequently added to the panel. In addition to the TEP members, Mr. David Marx from Outcome Engineering participated to provide ST-PRA modeling expertise. The purpose of this meeting was to orient TEP members to the project objectives and ST-PRA, gather feedback on the selection of one or more surgical procedures to serve as the focus for the ST-PRA, and gather feedback to be used for informing the initial fault tree development. Feedback from this meeting resulted in the specification of the study parameters referenced in the following section (“Resulting Decisions”). § ASC staff commonly served in more than one role.

16
Exhibit 5. List of members, technical expert panel
Expert Title/Degree Relevant Expertise/Experience Affiliation
R. Marshall Ackerman M.D. Orthopedic surgery Shady Grove Adventist Hospital
Jude Alexander M.D. Infection control, healthcare associated infections Inpatient Specialists
Barry Aron M.D. Urology Shady Grove Adventist Hospital
Nana Ekua Coleman M.D., Ed.M. Surgical site infections, pediatrics, pediatric surgery
Cohen Children’s Medical Center of NY
Lynn Crowley R.N., B.S.N, C.N.O.R.
General surgery, infection control practices Alegent Health Mercy Hospital
Joshua Felsher M.D. Infection control, healthcare associated infections Inpatient Surgical Consultants
Steve Martin M.D. Anesthesiology Shady Grove Adventist Hospital
Joseph Perz M.D. Infection control, healthcare associated infections
Centers for Disease Control and Prevention
Daniel Schwartz M.D. Infection control, healthcare associated infections
Centers for Medicare & Medicaid Services
Xiaoyan Song Ph.D. Infection control Children’s National Medical Center
Mark Sorrentino M.D., M.S. Ambulatory surgery HAS Physicians, LLC
Stephen Wolf P.A.-C Ambulatory surgery Shady Grove Adventist Hospital
On June 6, 2011, the AIR team convened a second meeting by teleconference, using
LiveMeeting. This meeting involved a subset of the original TEP (Dr. Ackerman and Ms. Crowley) and included two added TEP members, Drs. Song and Martin. The purpose of this meeting was to review the draft fault tree model and solicit feedback on areas for improvement. More details about this meeting are provided in the “Development of the Fault Tree Model” section of this report.
On November 2, 2011, the AIR team convened the third and final TEP meeting by teleconference using LiveMeeting. This meeting again involved a subset of the original TEP membership, including Drs. Aron, Coleman, Martin, Perz, Schwartz, Song, and Sorrentino, Ms. Crowley, and Mr. Wolf. The purpose of this meeting was to review the results of the ST-PRA modeling effort; to discuss the methods for identifying the basic events associated with the highest risk, as well as the unique combination of event sequences (cut sets) that lead to the occurrence of an SSI; and to obtain input on an intervention designed to reduce the likelihood of an SSI.
Resulting Decisions Using the information gathered through the various sources (literature review, database
analysis, site visits, and TEP input), the AIR team identified six important parameters to facilitate the development of the ST-PRA fault tree model. The parameters for the ST-PRA are as follows:

17
• Examine only SSIs stemming from arthroscopy of the knee • Examine only deep incision SSIs • Limit the temporal period of interest from the preoperative call to 30 days after the
procedure • Focus specifically on procedures performed in free-standing and/or hospital-affiliated
ASCs • Develop a fault tree accounting for patients who present at risk in the ASC • Develop a fault tree accounting for patients introduced to a microbe (or infection) in
the ASC
For more details on these parameters, please refer to Appendix E.
Development of the Fault Tree Model
A fault tree is a graphical depiction that conjoins risk estimates associated with a specific outcome of interest. For this study, the outcome of interest was an SSI occurring in outpatient arthroscopic surgery of the knee. The initial development of the fault tree used the four major inputs described above (i.e., literature review, database analysis, site visits, and technical expert input) to develop the risks associated with an SSI. Iteratively, the model was refined and revised to create a model that had face validity with technical experts who understand the procedure under study. In this section, we detail the steps taken in developing the fault tree model, as depicted in Exhibit 6.
Exhibit 6. Steps involved in developing the fault tree model
Data Sources
Step 1: Identify Risk
Factors
Step 2: Identify
Relationships
Step 3: Validate Fault
Tree
Step 4: Identify
Probabilities
Step 5: Conduct
Sensitivity Analyses
Step 6: Develop Risk-
Informed Intervention

18
Step 1. Identify All Factors Contributing to the Outcome of Interest After determining the outcome of interest (i.e., in this case, the occurrence of an SSI, which
is also the “top event” in the fault tree), the first step in constructing a fault tree involved identifying the risk factors (e.g., lack of communication between health care providers, patient does not comply with discharge instructions, failure to prepare skin appropriately prior to surgery, equipment failure) that are the most important contributors to this outcome. The end goal for this step was to identify a comprehensive list of variables (also known as “basic events”) that contribute risk within the model and potentially lead to the outcome of interest. An initial list of basic events was created based on the major risk factors recognized in the extant literature as contributing to an SSI. This list was augmented by studying the process maps developed from the site visits and identifying probable points of failure in the processes (e.g., communication failure between health care professionals). Finally, based on discussions with TEP members in attendance at the June 6 meeting, some basic events were added to this list, and some basic events were removed because their contribution to the top event was considered negligible. When additional basic events were considered for inclusion in the fault tree, a targeted literature review using these basic events as key search terms was conducted to provide additional support for their inclusion.
Step 2. Identify the Dependencies and Interactions Among the Risk Points
Once the outcome of interest (i.e., top event) and all the basic events contributing to this top event were identified, the research team considered the ways the basic events were connected to the result in the top-level event. For many of the basic events, this process was straightforward. For example, it is clear that contamination contributes additional risk at the basic event level, which can lead to a higher frequency of SSIs. There are numerous ways to build contamination into different parts of the fault tree.
The approach we used to incorporate these risk points was derived by separating the basic events into components of the operative process: preoperative, operative, and postoperative. By creating a logic model and isolating basic-level events in each part of the operative process, we expected to improve the face validity and overall interpretability of the model by the clinicians participating on the TEP, as well as a broader audience, including hospital and ASC administrators, and other relevant stakeholders. It was also a useful method for incorporating the data gathered from the site visits, because contamination can occur with people, processes, or equipment, each of which can contribute independent risk for SSIs.
As a preliminary step, we established specific parameters to guide the development of the model framework and the relationships of the risk points. Parameters allow fault tree designers to home in specifically on a top-level event (i.e., SSI) and the characteristics of the setting where this event might take place. They also serve to guide subject matter experts about variables of interest and key top-level event characteristics relevant to fault tree design. For this project, we limited the procedure under study to arthroscopy of the knee, due to the high frequency of these procedures in the ASC environment. We limited the time frame under consideration from the preoperative call by the outpatient surgery center to 30 days postoperative, due to the higher rate

19
of infection occurring within 30 days of surgery, using the definition of an SSI provided by the Centers for Disease Control and Prevention.6
Once the scope of the model was appropriately defined, the relationships (i.e., dependencies and interactions) among the multiple risk points were studied to understand how they collectively lead to an SSI. This is where clinical judgment, the results of the database analysis, site-visit process maps, and the input from the TEP were critical. Using these inputs enabled us to identify the multiple connections associated with the occurrence of SSIs. For example, a patient-level factor (e.g., diabetes) was identified from the literature, a staff-level factor (e.g., wearing artificial nails) was identified from a review of an ASC’s policy, and an organizational-level factor (e.g., preoperative screening) was identified by the technical experts. Using multiple data sources was invaluable, because organizational-level factors and their connections to the top event may be specific to the different types of outpatient surgery centers. These connections were further enhanced by targeting additional literature searches on patient-level and staff-level factors, which have been the focus of many research studies.
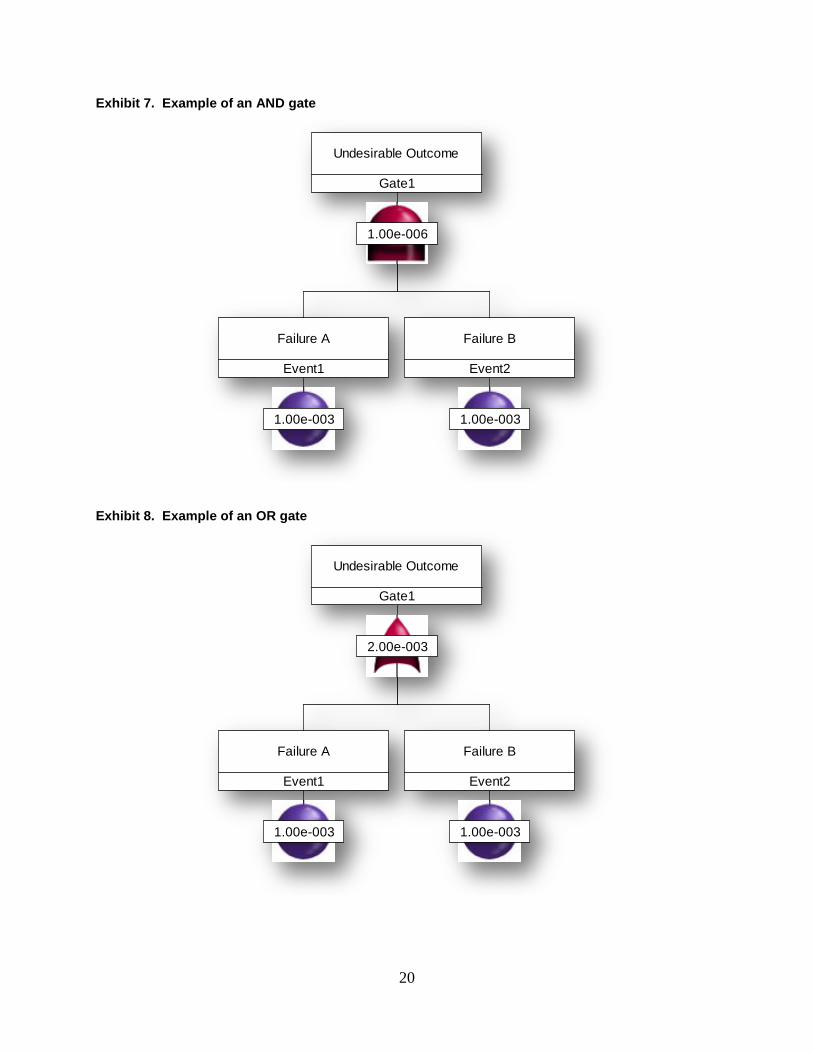
The relationship between the basic events and the top event were established next. The fault tree uses “gates” to demonstrate the logic for joining all the basic events into an organized model that contributes to the outcome of interest. The two major types of gates are “AND” gates (i.e., the output event occurs if all input events connected to the AND gate occur) and “OR” gates (i.e., the output event occurs if at least one of the input events connected to the OR gate occurs). In combination, the basic events, modeled in the fault tree along with the AND gates and OR gates, produced a descriptive, hierarchical flow diagram of the process and the outcome under investigation. Exhibits 7 and 8 present examples of AND and OR gates, respectively.
20
Exhibit 7. Example of an AND gate
Exhibit 8. Example of an OR gate
Gate1
Undesirable Outcome
1.00e-006
Event1
Failure A
1.00e-003
Event2
Failure B
1.00e-003
Gate1
Undesirable Outcome
2.00e-003
Event1
Failure A
1.00e-003
Event2
Failure B
1.00e-003

21
Step 3. Validate the Fault Tree Model Once an initial draft of a fault tree was developed, the model was reviewed by a subset of the
TEP, as noted earlier, to obtain feedback on the connectivity and logic of the basic events with regard to the outcome (i.e., top event). The model was revised on the basis of this feedback. Leveraging additional contacts within the health care field, we addressed specific questions that needed further clarification through focused interviews with individuals knowledgeable about the outcome under investigation. Additional literature searches were conducted to address specific needs in the model related to risk points or probability estimates. The goal of this validation step was to confirm that the logical relationships built into the fault tree are representative of the real system and processes under study (e.g., the preoperative, operative, and postoperative processes for an arthroscopic knee surgery at the ASC). Appendix F presents the final version of the fault tree.
Step 4. Identify the Likelihood of the Basic Events in the Fault Tree The next step involved assigning probabilities (or likelihoods) to each basic event in the fault
tree. To the extent that it was available, information from the peer-reviewed and grey literature was used to provide a starting point for estimating the probabilities of the basic events. When we found gaps in these estimates, we performed additional and more focused literature reviews or interviews with knowledgeable individuals to derive the estimates for these probabilities. It is important to note that when we needed to rely on technical experts’ estimates, we targeted these relationships in the subsequent sensitivity-testing component of this study. Appendix G presents the references for the probabilities used in this step.
Once the probabilities were assigned for the basic events, the fault tree was modeled using Relex, a software package that calculates the remaining probability estimates for all intermediate and top-level events in the fault tree using the logical relationships (e.g., AND gates, OR gates) previously specified. For the AND gates, the probabilities of its input events are multiplied together; for the OR gates, the probabilities of its input events are added together, with the overlap subtracted to prevent double counting of the gate if both failures occur simultaneously. This process leads to a probability of occurrence of the top-level event, along with the major risk points in the process (also known as cut sets) that were developed as the next step of this project.
Step 5. Conduct Sensitivity Analyses of the Fault Tree Model Because some probabilities included in the fault tree model were based on imprecise
information from the available databases, highly variable risk estimates in the literature, or estimates from technical experts, we conducted a series of sensitivity analyses to improve the reliability of the modeling exercise. The sensitivity analysis can be considered a series of grounded “what if” tests to study the robustness of the ST-PRA model. These analyses began with an examination of the base case, which corresponds to the current fault tree model detailed in the interim report, and then varying the basic event probabilities across a range of values to determine whether the combinations of the major events cause a change in the risk of an SSI. These analyses involved identifying the minimal cut sets, defined in the next section, for the base case and for each variation of the base case (obtained by modifying the probabilities) to study the

22
robustness of the fault tree model. This process allowed the team to identify an intervention that would have the greatest likelihood of mitigating the risk of SSIs, a major goal of this project.
Minimal cut sets. Cut sets are a unique combination of events leading to the occurrence of a top level event (an SSI). A cut set is considered a minimal cut set if, when any basic event is removed from the set, the remaining events are collectively no longer a cut set. A minimal cut set is defined as a critical path through multiple failure points.7 By identifying the different cut sets associated with an event, the model can be reconsidered after removing specific failure points or system components as a result of implementing an intervention or series of interventions designed to reduce the rate of occurrence of the top event. The minimal cut sets are identified through the software, using the underlying logic as depicted in the AND/OR gates. The software then combines basic level event probabilities to identify the paths, based on the conditional probabilities of event combinations. The minimal cut sets with the highest risk for the top level event are then listed in descending order of priority.
Sensitivity analysis. In the sensitivity analyses, we focused on the events for which the literature reported large variations in the probabilities, and varied these probabilities in the base case within the ranges suggested in the literature. When a probability estimate was not available from the literature, an anchor estimate was obtained from technical experts in the field. For example, when questions arose about the likelihood of a failure in the process with relevance to pediatric patients, Drs. Song and Coleman, both members of the TEP, were asked to estimate the probability of this risk occurring, based on their professional experience. This estimate was then considered the anchor estimate for the sensitivity analyses, which examined the range of intervals from 25–75 percent around the provided probability estimate.
For example, handwashing is a common approach for helping to prevent the spread of bacteria and would thereby be expected to have a positive impact on preventing the occurrence of SSIs. The literature indicates that non-OR staff compliance rates for handwashing range between 40 and 90 percent. The OR staff compliance rates for handwashing are reported to be consistently higher and with a much lower variation, around 75–90 percent. In the sensitivity analysis, we varied the conditional probability for non-OR handwashing compliance across the range of 40–90 percent to better understand the impact that handwashing may have at mitigating the occurrence of the SSI. The sensitivity analyses ensured that the model was appropriate even if the probabilities of basic level events constituting the model were grossly inaccurate at the beginning of the modeling exercise. If the same contributors are identified after the sensitivity analyses, the model’s integrity can be ensured. If this does not happen, further data would need to be collected (e.g., through additional interviews with the health care providers) to increase the reliability of the probability estimates.
We ran the fault tree model for each variation of the base case and determined the corresponding SSI rate and the top five minimal cut sets to understand how and if they had changed over the base case. Exhibit 9 presents the top five minimal cut sets for the base case with their contribution to an SSI (labeled Contributed Probability). Exhibit 10 displays the probability variations considered in the sensitivity analyses.

23
Exhibit 9. Top five minimal cut sets for the basic case
Cut Set
Contributed Probability
Events Included in Cut Set (Probability of Each Individual Event)
1 0.000103 Event 173 (0.9) Event 142 (0.3) Event 450 (0.293) Event 642 (0.2) Event 182 (0.2) Event 543 (0.0325)
Staff fails to provide patient with
instructions for weight reduction
Staff not well-trained in infection control
Obese, but not diabetic, patient
(30<BMI<40)
Fail to protect patient effectively (failure
related to skin prep, antibiotics admin,
shaving surgical site, etc.)
Fail to administer indicated antibiotics
SSI risk for obese patient, weight not
reduced and nutrition not improved
2 0.00006856 Event 173 (0.9) Event 450 (0.293) Event 660 (0.16) Event 433 (0.05) Event 543 (0.0325) –
Staff fails to provide patient with
instructions for weight reduction
Obese, but not diabetic, patient
(30<BMI<40)
Patient fails to notice infection during home
care
Patient has organism at postoperative visit
SSI risk for obese patient, weight not
reduced and nutrition not improved
3 0.0000643 Event 173 (0.9) Event 142 (0.3) Event 450 (0.293) Event 642 (0.2) Event 30 (0.125) Event 543 (0.0325)
Staff fails to provide patient with
instructions for weight reduction
Staff not well-trained in infection control
Obese, but not diabetic, patient
(30<BMI<40)
Fail to protect patient effectively (failure
related to skin prep, antibiotics admin,
shaving surgical site, etc.)
Fail to prepare skin appropriately
SSI risk for obese patient, weight not
reduced and nutrition not improved
4 0.0000617 Event 173 (0.9) Event 450 (0.293) Event 642 (0.2) Event 182 (0.2) Event 659 (0.18) Event 543 (0.0325)
Staff fails to provide patient with
instructions for weight reduction
Obese, but not diabetic, patient
(30<BMI<40)
Fail to protect patient effectively (failure
related to skin prep, antibiotics admin,
shaving surgical site, etc.)
Fail to administer indicated antibiotics
Glove puncture SSI risk for obese patient, weight not
reduced and nutrition not improved
5 0.0000514 Event 173 (0.9) Event 450 (0.293) Event 642 (0.2) Event 182 (0.2) Event 138 (0.15) Event 543 (0.0325)
Staff fails to provide patient with
instructions for weight reduction
Obese, but not diabetic, patient
(30<BMI<40)
Fail to protect patient effectively (failure
related to skin prep, antibiotics admin,
shaving surgical site, etc.)
Fail to administer indicated antibiotics
Fail to remove watch/jewelry/fake nails
SSI risk for obese patient, weight not
reduced and nutrition not improved
24
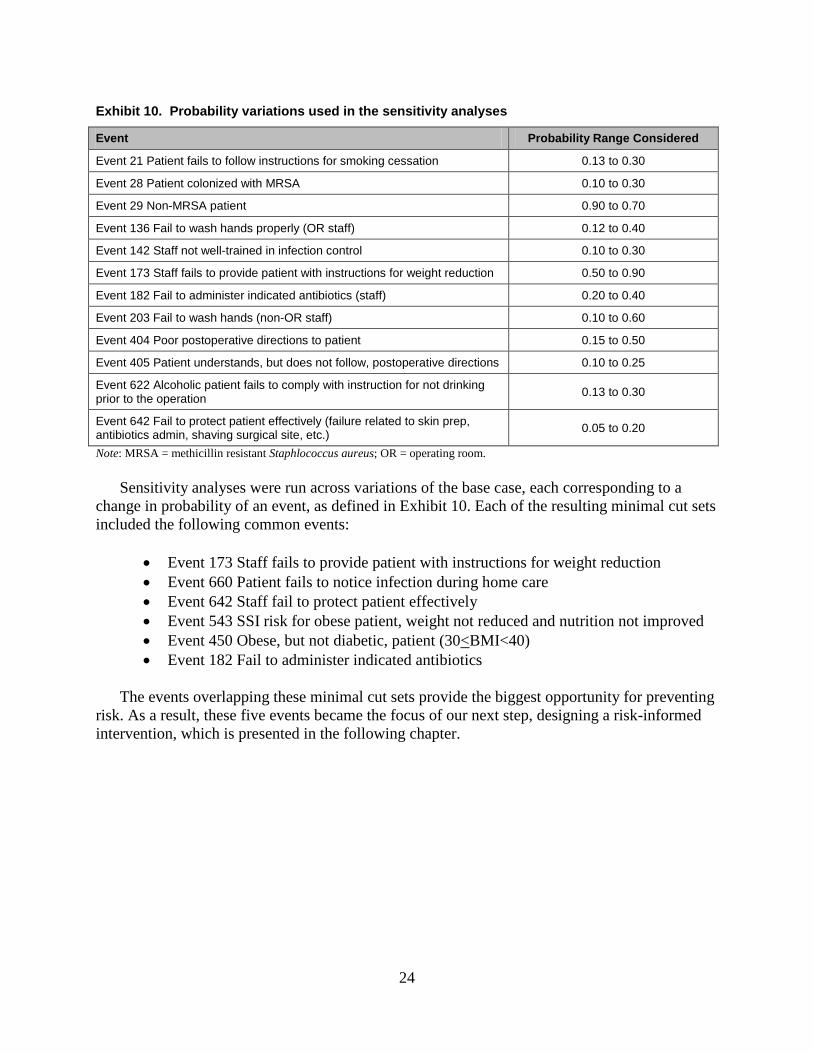
Exhibit 10. Probability variations used in the sensitivity analyses
Event Probability Range Considered
Event 21 Patient fails to follow instructions for smoking cessation 0.13 to 0.30
Event 28 Patient colonized with MRSA 0.10 to 0.30
Event 29 Non-MRSA patient 0.90 to 0.70
Event 136 Fail to wash hands properly (OR staff) 0.12 to 0.40
Event 142 Staff not well-trained in infection control 0.10 to 0.30
Event 173 Staff fails to provide patient with instructions for weight reduction 0.50 to 0.90
Event 182 Fail to administer indicated antibiotics (staff) 0.20 to 0.40
Event 203 Fail to wash hands (non-OR staff) 0.10 to 0.60
Event 404 Poor postoperative directions to patient 0.15 to 0.50
Event 405 Patient understands, but does not follow, postoperative directions 0.10 to 0.25
Event 622 Alcoholic patient fails to comply with instruction for not drinking prior to the operation 0.13 to 0.30
Event 642 Fail to protect patient effectively (failure related to skin prep, antibiotics admin, shaving surgical site, etc.) 0.05 to 0.20
Note: MRSA = methicillin resistant Staphlococcus aureus; OR = operating room. Sensitivity analyses were run across variations of the base case, each corresponding to a
change in probability of an event, as defined in Exhibit 10. Each of the resulting minimal cut sets included the following common events:
• Event 173 Staff fails to provide patient with instructions for weight reduction • Event 660 Patient fails to notice infection during home care • Event 642 Staff fail to protect patient effectively • Event 543 SSI risk for obese patient, weight not reduced and nutrition not improved • Event 450 Obese, but not diabetic, patient (30<BMI<40) • Event 182 Fail to administer indicated antibiotics
The events overlapping these minimal cut sets provide the biggest opportunity for preventing risk. As a result, these five events became the focus of our next step, designing a risk-informed intervention, which is presented in the following chapter.

25
Chapter 3. Risk-Informed Intervention
One of the most important goals for this project is to identify an intervention that has the greatest likelihood of mitigating the risk of SSIs. In this chapter, we detail Step 6, “Design a Risk-Informed Intervention,” by describing: (1) how we used importance and criticality measures, along with the cut sets, to inform the selection of an intervention; (2) the targeted event(s) for the intervention; (3) a description of the proposed intervention; and (4) recommendations for implementation.
Importance Measures
Importance measures are used to rank the most significant individual risks, based upon their contribution to the top level event (SSI), as a means of improving system performance. These measures help to assess the criticality of the risk in the model by assessing either the absolute risk, the risk’s relative importance within the model, or the risk’s frequency in the model. Commonly used relative importance measures in risk assessment modeling include the criticality, Birnbaum, and Fussell–Vesely measures.8 These measures anchor an individual risk estimate within the context of the other risks in the model. For example, the Birnbaum measure ranks the risks based upon the relative contribution of individual component failures in a system, and the Fussell–Vesely measure is a linear indicator of risk that accounts for the fractional contribution of a risk element to the total system for all scenarios under study, based upon the failure of an individual component. On the other hand, the criticality measure is a measure of absolute risk, which identifies the independent risk contribution of a basic event. For example, assuming that the top event SSI occurs, the criticality of basic event A is the probability that the top event is a result of basic event A. This allows the team to understand the fundamental components of a system’s liability.
The importance measure selected depends, in part, on the type of model created and the purpose of the modeling exercise. For this study, we focused on the criticality measure, because this measure permitted the rank ordering of the most critical contributors to the very rare event of SSIs and facilitated the identification of interventions that are most likely to improve system performance.
Exhibit 11 presents the events from the ST-PRA model ranked in order of criticality. For example, “Event 642 Fail to protect the patient effectively,” ranked as the most critical unique event, with the highest independent contribution to the occurrence of SSIs of 0.5187.

26
Exhibit 11. Importance measures on events in rank order of criticality
Event Criticality Birnbaum Fussell–Vesely
Event 642 Fail to protect patient effectively (failure related to skin prep, antibiotics admin, shaving surgical site, etc.)
0.5187 0.0113 0.5187
Event 450 Obese, but not diabetic, patient (30<BMI<40) 0.3147 0.0047 0.3147
Event 543 SSI risk for obese patient, weight not reduced and nutrition not improved 0.3043 0.0409 0.3043
Event 173 Staff fails to provide patient with instructions for weight reduction 0.3042 0.0015 0.3042
Event 142 Staff not well-trained in infection control 0.2583 0.0038 0.2583
Event 182 Fail to administer indicated antibiotics 0.2331 0.0051 0.2331
Event 677 Patient is a smoker but has no COPD 0.2003 0.0070 0.2003
Event 456 Patient is a smoker and has COPD 0.1649 0.0135 0.1649
Event 659 Glove puncture 0.1550 0.0038 0.1550
Event 30 Fail to prepare skin appropriately 0.1457 0.0051 0.1457
Event 138 Fail to remove watch/jewelry/fake nails 0.1291 0.0038 0.1291
Event 644 Fail to re-administer antibiotics for longer surgery 0.1166 0.0051 0.1166
Event 419 Patient fails to come for post-op visit 0.1162 0.0034 0.1162
Event 136 Fail to wash hands properly (OR staff) 0.10332 0.0038 0.1033
Event 687 Patient does not provide accurate info on smoking status 0.0995 0.0012 0.0995
Event 241 Tourniquet time >60min 0.0956 0.0051 0.0956
Event 660 Patient fails to notice infection during home care 0.0929 0.0025 0.0929
Note: BMI = body–mass index; COPD = chronic obstructive pulmonary disease; OR = operating room

27
Event(s) Targeted for Intervention
The criticality analysis provided a foundation for understanding the basic level events with the highest probability of contributing to the top level event. However, the real power of ST-PRA stems from the combinations of events and probabilities to identify critical paths leading to the occurrence of an SSI, as depicted in the minimal cut sets in Exhibit 9. Using both the criticality analysis and cut sets to identify the intervention ensures that the selected intervention will have the greatest impact in reducing SSIs.
To be successful, it is also important to consider the ease of implementation, the likelihood of achieving substantive improvement based on the intervention, and the level of effort necessary to effectively implement these interventions within an existing system (i.e., ASC environment). As with other quality improvement efforts, the most feasible intervention is the one that combines ease of implementation, has the greatest likelihood to yield an impact, and is the most resource conservative.
Due to its high criticality score and the fact that it appeared in four of the five top cut sets, “Event 642 Fail to effectively protect patient,” and its component events are recommended as the focus for intervention development. The most important components that comprise this failure, as indicated by their contribution to the risk of developing an SSI, include:
• Fail to prepare the skin appropriately preoperatively • Antibiotic-related failure • Staff not well-trained in infection control practices • Glove puncture • Fail to remove watch, jewelry, or artificial nails
Interestingly, several of these components are included as infection control requirements by the Joint Commission or the Centers for Medicare and Medicaid Services (CMS) accreditation and compliance processes in the hospital surgical environment (i.e., there are specific infection control standards regarding the wearing of jewelry and artificial nails, use of antibacterials, and other associated infection control practices). Although not required in ASCs, some facilities have adopted these policies. For example, hospital-affiliated ASCs tend to incorporate their hospital’s policies as their own; however, there can be great variability in how the policies and procedures are monitored and enforced, further highlighting this set of events as the target for a potentially valuable intervention.
The original risk of developing an SSI is estimated by the model as 0.0044, as noted previously (i.e., 44 out of 10,000 cases will develop an SSI following surgery). Because improvement efforts can never be 100 percent successful at mitigating risk, we examined the variable impact of an intervention using values of 25, 50, and 75 percent reduction in noncompliance rates. Exhibit 12 presents the new probability estimate for an intervention targeting each component intervention to reduce the occurrence of an SSI. For example, “Event 30 Fail to prepare the skin appropriately” has an original probability estimate of 0.1250. If providers reduce the current noncompliance rate of 12.5 percent by 25 percent, 50 percent, or 75

28
percent the probability risk for this single event would be reduced to 0.0938, 0.0625, or 0.0313, respectively, as shown in Exhibit 12.
Exhibit 12. Probability of an intervention reducing the risk of surgical site infection (SSI)
by interventions targeting component failure points individually
Event Original probability
25% reduction in noncom-
pliance
50% reduction in noncom-
pliance
75% reduction in noncom–
pliance
Original Probability of SSI 0.0044
Event 30 Fail to prepare skin appropriately
0.1250 0.0938 0.0625 0.0313
Gate 239 Antibiotics related failure 0.3000 0.2250 0.1500 0.0750
Event 142 Staff not well-trained in infection control
0.3000 0.2250 0.1500 0.0750
Event 659 Glove puncture 0.1800 0.1350 0.0900 0.0450
Event 138 Fail to remove watch/jewelry/fake nails
0.1500 0.1125 0.0750 0.0375
SSI = surgical site infection. Because the targeted event is comprised of multiple, related issues, the intervention can be
designed to address each of these components in the aggregate. This approach affords greater opportunity to demonstrate risk mitigation than developing an intervention that targets only one of these risk points. The impact of each of these combinations at different impact levels are presented in Exhibit 13. For example, if an ASC chooses to focus on improving skin preparation practices to appropriate levels, the intervention would reduce the likelihood of that risk factor from 0.125 to 0.0625, if the noncompliance rate was cut in half (i.e., reduced by 50 percent), as presented in Exhibit 13. If the ASC selected interventions that targeted both the failure to prepare the skin appropriately and training for staff in infection control practices and expected only a 25 percent reduction in noncompliance rate for each, the probability of an SSI would actually be further reduced to 0.0039, as presented in Exhibit 13.

29
Exhibit 13. Probability of intervention reducing risk of surgical site infection (SSI) by multiple concurrent interventions at various reductions of noncompliance rates (25, 50 and 75 percent)
Event Event 30 Gate 239 Event 142 Event 659 Event 138
25% reduction in noncompliance
Event 30 Fail to prepare skin appropriately 0.0042 0.0038 0.0039 0.0040 0.0041
Gate 239 Antibiotics-related failure – 0.0040 0.0037 0.0038 0.0039
Event 142 Staff not well-trained in infection control – – 0.0041 0.0039 0.0039
Event 659 Glove puncture – – – 0.0042 0.0041
Event 138 Fail to remove watch/jewelry/fake nails – – – – 0.0042
50% reduction in noncompliance
Event 30 Fail to prepare skin appropriately 0.0040 0.0033 0.0035 0.0037 0.0038
Gate 239 Antibiotics-related failure – 0.0036 0.0032 0.0033 0.0034
Event 142 Staff not well-trained in infection control – – 0.0038 0.0035 0.0035
Event 659 Glove puncture – – – 0.0040 0.0037
Event 138 Fail to remove watch/jewelry/fake nails – – – – 0.0041
75% reduction in noncompliance
Event 30 Fail to prepare skin appropriately 0.0039 0.0027 0.0032 0.0035 0.0035
Gate 239 Antibiotics-related failure – 0.0032 0.0027 0.0029 0.0029
Event 142 Staff not well-trained in infection control – – 0.0035 0.0030 0.0031
Event 659 Glove puncture – – – 0.0039 0.0034
Event 138 Fail to remove watch/jewelry/fake nails – – – – 0.0039
Proposed Intervention
Based on the results presented in Exhibits 12 and 13, we propose an intervention aimed at “Event 642 Fail to protect patient,” and focusing on all five major components of this cut set. Specifically, the intervention is designed to target skin preparation practices, proper administration of antibiotics, staff training in infection control practices, how to prevent glove punctures, and procedures to ensure removal of watches, jewelry, and fake nails.
When designing an intervention to improve patient safety, it is important to look for opportunities in which the intervention can be hardwired into the system of care. As much as possible, these interventions should focus on aspects that the provider can control (as opposed to

30
relying on patients to comply with instructions, for example), should be integrated into the process of care, and should include redundant process steps to minimize the occurrence of single-point failures.
When designing the intervention, the investigative team considered both the results from the sensitivity analyses and information gleaned through the site visits. These results pointed to focusing on the two major processes within the ASC environment that may impact the way in which care is provided, namely the practices employed to prevent infections and the information shared across members of the provider team, starting with the primary care physician all the way through the postoperative nurse. As a result, the proposed intervention targets these two important processes of patient care: (1) infection control practices and (2) communications between health care providers.
Infection Control Practices A major aspect of the intervention involves integrating better standards for infection
prevention practices into the daily care provided at ASCs. As a result, we recommend that guidelines for infection control practices at ASCs, modeled after the guidelines provided to hospitals, be developed. Furthermore, accompanying training for ASC staff should include the following:
• Prevention of preoperative infection transmission (e.g., hygiene, infectious waste, personal protective equipment, infectious patients, prevention of patient-to-patient transmission; assessment of risk factors for SSIs; risk procedures)
• Prevention of intraoperative infection transmission (e.g., surgical disinfection and antisepsis, skin preparation, disinfection in the surgical environment)
• Prevention of postoperative infection transmission (e.g., dressing the postoperative wound)
For example, the guidelines may include an antibacterial prophylaxis protocol that consists of several important components: (1) timing for drug administration, (2) proper drug selection, (3) re-administration of the drug after a specified period of time, and (4) specific instructions for proper dosing for obese patients. Another important example is surgical preparation and draping, a longstanding surgical technique. The important elements of this procedure should be ensured by the team as they prepare for the performance of the surgical procedure. In much the same way that Bundles of Care have extrapolated care from the operating room to the bedside for the performance of central venous catheters, we believe that there is an opportunity to readdress the way in which the surgical preparation and draping is performed. After residency, surgeons may never again be critiqued on their technique in this area, and the orientation procedures for surgical staff in ASCs are highly variable. As a result, the quality and consistency by which ASCs perform surgical preparation and draping is unknown. However, we do know that it is the procedure that has the highest opportunity for incorporating risk for an SSI into the model. Therefore, the intervention should include opportunities for staff technique to be observed, standards incorporated into a bundle, and staff trained on the proper technique to ensure consistency across providers and personnel in the ASC environment.

31
Therefore, we recommend that the ASC Bundle of Care provide specific guidance about infection control practices that ASCs should have in place and focus particularly on the critical issues identified through this study that significantly contributed both individually and in combination to an SSI. Namely, we recommend that the bundle address the following issues:
• Identification of high risk patients (e.g., diabetes, MRSA, obesity) • Procedures to ensure removal of jewelry, watches, and artificial nails • Guidance on routine double gloving and proper response to glove punctures • Skin preparation practices including antisepsis and draping • Proper administration of antibacterial agents
Further, we recommend that the bundle be implemented within a broader infection control plan, affording opportunities for auditing performance and subsequently supporting improvements in patient care within the ASC environment.
Communications Among Health Care Providers The next piece of the intervention involves improving the communications across the various
providers, including the physicians, surgeons, and ASC preoperative, operative, and postoperative staff. During the site visits, we discovered several areas where communications tended to break down such as between the ASCs and physicians’ offices during the preoperative phase of care. For example, we know that the ASC environment is a valuable and safe venue for receiving care for a large portion of the population but that it may not be the appropriate or feasible option for everyone (e.g., we know that most ASCs cannot accommodate morbidly obese patients). As a result, we propose that efforts also be directed to improve the communications between health care teams to better identify those patients who would be better served receiving care in an alternative environment such as the hospital where they have the tools and techniques in place to better care for patients such as the morbidly obese.
One way to improve communications is to create a checklist to be used by the nurse during the preoperative screening phone call to ensure that major risk factors such as obesity and poor blood glucose control are properly identified. A referral back to the surgeon should be performed for any concerns known to increase a patient’s risk for developing an SSI (e.g., smoking, diabetes, and obesity) to ensure optimal control during surgery. This communication should also be shared with the anesthesiologist and the patient’s primary care physician. A conversation should occur between the health care team members to determine whether the patient can proceed with surgery safely within the ASC environment, if inpatient surgery is the more appropriate option, or if the procedure should be done at all. These can be handled during preoperative huddles early in the morning or prior to the case.
In addition, ASCs should establish stop-gap measures that prevent surgery from occurring for patients with multiple known risk factors who present out of control on the morning of surgery (e.g., blood glucose levels out of control, uncompensated congestive heart failure (CHF)). To accomplish this, a variety of TeamSTEPPS tools can be considered. First, structured communication in the form of an SBAR, for example, might be used for a nurse to highlight a particular risk point to a surgeon. Alternatively, When a particular issue becomes a patient safety concern (e.g., when a patient’s chronic obstructive pulmonary disease is out of control

32
preoperatively), the nurse might consider the Two-Challenge Rule or the CUS tool (“I’m concerned, uncomfortable; this is a safety issue.”) to get the surgeon’s or anesthesiologist’s attention.
Intervention Implementation
As has been experienced in other health care settings for other initiatives (e.g., patient safety regulations), an important first step to improving outcomes—in this case, reducing the risk of SSIs, improving infection control practices, and improving communications—is to institute regulations to ensure that: providers are properly trained on infection control practices; staff do not wear watches, jewelry, or artificial nails; multiple components for antibacterial prophylaxis, including proper timing of administration, occur.
We propose that ASCs may be motivated to improve their infection control practices if a regulatory body with oversight of the ASC environment provides recommended guidelines or requirements. Because Joint Commission accreditation is currently voluntary for ASCs, the CMS should take an active role in better understanding the ways in which care can be improved in the ASC setting, especially with respect to infection control practices, and then provide this information to the public to assist with their decision regarding surgical options.
This piece of the intervention requires active participation by both the Joint Commission and CMS, and would be consistent with their current role in monitoring the care provided in these settings. For example, CMS has already established regulations regarding infection control in the hospital environment, which should facilitate the transition and tailoring of these regulations to the ASC environment. CMS also already plays an active role in the care received by its beneficiaries in ASCs and sponsors the integrated data sources necessary to investigate ASC infection risks at the patient level.
We believe that health care providers in ASCs want to improve the care provided to patients and prevent SSIs. To that end, regulatory requirements can be helpful in providing a standard, which currently does not exist for ASCs, for ensuring that providers take the necessary steps to protect their patients. Another possibility is to leverage the interest that ASCs have in ensuring quality patient care by engaging them as active partners in implementing the new requirement. In this way, AHRQ will build support for this initiative from both directions, from those who provide oversight of the regulations and from those who will be implementing these new practices.

33
Chapter 4. Conclusions and Next Steps
In this chapter, we highlight the strengths and limitations of the current study and discuss
some recommendations and next steps for AHRQ to consider.
Study Strengths and Limitations
ST-PRA is a valuable and important tool for assessing the risks associated with the occurrence of many different patient safety events in a variety of different health care contexts. In this study, we were able to use this novel approach to identify the contributors to the occurrence of SSIs in the ASC environment. The value of ST-PRA lies in the capacity to consider both individual contributors of risk, as well as unique combinations of risks that contribute to the adverse outcome. By including both quantitative and qualitative data into the models, a real-world experience can be created and tested using the sensitivity analysis methodology, allowing the user to maintain the scientific integrity of the tool. Finally, the ST-PRA model also serves as a living document that can continue to be modified over time as new risk information is acquired, either through direct observation or improved methods for studying the ASC environment.
Despite these important strengths, notable limitations of this study should be acknowledged. First, the quantitative estimates from the datasets were limited, because these data failed to include the more granular estimates of risk that are important for creating the risk models. As improvements in the SASD, NIS, and the SEDD databases occur, additional information regarding the context of care come into focus and can be used to further refine this research. Second, the lack of integrated data systems, linking patients between the ASC, emergency department, and inpatient settings, significantly limited the ability to inform the model with real risk estimates. Until these linkages can be established, investigators studying care in the ASC setting will continually face the challenge of “loss to followup.” Patients tend to seek care for surgical complications in emergency departments, inpatient settings, or their primary care physicians’ offices, and the attribution of the complication will not return to the ASC where it originated.
Finally, although a typical limitation of modeling is that the resulting models do not create a real-world picture of what it is intended to portray, this was not a limitation of the current study, as discussed previously. That is, the use of quantitative estimates from the literature and the modeling of the in vivo process flows contributed to a real life understanding of the system under study when combined with the sensitivity analyses, which ensured that the risk estimates and conclusions were supported across a range of values.
Next Steps
The use of ST-PRA as a modeling tool to identify risks in the ASC environment is an important outcome of this work. This model can be refined as new information becomes

34
available in the literature and as improvements in care in the ASC environment are realized through interventions like those proposed in this report. AHRQ should consider the following suggestions for next steps to continue this work, including developing the intervention, conducting a followup study to determine the impact of the intervention, developing an integrated database to track patients across care settings, and examining ways to make the ST-PRA methodology more accessible.
Developing the Intervention One of the most important next steps of this work is to develop the intervention, as proposed
in this report. We recommend developing the intervention as components and offering them in modular format, so that ASCs can select and implement the components in the order that best suits their needs. Depending upon the intervention selected, efforts aimed at understanding the critical process steps necessary for its implementation will be next. For example, if the intervention related to antibacterial administration is selected, providers will need to understand the expected performance steps that they need to include in their process and then field test these steps prior to implementation, to ensure that performance and measures of performance can be established. Intervention implementation can occur with or without regulatory oversight; however, the ability to hold providers accountable for performance in these settings over time is most likely to occur with the establishment of new regulations.
Once the performance steps are identified, education needs to occur, with feedback that addresses the barriers to implementation. The use of simulation exercises can be beneficial in this phase of the process. For example, rather than testing the intervention in vivo, the team could use microsimulation techniques and test the intervention in vitro on a desktop simulator, to see if the appropriate outcomes from the process change are achieved. Once developed, we recommend conducting a pilot test and usability study on the intervention, prior to its introduction to the ASCs. In particular, we suggest that any checklists, training programs, and infection control practices be examined to ensure that they can be used properly, effectively, and efficiently by staff and to identify ways to improve the functioning of these elements of the intervention. In addition, this study may also examine the effectiveness of each module of the intervention as a stand-alone, or in combination with the other modules that comprise this intervention.
Conducting a Followup Impact Study An essential feature of ST-PRA modeling is that it is a living document. As new information
becomes available, either in the literature or the public domain, risk estimates can be updated and new cut sets can be generated. This provides the ability to assess the impact based upon already completed work. Once the intervention and its components have been developed and implemented, followup studies should be conducted to determine the impact that these efforts have had on improving infection control practices and communications, and ultimately on the reduction of SSIs. For example, the model can be modified to include new probabilities associated with compliance with new processes and procedures, and the corresponding impact on the top-level event could be examined.

35
Developing an Integrated Database As highlighted in our discussion of data sources, a major challenge to understanding the care
provided in the ASC environment is that the data sources are not integrated. A benefit of integrating the data sources is that the potential costs associated with SSIs in the ASC environment may be more appropriately analyzed with a single data source, because the care received by a CMS dependent across practice settings is included in one place. Specifically, we recommend that the data sources include a method for tracking patients across practice settings, for example through a common patient identifier field.
Examining How to Make ST-PRA More Accessible Over the last 10 years, there have been a variety of methods and tools designed to improve
our understanding of the many risks in health care, including root cause analysis (RCA) and failure modes effects analysis. Despite the widespread use of these tools, they tend to be applied inconsistently, often with little to no expertise. An important limitation to these tools is that they are dependent upon the people who come together to analyze the event. For example, health care workers learn these strategies on the job, in the setting where a serious or sentinel event has occurred. Often these settings are emotionally charged, because a patient has experienced a severe injury at the hands of the providers, and the providers often cope by protecting and defending their own practice rather than taking the opportunity to learn through using the RCA tool.
As discussed, ST-PRA adds additional value over the other existing risk assessment tools. However, one of its major limitations at this time is that it is still restricted to the research domain, because the current fault tree software available for these analyses, Relex, is difficult to use and not understood by health care quality improvement teams. Until probability and fault tree analyses can be performed using readily available software tools, ST-PRA will remain out of reach of health care providers. We recommend that AHRQ investigate ways in which ST-PRA can be made more accessible to and easier to use by health care providers as they attempt to improve system design and reduce the risks associated with the delivery of health care. Examples of different ways this may be accomplished include modifying the ST-PRA tool as:
• An add-in to a readily available software program such as Microsoft Excel, to simplify the modeling process
• A series of questions and answers to frame the logic in a base case fault tree and allow it to be adapted to the local context
• A toolkit of core fault trees for important safety problems such as medication errors, serious and sentinel events, and central line-associated blood stream infections, which includes instructions on how to modify the core content in the risk assessment to account for differences in the local context
In summary, the results of this study offer several directions for future AHRQ work, including the development of: (1) the proposed intervention that focuses on building skills and

36
networks among health care providers; (2) additional studies such as usability, pilot testing, and followup impact; (3) better methods to track patients across provider sites; and (4) the development of more accessible tools that enable health care provider organizations better ways to examine other high-risk, low-base-rate events, and ultimately to improve the quality of care being delivered.
37
References 1. Fact Sheet on Probabilistic Risk Assessment. Rockville, MD: United States Nuclear Regulatory Commission; October 2007. http://www.nrc.gov/reading-rm/doc-collections/fact-sheets/probabilistic-risk-asses.html Accessed on August 14, 2011.
2. Fault Tree Handbook with Aerospace Applications. Version 1.1. Washington, DC: National Aeronatics and Space Administration; August 2002. http://www.hq.nasa.gov/office/codeq/doctree/fthb.pdf Accessed on August 14, 2011.
3. Westphal JE, Marx DA. Socio-technical probabilistic risk assessment: Its application to aviation maintenance. Int J Aviat Psychol 2008; 18(1): 51-60.
4. Marx DA, Slonim AD. Assessing patient safety risk before the injury occurs: An introduction to sociotechnical probabilistic risk modeling in health care. Qual Saf Health Care 2003 Dec; 12(Suppl 2): ii33–8.
5. Slonim AD, Bish EK, Xie RS. Red blood cell transfusion safety: Probabilistic risk assessment and cost/ benefits of risk reduction strategies. Ann Operations Research (Posted online 12 Jul 2011); 30 pp. DOI: 10.1007/s10479-011-0925-0Online First™
6. Mangram AJ, Horan TC, Pearson ML, et al. Guideline for prevention of surgical site infection, 1999. Infect Control and Hosp Epidemiol 1999 Apr; 20(4):250-80.
7. Ross SM. Introduction to Probability Models (8th ed.). Academic Press, CA, 2003.
8. Modarres M, ed. Risk analysis in engineering techniques, tools and trends. London , UK: Taylor and Francis Publishing ; 2006. Chapter 3, Probabilistic Risk Assessment (p. 33–111), & Chapter 6, Identifying, ranking and predicting contributors to risk (p. 241–74).

[Page Left Purposely Blank]


AHRQ Pub. No. 12-0045-EFMarch 2012
U.S. Department of Health and Human ServicesAgency for Healthcare Research and Quality540 Gaither RoadRockville, MD 20850