pro angiogenic and anti angiogenic …eprints.qut.edu.au/87318/1/xufang_zhang_thesis.pdfii...
TRANSCRIPT

PRO-ANGIOGENIC AND ANTI-ANGIOGENIC
FACTORS IN THE DEGRADATION OF
OSTEOARTHRITIC CARTILAGE
Xufang Zhang
BDS, MDS
Institute of Health and Biomedical Innovation
School of Biomedical Engineering & Medical Physics
Science and Engineering Faculty
Queensland University of Technology
Thesis submitted for the award of Doctor of Philosophy
September 2015


Pro-angiogenic and anti-angiogenic factors in the degradation of osteoarthritic cartilage i
Keywords
Angiogenesis, angiogenesis inhibitors, anti-angiogenesis, articular cartilage
chondrocytes, cartilage, cartilage degradation, chondrocyte hypertrophy,
chondrogenic differentiation, chondromodulin-1, chromatin immunoprecipitation,
collagen, hypoxia, hypoxia-inducible factor, lentivirus, matrix metalloproteinase,
osteoarthritis, vascular endothelial growth factor.

ii Pro-angiogenic and anti-angiogenic factors in the degradation of osteoarthritic cartilage
Abstract
Osteoarthritis (OA) is the most common form of musculoskeletal disorder and is a
leading cause of disability in the elderly. Some key pathophysiological features of
OA joints include articular cartilage degradation and abnormal subchondral bone
metabolism; however, the aetiology is largely unknown. Angiogenesis, controlled by
a balance between endogenous angiogenic and anti-angiogenic factors, has been
found to contribute to the pathogenesis and progression of OA. It is well known that
articular cartilage is an avascular tissue by nature, in which the resident chondrocytes
maintain a stable phenotype that avoids hypertrophy and angiogenesis throughout
life. It is of great importance to better understand the physiology of healthy cartilage
in order to develop therapies capable of arrest or reverse OA progression. Healthy
cartilage is known to contain considerable amount of anti-angiogenic factors. Among
them, chondromodulin-1 (ChM-1) is the most specific and abundant in cartilage and
the regulatory effect of ChM-1 in chondrocyte maturation and bone remodelling has
been verified in genetically modified mice. However, the contribution of anti-
angiogenic factors in the maintenance of chondrocyte phenotype is largely unknown.
Motivated by these findings, the aim of this project is to address the balance between
angiogenesis and anti-angiogenesis in OA cartilage with the focus on the function of
anti-angiogenic factor ChM-1.
For this purpose, cartilage tissues from the knees of OA patients were collected to
establish the profile of angiogenic and anti-angiogenic cytokines using angiogenesis
qRT-PCR array, human cytokine antibody membrane array, qRT-PCR, and Western
blot. The results revealed that the majority of angiogenic factors increased in severe
OA cartilage, while anti-angiogenic factors decreased, including ChM-1, tissue
inhibitor of metalloproteinase (TIMP)-1, TIMP-2, thrombospondin (TSP)-1 and
TSP-2, which implies loss of the balance between pro-angiogenic and anti-
angiogenic properties may be one of the most important characteristic of the cartilage
during OA progression. The down-regulation of ChM-1 and up-regulation of
vascular endothelial growth factor A (VEGFA) were also confirmed in both gene and
protein levels.
Subsequently, the involvement of ChM-1 in chondrogenesis and OA progression in
Pro-angiogenic and anti-angiogenic factors in the degradation of osteoarthritic cartilage iii
vivo and in vitro was systematically studied. Genetic manipulation of ChM-1
expression was performed using either lentiviral constructs carrying ChM-1 cDNA
(LV-ChM-1) or ChM-1siRNA. The results showed that ChM-1 expression was
correlated with chondrogenesis in cells derived from both cartilage and bone
marrow. Chondrocytes infected with LV-ChM-1 effectively resisted tumour necrosis
factor alpha (TNF-α) induced hypertrophy, with decreased gene and protein levels of
hypertrophic markers matrix metalloproteinase (MMP)-13, type X collagen α1
(COL10A1) and VEGFA; whereas chondrocytes infected with ChM-1 siRNA were
more sensitive to TNF-α induced hypertrophy. Next, the functional relevance of
ChM-1 supplementation to OA progression was tested in vivo using an experimental
rat OA model. It was demonstrated that intra-articular injection of lentivirus ChM-1
significantly ameliorated OA progression, as evidenced by reduced expression of
hypertrophic markers and matrix degradation.
Subsequent studies were performed to explore the molecular mechanism by which
ChM-1 exerts its anti-hypertrophic function. The hypoxia-inducible factor (HIF)-2α
pathway has recently been shown to be a central catabolic regulator of osteoarthritic
cartilage destruction with directly targeting multiple hypertrophic genes. Given that
cartilage is an avascular tissue, positive expression of HIF-2α in normal articular
cartilage has been detected in my study, and has been reported by other researchers
too. However, the presence of HIF-2α in normal cartilage is not enough in itself to
initiate the angiogenic and catabolic cascades. I hypothesized that ChM-1, as an
intrinsic and abundant protein in cartilage, may play a regulatory role in HIF-2α
function. Indeed, the results showed that ChM-1 overexpression delayed
translocation of HIF-2α to the nucleus at early time-point and inhibited its DNA
binding activity to the promoter of COL10A1, MMP-13 and VEGFA. This suggests
that the protective effect of ChM-1 on TNF-α-induced hypertrophy might be
achieved, at least in part, through the inhibition of HIF-2α activity.
In conclusion, this thesis extends our knowledge on the importance of anti-
angiogenic factor in cartilage to maintain the physiological function of chondrocytes
and prevent hypertrophy. My results indicate that ChM-1 is important to maintain the
chondrocyte phenotype and prevent hypertrophy by inhibiting catabolic factors of
COL10A1, MMP-13 and VEGFA via the HIF-2α signalling pathway. Moreover, this

iv Pro-angiogenic and anti-angiogenic factors in the degradation of osteoarthritic cartilage
study provides a potential therapeutic strategy for OA through supplementation of
anti-angiogenic factor of ChM-1.

Pro-angiogenic and anti-angiogenic factors in the degradation of osteoarthritic cartilage v
Table of Contents
Keywords .................................................................................................................................................i
Abstract .................................................................................................................................................. ii
Table of Contents .................................................................................................................................... v
List of Figures ..................................................................................................................................... viii
List of Tables .......................................................................................................................................... x
List of Abbreviations ..............................................................................................................................xi
List of Publications and Presentations ................................................................................................. xiii
Statement of Original Authorship ......................................................................................................... xv
Acknowledgements .............................................................................................................................. xvi
CHAPTER 1: INTRODUCTION ....................................................................................................... 1
1.1 Background .................................................................................................................................. 1
1.2 Context and research questions .................................................................................................... 3
1.3 Hypotheses and aims .................................................................................................................... 3
1.4 Significance ................................................................................................................................. 4
1.5 Thesis outline ............................................................................................................................... 4
CHAPTER 2: LITERATURE REVIEW ........................................................................................... 5
2.1 Structure and physiology of articular cartilage ............................................................................ 5 2.1.1 Articular cartilage development ........................................................................................ 5 2.1.2 Structure of mature articular cartilage .............................................................................. 7 2.1.3 Chondrocyte phenotype in cartilage ................................................................................. 8
2.2 Osteoarthritis (OA) .................................................................................................................... 11 2.2.1 Aetiology ........................................................................................................................ 11 2.2.2 Clinical significance of OA ............................................................................................ 11 2.2.3 Pathophysiology of OA .................................................................................................. 12 2.2.4 Chondrocyte hypertrophy in OA cartilage ...................................................................... 13
2.3 Hypoxia ...................................................................................................................................... 15 2.3.1 Oxygen tension in cartilage ............................................................................................ 15 2.3.2 Overview of hypoxia inducible factor (HIF) signalling pathway ................................... 16 2.3.3 Role of HIFs pathway in cartilage development and homeostasis .................................. 18 2.3.4 Role of HIFs pathway in osteoarthritis ........................................................................... 19
2.4 Chondromodulin-1 (ChM-1) in cartilage development, homeostasis and diseases ................... 22 2.4.1 Structure of ChM-1 ......................................................................................................... 22 2.4.2 Role of ChM-1 in cartilage development and regeneration ............................................ 24 2.4.3 Role of ChM-1 in other tissues and diseases .................................................................. 26 2.4.4 Molecular mechanisms involving the expression and function of ChM-1 ..................... 28 2.4.5 The research progress of angiogenesis and anti-angiogenesis in OA ............................. 28
2.5 Summary and implications......................................................................................................... 29
CHAPTER 3: MATERIALS AND METHODS .............................................................................. 31
3.1 Introduction ................................................................................................................................ 31
3.2 Reagents and antibodies ............................................................................................................. 31
3.3 Sample collection ....................................................................................................................... 31
3.4 Histology and Immunohistochemical staining ........................................................................... 32

vi Pro-angiogenic and anti-angiogenic factors in the degradation of osteoarthritic cartilage
3.5 Protein extraction and immunoblotting...................................................................................... 33 3.5.1 Protein extraction from cartilage tissues ......................................................................... 33 3.5.2 Protein extraction from chondrocytes ............................................................................. 33 3.5.3 Western blot.................................................................................................................... 34
3.6 Total RNA extraction from cartilage tissue ............................................................................... 34
3.7 Reverse transcription and qRT-PCR .......................................................................................... 34
3.8 Angiogenesis qRT-PCR array.................................................................................................... 38
3.9 Human cytokine antibody membrane array analysis ................................................................. 38
3.10 Cell culture................................................................................................................................. 39 3.10.1 Cell isolation and expansion ........................................................................................... 39 3.10.2 Chondrogenic differentiation .......................................................................................... 39
3.11 Lentivirus mediated gene manipulating ..................................................................................... 40 3.11.1 Lentivirus ChM-1 construct ............................................................................................ 40 3.11.2 Lentivirus production and titration ................................................................................. 40 3.11.3 LV-ChM-1 infection of chondrocytes ............................................................................ 41
3.12 ChM-1 knockdown by siRNA transfection in primary chondrocytes ........................................ 41
3.13 Animal study .............................................................................................................................. 42 3.13.1 Rat OA model ................................................................................................................. 42 3.13.2 Histological and immunohistochemical staining ............................................................ 42 3.13.3 Detection of gene expression in rat OA cartilage ........................................................... 43
3.14 Immunocytochemical staining ................................................................................................... 43
3.15 Chromatin immunoprecipitation (ChIP) assay........................................................................... 44
3.16 Statistical analysis ...................................................................................................................... 45
CHAPTER 4: PROFILE OF ANGIOGENIC AND ANTI-ANGIOGENIC CYTOKINES IN OA CARTILAGE 47
4.1 Introduction................................................................................................................................ 47
4.2 Materials and Methods ............................................................................................................... 48 4.2.1 Sample collection ........................................................................................................... 48 4.2.2 Immunohistochemical staining ....................................................................................... 48 4.2.3 Total RNA extraction and Angiogenesis qRT-PCR array .............................................. 48 4.2.4 Protein extraction and cytokine array ............................................................................. 49 4.2.5 Statistical analysis .......................................................................................................... 49
4.3 Results ....................................................................................................................................... 50 4.3.1 Loss of ChM-1 in severe OA cartilage ........................................................................... 50 4.3.2 Angiogenesis qRT-PCR array ........................................................................................ 52 4.3.3 Cytokine profile of human OA cartilage ........................................................................ 55
4.4 Discussion .................................................................................................................................. 60
CHAPTER 5: ROLE OF CHM-1 DURING CHONDROCYTE HYPERTROPHY AND ITS THERAPEUTIC EFFICACY IN OA PROGRESSION IN VITRO AND IN VIVO ..................... 65
5.1 Introduction................................................................................................................................ 65
5.2 Materials and Methods ............................................................................................................... 66 5.2.1 Cell culture and chondrogenic differentiation ................................................................ 67 5.2.2 Lentivirus and siRNA transfections ................................................................................ 67 5.2.3 Animal OA model .......................................................................................................... 68 5.2.4 Histological and immunohistochemical staining ............................................................ 68 5.2.5 Detection of gene expression in OA rat cartilage ........................................................... 68 5.2.6 Statistical analysis .......................................................................................................... 69
5.3 Results ....................................................................................................................................... 69 5.3.1 ChM-1 was positively correlated with chondrogenic differentiation ............................. 69 5.3.2 TGF-β3 could not up-regulate ChM-1 ............................................................................ 71

Pro-angiogenic and anti-angiogenic factors in the degradation of osteoarthritic cartilage vii
5.3.3 Lentivirus ChM-1 production and infection efficacy...................................................... 73 5.3.4 ChM-1 exerted protective effect on catabolic response induced by TNF-α ................... 81 5.3.5 Overexpression of ChM-1 in articular cartilage delayed OA progression in vivo .......... 84
5.4 Discussion .................................................................................................................................. 91
CHAPTER 6: CHM-1 INHIBITS CATABOLIC CHANGES OF OA CHONDROCYTES THROUGH HIF-2Α PATHWAY ...................................................................................................... 95
6.1 Introduction ................................................................................................................................ 95
6.2 Materials and Methods ............................................................................................................... 96 6.2.1 Immunohistochemical staining of HIF-1α and HIF-2α in rat OA cartilage .................... 97 6.2.2 Expression of HIF-2α in chondrocyte under hypoxia or TNF-α stimulation .................. 97 6.2.3 Effect of ChM-1 overexpression on HIF-2α production and nucleus translocation
in chondrocytes ............................................................................................................... 97 6.2.4 ChIP assay ...................................................................................................................... 98 6.2.5 Statistical analysis ........................................................................................................... 98
6.3 Results ........................................................................................................................................ 98 6.3.1 Expression of HIF-1α and HIF-2α in normal and OA cartilage ..................................... 98 6.3.2 ChM-1 delayed HIF-2α translocation to nucleus .......................................................... 100 6.3.3 ChM-1 inhibited transcriptional activity of HIF-2α on hypertrophic genes ................. 104
6.4 Discussion ................................................................................................................................ 105
CHAPTER 7: CONCLUSION AND DISCUSSION ..................................................................... 109
7.1 Introduction .............................................................................................................................. 109
7.2 Project design and main findings ............................................................................................. 110
7.3 Clinical implications ................................................................................................................ 116
7.4 Limitation................................................................................................................................. 117
7.5 Future direction ........................................................................................................................ 118
7.6 Concluding remarks ................................................................................................................. 119
BIBLIOGRAPHY ............................................................................................................................. 121
APPENDICES ................................................................................................................................... 140
viii Pro-angiogenic and anti-angiogenic factors in the degradation of osteoarthritic cartilage
List of Figures
Figure 2-1. Procession of endochondral ossification.............................................................................. 6
Figure 2-2. Structure of mature articular cartilage. ................................................................................ 8
Figure 2-3. Molecular structure of ChM-1. .......................................................................................... 23
Figure 2-4. Immunolocalization of ChM-1 in the avascular mesenchyme of the developing mouse forelimb. ................................................................................................................... 25
Figure 4-1. Expression of angiogenic and anti-angiogenic cytokines in OA cartilage......................... 51
Figure 4-2. Human Angiogenesis qRT-PCR array on OA cartilage tissue. ......................................... 53
Figure 4-3. qRT-PCR validation of differential expressed genes in severe OA cartilage identified by angiogenesis qRT-PCR array analysis. ........................................................... 54
Figure 4-4. Cytokine profiles in severe and mild OA cartilage. ........................................................... 56
Figure 4-5. Relative expression of angiogenic cytokines in severe and mild OA cartilage. ................ 57
Figure 5-1. Expression of chondrogenic and angiogenic-related markers in chondrogenic differentiation of ACCs and BMSCs.................................................................................... 70
Figure 5-2. Gene expression of ChM-1, COL2A1 and SOX9 in BMSCs in response to TGF-β3. ........................................................................................................................................ 72
Figure 5-3. Amplification of ChM-1 cDNA by PCR (A) and linearization of plasmid vector pLenti6/V5 (B). .................................................................................................................... 74
Figure 5-4. Map of pLenti6/V5 containing ChM-1 cDNA insert. ........................................................ 75
Figure 5-5. Gel electrophoresis of positive clones. .............................................................................. 76
Figure 5-6. GFP fluorescence in HEK293T cells during lentivirus GFP (LV-GFP) production. ........ 77
Figure 5-7. Validation of LV-ChM-1 transfection efficiency and titration by using HEK293T cells. ..................................................................................................................................... 78
Figure 5-8. Validation of LV-GFP transfection efficiency and titration by using HEK293T cells. ..................................................................................................................................... 79
Figure 5-9. Transfection efficiency of LV-GFP and LV-ChM-1 in primary articular cartilage chondrocytes (ACCs). .......................................................................................................... 80
Figure 5-10. Effects of gain and loss of function of ChM-1 on hypertrophic markers in primary cultured ACCs. ..................................................................................................................... 82
Figure 5-11. Effects of ChM-1 overexpression on chondrogenic differentiation of ACCs in pellet culture. ........................................................................................................................ 83
Figure 5-12. Gross observation of femur and tibia cartilage surface in surgical osteoarthritis rat model at 5-weeks. ................................................................................................................ 85
Figure 5-13. Histology analysis of tibia cartilage section in surgical osteoarthritis rat model at 5-Weeks. .............................................................................................................................. 86
Figure 5-14. Validation of lentivirus transfection efficacy in surgical osteoarthritis rat cartilage at 5-weeks. ........................................................................................................................... 87
Figure 5-15. Immunohistochemical staining of chondrogenic and hypertrophic markers in surgical osteoarthritis rat cartilage at 5-weeks. .................................................................... 88
Figure 5-16. Gene expression of ChM-1 and hypertrophic markers in surgical osteoarthritis rat cartilage at 5-weeks. ............................................................................................................. 89
Figure 5-17. Histology analysis of tibia cartilage in surgical osteoarthritis rat model at 9-weeks. ................................................................................................................................... 90

Pro-angiogenic and anti-angiogenic factors in the degradation of osteoarthritic cartilage ix
Figure 6-1. Immunohistochemical staining of HIF-1α and HIF-2α in rat OA cartilage. ...................... 99
Figure 6-2. Transfection efficiency of LV-GFP and LV-ChM-1 in chondrocyte cell line C28/I2. ................................................................................................................................ 101
Figure 6-3. Effect of ChM-1 overexpression on HIF-2α production in chondrocyte cell line C28/I2. ................................................................................................................................ 102
Figure 6-4. ChM-1 delayed HIF-2α translocation to nucleus in C28/I2. ............................................ 103
Figure 6-5. ChM-1 inhibited transcriptional activity of HIF-2α on hypertrophic genes. .................. 104
Figure 6-6. Schematic illustration of underlying molecular mechanisms of ChM-1. ......................... 108
Figure 7-1. Schematic illustration showing the protective effect of ChM-1 on cartilage homeostasis and the underlying mechanisms. .................................................................... 115

x Pro-angiogenic and anti-angiogenic factors in the degradation of osteoarthritic cartilage
List of Tables
Table 3-1. Primers used in qRT-PCR ................................................................................................... 36
Table 4-1. Profile of cytokines in OA cartilage (Classified by function) ............................................. 58
Table 4-2. Profile of cytokines in OA cartilage (Classified by signalling pathway) ............................ 59
Pro-angiogenic and anti-angiogenic factors in the degradation of osteoarthritic cartilage xi
List of Abbreviations
AAV adeno-associated virus
ACCs articular cartilage chondrocytes
ADAMTS a-disintegrin and metalloproteinase with thrombospondin-like repeats
ANOVA analysis of variance
BMSC bone marrow stromal cell
BSA bovine serum albumin
cDNA complimentary deoxyribonucleic acid
ChIP chromatin immunoprecipitation
ChM-1 chondromodulin-1
CO2 carbon dioxide
COL collagen
DMEM Dulbecco’s modified Eagles medium
DMEM/F12 Dulbecco’s modified Eagles medium/Ham’s F-12
DNA deoxyribonucleic acid
EDTA ethylenediamine tetraacetic acid
ERK1/2 extracellular signal-related kinase-1 and -2
FBS fetal bovine serum
FGF fibroblast growth factor
GAPDH glyceraldehyde 3-phosphate dehydrogenase
GFP green fluorescent protein
HEK human embryonic kidney
HIF hypoxia-inducible factor
IgG immunoglobulin G
JNK c-Jun N-terminal kinase
kb kilo bases
xii Pro-angiogenic and anti-angiogenic factors in the degradation of osteoarthritic cartilage
kDa kilo Dalton
LV lentivirus
MAPK mitogen-activated protein kinase
mins minutes
mL millilitre
MMP matrix metalloproteinase
mRNA messenger ribonucleic acid
NOS2 nitric oxide synthase-2
OA osteoarthritis
PBS phosphate buffered saline
PCR polymerase chain reaction
PDGF platelet-derived growth factor
PFA paraformaldehyde
pfu plaque-forming unit
PHD prolyl hydroxylase
P/S penicillin/streptomycin
PTGS2 prostaglandin endoperoxide synthase-2
qRT-PCR quantitative real-time reverse transcriptase polymerase chain reaction
SEM standard error of the mean
TGF-β transforming growth factor beta
TIMP tissue inhibitor of metalloproteinase
TNF tumor necrosis factor
TSP thrombospondin
VEGF vascular endothelial growth factor
VEGFR vascular endothelial growth factor receptor
VHL von Hippel-Lindau protein
Wnt wingless-type MMTV integration site family member

Pro-angiogenic and anti-angiogenic factors in the degradation of osteoarthritic cartilage xiii
List of Publications and Presentations
Publications arising from this PhD project
1. Xufang Zhang, Wei Fang, Ross Crawford, Yin Xiao. Chondromodulin-1
ameliorates osteoarthritis progression by inhibiting HIF-2α activity. To be submitted
to Arthritis and Rheumatology. (Awaiting for completion of final manuscript draft).
2. Xufang Zhang, Ross Crawford, Yin Xiao. Inhibition of vascular endothelial
growth factor (VEGF) with shRNA maintains chondrocyte phenotype in
osteoarthritis. To be submitted to Journal of Molecular Medicine. (Manuscript in
preparation).
Other publications
Xufang Zhang, Pingping Han, Anjali Jaiprakash, Chengtie Wu, Yin Xiao.
Stimulatory effect of Ca3ZrSi2O9 bioceramics on cementogenic/osteogenic
differentiation of periodontal ligament cells. Journal of Materials Chemistry B, 2014,
2 (10), 1415 – 1423. (IF 6.62)
Presentations
1. Xufang Zhang, Ross Crawford, Yin Xiao. Anti-angiogenic factors are essential
regulators in cartilage homeostasis and osteoarthritis. Australian and New Zealand
Bone & Mineral Society, Annual Scientific Meeting, September, 2014, Queenstown,
New Zealand. (Oral presentation)
2. Xufang Zhang, Ross Crawford, Yin Xiao. Imbalance between pro-angiogenic and
anti-angiogenic factors in osteoarthritic cartilage. Australia & New Zealand
Orthopaepic Research Society 18th Annual Scientific Meeting, September, 2012,
Perth, Australia. (Oral presentation)
3. Xufang Zhang, Indira Prasadam, Ross Crawford, Yin Xiao. Expression of
angiogenic related cytokines in cartilage of osteoarthritis. Australian and New
Zealand Bone & Mineral Society 22nd Annual Scientific Meeting, and the 1st Asia-

xiv Pro-angiogenic and anti-angiogenic factors in the degradation of osteoarthritic cartilage
Pacific Bone and Mineral Research Meeting, September, 2012, Perth, Australia.
(Poster presentation)
4. Xufang Zhang, Ross Crawford, Yin Xiao. Imbalance between pro-angiogenic and
anti-angiogenic factors in osteoarthritic cartilage. IHBI inspire, November, 2012,
Gold Coast, Australia. (Poster presentation)
Pro-angiogenic and anti-angiogenic factors in the degradation of osteoarthritic cartilage xv
Statement of Original Authorship
The work contained in this thesis has not been previously submitted to meet
requirements for an award at this or any other higher education institution. To the
best of my knowledge and belief, the thesis contains no material previously
published or written by another person except where due reference is made.
Signature: QUT Verified Signature
Date: September 2015

xvi Pro-angiogenic and anti-angiogenic factors in the degradation of osteoarthritic cartilage
Acknowledgements
First of all, I would like to thank my principal supervisor Professor Yin Xiao, whose
guidance, innovative ideas and continuous supports have always been invaluable for
me. Thanks for encouraging me and keeping me motivated throughout my PhD
journey. My appreciation and gratitude are also addressed to my co-supervisor,
Professor Ross Crawford, whose generous support and excellent clinical expertise
has always inspired me to work hard. It has been a great opportunity to work with
both of you and to join in such a wonderful group.
My appreciation also goes to all the former and current teachers, colleagues and my
wonderful friends in IHBI, especially Dr. Chengtie Wu, Ms. Wei Shi, Dr. Thor Friis,
Dr. Xueli Mao, Dr.Wenyi Gu, Mr. Samuel Perry, Dr. Yinghong Zhou, Dr. Pingping
Han, Mr. Zetao Chen, Dr. Nishant Chakravorty, Mr. Edward Ren and Ms. Snow
Zhang. It has been highly enjoyable learning and working with you. I really cherish
and appreciate the friendships established during my PhD journey.
I would also like to express my gratitude to the professional staff in Institute of
Health and Biomedical Innovation (IHBI) and Medical Engineering Research
Facility (MERF) with the excellent laboratory facilities. I am also grateful to them
for providing comfortable research environment and suggestions regarding my study.
Many thanks go to QUT for the Tuition Fee Waiver Scholarship and China
Scholarship Council for granting me a living allowance scholarship.
Deep gratitude goes to my boyfriend Chen Fan, for his support and encouragement
during my hard times. I am lucky enough to have your love and companion during
PhD journey.
Last but not least, my heartfelt gratitude goes to my family for their unconditional
love and support. Their love has been the most important strength that makes me
keep going in my work and in my life.

Chapter 1: Introduction 1
Chapter 1: Introduction
1.1 BACKGROUND
Osteoarthritis (OA) is the most common form of musculoskeletal disorder and is a
leading cause of disability in older members of society. The key pathophysiological
features of OA joints include articular cartilage degradation and abnormal
subchondral bone metabolism; however the aetiology is largely unknown. Loss of
proteoglycans (mainly aggrecan) and degradation of collagen matrix are the most
prominent characteristics of OA cartilage. Furthermore, hypertrophy markers
including type Х collagen α1 (COL10A1), matrix metallopeptidase-13 (MMP-13)
and runt-related transcription factor-2 (RUNX2) are up-regulated in OA cartilage,
leading to disruption of homeostasis and cartilage degradation. The molecular
mechanisms regulating phenotypic changes of OA cartilage are largely unknown.
Angiogenesis has recently been found to contribute to pathogenesis of OA. It is well
documented that articular cartilage is an avascular tissue by nature, in which the
resident chondrocytes maintain stable phenotype that suppresses hypertrophy and
angiogenesis throughout life. Therefore, articular cartilage may possess its own
intrinsic factors to maintain the phenotype. It is of great importance to understand the
physiology of healthy cartilage in order to develop therapies capable of arresting or
reversing OA progression. Several growth factors, such as the transforming growth
factor beta (TGF-β) family, have been proposed to be essential for chondrogenesis
and cartilage development (Goldring et al., 2006; Lafont et al., 2008). But TGF-β is
not exclusively expressed in cartilage tissue and furthermore, intra-articular
supplement of TGF-β results in osteoarthritis-like changes and osteophyte formation
(Bakker et al., 2001; Van Beuningen et al., 2000; Van Beuningen et al., 1994),
which may deny its importance in mature cartilage maintenance. It has been
observed that cartilage contains appreciable amounts of anti-angiogenic factors, such
as chondromodulin-1 (ChM-1) and thrombospondin (TSPs), which are expressed in
the chondrocyte cytoplasm and cartilage matrix (Bonnet & Walsh, 2005; Hiraki et
al., 1997a; Hiraki et al., 1997b; Patra & Sandell, 2012). ChM-1, one of the most
specific and abundant anti-angiogenic factors in cartilage, is a 121-amino acid

2 Chapter 1: Introduction
residue glycoprotein derived from a transmembrane precursor and distributed mainly
in interstitial space of cartilage matrix (Hiraki, et al., 1997a; Shukunami & Hiraki,
1998). The inhibition of angiogenesis by ChM-1 in cartilage, cardiac valves and
several tumours has been well documented (Hayami et al., 1999; Miura et al., 2010;
Yoshioka et al., 2006). The regulatory effect of ChM-1 in cartilage development was
verified by genetically modified mice. In vivo, ChM-1 null mice have retarded
chondrocyte maturation in the periosteal callus, aberrant cartilage formation during
fracture repair (Yukata et al., 2008), and marked reduction in bone remodelling
(Nakamichi et al., 2003). A recent study demonstrated that application of adeno-
associated virus (AAV) carrying ChM-1 in micro-fractured porcine cartilage lesions
stimulate chondrogenic differentiation of ingrowing progenitor cells, and inhibited
endochondral ossification by an unknown mechanism (Klinger et al., 2011).
However, the contribution of anti-angiogenic factors in the maintenance of
chondrocyte phenotype is largely unknown.
Another observation is that hypoxia stabilizes the hypoxia-inducible factor-α (mainly
HIF-1α and HIF-2α) and initiates an angiogenic signalling cascade. In cartilage,
however, the avascular nature of the tissue and the resulting hypoxia normally would
not support angiogenesis. HIF-1α and HIF-2α have both been found in normal
articular cartilage (Bohensky et al., 2009; Coimbra et al., 2004). Although HIF-1α is
reported to be essential for chondrocyte survival, energy generation and matrix
synthesis, it has also been shown that HIF-1α can induce vascular endothelial growth
factor A (VEGFA) expression in chondrocytes (Lin et al., 2004; Pfander et al., 2003;
Schipani et al., 2001; Thoms et al., 2013). HIF-2α has been recently demonstrated as
a central catabolic regulator of osteoarthritic cartilage destruction by directly
targeting the hypertrophic genes VEGFA, COL10A1, MMP-13 and RUNX2 (Saito
et al., 2010; Yang et al., 2010). So, given that HIFs do not typically initiate the
angiogenic and catabolic cascades in normal cartilage, there must exist a mechanism
that prevents this effect. The question as to whether the abundant expression of
ChM-1 in cartilage interferes with the activity of HIFs has until now remained
unknown.

Chapter 1: Introduction 3
1.2 CONTEXT AND RESEARCH QUESTIONS
The pathology of OA involves both of loss of cartilage avascularity and chondrocyte
hypertrophy. However, it is not clear whether the angiogenic and anti-angiogenic
equilibrium would be shifted and whether this imbalance could exacerbate cartilage
degradation and disease process. As discussed above, ChM-1 is the most abundant
endogenous anti-angiogenic protein expressed in cartilage, and its expression is
confined to normal avascular cartilage. However, there remains a large knowledge
gap in our understanding of the contribution of ChM-1 to maintain the chondrocyte
phenotype. In addition, although hypoxia is the physiologic environment for articular
cartilage, in vascular tissues it is a stress condition. HIF-2α has recently been shown
to be a catabolic regulator in growth plate and osteoarthritis. How chondrocytes
survive in hypoxic conditions and why HIFs initiate angiogenic and hypertrophic
pathways in OA cartilage – but not in normal cartilage – is a fundamental question in
cartilage biology. Whether ChM-1’s role is primarily to protect chondrocytes by
regulating the HIF-2α pathway remained to be investigated.
1.3 HYPOTHESES AND AIMS
The hypothesis of my PhD study was that the anti-angiogenic factor is essential in
maintaining the physiological functions of chondrocytes and preventing hypertrophy
in OA development.
The specific aims of this study are summarized as follows:
Aim 1: To characterize the profiles of angiogenic and anti-angiogenic cytokines in
human OA cartilage. (Chapter 4)
Aim 2: To investigate the involvement of ChM-1 in chondrogenesis and chondrocyte
hypertrophy in vitro. (Chapter 5)
Aim 3: To investigate the therapeutic potential of ChM-1 supplementation in OA
progression using an experimental rat OA model. (Chapter 5)
Aim 4: To explore the molecular mechanism underlying anti-hypertrophic function
of ChM-1 with a focus on the HIF-2α pathway. (Chapter 6)

4 Chapter 1: Introduction
1.4 SIGNIFICANCE
The identification of the specific biological factors responsible for maintaining
cartilage homeostasis is of great importance to develop novel therapeutic strategies
of OA. The present study has focused on the cartilage-derived anti-angiogenic factor
ChM-1, and highlighted its function in phenotype transition of OA cartilage. More
knowledge about anti-angiogenesis and the maintenance of cartilage homeostasis has
been revealed as the result of this project. This project is the first to systematically
investigate the role of ChM-1 during chondrogenic differentiation and chondrocyte
hypertrophy, as well as in OA progression in vivo. It also pioneers the exploration of
anti-hypertrophic mechanisms of ChM-1 in relation to the HIF-2α pathway. These
findings will provide a new perspective on the molecular mechanisms of cartilage
maintenance and OA progression, and also suggest potential new treatment options
of OA.
1.5 THESIS OUTLINE
This thesis comprises seven chapters:
(1) Introduction of my PhD topics, hypothesis and aims;
(2) Literature review on the topic investigated;
(3) Methodology and material used in this study;
(4) Results from aim 1, showing the profile of angiogenic and anti-angiogenic factors
in severe OA cartilage;
(5) Results from aims 2 and 3, showing the role of ChM-1 during chondrocyte
hypertrophy and its therapeutic efficacy in OA development in vitro and in vivo;
(6) Results from aim 4, showing that ChM-1 regulates the HIF-2α pathway by
delaying HIF-2α nuclear translocation thus inhibiting its transcriptional activity;
(7) General discussion and conclusion of this study.

Chapter 2: Literature Review 5
Chapter 2: Literature Review
2.1 STRUCTURE AND PHYSIOLOGY OF ARTICULAR CARTILAGE
Cartilage is a specialized connective tissue composed of chondrocytes and a large
amount of extracellular matrix including collagen fibres, ground substance rich in
proteoglycan and elastin fibres (Pacifici et al., 2000). According to the amounts of
these three components, cartilage is classified into three types: elastic cartilage,
hyaline cartilage and fibrocartilage. Articular cartilage – also referred to as hyaline
cartilage – is the main component of joint surface with biophysical properties and the
ability of withstanding high compressive forces (Las Heras et al., 2012).
2.1.1 Articular cartilage development
Formation of articular cartilage
The process of articular joint formation is classically divided into two phases
(Goldring, 2012). The first phase is the formation of mesenchymal prechondrogenic
condensations and their differentiation into cartilaginous skeletal anlagen. The
second phase includes the formation of joint structures including synovium,
ligaments and capsule, and space (cavitation) (Las Heras, et al., 2012). In
vertebrates, the axial and appendicular skeleton development begins with
endochondral bone formation (Karsenty et al., 2009). At first, mesenchymal
progenitors condense and differentiate into chondrocytes in the shape of the future
long bone. Then an avascular cartilaginous template forms, which is surrounded by a
perichondrium (Goldring, 2012; Karsenty, et al., 2009). Osteoblasts, also derived
from mesenchymal precursors in the perichondrium, develop a bone collar, which
will be the future cortical bone (Karsenty, et al., 2009; Maes et al., 2010). As skeletal
development proceeds, the majority of chondrocytes will eventually undergo
secondary ossification, a process known as endochondral ossification (Goldring,
2012; Goldring, et al., 2006; Las Heras, et al., 2012).
Endochondral ossification is the normal mechanism of long bone formation and
growth, referring to the formation of calcified bone within a cartilaginous scaffold
(Figure 2-1) (DeLise et al., 2000; Las Heras, et al., 2012; Maes, et al., 2010;

6 Chapter 2: Literature Review
Solomon et al., 2008). Differentiated chondrocytes undergo a series of late
differentiation steps, resulting in mature hypertrophic chondrocytes that express
osteogenic markers (such as alkaline phosphatase (ALP)), angiogenic factor (such as
VEGF) and secrete matrix proteins (such as COL10A1). Angiogenesis is required for
endochondral ossification in this process (Goldring, 2012; Karsenty, et al., 2009).
Blood vessels invade into the hypertrophic cartilage from the bone collar, and bring
in osteoblast progenitors from the perichondrium (Karsenty, et al., 2009; Maes, et
al., 2010). The cartilage matrix is gradually degraded and the bone matrix secreted
and deposited by osteoblasts to form the ossification centre. At this stage, the growth
plate consists of hypertrophic chondrocytes and layers of spongy/trabecular bone
(Karsenty, et al., 2009; Maes, et al., 2010; Solomon, et al., 2008). Afterwards, linear
bone growth continues via the endochondral ossification process in growth plate,
while osteoblasts in the perichondrium generate cortical bone on the outside
circumference (Karsenty, et al., 2009; Maes, et al., 2010). Eventually, the majority of
cartilaginous tissue is replaced by bone; however, chondrocytes at the end of the long
bone persist and form the permanent mature articular cartilage of the joints
(Goldring, 2012; Karsenty, et al., 2009).
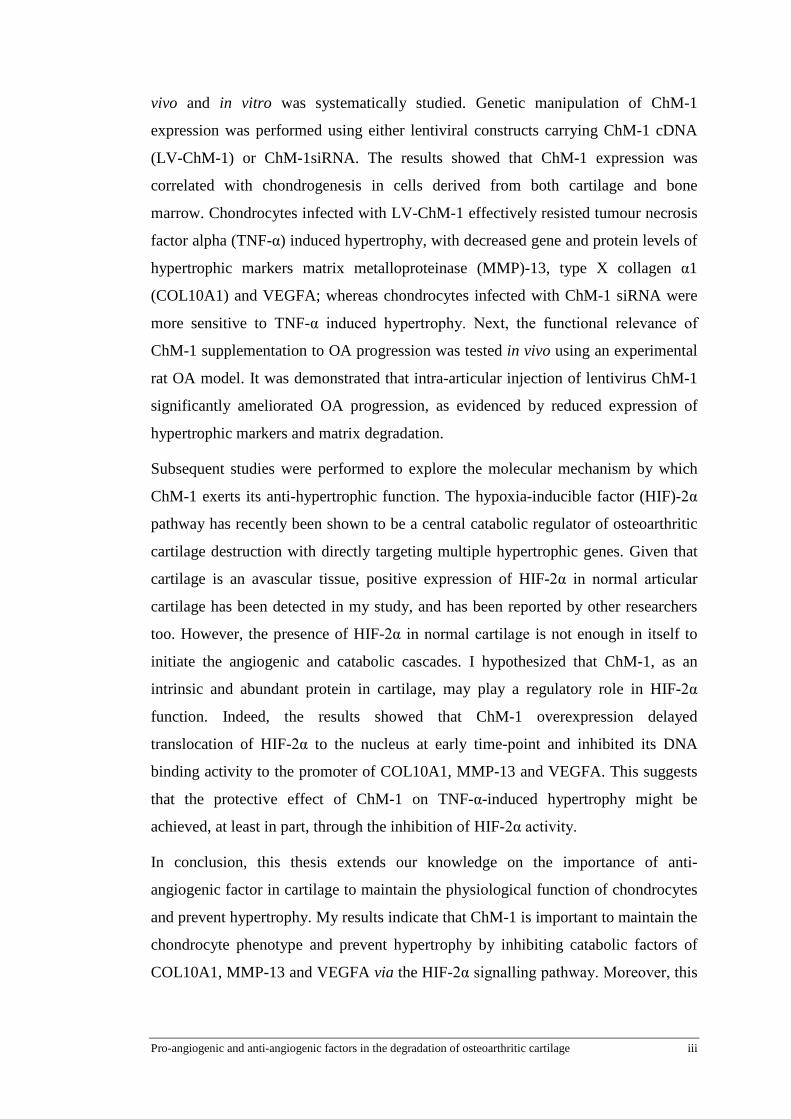
Figure 2-1. Procession of endochondral ossification. Enchondral ossification takes place in the
growth plates at the distal ends of the long bones between the later epiphysis and diaphysis. Resting
chondrocytes start to proliferate, differentiate into hypertrophic chondrocytes, and finally undergo
apoptosis. Blood vessel invasion then takes place. The cartilage matrix is degraded and replaced with
the typical trabecular bone matrix produced by osteoblasts. (Adapted from Pearson Education, Inc.
Publishing as Benjamin Cummings).

Chapter 2: Literature Review 7
Fate of hypertrophic chondrocytes in endochondral ossification
According to traditional view, it is thought that after endochondral bone formation
terminally differentiated hypertrophic chondrocytes undergo apoptosis, leaving a
cartilaginous matrix that is mineralized prior to the formation of new bone (Goldring,
2012; Las Heras, et al., 2012; Yang et al., 2014). However, a recent study conducted
by Yang et al. showed that hypertrophic chondrocytes can survive during the
cartilage-to-bone transition and finally become osteogenic cells (osteoblasts and
osteocytes) in fetal and postnatal endochondral bones and persist into adulthood.
This view completely changes the accepted wisdom regarding the process of
endochondral bone formation (Yang, et al., 2014).
2.1.2 Structure of mature articular cartilage
Articular cartilage consists of cartilage cells (chondrocytes) and large amounts of
extracellular matrix (ECM). Cell density in cartilage is relatively low compared to
other tissues, at approximately 1% to 10% of the cartilage tissue volume (Archer &
Francis-West, 2003; Buckwalter & Mankin, 1998). The ECM is composed of
complex organized macromolecules, including collagen fibres (predominantly
COL2A1), soluble negatively charged proteoglycans (such as aggrecan, small
leucine-rich proteoglycans and perlecan) and noncollagenous proteins, as well as
ions (mainly Na+ and Cl- ions). The tissue fluid accounts for 65% to 80% of the wet
weight of articular cartilage. The fluid is what enables nutrients and oxygen to
diffuse through the cartilage matrix to chondrocytes in the absence of a vasculature
(Kuettner et al., 1991).
Adult articular cartilage is divided into four distinct zones (Figure 2-2): (a) the
superficial zone, composed of thin collagen fibrils arranged parallel to the surface,
high concentration of decorin and low concentration of aggrecan; (b) the middle
(transitional) zone, composed of thick collagen fibrils arranged as gothic arches; (c)
the deep (radial) zone, consist of thick collagen bundles arranged in a radial fashion;
and (d) the calcified cartilage zone, located between the tidemark and the
subchondral bone. Tidemark is referred to the interface between the noncalcified
cartilage and the calcified cartilage. The calcified cartilage is composed of unique
matrix composition, such as COL10A1, and hypertrophic chondrocytes.

8 Chapter 2: Literature Review
Vascularization and innervation originating from the subchondral bone could
probably invade into calcified cartilage in association with advancing age (Goldring,
2012).
Figure 2-2. Structure of mature articular cartilage. Four distinct zones are observed: the superficial
zone (tangential layer); the middle (transitional) zone; the deep (radial) zone; and the calcified
cartilage zone, which located between the tidemark (the interface between the noncalcified cartilage
and the calcified cartilage) and the subchondral bone (Hill, 2014).
2.1.3 Chondrocyte phenotype in cartilage
Chondrocyte phenotype is dependent upon the developmental and maturational stage
of the tissue (Pacifici, et al., 2000). Chondrogenesis occurs as a result of
condensation of mesenchymal cells, which express type I, III and V collagens.
Chondroprogenitor cell differentiation is characterized by expression of cartilage-
specific type II, IX, and XI collagens. In terms of transcription factors, SOX9 (sex
determining region Y (SRY)-box 9) determines chondrogenic lineage differentiation
from mesenchymal cells by directly activating cartilage matrix gene of COL2A1
(Akiyama et al., 2002; Akiyama et al., 2005; de Crombrugghe et al., 2000; Lefebvre
et al., 1997). The proliferating chondrocytes express type VI collagen. In the process
of endochondral ossification, the hypertrophic zone is characterized by expression of

Chapter 2: Literature Review 9
COL10A1 and matrix calcification. In addition, MMP-9, -13, and -14, and
vascularization marker VEGFA are also highly expressed by hypertrophic
chondrocytes during endochondral ossification (Kuettner, et al., 1991; Las Heras, et
al., 2012).
Mature chondrocytes exhibit a stable phenotype characterized by a round shape and
low proliferation rate. However, chondrocytes are metabolically active cells,
responsible for synthesis and turnover collagens (mainly COL2A1), proteoglycans
(mainly aggrecan), glycoproteins and hyaluronan (Goldring & Marcu, 2009; Jackson
& Gu, 2009; Las Heras, et al., 2012). Expression of MMPs is very low in articular
chondrocytes under normal condition. COL2A1, aggrecan and transcriptional factor
SOX9 have frequently been used as marker for chondrogenic lineage differentiation
and cartilage regeneration, as they are the most prominent feature of chondrogenesis
and mature cartilage.
Sex determining region Y (SRY)-box 9 (SOX9)
Transcriptional factor SOX9 is regarded as the master regulator for cartilage
development (de Crombrugghe, et al., 2000). As early as the condensation process of
mesenchymal cells, SOX9 expression becomes evident, which precedes production
of COL2A1 (Lefebvre, et al., 1997). Lefebvre et al. demonstrated that COL2A1
expression is closely correlated with high levels of SOX9 RNA and protein in
chondrocytes, furthermore, SOX9 binds to a consensus sequence in the COL2A1
enhancer region and activates gene transcription (Lefebvre, et al., 1997). It has been
shown that lineage determination towards chondrocytes is controlled by the
expression of SOX9 (Akiyama, et al., 2002; Akiyama, et al., 2005; de Crombrugghe,
et al., 2000). In mouse embryonic development, SOX9 inactivation in limb buds
before mesenchymal condensations leads to absence of both cartilage and bone,
while SOX9 deletion after mesenchymal condensations shows a severe generalized
chondrodysplasia and inhibition of chondrocyte proliferation (Akiyama, et al., 2002).
In vitro studies have shown that chondrogenic differentiation of embryonic stem cells
in SOX9-/- mouse is completely absent (Hargus et al., 2008). In addition, in humans
haploinsufficiency of SOX9 exhibits the campomelic dysplasia syndrome, featured
by bowing of the long bones and other skeletal disorders (Archer & Francis-West,
2003; de Crombrugghe, et al., 2000). Therefore, SOX9 is a major transcriptional
factor in the lineage commitment and development of chondrogenic cells.

10 Chapter 2: Literature Review
Type II collagen α1 (COL2A1)
Cartilage matrix contains multiple different collagen molecules, specifically types II,
III, VI, IX, X, XI, XII and XIV, and COL2A1 is the principal ECM component and
accounts for 90 to 95% of the collagens in articular cartilage (Buckwalter & Mankin,
1998; Eyre, 1995). COL2A1 is the primary component for the cross-banded fibrils,
and electron microscopy has revealed the COL2A1 cross-bands with type IX and XI
collagens to form a tight meshwork, providing the tensile stiffness and strength of
cartilage tissue, as well as the cohesiveness of ECM (Buckwalter & Mankin, 1998;
Eyre, 1995). The functions of type IX and type XI collagens have not been well
understood. Type IX collagen molecules may bind together the collagen-fibril
meshwork and connect with proteoglycans. In contrast, COL10A1 is only expressed
near the cells of the calcified cartilage zone of the articular cartilage and the
hypertrophic zone of the growth plate (Buckwalter & Mankin, 1998; Roughley &
Lee, 1994).
Aggrecan
Articular cartilage contains two major categories of proteoglycans: large aggregating
proteoglycan monomers (mainly aggrecan, gene names ACAN), and small
proteoglycans such as decorin, biglycan, and fibromodulin (Buckwalter & Mankin,
1998; Roughley & Lee, 1994). Aggrecans occupy the interfibrillar space of the
cartilage matrix, contributing to approximately 90% of the total proteoglycan mass
(Buckwalter & Mankin, 1998). In general, proteoglycans consist of a protein core
with linked glycosaminoglycan chains, which are long unbranched polysaccharide
chains consisting of disaccharides repeat that contain an amino sugar. Aggrecans
have a protein core filament linked with large numbers of chondroitin-sulfate and
keratan-sulfate chains (Buckwalter & Mankin, 1998; Knudson & Knudson, 2001).
Large quantities of aggrecans are the most prominent feature of articular (hyaline)
cartilage, providing the osmotic environment to withstand compressive loads
(Knudson & Knudson, 2001; Roughley & Lee, 1994).

Chapter 2: Literature Review 11
2.2 OSTEOARTHRITIS (OA)
OA is the most common form of musculoskeletal disorder and a leading cause of
disability in the elderly. It has been estimated that worldwide 9.6% of men and 18%
of women > 60 years have symptomatic OA (Woolf & Pfleger, 2003). In Australia,
OA affects more than 1.3 million people and more than 41,000 total hip and knee
replacements were performed for OA each year (Department of Health and Ageing,
Australia (http://www.aihw.gov.au/)). Clinically, OA is degenerative joint disease
characterized by pain, tenderness, limitation of movement and reduction of life
quality. According to World Health Organization Guidelines, OA is defined as a
result of both mechanical and biological events that uncouple the normal balance
between degradation and synthesis by articular cartilage chondrocytes and ECM, and
subchondral bone (Mollenhauer & Erdmann, 2002). Ultimately, OA is manifested by
morphologic, biochemical and biomechanical changes (Mollenhauer & Erdmann,
2002).
2.2.1 Aetiology
The aetiology of OA is multifactorial and is as yet not fully understood (Felson et al.,
2000; Loeser, 2009). Age is the most prominent factor for OA, since the incidence of
OA increases dramatically over the age of 50 (Felson, et al., 2000; Sowers, 2001).
Gender distribution indicates females have a greater risk to suffer from OA than
male. Family inheritance (genetic component) also appears to be a risk factor as
shown by twin studies and family clustering (Felson, et al., 2000; Sowers, 2001).
Other potentially modifiable factors for OA include joint overload (occupational
repetitive heavy load), obesity, mechanical injury from trauma, and joint instability
or malalignment (Coggon et al., 2000; Felson, et al., 2000). These risk factors may
stimulate biomechanical and/or biochemical molecular signalling pathways, which
result in cartilage degradation and joint destruction (Kapoor et al., 2011).
2.2.2 Clinical significance of OA
OA occurs mainly in weight bearing joints such as knees, hip and spine; it can also
affect the joints of hands and feet, although the incidence are rare (Cushnaghan &
Dieppe, 1991). The main symptoms of OA include pain, stiffness, limited function
12 Chapter 2: Literature Review
and joint movement, instability of joint, crepitus, deformity due to bony enlargement
and joint effusion/swelling (Hunter et al., 2008).
There is currently no cure for OA. Joint (knee/hip) replacement surgery is the most
common option for the late stage of OA patients, since there is no clinical
presentation in the early stage with joint destruction being irreversible once OA is
diagnosed (Michael et al., 2010). Generally, the treatment of OA is divided into non-
pharmacological, pharmacological, and surgical treatments (Altman, 2010; Michael,
et al., 2010; Woolf & Pfleger, 2003). Non-pharmacological treatment includes
physiotherapy, acupuncture, exercise, and weight loss. Pharmacological management
of OA, focusing on the control of pain and inflammation, improvement joint function
and quality of life, includes analgesics (paracetamol/acetaminophen), non-selective
non-steroidal anti-inflammatory drugs (NSAIDs), cyclooxygenase (COX)-2
inhibitors, topical NSAIDs, intra-articular corticosteroids and hyaluronic acid
(Altman, 2010; Michael, et al., 2010). Symptomatic slow acting drugs for OA
include glucosamine, chondroitin sulfate and collagen hydrolysate. Current research
of pharmaceutical interventions for OA includes tumor necrosis factor alpha (TNF-α)
antibodies, anti-inflammatory cytokines such as interleukin (IL)-10, and inhibitors
for MMPs (Michael, et al., 2010).
2.2.3 Pathophysiology of OA
The key pathophysiological features of OA joints include articular cartilage
dagradation and abnormal subchondral bone metabolism. In osteoarthritic joints,
cartilage damage is manifested by loss of smooth appearance, softening, fissuring
and reduced thickness. Cartilage pathology in OA is associated with changes of
cellular phenotype of articular chondrocytes to a state of terminal differentiation
(Pfander et al., 2001; Pullig et al., 2000). In mature adult articular cartilage,
chondrocytes have a stable phenotype with an anabolic metabolic activity;
osteoarthritic chondrocytes, on the other hand, manifest catabolic metabolic
phenotypes, in which matrix breakdown outweighs new matrix synthesis (Rousseau
& Delmas, 2007).
Inflammation has now been implicated as an important mediator in OA progression,
although OA has been seen as a non-inflammatory arthropathy for a long time
(Bonnet & Walsh, 2005). Pro-inflammatory factors, such as IL-1, IL-6 and TNF-α,

Chapter 2: Literature Review 13
are mediators that initiate and enhance the catabolism in OA cartilage (Kapoor, et al.,
2011). These cytokines, which are produced by chondrocytes, mononuclear cells,
osteoblasts and synovial tissues, stimulate chondrocytes to release proteolytic
enzymes and suppress the synthesis of proteoglycan and collagen, thereby
accelerating cartilage degradation (Kapoor, et al., 2011).
2.2.4 Chondrocyte hypertrophy in OA cartilage
Expression of the matrix proteins COL2A1 and aggrecan are significantly reduced in
OA chondrocytes (Knudson & Knudson, 2001). OA chondrocytes secrete
osteogenic-related proteins such as type I collagen (COL1), ALP, bone sialoprotein
(BSP) and COL10A1 that are normally absent in healthy cartilage (Kapoor, et al.,
2011). Extracellular MMPs, such as collagenase (MMP-1, 8 and 13), stromelysin
(MMP-3) and gelatinase (MMP-2 and 9), are responsible for degradation of collagen
and proteoglycans (Cawston & Wilson, 2006; Murphy & Lee, 2005). A-disintegrin
and metalloproteinase with thrombospondin-like repeats (ADAMTS)-4 and
ADAMTS-5 are the dominant aggrecanase enzymes (Murphy & Lee, 2005). The
abundance and activity of MMPs and ADAMTS are markedly enhanced by OA
chondrocytes and play a crucial role in degrading the normal cartilage ECM
components in OA (Cawston & Wilson, 2006; Kapoor, et al., 2011; Murphy & Lee,
2005; Tetlow et al., 2001). Activity of MMPs and ADAMTS are inhibited by
specific endogenous tissue inhibitors of metalloproteinases (TIMPs) (Murphy et al.,
2003). For instance, TIMP-1, the most abundant protease inhibitor in healthy
cartilage, inhibits activity of MMP-1 (Davidson et al., 2006); TIMP-3 effectively
inhibits ADAMTS-4 and -5 (Kashiwagi et al., 2001; Murphy, et al., 2003). However,
in OA cartilage the expressions of TIMPs are decreased and lead to an imbalance in
the regulation of MMPs which contributes to cartilage degradation (Davidson, et al.,
2006; Franses et al., 2010).
In the current view of osteoarthritis, expression of COL10A1, MMP-13 and ALP has
been regarded as hypertrophic markers of cartilage. Gene expression of these
hypertrophic markers are controlled by transcriptional factor RUNX2, transducing
the extracellular signals into regulated gene expression (Hirata et al., 2012;
Kamekura et al., 2006; Li et al., 2011). Several signalling pathways have been
demonstrated to be involved in this process, such as mitogen-activated protein kinase

14 Chapter 2: Literature Review
(MAPK), TGF-β and wingless-type MMTV integration site family member (Wnt),
which all target the transcriptional factor RUNX2 with the result of up-regulation of
hypertrophic markers (Zheng et al., 2003).
Runt-related transcription factor 2 (RUNX2)
RUNX2 is essential for specifying the osteoblast lineage differentiation, as well as
guiding chondrocyte hypertrophy by directly targeting the osteogenic marker osterix
in osteoblasts and the hypertrophic genes of COL10A1 and MMP-13 in chondrocytes
(Hirata, et al., 2012; Li, et al., 2011). RUNX2 is induced in the articular cartilage of
wild-type mice at the early stage of OA, almost simultaneously with COL10A1 but
earlier than MMP-13 (Kamekura, et al., 2006). RUNX2+/- mice show resistance to
osteoarthritis development following induced knee joint instability, and cartilage
exhibits decreased cartilage destruction and osteophyte formation accompanied by
reduced abundance of COL10A1 and MMP-13 (Kamekura, et al., 2006).
Type X collagen α1 (COL10A1)
COL10A1 is the most specific marker of hypertrophic chondrocytes (Girkontaite et
al., 1996; Schmid et al., 1994; von der Mark et al., 1992). COL10A1 is a non-
fibrillar, network-forming short collagen with a triple helical core with half the
length of the fibril-forming collagen types I, II and III (Schmid, et al., 1994). The
globular domain at the carboxyl end helps assemble the molecules into a hexagonal
meshwork (Schmid, et al., 1994). COL10A1 is expressed in pre-hypertrophic and
hypertrophic chondrocytes in the growth plate and involved in matrix mineralization
and endochondral ossification, since a transgenic mouse with Col10α1 gene mutation
showed severe reduction in the hypertrophic zone (Jacenko et al., 1993). In human
adult articular cartilage, COL10A1 is restricted to the calcified cartilage zone below
the tide mark, whereas the osteoarthritic chondrocytes synthesize large amounts of
COL10A1; In OA cartilage, COL10A1 is found predominantly in chondrocyte
clusters in the deep zones, as well as in middle and upper zones in severe OA
cartilage, as shown by biochemical, immunohistological and in situ hybridization
methods (Girkontaite, et al., 1996; Schmid, et al., 1994; von der Mark, et al., 1992).
Matrix metalloproteinases (MMP)-13
MMPs are a family of zinc-dependent endopeptidases that degrade extracellular
matrix components (Murphy & Lee, 2005; Neuhold et al., 2001; Wang et al., 2013).

Chapter 2: Literature Review 15
In cartilage, MMPs could be synthesized by synovial cells and chondrocytes.
Compared to other MMPs, MMP-13 expression tends to be restricted to connective
tissues (Vincenti & Brinckerhoff, 2002). MMP-13, also known as collagenase-3, is
the major enzyme that targets cartilage for degradation (Wang, et al., 2013). In OA,
MMP-13 play an important role in degrading COL2A1, as well as proteoglycan,
types IV and type IX collagen, osteonectin and perlecan (Shiomi et al., 2010). It has
been shown that transgenic mice overexpressing MMP-13 develop a spontaneous
OA-like cartilage phenotype (Neuhold, et al., 2001). Clinical evidence has also
revealed that patients with articular cartilage destruction have increased expression
of MMP-13, suggesting that its increases closely associated with cartilage
degradation (Roach et al., 2005).
2.3 HYPOXIA
Articular cartilage is a typically avascular tissue by nature. Synoviocytes, which lies
in the outer layer in the synovium, secrete synovial fluid into the joint space. This
fluid plays an important role in lubricating the joint surface and provides nutrient and
gas exchange to cartilage chondrocytes and buffers the force between the two joints
(Lafont, 2010; Lorenz & Richter, 2006). It has been reported that oxygen supply to
articular chondrocytes depends on the oxygen capacity in synovial fluids and its flow
during the movement of the respective joint. Therefore, oxygen supply in cartilage is
very limited (Lee et al., 2007; Lund-Olesen, 1970; Pfander & Gelse, 2007).
2.3.1 Oxygen tension in cartilage
It was known for a long time that oxygen partial pressure (pO2) of mature cartilage is
particularly low compared to other tissues. In human synovial fluid, the oxygen
tension is around 1-9% (Falchuk et al., 1969; Lund-Olesen, 1970; Treuhaft &
MCCarty, 1971). Falchuk et al. reported that pO2 values ranged from 53 to 9 mmHg
in synovial fluids (Falchuk, et al., 1969). Lund-Olesen et al. reported that mean pO2
values is 63 mmHg in traumatic exudates and 43 mmHg in osteoarthritic synovial
fluids, while the lowest value occurs in rheumatoid arthritis patients, which is around
27 mmHg (Lund-Olesen, 1970). Paradoxically, in spite of increased blood vessel

16 Chapter 2: Literature Review
penetration into the calcified cartilage layer in rheumatoid arthritis and osteoarthritis,
oxygen tension seems to decrease even further in these pathological conditions.
In articular cartilage tissue, it has been shown that oxygen gradients are steep
compared with fibrous connective tissues, and the absolute value at the centre of
0.5mm cartilage blocks is 5–8 mmHg, as compared to 15–20 mmHg in the inter-
capillary soft tissues (Silver, 1975). Based on this particular study, it has been
estimated that oxygen tension in the upper zones of mature normal cartilage is
around 6–10%, while oxygen content drops to 1% in the deep layers next to the
calcified cartilage (Pfander & Gelse, 2007; Silver, 1975). In compressed cartilage, it
has been calculated that oxygen tension is close to zero at a depth of 0.096 cm from
the cartilage surface (Pfander & Gelse, 2007).
Chondrocytes appear to be the only cell type that can adapt to the hypoxic
environment of cartilage, It has been shown that oxygen consumption by cartilage is
only 2–5% of that of liver or kidney, even when cultured in air-saturated medium
instead of synovial fluid, which typically has 6 ± 10% O2 concentration (Lee &
Urban, 1997; Silver, 1975). Furthermore, it has been demonstrated that oxygen
consumption by chondrocytes is independent on the ambient oxygen pressure, and
that chondrocytes will always have a minimal oxygen consumption whether oxygen
level is less than 1% (anoxia) or as high as 21% (Schneider et al., 2007).
2.3.2 Overview of hypoxia inducible factor (HIF) signalling pathway
The cellular response to hypoxia is mediated by HIF family members (mainly HIF-
1α, -2α, -3α). Among these family members, the functions of HIF-1α and HIF-2α
have been widely studied. It is well documented that hypoxia initiates an angiogenic
signals via stabilizing HIF-1α and/or HIF-2α. The functional unit of HIF signalling is
composed of two subunits: the α-subunit confers oxygen responsiveness of HIF;
while the β-subunit is constitutively expressed, which is also named aryl
hydrocarbon receptor nuclear translocator (ARNT) (Huang et al., 1996; Jiang et al.,
1997). The abundance and stability of the HIF-α subunit determines the function of
HIFs signalling pathway (Huang, et al., 1996; Jiang, et al., 1997; Salceda & Caro,
1997).
Both of HIF-1α and HIF-2α belong to the PER-ARNT-SIM (PAS) subfamily of the
basic helix-loop-helix (bHLH) family of transcription factors (Wang et al., 1995).

Chapter 2: Literature Review 17
The protein structure of HIF-1α and HIF-2α are closely related, including a bHLH
domain on N-terminal for DNA binding; an intermediate PAS domain for the
specificity and dimerization of target gene; and a transactivation domain (TAD),
including N-terminal TAD (NTAD) and one C-terminal TAD (CTAD) (Sowter et al.,
2003; Wang, et al., 1995; Yan et al., 2007). Overall, HIF-2α and HIF-1α share 48%
amino acid identity and, more specifically, an 83% sequence identify in the bHLH
region and approximately 70% sequence homology across the PAS domain (Ema et
al., 1997; Flamme et al., 1997; Hogenesch et al., 1997). HIF-3α has no TAD
domain; it is, therefore, thought to be a dominant negative of HIF-1α and HIF-2α
(Maynard et al., 2005).
The HIF transcription factors were originally identified by the fact that their
expression and function mainly depend on oxygen level surrounding the cells
(Bruick & McKnight, 2001; Epstein et al., 2001). Under normal oxygen condition,
HIF-α have a very short half-life (about 5 min), degrading rapidly (Salceda & Caro,
1997). In brief, prolyl residues of HIF-α in C-terminal (Pro402 and Pro564 in TAD
region) are hydroxylated by prolyl hydroxylase (PHD-1 to -3) (Ivan et al., 2001;
Jaakkola et al., 2001; Yu et al., 2001). PHDs serve as oxygen sensors, since their
activity requires oxygen as co-factor and directly sense O2 level within the cell
(Bruick & McKnight, 2001; Epstein, et al., 2001). Hydroxylated HIF-α is
ubiquitinated through binding to von Hippel-Lindau protein (VHL), a target of E3
ubiquition-ligase complex, and finally rapidly degraded by 26S proteasome (Ohh et
al., 2000; Salceda & Caro, 1997; Tanimoto et al., 2000). On the other hand, under
hypoxic condition (1-5% oxygen), PHDs activity is inhibited and prolyl
hydroxylation of HIF-α is, therefore, hampered (Huang et al., 1998; Salceda & Caro,
1997). The HIF-α is stabilized and accumulates in the cytoplasm after which it
translocates into the nucleus and heterodimerizes with the constitutively expressed
HIF-β (ARNT) (Jiang et al., 1996; Semenza et al., 1994; Wang & Semenza, 1993).
Then the HIF-α/β heterodimer trans-activates hypoxia-responsive genes via binding
to hypoxia-response elements (HRE, 5’-RCGTG-3’; R is A or G) (Semenza et al.,
1996; Semenza, et al., 1994; Wang & Semenza, 1993). In addition, the recruitment
of co-activator p300/CBP is also an essential component for transcriptional activity
of HIFs (Lando et al., 2002). One of the well-known gene targets of HIFs is
18 Chapter 2: Literature Review
angiogenic genes, such as VEGF and erythropoietin (EPO) (Firth et al., 1994;
Forsythe et al., 1996).
2.3.3 Role of HIFs pathway in cartilage development and homeostasis
The importance of HIF-1α and HIF-2α during cartilage development, mainly in
endochondral ossification and growth plate development, has been demonstrated in
several studies. Schipani et al. established the mouse model of tissue-specific
deletion of HIF-1α in cartilaginous growth plate of developing bone, and found that
the interior developmental growth plate in mammals was hypoxic; cell death
increased in the interior of the growth plate that lacked HIF-1α, indicating HIF-1α is
essential for chondrocytes growth arrest and survival (Schipani, et al., 2001). Provot
et al., using conditional knockout of HIF-1α in limb bud mesenchyme, showed
alterations to the formation of the cartilaginous primordia, and late hypertrophic
differentiation was also affected due to the delay in early chondrogenesis (Provot et
al., 2007). Stewart et al. showed that HIF-2α expression was elevated during
terminally differentiating growth plate chondrocyte accompanied by an increase in
VEGF expression, suggesting that HIF-2α is involved in the initiation of blood vessel
formation and a metabolic shift in the growth plate and crucial for endochondral
ossification (Stewart et al., 2006). Moreover, deletion of pVHL in chondrocytes,
which leads to HIF-1α and -2α overexpression, increases matrix deposition during
growth plate development (Pfander et al., 2004).
Being avascular, hypoxia is the physiological environment for adult cartilage, and
was, therefore, long considered the most favourable condition for chondrocyte
survival, differentiation and cartilage regeneration; it is, nevertheless, a stress
condition in vascular tissues. In cartilage, as in other tissues, hypoxia enhances the
expression of HIFs. Both of HIF-1α and HIF-2α are detectable in normal articular
cartilage (Bohensky, et al., 2009; Coimbra, et al., 2004). HIF-1α has been reported to
be essential for chondrocyte survival, energy generation and matrix synthesis
(Pfander, et al., 2003; Yudoh et al., 2005). Pfander et al. showed that HIF-1α is
necessary for anaerobic energy generation and proteoglycan synthesis in articular
chondrocytes (Pfander, et al., 2003). In vitro studies showed that hypoxia increases
the accumulation of COL2A1 and enhances the transcriptional factor SOX9, a master

Chapter 2: Literature Review 19
regulator of cartilage-specific matrix proteins (Duval et al., 2009; Robins et al.,
2005).
2.3.4 Role of HIFs pathway in osteoarthritis
Recent studies have demonstrated the catabolic effect of HIF signalling in
osteoarthritic cartilage, in particularly HIF-2α. It has been proposed that the shift
from HIF-1α to HIF-2α initiates and promotes chondrocyte hypertrophy and cartilage
degradation in OA (Husa et al., 2010). In spite of having approximately 50%
sequence homology, HIF-1α and HIF-2α have remarkably different expression
patterns and functions in cartilage metabolism (Husa, et al., 2010). HIF-1α, which
has been extensively studied as a beneficial factor for matrix production and cartilage
metabolism, seems to play an important role in cartilage developmental stages
including endochondral ossification and growth plate development, as well as in
maintaining mature cartilage homeostasis; whereas, until recently, HIF-2α has been
shown to be a catabolic regulator in cartilage metabolism during pathological
process, such as chondrocyte hypertrophy in osteoarthritis (Husa, et al., 2010; Saito,
et al., 2010; Yang, et al., 2010).
Expression of HIF-2α in OA cartilage
The scientific literature concerning the expression of HIF-2α in OA cartilage is
contradictory – both increased and decreased levels have been reported (Bohensky,
et al., 2009; Coimbra, et al., 2004). For example, studies conducted by Yang et al.
and Saito et al. showed an increase in HIF-2α levels in human OA cartilage as well
as in experimentally-induced mouse OA cartilage (Saito, et al., 2010; Yang, et al.,
2010). Bohensky, however, reported that HIF-2α is reduced in human OA cartilage
(Bohensky, et al., 2009). In vitro studies showed that HIF-2α is not solely dependent
on oxygen level, but also quite sensitive to non-hypoxic stimulus including
inflammatory cytokines, growth factors and catabolic stress. Both of Yang’s and
Saito’s studies showed that IL-1β and TNF-α stimulation resulted in an upregulation
of HIF-2α in chondrocytes and, furthermore, suggested that NF-κB and p38 may be
the upstream mechanism that regulates HIF-2α (Saito, et al., 2010; Yang, et al.,
2010). TGF-β1 can also induce HIF-2α gene and protein expression under non-
hypoxic condition, and further activates VEGF transcription in a Smad3-dependent

20 Chapter 2: Literature Review
manner (Chae et al., 2011). However, there is as yet only one study that shows that
IL-1α decreases HIF-2α level in human chondrocytes (Thoms, et al., 2013).
Catabolic effect of HIF-2α in OA cartilage
HIF-2α has recently been demonstrated as a central catabolic regulator of cartilage
destruction in osteoarthritis by directly targeting key hypertrophic genes involved in
the pathogenic transition of an osteoarthritic chondrocyte (such as COL10A1, MMP-
13 and VEGFA), and also regulating chondrocyte apoptosis and autophagy
(Bohensky, et al., 2009; Ryu et al., 2012; Saito, et al., 2010; Yang, et al., 2010).
Coincidently, two independent studies have recently reported that HIF-2α directly
targets the promoters of hypertrophic genes in OA cartilage (Saito, et al., 2010;
Yang, et al., 2010). Endochondral bone formation is seen as an outcome typical of
OA cartilage, which results in osteophyte formation (Kawaguchi, 2008; Kronenberg,
2003; Saito, et al., 2010). The process of endochondral bone formation is
characterized by sequential steps, including chondrocyte hypertrophic differentiation
(represented by COL10A1 secretion), cartilage degradation (represented by
expression of proteinases MMP-13) and vascular invasion (angiogenic stimuli, such
as VEGF) (Kawaguchi, 2008; Kronenberg, 2003; Saito, et al., 2010). Saito et al.
demonstrated that HIF-2α is strongly implicated in catabolic mechanisms leading to
cartilage breakdown and endochondral bone formation (Saito, et al., 2010). HIF-2α
enhances the transcriptional activities of COL10A1, MMP-13 and VEGFA by
binding to the respective hypoxia-responsive elements on their promoters (Saito, et
al., 2010). Epas1-heterozygous (gene name of HIF-2α) deficient mice showed
resistance to osteoarthritis development (Saito, et al., 2010; Yang, et al., 2010).
Yang’s study further confirmed the catabolic role of HIF-2α in osteoarthritis (Yang,
et al., 2010). Consistent with Saito’s result, they showed that Epas1 transgenic mice
induced spontaneous cartilage destruction, while heterozygous deletion of Epas1
gene suppressed cartilage destruction in mice OA model (Yang, et al., 2010). It has,
furthermore, been shown that catabolic factors including MMP-1, MMP-3, MMP-9,
MMP-12, MMP-13, ADAMTS4, nitric oxide synthase-2 (NOS2) and prostaglandin
endoperoxide synthase-2 (PTGS2), are direct targets of HIF-2α (Yang, et al., 2010).
Besides catabolic factors, HIF-2α could also induce osteogenic factors, such as
RUNX2 and Indian hedgehog (IHH) (Saito, et al., 2010; Tamiya et al., 2008). IHH
signal promotes chondrocyte hypertrophy during endochondral ossification and

Chapter 2: Literature Review 21
osteoarthritis progression through the Patched-1 (PTCH1) receptors and
transcriptional factors of glioma-associated oncogene homolog (GLI) family member
(Lin et al., 2009). RUNX2 is another key transcriptional factor of chondrocyte
hypertrophy, which directly targets COL10A1 and MMP-13 (Kamekura, et al., 2006;
Sato et al., 2008; Zheng, et al., 2003). HIF-2α enhances RUNX2 promoter activity;
however, RUNX2 does not seem essential for HIF-2α to initiate chondrocyte
hypertrophy (Husa, et al., 2010; Saito, et al., 2010).
Another study showed that HIF-2α regulates Fas-mediated chondrocyte apoptosis in
osteoarthritis destruction, which also indicates the catabolic role of HIF-2α in OA
(Ryu, et al., 2012). Overexpression of HIF-2α in mouse cartilage tissues by
adenovirus injection or chondrocyte-specific Epas1 transgenic mice increased
chondrocyte apoptosis and cartilage destruction, while chondrocyte-specific
knockout of Epas1 in mice suppressed these catabolic processes in OA mice model
(Ryu, et al., 2012).
Autophagy is a normal physiological process that degrades and recycles damaged
and dysfunctional intracellular organelles and molecules in order to maintain
homeostasis or normal function (Bohensky, et al., 2009). Bohensky et al. showed
that HIF-1α promotes the onset of autophagy in chondrocytes and that HIF-2α acts as
a brake on the autophagy accelerator ability of HIF-1α (Bohensky, et al., 2009).
Catabolic effects of HIF-1α in OA cartilage
HIF-1α has been considered a key factor for chondrocyte survival and cartilage
homeostasis; however, there are now a number of studies that demonstrate that HIF-
1α is a catabolic effector in cartilage pathogenesis. Rather than a strictly hypoxia-
inducible factor, HIF-1α has been seen as a stress-inducible factor, since evidence
shows that pro-inflammatory cytokines of IL-1β and TNF-α, insulin-like growth
factor 1 (IGF-1) oxidative stress elevates HIF-1α stability in chondrocytes in vitro
through p38 kinase and phosphoinositide (PI)-3 kinase pathways (Thoms, et al.,
2013; Yudoh, et al., 2005). HIF-1α could indeed induce VEGFA expression in
chondrocytes. Lin et al. found that hypoxia-induced VEGF expression is HIF-1α-
dependent in chondrocyte, indicating that the hypoxic-angiogenesis (HIF-1α-VEGF)
response pathway remains intact in cartilage (Lin, et al., 2004). Prostaglandin (PG),
especially PGE2, is involved in IL-1β induced pathophysiology of OA cartilage by
inducing expression of matrix-degrading enzymes. Grimmer et al. showed that HIF-
22 Chapter 2: Literature Review
1α up-regulates PG metabolism in OA cartilage through enhancing microsomal PGE
synthase 1 (mPGES-1), which opens the possibility that HIF-1α participates in
catabolic metabolism of OA cartilage (Grimmer et al., 2007).
2.4 CHONDROMODULIN-1 (CHM-1) IN CARTILAGE DEVELOPMENT,
HOMEOSTASIS AND DISEASES
The balance of angiogenic and anti-angiogenic factors is critical for normal
development and homeostasis. In the developmental stage of endochondral bone
formation, cartilage switches its phenotype from anti-angiogenic to pro-angiogenic at
the primary ossification centre where the hypertrophic and calcified cartilage zone
forms. Angiogenic factors, such as VEGF, fibroblast growth factor (FGF), platelet-
derived growth factor (PDGF), angiopoietins, chemokines and MMPs, play an
important role during endochondral ossification. However, mature articular cartilage
normally resists vascular invasion due to the dominant role of anti-angiogenic
factors. Cartilage contains considerable amount of anti-angiogenic factors, such as
ChM-1, TSP-1, TIMPs and troponin-1, which are responsible for maintaining its
avascular nature and resist angiogenesis (Bonnet & Walsh, 2005; Patra & Sandell,
2012). However, the functional role of anti-angiogenic factors in the maintenance of
chondrocyte phenotype is largely unknown.
ChM-1 is a 121-amino acid residue glycoprotein derived from a transmembrane
precursor and distributed mainly in the interstitial space of cartilage matrix. It is an
anti-angiogenic factor that is highly and specifically expressed in cartilage (Hiraki, et
al., 1997a; Shukunami & Hiraki, 1998). The inhibition of angiogenesis by ChM-1 in
cartilage, endothelial cells, cardiac valves and several tumors is well documented
(Hayami, et al., 1999; Miura, et al., 2010; Yoshioka, et al., 2006). Recent studies
have revealed the regulatory effect of ChM-1 in cartilage development and tissue
repair, indicative of the importance of ChM-1 in governing chondrocyte phenotype
changes (Klinger, et al., 2011; Nakamichi, et al., 2003; Yukata, et al., 2008).
2.4.1 Structure of ChM-1
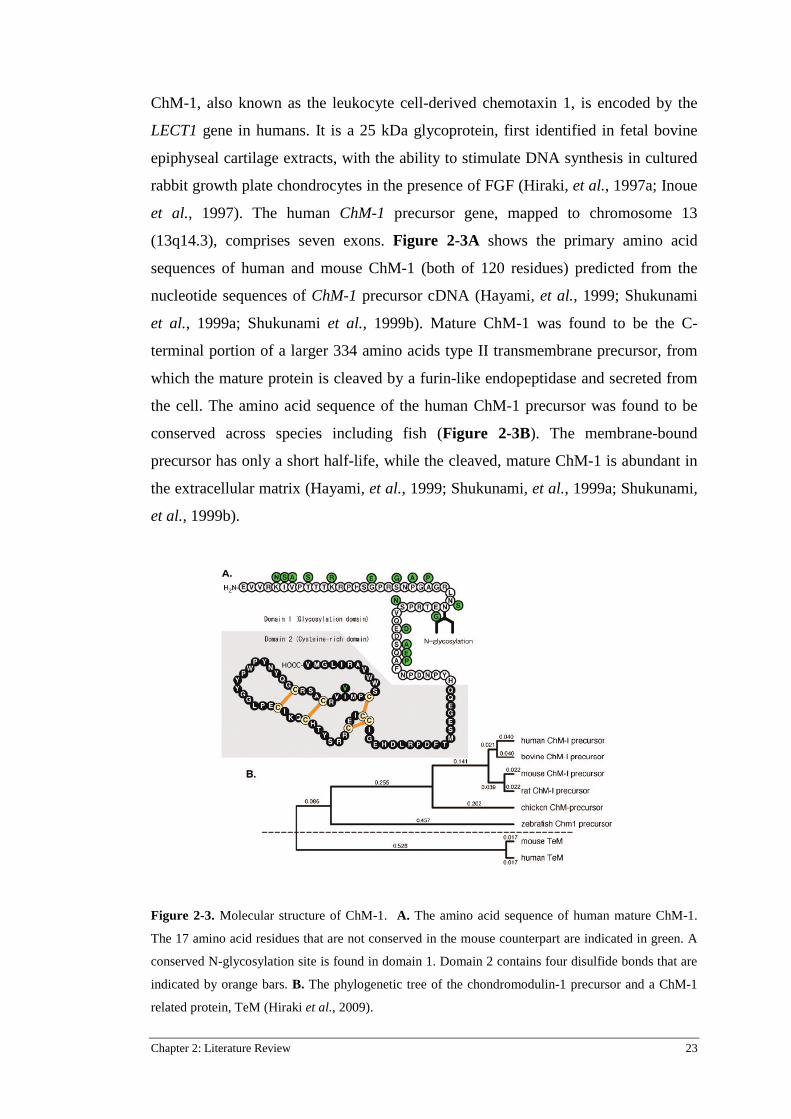
Chapter 2: Literature Review 23
ChM-1, also known as the leukocyte cell-derived chemotaxin 1, is encoded by the
LECT1 gene in humans. It is a 25 kDa glycoprotein, first identified in fetal bovine
epiphyseal cartilage extracts, with the ability to stimulate DNA synthesis in cultured
rabbit growth plate chondrocytes in the presence of FGF (Hiraki, et al., 1997a; Inoue
et al., 1997). The human ChM-1 precursor gene, mapped to chromosome 13
(13q14.3), comprises seven exons. Figure 2-3A shows the primary amino acid
sequences of human and mouse ChM-1 (both of 120 residues) predicted from the
nucleotide sequences of ChM-1 precursor cDNA (Hayami, et al., 1999; Shukunami
et al., 1999a; Shukunami et al., 1999b). Mature ChM-1 was found to be the C-
terminal portion of a larger 334 amino acids type II transmembrane precursor, from
which the mature protein is cleaved by a furin-like endopeptidase and secreted from
the cell. The amino acid sequence of the human ChM-1 precursor was found to be
conserved across species including fish (Figure 2-3B). The membrane-bound
precursor has only a short half-life, while the cleaved, mature ChM-1 is abundant in
the extracellular matrix (Hayami, et al., 1999; Shukunami, et al., 1999a; Shukunami,
et al., 1999b).
Figure 2-3. Molecular structure of ChM-1. A. The amino acid sequence of human mature ChM-1.
The 17 amino acid residues that are not conserved in the mouse counterpart are indicated in green. A
conserved N-glycosylation site is found in domain 1. Domain 2 contains four disulfide bonds that are
indicated by orange bars. B. The phylogenetic tree of the chondromodulin-1 precursor and a ChM-1
related protein, TeM (Hiraki et al., 2009).

24 Chapter 2: Literature Review
2.4.2 Role of ChM-1 in cartilage development and regeneration
Expression of ChM-1 during cartilage development
Cartilage is the most prominent site of ChM-1 expression in mammals (Patra &
Sandell, 2012). During fetal developmental stages, the expression of ChM-1 is
closely related to chondrocyte phenotype. Endochondral ossification takes place in
the growth plates at the distal ends of the long bones between the late epiphysis and
diaphysis. Resting chondrocytes first undergo proliferation, then differentiate into
hypertrophic chondrocytes, and finally transit into osteoblast or undergo apoptosis.
ChM-1 is highly expressed in the avascular cartilage regions of the growth plate. The
immunoreactivity for mature ChM-1 has been shown to specifically localize in
cartilaginous bone primordia, where it is maintained at a high level in the avascular
zone of cartilage, including the resting, proliferating, and early hypertrophic zones
(Hiraki, et al., 1997a; Shukunami, et al., 1999a; Shukunami et al., 2008). However,
in embryonic epiphyseal cartilage, ChM-1 expression is abolished in the area of late
hypertrophic chondrocytes, where blood vessel invasion takes place (Hiraki, et al.,
1997a; Shukunami, et al., 1999a; Shukunami, et al., 2008). Concomitant with the
disappearance of ChM-1, calcified cartilage begins to express VEGFA and MMP-13,
which initiates the remodelling of calcified cartilage matrix (Hiraki, et al., 1997a;
Shukunami, et al., 1999a; Shukunami, et al., 2008) (Figure 2-4). Concurrent
expression of angiogenic-related factors (such as MMP-9) facilitates vascular
invasion at the centre of bony collars surrounding the late hypertrophic and calcified
zone of cartilage. The cartilage matrix is then degraded and replaced with the typical
trabecular bone matrix produced by osteoblasts (Las Heras, et al., 2012). In addition,
it is also found that expression of ChM-1 is down-regulated in rescued RUNX2
knockout mice, in contrast to that of VEGF, which is up-regulated in the same
animals, suggesting that ChM-1 and VEGF have opposite roles (Kamekura, et al.,
2006). Thus, the expression pattern of ChM-1 suggests it may possess important
function in skeletal development.

Chapter 2: Literature Review 25
Figure 2-4. Immunolocalization of ChM-1 in the avascular mesenchyme of the developing mouse
forelimb. A frozen section of mouse forelimb was double-stained with platelet endothelial cell
adhesion molecule (PECAM)-1 antibody (red) and ChM-1 antibody (green). Positive staining for
ChM-1 is observed in the avascular cartilage ECM zones of the phalanges, carpal bones and ulna and
radius in the PECAM-1 negative domains. Orange arrowheads indicate the sites of vascular invasion
into hypertrophic/calcified cartilage of cartilaginous bone primordial (Hiraki, et al., 2009).
Function of ChM-1 in cartilage development and regeneration
The regulatory effect of ChM-1 in cartilage development has been verified by
genetically modified mice. ChM-1 null mice display no abnormalities in vascular
invasion or cartilage development (Brandau et al., 2002), however, adult ChM-1 null
mice exhibit aberrant cartilage formation during fracture repair (Yukata, et al., 2008).
The majority of the chondrocytes in the periosteal callus in ChM-1 null mice fail to
differentiate into mature chondrocytes, resulting in a marked reduction of the
external cartilaginous callus (Yukata, et al., 2008). In addition, ChM-1 null adult
mice display a marked reduction in bone remodelling, manifested by a significant
increase in the bone mineral density due to an imbalance between osteoclastic bone
resorption and osteoblastic bone formation (Nakamichi, et al., 2003). Hence, these
studies indicate that ChM-1 participates in regulation of chondrocyte phenotype and
bone remodelling.
In vitro studies have demonstrated that ChM-1 increases the proliferation and
differentiation of chondrocytes. Hiraki et al. showed that ChM-1 purified from fetal
bovine cartilage stimulates DNA synthesis of cultured growth-plate chondrocytes in
the presence of basic FGF (bFGF) (Hiraki et al., 1991). Inoue et al. observed that

26 Chapter 2: Literature Review
ChM-1 stimulates the colony formation of rabbit growth plate chondrocytes in
agarose culture, in a dose-dependent manner and synergistically in the presence of
FGF-2, indicating that ChM-1 might participate in an autocrine signalling of
anchorage-independent growth of chondrocytes in vitro (Inoue, et al., 1997).
The inhibitory effect of ChM-1 on angiogenesis is well-documented. Recombinant
ChM-1 inhibits proliferation and tube morphogenesis of endothelial cells in cell
culture experiments (Hiraki, et al., 1997a; Hiraki, et al., 1997b; Yoshioka, et al.,
2006). ChM-1 inhibited the migration human umbilical cord vascular endothelial
cells (HUVECs) by the disruption of actin reorganisation and suppression of
Rac1/Cdc42 GTPase activity (Miura, et al., 2010).
ChM-1 also plays a role in cartilage regeneration. Inferior microfracture-induced
fibrocartilage is characterized by a lack of ChM-1, which may contribute to the
observed matrix calcification, vascular ingrowth, and excessive ossification within
the cartilage lesions (Blanke et al., 2009). Direct application of adeno-associated
virus (AAV)-ChM-1 vectors into microfractured porcine cartilage lesions stimulated
chondrogenic differentiation of ingrowing progenitor cells, but significantly inhibited
terminal chondrocyte hypertrophy, the invasion of vessel structures, and excessive
endochondral ossification, which were otherwise observed in untreated lesions
(Klinger, et al., 2011). During chondrogenic differentiation of BMSCs, anti-
hypertrophic factors such as parathyroid hormone-related protein (PTH-rP) and anti-
angiogenic proteins including ChM-1 or TSP-1 can inhibit endochondral ossification
(Gelse et al., 2012).
2.4.3 Role of ChM-1 in other tissues and diseases
Besides cartilage, ChM-1 has been detected in the eye, cardiac valves and thymus
(Brandau, et al., 2002; Funaki et al., 2001), and furthermore, ChM-1 is also a
candidate for anti-cancer proteins due to its anti-angiogenesis and anti-tumorigenic
effects (Hayami, et al., 1999; Mera et al., 2009; Oshima et al., 2004), which will be
summarized below.
ChM-1 expression has been detected in the eye and cerebellum in rats (Funaki, et al.,
2001). ChM-1 mRNA expression is evident in the iris-ciliary body, retina, and scleral
compartments and vitreous body, specifically in the ganglion cells, inner nuclear
layer cells, and pigment epithelium in the retina and in the non-pigment epithelium

Chapter 2: Literature Review 27
of the ciliary body. In addition, recombinant human ChM-1 inhibits tube
morphogenesis of human retinal endothelial cells in vitro, suggesting its role in the
regulation of retinal vascularization during development and the maintenance of an
intact retina and vitreous body (Funaki, et al., 2001).
Cardiac valves have the same level of avascularity as cartilage under normal
conditions, but under pathological conditions, such as aortic stenosis, these valves
express angiogenic factors that causes neovascularization (Akiyama et al., 2004;
Kalluri & Zeisberg, 2006). ChM-1 has been detected throughout the valvular
interstitial cells of all four cardiac valves and their extracellular matrix, but not in the
outer endothelial cell layer (Yoshioka, et al., 2006). The non-overlapping
localizations of ChM-1 and VEGFA are apparent at all development stages of the
heart under normal conditions, and ChM-1 maintains cardiac valvular function by
preventing angiogenesis (Yoshioka, et al., 2006).
In chondrosarcoma, transcripts for ChM-1 are substantially reduced, compared to
normal articular cartilage and other benign cartilage tumours (Hayami, et al., 1999).
The susceptibility of chondrosarcoma to tumour angiogenesis may therefore be
accounted for by a loss of ChM-1 expression. Local administration of recombinant
human ChM-1 completely blocked vascular invasion and tumour growth of
chondrosarcoma, and also inhibited the growth of HT-29 colon adenocarcinoma in
vivo, implying its therapeutic potential for solid tumours (Hayami, et al., 1999).
Furthermore, the adenoviral transduction of human ChM-1 in mouse melanoma cells
results in the suppression of tumour growth in association with decreased tumour
angiogenesis (Oshima, et al., 2004). It is reported that ChM-1 can act directly on
tumour cells and not just endothelial cells. Mera et al. showed that ChM-1 reduced
growth and DNA synthesis of human tumour cells, such as HepG2, PC-3 and NOS-1
(Mera, et al., 2009). ChM-1 also down-regulates cell cycle proteins and up-regulate
the cell cycle inhibitor (Mera, et al., 2009; Patra & Sandell, 2012). These data
suggest that ChM-1 mediates its cytotoxic effect on human tumour cells primarily by
cell cycle arrest.
In rheumatoid arthritis, recombinant human ChM-1 suppresses the proliferation of
synovial cells (Setoguchi et al., 2004). ChM-1 has also been found to suppress the
proliferative response of T cells that had been stimulated with anti-CD3/CD28
antibodies. The suppression of T cell responses and synovial cell proliferation

28 Chapter 2: Literature Review
indicates a unique therapeutic potential for ChM-1 in rheumatoid arthritis (Setoguchi,
et al., 2004).
2.4.4 Molecular mechanisms involving the expression and function of ChM-1
The regulation systems associated with ChM-1 production are poorly understood.
ChM-1 has been reported as a hypoxia-inducible and SOX9-regulated gene in human
articular chondrocytes (Lafont, et al., 2008). SOX9 is a potent transactivator of
chondrocyte-specific genes. The adenoviral co-expression of SOX9, SOX5 and
SOX6 induces chondrogenic differentiation as well as ChM-1 mRNA in mouse
embryonic stem cells (Ikeda et al., 2004). In chondrocyte differentiation, ChM-1
mRNA is down-regulated when treated with FGF-2, TGF-β2 and PTH-rP
(Shukunami & Hiraki, 1998). However, there is no evidence showing whether
transcriptional factor SOX9 directly targets ChM-1 gene transcription.
In the study of cartilage regeneration, overexpression of ChM-1 in cultured
osteochondral progenitor cells showed a tendency to reduce the expression of
hypertrophic maker COL10A1 by mechanisms unknown (Klinger, et al., 2011). In
addition, in the studies involving the anti-angiogenesis and anti-tumour effect of
ChM-1, it is reported that ChM-1 reduces growth of tumour cells presumably by
suppressing the signal transducer and activators of transcription (STAT) signalling
pathway (Mera, et al., 2009). ChM-1 also down-regulates cell cycle proteins such as
cyclin D1, cyclin D3 and cdk6 and up-regulate the cell cycle inhibitor protein
p21cip1, suggesting that ChM-1 possess the ability of arresting cell cycle (Mera, et
al., 2009; Patra & Sandell, 2012). Nevertheless, whether ChM-1 binds to specific
receptors, activates signalling pathways or directly targets gene transcription remains
unknown and needs to be elucidated to gain further insight into the mechanisms of
maintaining chondrocyte phenotype.
2.4.5 The research progress of angiogenesis and anti-angiogenesis in OA
Normal articular cartilage remains avascular throughout life. In an osteoarthritic
environment, however, it seems that cartilage loses its ability to stay avascular
(Murata et al., 2008; Walsh et al., 2010). Blood vessels and channels can be seen to
invade from the subchondral bone into the calcified and noncalcified cartilage in OA,
and sympathetic and sensory nerves are present within vascular channels in both
Chapter 2: Literature Review 29
mild and severe OA cartilage (Suri et al., 2007; Suri & Walsh, 2012; Walsh, et al.,
2010). Moreover, OA chondrocytes produce VEGF and express VEGF receptor
(VEGFR) (Enomoto et al., 2003). By contrast, normal adult chondrocytes are
negative for both ligand and receptor (Enomoto, et al., 2003; Walsh, et al., 2010). In
vitro studies have demonstrated that VEGF expression in chondrocytes can be
induced by inflammatory cytokines, hypoxia and mechanical stress, which are
factors all symptomatic in OA (Giatromanolaki et al., 2003; Loeser, 2006; Pufe et
al., 2004b). HIF-α, Jun N-terminal kinase (JNK) or p38 MAPK pathway are known
to be involved in this process (Giatromanolaki, et al., 2003; Murata et al., 2006;
Pufe, et al., 2004b).
Immunohistochemical staining shows decreased ChM-1 expression in osteoarthritic
cartilage and that the loss of ChM-1 coincides with blood vessels invading the
cartilage (Hayami et al., 2003). The function of angiogenic stimulators has been
extensively studied in the past two decades. VEGFA has the ability to shift the
balance between MMPs and TIMPs and this may contribute to matrix degradation in
OA cartilage (Pufe et al., 2004a; Pufe, et al., 2004b). However, in recent years, it has
been recognized that the role of endogenous angiogenesis inhibitors are increasingly
important to elucidate the balance between angiogenesis and tissue homeostasis.
Anti-angiogenic factor ChM-1 and angiogenic factor VEGFA are expressed in a
mutually exclusive pattern, as shown in the growth plate during cartilage
development, as well as in heart valves and in rescued RUNX2 null mice (Kamekura,
et al., 2006; Takeda et al., 2001). But it remains unclear if anti-angiogenic factor
ChM-1 participates in maintaining the chondrocyte phenotype and the mechanisms
underlying this role.
2.5 SUMMARY AND IMPLICATIONS
This literature review has sought to summarize the natural anatomical structure and
physiological property of cartilage and pathological change of chondrocytes in
osteoarthritis in terms of angiogenic and anti-angiogenic factors. During chondrocyte
development, angiogenesis has to be turned on and off at various stages.
Angiogenesis is necessary for endochondral ossification in the normal growth plate,
whereas anti-angiogenesis is necessary in mature healthy cartilage. In OA pathology,

30 Chapter 2: Literature Review
chondrocytes undergo hypertrophy, similar to growth plate development. However, it
is not clear whether the angiogenic and anti-angiogenic equilibrium would be shifted
once more, and whether this imbalance could exacerbate cartilage degradation and
disease processes. ChM-1 is the most abundant endogenous anti-angiogenic protein
in cartilage. This review has highlighted the expression pattern of ChM-1 and its
related biological functions. Indeed, it has been shown that expression of ChM-1 is
confined in normal avascular cartilage, whereas its expression is abolished in
hypertrophic chondrocytes both in the growth plate and in osteoarthritis. There
remains a great knowledge gap in understanding the contribution of ChM-1 in
chondrocyte phenotype. This review also summarizes HIF signalling pathways in
general and specifically in cartilage. Although hypoxia has been regarded as a
favourable condition to induce the chondrocyte phenotype, HIF-2α has been shown
to be a catabolic regulator in the growth plate and osteoarthritis. Interestingly,
hypoxia initiates angiogenic signals in vascular tissues by stabilizing HIF-α, but the
existence of HIFs in normal cartilage could not initiate the angiogenic and
hypertrophic cascades. It remains to be demonstrated whether the abundant
expression of ChM-1 in cartilage directly interferes with the activity of HIFs.
Motivated by previous studies, the aim of this project is to address the balance
between angiogenesis and anti-angiogenesis in OA cartilage with the focus on the
function of anti-angiogenic factor ChM-1. I hypothesise that the anti-angiogenic
factor is essential in maintaining the physiological functions of chondrocytes and
preventing hypertrophy in OA progression. Therefore, profiling of angiogenic-
related cytokines in human OA cartilage was performed in this study. The
involvement of ChM-1 in chondrogenesis and inflammatory cytokine-induced
hypertrophy were studied in vitro by transfection of ChM-1 lentivirus or siRNA in
chondrocytes; the in vivo role of ChM-1 in OA progression was investigated in an
OA rat model. Furthermore, the possible molecular mechanisms involved in this
process were also explored by investigating regulation of the HIF-2α pathways in
chondrocytes. The results from this project will contribute to a better understanding
of the aetiology of OA by providing fresh insights into the molecular mechanisms of
OA progression; thereby highlighting potential new treatment options of OA.

Chapter 3: Materials and Methods 31
Chapter 3: Materials and Methods
3.1 INTRODUCTION
All materials and methods referred to in the results chapters are described in this
chapter. Any modifications of the protocols, sample size and statistical analysis are
detailed in the results chapters in which they were performed.
3.2 REAGENTS AND ANTIBODIES
Transforming growth factor beta 3 (TGF-β3) was purchased from Bioscientific Pty
Ltd, Kirrawee, NSW, Australia. COL2 antibody (Abcam, ab53047), COL10 (Abcam,
ab58632 and ab49945), MMP-13 (Abcam, ab75606) and VEGFR3 (Abcam,
ab27278) were from Sapphire Bioscience Pty Ltd, Waterloo NSW, Australia.
VEGFR2 (Cell Signaling Technology, #2479) were purchased from Genesearch Pty
Ltd, QLD, Australia. VEGF antibody (#RB-222-P), COL2 (MS-235-P0), MMP-13
(RB-1681-P0) were purchased from Thermo Scientific, VIC, Australia. ChM-1
antibody (sc-33563, sc-20310), RUNX2 (sc-10758), GAPDH (sc-47724) and GFP
(sc-9996) were purchased from Santa Cruz, Biotechnology, CA, USA. Aggrecan
(AB1031) was purchased from Merck Millipore, MA, USA. V5 antibody
(Invitrogen, R96025) were purchased from Life Technologies, VIC, Australia. HIF-
1α (NB100-105) and HIF-2α (NB100-122) were obtained from Novus Biologicals,
CO, USA. TRIzol® Reagent (Ambion®), SYBR green qPCR master mix and 96-well
plates for qRT-PCR analysis were all obtained from Life Technologies. DyNAmo
cDNA Synthesis Kit (F-470L) was purchased from Thermo Scientific. All other
reagents were all obtained from Sigma-Aldrich (NSW, Australia) unless otherwise
stated.
3.3 SAMPLE COLLECTION
Ethics approval for this project was obtained from the Queensland University of
Technology and Prince Charles Hospital Ethics Committees and a consent form was
32 Chapter 3: Materials and Methods
signed by all patients involved. Detailed information of weight and age of the
patients was recorded, and the radiographs of knee were taken before operation. The
average age of OA patients participating in the study was 68.17 ± 5.74 years old. The
patients selected for this project had all ceased anti-inflammatory treatment more
than one-month prior to surgery. Severe OA cartilage was sourced from the main
defective area of the medial compartment tibia cartilage showing degenerative
changes. The relative healthy counterpart (mild OA cartilage) was sourced from the
anterior compartment of the distal femur cartilage showing smooth surface. A portion
of each individual cartilage sample was snap frozen in liquid nitrogen and stored at -
80°C for RNA extraction.
3.4 HISTOLOGY AND IMMUNOHISTOCHEMICAL STAINING
The isolated cartilage tissues were processed for histological and
immunohistochemical staining. Tissue samples were fixed in 4% paraformaldehyde
(PFA) for 24 h, and then dehydrated through gradient alcohol, embedded in paraffin
and sectioned to 5 µm thickness. For immunohistochemical staining, the slices were
de-waxed in xylene and rehydrated in ethanol. The sections were incubated with
proteinases K (DAKO Multilink, CA, USA) for 10 min for antigen retrieval and
endogenous peroxidases were inhibited by incubation in 3% hydrogen peroxide
(H2O2) in phosphate buffered saline (PBS) for 15 min. Next, non-specific binding
were blocked by incubation with 10% swine serum for 1 h. The slices were then
incubated with the polyclonal rabbit VEGF antibody (1:400), ChM-1 antibody
(1:200, sc-33563) overnight at 4ºC, followed by incubation at room temperature with
secondary antibody for 45 min, and then with horseradish perioxidase-conjugated
avidin-biotin complex (Universal LSAB™+ Kit/HRP, DAKO, Denmark) for another
15 min. The antibody complexes were visualized by diaminobenzidine (DAB)
substrate. Mayer’s haematoxylin was used for counter staining. The stained
specimens were viewed and photographed under microscope (Zeiss Axio Imager M2,
Zeiss, Germany).

Chapter 3: Materials and Methods 33
3.5 PROTEIN EXTRACTION AND IMMUNOBLOTTING
3.5.1 Protein extraction from cartilage tissues
Total protein from human OA cartilage samples were extracted by first snap freezing
in liquid nitrogen then homogenizing to very fine powder by manual crushing with
pestle. The frozen tissue powder was collected in a cryovial containing radio-
immunoprecipitation assay (RIPA) lysis buffer (150 mM NaCl, 1% IGEPAL CA-
630, 0.5% sodium deoxycholate, 0.1% SDS and 50 mM Tris-HCl, pH8.0. Sigma-
Aldrich, R0278) and steel beads. Protease inhibitor cocktail (Roche, Swiss) and
phosphatase inhibitor (Roche) were added fresh to the RIPA buffer. The samples
were then milled using bead-beater (Mini-Beadbeater-16, BioSpec, USA), and
further homogenized with a sonicator. After centrifuging at 12000 g for 10 min, the
supernatants were collected and stored at - 80°C for subsequent bicinchoninic acid
(BCA) assay and Western blot.
3.5.2 Protein extraction from chondrocytes
Primary articular cartilage chondrocytes (ACCs), human chondrocyte cell line
C28/I2, and HEK293T cell line were used in this project. Whole cell protein or
nucleus/cytoplasmic protein were extracted from these cells following indicated
treatment.
Whole cell lysates were extracted using RIPA lysis buffer with freshly added
protease inhibitor cocktail and phosphatase inhibitor. Typically, 100-200 μL lysis
buffer with inhibitors were added into 1 well of 6-well plate. After shaking at 4ºC
until lysed, whole cell lysates were collected with scrapper and transferred into 1.5
mL tube. The samples were vortexed for 15 s, centrifuge at 4ºC for 15 min at 12000
g, the supernant transferred to a clean tube and stored at -80ºC.
Nuclear and cytoplasmic protein fractions were prepared using NE-PER Nuclear and
Cytoplasmic extraction kit (Thermo Scientific, USA). Protease inhibitor cocktail and
phosphatase inhibitor were added prior to cell lysis. Typically, for one well of 6-well
plate (approximately 2 × 10⁶ cells for C28/I2 or HEK293T cell line), 150-200 μL
Cytoplasmic Extraction Reagent I (CER I), 8.75-11 μL Cytoplasmic Extraction
Reagent II (CER II), and 75-100 μL Nuclear Extraction Reagent (NER) were the
volumes used to separate out the nuclear and cytoplasmic lysates.
34 Chapter 3: Materials and Methods
3.5.3 Western blot
The protein concentration from cartilage tissues, whole cell lysates or nuclear and
cytoplasmic protein fractions was determined with Pierce BCA Protein Assay kit
(Thermo Scientific, Australia). Following the determination of protein concentration,
10 μg protein was separated by SDS polyacrylamide gel electrophoresis (PAGE) on
10% acrylamide gels. The protein was transferred to nitrocellulose membrane (Pall
Corporation, East Hills, NY, USA) which was blocked with Odyssey® blocking
buffer (Millennium Science, Australia) for 1 h at room temperature. The membranes
were incubated with each primary antibody, including VEGF (1:1000), ChM-1
(1:1000), V5 (1:2000), GFP (1:5000), RUNX2 (1:2000), COL2 (1:1000, Abcam,
ab53047), MMP-13 (1:1000, Abcam, ab75606), COL10 (1:1000, Abcam, ab49945),
aggrecan (1:1000), VEGFR2 (1:1000), VEGFR3 (1:1000) and GAPDH (1:2000)
overnight at 4°C. Membranes were then washed twice and incubated with
corresponding fluorescent secondary antibodies (1:4000, Cell Signaling Technology,
Inc., USA) for 1 h at room temperature. The protein bands were visualized using the
Odyssey® infrared imaging system. The relative intensity of protein bands was
quantified using Image J software.
3.6 TOTAL RNA EXTRACTION FROM CARTILAGE TISSUE
A portion of each cartilage sample was stored at −80°C, from which total RNA was
extracted. The samples were flash frozen in liquid nitrogen and then homogenized to
fine powder by manual crushing with pestle. The frozen tissue powder was collected
in a cryovial containing TRIzol Reagent and steel beads. The samples were then
milled using bead-beater. After centrifugation at 12000 g for 10 min, the aqeous
phase was collected and the RNA extracted with the chloroform and isopropanol
method.
3.7 REVERSE TRANSCRIPTION AND QRT-PCR
The complementary DNA was synthesized from 1 μg of total RNA using

Chapter 3: Materials and Methods 35
DyNAmo™ cDNA Synthesis Kit, as per the manufacturer’s protocol. qRT-PCR was
performed using SYBR reagent on an ABI 7500 Thermal Cycler (Applied
Biosystems, Australia). The sequences of primers are showed in Table 3-1. The
following cycling conditions were used: 95°C for 10 min for activation, followed by
40 cycles of denaturation step of 95°C for 15 s and primer extension at 60°C for 1
min. All reactions were performed in triplicate from each of three independent
experiments. The mean cycle threshold (Ct) value of each target gene was
normalized against Ct value of house-keeping gene 18S ribosomal RNA (18S
rRNA), GAPDH and β-actin. The relative expression calculated using the following
formula: 2-(normalized average Cts) ×104.

36 Chapter 3: Materials and Methods
Table 3-1. Primers used in qRT-PCR (Continued to next page)
Gene: Homo sapiens (H) & Rattus norvegicus (R)
Primers: Forward (F) & Reverse (R)
IL-1β (H) F: 5'- AGCCATGGCAGAAGTACCTGAGC -3' R: 5'- GAAGCCCTTGCTGT GTGGTGG-3'
IL-6 (H) F: 5'-AGGAGACTTGCCTGGTGAAA-3' R: 5'-CAGGGGTGGTTATTGCATCT-3'
TNF-α (H) F: 5'-CCTGGTATGAGCCCATCTATC-3' R: 5'-GGTTGGATGTTCGTCCTCCTC-3'
ChM-1 (H) F: 5’- CGCAAGTGAAGGCTCGTA -3’ R: 5’-TGGAGGAGATGCTCTGTTTGG-3’
VEGFA (H) F: 5’-GCTGTCTTGGGTGCATTGG-3’ R: 5’-GCAGCCTGGGACCACTTG -3’
VEGFR2 (H) F: 5’-CAAACGCTGACATGTACGGTCTA -3’ R: 5’-CCAACTGCCAATACCAGTGGAT -3’
COL2A1 (H) F: 5’- GGATGGCTGCACGAAACATACCGG -3’ R: 5’- CAAGAAGCAGACCGGCCCTATG -3’
ACAN (H) F: 5’-AGTCACACCTGAGCAGCATC -3’ R: 5’- AGTTCTCAAATTGCATGGGGTGTC -3’
SOX9 (H) F: 5’- AGCACTCGGGGCAATCCCAG -3’ R: 5’- TTGGAGATGACGTCGCTGC -3’
Endostatin (H) F: 5’- AGTGGCCCGGTACCACTTC -3’ R: 5’- CGGATGTGGAACAGCAGTGA -3’
RUNX2 (H) F: 5’- AAGAAGAGCCAGGCAGGTGC -3’ R: 5’-CATACCGAGGGACATGCCTGAG -3’
COL10A1 (H) F: 5’- AGCACGCAGAATCCATCTGAG -3’ R: 5’- AGGGAATGAAGAACTGTGTCTTGGTG -3’
MMP-13 (H) F: 5’-ACTTCACGATGGCATTGCTG -3’ R: 5’-CATAATTTGGCCCAGGAGGA -3’
MMP-2 (H) F: 5'-CCGTCGCCCATCATCAA-3' R: 5'-AGATATTGCACTGCCAACTCT-3'
MMP-9 (H) F: 5'-TCGTGGTTCCAACTCGGTTT-3' R: 5'-GCGGCCCTCGAAGATGA-3'
HIF-2α (H) F: 5’- CGCACAGAGTTCTTGGGAGC -3’ R: 5’-TGCAGACCTTGTCTTGAAGGTG -3’
PECAM1 (H) F: 5’-TGGAGCACAGTGGCAACTACAC -3’ R: 5’-CCACGATGCTGCTGACCTT-3’
ANGPT2 (H) F: 5’- GAAGAGATCAAGGCCTACTGTG -3’ R: 5’-CTCCTGAAGGGTTACCAAATCCCAC -3’
TGF-β1 (H) F: 5’-CGAGCCTGAGGCCGACTAC -3’ R: 5’-AGATTTCGTTGTGGGTTTCCA -3’
GAPDH (H &R) F: 5’- TCAGCAATGCCTCCTGCAC -3’ R: 5’- TCTGGGTGGCAGTGATGGC -3’

Chapter 3: Materials and Methods 37
Table 3-1. Primers used in qRT-PCR
Gene: Homo sapiens (H) & Rattus norvegicus (R)
Primers: Forward (F) & Reverse (R)
18S (H) F: 5'-TTCGGAACTGAGGCCATGAT-3' R: 5'-CGAAC CTCCGACTTCGTTC-3'
ChM-1 (R&H) F: 5’- CGTTTTGCTGGAGGAGAG -3’ R: 5’- GACTGGCATGATCTTGCC -3’
VEGFA (R) F: 5’- CTCCACCATGCCAAGTGGTC -3’ R: 5’- AGATGTCCACCAGGGTCTCA -3’
COL10A1 (R) F: 5’- GCAGCCTGGAGAGAGCATATC -3’ R: 5’- AATGGATTCTGGTGCTCAGAGG -3’
MMP-13 (R) F: 5’- GGAACCACGTGTGGAGTTATG -3’ R: 5’- TCTTCTTCTATGAGGCGGGGA -3’
β-actin (R) F: 5'- CATACCCAAGAAGGAAGGCTGG -3' R: 5'- GCTATGTTGCTCTAGACTTCGAGC -3'
38 Chapter 3: Materials and Methods
3.8 ANGIOGENESIS QRT-PCR ARRAY
Total RNA was extracted from severe and mild OA cartilage by using TRIzol
Reagent and was reverse transcripted by cDNA Synthesis Kit (Finnzymes). Human
Angiogenesis RT2 Profiler PCR Array was purchased from SuperArray Bioscience
Corporation (PAHS-024Z, Qiagen, VIC, Australia). Quantitative real-time PCR was
performed in an ABI Prism 7300 Sequence Detector (Applied Biosystems). The
qRT-PCR cycling conditions are the same as described in Section 3.7. The ΔΔCt
formula was used for data analysis. Fold-changes were calculated as difference in
gene expression between severe and mild OA cartilage. As demonstrated in the
result, the positive value indicates gene up-regulation and the negative value
indicates gene down-regulation.
3.9 HUMAN CYTOKINE ANTIBODY MEMBRANE ARRAY ANALYSIS
The expression level of 54 cytokines were analyzed in individual samples of
cartilage derived from three different donors using human cytokine antibody
membrane arrays (AAH-CYT-8, RayBiotech, Inc., GA, USA) according to the
manufacturer’s recommendations. Severe OA cartilage was sourced from the main
defective area of the medial compartment tibia cartilage showing degenerative
changes. The relative healthy counterpart (mild OA cartilage) was sourced from the
anterior compartment of the distal femur cartilage showing smooth surface. The
configuration of the cytokine antibody membrane array is given in Figure 4-4. The
protein concentrations from the cartilage samples were normalized using BCA
protein assay. For each membrane, 40 μg of protein in 1 mL lysis buffer was applied.
After blocking, membranes were incubated overnight at 4°C. Detection of cytokines
was performed by biotin-conjugated secondary antibodies raised against the
particular chemokines and horseradish peroxidase-conjugated streptavidin. For
detection by chemiluminescence, the membranes were briefly exposed to X-ray films
(Kodak) for 1 min. Images were scanned and spot intensity was determined by
densitometric measurements. In brief, a color was defined representing the
background color of the array in a given area (negative control). For each spot, the
number of stained and unstained pixels was determined within a given area. For
normalization of arrays, signal values of cytokines were divided by the mean value

Chapter 3: Materials and Methods 39
of the positive control and multiplied with 100. A value of 100 represents a spot
intensity as shown in the positive control, while a value of zero represents the spot
intensity as seen in the negative control.
3.10 CELL CULTURE
3.10.1 Cell isolation and expansion
Articular cartilage chondrocytes (ACCs) were cultured from the healthy parts of the
articular cartilage and only passage 1 cells were used for subsequent experiments.
Briefly, cartilage was dissected into small pieces and chondrocytes were released by
digesting the tissues in 0.15% collagenase type ΙΙ. The cells suspension was filtered
(70 µm mesh) and resuspended in Dulbecco's Modified Eagle Medium: Nutrient
Mixture F-12 (DMEM/F12; Gibco®, Life Technologies Pty Ltd., Australia)
containing 10% (v/v) fetal bovine serum (FBS; In Vitro Technologies, Australia) and
1% (v/v) penicillin/streptomycin (P/S; Gibco®, Life Technologies) and plated at a
density of 3000 cells/cm2.
The human bone marrow stromal cells (hBMSCs) were isolated and cultured
according to the previously published procedures (Wu et al., 2013).
3.10.2 Chondrogenic differentiation
For chondrogenic differentiation, 2 × 10⁵ cells of ACCs, BMSCs and mixture of
ACCs and BMSCs (1:1) were resuspended and centrifuged at 600 g for 20 min to
form a pellet. The pellets were grown in 2 mL of chondrogenic differentiation
medium for 3-weeks. The chondrogenic medium was composed of high glucose
DMEM (Life Technologies) supplemented with 10 ng/mL of TGF-β3, 1% insulin–
transferrin–selenium (ITS) supplement (1 mg/mL insulin from bovine pancreas, 0.55
mg/mL human transferrin, 0.5 μg/mL sodium selenite, 50 mg/mL bovine serum
albumin, 470 μg/mL linoleic acid), 0.1 mM ascorbic acid, 0.4 mM proline, 10-7 M
dexamethasone and 10 mg/mL of sodium pyruvate. The medium was replaced every
3 days. At day 7, 14 and 21, the pellets were collected and processed for RNA
extraction and histological evaluation.

40 Chapter 3: Materials and Methods
3.11 LENTIVIRUS MEDIATED GENE MANIPULATING
3.11.1 Lentivirus ChM-1 construct
Human chondromodulin-1 cDNA was isolated from human chondrocytes and
amplified by PCR with the SpeΙ and XhoΙ restriction enzyme cutting site inducted
(Finnzymes, Thermo Fisher Scientific, USA). The primers for PCR were designed
based on Homo sapiens ChM-1 mRNA sequences from National Center for
Biotechnology Information (NCBI)’s site. The forward primer:
TAGAGGATCCACTAGTCCACCATGACAGAGAACTCCGACAAAGTTC, was
designed to include a SpeΙ restriction enzyme site (italic underlined). The reverse
primer: GCCCTCTAGACTCGAGCCCACCATGCCCAAGATACGG, included a
XhoΙ restriction enzyme site (italic underlined). The length of amplified segment
was 1041 bp. The amplified segment was subcloned into the plasmid pLenti6/V5
with the control of Human CMV promoter using In-Fusion HD Cloning Kit
(Clontech Laboratories, Inc. A Takara Bio Company, USA). The insert sequence was
confirmed by restriction-enzyme digestions and DNA sequencing. The third-
generation pLenti6/V5-ChM-1 was used for lentivirus production. The lentiviral
packaging plasmids pRSVRev, pMDLgpRRE and pMD.G have been described by
Gu, et al. (Gu et al., 2011). The pLenti6/V5-ChM-1 and the packing plasmids were
transformed and amplified in Escherichia coli (SURE 2 and DH5α respectively), and
isolated using NucleoBond® Xtra Maxi-Prep Kits (Macherey-Nagel, Dueren,
Germany).
3.11.2 Lentivirus production and titration
HEK293T cell line was used to package the lentivirus. Briefly, 6.6 μg pLenti6/V5-
ChM-1 and 3.3 μg of each packaging plasmid with 133 μL 1.25 M CaCl2, 0.5 mL
H2O and 0.66 mL 2 × HEPES buffered saline (140 mM NaCl, 1.5 mM Na2HPO4, 50
mM HEPES with pH 7.05) were added to transfect HEK293T cell line in a T75 flask.
The virus containing supernatant was harvested after 48-72 h and concentrated using
Amicon Ultra-15 Centrifugal Filter Unit (100MW, Merck Millipore, Kilsyth,
Australia). The concentrated lentivirus was stored at -80°C for cell infection.
For virus titration, HEK293T cells were seeded in 6-well plates at density of 4 × 10⁵
cells/well and incubated for 12-24 h. Before infecting the cells the lentivirus solution

Chapter 3: Materials and Methods 41
was serial diluted in DMEM medium containing 8 μg/mL polybrene to contain 10
μL, 1 μL, 0.1 μL, 0.01 μL, 0.001 μL and 0 μL of concentrated lentivirus solution
(dilution factors: 0.1, 1, 10, 100 and 1000, respectively). After incubated with
lentivirus overnight, the media were replaced and the cells cultured for another 48 h.
Then cells were trypsinised and fixed with 1% PFA for 30 min.
In this experiment, the LV-ChM-1 contained no GFP fluorescence, but instead
contained a V5-tag. This allowed flow cytometry to determine the percentage of V5-
tag positive cells by first fixing the cells then incubating with anti-V5-tag primary
antibody for 1 h, followed by incubation with DyLight® 488-conjugated goat anti-
mouse IgG H&L (ab96879, abcam) secondary antibody for 30 min.
For LV-GFP titration, the fixed cells were subjected to flow cytometry analysis to
determine the percentage of GFP-positive cells. The lentiviral particle concentrations
(particles/μL) were calculated using the following formulation: percentage positive
cells × 4 × 10⁵ × dilution factor.
3.11.3 LV-ChM-1 infection of chondrocytes
Primary ACCs or C28/I2 cells were infected with lentivirus in polybrene-containing
(8 μg/mL) medium when cells were 50-60% confluence. Cells were transfected with
lentivirus containing ChM-1 cDNA (LV-ChM-1) or GFP (LV-GFP, serves as empty
vector control), respectively. After 24 h, the culture medium was changed and 48 h
later, transfected cells were subjected to TNF-α stimulation for specific time-points,
after which the cells were harvested for qRT-PCR and Western blot analysis.
3.12 CHM-1 KNOCKDOWN BY SIRNA TRANSFECTION IN PRIMARY
CHONDROCYTES
Primary human chondrocytes were transfected with ChM-1siRNA (ON-TARGET
plus Human LECT1 (11061) siRNA-SMART pool, Millennium Science, Australia)
and scrambled siRNA at 100 nM using Lipofectamine 2000 following to the
manufacturer’s instruction (Life Technologies). 24 h after transfection, cells were
subjected to TNF-α stimulation for 48 h, after which the cells were harvested for
qRT-PCR and Western blot analysis.

42 Chapter 3: Materials and Methods
3.13 ANIMAL STUDY
3.13.1 Rat OA model
All animal experiment and protocols were approved by Animal Ethic Committee of
Queensland University of Technology (no.1200000248 and no. 1400000274).
Experimental osteoarthritis was induced in 8-week-old female Wistar rat by
surgically removal of meniscus (menisectomy, MSX) of the right knee. Sham
operated rats were used as controls. Rats were randomly divided into the following
four groups: group 1, Sham + PBS; group 2, MSX + PBS; group 3, MSX + LV-
ChM-1; group 4, MSX + LV-GFP. Starting one week after the surgery, rats were
anesthetized with isoflourane inhalation and given intra-articular injections of 50 μL
lentivirus or PBS at 8, 12, 16 and 20 days post OA surgery. For the lentivirus groups,
a total amount of 1 × 10⁹ pfu lentivirus was injected into each knee joint. Five-weeks
and nine-weeks after OA surgery, rats were sacrificed and knee joints were harvested
for histology and immunohistochemical analysis, and RNA extraction.
3.13.2 Histological and immunohistochemical staining
The harvested rat knees were processed for histological and immunohistochemical
staining. Tissue samples were fixed in 4% PFA for 24 h and decalcified in neutral
10% EDTA for 2 months at 4°C on a rocking platform. Following that, the samples
were dehydrated through gradient alcohol, embedded in paraffin and sectioned to 5
µm thickness.
To evaluate OA severity, four representative sections from various depths of the joint
were stained with Safranin-O to visualize the presence of proteoglycans in cartilage
matrix (Rosenberg, 1971). Mankin’s histologic grading system (Mankin score, 0 to
14) was used to evaluate OA severity in tibial plateau (Mankin et al., 1971; Pearson
et al., 2011; Van der Sluijs et al., 1992). Briefly, sections were de-waxed in xylene
and rehydrated in ethanol. The sections were incubated with Weigert’s iron
hematoxylin for 2 min and washed with running water for 10 min. Then 0.01% w/v
Fast Green was applied to the sections for 5 min, followed by quickly rinsing in 1%
v/v acetic acid for 10-15 s. Subsequently, the sections were treated with 0.1% w/v

Chapter 3: Materials and Methods 43
Safranin-O for 10 min. Finally, sections were dehydrate and cleared by 70%, 90%
and 100% ethanol and xylene, and mounted with Depex mounting medium (Sigma).
The stained specimens were viewed under microscope (Zeiss Axio Imager M2, Zeiss,
Germany) and scanned by Leica SCN400 scanning system (Leica Microsystems,
Wetzlar, Germany).
To visualize GFP fluorescence in lentivirus transfected knee cartilage, frozen sections
(8 µm) were prepared using cryo microtome and viewed under confocal microscopy
(Leica TCS SP5, Germany).
Protocol of immunohistochemical staining has been described in section 3.4. The
slices were incubated with the primary antibodies of VEGF (1:400), ChM-1 (1:200),
aggrecan (1:200), COL2 (1:200, MS-235-P0), MMP-13 (1:200, RB-1681-P0),
COL10 (1:200, ab58632), V5 (1:200), HIF-1α (1:50) and HIF-2α (1:100). The
stained specimens were viewed under microscope (Zeiss Axio Imager M2, Zeiss) and
scanned by Leica SCN400 scanning system (Leica Microsystems).
3.13.3 Detection of gene expression in rat OA cartilage
The rat knees were harvested immediately after rats sacrificed and the knee samples
were kept in dry ice to preserve RNA. Rat knee cartilage was scratched using blades
and dissected into thin and small pieces (0.5 mm × 0.5 mm) and deposited into
cryovials containing TRIzol Reagent and steel beads. The samples were then milled
using bead-beater. After centrifugation at 12000 g for 10 min, the supernatants were
collected and used for subsequent RNA extraction with chloroform and isopropanol.
The protocols for cDNA synthesis and qRT-PCR were described in section 3.7.
3.14 IMMUNOCYTOCHEMICAL STAINING
The human chondrocyte cell line C28/I2 was cultured on the coverslips with
DMEM/F12 medium containing 10% FBS and 1% P/S. At 60% confluence, C28/I2
was then transfected with LV-ChM-1 or LV-GFP. Transfected C28/I2 were exposed
to TNF-α for indicated time-point and subsequently fixed by 4% PFA for 15 min.
The fixed cells were then permeabilized with 0.2% Triton X-100 in PBS for 10 min
and non-specific binding were blocked by incubation with 1% bovine serum albumin

44 Chapter 3: Materials and Methods
(BSA) for 10 min. After blocking, fixed cells were incubated with primary antibody
of HIF-2α (1:50) overnight at 4°C with rocking. On the second day, fixed cells were
then washed three times with PBS and then incubated with anti-rabbit secondary
antibodies conjugated with Alexa Fluor 488 fluorescent dyes (1:1000, Cell Signaling
Technology, #4412) for 1 h at room temperature. Finally, cell nuclei were visualized
by DAPI (1:1000). The stained coverslips were sealed on slides with ProLong® Gold
Antifade Mountant with DAPI (Life technologies) and viewed under confocal
microscopy (Leica TCS SP5).
3.15 CHROMATIN IMMUNOPRECIPITATION (CHIP) ASSAY
ChIP assay was performed using Pierce Agarose ChIP kit (Thermo Scientific, USA).
Firstly, LV-ChM-1 or LV-GFP infected C28/I2 cells were passaged and cultured for
48 h. After stimulation with TNF-α for 6 h, the cells were fixed with 1%
formaldehyde for 10 min at room temperature to preserve protein-DNA complexes.
Chromatin was digested by micrococcal nuclease to yield fragments ranging from
200 to 1000 base pairs. For immunoprecipitation, primary HIF-2α antibody and
normal rabbit IgG were used to incubate with the protein-DNA complexes at 4°C
overnight. A/G agarose resin was used to precipitate the fragments. The purified
DNA from ChIP samples and input DNA was subjected to qRT-PCR analysis. Based
on the published literature, primers were designed to span the identified hypoxia-
responsive element (HRE) in the promoter or intron of target genes (Liu et al., 1995;
Saito, et al., 2010), as follows: COL10A1 (HRE: +84 to +95bp; primer set -59 to
+121bp) forward primer 5’-GGGTAACCTCATGTAGTAAGGG-3’; reverse primer
5’- GCAAGTTAA CATGGAAGTCC-3’. MMP-13 (HRE: -106 to -101bp; primer
set –214 to –28 bp) forward primer 5’-GCCAGATGGGTTTTGAGAC-3’; reverse
primer 5’-ATAGGCCTGCAATGG TGAG -3’.VEGFA (HRE: -982 to -977 bp;
primer set –1,000 to–795 bp) forward primer 5’- GCCAGACTCCACAGTGCA-3’;
reverse primer5’- GCCTGCAGACATCAAAGTGAGC-3’. Control primer sets were
designed that are not spanned the HRE region of target genes, as follows:
COL10A1,−2,131to −1,900bp; MMP-13 , –4,797 to –4,551 bp; VEGFA, –4,685 to –
4,507 bp, respectively.

Chapter 3: Materials and Methods 45
3.16 STATISTICAL ANALYSIS
The results were generated from experiments with tissues or cells from multiple
donors, which detailed in the relevant chapters. Each condition was tested in
triplicate in each experiment, unless otherwise stated in the respective result chapters.
Data from qRT-PCR, Western blot and Mankin score were presented as means ±
standard error of mean (SEM). Analysis of variance was conducted by using a
general linear model and the donor was regarded as the random factor. p < 0.05 was
considered a statistically significant difference. If significant differences were
revealed among conditions, Student–Newman–Keuls (SNK) post hoc tests were used
for pairwise comparisons. Statistical analyses were performed by using Statistical
Package for Social Science (SPSS) version 21.0 software (SPSS Inc., Chicago,
USA).


Chapter 4: Profile of angiogenic and anti-angiogenic cytokines in OA cartilage 47
Chapter 4: Profile of angiogenic and anti-angiogenic cytokines in OA cartilage
4.1 INTRODUCTION
Angiogenesis is an essential physiological process during embryonic and postnatal
development and its regulation is finely balanced between endogenous pro-
angiogenic and anti-angiogenic factors (Bonnet & Walsh, 2005). Normal articular
cartilage remains avascular throughout life. During chondrocyte development,
angiogenesis is switched on and off at different stages. Angiogenesis is necessary for
endochondral ossification in the normal growth plate, during which hypertrophic
chondrocytes produce angiogenic factors, including VEGF, and induce vascular
invasion, a prerequisite for new bone formation (Bonnet & Walsh, 2005; Goldring,
2012; Las Heras, et al., 2012). However, anti-angiogenesis becomes dominant in
healthy mature cartilage, which contains a large amount of anti-angiogenic factors,
such as ChM-1, TSP-1, TIMPs and troponin-1 (Bonnet & Walsh, 2005; Patra &
Sandell, 2012).
Research has shown that in an osteoarthritic environment cartilage loses its ability to
remain avascular. Blood vessels and channels can be seen to invade from the
subchondral bone into the calcified and noncalcified cartilage in OA (Suri, et al.,
2007; Suri & Walsh, 2012). Earlier studies into angiogenic regulators have tended to
focus on the osteoarthritic synovium and synovial fluid (Bonnet & Walsh, 2005). It
has been observed that angiogenesis in the synovium of osteoarthritic joints –
manifested by increased endothelial cell proliferation, vascular density, macrophage
infiltration and increased VEGF abundance within synovium and synovial fluid –
closely associated with chronic synovitis in OA. However, there is a lack of studies
concerning ectopic angiogenesis in cartilage. In OA cartilage tissue, chondrocytes
are known to undergo hypertrophy, which is similar to growth plate development,
but it is not clear whether the angiogenic and anti-angiogenic equilibrium is
perturbed, and whether this imbalance could exacerbate cartilage degradation and
disease process.

48 Chapter 4: Profile of angiogenic and anti-angiogenic cytokines in OA cartilage
The hypothesis of this study is that cartilage shifts from a highly anti-angiogenic
phenotype towards angiogenic phenotype in osteoarthritis. To demonstrate this
hypothesis, firstly, the expression patterns of VEGFA and ChM-1 in severe OA and
mild OA cartilage were investigated, since VEGFA is the most potent angiogenic
factor and ChM-1 is the most abundant anti-angiogenic factor in cartilage. Then the
expression profiles of a panel of angiogenic and anti-angiogenic cytokines in OA
cartilage were studied using various cytokines arrays.
4.2 MATERIALS AND METHODS
Detailed descriptions of materials and methods used in this chapter are found in
Chapter 3. The following is a brief outline of the materials and methods used to
generate the data in this chapter.
4.2.1 Sample collection
Human articular cartilage samples were obtained from osteoarthritic patients
undergoing knee replacement surgery, as described in section 3.3.
4.2.2 Immunohistochemical staining
The isolated cartilage samples were fixed and sectioned to 5 µm thickness.
Immunohistochemical staining of ChM-1 and VEGFA in severe and mild OA
cartilage tissues were performed as described in section 3.4. Primary antibodies used
were: VEGFA (1:400) and ChM-1 (1:200). Immunohistochemical staining was
performed by using cartilage samples from three different OA donors.
4.2.3 Total RNA extraction and Angiogenesis qRT-PCR array
Total RNA from severe and mild OA cartilage tissues were extracted as described in
section 3.6. The RNAs were subjected to Angiogenesis qRT-PCR array analysis
(Qiagen), as described in section 3.8. Assays were performed in duplicate from two
different OA patients.
qRT-PCR was used to validate the array data by measuring expression levels of
selected genes of interest. For full details of reverse transcription of RNA and qRT-

Chapter 4: Profile of angiogenic and anti-angiogenic cytokines in OA cartilage 49
PCR analysis refer to section 3.7. Assays were performed in triplicate, with each
sample tested individually three times from three different OA patients.
4.2.4 Protein extraction and cytokine array
Protein from severe and mild OA cartilage tissues were extracted as described in
section 3.5.1. Western blot was performed to detect protein levels of angiogenic-
related cytokines of ChM-1, TIMP-1, TIMP-2, VEGFA and its receptor VEGFR2,
VEGFR3, hypertrophic marker RUNX2 and endogenous control GAPDH (refer to
section 3.5.2).
Protein level of angiogenic and inflammatory cytokines in severe and mild OA
cartilage were detected by Cytokine antibody membrane array (RayBiotech) as
described in section 3.9. Western blot and cytokine arrays were performed in
triplicate, with each sample tested individually twice from three different OA
patients.
4.2.5 Statistical analysis
The qRT-PCR assays were performed in triplicate with each treatment tested
individually three times from three different patients. The expression of the target
gene was first normalized to 18S. All data were converted to fold change relative to
the control (mild OA cartilage) and tested by one-way analysis of variance (ANOVA)
for statistical significance. A p-value of < 0.05 was regarded as significant.
For analysis of cytokine antibody membrane array, the spot values of each cytokine
were normalized to the positive control, i.e., the signal values of cytokines were
divided by the mean value of the positive control and multiplied with 100 (Positive
control can be used to normalize the results from different membranes being
compared). A value of 100 represents a spot intensity as shown in the positive
control, while a value of zero represents the spot intensity of the negative control.
The data were then analyzed by randomized block design ANOVA in which p < 0.05
was considered as statistically significant difference.

50 Chapter 4: Profile of angiogenic and anti-angiogenic cytokines in OA cartilage
4.3 RESULTS
4.3.1 Loss of ChM-1 in severe OA cartilage
Both VEGFA and ChM-1 were shown to be expressed in mild and severe OA
cartilage. Immunohistochemical staining showed that ChM-1 was expressed strongly
in mild OA cartilage and was distributed in the cytoplasm as well as in the
surrounding extracellular matrix. VEGFA expression was detectable in chondrocytes
in mild OA (Figure 4-1A). However, in severe OA cartilage, the intensity of ChM-1
staining was lower than that in mild OA cartilage, whereas VEGFA expression was
stronger than that in mild OA and distributed in both chondrocytes and the
surrounding matrix. Western blot analyses showed detectable levels of the mature
secretory form of ChM-1 (~25 kDa) in both mild and severe OA cartilages; however,
its expression was significantly lower in severe OA cartilage compared with mild OA
samples (Figure 4-1B and C). The expression of the anti-angiogenic factors TIMP-1
and TIMP-2 were down in the severe OA samples, whereas expression of the
angiogenic factors VEGFA, VEGFR2 and VEGFR3 were up in these samples. These
results suggested that loss of anti-angiogenic factor (ChM-1) and overabundance of
angiogenic factor (VEGFA) in severe OA cartilage.
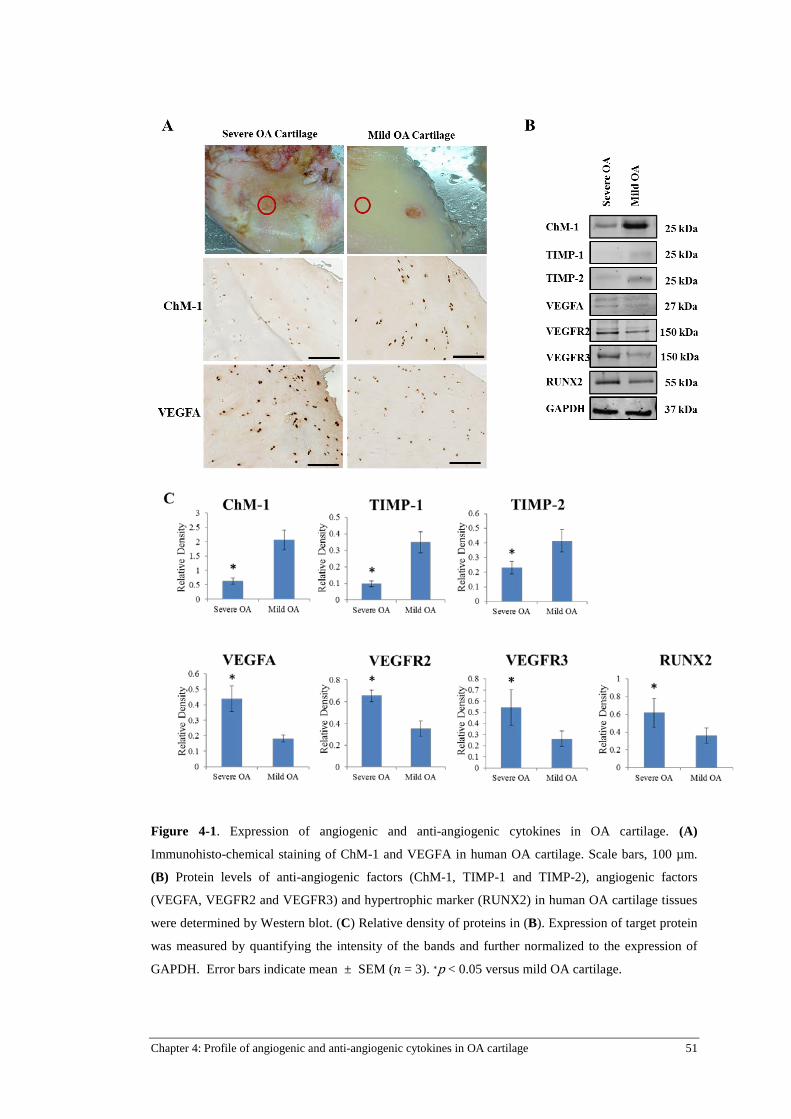
Chapter 4: Profile of angiogenic and anti-angiogenic cytokines in OA cartilage 51
Figure 4-1. Expression of angiogenic and anti-angiogenic cytokines in OA cartilage. (A)
Immunohisto-chemical staining of ChM-1 and VEGFA in human OA cartilage. Scale bars, 100 µm.
(B) Protein levels of anti-angiogenic factors (ChM-1, TIMP-1 and TIMP-2), angiogenic factors
(VEGFA, VEGFR2 and VEGFR3) and hypertrophic marker (RUNX2) in human OA cartilage tissues
were determined by Western blot. (C) Relative density of proteins in (B). Expression of target protein
was measured by quantifying the intensity of the bands and further normalized to the expression of
GAPDH. Error bars indicate mean ± SEM (𝑛 = 3). ∗p < 0.05 versus mild OA cartilage.
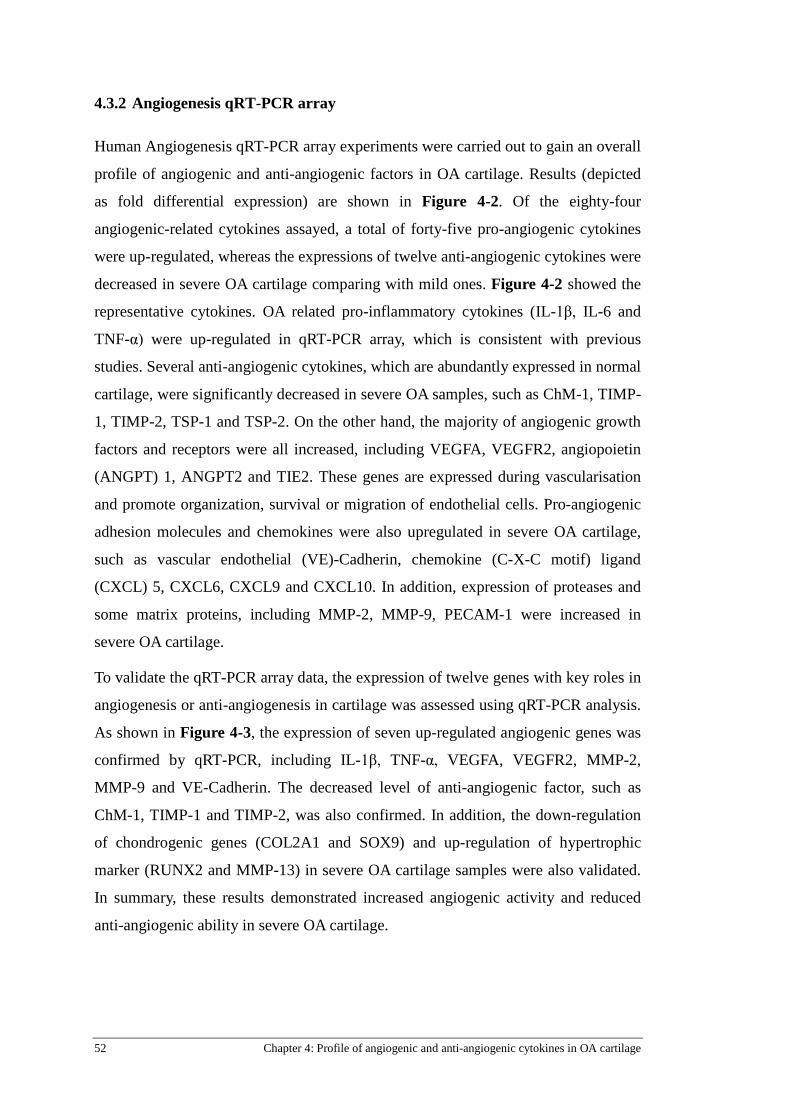
52 Chapter 4: Profile of angiogenic and anti-angiogenic cytokines in OA cartilage
4.3.2 Angiogenesis qRT-PCR array
Human Angiogenesis qRT-PCR array experiments were carried out to gain an overall
profile of angiogenic and anti-angiogenic factors in OA cartilage. Results (depicted
as fold differential expression) are shown in Figure 4-2. Of the eighty-four
angiogenic-related cytokines assayed, a total of forty-five pro-angiogenic cytokines
were up-regulated, whereas the expressions of twelve anti-angiogenic cytokines were
decreased in severe OA cartilage comparing with mild ones. Figure 4-2 showed the
representative cytokines. OA related pro-inflammatory cytokines (IL-1β, IL-6 and
TNF-α) were up-regulated in qRT-PCR array, which is consistent with previous
studies. Several anti-angiogenic cytokines, which are abundantly expressed in normal
cartilage, were significantly decreased in severe OA samples, such as ChM-1, TIMP-
1, TIMP-2, TSP-1 and TSP-2. On the other hand, the majority of angiogenic growth
factors and receptors were all increased, including VEGFA, VEGFR2, angiopoietin
(ANGPT) 1, ANGPT2 and TIE2. These genes are expressed during vascularisation
and promote organization, survival or migration of endothelial cells. Pro-angiogenic
adhesion molecules and chemokines were also upregulated in severe OA cartilage,
such as vascular endothelial (VE)-Cadherin, chemokine (C-X-C motif) ligand
(CXCL) 5, CXCL6, CXCL9 and CXCL10. In addition, expression of proteases and
some matrix proteins, including MMP-2, MMP-9, PECAM-1 were increased in
severe OA cartilage.
To validate the qRT-PCR array data, the expression of twelve genes with key roles in
angiogenesis or anti-angiogenesis in cartilage was assessed using qRT-PCR analysis.
As shown in Figure 4-3, the expression of seven up-regulated angiogenic genes was
confirmed by qRT-PCR, including IL-1β, TNF-α, VEGFA, VEGFR2, MMP-2,
MMP-9 and VE-Cadherin. The decreased level of anti-angiogenic factor, such as
ChM-1, TIMP-1 and TIMP-2, was also confirmed. In addition, the down-regulation
of chondrogenic genes (COL2A1 and SOX9) and up-regulation of hypertrophic
marker (RUNX2 and MMP-13) in severe OA cartilage samples were also validated.
In summary, these results demonstrated increased angiogenic activity and reduced
anti-angiogenic ability in severe OA cartilage.

Chapter 4: Profile of angiogenic and anti-angiogenic cytokines in OA cartilage 53
Figure 4-2. Human Angiogenesis qRT-PCR array on OA cartilage tissue. Columns represent fold
changes of individual gene expression between severe and mild OA cartilage. Upper columns (> 1.00)
represent up-regulated genes, lower columns (< 1.00) genes means down-regulated genes. Result is
one representative data from two independent experiments, which showed similar results.

54 Chapter 4: Profile of angiogenic and anti-angiogenic cytokines in OA cartilage
Figure 4-3. qRT-PCR validation of differential expressed genes in severe OA cartilage identified by
angiogenesis qRT-PCR array analysis. (A) Expression of angiogenic and anti-angiogenic genes in
mild and severe OA cartilage. (B) Expression of chondrogenic (COL2A1 and SOX9) and
hypertrophic markers (RUNX2 and MMP-13) in mild and severe OA cartilage. The results were
generated from experiments with tissues from three OA donors. Assays were performed in triplicate,
with each sample tested individually three times. The expression of the target gene was first
normalized to 18S and then further converted to the fold change of the control (mild OA cartilage).
Error bars indicate mean ± SEM (𝑛 = 3). ∗p < 0.05 versus mild OA cartilage.

Chapter 4: Profile of angiogenic and anti-angiogenic cytokines in OA cartilage 55
4.3.3 Cytokine profile of human OA cartilage
The protein level of angiogenic cytokines were further confirmed using human
cytokine antibody arrays. Cytokine analysis was conducted in three sets of samples,
comprising three severe and mild OA samples pairs. The array configuration is
shown in Figure 4-4; all cytokines were assayed in duplicates. The complete
cytokine profile of cartilage tissues is shown in Table 4-1. Of all the fifty-four
cytokines, forty-nine had elevated expression levels in severe OA cartilage.
Densitometric analysis revealed that twenty-one reached statistical significance (p <
0.05). However, none of the down-regulated cytokines showed statistically
significant differences.
Functional analysis of these cytokines showed that up-regulated cytokines in severe
OA cartilage are mostly related to angiogenic growth factors, cell migration related
cytokines, adhesion molecules and pro-inflammatory interleukins (Table 4-1). As
shown in Figure 4-5, several potent angiogenic growth factors and receptors were
significantly increased, including VEGFR2, VEGFR3, TIE1 and TIE2, which are
consistent with the qRT-PCR array result. Functionally, within the list of increased
cytokines given in Figure 4-5, there were pro-angiogenic secreted molecules (PDGF
AA, PDGF-AB, TGF-β2), cell surface receptors (PDGF-R alpha), pro-angiogenic
adhesion molecules (VE-Cadherin), chemokines (IP-10/CXCL10, SDF-1β), and
enzymatic extracellular matrix molecules and matrix proteins (MMP-9, PECAM-1).
In summary, these data support the angiogenic qRT-PCR array results that the
majority of angiogenic factors are up-regulated in severe OA environment, indicating
the importance of regulatory cytokines of angiogenesis in OA pathogenesis.
In addition, signalling pathway analysis was performed to clarify the relation of the
differentially expressed cytokines to the well-documented biological pathways.
Result was summarized in Table 4-2. Several related signalling pathways were
identified in severe OA cartilage tissue, including MAPK, nuclear factor-kappa B
(NF-κB), TGF-β and Janus kinase/signal transducers and activators of transcription
(JAK/STAT) signalling pathways. These results provide further insights into the
identification of signalling pathways responsible for cartilage degradation in severe
OA.

56 Chapter 4: Profile of angiogenic and anti-angiogenic cytokines in OA cartilage
Figure 4-4. Cytokine profiles in severe and mild OA cartilage. Representative cytokine antibody array
membranes showing the cytokine profile of cartilage derived from severe OA (A) and mild OA (B)
cartilage. The respective cytokines of each dot are showed in C. Positive controls are used as loading
control, which serves to normalize the results from different membranes being compared. Cytokine
antibody array were performed in triplicate, with each sample tested individually twice from three
different OA patients. Result is one representative data from three independent experiments, which
showed similar trends.

Chapter 4: Profile of angiogenic and anti-angiogenic cytokines in OA cartilage 57
Figure 4-5. Relative expression of angiogenic cytokines in severe and mild OA cartilage. Human
cartilage samples were collected from three osteoarthritic patients undergoing knee replacement
surgery. Cytokine antibody array were performed in triplicate, with each sample tested individually
twice from three different OA patients. For analysis, the spot values of each cytokines were divided by
the mean value of the positive control and multiplied with 100. A value of 100 represents a spot
intensity as shown in the positive control, while a value of zero represents the spot intensity as seen in
the negative control. And then the data are analyzed by randomized block design ANOVA. *p < 0.05,
significant difference between severe and mild OA cartilage.

58 Chapter 4: Profile of angiogenic and anti-angiogenic cytokines in OA cartilage
Table 4-1. Profile of cytokines in OA cartilage (Classified by function)
Cytokines Severe/Mild Ratio
p-value Cytokines Severe/Mild Ratio
p-value
Angiogenic growth factor and receptors Adhesin molecules VEGFR2* 1.4535 0.0297 ALCAM 0.9909 0.9563 VEGFR3* 1.2416 0.0144 L-Selectin* 1.4551 0.0107 PDGF AA* 1.4325 0.0198 PECAM-1* 1.8224 0.0284 PDGF-AB* 1.6895 0.0010 E-Selectin 1.0032 0.9846 PDGF R alpha* 2.5098 0.0082 ICAM-2 1.0428 0.8027 PDGF R beta 1.2514 0.1810 VE-Cadherin* 1.8010 0.0010 Tie-1* 1.7604 0.0162 Tie-2* 1.3940 0.0191 Interleukins TGF-alpha* 1.4044 0.0037 IL-1R2 1.2747 0.1477 IGF-2 1.1845 0.2387 IL-2R beta 1.2011 0.1148 Endoglin 1.1193 0.1460 IL-2R gamma* 1.3905 0.0079 IL-5R alpha 0.9103 0.4086 MMPs IL-9 1.1239 0.4263 MMP-1 1.1553 0.1086 IL-10Rbeta 1.3540 0.1980 MMP-3 1.0104 0.9139 IL-13 R alpha 2 1.1649 0.1773 MMP-9* 1.5024 0.0299 IL-18 BP alpha 1.2974 0.0817 MMP-13* 1.3219 0.0135 IL-18Rbeta 1.1102 0.2797 TIMP-4* 1.4137 0.0196 IL-21R* 1.3901 0.0205 Cardiotrophin-1 1.2335 0.1896 Osteogenic related cytokines LIF 1.1865 0.2367 Activin A 1.0736 0.4987 BMP-5 1.1205 0.2474 Others BMP-7 1.0793 0.4281 B7-1(CD80) 0.9916 0.9531 TGF beta 2* 1.4099 0.0010 CD14 1.2173 0.1782 LAP 1.0547 0.6837 DR6(TNFRSF21) 1.0968 0.5360 ErbB3 0.9943 0.9685 Cell migration related cytokines Fas Lignad 0.9181 0.6488 IP-10* 1.1921 0.0279 Leptin R 1.0922 0.6177 SDF-1beta* 1.5849 0.0123 M-CSF R 1.4635 0.0620 CXCL16 1.1403 0.0737 NGF R* 1.4551 0.0092 MPIF-1 1.1863 0.2566 Prolactin 1.3435 0.1815 SCF R* 1.4218 0.0029 Siglec-5* 1.6277 0.0000
Data showed fold change of severe OA cartilage compared to the mild OA cartilage after
densitometric analysis and normalization. *p < 0.05, significant difference between severe and mild
OA cartilage.

Chapter 4: Profile of angiogenic and anti-angiogenic cytokines in OA cartilage 59
Table 4-2. Profile of cytokines in OA cartilage (Classified by signalling pathway)
Cytokines Severe/Mild Ratio
P-value Cytokines Severe/Mild Ratio
P-value
MAPK JAK/STAT3 DR6(TNFRSF21) 1.0968 0.5360 IL-1R2 1.2747 0.1477 IL-1R2 1.2747 0.1477 IL-2R beta 1.2011 0.1148 IL-2R beta 1.2011 0.1148 IL-2R gamma* 1.3905 0.0079 IL-2R gamma* 1.3905 0.0079 IL-10Rbeta 1.3540 0.1980 IL-18 BP alpha 1.2974 0.0817 IL-13 R alpha 2 1.1649 0.1773 IL-18Rbeta 1.1102 0.2797 IL-18 BP alpha 1.2974 0.0817 MMP-1 1.1553 0.1086 IL-18Rbeta 1.1102 0.2797 MMP-3 1.0104 0.9139 IL-21R* 1.3901 0.0205 MMP-9* 1.5024 0.0299 MMP-1 1.1553 0.1086 MMP-13* 1.3219 0.0135 MMP-3 1.0104 0.9139 LIF 1.1865 0.2367 MMP-9* 1.5024 0.0299 MMP-13* 1.3219 0.0135 NF-κB VEGFR2* 1.4535 0.0297 Fas Lignad 0.9181 0.6488 VEGFR3* 1.2416 0.0144 IL-1R2 1.2747 0.1477 PDGF R alpha* 2.5098 0.0082 IL-10Rbeta 1.3540 0.1980 PDGF R beta 1.2514 0.1810 MMP-1 1.1553 0.1086 TGF beta 2* 1.4099 0.0010 MMP-3 1.0104 0.9139 B7-1(CD80) 0.9916 0.9531 MMP-9* 1.5024 0.0299 Cardiotrophin-1 1.2335 0.1896 MMP-13* 1.3219 0.0135 IP-10* 1.1921 0.0279 Cardiotrophin-1 1.2335 0.1896 Leptin R 1.0922 0.6177 DR6(TNFRSF21) 1.0968 0.5360 LIF 1.1865 0.2367 SDF-1beta* 1.5849 0.0123 TGF-alpha* 1.4044 0.0037 TGF-β Activin A 1.0736 0.4987 BMP-5 1.1205 0.2474 BMP-7 1.0793 0.4281 Endoglin 1.1193 0.5395 TGF beta 2* 1.4099 0.0010
Data showed fold change of severe OA cartilage compared to the mild OA cartilage after
densitometric analysis and normalization. *p < 0.05, significant difference between severe and mild
OA cartilage.
60 Chapter 4: Profile of angiogenic and anti-angiogenic cytokines in OA cartilage
4.4 DISCUSSION
The balance between angiogenic and anti-angiogenic factors is critical for cartilage
homeostasis (Bonnet & Walsh, 2005; Shukunami, et al., 1999a; Shukunami, et al.,
2008). In normal articular cartilage, anti-angiogenic factors play a dominant role in
maintaining homeostasis, as in physiological condition cartilage is essentially devoid
of vascular structure. However, this property seemed to be lost in OA cartilage.
ChM-1 is reported to play an important role in the resistance of cartilage to
angiogenesis. During the developmental phase, the gene transcript of ChM-1 is
maintained at a high level in the avascular zones of bone rudiments, including the
resting, proliferating and early hypertrophic zones (Shukunami, et al., 2008). In
contrast, its expression is abolished in the lower hypertrophic and calcified zones of
cartilage, allowing vascular invasion and initiation of endochondral bone formation
(Shukunami & Hiraki, 1998; Shukunami, et al., 1999a). Although ChM-1 null mice
show no obvious phenotype in terms of cartilage and vasculogenesis (Brandau, et al.,
2002), adult ChM-1 null mice exhibit delayed chondrocyte maturation in the
periosteal callus, aberrant cartilage formation during fracture repair (Yukata, et al.,
2008), and marked reduction in bone remodelling (Nakamichi, et al., 2003),
indicating that ChM-1 may participate in the maintenance of the chondrocyte
phenotype. An earlier study showed decreased ChM-1 expression in early stages of
experimental rat OA, even prior to the loss of COL2 (Hayami, et al., 2003),
indicating loss of ChM-1 might be an early event in cartilage degradation. My results
also showed that ChM-1 protein and mRNA was highly expressed in relatively
healthy human cartilage, which is consistent with the physiological function of ChM-
1, but it was markedly down-regulated in late stage of OA, which may contribute to
osteochondral angiogenesis. The involvement of ChM-1 in chondrogenesis and
chondrocyte hypertrophy is investigated in the following chapter.
To be noticed, human ChM-1 precursor is a 334 amino acids transmembrane protein,
and mature ChM-1 is the C-terminal portion of its precursor, which is secreted from
the chondrocytes and distributed in the cartilage matrix. In this study, ChM-1
antibodies (C-20, sc-20310; H-300, sc-33563) were used to verify the protein
expression. The former antibody epitope mapping corresponds to near the C-
terminus of ChM-1, and the later one corresponds to 1-300 mapping at the N-
terminal of ChM-1 of human origin, which means these two antibodies can detect

Chapter 4: Profile of angiogenic and anti-angiogenic cytokines in OA cartilage 61
both of the precursor and mature ChM-1 protein in cells and tissues.
The imbalanced gene profile of angiogenic and anti-angiogenic factors in severe OA
cartilage were demonstrated in this study. Angiogenesis qRT-PCR array analysis (by
using cartilage from two donors) showed a trend that down-regulation of various
anti-angiogenic factors (ChM-1, TIMP-1, TIMP-2, TSP-1, TSP-2) in severe OA
cartilage and up-regulation of angiogenic molecules, providing further evidence that
the phenotype of cartilage shifts from highly anti-angiogenic property to angiogenic
potential in osteoarthritis. Quantitative RT-PCR was used to validate the array data
by measuring expression levels of selected genes of interest, and the data confirmed
the significantly up-regulated angiogenic genes, including IL-1β, TNF-α, VEGF,
VEGFR2, MMP-2, MMP-9 and VE-Cadherin and the significantly decreased level of
anti-angiogenic factor, such as ChM-1, TIMP-1 and TIMP-2. Although a few
angiogenic inhibitors were increased in OA, e.g. TIMP-3 and PF4, such increases
appear insufficient to prevent vascular invasion. Expression of VEGFR2, PECAM-1,
VE-Cadherin, ANGPT2, TIE2, AKT, CXCL5, CXCL6, PF4 and ANGPTL4, whose
relationship with osteoarthritis has never been reported, was altered in late OA
cartilage. The altered angiogenic profile in OA cartilage not only explains the
observed invasion of blood vessels, but may also indicate loss of anti-angiogenic
phenotype may be one of the most important characteristics of OA cartilage and its
role in cartilage destruction has been underestimated. These angiogenic factors may
be associated with the OA pathogenesis. For instance, VEGF is chemotactic for
osteoblasts and also a mediator for osteophyte formation and subchondral
mineralization (Gerber et al., 1999). VEGF stimulation of chondrocytes induced
VEGFR2 phosphorylation, activation of the MAPK-ERK 1/2, and long-lasting
activation of the transcription factor activator protein-1 (AP-1) (Pufe, et al., 2004a;
Pufe, et al., 2004b). VEGF also increased secreted MMP-1, MMP-3 and MMP-13
from chondrocytes, but diminished the expression of TIMP-1 and TIMP-2 (Pufe, et
al., 2004a).
Furthermore, I have identified up-regulation of other important pro-angiogenic
factors such as angiopoietin-Tie system. Apart from the VEGF system, the Tie
receptors and their angiopoietin ligands have been identified as the second vascular
tissue-specific receptor Tyrosine kinase system (Augustin et al., 2009). This system
enhances remodelling of blood vessels or survival of endothelial cells via

62 Chapter 4: Profile of angiogenic and anti-angiogenic cytokines in OA cartilage
phosphatidylinositol (PI) 3-kinase/Akt or ERK/MAPK signalling pathway (Augustin,
et al., 2009). A study in rheumatoid arthritis showed that angiopoietin-1 could
directly potentiate synovium overgrowth and degradation of the cartilaginous matrix
via ERK/MAPK and PI 3-kinase/Akt pathways (Hashiramoto et al., 2007). In OA
progression, both the ERK/MAPK pathway and the PI 3-kinase/Akt pathway are
activated. Therefore, the up-regulated angiopoietin-1, angiopoietin-2 and their
receptor Tie in OA may have direct effect on chondrocytes and mediate cartilage
destruction through these signalling pathways. In addition to angiogenic growth
factors, neovascularisation also depends on ECM proteolysis by MMPs, which are
negatively regulated by TIMPs (Kapoor, et al., 2011; Pufe, et al., 2004a). In this
experiment, the increased expression of MMP-2 and MMP-9 and decreased level of
TIMP-1, TIMP-2 in OA joints support the potential role of these MMPs in promoting
vascular invasion as an important step in OA pathogenesis.
Chemokines, a large family of chemotactic cytokines, exert their function as
chemoattractants for leukocytes, recruiting monocytes, neutrophils and other effector
cells to sites of tissue damage (Endres et al., 2010). Most chemokines are
inflammatory and are released in response to pro-inflammatory cytokines such as IL-
1β. This study demonstrated that chemokines PF4, CCL11, CXCL1, CXCL10 (IP-
10), CXCL3, CXCL5, CXCL6, CXCL9 and SDF-1β were significantly up-regulated
in OA cartilage. The protein level of CXCL16 was surprisingly high both in OA and
normal cartilage, suggesting that this chemokine may have an impact in cartilage
homeostasis, except for its immunological function. The well-known chemokine
CXCL12/SDF-1 could significantly induce proliferation and COL1 expression in
osteoblasts from osteoarthritis patients (Lisignoli et al., 2006). Endres’s study
demonstrated that CCL25, CXCL10 and CXCL1 effectively stimulated migration of
human subchondral progenitor cells, which presumably would enter the cartilage
defect and form cartilaginous repair (Endres, et al., 2010). However, the potential
role and mechanisms of chemokines in the destruction of cartilage in osteoarthritis
still requires further investigations.
In conclusion, the decrease in ChM-1 and increase in VEGFA expression, as well as
the changed profile of other angiogenesis-related cytokines, occurred in the late stage
of OA, suggesting that OA progression might be correlated with the imbalanced
angiogenesis in OA cartilage. However, whether the anti-angiogenic factors

Chapter 4: Profile of angiogenic and anti-angiogenic cytokines in OA cartilage 63
contribute to the maintenance of the chondrocyte phenotype is largely unknown.
Therefore, the function and regulatory mechanisms of ChM-1 during cartilage
degradation in OA are investigated in the next chapter of the study.


Chapter 5: Role of ChM-1 during chondrocyte hypertrophy and its therapeutic efficacy in OA progression in vitro and in vivo 65
Chapter 5: Role of ChM-1 during chondrocyte hypertrophy and its therapeutic efficacy in OA progression in vitro and in vivo
5.1 INTRODUCTION
Articular cartilage is an avascular tissue by nature, in which the resident
chondrocytes maintain stable phenotype that avoids hypertrophy and angiogenesis
throughout life. Several growth factors, such as TGF-β family, have been proposed to
be essential for chondrocyte differentiation and cartilage development (Goldring, et
al., 2006; Lafont, et al., 2008). But TGF-β is not exclusively expressed in cartilage
tissue and furthermore, intra-articular supplement of TGF-β results in osteoarthritis-
like changes and osteophyte formation (Bakker, et al., 2001; Van Beuningen, et al.,
2000; Van Beuningen, et al., 1994), which may deny its importance in maintaining
mature cartilage. Articular cartilage may, therefore, possess its own intrinsic factors
to maintain its phenotype. Cartilage is known to contain considerable amounts of
anti-angiogenic factors, such as ChM-1, TSPs, TIMPs and troponin-1, which are
extensively expressed in chondrocyte cytoplasm and cartilage matrix (Bonnet &
Walsh, 2005; Patra & Sandell, 2012). In pathological conditions such as OA,
cartilage loses the anti-angiogenic potential with decreased abundance of ChM-1. In
OA cartilage, hypertrophy markers including COL10A1, MMP-13 and RUNX2 are
up-regulated, leading to matrix degradation and disruption of homeostasis (Hirata, et
al., 2012; Kapoor, et al., 2011; Li, et al., 2011; Murphy & Lee, 2005). However, the
contribution of anti-angiogenic factors in the maintenance of chondrocyte phenotype
is largely unknown.
ChM-1 is a 121-amino acid glycoprotein derived from a transmembrane precursor
and distributed mainly in interstitial space of cartilage matrix (Hiraki, et al., 1997a;
Shukunami & Hiraki, 1998). The inhibition of angiogenesis by ChM-1 in cartilage,
endothelial cells, cardiac valves and several tumors has been well documented
(Hayami, et al., 1999; Miura, et al., 2010; Yoshioka, et al., 2006). The regulatory
effect of ChM-1 in cartilage development was verified by genetically modified mice.

66 Chapter 5:Role of ChM-1 during chondrocyte hypertrophy and its therapeutic efficacy in OA progression in vitro and in vivo
In vivo, ChM-1 null mice exhibit delayed chondrocyte maturation in the periosteal
callus, aberrant cartilage formation during fracture repair (Yukata, et al., 2008), and
marked reduction in bone remodelling (Nakamichi, et al., 2003).
Due to the short half-life of recombinant ChM-1 protein, genetic manipulation
method was always utilized to provide a more efficient delivery of ChM-1 to cells or
tissues (Klinger, et al., 2011; Yoshioka, et al., 2006). Among contemporary vector
systems, adeno-associated virus (AAV) and lentivirus (LV) hold a particular promise
for therapeutic potential (Fleming et al., 2001). These vectors possess the capacity to
transduce both of dividing cells and non-dividing cells and to obtain the efficient
gene transfer (Fleming, et al., 2001; Kaplitt et al., 1994). A recent study
demonstrated that application of AAV-ChM-1 in micro-fractured porcine cartilage
lesions stimulated chondrogenic differentiation of ingrowing progenitor cells and
inhibited excessive endochondral ossification via an unknown mechanism,
suggesting that ChM-1 is involved in chondrocyte phenotype changes associated
with transitions to a hypertrophic tendency (Klinger, et al., 2011). In this study,
lentivirus vectors carrying ChM-1 complementary DNA (LV-ChM-1) was used to
overexpress ChM-1 in chondrocytes and cartilage tissues. The rational for choosing
lentivirus is the fact that it belongs to Retroviridae family, which can integrate the
gene with the host genome to produce a more stable and sustained gene transfer
(Fleming, et al., 2001).
The hypothesis of this chapter is that the anti-angiogenic factor is essential in
maintaining the physiological functions of chondrocytes and preventing hypertrophy
in OA progression. Therefore, the involvement of ChM-1 in chondrogenesis and
inflammatory cytokine-induced hypertrophy were studied by using gene transfer of
LV-ChM-1 vector or ChM-1 siRNA in chondrocyte in vitro; the role of ChM-1 in
OA progression in vivo was investigated with rat OA model.
5.2 MATERIALS AND METHODS
Details of materials and methods used in this chapter are described in Chapter 3. The
following is a brief outline of the materials and methods used to generate the data in
this chapter.

Chapter 5: Role of ChM-1 during chondrocyte hypertrophy and its therapeutic efficacy in OA progression in vitro and in vivo 67
5.2.1 Cell culture and chondrogenic differentiation
Articular cartilage and bone marrow were obtained from osteoarthritic patients
undergoing knee replacement surgery. For chondrocyte isolation, cartilage slices
from macroscopically healthy parts of the anterior compartment of femoral condyles,
which showed smooth surface, were digested as described in section 3.10.1. The
human bone marrow stromal cells (BMSCs) were isolated as described in section
3.10.1. Freshly isolated articular cartilage chondrocytes (ACCs) and BMSCs were
expanded in monolayer culture in humidified air with 5% CO2 at 37°C. ACCs at
passage 1 and BMSCs at passage 3 were used in the subsequent experiments.
To determine the role of ChM-1 during chondrogenesis, in vitro chondrogenic
differentiation of ACCs and BMSCs using a pellet culture method were performed as
described in section 3.10.2. Pellet cultures were harvested at 7, 14 and 21 days for
histological, immunohistochemical staining as described in section 3.4. Gene
expression of ChM-1, VEGFA and chondrogenic markers (COL2A1, SOX9 and
ACAN) were detected by qRT-PCR as described in section 3.7. Assays of pellet
culture were performed in triplicate, with each sample tested individually three times
from three different OA patients.
5.2.2 Lentivirus and siRNA transfections
To determine the role of ChM-1 in chondrocyte hypertrophy in OA, LV-ChM-1 and
ChM-1 siRNA were constructed to respectively overexpress and down-regulate
ChM-1. Lentivirus vector carrying ChM-1 cDNA were constructed and produced as
described in section 3.11. Lentivirus titration was determined by flow cytometry.
In mono-layer-cultured model, ACCs were infected with LV-ChM-1 or LV-GFP
(serves as empty vector control) for 48 h. Then the transfected cells were stimulated
with TNF-α for 48 h. Non-transfected ACCs without TNF-α stimulation serves as
empty control. Subsequently, samples were harvested for qRT-PCR and Western blot
analysis, as described in sections 3.7 and 3.5, respectively. To knockdown ChM-1
expression in chondrocytes, ACCs were transfected with ChM-1 siRNA and
scrambled siRNA at 100 nM using Lipofectamine 2000, as described in section 3.12.
Twenty-four hours after transfection, cells were subjected to TNF-α stimulation for
48 h. Subsequently, samples were harvested for qRT-PCR and Western blot analysis,

68 Chapter 5:Role of ChM-1 during chondrocyte hypertrophy and its therapeutic efficacy in OA progression in vitro and in vivo
as described in section 3.7 and 3.5, respectively.
For pellet cultures, ACCs were first infected by LV-ChM-1 or LV-GFP in monolayer
culture and then cells were digested and centrifuged to form pellets, following the
protocols in section 3.10.2. After 21 days, pellets were harvested and subjected to
qRT-PCR and Western blot analysis, as described in section 3.7 and 3.5, respectively.
Data generated from this part were from three independent experiments, with each
sample tested individually three times from three OA donors.
5.2.3 Animal OA model
Experimental osteoarthritis was induced in Wistar rats by surgically removal of
mesial meniscus (menisectomy, MSX) of the right knee. Intra-articular injection of
50 μL lentivirus (LV-ChM-1 or LV-GFP) or PBS was performed four times post OA
surgery (on 8, 12, 16 and 20 days, respectively), and knee joints were collected at 5-
weeks and 9-weeks post-OA surgery for histology analysis and RNA extraction. LV-
GFP was used as an empty vector control. Further details are described in section
3.13.1. Nine rats were used for each group. In each group, six rat joint samples were
processed for histological analysis and three samples were preserved for RNA
extraction.
5.2.4 Histological and immunohistochemical staining
The isolated rat right knee joints were fixed and sectioned to 5 µm thickness.
Safranin-O staining was used to evaluate OA severity as described in section 3.13.2.
Mankin’s histologic grading system (Mankin score, 0 to 14) were used to evaluate
OA severity in tibial plateau. Frozen sections (8 µm) were prepared to visualize GFP
fluorescence in LV-GFP infected knee cartilage and viewed under confocal
microscopy. The infection efficacy of LV-ChM-1 was evaluated by
immunohistochemical staining of ChM-1 and V5-tag in rat OA cartilage. The
expression of chondrogenic and hypertrophic markers, including COL2A1, aggrecan,
MMP-13, COL10A1 and VEGFA were also evaluated by immunohistochemical
staining as described in section 3.13.2.
5.2.5 Detection of gene expression in OA rat cartilage
To determine gene expression of ChM-1 and hypertrophic markers (VEGFA,

Chapter 5: Role of ChM-1 during chondrocyte hypertrophy and its therapeutic efficacy in OA progression in vitro and in vivo 69
COL10A1 and MMP-13), total RNA was extracted from experimental osteoarthritis
rat cartilages (5-weeks group), as described in section 3.13.3. Gene expressions were
detected by qRT-PCR as described in section 3.7. Primers for the target genes are
listed in Table 3-1. Assays were performed in triplicate, with samples from three
rats.
5.2.6 Statistical analysis
All the data, including qRT-PCR and Mankin score, were presented as means ± SEM
and were analysed using one-way ANOVA. If significant differences were revealed
among conditions, SNK post hoc tests were used for pairwise comparisons. Analysis
was performed using SPSS version 21.0 software. p-value < 0.05 were considered to
be statistically significant difference.
5.3 RESULTS
5.3.1 ChM-1 was positively correlated with chondrogenic differentiation
ACCs and BMSCs are the major seed cells for intrinsic cartilage repair and tissue
engineering, therefore the expression of ChM-1 and VEGFA in chondrogenesis was
investigated by pellet culture of ACCs and BMSCs. Significantly increased ChM-1
expression was observed during the chondrogenic differentiation of ACCs with more
intensive staining in the 3-weeks pellets compared to that in 1-week pellets. Gene
expression of ChM-1 and COL2A1 was also increased gradually with time of
chondrogenic differentiation, while VEGFA expression decreased commensurately
with time (Figure 5-1A). At the 3-weeks’ time-point, histological analysis showed
that a significant increased matrix deposition in ACCs pellets with stronger intensity
of Safranin-O staining compared to BMSCs pellets (Figure 5-1B). Immuno-
histochemical staining for ChM-1 and COL2A1 showed a stronger staining pattern in
ACCs pellet than BMSCs pellet. Conversely, BMSCs pellets showed higher VEGFA
expression than ACCs pellets. These observations were further confirmed by the
gene expression showing a higher level of ChM-1, COL2A1, ACAN and SOX9, and
lower level of VEGFA in ACCs pellets than BMSCs pellets. The result demonstrated
the consistency of ChM-1 expression with chondrogenic markers and that cartilage

70 Chapter 5:Role of ChM-1 during chondrocyte hypertrophy and its therapeutic efficacy in OA progression in vitro and in vivo
derived cells have higher constituent ChM-1 expression than that in BMSCs.
Figure 5-1. Expression of chondrogenic and angiogenic-related markers in chondrogenic
differentiation of ACCs and BMSCs. (A) Immunohistochemical staining of ChM-1 and qRT-PCR
analysis of ChM-1, VEGFA and COL2A1 gene expression in pellet culture of ACCs for 1, 2 and 3-
weeks. Values are mean ± SEM (n = 3). *p < 0.05 versus week 1. (B) Safranin-O staining and
immunohistochemical staining of COL2A1, ChM-1 and VEGFA in pellet culture of ACCs or BMSCs
for 3-weeks. Gene expression of chondrogenic markers (COL2A1, ACAN, SOX9) and angiogenic-
related cytokines (ChM-1, Endostatin and VEGFA) were measured by qRT-PCR. Values are mean ±
SEM (n = 3). *p < 0.05 versus ACCs group. Scale bars, 100 µm.
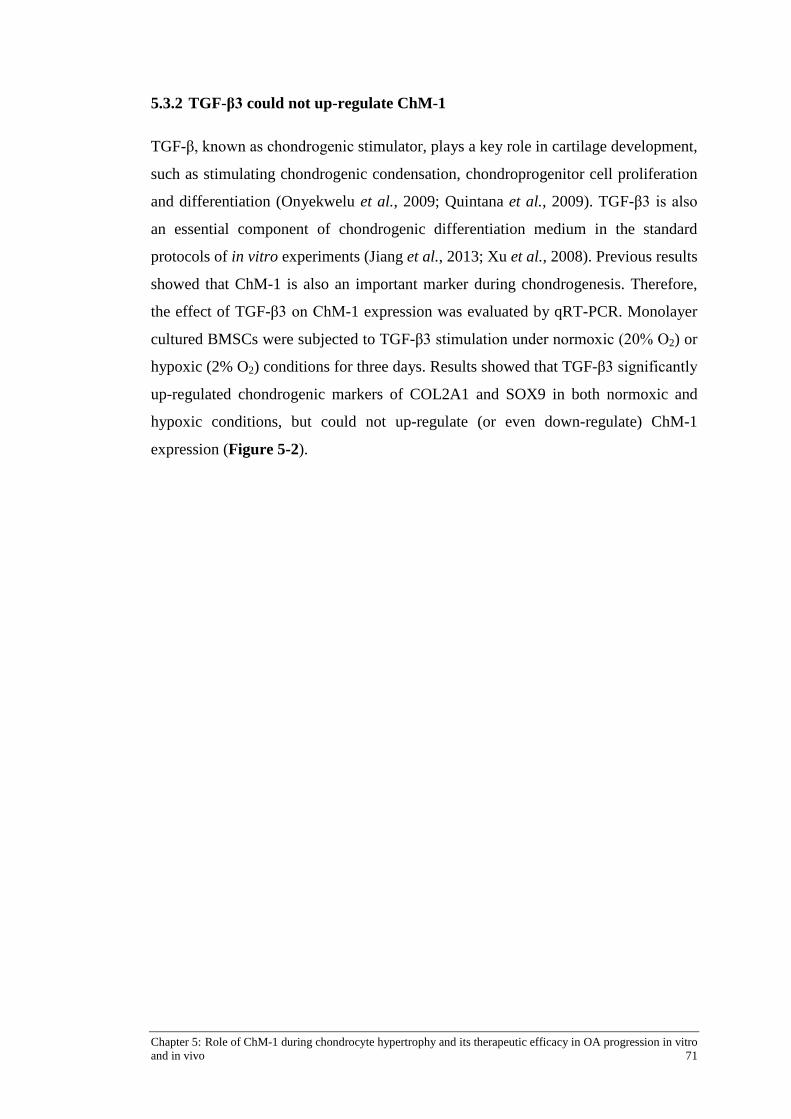
Chapter 5: Role of ChM-1 during chondrocyte hypertrophy and its therapeutic efficacy in OA progression in vitro and in vivo 71
5.3.2 TGF-β3 could not up-regulate ChM-1
TGF-β, known as chondrogenic stimulator, plays a key role in cartilage development,
such as stimulating chondrogenic condensation, chondroprogenitor cell proliferation
and differentiation (Onyekwelu et al., 2009; Quintana et al., 2009). TGF-β3 is also
an essential component of chondrogenic differentiation medium in the standard
protocols of in vitro experiments (Jiang et al., 2013; Xu et al., 2008). Previous results
showed that ChM-1 is also an important marker during chondrogenesis. Therefore,
the effect of TGF-β3 on ChM-1 expression was evaluated by qRT-PCR. Monolayer
cultured BMSCs were subjected to TGF-β3 stimulation under normoxic (20% O2) or
hypoxic (2% O2) conditions for three days. Results showed that TGF-β3 significantly
up-regulated chondrogenic markers of COL2A1 and SOX9 in both normoxic and
hypoxic conditions, but could not up-regulate (or even down-regulate) ChM-1
expression (Figure 5-2).

72 Chapter 5:Role of ChM-1 during chondrocyte hypertrophy and its therapeutic efficacy in OA progression in vitro and in vivo
Figure 5-2. Gene expression of ChM-1, COL2A1 and SOX9 in BMSCs in response to TGF-β3.
Monolayer cultured BMSCs were subjected to TGF-β3 stimulation under normoxia (20% O2) or
hypoxia (2% O2) condition for 3 days, and gene expression were detected by qRT-PCR. Data showed
that TGF-β3 significantly up-regulated chondrogenic markers of COL2A1 and SOX9 in both
normoxia and hypoxia conditions, but had no effect or decreased ChM-1 expression. Values are mean
± SEM (n = 3). *p < 0.05 versus blank group in normoxia, # p < 0.05 versus blank group in hypoxia.

Chapter 5: Role of ChM-1 during chondrocyte hypertrophy and its therapeutic efficacy in OA progression in vitro and in vivo 73
5.3.3 Lentivirus ChM-1 production and infection efficacy
Lentivirus vector carrying ChM-1 cDNA was constructed and produced to
overexpress ChM-1 in target cells (that is ACCs in this experiment). Briefly, human
chondromodulin-1 cDNA was isolated from human chondrocytes and amplified by
PCR with the SpeΙ and XhoΙ restriction enzyme cutting site inducted (Figure 5-3).
The amplified segment was subcloned into the plasmid pLenti6/V5 (Figure 5-4)
under the control of the CMV promoter. The insert was confirmed by both
restriction-enzyme digestion (Figure 5-5) and DNA sequencing. The resulting
plasmid pLenti6/V5-ChM-1 was used for the production of lentivirus vector to
deliver ChM-1 cDNA into the target cells. Plasmid pLentiLox 3.7 (pLL3.7) with
GFP was used as empty control vector. Subsequently, lentivirus was packaged by
using HEK293T cell line and then concentrated for further experiments. During
lentivirus production, GFP fluorescence could be detected in pLL3.7 GFP transfected
HEK293T cells (Figure 5-6).
Lentivirus titration was performed by using serial dilution of concentrated lentivirus
(LV-ChM-1 or LV-GFP) in HEK293T cell line. Lentivirus titres were calculated by
the flow cytometry results, showing V5-tag positive or GFP positive cells (Figure 5-
7 and Figure 5-8). The lentivirus titre used in this experiment was 2 × 10⁸/mL.
Transfection efficacy was also confirmed by Western blot and qRT-PCR. Gene
expression of ChM-1 increased above 50 fold in LV-ChM-1 infected HEK293T
cells, and protein level of ChM-1 was also detected following infection, showing a
clear band around 37 kDa (Figure 5-7). In LV-GFP infected HEK293T cells, GFP
fluorescence was detectable in the majority of cells under fluorescence microscopy,
and a solid band of GFP protein was also visible by Western blot (Figure 5-8).
After lentivirus titration, ACCs were transfected with LV-ChM-1 or LV-GFP (serves
as empty vector control). In LV-GFP infected ACCs, GFP fluorescence was
detectable in the majority of cells (Figure 5-9). Infection efficacy was validated by
Western blot and qRT-PCR. ChM-1 expression significantly increased at both
protein and gene levels in LV-ChM-1 transfected ACCs (Figure 5-9).
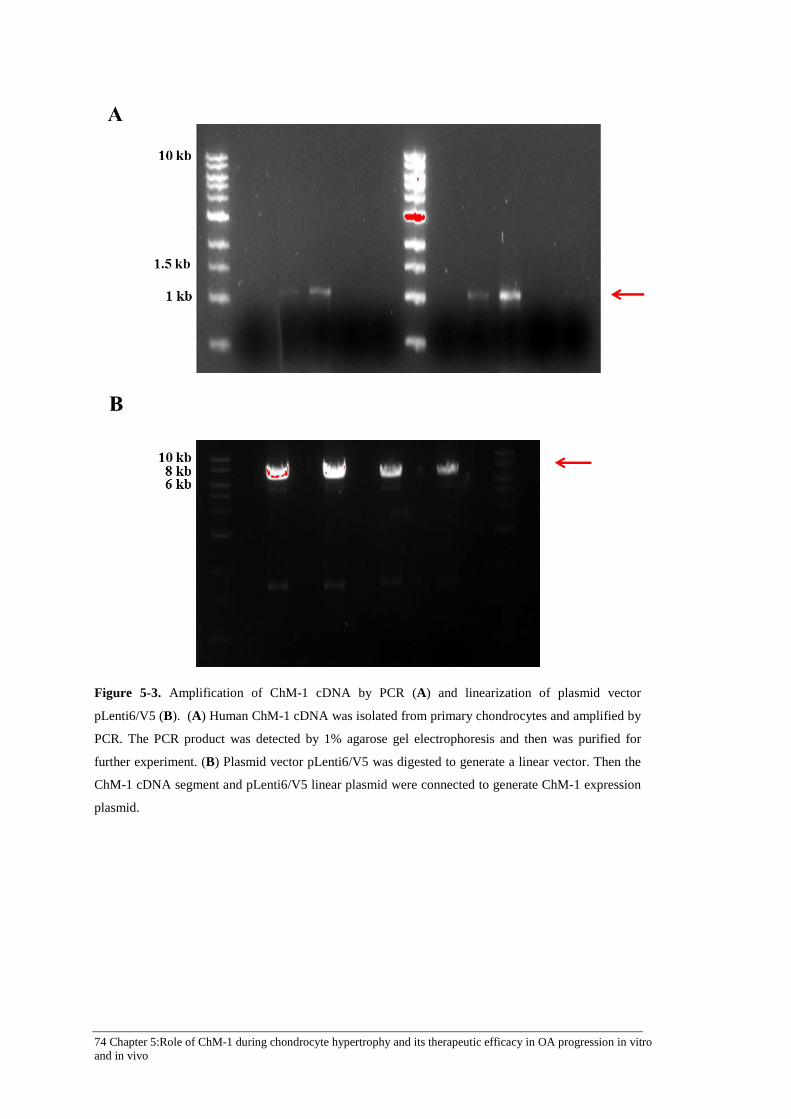
74 Chapter 5:Role of ChM-1 during chondrocyte hypertrophy and its therapeutic efficacy in OA progression in vitro and in vivo
Figure 5-3. Amplification of ChM-1 cDNA by PCR (A) and linearization of plasmid vector
pLenti6/V5 (B). (A) Human ChM-1 cDNA was isolated from primary chondrocytes and amplified by
PCR. The PCR product was detected by 1% agarose gel electrophoresis and then was purified for
further experiment. (B) Plasmid vector pLenti6/V5 was digested to generate a linear vector. Then the
ChM-1 cDNA segment and pLenti6/V5 linear plasmid were connected to generate ChM-1 expression
plasmid.

Chapter 5: Role of ChM-1 during chondrocyte hypertrophy and its therapeutic efficacy in OA progression in vitro and in vivo 75
Figure 5-4. Map of pLenti6/V5 containing ChM-1 cDNA insert. The amplified ChM-1 cDNA
segment was cloned into the SpeΙ and XhoΙ restriction enzyme cutting site, with the control of human
CMV promoter. Adapted from Life Technology (www.invitrogen.com).

76 Chapter 5:Role of ChM-1 during chondrocyte hypertrophy and its therapeutic efficacy in OA progression in vitro and in vivo
Figure 5-5. Gel electrophoresis of positive clones. E.coli SURE2 was transformed with pLenti6/V5
ChM-1 plasmid and positive clones were selected by Ampicillin. The amplified plasmids were
collected by mini-prep plasmid purification and digested by restriction enzymes of SpeΙ and XhoΙ.
The fragment was detected by 1% agarose gel electrophoresis. Data showed two positive clones (lane
1 and 3). Red arrow is for the target gene ChM-1 fragment, Blue arrow for the plasmid vector.

Chapter 5: Role of ChM-1 during chondrocyte hypertrophy and its therapeutic efficacy in OA progression in vitro and in vivo 77
Figure 5-6. GFP fluorescence in HEK293T cells during lentivirus GFP (LV-GFP) production. pLL3.7
GFP vector along with three packaging plasmids (pRSVRev, pMDLgpRRE and pMD.G) were
transfected into HEK293T cells to produce LV-GFP. GFP fluorescence was detected in HEK293T
cells during lentivirus production process. Scale bars, 50 μm.

78 Chapter 5:Role of ChM-1 during chondrocyte hypertrophy and its therapeutic efficacy in OA progression in vitro and in vivo
Figure 5-7. Validation of LV-ChM-1 transfection efficiency and titration by using HEK293T cells.
(A) Western blot and qRT-PCR analysis of ChM-1 expression in HEK293T cells with LV-ChM-1
transfection. Western blot showed ChM-1 protein were expressed in transfected cells, which showed a
clear band at around 37 kDa. Gene expression of ChM-1 increased above 50 times in 10 μL LV-ChM-
1 transfected HEK293T cells. (B) Titration of LV-ChM-1 in HEK293T cells by flow cytometry.
HEK293T cells were seeded into 6-well plate at a density of 1 × 10⁶ cells/well. Serial dilution of
concentrated LV-ChM-1 (10 μL, 1 μL, 0.1 μL, 0.01 μL, 0.001 μL) was added to each well to transfect
HEK293T cells. Cells were labelled with V5 Tag antibody and Alexa Fluor® 488 secondary antibody.
Data showed 37.36% of cells were V5-tag positive with 1 μL LV-ChM-1 transfection.

Chapter 5: Role of ChM-1 during chondrocyte hypertrophy and its therapeutic efficacy in OA progression in vitro and in vivo 79
Figure 5-8. Validation of LV-GFP transfection efficiency and titration by using HEK293T cells. (A)
GFP fluorescence in LV-GFP transfected HEK293T cells. Western blot showed the expression of
GFP protein in LV-GFP transfected HEK293T cells. Scale bars, 20 μm. (B) Titration of LV-GFP in
HEK293T cells by flow cytometry. HEK293T cells were seeded into 6-well plate at a density of 1 × 10⁶ cells/well. Serial dilution of concentrated LV-GFP (10 μL, 1 μL, 0.1 μL, 0.01 μL, 0.001 μL) was
added to each well to transfect HEK293T cells. Data showed 43.16% of cells were GFP positive with
1 μL LV-GFP transfection.

80 Chapter 5:Role of ChM-1 during chondrocyte hypertrophy and its therapeutic efficacy in OA progression in vitro and in vivo
Figure 5-9. Transfection efficiency of LV-GFP and LV-ChM-1 in primary articular cartilage
chondrocytes (ACCs). (A) GFP fluorescence in LV-GFP transfected ACCs. ACCs were transfected
with LV-GFP. Scale bars, 20 μm. (B) Western blot and qRT-PCR analysis of ChM-1 expression in
ACCs cells with LV-ChM-1 transfection. ACCs were transfected with lentivirus containing LV-ChM-
1. ChM-1 expression significantly increased in both protein and gene levels in LV-ChM-1 transfected
ACCs.

Chapter 5: Role of ChM-1 during chondrocyte hypertrophy and its therapeutic efficacy in OA progression in vitro and in vivo 81
5.3.4 ChM-1 exerted protective effect on catabolic response induced by TNF-α
It is well known that pro-inflammatory factors, especially IL-1β, IL-6 and TNF-α,
are major mediators of initiating and enhancing the catabolism in OA cartilage
(Kapoor, et al., 2011). To investigate whether ChM-1 protects chondrocyte from
hypertrophy in OA conditions, TNF-α was applied to mimic the inflammatory
environment of OA. As shown in Figure 5-10A, ACCs transduction with LV-ChM-1
effectively resulted in the up-regulation of ChM-1 gene (> 100-fold) and protein
expression in ACCs. Hypertrophic genes of RUNX2, COL10A1, MMP-13 and
VEGFA were stimulated by TNF-α. However, in ACCs with ChM-1 overexpression,
TNF-α failed to induce chondrocyte hypertrophy. ChM-1 also decreased the protein
level of hypertrophic markers RUNX2, COL10A1 and MMP-13 in the presence of
TNF-α. Conversely, inhibition of ChM-1 by siRNA resulted in notably enhanced
chondrocyte hypertrophy (Figure 5-10B). Following TNF-α stimulation, ChM-1
siRNA up-regulated hypertrophic markers of RUNX2, COL10A1 and MMP-13 at
both gene and protein levels compared to uninfected and scrambled siRNA
transfected ACCs. These results indicate that under the influence of TNF-α
stimulation, ChM-1 could resist up-regulation of hypertrophic markers (RUNX2,
COL10A1, MMP-13 and VEGFA).
Subsequently, the role of ChM-1 overexpression in maintaining the chondrocyte
phenotype during ACCs pellet culture was studied. Accordingly, ACCs were infected
with LV-ChM-1 and then subjected to pellet culture in chondrogenic medium for
three-weeks. However, results showed that ChM-1 overexpression had no significant
effect on the expression of chondrogenic and hypertrophic genes at either mRNA or
protein levels, including COL2A1, ACAN, RUNX2, MMP-13, ALP and COL10A1
(Figure 5-11).

82 Chapter 5:Role of ChM-1 during chondrocyte hypertrophy and its therapeutic efficacy in OA progression in vitro and in vivo
Figure 5-10. Effects of gain and loss of function of ChM-1 on hypertrophic markers in primary
cultured ACCs. (A) mRNA and protein expression of RUNX2, COL10A1, MMP-13, and VEGFA in
ACCs with ChM-1 overexpression. ACCs were transfected with LV-ChM-1 or LV-GFP (serves as
empty vector control) and exposed to TNF-α (10 ng/mL) for 48 h. (B) Analyses of the hypertrophic
markers in ACCs transfected with ChM-1 siRNA (100 nM) or scrambled siRNA, followed by
treatment with TNF-α (10 ng/mL) for 48 h. Non-transfected ACCs serves as empty control for both
(A) and (B). Values are mean ± SEM (n = 3). *p < 0.05 versus LV-GFP group.

Chapter 5: Role of ChM-1 during chondrocyte hypertrophy and its therapeutic efficacy in OA progression in vitro and in vivo 83
Figure 5-11. Effects of ChM-1 overexpression on chondrogenic differentiation of ACCs in pellet
culture. (A) Expression of chondrogenic genes (COL2A1, ACAN and SOX9) and hypertrophic genes
(RUNX2, COL10A1, MMP-13, ALP and VEGFA) in ACCs pellets with ChM-1 overexpression.
ACCs were infected with LV-ChM-1 and then subjected to pellet culture in chondrogenic medium for
3-weeks. (B) Protein expression of chondrogenic and hypertrophic markers in ACCs pellets with
ChM-1 overexpression. Values are mean ± SEM (n = 3). *p < 0.05 versus LV-GFP group.

84 Chapter 5:Role of ChM-1 during chondrocyte hypertrophy and its therapeutic efficacy in OA progression in vitro and in vivo
5.3.5 Overexpression of ChM-1 in articular cartilage delayed OA progression in
vivo
Based on the in vitro data, I therefore evaluated the therapeutic efficacy of ChM-1
overexpression in an experimental rat model of OA induced by surgically removal of
meniscus (MSX). Lentivirus ChM-1 and GFP were injected intra-articular into rat
OA knee joints. Gross morphology demonstrated severe cartilage surface damage in
LV-GFP and PBS-treated OA group having a rough appearance, osteophyte
formation and proliferation of peripheral fibrous tissues in both tibia and femur
cartilage. LV-ChM-1 treatment had no significant influence on the surface roughness
of cartilage, but alleviated osteophyte and fibrous tissue formation at five-weeks
(Figure 5-12). Safranin-O staining showed similar severity of proteoglycan depletion
in LV-GFP and PBS-treated OA rats. Interestingly, intra-articular injection of LV-
ChM-1 reduced proteoglycan depletion compared to LV-GFP and PBS-treated OA
groups (Figure 5-13). Cartilage degradation in the tibial plateau was further
quantified by Mankin’s histologic grading system. LV-ChM-1 treatment significantly
reduced the Mankin score by 65.62% ± 11.35% and 64.51% ± 13.22% at five-weeks
compared to LV-GFP and PBS-treated OA groups, respectively (Figure 5-13).
Ectopic expressions of these constructs were confirmed by V5-tag staining and GFP
fluorescence, respectively (Figure 5-14). Immunohistochemical staining and qRT-
PCR showed that ChM-1 expression in articular cartilage was successfully enhanced
by LV-ChM-1 injection at five-weeks (Figure 5-14 and Figure 5-16). Furthermore,
overexpression of ChM-1 in articular cartilage chondrocytes markedly decreased
gene and protein abundance of catabolic markers, including COL10A1, MMP-13 and
VEGFA (Figure 5-15 and Figure 5-16). Additionally, immunohistochemical staining
of COL2A1 and aggrecan were correspondingly enhanced in cartilage following LV-
ChM-1 treatments (Figure 5-15).
At late time-points (nine-weeks), intra-articular injection of LV-ChM-1 seemed to
have higher cartilage thickness as revealed by Safranin-O staining (Figure 5-17A).
However, Mankin score of LV-ChM-1 treatment showed no statistically significant
difference at nine-weeks, compared to LV-GFP treatment and PBS group (Figure 5-
17B). Immunohistochemical staining showed that ChM-1 abundance was slightly
elevated at nine-weeks (Figure 5-17). Taken together, the in vivo experiment
revealed that overexpression of ChM-1 by lentivirus infection delayed cartilage

Chapter 5: Role of ChM-1 during chondrocyte hypertrophy and its therapeutic efficacy in OA progression in vitro and in vivo 85
degradation in OA rat model at the early time-point.
Figure 5-12. Gross observation of femur and tibia cartilage surface in surgical osteoarthritis rat model
at 5-weeks. Experimental rat model of OA were induced by surgically removal of meniscus. LV-
ChM-1 or LV-GFP was injected intra-articular into rat OA knee joints. Severe cartilage surface
damage were shown in LV-GFP and PBS groups with rough appearance, osteophyte formation and
proliferation of peripheral fibrous tissues in both tibia and femur cartilage. LV-ChM-1 treatment
alleviated osteophyte and fibrous tissue formation.

86 Chapter 5:Role of ChM-1 during chondrocyte hypertrophy and its therapeutic efficacy in OA progression in vitro and in vivo
Figure 5-13. Histology analysis of tibia cartilage section in surgical osteoarthritis rat model at 5-
Weeks. (A) Safranin-O staining showed similar severity of proteoglycan depletion in LV-GFP and
PBS-treated OA rats. LV-ChM-1 treatment reduced proteoglycan depletion compared to LV-GFP and
PBS-treated OA groups. Scale bars, 50 µm. (B) Quantification of osteoarthritis progression by
Mankin scoring system. Values are mean ± SEM (n = 6). *p < 0.05 versus LV-GFP group.

Chapter 5: Role of ChM-1 during chondrocyte hypertrophy and its therapeutic efficacy in OA progression in vitro and in vivo 87
Figure 5-14. Validation of lentivirus transfection efficacy in surgical osteoarthritis rat cartilage at 5-
weeks. Transfection efficacy was confirmed by GFP fluorescence in LV-GFP group and
immunohistochemical staining of ChM-1 and V5-tag in LV-ChM-1 group. Scale bars, 50 µm.
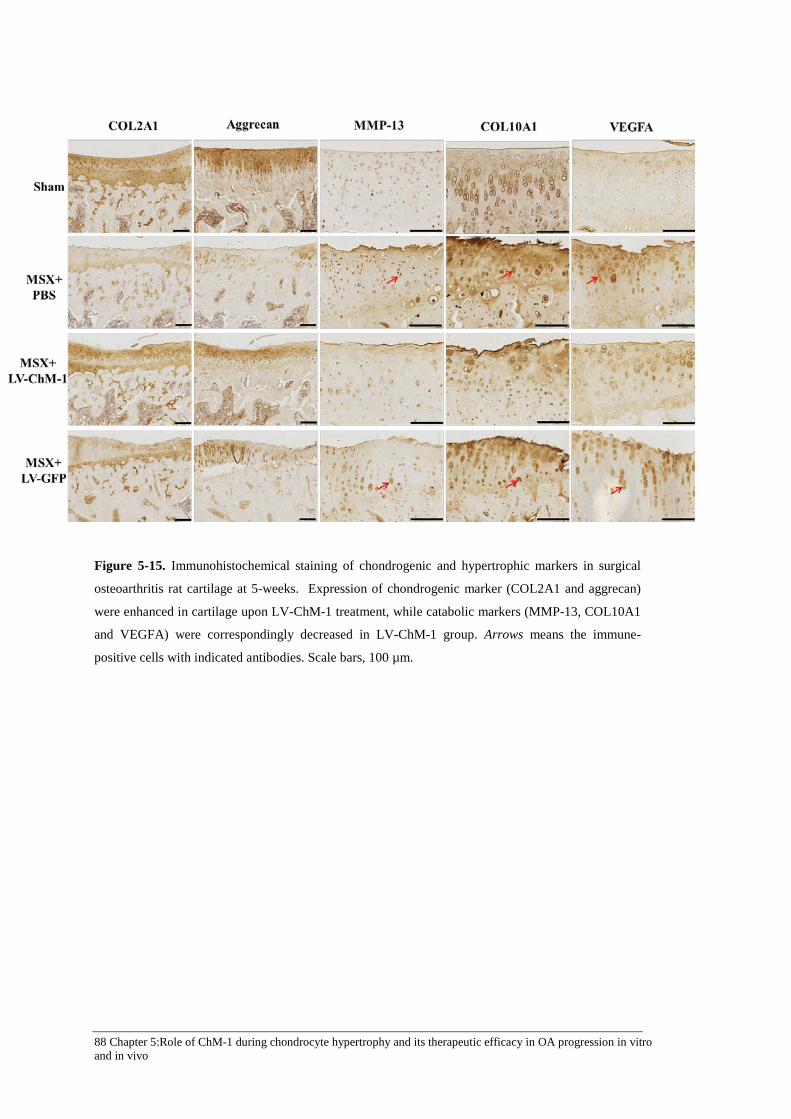
88 Chapter 5:Role of ChM-1 during chondrocyte hypertrophy and its therapeutic efficacy in OA progression in vitro and in vivo
Figure 5-15. Immunohistochemical staining of chondrogenic and hypertrophic markers in surgical
osteoarthritis rat cartilage at 5-weeks. Expression of chondrogenic marker (COL2A1 and aggrecan)
were enhanced in cartilage upon LV-ChM-1 treatment, while catabolic markers (MMP-13, COL10A1
and VEGFA) were correspondingly decreased in LV-ChM-1 group. Arrows means the immune-
positive cells with indicated antibodies. Scale bars, 100 µm.
Chapter 5: Role of ChM-1 during chondrocyte hypertrophy and its therapeutic efficacy in OA progression in vitro and in vivo 89
Figure 5-16. Gene expression of ChM-1 and hypertrophic markers in surgical osteoarthritis rat
cartilage at 5-weeks. Intra-articular injection of LV-ChM-1 resulted in markedly increasing gene level
of ChM-1. Gene level of hypertrophic markers (COL10A1, MMP-13 and VEGFA) significantly
decreased in LV-ChM-1 treatment group. Values represent mean ± SEM (n = 3). *p < 0.05 versus
LV-GFP group.

90 Chapter 5:Role of ChM-1 during chondrocyte hypertrophy and its therapeutic efficacy in OA progression in vitro and in vivo
Figure 5-17. Histology analysis of tibia cartilage in surgical osteoarthritis rat model at 9-weeks. (A)
Safranin-O staining showed severity of proteoglycan depletion in LV-ChM-1, LV-GFP and PBS-
treated OA rats. Immunohistochemical staining showed the expression of ChM-1 in OA tibia
cartilage. (B) Quantification of osteoarthritis progression by Mankin scoring system. Values represent
mean ± SEM (n = 6).

Chapter 5: Role of ChM-1 during chondrocyte hypertrophy and its therapeutic efficacy in OA progression in vitro and in vivo 91
5.4 DISCUSSION
This study extended our knowledge on the importance of anti-angiogenic factor in
maintaining the physiological functions of chondrocytes and preventing hypertrophy.
My data showed the anti-angiogenic factor ChM-1 is closely correlated with
chondrocyte maturation and stabilize chondrocyte phenotype. It was found that the
ChM-1 can regulate catabolic genes of VEGFA, COL10A1 and MMP-13 in
chondrocytes and thus protect chondrocytes from TNF-α-induced hypertrophy. More
importantly, the in vivo study provided evidence that ChM-1 supplementation to
articular chondrocytes delays OA progression, suggesting that ChM-1 could have a
therapeutic potential in OA pathological conditions.
The role of ChM-1 as a potent anti-angiogenic factor has been widely studied
(Hayami, et al., 1999; Hiraki, et al., 1997a; Miura, et al., 2010; Shukunami & Hiraki,
1998; Yoshioka, et al., 2006). Further, ChM-1 has been reported to stimulate
proliferation of cultured chondrocytes (Hiraki, et al., 1991). During chick wing
development ChM-1 expression co-localizes with the cartilage matrix marker
COL2A1 (Shukunami, et al., 2008). Pelttari et al. reported that mesenchymal stem
cell (MSCs) pellets transplanted to ectopic sites in severe combined
immunodeficiency (SCID) mice underwent endochondral ossification with
hypertrophy and angiogenesis, whereas chondrocyte pellets resisted calcification and
vascular invasion in vivo (Pelttari et al., 2006), suggesting different potential of
chondrogenic differentiation between MSCs and chondrocytes. However, the
importance of anti-angiogenic factor had not been taken into consideration in that
study. My results showed that during chondrogenic differentiation of ACCs, up-
regulation of ChM-1 was consistent with the expression of cartilage marker COL2A1
and SOX9. BMSCs produced ChM-1 at significantly lower level than chondrocytes
and cannot undergo complete chondrogenic differentiation, with less matrix
deposition and COL2A1 expression. These results suggested the ChM-1 may be
correlated with chondrogenesis and ChM-1 may act as an anabolic marker in
chondrocyte phenotype. Furthermore, TGF-β, known as a chondrogenic stimulator,
significantly up-regulated SOX9 and COL2A1, but had no influence on ChM-1
expression. This may indicate that ChM-1 is an independent anabolic marker or
regulated through unknown upstream signalling in chondrocytes.
Surprisingly, in pellet culture, overexpression of ChM-1 in chondrocytes did not

92 Chapter 5:Role of ChM-1 during chondrocyte hypertrophy and its therapeutic efficacy in OA progression in vitro and in vivo
enhance chondrogenic differentiation of ACCs. In Pelttari’s study, chondrocytes
pellet possess the ability to resist vascular invasion in vivo (Pelttari, et al., 2006),
indicating chondrocytes pellet contains physiologically significant amounts of anti-
angiogenic protein, which might include ChM-1. As shown in my previous data,
ChM-1 expression could be up-regulated with time of chondrogenic differentiation in
pellet culture. Besides, chondrocytes possess higher constituent ChM-1 level than
that in BMSCs. Therefore, I hypothesize that the pellet culture of chondrocytes could
induce sufficient amount of ChM-1 protein to maintain chondrocyte phenotype;
whereas the excessive ChM-1 has no additional function. But this result cannot rule
out the protective function of ChM-1 in cartilage homeostasis. My results showed
ChM-1 could protect chondrocyte in hypertrophic condition, that is monolayer
culture with TNF-α stimulation. Compared to monolayer culture system, pellet
culture method of chondrogenic differentiation has been proved to be a better model
to mimic the chondrocyte micro-environment, which can preserve chondrocyte
phenotype. However, it will be more interesting and more convincing to show the
effect of ChM-1 overexpression/knockdown on chondrogenesis in pellet culture
system with hypertrophic stimuli, such as inflammatory cytokine or mechanical
loading, which will be subjected to my future study.
Pro-inflammatory factors, especially IL-1β, IL-6 and TNF-α, are major mediators of
initiating and enhancing the catabolism of OA cartilage (Kapoor, et al., 2011). My
results demonstrated that TNF-α up-regulates hypertrophic genes of RUNX2,
COL10A1, MMP-13, ALP and VEGF, and down-regulates ChM-1 in ACCs, which
is consistent with previous reports. Interestingly, ACCs with ChM-1 overexpression
effectively resist TNF-α induced hypertrophy, with constant higher level of
chondrogenic marker and low expression of hypertrophic markers, thus indicating
that ChM-1 could protect chondrocyte from catabolism induced by pro-inflammatory
cytokine. Additionally, Klinger et al. showed that osteochondral progenitor cells with
AAV-ChM-1 infection stimulated chondrogenic differentiation and inhibited
endochondral ossification with decreased COL10A1 abundance in a micro-fractured
cartilage repair model, but ChM-1 had no effect on VEGFA gene expression in vitro
(Klinger, et al., 2011). However, as shown in my result, ChM-1 could suppress up-
regulation of VEGFA and COL10A1 in an inflammatory environment and MSX-
induced OA model. The data implies that ChM-1 may not target angiogenic and
Chapter 5: Role of ChM-1 during chondrocyte hypertrophy and its therapeutic efficacy in OA progression in vitro and in vivo 93
hypertrophic genes directly, but target the signals of initiating these catabolic genes.
Based on these encouraging in vitro results, I set to test the functional relevance of
ChM-1 supplementation to OA progression in vivo. I found that ChM-1
overexpression in articular chondrocytes significantly ameliorated OA progression at
five-weeks, characterized by reduced COL10A1, MMP-13 and VEGFA expression
and matrix degradation. At late stage of OA (nine-weeks post-surgery), ChM-1
showed no tendency to reduce cartilage matrix degradation, as there is no significant
difference in Mankin scores. As shown by immunostaining, the abundance of ChM-1
also decreased at week nine. This observed phenomenon might be explained as
follows: the N-terminal 14 kDa truncated form of ChM-1 has been recently identified
in hypertrophic and calcified zone of cartilage in developing long bone (Miura et al.,
2014). The ChM-1 cleavage has little inhibitory effect on angiogenesis in contrast to
its intact 25 kDa form, indicating other mechanisms regulating ChM-1 function at
post-transcriptional level in vivo (Miura, et al., 2014). In my study, lentivirus
carrying ChM-1 efficiently increased gene level of ChM-1; however, at late stage
OA cartilage, the intact form of ChM-1 might be proteolyzed and thus its protective
effect on cartilage is compromised. Nevertheless, considering the time-scale
correlation between laboratory rats and human (10.5 rat days equals to one human
year (Sengupta, 2013)), my in vivo data showed ChM-1 supplementation at least
postponed OA progression, providing evidence for utilizing anti-angiogenic strategy
in OA therapy. Further studies will aim to clarify the post-transcriptional regulation
of ChM-1, as well as to develop more sustained strategy to improve ChM-1
efficiency in OA therapy.
In conclusion, my results indicate that ChM-1 is important to maintain the
chondrocyte phenotype and prevent hypertrophy by inhibiting catabolic factors of
COL10A1, MMP-13 and VEGFA. Moreover, this study provides a new therapeutic
strategy for OA through supplementation of anti-angiogenic protein ChM-1.

Chapter 6: ChM-1 inhibits catabolic changes of OA chondrocytes through HIF-2α pathway 95
Chapter 6: ChM-1 inhibits catabolic changes of OA chondrocytes through HIF-2α pathway
6.1 INTRODUCTION
As discussed in the previous chapters, ChM-1 is closely correlated with chondrocyte
maturation and stabilizes the chondrocyte phenotype. The expression of ChM-1 is
confined within normal avascular cartilage, whereas its expression is abolished in
hypertrophic chondrocytes, in both growth plate and osteoarthritis. My results
indicate that ChM-1 can regulate the catabolic genes of VEGFA, COL10A1 and
MMP-13 in chondrocytes, and thus protect chondrocytes from TNF-α-induced
hypertrophy in vitro and delay OA progression in an animal model. Therefore, it
could be inferred that ChM-1 is not merely an anti-angiogenic protein in cartilage,
but more importantly, serves as the intrinsic factors to maintain its phenotype.
Articular cartilage is an avascular tissue by nature and oxygen supply to the
chondrocytes is limited to the capacity of synovial fluids to carry oxygen and its flow
rate during joint movement (Lee, et al., 2007; Lund-Olesen, 1970; Pfander & Gelse,
2007). Therefore, being avascular, hypoxia is the physiologic environment for
articular cartilage. Hypoxia has generally been regarded as the condition most
favourable to induce the chondrocyte phenotype; nevertheless, it is a stress condition
in vascular tissues. The hypoxic response is mediated by hypoxia inducible factor
(HIF) family members (mainly HIF-1α, -2α). In vitro studies have demonstrated that
hypoxia enhances SOX9 activity – considered the master regulator of
chondrogenesis – and leads to an increased expression of COL2A1 (Duval, et al.,
2009; Robins, et al., 2005). HIF-1α has been reported to be essential for chondrocyte
survival, energy generation and matrix synthesis (Pfander, et al., 2003; Yudoh, et al.,
2005). Recently, several studies have revealed a catabolic effect of HIF signalling in
osteoarthritic cartilage, particularly HIF-2α (Saito, et al., 2010; Yang, et al., 2010).
The hypothesis is that the shift from HIF-1α to HIF-2α initiates and promotes
chondrocyte hypertrophy and cartilage degradation in OA (Husa, et al., 2010). In
spite of HIF-1α and HIF-2α having approximately 50% amino acid sequence

96 Chapter 6: ChM-1 inhibits catabolic changes of OA chondrocytes through HIF-2α pathway
identity, they have remarkably different expression patterns and functions in cartilage
metabolism (Husa, et al., 2010). HIF-2α has been shown to potentiate Fas-mediated
chondrocyte apoptosis, which actively promotes osteoarthritic cartilage destruction
(Ryu, et al., 2012). Moreover, two independent studies reported that HIF-2α, as a
central catabolic regulator of osteoarthritic cartilage destruction, directly targets
hypertrophic genes in OA cartilage, such as VEGFA, COL10A1, RUNX2, MMP-1,
MMP-3, MMP-9, MMP-12, MMP-13 and ADAMTS4 (Saito, et al., 2010; Yang, et
al., 2010).
In normal cartilage, as in other tissues, hypoxia enhances the expression of both HIF-
1α and HIF-2α. Although the literature concerning the HIF-2α abundance in OA
cartilage seems contradictory – with reports of both increased and decreased level, in
healthy articular cartilage HIF-2α has been detected in considerable amounts
(Bohensky, et al., 2009; Coimbra, et al., 2004). Interestingly, the existence of HIF-2α
in normal cartilage does not initiate the angiogenic and catabolic cascades. Hence, it
seems that chondrocytes in normal cartilage are capable of blocking angiogenic and
hypertrophic pathways induced by HIF-2α, whereas OA chondrocytes cannot.
Therefore, it would appear that ChM-1, as an intrinsic and abundant protein in
cartilage, may play a regulatory role in the function of HIFs.
Therefore, the hypothesis of this study is that ChM-1 may influence HIF-2α
abundance or transcriptional activity and subsequently suppress catabolic marker
expression. To verify this hypothesis, I first examined the effect of ChM-1
overexpression on HIF-2α expression in chondrocytes. Next, since HIF-2α is a
transcription factor, translocation into the nucleus is essential for it to exert its
function; therefore, the nuclear accumulation of HIF-2α under ChM-1
overexpression condition was investigated by Western blot and immunocytochemical
staining. Last, chromatin immunoprecipitation (ChIP) assays were performed to
clarify whether ChM-1 could influence the recruitment of HIF-2α to the promoter
regions of COL10A1, MMP-13 and VEGFA.
6.2 MATERIALS AND METHODS
Details of materials and methods used in this chapter are described in Chapter 3. The
following is a brief outlines of the materials and methods used to generate the data in

Chapter 6: ChM-1 inhibits catabolic changes of OA chondrocytes through HIF-2α pathway 97
this chapter.
6.2.1 Immunohistochemical staining of HIF-1α and HIF-2α in rat OA cartilage
An experimental rat model of OA was induced by surgically removing the meniscus
as described in section 3.13.1. After five-weeks, the rats were sacrificed and the knee
samples were collected for histology analysis. The expression of HIF-1α and HIF-2α
during OA pathology was explored by immunohistochemical staining of HIF-1α and
HIF-2α, as described in section 3.13.2. Six rat joint samples from each group were
processed for histological analysis.
6.2.2 Expression of HIF-2α in chondrocyte under hypoxia or TNF-α stimulation
To explore the molecular mechanisms underlying the inhibitory effect of ChM-1 on
catabolic changes of chondrocytes, C28/I2 cells with or without ChM-1
overexpression were used in this part of the study. C28/I2 cells were cultured and
expanded in DMEM/F12 medium supplemented with 10% v/v FBS and 1% v/v P/S.
To study expression of HIF-2α under hypoxia environment, the cells were seeded in
6-well plates and cultured in a BINDER CO2 Incubator with O2 Control, which was
set as 1% O2, 5% CO2 and 94% N2. To determine the expression of HIF-2α under
osteoarthritic hypertrophic environment, the cytokine TNF-α was added to the cell
culture medium at different concentrations (1, 10, 50 ng/mL). At the nominated time-
points, whole cell lysates were extracted using RIPA lysis buffer and subjected to
Western blot to determine the protein expression of HIF-2α, as described in section
3.5. Assays were performed in triplicate, with each sample tested individually three
times from three different C28/I2 cell line passages.
6.2.3 Effect of ChM-1 overexpression on HIF-2α production and nucleus
translocation in chondrocytes
To investigate the effect of ChM-1 overexpression on HIF-2α production, C28/I2
cells were infected with LV-ChM-1 or LV-GFP at 50–60% confluence (details are
described in section 3.11.3). Infected cells were exposed to TNF-α (10 ng/mL)
stimulation for the nominated time-points. Whole cell lysates were extracted using
RIPA lysis buffer. Nucleus lysate and cytoplasmic protein were prepared using NE-

98 Chapter 6: ChM-1 inhibits catabolic changes of OA chondrocytes through HIF-2α pathway
PER Nuclear and Cytoplasmic extraction kit. Protein abundance of HIF-2α was
detected by Western blot as described in section 3.5.
To visualize HIF-2α location in chondrocytes, C28/I2 cells overexpressing ChM-1
was seeded on coverslips and exposed to 10 ng/mL TNF-α stimulation for 1 h. The
cell were fixed in 4% PFA for 1 h and immunocytochemical staining of HIF-2α
performed, as described in section 3.14. The stained cells were viewed under
confocal microscopy (Leica TCS SP5).
6.2.4 ChIP assay
To determine if ChM-1 interferes with the recruitment of HIF-2α to the promoter
region of the catabolic genes of COL10A1, MMP-13 and VEGFA, ChIP assays were
performed using Pierce Agarose ChIP kit. LV-ChM-1 and LV-GFP infected C28/I2
cells were exposed to TNF-α for 6 h then the samples subjected to ChIP analysis.
HIF-2α antibody and normal rabbit IgG were used for immunoprecipitation. Primers
were designed to span the identified HRE in the promoter or intron of target genes
(Liu, et al., 1995; Saito, et al., 2010), as follows: COL10A1 (-59 to +121 bp), MMP-
13 (–214 to –28 bp), VEGFA (–1,000 to–795 bp). Further details are described in
section 3.15.
6.2.5 Statistical analysis
Assays were performed in triplicate, with each sample tested individually three times
from three different C28/I2 cell line passages. All the data, including qRT-PCR,
Western blot and ChIP assay results, were presented as means ± SEM and were
analysed using one-way ANOVA. Analyses were performed using SPSS version
21.0 software. A p-value <0.05 were considered to be statistically significant
difference.
6.3 RESULTS
6.3.1 Expression of HIF-1α and HIF-2α in normal and OA cartilage
The cellular expression of HIF-1α and HIF-2α in normal and OA rat cartilage was
determined by immunohistochemical staining. As shown in Figure 6-1, HIF-1α and
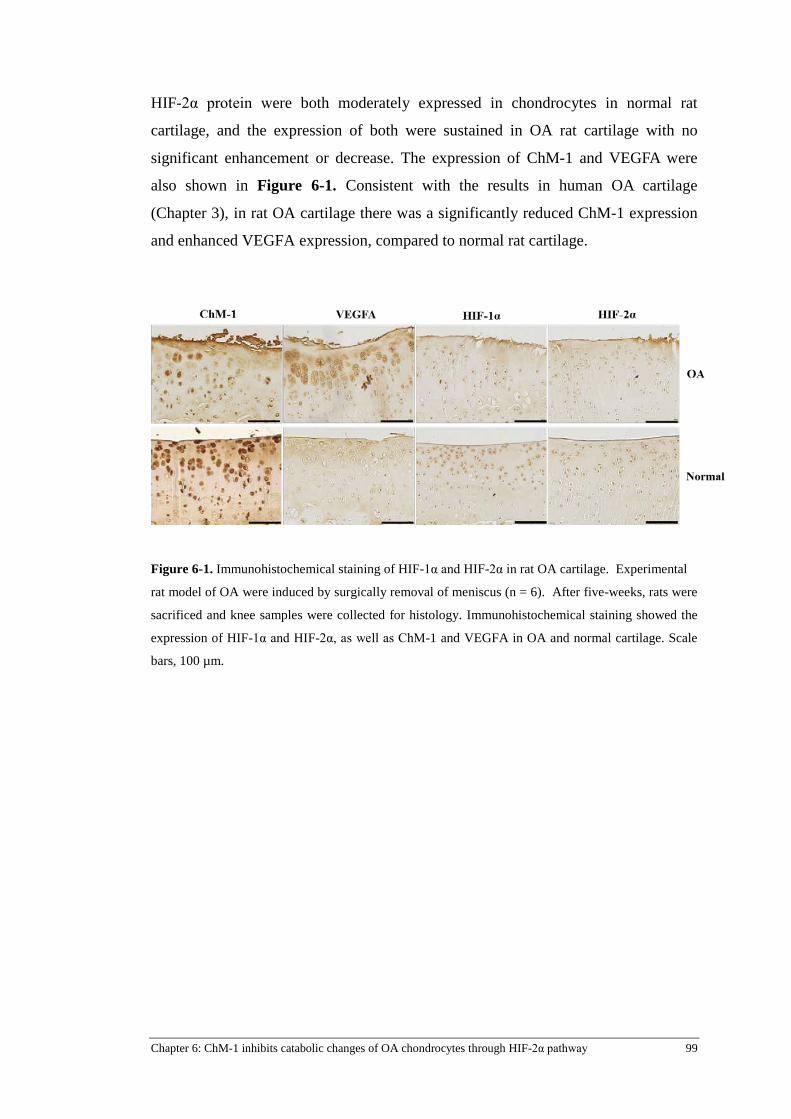
Chapter 6: ChM-1 inhibits catabolic changes of OA chondrocytes through HIF-2α pathway 99
HIF-2α protein were both moderately expressed in chondrocytes in normal rat
cartilage, and the expression of both were sustained in OA rat cartilage with no
significant enhancement or decrease. The expression of ChM-1 and VEGFA were
also shown in Figure 6-1. Consistent with the results in human OA cartilage
(Chapter 3), in rat OA cartilage there was a significantly reduced ChM-1 expression
and enhanced VEGFA expression, compared to normal rat cartilage.
Figure 6-1. Immunohistochemical staining of HIF-1α and HIF-2α in rat OA cartilage. Experimental
rat model of OA were induced by surgically removal of meniscus (n = 6). After five-weeks, rats were
sacrificed and knee samples were collected for histology. Immunohistochemical staining showed the
expression of HIF-1α and HIF-2α, as well as ChM-1 and VEGFA in OA and normal cartilage. Scale
bars, 100 µm.

100 Chapter 6: ChM-1 inhibits catabolic changes of OA chondrocytes through HIF-2α pathway
6.3.2 ChM-1 delayed HIF-2α translocation to nucleus
ChM-1 overexpression in C28/I2 was achieved by infection with LV-ChM-1 or LV-
GFP (serves as empty vector control). GFP fluorescence was detectable in majority
cells infected with LV-GFP (Figure 6-2). Infection efficacy was also validated by
Western blot and qRT-PCR. ChM-1 gene and protein expression was significantly
increased LV-ChM-1 transfected C28/I2 (Figure 6-2).
As is shown in Figure 6-3A, both hypoxic conditions and TNF-α stimulation
markedly increased the total protein level of HIF-2α, whereas ChM-1 overexpression
had no effect on either mRNA or cellular protein levels of HIF-2α compared to
control and GFP group (Figure 6-3B). Nuclear accumulation of activated HIF-2α in
ChM-1 overexpression condition was determined by immunofluorescence and
Western blot. Figure 6-4A shows there was a substantial nuclear translocation of
HIF-2α occurring at 30 min of TNF-α stimulation in “wild type” C28/I2 cells,
whereas this was delayed up to 2 h in the ChM-1 overexpressing cells.
Immunofluorescence staining revealed that a considerable amount of HIF-2α was
localized to the nucleus upon TNF-α stimulation at 1 h, whereas HIF-2α remained in
the cytoplasm in ChM-1 overexpressing cells (Figure 6-4B). These data suggest that
ChM-1 has no effect on the gene expression and de novo protein synthesis of HIF-
2α, but rather delays HIF-2α translocation to nucleus.

Chapter 6: ChM-1 inhibits catabolic changes of OA chondrocytes through HIF-2α pathway 101
Figure 6-2. Transfection efficiency of LV-GFP and LV-ChM-1 in chondrocyte cell line C28/I2. (A)
GFP fluorescence in LV-GFP transfected C28/I2. C28/I2 cells were transfected with LV-GFP. GFP
fluorescence was detectable in majority cells. Scale bars, 50 μm. (B) Western blot and qRT-PCR
analysis of ChM-1 expression in C28/I2 cells with LV-ChM-1 transfection. ChM-1 expression
significantly increased in both protein and gene level in LV-ChM-1 transfected C28/I2.

102 Chapter 6: ChM-1 inhibits catabolic changes of OA chondrocytes through HIF-2α pathway
Figure 6-3. Effect of ChM-1 overexpression on HIF-2α production in chondrocyte cell line C28/I2.
(A) HIF-2α protein expression in chondrocyte cell line C28/I2 under the stimulation of TNF-α (1, 10
or 50 ng/mL) or hypoxia condition (1% O2) for indicated time-points. GAPDH was included as a
loading control. (B) Western blot and qRT-PCR analysis of HIF-2α expression in C28/I2 transfected
with LV-ChM-1 or LV-GFP and exposed to TNF-α (10 ng/mL) for indicated time-points. Values
represent mean ± SEM (n = 3).

Chapter 6: ChM-1 inhibits catabolic changes of OA chondrocytes through HIF-2α pathway 103
Figure 6-4. ChM-1 delayed HIF-2α translocation to nucleus in C28/I2. (A) Cytoplasmic and nuclear
abundance of HIF-2α in C28/I2 with ChM-1 overexpression demonstrated by Western blot. C28/I2
cells were transfected with LV-ChM-1 or LV-GFP and exposed to TNF-α for indicated time-points.
Tubulin and PCNA serve as a loading control for cytoplasmic and nuclear protein, respectively. The
intensities of the bands were normalized to loading control and then further converted to the fold
change of the first time-point. Values are mean ± SEM (n = 3). (B) Intra-cellular localization of HIF-
2α in C28/I2 with ChM-1 overexpression demonstrated by immunofluorescence staining. C28/I2 cells
were transfected with LV-ChM-1 and exposed to 10 ng/mL TNF-α for 1 h. DAPI was used to
visualize nuclei. Non-transfected ACCs serves as control. Scale bars, 50 µm. Arrow head, positive
nucleus staining of HIF-2α; Arrow, negative nucleus staining of HIF-2α.

104 Chapter 6: ChM-1 inhibits catabolic changes of OA chondrocytes through HIF-2α pathway
6.3.3 ChM-1 inhibited transcriptional activity of HIF-2α on hypertrophic genes
ChIP assays were performed to determine whether ChM-1 associates with HIF-2α
when recruited to the promoter of the catabolic genes of COL10A1, MMP-13 and
VEGFA. Primer sets (positions are indicated in Figure 6-5) were designed to
amplify the identified HIF-2α binding regions on the promoter or intron of target
genes (Liu, et al., 1995; Saito, et al., 2010). After exposure to TNF-α for 6 h, qRT-
PCR showed that the binding activities of HIF-2α to the promoter of COL10A1,
MMP-13 and VEGFA were significantly decreased in ChM-1 infected C28/I2 cells,
compared to the GFP infected group (Figure 6-5). These data therefore indicate that
ChM-1 inhibits the transcriptional activity of HIF-2α on genes of COL10A1, MMP-
13 and VEGFA.
Figure 6-5. ChM-1 inhibited transcriptional activity of HIF-2α on hypertrophic genes. ChIP assay
for detection the DNA binding activity of HIF-2α to the promoter of hypertrophic genes of MMP-13,
COL10A1 and VEGFA in C28/I2 with ChM-1 overexpression. C28/I2 cells were transfected with
LV-ChM-1 or LV-GFP and exposed to TNF-α for 6 h. Chromatin was immunoprecipitated with HIF-
2α antibody, and ChIP DNA was amplified by primer sets that span the HRE site. TSS, transcription
start site. Non-transfected ACCs serves as empty control. Values are mean ± SEM (n = 3). *p < 0.05
versus LV-GFP group.

Chapter 6: ChM-1 inhibits catabolic changes of OA chondrocytes through HIF-2α pathway 105
6.4 DISCUSSION
The protective effect of ChM-1 on the chondrocyte phenotype has been shown in an
OA model in my previous studies, as well as in a cartilage regeneration model by
other researchers (Klinger, et al., 2011). The mechanism underlying this function of
ChM-1 is fundamentally important in cartilage biology, since ChM-1 is an intrinsic
and abundant protein in cartilage. Here, I report that ChM-1 delays HIF-2α
translocation to nucleus at early time-points and inhibits the transcriptional activity
of HIF-2α on the genes COL10A1, MMP-13 and VEGFA. This is the first study to
report such a mechanism in the regulation of the chondrocyte phenotype by ChM-1.
The HIF family of proteins was first discovered by virtue of its expression and
function depending mainly on the oxygen levels surrounding cells (Bruick &
McKnight, 2001; Epstein, et al., 2001). Under normal oxygen condition, HIF-α is
hydroxylated by PHDs and degrades rapidly through ubiquitination (Ivan, et al.,
2001; Jaakkola, et al., 2001; Yu, et al., 2001). On the other hand, under hypoxia (1-
5% oxygen), PHD activity is inhibited and HIF-α becomes stabilized, translocating
into the nucleus and heterodimerizes with the constitutively expressed HIF-β (Huang,
et al., 1998; Jiang, et al., 1996; Salceda & Caro, 1997; Semenza, et al., 1994; Wang
& Semenza, 1993). The HIF-α/β heterodimer then trans-activates target genes by
binding to hypoxia-response elements (HRE, 5’-RCGTG-3’; R is A or G). In vitro
studies showed that HIF-2α is not solely dependent on oxygen level, but also
sensitive to non-hypoxic stimuli, including inflammatory cytokines, growth factors
and catabolic stress. It has been shown that IL-1β and TNF-α up-regulate HIF-2α in
chondrocytes through the NF-κB and p38 pathways (Saito, et al., 2010; Yang, et al.,
2010). Classically, the best characterised targets of HIFs are angiogenic genes, such
as VEGF, EPO (Firth, et al., 1994; Forsythe, et al., 1996). Recently, the chondrocyte
hypertrophic markers VEGFA, COL10A1 and MMP-13 have been shown also to be
targets of HIF-2α, as shown by transcription factor screening, immunoprecipitation,
luciferase reporter assay, site-directed mutagenesis of luciferase assay and ChIP
assay. These data provides solid evidence for the catabolic role of HIF-2α in cartilage
(Saito, et al., 2010). Based on these results, therefore, this study aimed to explore the
mechanistic pathway of ChM-1 with a focus of the regulation of HIF-2α activity.
My results show that HIF-2α could be induced both by hypoxia (1% O2) and TNF-α
stimulation in the chondrocyte cell line C28/I2, which is consistent with previous
106 Chapter 6: ChM-1 inhibits catabolic changes of OA chondrocytes through HIF-2α pathway
studies (Saito, et al., 2010; Yang, et al., 2010). Furthermore, in the surgery-induced
OA rat model, my results showed that there was no significant difference in HIF-2α
protein expression in either normal or OA rat cartilage. It is not at all surprising to
observe moderately expressed HIF-2α in normal cartilage, considering the low
oxygen tension in cartilage. However, there are great discrepancies concerning the
expression of HIF-2α in OA cartilage, most likely because the short half-life of HIF-
2α protein (approximately 5 min) makes its detection in tissues difficult (Thoms, et
al., 2013). For instance, studies conducted by Yang et al. and Saito et al. showed
increased levels of HIF-2α in human and experimentally-induced mouse OA
cartilage (Saito, et al., 2010; Yang, et al., 2010), whereas a study by Bohensky
reported reduced HIF-2α protein expression in human OA cartilage (Bohensky, et
al., 2009). In my study, the isolated rat femur and tibia samples were immediately
immersed in PFA to avoid protein degradation, and the results showed that HIF-2α
was moderately expressed in rat OA cartilage, but not significantly different to that
seen in normal cartilage, indicating that the decreased O2 tension and increased
inflammation in OA environment did not increase total protein levels of HIF-2α.
To determine any interaction between ChM-1 and the HIF-2α pathway, ChM-1
overexpression in the chondrocyte cell line C28/I2 was achieved by lentivirus
infection of the cells. My results showed that ChM-1 has no effect on the gene and de
novo protein synthesis of HIF-2α. However, this result cannot rule out the influence
of ChM-1 on HIF-2α activity, since regulation of HIF-2α depends on post-
translational hydroxylation and nuclear translocation and not the total protein level.
Interestingly, the data indeed showed that ChM-1 overexpression delays HIF-2α
nuclear translocation at early time-points and inhibits the DNA binding activity of
HIF-2α to the promoter regions of COL10A1, MMP-13 and VEGFA, indicating the
protective effect of ChM-1 on TNF-α-induced hypertrophy might be achieved, at
least in part, through the inhibition of HIF-2α activity. This could also explain why,
in normal cartilage in vivo, HIF-2α fails to induce angiogenesis factors and catabolic
markers. It may be that in normal cartilage, the abundant expression of ChM-1
blocks the angiogenic and hypertrophic activity of HIF-2α, whereas in OA cartilage,
the catabolic function of HIF-2α is unlocked due to a lack of ChM-1.
Although ChM-1 overexpression has no effect on gene expression of PHD2, it will
be interesting to detect the protein level of PHD2 as it initiates the first step of HIF

Chapter 6: ChM-1 inhibits catabolic changes of OA chondrocytes through HIF-2α pathway 107
degradation. And also it is still not clear whether ChM-1 could directly interact with
HIF-2α or influence other co-transactivators of HIFs pathway, such as STAT3, p300
and up-stream stimulating factor 2 (USF2). As ChM-1 has been shown to suppress
STAT activity in human cancer cells (Mera, et al., 2009), the inhibitory effect of
ChM-1 on the HIF pathways may be through these co-transactivators. Further studies
are needed to address these questions.
In conclusion, my results demonstrated that ChM-1 delays the translocation of HIF-
2α into the nucleus and inhibits transcriptional activation of HIF-2α on the genes
COL10A1, MMP-13 and VEGFA. Based on the results it has been summarized in
the following scheme illustration (Figure 6-6) for the possible mechanism of ChM-1
in preventing the HIF-2α nuclear translation and binding on the promotors for
hypertrophic markers. The data suggests a novel mechanism of ChM-1 in
maintaining chondrocyte phenotype and preventing hypertrophy.

108 Chapter 6: ChM-1 inhibits catabolic changes of OA chondrocytes through HIF-2α pathway
Figure 6-6. Schematic illustration of underlying molecular mechanisms of ChM-1. HIF-2α is a
catabolic regulator of osteoarthritis cartilage, which directly targets hypertrophic genes of VEGFA,
COL10A1 and MMP-13 (Saito, et al., 2010). This study showed that ChM-1 inhibits the translocation
of HIF-2α into the nucleus at early time-points and inhibits transcriptional activation of HIF-2α on the
genes COL10A1, MMP-13 and VEGFA. And thus ChM-1 protects chondrocyte phenotype and
prevents hypertrophy.
Chapter 7: Conclusion and Discussion 109
Chapter 7: Conclusion and Discussion
7.1 INTRODUCTION
Cartilage is a highly specialized connective tissue with an avascular structure and
limited innate regenerative ability. Osteoarthritis (OA) is the most common form of
musculoskeletal disorder and a leading cause of disability in the elderly (Woolf &
Pfleger, 2003). The key pathophysiological features of OA joints include articular
cartilage degradation and abnormal subchondral bone metabolism; however the
aetiology is largely unknown. Apart from providing relief for symptomatic pain, the
most common treatment option for OA patients is joint (knee/hip) replacement
surgeries, since there is no treatment available to slow down the cartilage degradation
and OA progression. Normal cartilage maintains a stable phenotype that suppresses
hypertrophy and angiogenesis throughout life. The molecular and cellular basis for
the ability to maintain the chondrocyte phenotype and cartilage homeostasis is still
poorly understood. It is important to gain a better understanding of the physiology of
healthy cartilage in order to develop therapies with which to arrest or reverse OA
progression. Therefore, the specific biological factors responsible for maintaining
cartilage homeostasis must be identified and targeted to fulfil the goal of disease
medication.
Angiogenesis, controlled by a balance between endogenous angiogenic and anti-
angiogenic factors, has been found to contribute to pathogenesis of OA. Normal
cartilage is known to contain considerable amounts of anti-angiogenic factors, which
are extensively expressed in chondrocyte cytoplasm and cartilage matrix (Bonnet &
Walsh, 2005; Patra & Sandell, 2012). Of the anti-angiogenic factors, ChM-1 is the
one most specific and abundantly expressed in cartilage and its expression closely
related with the chondrocyte phenotype. The regulatory effect of ChM-1 in
chondrocyte maturation and bone remodelling has been verified in genetically
modified mice (Nakamichi, et al., 2003; Yukata, et al., 2008). Motivated by these
findings, the aim of this project was to address the balance between angiogenesis and
anti-angiogenesis in OA cartilage with a focus on the function of ChM-1. As part of

110 Chapter 7: Conclusion and Discussion
this study I performed an expression profiling of angiogenic-related cytokines in
human OA cartilage. The involvement of ChM-1 in chondrogenesis and OA
progression were investigated in a rat OA model and in vitro using human articular
cartilage chondrocytes cell culture, in an effort to determine the prevention of
chondrocyte hypertrophy and the molecular mechanism underlying ChM-1’s
function. The overarching goal of this study was to gain a better understanding of the
aetiology of OA thus providing new insights into the molecular mechanisms of OA
progression, and also potential new treatment options for OA.
7.2 PROJECT DESIGN AND MAIN FINDINGS
The first aim of this study was to build an expression profile of angiogenesis-related
cytokines in OA cartilage, as shown in Chapter 4. In normal articular cartilage, anti-
angiogenic factors play a dominant role, since in normal physiological conditions
cartilage is essentially devoid of a vasculature. However, this property appears to be
lost in OA cartilage, in which blood vessels and channels invade from the
subchondral bone into the calcified and noncalcified cartilage in OA (Suri, et al.,
2007; Suri & Walsh, 2012). The distribution of angiogenesis-related factors in OA
cartilage is largely unknown, as previous studies on angiogenesis regulators usually
focused on osteoarthritic synovium and synovial fluid (Bonnet & Walsh, 2005). The
data from this study demonstrated disequilibrium between the expression of
angiogenic and anti-angiogenic factors in cartilage tissue. It was demonstrated that a
significant down-regulation of some anti-angiogenic factors in severe OA cartilage
and an up-regulation of angiogenic signalling molecules, providing further evidence
that a shift from anti-angiogenesis to angiogenesis precipitates osteoarthritis in
cartilage. The altered angiogenic profile in OA cartilage not only explains the
observed invasion of blood vessels, but also indicates that the loss of the anti-
angiogenic phenotype may be one of the most important characteristic of OA
cartilage and that its role in cartilage destruction has been underestimated.
Specifically, my results confirmed a down-regulation of ChM-1 and up-regulation of
VEGFA in OA cartilage samples. The mRNA levels of several anti-angiogenic
factors (ChM-1, TIMP-1, TIMP-2, TSP-1 and TSP-2) were decreased in OA
cartilage. Furthermore, I also identified an up-regulation of VEGFR2, PECAM-1,

Chapter 7: Conclusion and Discussion 111
VE-Cadherin, ANGPT2, TIE2, AKT, CXCL5, CXCL6, PF4 and ANGPTL4, whose
relationship with osteoarthritis has never previously been reported. Among these, the
angiopoietin-Tie system might be of great interests in future OA research, since
angiopoietin-Tie system has been shown to have a deteriorating effect on rheumatoid
arthritis (RA) (Hashiramoto, et al., 2007).
In part two of this study (Chapter 5), I focused the on the function of the anti-
angiogenic factor ChM-1. The involvement of ChM-1 in chondrogenesis and OA
progression in vivo and in vitro was systematically studied. First, ChM-1 expression
during chondrocyte maturation was investigated in chondrogenic culture conditions
using cells derived from cartilage and bone marrow. The rationale for this is the fact
that ACCs and BMSCs are the major seed cells for intrinsic cartilage repair and
tissue engineering. My results showed that during chondrogenic differentiation of
ACCs, ChM-1 up-regulation coincided with the expression of the canonical cartilage
markers SOX9 and COL2A1. BMSCs expressed lower levels of ChM-1 than
chondrocytes and were unable to undergo complete chondrogenic differentiation
with less matrix deposition and COL2A1 expression. These results suggest that the
correlation of ChM-1 and chondrogenesis and ChM-1 may act as an anabolic marker
in chondrocyte phenotype.
Since TGF-β3 is commonly used in chondrogenic differentiation protocols, its effect
on ChM-1 expression was evaluated in monolayer-cultured BMSCs. These
experiments showed that TGF-β3 down-regulated ChM-1 gene expression. These
data are in agreement with an earlier report which showed that ChM-1 was down-
regulated when treated with FGF-2, TGF-β2 and PTH-rP (Shukunami & Hiraki,
1998). Currently, the upstream signalling cascades that regulate the intrinsic
expression of ChM-1 in chondrocytes are largely unknown; as such my data all but
rule out TGF-β3 as an upstream regulator of ChM-1. Cartilage regeneration research
has tended to focus on enhancing the expression of anabolic cartilage makers (such
as COL2A1, ACAN and SOX9), however, my results suggest that in addition to
these traditional anabolic markers, the anti-angiogenic nature of cartilage (especially
the expression of ChM-1) deserve greater attention if the goal is to regenerate
cartilage with proper physiological properties.
Subsequently, the effect of ChM-1 on chondrocyte hypertrophy was investigated in
vitro using the pro-inflammatory factor TNF-α to induce hypertrophy. Given the

112 Chapter 7: Conclusion and Discussion
short half-life of recombinant ChM-1 protein (Klinger, et al., 2011), I engineered a
lentivirus construct carrying ChM-1 cDNA and also purchased a ChM-1 siRNA from
a commercial vendor in order to manipulate in vitro ChM-1 gene expression. I
demonstrated in ACCs that TNF-α up-regulates the hypertrophic genes RUNX2,
COL10A1, MMP-13 and VEGFA, and down-regulates ChM-1, which are consistent
with previous reports. Interestingly, ACCs overexpressing ChM-1 were able to resist
TNF-α induced hypertrophy as was seen by their low expression of hypertrophic
markers. This was a strong indication that ChM-1 could protect chondrocytes from
catabolism induced by pro-inflammatory cytokines. In a similar study, Klinger et al
showed that VEGF gene expression was not down-regulated in chondrocytes and
osteochondral progenitor cells infected with AAV-ChM-1 (Klinger, et al., 2011). A
caveat must be made in regards to the different methodologies between mine and
Klinger’s studies. Klinger et al. used ordinary culture medium, whereas in my
experiment TNF-α was used to stimulate the cells to undergo hypertrophy. However,
these observations indicate that ChM-1 may exert its protective effect only in
response to adverse or challenged environment of cartilage. Further evidence from
my pellet culture study is that chondrocytes overexpressing ChM-1 had no
significant effect on the expression of chondrogenic and hypertrophic markers,
including COL2A1, ACAN, RUNX2, MMP-13 and COL10A1. It is well
documented that pellet cultures grown in chondrogenic differentiation medium better
maintains the cartilaginous properties, such as the expression and deposition of
COL2A1 and aggrecan (Mauck et al., 2006). It will be of interest to determine
whether ChM-1 has a protective effect on pellet culture in challenged situation, such
as cytokine stimulation or mechanical loading, which will be the subject to future
studies.
Encouraged by the in vitro results, I decided to test the functional relevance of ChM-
1 supplementation to OA progression in an in vivo model. I found that ChM-1
overexpression in articular chondrocytes significantly ameliorated OA progression at
5-weeks, characterized by reduced COL10A1, MMP-13 and VEGFA expression and
matrix degradation. Klinger et al showed that osteochondral progenitor cells infected
with AAV-ChM-1 stimulated chondrogenic differentiation and inhibited
endochondral ossification as was evidenced by decreased COL10A1 abundance in a
micro-fractured cartilage repair model, whereas ChM-1 had no effect on VEGFA

Chapter 7: Conclusion and Discussion 113
gene expression in vitro (Klinger, et al., 2011). By contrast, my study demonstrated
that ChM-1 could suppress up-regulation of VEGFA and COL10A1 both when
challenged by TNF-α induced inflammation, as well as in an MSX-induced OA rat
model. The data implies that ChM-1 may not target angiogenic and hypertrophic
genes directly, but target the signals of initiating these catabolic genes. However, at
the late stage of OA (9-weeks post-surgery) there was no statistically significant
difference in Mankin scores between treated and non-ChM-1 treated animals,
suggesting that ChM-1 did not have any effect in reducing cartilage matrix
degradation in this model. Furthermore, immunostaining revealed a decrease in
ChM-1 expression at 9-weeks, an observation that may be due to degradation of
ChM-1 itself, since it has been shown that the N-terminal 14 kDa truncated form of
ChM-1 is present in the hypertrophic and calcified zone of cartilage in developing
long bone (Miura, et al., 2014) and has little inhibitory effect on angiogenesis in
contrast to the intact 25 kDa form. These results also indicate other mechanisms
regulate ChM-1 in vivo function at the post-transcriptional level (Miura, et al., 2014).
In my study, lentivirus carrying ChM-1 efficiently increased gene level of ChM-1;
however, at late stage OA cartilage, the intact form of ChM-1 may be proteolyzed,
thus compromising its protective effect in cartilage. Nevertheless, my in vivo data
showed that ChM-1 supplementation could at least delay the effects of OA
progression, providing evidence of the utility of anti-angiogenesis as a therapeutic
strategy of OA.
In third part of this study, I set out to explore the molecular mechanism by which
ChM-1 maintains the chondrocyte phenotype and exerts its anti-hypertrophic
function (Chapter 6). To recap, hypoxia is the normal physiologic environment for
articular cartilage and is the optimal condition required to induce the chondrocyte
phenotype. However, it is well documented that hypoxia initiates an angiogenic
signals by stabilizing HIF-1α and/or HIF-2α. It has been found that hypoxia induced
VEGF expression is HIF-1α-dependent in chondrocyte, indicating that the hypoxia
response pathway is intact in cartilage (Lin, et al., 2004). Coincidently, two recent
studies from independent groups reported that HIF-2α, as a transcriptional factor,
could directly target hypertrophic genes of VEGFA, COL10A1, MMP-13 and
RUNX2 in OA cartilage (Saito, et al., 2010; Yang, et al., 2010). The scientific
literature concerning the HIF-2α abundance in OA cartilage is contradictory, with

114 Chapter 7: Conclusion and Discussion
reports of both increased and decreased level; however, there is no doubt that
considerable amounts of HIF-2α is found in healthy articular cartilage (Bohensky, et
al., 2009; Coimbra, et al., 2004). HIFs have been regarded as master regulator of
VEGFA (Lin, et al., 2004; Liu, et al., 1995), however, my results show that HIF-1α
and HIF-2α protein was detectable in both normal and OA rat cartilage with no
significant difference, whereas VEGFA is significantly up-regulated in OA
conditions. This suggests that in normal cartilage tissue the HIF-VEGF axis is
otherwise kept in check by certain mechanisms. It seems that chondrocytes in normal
cartilage could block angiogenic and hypertrophic pathways induced by HIFs,
whereas OA derived chondrocytes were unable to do so. This mechanism is
fundamentally important in cartilage biology. Here, I speculated that ChM-1, as an
intrinsic and abundant protein in cartilage, may play a regulatory role in HIFs’
function. As my result shows, HIF-2α is not only sensitive to oxygen levels, but can
also be induced by non-hypoxic mechanisms including stimulation by the
inflammatory cytokine TNF-α. This latter finding is consistent with Yang’s study in
which murine chondrocytes were used (Yang, et al., 2010). My data, for the first
time, showed that ChM-1 overexpression delays HIF-2α nucleus translocation at
early time-points. However, at the 2 h time-point, there is no discernible difference in
cells overexpressing ChM-1 compared with controls. As cartilage need long-term
maintenance and OA is a disease with a long lead time, the short timeframe involved
would have negligible effect on the function of HIF-2α. Next, I tested if ChM-1
could influence the intra-nuclear function of HIF-2α and the data showed that ChM-1
inhibits the DNA binding activity of HIF-2α to the promoter regions of COL10A1,
MMP-13 and VEGFA. This indicates a protective effect of ChM-1 on TNF-α
induced hypertrophy might be achieved, at least in part, through the inhibition of
HIF-2α activity. This may also explain why HIF-2α in normal in vivo cartilage fails
to induce angiogenic factors and catabolic markers. It could be speculated that in
normal cartilage, the abundant expression of ChM-1 blocks the angiogenic and
hypertrophic activity of HIF-2α, whereas in OA cartilage, the catabolic function of
HIF-2α is unlocked due to lack of ChM-1.
Taken together, this is the first study to look at the potential of ChM-1 as an
osteoarthritis treatments strategy and the underlying mechanisms governing this
particular property. The data show that ChM-1 is closely correlated with chondrocyte

Chapter 7: Conclusion and Discussion 115
maturation and stabilizes the chondrocyte phenotype. It was found that the ChM-1
can regulate the catabolic genes of VEGFA, COL10A1 and MMP-13 in
chondrocytes and thus protect chondrocytes from TNF-α-induced hypertrophy. More
importantly, the in vivo study provided evidence that ChM-1 supplementation in
articular chondrocytes delays OA progression. The underlying mechanism could be
the inhibitory effect of ChM-1 on HIF-2α translocation into the nucleus, as well as its
DNA binding activity. My study also suggests ChM-1 supplementation as a potential
therapeutic modality in the treatment of OA. The major findings in this thesis have
been summarised in the following schematic (Figure 7-1).
Figure 7-1. Schematic illustration showing the protective effect of ChM-1 on cartilage homeostasis
and the underlying mechanisms. In normal cartilage, the abundant expression of ChM-1 blocks the
angiogenic and hypertrophic activity of HIF-2α; whereas in OA cartilage, lack of ChM-1 leads to the
activation of HIF-2α signalling pathway, resulting in chondrocyte hypertrophy and cartilage
degradation through the enhancement expression of catabolic genes of COL10A1, MMP-13 and
VEGFA.

116 Chapter 7: Conclusion and Discussion
7.3 CLINICAL IMPLICATIONS
In this study, lentivirus vector was used to carry ChM-1 gene into the cartilage. In
recent years, research has focused on the lentivirus vector as a useful gene therapy
tool. Lentivirus vector have the advantages of not producing viral proteins and are
not capable of replication; they are also specifically designed to transduce non-
dividing cells, which make this method particularly suitable to treat post-mitotic and
highly differentiated cell types (Escors & Breckpot, 2010; Fleming, et al., 2001). The
first approved human clinical trial using lentivirus vector were for the treatment of
acquired immune deficiency syndrome (AIDS), and for which no proof of
oncogenesis has been reported (Escors & Breckpot, 2010). There are over one
hundred approved clinical trials using lentivirus-based gene therapy, which occupy
4.6% of total clinical trials using viral vectors (Escors & Breckpot, 2010; Manilla et
al., 2005). Lentivirus have been widely used in gene therapy for metabolic diseases,
including β–thalassemia (Zhao et al., 2009) and severe combined immunodeficiency
(SCID) (Mortellaro et al., 2006).
In gene therapy of osteoarthritis, there are two potential sites for gene transfer: (1)
the synovium and (2) the articular cartilage (Evans et al., 2004). The cartilage matrix
may serve as a barrier to in vivo gene transductions. Lentivirus has been seen as
providing long-term transgene expression and low immunogenicity (Evans, 2004;
Evans, et al., 2004). Besides my study, there are other preliminary reports concerning
gene transfer in cartilage that utilized liposomal formulation (Tomita et al., 1997),
AAV (Arai et al., 2000) and lentivirus technologies (Chu et al., 2013; Zhu et al.,
2015). Although the transduction efficiency in my study was satisfactory, the
immunogenicity of lentivirus in synovium waits to be clarified and will be the
subject of future studies. It is hoped that lentiviral vectors will have the necessary
safety and therapeutic value in a clinical setting.
Besides gene therapy, other treatment option could be used to combine the ChM-1
protein or its functional peptides with appropriate slowly-releasing drug carriers,
such as hydrogels, which can be delivered locally into joint space. The consistency of
results and the safety concerns might be the most important issues when utilizing
ChM-1 products in the clinic, and various animal models, ranging from small size to
large size, are needed to verify the results before proceeding with clinic trials.

Chapter 7: Conclusion and Discussion 117
7.4 LIMITATION
The limitations of the particular research approach have been discussed throughout
the individual chapters of this thesis. In particular, this study focused the function of
ChM-1 itself, but did not explore how ChM-1 itself is regulated. This study showed a
correlation of ChM-1 and chondrogenesis and that ChM-1 may act as an anabolic
marker in the chondrocyte phenotype; however, ChM-1 protein can be induced in
chondrogenic differentiation of ACCs in pellet culture system, and ChM-1
overexpression by itself did not enhance chondrogenesis, indicating that
chondrocytes may possess an intrinsic mechanism to regulate ChM-1. The upstream
signals that regulate ChM-1 are largely unknown.
Furthermore, there is lack of full understanding concerning the metabolism of ChM-
1 protein, especially at the post-transcriptional level. Recently, the truncated 14 kDa
N-terminal form of ChM-1 has been identified in hypertrophic and calcified zone of
cartilage in developing long bones (Miura, et al., 2014). This ChM-1 cleavage
product has limited inhibitory effects on angiogenesis, in contrast to the full-length
25 kDa form, indicating mechanisms regulating ChM-1 function at the post-
transcriptional level (Miura, et al., 2014). My data showed that lentivirus carrying
ChM-1 efficiently increased gene and protein expression of ChM-1 at early time-
point (5-weeks), whereas the abundance of ChM-1 seems to be decreased at later
time-point (9-weeks). This result is probably due to the efficiency of gene delivery
vector as well as other deteriorating factors at late stage of OA (such as mechanical
loading, inflammation), or, alternatively, degradation of the ChM-1 protein. In late
stage OA cartilage, the intact form of ChM-1 may be proteolyzed, thus
compromising its protective effects in cartilage. Further studies will aim to clarify the
post-transcriptional regulation of ChM-1, as well as to develop more sustained
strategy to improve ChM-1 efficiency as an OA therapy.
In addition to this, my data showed an inhibitory effect of ChM-1 on HIF-2α nuclear
translocation and DNA binding activity. However, it is still not clear whether ChM-1
interacts directly with HIF-2α or influences other co-transactivators of HIFs
pathway, such as STAT3, p300 and USF2. As ChM-1 has been shown to suppress
STAT activity in human cancer cells (Mera, et al., 2009), the inhibitory effect of
ChM-1 in HIFs pathway may be via these co-transactivators. Also, it is still unclear
118 Chapter 7: Conclusion and Discussion
whether ChM-1 influences HIF-1α function. Further studies, such as
immnunoprecipitation and luciferase assay, are needed to address all these questions.
7.5 FUTURE DIRECTION
This study has demonstrated the protective effect of ChM-1 in chondrocyte
hypertrophy and OA progression in vitro, as well as in surgery-induced OA animal
model in vivo. As discussed previously (refer to 7.3 Limitation), it is of great
importance to discover the upstream and post-transcriptional regulation of ChM-1.
Earlier studies have reported that ChM-1 is a hypoxia-inducible and SOX9-regulated
gene in human articular chondrocytes (Lafont, et al., 2008). However, there is no
detailed molecular evidence yet to support this notion. My results showed that the
chondrogenic stimulator TGF-β3 significantly up-regulated SOX9 and COL2A1, but
had no positive influence on ChM-1 expression, which may indicate that SOX9 is
not an upstream regulator of ChM-1. Further studies are required to identify the
master regulator of ChM-1, as well as chondrocyte phenotype.
It has been a controversial issue for long time concerning whether hypoxia is
beneficial for chondrocyte differentiation and cartilage homeostasis. The scientific
literature concerning functions of HIF-1α and HIF-2α in cartilage is contradictory,
with claims of both anabolic and catabolic effects; although the majority of studies
considered HIF-1α to have an anabolic role and HIF-2α a catabolic role in
chondrocytes. My result showed that ChM-1 could inhibit HIF-2α activity in
chondrocytes, which goes some way in explaining why hypoxia in normal in vivo
cartilage does not induce angiogenic factors or catabolic markers. An exploration of
this mechanism in vivo would be of great interest.
Furthermore, my results also indicate the homeostasis of cartilage, as an avascular
and hypoxic tissue, is maintained by a complicated molecular network. Factors other
than HIF-1α and HIF-2α, needs to be identified, to clarify the unique feature that is
hypoxia in cartilage. It is also of great interest to further clarify the molecular
mechanism of ChM-1, such as to identify its receptor or binding protein by
immnunoprecipitation, to screen signalling pathway related to ChM-1 using signal
transduction reporter array, and to discover potential target genes of ChM-1 using
luciferase assay.

Chapter 7: Conclusion and Discussion 119
7.6 CONCLUDING REMARKS
This study highlights the importance of anti-angiogenic factors in cartilage
homeostasis and osteoarthritis progression. In particular, the findings of this study
indicate that the anti-angiogenic protein ChM-1 is important to maintain the
chondrocyte phenotype and prevent hypertrophy, by inhibiting the catabolic factors
of COL10A1, MMP-13 and VEGFA. The underlying mechanism for this may be the
inhibitory effect of ChM-1 on catabolic activities of transcriptional factor HIF-2α.
More importantly, the in vivo study showed evidence that ChM-1 supplementation in
articular chondrocytes delays OA progression. The findings from this work provide a
new perspective on the molecular mechanisms of cartilage maintenance and OA
progression, and also points to potential treatment options for OA.

Bibliography 121
Bibliography
Akiyama, H., Chaboissier, M. C., Behringer, R. R., Rowitch, D. H., Schedl, A.,
Epstein, J. A., et al. (2004). Essential role of Sox9 in the pathway that
controls formation of cardiac valves and septa. Proc Natl Acad Sci U S A,
101(17), 6502-6507.
Akiyama, H., Chaboissier, M. C., Martin, J. F., Schedl, A., & de Crombrugghe, B.
(2002). The transcription factor Sox9 has essential roles in successive steps of
the chondrocyte differentiation pathway and is required for expression of
Sox5 and Sox6. Genes Dev, 16(21), 2813-2828.
Akiyama, H., Kim, J. E., Nakashima, K., Balmes, G., Iwai, N., Deng, J. M., et al.
(2005). Osteo-chondroprogenitor cells are derived from Sox9 expressing
precursors. Proc Natl Acad Sci U S A, 102(41), 14665-14670.
Altman, R. D. (2010). Early management of osteoarthritis. Am J Manag Care, 16
Suppl Management, S41-47.
Arai, Y., Kubo, T., Fushiki, S., Mazda, O., Nakai, H., Iwaki, Y., et al. (2000). Gene
delivery to human chondrocytes by an adeno associated virus vector. J
Rheumatol, 27(4), 979-982.
Archer, C. W., & Francis-West, P. (2003). The chondrocyte. Int J Biochem Cell Biol,
35(4), 401-404.
Augustin, H. G., Koh, G. Y., Thurston, G., & Alitalo, K. (2009). Control of vascular
morphogenesis and homeostasis through the angiopoietin-Tie system. Nat
Rev Mol Cell Biol, 10(3), 165-177.
Bakker, A., van de Loo, F., Van Beuningen, H., Sime, P., van Lent, P., Van der
Kraan, P., et al. (2001). Overexpression of active TGF-beta-1 in the murine
knee joint: evidence for synovial-layer-dependent chondro-osteophyte
formation. Osteoarthritis Cartilage, 9(2), 128-136.
Blanke, M., Carl, H. D., Klinger, P., Swoboda, B., Hennig, F., & Gelse, K. (2009).
Transplanted chondrocytes inhibit endochondral ossification within cartilage
repair tissue. Calcif Tissue Int, 85(5), 421-433.
Bohensky, J., Terkhorn, S. P., Freeman, T. A., Adams, C. S., Garcia, J. A., Shapiro,
I. M., et al. (2009). Regulation of autophagy in human and murine cartilage:

122 Bibliography
hypoxia-inducible factor 2 suppresses chondrocyte autophagy. Arthritis
Rheum, 60(5), 1406-1415.
Bonnet, C. S., & Walsh, D. A. (2005). Osteoarthritis, angiogenesis and inflammation.
Rheumatology (Oxford), 44(1), 7-16.
Brandau, O., Aszodi, A., Hunziker, E. B., Neame, P. J., Vestweber, D., & Fassler, R.
(2002). Chondromodulin I is dispensable during enchondral ossification and
eye development. Mol Cell Biol, 22(18), 6627-6635.
Bruick, R. K., & McKnight, S. L. (2001). A conserved family of prolyl-4-
hydroxylases that modify HIF. Science, 294(5545), 1337-1340.
Buckwalter, J. A., & Mankin, H. J. (1998). Articular cartilage: tissue design and
chondrocyte-matrix interactions. Instr Course Lect, 47, 477-486.
Cawston, T. E., & Wilson, A. J. (2006). Understanding the role of tissue degrading
enzymes and their inhibitors in development and disease. Best Pract Res Clin
Rheumatol, 20(5), 983-1002.
Chae, K. S., Kang, M. J., Lee, J. H., Ryu, B. K., Lee, M. G., Her, N. G., et al. (2011).
Opposite functions of HIF-alpha isoforms in VEGF induction by TGF-beta1
under non-hypoxic conditions. Oncogene, 30(10), 1213-1228.
Chu, X., You, H., Yuan, X., Zhao, W., Li, W., & Guo, X. (2013). Protective effect of
lentivirus-mediated siRNA targeting ADAMTS-5 on cartilage degradation in
a rat model of osteoarthritis. Int J Mol Med, 31(5), 1222-1228.
Coggon, D., Croft, P., Kellingray, S., Barrett, D., McLaren, M., & Cooper, C. (2000).
Occupational physical activities and osteoarthritis of the knee. Arthritis
Rheum, 43(7), 1443-1449.
Coimbra, I. B., Jimenez, S. A., Hawkins, D. F., Piera-Velazquez, S., & Stokes, D. G.
(2004). Hypoxia inducible factor-1 alpha expression in human normal and
osteoarthritic chondrocytes. Osteoarthritis Cartilage, 12(4), 336-345.
Cushnaghan, J., & Dieppe, P. (1991). Study of 500 patients with limb joint
osteoarthritis. I. Analysis by age, sex, and distribution of symptomatic joint
sites. Ann Rheum Dis, 50(1), 8-13.
Davidson, R. K., Waters, J. G., Kevorkian, L., Darrah, C., Cooper, A., Donell, S. T.,
et al. (2006). Expression profiling of metalloproteinases and their inhibitors
in synovium and cartilage. Arthritis Res Ther, 8(4), R124.

Bibliography 123
de Crombrugghe, B., Lefebvre, V., Behringer, R. R., Bi, W., Murakami, S., &
Huang, W. (2000). Transcriptional mechanisms of chondrocyte
differentiation. Matrix Biol, 19(5), 389-394.
DeLise, A. M., Fischer, L., & Tuan, R. S. (2000). Cellular interactions and signaling
in cartilage development. Osteoarthritis Cartilage, 8(5), 309-334.
Duval, E., Leclercq, S., Elissalde, J. M., Demoor, M., Galera, P., & Boumediene, K.
(2009). Hypoxia-inducible factor 1alpha inhibits the fibroblast-like markers
type I and type III collagen during hypoxia-induced chondrocyte
redifferentiation: hypoxia not only induces type II collagen and aggrecan, but
it also inhibits type I and type III collagen in the hypoxia-inducible factor
1alpha-dependent redifferentiation of chondrocytes. Arthritis Rheum, 60(10),
3038-3048.
Ema, M., Taya, S., Yokotani, N., Sogawa, K., Matsuda, Y., & Fujii-Kuriyama, Y.
(1997). A novel bHLH-PAS factor with close sequence similarity to hypoxia-
inducible factor 1α regulates the VEGF expression and is potentially involved
in lung and vascular development. Proc Natl Acad Sci U S A, 94(9), 4273-
4278.
Endres, M., Andreas, K., Kalwitz, G., Freymann, U., Neumann, K., Ringe, J., et al.
(2010). Chemokine profile of synovial fluid from normal, osteoarthritis and
rheumatoid arthritis patients: CCL25, CXCL10 and XCL1 recruit human
subchondral mesenchymal progenitor cells. Osteoarthritis Cartilage, 18(11),
1458-1466.
Enomoto, H., Inoki, I., Komiya, K., Shiomi, T., Ikeda, E., Obata, K., et al. (2003).
Vascular endothelial growth factor isoforms and their receptors are expressed
in human osteoarthritic cartilage. Am J Pathol, 162(1), 171-181.
Epstein, A. C., Gleadle, J. M., McNeill, L. A., Hewitson, K. S., O'Rourke, J., Mole,
D. R., et al. (2001). C. elegans EGL-9 and Mammalian Homologs Define a
Family of Dioxygenases that Regulate HIF by Prolyl Hydroxylation. Cell,
107(1), 43-54.
Escors, D., & Breckpot, K. (2010). Lentiviral vectors in gene therapy: their current
status and future potential. Arch Immunol Ther Exp (Warsz), 58(2), 107-119.
Evans, C. (2004). Gene therapies for osteoarthritis. Curr Rheumatol Rep, 6(1), 31-40.
Evans, C. H., Gouze, J. N., Gouze, E., Robbins, P. D., & Ghivizzani, S. C. (2004).
Osteoarthritis gene therapy. Gene Ther, 11(4), 379-389.

124 Bibliography
Eyre, D. (1995). Collagen structure and function in articular cartilage: Metabolic
changes in the development of osteoarthritis. Osteoarthritic Disorders, 219-
228.
Falchuk, K. H., Goetzl, E. J., & Kulka, J. P. (1969). Respiratory gases of synovial
fluids. Am J Med, 49(2), 223-231.
Felson, D. T., Lawrence, R. C., Dieppe, P. A., Hirsch, R., Helmick, C. G., Jordan, J.
M., et al. (2000). Osteoarthritis: new insights. Part 1: the disease and its risk
factors. Ann Intern Med, 133(8), 635-646.
Firth, J. D., Ebert, B. L., Pugh, C. W., & Ratcliffe, P. J. (1994). Oxygen-regulated
control elements in the phosphoglycerate kinase 1 and lactate dehydrogenase
A genes: similarities with the erythropoietin 3' enhancer. Proc Natl Acad Sci
U S A, 91(14), 6496-6500.
Flamme, I., Fröhlich, T., von Reutern, M., Kappel, A., Damert, A., & Risau, W.
(1997). HRF, a putative basic helix-loop-helix-PAS-domain transcription
factor is closely related to hypoxia-inducible factor-1α and developmentally
expressed in blood vessels. Mech Dev, 63(1), 51-60.
Fleming, J., Ginn, S. L., Weinberger, R. P., Trahair, T. N., Smythe, J. A., &
Alexander, I. E. (2001). Adeno-associated virus and lentivirus vectors
mediate efficient and sustained transduction of cultured mouse and human
dorsal root ganglia sensory neurons. Hum Gene Ther, 12(1), 77-86.
Forsythe, J. A., Jiang, B. H., Iyer, N. V., Agani, F., Leung, S. W., Koos, R. D., et al.
(1996). Activation of vascular endothelial growth factor gene transcription by
hypoxia-inducible factor 1. Mol Cell Biol, 16(9), 4604-4613.
Franses, R. E., McWilliams, D. F., Mapp, P. I., & Walsh, D. A. (2010).
Osteochondral angiogenesis and increased protease inhibitor expression in
OA. Osteoarthritis Cartilage, 18(4), 563-571.
Funaki, H., Sawaguchi, S., Yaoeda, K., Koyama, Y., Yaoita, E., Funaki, S., et al.
(2001). Expression and localization of angiogenic inhibitory factor,
chondromodulin-I, in adult rat eye. Invest Ophthalmol Vis Sci, 42(6), 1193-
1200.
Gelse, K., Beyer, C., Welsch, G., & Blanke, M. (2012). Endochondral Ossification in
Cartilage Repair Tissue Hampers Bone Marrow Stimulating Techniques.
Rheumatology: Current Opinion, S3:002.

Bibliography 125
Gerber, H. P., Vu, T. H., Ryan, A. M., Kowalski, J., Werb, Z., & Ferrara, N. (1999).
VEGF couples hypertrophic cartilage remodeling, ossification and
angiogenesis during endochondral bone formation. Nat Med, 5(6), 623-628.
Giatromanolaki, A., Sivridis, E., Maltezos, E., Athanassou, N., Papazoglou, D.,
Gatter, K. C., et al. (2003). Upregulated hypoxia inducible factor-1alpha and
-2alpha pathway in rheumatoid arthritis and osteoarthritis. Arthritis Res Ther,
5(4), R193-201.
Girkontaite, I., Frischholz, S., Lammi, P., Wagner, K., Swoboda, B., Aigner, T., et
al. (1996). Immunolocalization of type X collagen in normal fetal and adult
osteoarthritic cartilage with monoclonal antibodies. Matrix Biol, 15(4), 231-
238.
Goldring, M. B. (2012). Chondrogenesis, chondrocyte differentiation, and articular
cartilage metabolism in health and osteoarthritis. Ther Adv Musculoskelet
Dis, 4(4), 269-285.
Goldring, M. B., & Marcu, K. B. (2009). Cartilage homeostasis in health and
rheumatic diseases. Arthritis Res Ther, 11(3), 224.
Goldring, M. B., Tsuchimochi, K., & Ijiri, K. (2006). The control of chondrogenesis.
J Cell Biochem, 97(1), 33-44.
Grimmer, C., Pfander, D., Swoboda, B., Aigner, T., Mueller, L., Hennig, F. F., et al.
(2007). Hypoxia-inducible factor 1alpha is involved in the prostaglandin
metabolism of osteoarthritic cartilage through up-regulation of microsomal
prostaglandin E synthase 1 in articular chondrocytes. Arthritis Rheum,
56(12), 4084-4094.
Gu, W., Payne, E., Sun, S., Burgess, M., & McMillan, N. A. (2011). Inhibition of
cervical cancer cell growth in vitro and in vivo with dual shRNAs. Cancer
Gene Ther, 18(3), 219-227.
Hargus, G., Kist, R., Kramer, J., Gerstel, D., Neitz, A., Scherer, G., et al. (2008).
Loss of Sox9 function results in defective chondrocyte differentiation of
mouse embryonic stem cells in vitro. Int J Dev Biol, 52(4), 323-332.
Hashiramoto, A., Sakai, C., Yoshida, K., Tsumiyama, K., Miura, Y., Shiozawa, K.,
et al. (2007). Angiopoietin 1 directly induces destruction of the rheumatoid
joint by cooperative, but independent, signaling via ERK/MAPK and
phosphatidylinositol 3-kinase/Akt. Arthritis Rheum, 56(7), 2170-2179.
126 Bibliography
Hayami, T., Funaki, H., Yaoeda, K., Mitui, K., Yamagiwa, H., Tokunaga, K., et al.
(2003). Expression of the cartilage derived anti-angiogenic factor
chondromodulin-I decreases in the early stage of experimental osteoarthritis.
J Rheumatol, 30(10), 2207-2217.
Hayami, T., Shukunami, C., Mitsui, K., Endo, N., Tokunaga, K., Kondo, J., et al.
(1999). Specific loss of chondromodulin-I gene expression in
chondrosarcoma and the suppression of tumor angiogenesis and growth by its
recombinant protein in vivo. FEBS Lett, 458(3), 436-440.
Hill, M. A. (2014). Embryology Articular cartilage.jpg. . Retrieved from
https://php.med.unsw.edu.au/embryology/index.php?title=File:Articular_cart
ilage.jpg
Hiraki, Y., Inoue, H., Iyama, K., Kamizono, A., Ochiai, M., Shukunami, C., et al.
(1997a). Identification of chondromodulin I as a novel endothelial cell growth
inhibitor. Purification and its localization in the avascular zone of epiphyseal
cartilage. J Biol Chem, 272(51), 32419-32426.
Hiraki, Y., Kono, T., Sato, M., Shukunami, C., & Kondo, J. (1997b). Inhibition of
DNA synthesis and tube morphogenesis of cultured vascular endothelial cells
by chondromodulin-I. FEBS Lett, 415(3), 321-324.
Hiraki, Y., Miura, S., Nishizaki, Y., & Shukunami, C. (2009). Chondromodulin-I: A
Growth-Modulating Functional Matrix in Cartilage. Inflammation and
Regeneration, 29(5), 317-323.
Hiraki, Y., Tanaka, H., Inoue, H., Kondo, J., Kamizono, A., & Suzuki, F. (1991).
Molecular cloning of a new class of cartilage-specific matrix,
chondromodulin-I, which stimulates growth of cultured chondrocytes.
Biochem Biophys Res Commun, 175(3), 971-977.
Hirata, M., Kugimiya, F., Fukai, A., Saito, T., Yano, F., Ikeda, T., et al. (2012).
C/EBPbeta and RUNX2 cooperate to degrade cartilage with MMP-13 as the
target and HIF-2alpha as the inducer in chondrocytes. Hum Mol Genet, 21(5),
1111-1123.
Hogenesch, J. B., Chan, W. K., Jackiw, V. H., Brown, R. C., Gu, Y.-Z., Pray-Grant,
M., et al. (1997). Characterization of a subset of the basic-helix-loop-helix-
PAS superfamily that interacts with components of the dioxin signaling
pathway. J Biol Chem, 272(13), 8581-8593.
Bibliography 127
Huang, L. E., Arany, Z., Livingston, D. M., & Bunn, H. F. (1996). Activation of
Hypoxia-inducible Transcription Factor Depends Primarily upon Redox-
sensitive Stabilization of Its α Subunit. J Biol Chem, 271(50), 32253-32259.
Huang, L. E., Gu, J., Schau, M., & Bunn, H. F. (1998). Regulation of hypoxia-
inducible factor 1alpha is mediated by an O2-dependent degradation domain
via the ubiquitin-proteasome pathway. Proc Natl Acad Sci U S A, 95(14),
7987-7992.
Hunter, D. J., McDougall, J. J., & Keefe, F. J. (2008). The symptoms of osteoarthritis
and the genesis of pain. Rheum Dis Clin North Am, 34(3), 623-643.
Husa, M., Liu-Bryan, R., & Terkeltaub, R. (2010). Shifting HIFs in osteoarthritis.
Nat Med, 16(6), 641-644.
Ikeda, T., Kamekura, S., Mabuchi, A., Kou, I., Seki, S., Takato, T., et al. (2004). The
combination of SOX5, SOX6, and SOX9 (the SOX trio) provides signals
sufficient for induction of permanent cartilage. Arthritis Rheum, 50(11),
3561-3573.
Inoue, H., Kondo, J., Koike, T., Shukunami, C., & Hiraki, Y. (1997). Identification
of an autocrine chondrocyte colony-stimulating factor: chondromodulin-I
stimulates the colony formation of growth plate chondrocytes in agarose
culture. Biochem Biophys Res Commun, 241(2), 395-400.
Ivan, M., Kondo, K., Yang, H., Kim, W., Valiando, J., Ohh, M., et al. (2001). HIFα
targeted for VHL-mediated destruction by proline hydroxylation:
implications for O2 sensing. Science, 292(5516), 464-468.
Jaakkola, P., Mole, D. R., Tian, Y. M., Wilson, M. I., Gielbert, J., Gaskell, S. J., et
al. (2001). Targeting of HIF-alpha to the von Hippel-Lindau ubiquitylation
complex by O2-regulated prolyl hydroxylation. Science, 292(5516), 468-472.
Jacenko, O., LuValle, P. A., & Olsen, B. R. (1993). Spondylometaphyseal dysplasia
in mice carrying a dominant negative mutation in a matrix protein specific for
cartilage-to-bone transition. Nature, 365(6441), 56-61.
Jackson, A., & Gu, W. (2009). Transport properties of cartilagious tissues. Curr
Rheumatol Rev, 5(1), 40.
Jiang, B. H., Rue, E., Wang, G. L., Roe, R., & Semenza, G. L. (1996). Dimerization,
DNA binding, and transactivation properties of hypoxia-inducible factor 1. J
Biol Chem, 271(30), 17771-17778.

128 Bibliography
Jiang, B. H., Zheng, J. Z., Leung, S. W., Roe, R., & Semenza, G. L. (1997).
Transactivation and inhibitory domains of hypoxia-inducible factor 1alpha.
Modulation of transcriptional activity by oxygen tension. J Biol Chem,
272(31), 19253-19260.
Jiang, Y., Chen, L., Zhang, S., Tong, T., Zhang, W., Liu, W., et al. (2013).
Incorporation of bioactive polyvinylpyrrolidone-iodine within bilayered
collagen scaffolds enhances the differentiation and subchondral osteogenesis
of mesenchymal stem cells. Acta Biomater, 9(9), 8089-8098.
Kalluri, R., & Zeisberg, E. (2006). Controlling angiogenesis in heart valves. Nat
Med, 12(10), 1118-1119.
Kamekura, S., Kawasaki, Y., Hoshi, K., Shimoaka, T., Chikuda, H., Maruyama, Z.,
et al. (2006). Contribution of runt-related transcription factor 2 to the
pathogenesis of osteoarthritis in mice after induction of knee joint instability.
Arthritis Rheum, 54(8), 2462-2470.
Kaplitt, M. G., Leone, P., Samulski, R. J., Xiao, X., Pfaff, D. W., O'Malley, K. L., et
al. (1994). Long-term gene expression and phenotypic correction using
adeno-associated virus vectors in the mammalian brain. Nat Genet, 8(2), 148-
154.
Kapoor, M., Martel-Pelletier, J., Lajeunesse, D., Pelletier, J. P., & Fahmi, H. (2011).
Role of proinflammatory cytokines in the pathophysiology of osteoarthritis.
Nat Rev Rheumatol, 7(1), 33-42.
Karsenty, G., Kronenberg, H. M., & Settembre, C. (2009). Genetic control of bone
formation. Annu Rev Cell Dev Biol, 25, 629-648.
Kashiwagi, M., Tortorella, M., Nagase, H., & Brew, K. (2001). TIMP-3 is a potent
inhibitor of aggrecanase 1 (ADAM-TS4) and aggrecanase 2 (ADAM-TS5). J
Biol Chem, 276(16), 12501-12504.
Kawaguchi, H. (2008). Endochondral ossification signals in cartilage degradation
during osteoarthritis progression in experimental mouse models. Mol Cells,
25(1), 1-6.
Klinger, P., Surmann-Schmitt, C., Brem, M., Swoboda, B., Distler, J. H., Carl, H. D.,
et al. (2011). Chondromodulin 1 stabilizes the chondrocyte phenotype and
inhibits endochondral ossification of porcine cartilage repair tissue. Arthritis
Rheum, 63(9), 2721-2731.

Bibliography 129
Knudson, C. B., & Knudson, W. (2001). Cartilage proteoglycans. Semin Cell Dev
Biol, 12(2), 69-78.
Kronenberg, H. M. (2003). Developmental regulation of the growth plate. Nature,
423(6937), 332-336.
Kuettner, K. E., Aydelotte, M. B., & Thonar, E. J. (1991). Articular cartilage matrix
and structure: a minireview. J Rheumatol Suppl, 27, 46-48.
Lafont, J. E. (2010). Lack of oxygen in articular cartilage: consequences for
chondrocyte biology. Int J Exp Pathol, 91(2), 99-106.
Lafont, J. E., Talma, S., Hopfgarten, C., & Murphy, C. L. (2008). Hypoxia promotes
the differentiated human articular chondrocyte phenotype through SOX9-
dependent and -independent pathways. J Biol Chem, 283(8), 4778-4786.
Lando, D., Peet, D. J., Gorman, J. J., Whelan, D. A., Whitelaw, M. L., & Bruick, R.
K. (2002). FIH-1 is an asparaginyl hydroxylase enzyme that regulates the
transcriptional activity of hypoxia-inducible factor. Genes Dev, 16(12), 1466-
1471.
Las Heras, F., Gahunia, H. K., & Pritzker, K. P. (2012). Articular cartilage
development: a molecular perspective. Orthop Clin North Am, 43(2), 155-
171, v.
Lee, R. B., & Urban, J. P. (1997). Evidence for a negative Pasteur effect in articular
cartilage. Biochem J, 321 ( Pt 1), 95-102.
Lee, Y. A., Kim, J. Y., Hong, S. J., Lee, S. H., Yoo, M. C., Kim, K. S., et al. (2007).
Synovial proliferation differentially affects hypoxia in the joint cavities of
rheumatoid arthritis and osteoarthritis patients. Clin Rheumatol, 26(12), 2023-
2029.
Lefebvre, V., Huang, W., Harley, V. R., Goodfellow, P. N., & de Crombrugghe, B.
(1997). SOX9 is a potent activator of the chondrocyte-specific enhancer of
the pro alpha1(II) collagen gene. Mol Cell Biol, 17(4), 2336-2346.
Li, F., Lu, Y., Ding, M., Napierala, D., Abbassi, S., Chen, Y., et al. (2011). Runx2
contributes to murine Col10a1 gene regulation through direct interaction with
its cis-enhancer. J Bone Miner Res, 26(12), 2899-2910.
Lin, A. C., Seeto, B. L., Bartoszko, J. M., Khoury, M. A., Whetstone, H., Ho, L., et
al. (2009). Modulating hedgehog signaling can attenuate the severity of
osteoarthritis. Nat Med, 15(12), 1421-1425.

130 Bibliography
Lin, C., McGough, R., Aswad, B., Block, J. A., & Terek, R. (2004). Hypoxia induces
HIF‐1α and VEGF expression in chondrosarcoma cells and chondrocytes. J
Orthop Res, 22(6), 1175-1181.
Lisignoli, G., Toneguzzi, S., Piacentini, A., Cristino, S., Grassi, F., Cavallo, C., et al.
(2006). CXCL12 (SDF-1) and CXCL13 (BCA-1) chemokines significantly
induce proliferation and collagen type I expression in osteoblasts from
osteoarthritis patients. J Cell Physiol, 206(1), 78-85.
Liu, Y., Cox, S. R., Morita, T., & Kourembanas, S. (1995). Hypoxia regulates
vascular endothelial growth factor gene expression in endothelial cells
identification of a 5′ enhancer. Circ Res, 77(3), 638-643.
Loeser, R. F. (2006). Molecular mechanisms of cartilage destruction: mechanics,
inflammatory mediators, and aging collide. Arthritis Rheum, 54(5), 1357-
1360.
Loeser, R. F. (2009). Aging and osteoarthritis: the role of chondrocyte senescence
and aging changes in the cartilage matrix. Osteoarthritis Cartilage, 17(8),
971-979.
Lorenz, H., & Richter, W. (2006). Osteoarthritis: cellular and molecular changes in
degenerating cartilage. Prog Histochem Cytochem, 40(3), 135-163.
Lund-Olesen, K. (1970). Oxygen tension in synovial fluids. Arthritis Rheum, 13(6),
769-776.
Maes, C., Kobayashi, T., Selig, M. K., Torrekens, S., Roth, S. I., Mackem, S., et al.
(2010). Osteoblast precursors, but not mature osteoblasts, move into
developing and fractured bones along with invading blood vessels. Dev Cell,
19(2), 329-344.
Manilla, P., Rebello, T., Afable, C., Lu, X., Slepushkin, V., Humeau, L. M., et al.
(2005). Regulatory considerations for novel gene therapy products: a review
of the process leading to the first clinical lentiviral vector. Hum Gene Ther,
16(1), 17-25.
Mankin, H. J., Dorfman, H., Lippiello, L., & Zarins, A. (1971). Biochemical and
Metabolic Abnormalities in Articular Cartilage from Osteo-Arthritic Human
Hips: II. Correlation of morphology with biochemical and metabolic data.
[Journal Article]. J Bone Joint Surg Am, 53(3), 523-537.

Bibliography 131
Mauck, R. L., Yuan, X., & Tuan, R. S. (2006). Chondrogenic differentiation and
functional maturation of bovine mesenchymal stem cells in long-term agarose
culture. Osteoarthritis Cartilage, 14(2), 179-189.
Maynard, M. A., Evans, A. J., Hosomi, T., Hara, S., Jewett, M. A., & Ohh, M.
(2005). Human HIF-3α4 is a dominant-negative regulator of HIF-1 and is
down-regulated in renal cell carcinoma. The FASEB journal, 19(11), 1396-
1406.
Mera, H., Kawashima, H., Yoshizawa, T., Ishibashi, O., Ali, M. M., Hayami, T., et
al. (2009). Chondromodulin-1 directly suppresses growth of human cancer
cells. BMC Cancer, 9, 166.
Michael, J. W., Schluter-Brust, K. U., & Eysel, P. (2010). The epidemiology,
etiology, diagnosis, and treatment of osteoarthritis of the knee. Dtsch Arztebl
Int, 107(9), 152-162.
Miura, S., Kondo, J., Takimoto, A., Sano-Takai, H., Guo, L., Shukunami, C., et al.
(2014). The N-Terminal Cleavage of Chondromodulin-I in Growth-Plate
Cartilage at the Hypertrophic and Calcified Zones during Bone Development.
PloS one, 9(4), e94239.
Miura, S., Mitsui, K., Heishi, T., Shukunami, C., Sekiguchi, K., Kondo, J., et al.
(2010). Impairment of VEGF-A-stimulated lamellipodial extensions and
motility of vascular endothelial cells by chondromodulin-I, a cartilage-
derived angiogenesis inhibitor. Exp Cell Res, 316(5), 775-788.
Mollenhauer, J. A., & Erdmann, S. (2002). Introduction: molecular and
biomechanical basis of osteoarthritis. Cell Mol Life Sci, 59(1), 3-4.
Mortellaro, A., Hernandez, R. J., Guerrini, M. M., Carlucci, F., Tabucchi, A.,
Ponzoni, M., et al. (2006). Ex vivo gene therapy with lentiviral vectors
rescues adenosine deaminase (ADA)-deficient mice and corrects their
immune and metabolic defects. Blood, 108(9), 2979-2988.
Murata, M., Yudoh, K., & Masuko, K. (2008). The potential role of vascular
endothelial growth factor (VEGF) in cartilage: how the angiogenic factor
could be involved in the pathogenesis of osteoarthritis? Osteoarthritis
Cartilage, 16(3), 279-286.
Murata, M., Yudoh, K., Nakamura, H., Kato, T., Inoue, K., Chiba, J., et al. (2006).
Distinct signaling pathways are involved in hypoxia- and IL-1-induced VEGF
expression in human articular chondrocytes. J Orthop Res, 24(7), 1544-1554.

132 Bibliography
Murphy, G., Knauper, V., Lee, M. H., Amour, A., Worley, J. R., Hutton, M., et al.
(2003). Role of TIMPs (tissue inhibitors of metalloproteinases) in pericellular
proteolysis: the specificity is in the detail. Biochem Soc Symp(70), 65-80.
Murphy, G., & Lee, M. H. (2005). What are the roles of metalloproteinases in
cartilage and bone damage? Ann Rheum Dis, 64 Suppl 4, iv44-47.
Nakamichi, Y., Shukunami, C., Yamada, T., Aihara, K., Kawano, H., Sato, T., et al.
(2003). Chondromodulin I is a bone remodeling factor. Mol Cell Biol, 23(2),
636-644.
Neuhold, L. A., Killar, L., Zhao, W., Sung, M.-L. A., Warner, L., Kulik, J., et al.
(2001). Postnatal expression in hyaline cartilage of constitutively active
human collagenase-3 (MMP-13) induces osteoarthritis in mice. J Clin Invest,
107(1), 35-44.
Ohh, M., Park, C. W., Ivan, M., Hoffman, M. A., Kim, T.-Y., Huang, L. E., et al.
(2000). Ubiquitination of hypoxia-inducible factor requires direct binding to
the beta-domain of the von Hippel-Lindau protein. Nat Cell Biol, 2(7), 423-
427.
Onyekwelu, I., Goldring, M. B., & Hidaka, C. (2009). Chondrogenesis, joint
formation, and articular cartilage regeneration. J Cell Biochem, 107(3), 383-
392.
Oshima, Y., Sato, K., Tashiro, F., Miyazaki, J., Nishida, K., Hiraki, Y., et al. (2004).
Anti-angiogenic action of the C-terminal domain of tenomodulin that shares
homology with chondromodulin-I. J Cell Sci, 117(Pt 13), 2731-2744.
Pacifici, M., Koyama, E., Iwamoto, M., & Gentili, C. (2000). Development of
articular cartilage: what do we know about it and how may it occur? Connect
Tissue Res, 41(3), 175-184.
Patra, D., & Sandell, L. J. (2012). Antiangiogenic and anticancer molecules in
cartilage. Expert Rev Mol Med, 14, e10.
Pearson, R. G., Kurien, T., Shu, K. S., & Scammell, B. E. (2011). Histopathology
grading systems for characterisation of human knee osteoarthritis--
reproducibility, variability, reliability, correlation, and validity. Osteoarthritis
Cartilage, 19(3), 324-331.
Pelttari, K., Winter, A., Steck, E., Goetzke, K., Hennig, T., Ochs, B. G., et al. (2006).
Premature induction of hypertrophy during in vitro chondrogenesis of human
mesenchymal stem cells correlates with calcification and vascular invasion

Bibliography 133
after ectopic transplantation in SCID mice. Arthritis Rheum, 54(10), 3254-
3266.
Pfander, D., Cramer, T., Schipani, E., & Johnson, R. S. (2003). HIF-1alpha controls
extracellular matrix synthesis by epiphyseal chondrocytes. J Cell Sci, 116(Pt
9), 1819-1826.
Pfander, D., & Gelse, K. (2007). Hypoxia and osteoarthritis: how chondrocytes
survive hypoxic environments. Curr Opin Rheumatol, 19(5), 457-462.
Pfander, D., Kobayashi, T., Knight, M. C., Zelzer, E., Chan, D. A., Olsen, B. R., et
al. (2004). Deletion of Vhlh in chondrocytes reduces cell proliferation and
increases matrix deposition during growth plate development. Development,
131(10), 2497-2508.
Pfander, D., Swoboda, B., & Kirsch, T. (2001). Expression of early and late
differentiation markers (proliferating cell nuclear antigen, syndecan-3,
annexin VI, and alkaline phosphatase) by human osteoarthritic chondrocytes.
Am J Pathol, 159(5), 1777-1783.
Provot, S., Zinyk, D., Gunes, Y., Kathri, R., Le, Q., Kronenberg, H. M., et al. (2007).
Hif-1alpha regulates differentiation of limb bud mesenchyme and joint
development. J Cell Biol, 177(3), 451-464.
Pufe, T., Harde, V., Petersen, W., Goldring, M. B., Tillmann, B., & Mentlein, R.
(2004a). Vascular endothelial growth factor (VEGF) induces matrix
metalloproteinase expression in immortalized chondrocytes. J Pathol, 202(3),
367-374.
Pufe, T., Lemke, A., Kurz, B., Petersen, W., Tillmann, B., Grodzinsky, A. J., et al.
(2004b). Mechanical overload induces VEGF in cartilage discs via hypoxia-
inducible factor. Am J Pathol, 164(1), 185-192.
Pullig, O., Weseloh, G., Gauer, S., & Swoboda, B. (2000). Osteopontin is expressed
by adult human osteoarthritic chondrocytes: protein and mRNA analysis of
normal and osteoarthritic cartilage. Matrix Biol, 19(3), 245-255.
Quintana, L., zur Nieden, N. I., & Semino, C. E. (2009). Morphogenetic and
regulatory mechanisms during developmental chondrogenesis: new
paradigms for cartilage tissue engineering. Tissue Eng Part B Rev, 15(1), 29-
41.
Roach, H. I., Yamada, N., Cheung, K. S., Tilley, S., Clarke, N. M., Oreffo, R. O., et
al. (2005). Association between the abnormal expression of matrix-degrading

134 Bibliography
enzymes by human osteoarthritic chondrocytes and demethylation of specific
CpG sites in the promoter regions. Arthritis Rheum, 52(10), 3110-3124.
Robins, J. C., Akeno, N., Mukherjee, A., Dalal, R. R., Aronow, B. J., Koopman, P.,
et al. (2005). Hypoxia induces chondrocyte-specific gene expression in
mesenchymal cells in association with transcriptional activation of Sox9.
Bone, 37(3), 313-322.
Rosenberg, L. (1971). Chemical basis for the histological use of safranin O in the
study of articular cartilage. J Bone Joint Surg Am, 53(1), 69-82.
Roughley, P. J., & Lee, E. R. (1994). Cartilage proteoglycans: Structure and potential
functions. Microsc Res Tech, 28(5), 385-397.
Rousseau, J. C., & Delmas, P. D. (2007). Biological markers in osteoarthritis. Nat
Clin Pract Rheumatol, 3(6), 346-356.
Ryu, J. H., Shin, Y., Huh, Y. H., Yang, S., Chun, C. H., & Chun, J. S. (2012).
Hypoxia-inducible factor-2[alpha] regulates Fas-mediated chondrocyte
apoptosis during osteoarthritic cartilage destruction. Cell Death Differ, 19(3),
440-450.
Saito, T., Fukai, A., Mabuchi, A., Ikeda, T., Yano, F., Ohba, S., et al. (2010).
Transcriptional regulation of endochondral ossification by HIF-2 [alpha]
during skeletal growth and osteoarthritis development. Nat Med, 16(6), 678-
686.
Salceda, S., & Caro, J. (1997). Hypoxia-inducible factor 1alpha (HIF-1alpha) protein
is rapidly degraded by the ubiquitin-proteasome system under normoxic
conditions. Its stabilization by hypoxia depends on redox-induced changes. J
Biol Chem, 272(36), 22642-22647.
Sato, S., Kimura, A., Ozdemir, J., Asou, Y., Miyazaki, M., Jinno, T., et al. (2008).
The distinct role of the Runx proteins in chondrocyte differentiation and
intervertebral disc degeneration: findings in murine models and in human
disease. Arthritis Rheum, 58(9), 2764-2775.
Schipani, E., Ryan, H. E., Didrickson, S., Kobayashi, T., Knight, M., & Johnson, R.
S. (2001). Hypoxia in cartilage: HIF-1alpha is essential for chondrocyte
growth arrest and survival. Genes Dev, 15(21), 2865-2876.
Schmid, T. M., Cole, A. A., Chen, Q., Bonen, D. K., Luchene, L., & Linsenmayer, T.
(1994). Assembly of type X collagen by hypertrophic chondrocytes. In P.

Bibliography 135
Yurchenco, D. Birk & R. Mecham (Eds.), Extracellular Matrix Assembly and
Structure (pp. 171-206.). California: Academic Press.
Schneider, N., Mouithys-Mickalad, A., Lejeune, J. P., Duyckaerts, C., Sluse, F.,
Deby-Dupont, G., et al. (2007). Oxygen consumption of equine articular
chondrocytes: Influence of applied oxygen tension and glucose concentration
during culture. Cell Biol Int, 31(9), 878-886.
Semenza, G. L., Jiang, B. H., Leung, S. W., Passantino, R., Concordet, J. P., Maire,
P., et al. (1996). Hypoxia response elements in the aldolase A, enolase 1, and
lactate dehydrogenase A gene promoters contain essential binding sites for
hypoxia-inducible factor 1. J Biol Chem, 271(51), 32529-32537.
Semenza, G. L., Roth, P. H., Fang, H. M., & Wang, G. L. (1994). Transcriptional
regulation of genes encoding glycolytic enzymes by hypoxia-inducible factor
1. J Biol Chem, 269(38), 23757-23763.
Sengupta, P. (2013). The Laboratory Rat: Relating Its Age With Human's. Int J Prev
Med, 4(6), 624-630.
Setoguchi, K., Misaki, Y., Kawahata, K., Shimada, K., Juji, T., Tanaka, S., et al.
(2004). Suppression of T cell responses by chondromodulin I, a cartilage-
derived angiogenesis inhibitory factor: therapeutic potential in rheumatoid
arthritis. Arthritis Rheum, 50(3), 828-839.
Shiomi, T., Lemaitre, V., D'Armiento, J., & Okada, Y. (2010). Matrix
metalloproteinases, a disintegrin and metalloproteinases, and a disintegrin
and metalloproteinases with thrombospondin motifs in non-neoplastic
diseases. Pathol Int, 60(7), 477-496.
Shukunami, C., & Hiraki, Y. (1998). Expression of cartilage-specific functional
matrix chondromodulin-I mRNA in rabbit growth plate chondrocytes and its
responsiveness to growth stimuli in vitro. Biochem Biophys Res Commun,
249(3), 885-890.
Shukunami, C., Iyama, K., Inoue, H., & Hiraki, Y. (1999a). Spatiotemporal pattern
of the mouse chondromodulin-I gene expression and its regulatory role in
vascular invasion into cartilage during endochondral bone formation. Int J
Dev Biol, 43(1), 39-49.
Shukunami, C., Takimoto, A., Miura, S., Nishizaki, Y., & Hiraki, Y. (2008).
Chondromodulin-I and tenomodulin are differentially expressed in the

136 Bibliography
avascular mesenchyme during mouse and chick development. Cell Tissue
Res, 332(1), 111-122.
Shukunami, C., Yamamoto, S., Tanabe, T., & Hiraki, Y. (1999b). Generation of
multiple transcripts from the chicken chondromodulin-I gene and their
expression during embryonic development. FEBS Lett, 456(1), 165-170.
Silver, I. A. (1975). Measurement of pH and ionic composition of pericellular sites.
Philos Trans R Soc Lond B Biol Sci, 271(912), 261-272.
Solomon, L. A., Berube, N. G., & Beier, F. (2008). Transcriptional regulators of
chondrocyte hypertrophy. Birth Defects Res C Embryo Today, 84(2), 123-
130.
Sowers, M. (2001). Epidemiology of risk factors for osteoarthritis: systemic factors.
Curr Opin Rheumatol, 13(5), 447-451.
Sowter, H. M., Raval, R. R., Moore, J. W., Ratcliffe, P. J., & Harris, A. L. (2003).
Predominant role of hypoxia-inducible transcription factor (Hif)-1alpha
versus Hif-2alpha in regulation of the transcriptional response to hypoxia.
Cancer Res, 63(19), 6130-6134.
Stewart, A. J., Houston, B., & Farquharson, C. (2006). Elevated expression of
hypoxia inducible factor-2alpha in terminally differentiating growth plate
chondrocytes. J Cell Physiol, 206(2), 435-440.
Suri, S., Gill, S. E., Massena de Camin, S., Wilson, D., McWilliams, D. F., & Walsh,
D. A. (2007). Neurovascular invasion at the osteochondral junction and in
osteophytes in osteoarthritis. Ann Rheum Dis, 66(11), 1423-1428.
Suri, S., & Walsh, D. A. (2012). Osteochondral alterations in osteoarthritis. Bone,
51(2), 204-211.
Takeda, S., Bonnamy, J. P., Owen, M. J., Ducy, P., & Karsenty, G. (2001).
Continuous expression of Cbfa1 in nonhypertrophic chondrocytes uncovers
its ability to induce hypertrophic chondrocyte differentiation and partially
rescues Cbfa1-deficient mice. Genes Dev, 15(4), 467-481.
Tamiya, H., Ikeda, T., Jeong, J. H., Saito, T., Yano, F., Jung, Y. K., et al. (2008).
Analysis of the Runx2 promoter in osseous and non-osseous cells and
identification of HIF2A as a potent transcription activator. Gene, 416(1-2),
53-60.

Bibliography 137
Tanimoto, K., Makino, Y., Pereira, T., & Poellinger, L. (2000). Mechanism of
regulation of the hypoxia‐inducible factor‐1α by the von Hippel‐Lindau
tumor suppressor protein. The EMBO journal, 19(16), 4298-4309.
Tetlow, L. C., Adlam, D. J., & Woolley, D. E. (2001). Matrix metalloproteinase and
proinflammatory cytokine production by chondrocytes of human
osteoarthritic cartilage: associations with degenerative changes. Arthritis
Rheum, 44(3), 585-594.
Thoms, B. L., Dudek, K. A., Lafont, J. E., & Murphy, C. L. (2013). Hypoxia
promotes the production and inhibits the destruction of human articular
cartilage. Arthritis Rheum, 65(5), 1302-1312.
Tomita, T., Hashimoto, H., Tomita, N., Morishita, R., Lee, S. B., Hayashida, K., et
al. (1997). In vivo direct gene transfer into articular cartilage by intraarticular
injection mediated by HVJ (Sendai virus) and liposomes. Arthritis Rheum,
40(5), 901-906.
Treuhaft, P. S., & MCCarty, D. J. (1971). Synovial fluid pH, lactate, oxygen and
carbon dioxide partial pressure in various joint diseases. Arthritis Rheum,
14(4), 475-484.
Van Beuningen, H., Glansbeek, H., Van der Kraan, P., & Van den Berg, W. (2000).
Osteoarthritis-like changes in the murine knee joint resulting from intra-
articular transforming growth factor-β injections. Osteoarthritis Cartilage,
8(1), 25-33.
Van Beuningen, H. M., Van der Kraan, P., Arntz, O., & Van den Berg, W. (1994).
Transforming growth factor-beta 1 stimulates articular chondrocyte
proteoglycan synthesis and induces osteophyte formation in the murine knee
joint. Lab invest, 71(2), 279-290.
Van der Sluijs, J., Geesink, R., Van der Linden, A., Bulstra, S., Kuyer, R., &
Drukker, J. (1992). The reliability of the Mankin score for osteoarthritis. J
Orthop Res, 10(1), 58-61.
Vincenti, M. P., & Brinckerhoff, C. E. (2002). Transcriptional regulation of
collagenase (MMP-1, MMP-13) genes in arthritis: integration of complex
signaling pathways for the recruitment of gene-specific transcription factors.
Arthritis Res, 4(3), 157-164.

138 Bibliography
von der Mark, K., Kirsch, T., Nerlich, A., Kuss, A., Weseloh, G., Gluckert, K., et al.
(1992). Type X collagen synthesis in human osteoarthritic cartilage.
Indication of chondrocyte hypertrophy. Arthritis Rheum, 35(7), 806-811.
Walsh, D. A., McWilliams, D. F., Turley, M. J., Dixon, M. R., Franses, R. E., Mapp,
P. I., et al. (2010). Angiogenesis and nerve growth factor at the osteochondral
junction in rheumatoid arthritis and osteoarthritis. Rheumatology (Oxford),
49(10), 1852-1861.
Wang, G. L., Jiang, B. H., Rue, E. A., & Semenza, G. L. (1995). Hypoxia-inducible
factor 1 is a basic-helix-loop-helix-PAS heterodimer regulated by cellular O2
tension. Proc Natl Acad Sci U S A, 92(12), 5510-5514.
Wang, G. L., & Semenza, G. L. (1993). Characterization of hypoxia-inducible factor
1 and regulation of DNA binding activity by hypoxia. J Biol Chem, 268(29),
21513-21518.
Wang, M., Sampson, E. R., Jin, H., Li, J., Ke, Q. H., Im, H. J., et al. (2013). MMP13
is a critical target gene during the progression of osteoarthritis. Arthritis Res
Ther, 15(1), R5.
Woolf, A. D., & Pfleger, B. (2003). Burden of major musculoskeletal conditions.
Bull World Health Organ, 81(9), 646-656.
Wu, C., Han, P., Xu, M., Zhang, X., Zhou, Y., Xue, G., et al. (2013).
Nagelschmidtite bioceramics with osteostimulation properties: material
chemistry activating osteogenic genes and WNT signalling pathway of
human bone marrow stromal cells. [10.1039/C2TB00391K]. J Mater Chem B
Mater Biol Med, 1(6), 876-885.
Xu, J., Wang, W., Ludeman, M., Cheng, K., Hayami, T., Lotz, J. C., et al. (2008).
Chondrogenic differentiation of human mesenchymal stem cells in three-
dimensional alginate gels. Tissue Eng Part A, 14(5), 667-680.
Yan, Q., Bartz, S., Mao, M., Li, L., & Kaelin, W. G. (2007). The hypoxia-inducible
factor 2α N-terminal and C-terminal transactivation domains cooperate to
promote renal tumorigenesis in vivo. Mol Cell Biol, 27(6), 2092-2102.
Yang, L., Tsang, K. Y., Tang, H. C., Chan, D., & Cheah, K. S. (2014). Hypertrophic
chondrocytes can become osteoblasts and osteocytes in endochondral bone
formation. Proc Natl Acad Sci U S A, 111(33), 12097-12102.

Bibliography 139
Yang, S., Kim, J., Ryu, J.-H., Oh, H., Chun, C.-H., Kim, B. J., et al. (2010).
Hypoxia-inducible factor-2 [alpha] is a catabolic regulator of osteoarthritic
cartilage destruction. Nat Med, 16(6), 687-693.
Yoshioka, M., Yuasa, S., Matsumura, K., Kimura, K., Shiomi, T., Kimura, N., et al.
(2006). Chondromodulin-I maintains cardiac valvular function by preventing
angiogenesis. Nat Med, 12(10), 1151-1159.
Yu, F., White, S. B., Zhao, Q., & Lee, F. S. (2001). HIF-1alpha binding to VHL is
regulated by stimulus-sensitive proline hydroxylation. Proc Natl Acad Sci U
S A, 98(17), 9630-9635.
Yudoh, K., Nakamura, H., Masuko-Hongo, K., Kato, T., & Nishioka, K. (2005).
Catabolic stress induces expression of hypoxia-inducible factor (HIF)-1 alpha
in articular chondrocytes: involvement of HIF-1 alpha in the pathogenesis of
osteoarthritis. Arthritis Res Ther, 7(4), R904-914.
Yukata, K., Matsui, Y., Shukunami, C., Takimoto, A., Goto, T., Nishizaki, Y., et al.
(2008). Altered fracture callus formation in chondromodulin-I deficient mice.
Bone, 43(6), 1047-1056.
Zhao, H., Pestina, T. I., Nasimuzzaman, M., Mehta, P., Hargrove, P. W., & Persons,
D. A. (2009). Amelioration of murine beta-thalassemia through drug
selection of hematopoietic stem cells transduced with a lentiviral vector
encoding both gamma-globin and the MGMT drug-resistance gene. Blood,
113(23), 5747-5756.
Zheng, Q., Zhou, G., Morello, R., Chen, Y., Garcia-Rojas, X., & Lee, B. (2003).
Type X collagen gene regulation by Runx2 contributes directly to its
hypertrophic chondrocyte-specific expression in vivo. J Cell Biol, 162(5),
833-842.
Zhu, S., Lu, P., Liu, H., Chen, P., Wu, Y., Wang, Y., et al. (2015). Inhibition of Rac1
activity by controlled release of NSC23766 from chitosan microspheres
effectively ameliorates osteoarthritis development in vivo. Ann Rheum Dis,
74(1), 285-293.
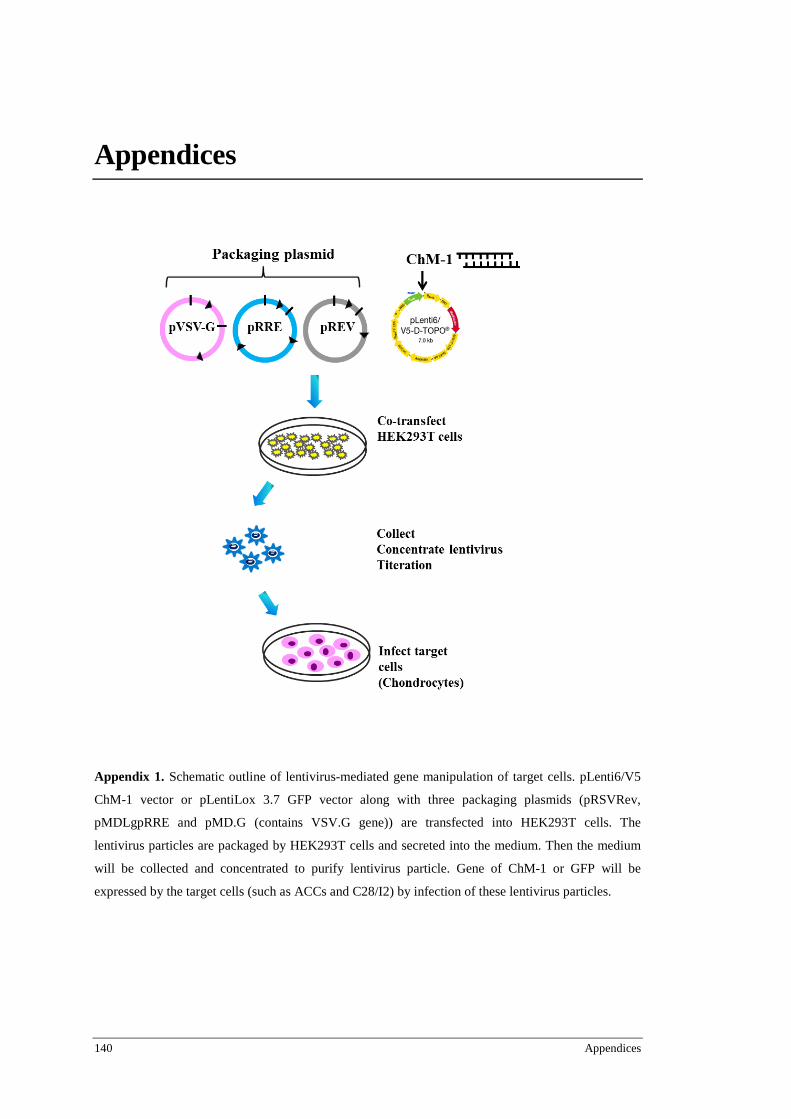
140 Appendices
Appendices
Appendix 1. Schematic outline of lentivirus-mediated gene manipulation of target cells. pLenti6/V5
ChM-1 vector or pLentiLox 3.7 GFP vector along with three packaging plasmids (pRSVRev,
pMDLgpRRE and pMD.G (contains VSV.G gene)) are transfected into HEK293T cells. The
lentivirus particles are packaged by HEK293T cells and secreted into the medium. Then the medium
will be collected and concentrated to purify lentivirus particle. Gene of ChM-1 or GFP will be
expressed by the target cells (such as ACCs and C28/I2) by infection of these lentivirus particles.