priviledge - fundsquare.net
TRANSCRIPT

PrivilEdgeis an investment company
with variable capital ("SICAV")incorporated in Luxembourg
PrivilEdgeest une société d’investissement
à capital variable ("SICAV")enregistrée au Luxembourg RCS Luxembourg B0181207
PrivilEdgeUnaudited semi-annual report · Rapport semestriel non révisé
31.03.2019

IMPORTANT This report does not constitute an offer of Shares. No subscriptions can be received on the basis of financial reports alone. Subscriptions can only be accepted on the basis of the current Prospectus or relevant Key Investor Information Document accompanied by the most recent annual report and subsequent semi-annual report if later than such annual report. The current Prospectus, the Key Investor Information Document, the Articles, the annual and semi-annual reports as well as other notices to Shareholders may be obtained free of charge from either the Registered Office of the Company or the foreign representatives. Specific information for German and Swiss subscribers are listed in the Supplementary Information. The issue and redemption prices of Shares may also be obtained from said offices upon request. It is prohibited to reproduce (either in full or in part), transmit (electronically or by any other means), alter, create a link to, or use for public or commercial use of any kind any information contained in this report. IMPORTANT Le présent rapport ne constitue pas une invitation à souscrire. Aucune souscription ne peut être acceptée sur la base des seuls rapports financiers. Les souscriptions ne peuvent être acceptées que sur la base du Prospectus en vigueur ou du Key Investor Information Document pertinent accompagné du dernier rapport annuel et du dernier rapport semestriel si celui-ci est plus récent que le rapport annuel. Les derniers Prospectus et Key Investor Information Document, les statuts de la Société, les rapports annuels et semestriels, ainsi que d'autres informations destinées aux Actionnaires peuvent être obtenus sans frais au siège de la Société et auprès des représentants à l’étranger. Les informations spécifiques pour les Actionnaires allemands et suisses sont reprises dans les informations supplémentaires. Les prix d'émission et de rachat des actions peuvent également être obtenus sur demande auprès de ces bureaux. Il est strictement interdit de reproduire (en tout ou partie), de transmettre (électroniquement ou par tout autre moyen), de modifier, de créer un lien ou d’utiliser, à des fins publiques ou commerciales, toutes les informations contenues dans ce rapport.

Table of contents/Table des matières
List of parties and addresses/Liste des parties et adresses......................................................................................................................................................................................... 4
Combined/Combiné .......................................................................................................................................................................................................................................................... 9Combined statement of net assets/Etat combiné de l’actif net.......................................................................................................................................................................................... 10Combined statement of operations and changes in net assets/Etat combiné des opérations et des variations de l’actif net ...........................................................................................11
Statement of net assets/Etat de l'actif netStatement of operations and changes in net assets/Etat des opérations et des variations de l'actif netStatement of changes in the number of Shares outstanding/Etat des variations du nombre d’actionsStatistics/StatistiquesSchedule of investments/Inventaire du portefeuille
William Blair Global Leaders .................................................................................................................................................................................................................................. ...........13Wellington Large Cap US Research .............................................................................................................................................................................................................................. .. 21Sands US Growth ............................................................................................................................................................................................................................................................. 31Delaware US Large Cap Value ................................................................................................................................................................................................................................... ......39WellsCap US Selective Equity ................................................................................................... .......................................................................................................................................45Income Partners RMB Debt ...................................................................................................................................................................................................................................... ........53SMAM Japan Small and Mid Cap .................................................................................................................................................................................................................................. .. 61Fidelity Technology ........................................................................................................................................................................................................................................... ................69Ashmore Emerging Market Local Currency Bond ............................................................................................................................................................................................................. 77Baird US Aggregate Bond........................................................................................................ ............................................................................................................................... ..........91Baird US Short Duration Bond ................................................................................................... .......................................................................................................................................99Columbia US Short Duration High Yield.......................................................................................... ............................................................................................................................... 107DPAM European Real Estate..................................................................................................................................................................................................................................... .... 117H2O High Conviction Bonds ..................................................................................................................................................................................................................................... ......129American Century Emerging Markets Equity .................................................................................................................................................................................................................. 143AXA IM Short Duration Inflation Bond.......................................................................................................................................................................................................................... .. 153Franklin Flexible Euro Aggregate Bond......................................................................................................................................................................................................................... . 161Henderson Pan European Equity.................................................................................................. ..................................................................................................................................171William Blair US Small and Mid Cap ............................................................................................................................................................................................................................ .. 175BlackRock Emerging Market Dynamic Bond................................................................................................................................................................................................................... 185JP Morgan Pan European Flexible Equity....................................................................................................................................................................................................................... 199Moneta Best of France…………………………………………………………………………………………………………..………………………………………………………………………..215NN IP Euro Credit ............................................................................................................................................................................................................................................. ..............221T. Rowe Price European High Yield Bond ...................................................................................................................................................................................................................... 237Flossbach von Storch Global Convertible Bond……………………………………………………………………… . ………………………………………………………………………………247Payden Emerging Market Debt………………………………………………………………………………………… .………………………………………………………………………………255PPM America US Corporate Bond………………………………………………………………………………………....……………………………………………………………………………267Amber Event Europe…………………………………………………………………………………………………………. …………………………………………………………………………..279
Notes to the financial statements/Notes aux états financiers................................................................................................................................................................................... 289Unaudited supplementary information/Informations supplémentaires non révisées ............................................................................................................................................ 311
Copies of the changes in the portfolio of each Sub-Fund for the period ended 31 March 2019 may be obtained free of charge, upon request, from CACEIS Bank, LuxembourgBranch, Luxembourg, Lombard Odier Funds (Europe) S.A., Luxembourg, Lombard Odier Asset Management (Switzerland) SA, Petit-Lancy (the Swiss representative) andDekaBank Deutsche Girozentrale, Frankfurt/Main.
Des copies des modifications de l’état du portefeuille de chaque Compartiment pour la période clôturant au 31 mars 2019 peuvent être obtenues sans frais, sur demande, auprès deCACEIS Bank, succursale du Luxembourg, Luxembourg, Lombard Odier Funds (Europe) S.A., Luxembourg, Lombard Odier Asset Management (Switzerland) SA, Petit-Lancy (lereprésentant en Suisse) et DekaBank Deutsche Girozentrale, Francfort/Main.
PrivilEdge · 31/03/2019 3

4 PrivilEdge · 31/03/2019
List of parties and addresses/Liste des parties et adresses The Company/La Société PrivilEdge Registered Office/Siège 291, route d’Arlon, 1150 Luxembourg, Grand Duchy of Luxembourg Board of Directors/Conseil d’Administration ● Chairman of the Board/Président du Conseil
Yvar Mentha
● Directors/Administrateurs Mariusz Baranowski Mark Edmonds Stéphane Monier Alexandre Meyer Jean-Claude Ramel Yvar Mentha and Jean-Claude Ramel are former employees of the Lombard Odier Group. Mariusz Baranowski, Mark Edmonds, Stéphane Monier and Alexandre Meyer are employees of the Lombard Odier Group. Yvar Mentha et Jean-Claude Ramel sont d'anciens employés du Groupe Lombard Odier. Mariusz Baranowski, Mark Edmonds, Stéphane Monier et Alexandre Meyer sont employés du Groupe Lombard Odier.
Management Company and Domiciliary Agent/Société de Gestion et Agent domiciliataire Lombard Odier Funds (Europe) S.A. 291, route d’Arlon, 1150 Luxembourg, Grand Duchy of Luxembourg ● Directors of the Management Company/Administrateurs de la Société de Gestion
Alexandre Meyer Julien Desmeules Mark Edmonds Francine Keiser Patrick Zurstrassen Alexandre Meyer, Julien Desmeules and Mark Edmonds are employees of the Lombard Odier Group. Francine Keiser and Patrick Zurstrassen are Independent Directors. Alexandre Meyer, Julien Desmeules et Mark Edmonds sont employés du Groupe Lombard Odier. Francine Keiser et Patrick Zurstrassen sont Administrateurs Indépendants.
● Dirigeants of the Management Company/Dirigeants de la Société de Gestion
Mariusz Baranowski Mark Edmonds Michael Derwael (up to/jusqu’au 30/04/2019) Ingrid Robert Mariusz Baranowski, Mark Edmonds, Michael Derwael and Ingrid Robert are employees of the Lombard Odier Group. Mariusz Baranowski, Mark Edmonds, Michael Derwael et Ingrid Robert sont employés du Groupe Lombard Odier.
Global Distributor/Distributeur global Lombard Odier Funds (Europe) S.A. 291, route d’Arlon, 1150 Luxembourg, Grand Duchy of Luxembourg

PrivilEdge · 31/03/2019 5
List of parties and addresses/Liste des parties et adresses Investment Managers/Gérants Aberdeen Asset Management Asia Limited (up to/jusqu’au 31/10/2018) 21 Church Street, #01-01 Capital Square Two, 049480, Singapore Aberdeen Asset Managers Limited (up to/jusqu’au 31/10/2018) and/et Aberdeen Asset Management Asia Limited as Sub-Investment Manager for asian assets/comme Sous-Gérant pour les actifs asiatiques 10 Queen’s Terrace, Aberdeen, AB10 1YG, United Kingdom Amber Capital UK LLP 14-17 Market Place, London, W1W 8AJ, United Kingdom American Century Investment Management, Inc. (as from/dès le 01/11/2018) 4500 Main Street, Kansas City, Missouri 64111, United States of America Ashmore Investment Management Limited 61 Aldwych, London WC2B 4AE, United Kingdom AXA Investment Managers Paris Tour Majunga – La Défense 9 – 6, place de la Pyramide – 92800 Puteaux, France BlackRock Investment Management (UK) Limited 12, Throgmorton Avenue, London EC2N 2DL, United Kingdom Columbia Management Investment Advisers, LLC 225 Franklin Street, Boston, MA 02110, United States of America Degroof Petercam Asset Management SA Rue Guimard 18, 1040 Brussels, Belgium FIL Pensions Management and/et FIL Investments International as Sub-Investment Manager/comme Sous-Gérant Oakhill House, 130 Tonbridge Road, Hildenborough, Kent TN11 9DZ, United Kingdom Flossbach von Storch AG Ottoplatz 1, 50679 Cologne, Germany Franklin Templeton Investment Management Limited Cannon Place, 78 Cannon Street, London EC4N 6HL, United Kingdom H2O Asset Management LLP 2nd Floor, 10 Old Burlington Street, London W1S 3AG, United Kingdom Henderson Global Investors Limited (up to/jusqu’au 07/12/2018) 201 Bishopsgate, London, EC2M 3AE, United Kingdom Income Partners Asset Management (HK) Limited Suite 3311 – 3313, 2 IFC, 8 Finance Street, Central, Hong Kong JP Morgan Asset Management (UK) Limited 60 Victoria Embankment, London EC4Y 0JP, United Kingdom Macquarie Investment Management Advisers, a series of Macquarie Investment Management Business Trust 2005 Market Street, Philadelphia, PA 19103, United States of America Moneta Asset Management 36 rue Marbeuf, 75008 Paris, France NN Investment Partners B.V. 65 Schenkkade, 2595 AS, The Hague, The Netherlands Payden & Rygel 333 South Grand Avenue, Suite 3200, Los Angeles, California 90071, United States of America PPM America, Inc. 225 W. Wacker Drive, Suite 1200, Chicago, Illinois 60606, United States of America Robert W. Baird & Co. Incorporated 777 East Wisconsin Avenue, Milwaukee, 53202, United States of America Sands Capital Management, L.L.C. 1000 Wilson Boulevard, Suite 3000, Arlington, Virginia 22209, United States of America Sumitomo Mitsui Asset Management Company, Limited (renamed/renommé Sumitomo Mitsui DS Asset Management Company, Limited as from/dès le 01/04/2019) Atago Green hills Mori Tower 28F, 2-5-1 Atago, Minato-ku, Tokyo 105-6228, Japan

6 PrivilEdge · 31/03/2019
List of parties and addresses/Liste des parties et adresses T. Rowe Price International Ltd 60 Queen Victoria Street, London EC4N 4TZ, United Kingdom Wellington Management Company LLP 280 Congress Street, Boston, Massachusetts 02210, United States of America Wells Capital Management, Incorporated 525 Market Street, 10th Floor, San Francisco, 94105, United States of America William Blair Investment Management, LLC 150 North Riverside Plaza, Chicago, Illinois 60606, United States of America The allocation of Sub-Funds to Investment Managers is set out in Note 6 to the financial statements La liste des Compartiments attribués aux différents Gérants figure dans la Note 6 aux états financiers Depositary, Central Administration Agent and Registrar, Transfer Agent and Paying Agent Dépositaire, Agent d’administration centrale et d’enregistrement, Agent de transfert et de paiement CACEIS Bank, Luxembourg Branch 5, allée Scheffer, 2520 Luxembourg, Grand Duchy of Luxembourg Auditor/Auditeur PricewaterhouseCoopers, Société coopérative Réviseur d’entreprises agréé 2, rue Gerhard Mercator, B.P. 1443, 1014 Luxembourg, Grand Duchy of Luxembourg Legal Adviser/Conseiller juridique Linklaters LLP 35, avenue John F. Kennedy, 1855 Luxembourg, Grand Duchy of Luxembourg Foreign Representatives/Représentants à l’étranger ● In the Netherlands/Aux Pays-Bas
Lombard Odier Funds (Europe) S.A. – Dutch Branch NoMA House, Gustav Mahlerlaan 1212, 1081 LA Amsterdam, The Netherlands
● In Switzerland/En Suisse Representative/Représentant Lombard Odier Asset Management (Switzerland) SA 6, avenue des Morgines, 1213 Petit-Lancy, Switzerland Paying agent/Service de paiement Bank Lombard Odier & Co Ltd/Banque Lombard Odier & Cie SA 11, rue de la Corraterie, 1204 Geneva, Switzerland
● In the United Kingdom/Au Royaume-Uni
Lombard Odier Asset Management (Europe) Limited Queensberry House, 3 Old Burlington Street, London W1S 3AB, United Kingdom
● In Austria/En Autriche
Erste Bank der oesterreichischen Sparkassen AG Am Belvedere 1, 1100 Vienna, Austria
● In Italy/En Italie
Paying agents/Services de paiement Allfunds Bank S.A.U., Milan Branch Via Bocchetto 6, 20123 Milano, Italy Société Générale Securities Services S.p.A. Via Benigno Crespi 19A, 20159 Milan, Italy
● In France/En France
Centralising Agent/Correspondant centralisateur CACEIS Bank 1-3, place Valhubert, 75013 Paris, France
● In Belgium/En Belgique
CACEIS Belgium SA Avenue du Port 86C, b320, 1000 Brussels, Belgium

PrivilEdge · 31/03/2019 7
List of parties and addresses/Liste des parties et adresses ● In Spain/En Espagne
Allfunds Bank, S.A.U. C/ de los Padres Dominicos, 7, 28050 Madrid, Spain
● In Liechtenstein/Au Liechtenstein
Paying agent/Service de paiement LGT Bank AG Herrengasse 12, 9490 Vaduz, Liechtenstein
● In Germany/En Allemagne
German Information and Paying Agent/Office d'information et de paiement pour l'Allemagne DekaBank Deutsche Girozentrale Mainzer Landstrasse 16, 60325 Frankfurt/Main, Germany


PrivilEdgeis an investment company
with variable capital ("SICAV")incorporated in Luxembourg
PrivilEdgeest une société d’investissement
à capital variable ("SICAV")enregistrée au Luxembourg RCS Luxembourg B0181207
PrivilEdgeCombined · Combiné
31.03.2019

The accompanying notes form an integral part of these financial statements.Les notes annexées font partie intégrante de ces états financiers.
10 PrivilEdge - Combined · 31/03/2019
Combined statement of net assets as at 31/03/2019 / État combiné de l'actif net au 31/03/2019
NotesNotes USD
ASSETS/ACTIF
4 400 809 175.51Investments in securities at market value/Portefeuille-titres à la valeur de marché (2):( USD )4 116 528 598.06Acquisition cost/Coût d'acquisition
305 792.11Net options at market value/Position nette en options à la valeur de marché (2):( USD )457 125.90Acquisition cost/Coût d'acquisition
194 531 084.98Cash and term deposits/Liquidité et dépôts à terme15 189 860.43Receivable on investments sold/À recevoir sur vente de titres18 621 155.53Amounts receivable on subscriptions/Montants à recevoir sur souscriptions d'actions21 420 990.32Interest and dividends receivable, net/Intérêt et dividendes nets à recevoir
485 890.32Interest on swaps receivable/Intérêt à recevoir sur swaps132 057.88Formation/reorganisation expenses/Frais de constitution/réorganisation (2)259 352.29Unrealised appreciation on IRS/Plus-value non réalisée sur IRS (2)
9 416.48Unrealised appreciation on CDS/Plus-value non réalisée sur CDS (2)2 004 585.95Unrealised appreciation on futures contracts/Plus-value non réalisée sur contrats futures (2)
2 374.68Receivable on foreign exchange transactions, net/A recevoir sur opérations de change, net6 870 226.47Unrealised appreciation on forward foreign currency exchange contracts/Plus-value non réalisée sur contrats de change à
terme(2)
785 995.49Other assets/Autres actifs4 661 427 958.43
LIABILITIES/PASSIF
249 444.47Net options at market value/Position nette en options à la valeur de marché (2):( USD )398 562.74Acquisition cost/Coût d'acquisition
15 744 947.14Bank overdrafts/Découverts bancaires27 093 109.33Payable on investments purchased/À payer sur achat de titres
7 563 122.07Amounts payable on redemptions/Montants à payer sur rachats d'actions3 324 280.97Management and distribution fees payable/Commission de gestion et de distribution à payer (3)4 149 252.15Taxes and expenses payable/Impôts et autres frais à payer
842 088.83Unrealised depreciation on IRS/Moins-value non réalisée sur IRS (2)697 869.86Unrealised depreciation on CDS/Moins-value non réalisée sur CDS (2)
1 530 845.63Interest on swaps payable/Intérêt à payer sur swaps1 360 564.86Unrealised depreciation on futures contracts/Moins-value non réalisée sur contrats futures (2)
140 098.93Payable on foreign exchange transactions, net/A payer sur opérations de change, net 5 599 149.73Unrealised depreciation on forward foreign currency exchange contracts/Moins-value non réalisée sur contrats de change à
terme(2)
68 294 773.984 593 133 184.45NET ASSET VALUE/VALEUR NETTE D'INVENTAIRE

The accompanying notes form an integral part of these financial statements.Les notes annexées font partie intégrante de ces états financiers.
11PrivilEdge - Combined · 31/03/2019
Combined statement of operations and changes in net assets for the period from 01/10/2018 to 31/03/2019 / Étatcombiné des opérations et des variations de l'actif net pour la période du 01/10/2018 au 31/03/2019
NotesNotes USD
5 105 587 302.42NET ASSET VALUE AT THE BEGINNING OF THE PERIOD/ACTIF NET AU DÉBUT DE LA PÉRIODE
INCOME/REVENUS
27 289 192.30Dividends, net/Dividendes, nets (2)31 351 492.03Interest on bonds, net/Intérêts sur obligations, nets (2)
864 140.05Bank interest/Intérêts bancaires94 180.91Securities Lending Income/Revenus sur prêt de titres (9)
242 687.13Other income/Autres revenus59 841 692.41
EXPENSES/DÉPENSES
19 505 582.26Management fees/Commission de gestion (3)792 859.62Distribution fees/Frais de distribution (3)
7 079 085.78Performance fees/Commission de performance (3)254 713.73Bank interest and other expenses/Intérêts bancaires débiteurs et autres frais
5 844 987.09Fixed Rate of Operational Costs/Taux Fixe de Coûts Opérationnels (4)693 044.63Interest on swaps, net/Intérêts sur contrats de swaps, nets
59 769.45Formation/Reorganisation expenses/Frais de constitution/réorganisation (2)34 230 042.5625 611 649.85NET INVESTMENT INCOME/REVENU NET SUR INVESTISSEMENTS
5 358 994.96Net realised gain on sale of investments/Gain net réalisé sur ventes d'investissements (2)747 503.56Net realised gain on options/Gain net réalisé sur options844 358.61Net realised gain on swaps/Gain net réalisé sur swaps (2)
14 160 325.61Net realised gain on futures contracts/Gain net réalisé sur contrats futures(17 432 920.75)Net realised loss on foreign exchange/Perte nette réalisée sur opérations de change
17 489 627.09Net realised gain on forward foreign currency exchange contracts/Gain net réalisé sur contrats de change à terme46 779 538.95NET REALISED GAIN/GAIN NET RÉALISÉ
(74 018 997.15)Change in net unrealised appreciation or depreciation on investments/Variation de la plus ou moins-value nette non réaliséesur investissements
(2)
(305 886.04)Change in net unrealised appreciation or depreciation on options/Variation de la plus ou moins-value non réalisée sur options(146 876.88)Change in net unrealised appreciation or depreciation on IRS/Variation de la plus ou moins-value nette non réalisée sur IRS (2)(863 356.05)Change in net unrealised appreciation or depreciation on CDS/Variation de la plus ou moins-value nette non réalisée sur
CDS(2)
(6 668 848.32)Change in net unrealised appreciation or depreciation on futures contracts/Variation de la plus ou moins-value nette nonréalisée sur contrats futures
(2 234 565.65)Change in net unrealised appreciation or depreciation on forward foreign currency exchange contracts/Variation de la plus oumoins-value nette non réalisée sur contrats de change à terme
(37 458 991.15)NET DECREASE IN NET ASSETS AS A RESULT OF OPERATIONS/DIMINUTION NETTE DE L'ACTIF NET RÉSULTANTDES OPÉRATIONS
(7 609 134.75)Dividend paid/Dividende payé(430 850 563.62)Net subscriptions/(redemptions) including equalisation/Souscriptions/(rachats) nets incluant la régularisation
(36 535 428.45)Reevaluation of the Net Asset Value at the beginning of the period/Réévaluation de la Valeur Nette d'Inventaire audébut de la période
4 593 133 184.45NET ASSET VALUE AT THE END OF THE PERIOD/VALEUR NETTE D'INVENTAIRE À LA FIN DE LA PÉRIODE

12

PrivilEdgeis an investment company
with variable capital ("SICAV")incorporated in Luxembourg
PrivilEdgeest une société d’investissement
à capital variable ("SICAV")enregistrée au Luxembourg RCS Luxembourg B0181207
PrivilEdge –William Blair Global Leaders
Unaudited semi-annual report · Rapport semestriel non révisé
31.03.2019

The accompanying notes form an integral part of these financial statements.Les notes annexées font partie intégrante de ces états financiers.
14 PrivilEdge - William Blair Global Leaders · 31/03/2019
ASSETS/ACTIF
101 831 674.24Investments in securities at market value/Portefeuille-titres à la valeur de marché (2):( USD )89 556 979.16Acquisition cost/Coût d'acquisition
1 638 108.85Cash and term deposits/Liquidité et dépôts à terme83 931.62Interest and dividends receivable, net/Intérêt et dividendes nets à recevoir
396.60Formation/reorganisation expenses/Frais de constitution/réorganisation (2)103 554 111.31
LIABILITIES/PASSIF
173 574.22Payable on investments purchased/À payer sur achat de titres89 979.90Management and distribution fees payable/Commission de gestion et de distribution à payer (3)20 692.95Taxes and expenses payable/Impôts et autres frais à payer
169.95Payable on foreign exchange transactions, net/A payer sur opérations de change, net 284 417.02
103 269 694.29NET ASSET VALUE/VALEUR NETTE D'INVENTAIRE
Statement of net assets as at 31/03/2019 / État de l'actif net au 31/03/2019
NotesNotes USD

The accompanying notes form an integral part of these financial statements.Les notes annexées font partie intégrante de ces états financiers.
15PrivilEdge - William Blair Global Leaders · 31/03/2019
Statement of operations and changes in net assets for the period from 01/10/2018 to 31/03/2019 / État desopérations et des variations de l'actif net pour la période du 01/10/2018 au 31/03/2019
NotesNotes USD
108 795 015.68NET ASSET VALUE AT THE BEGINNING OF THE PERIOD/VALEUR NETTE D'INVENTAIRE AU DÉBUT DE LAPÉRIODE
INCOME/REVENUS
528 316.54Dividends, net/Dividendes, nets (2)14 147.88Bank interest/Intérêts bancaires
194.47Securities Lending Income/Revenus sur prêt de titres (9)2 109.70Other income/Autres revenus
544 768.59EXPENSES/DÉPENSES
503 836.94Management fees/Commission de gestion (3)33 771.01Distribution fees/Frais de distribution (3)
29.44Bank interest and other expenses/Intérêts bancaires débiteurs et autres frais127 626.63Fixed Rate of Operational Costs/Taux Fixe de Coûts Opérationnels (4)
1 578.06Formation/Reorganisation expenses/Frais de constitution/réorganisation (2)666 842.08
(122 073.49)NET INVESTMENT LOSS/PERTE NETTE SUR INVESTISSEMENTS
530 613.17Net realised gain on sale of investments/Gain net réalisé sur ventes d'investissements (2)(176 213.14)Net realised loss on foreign exchange/Perte nette réalisée sur opérations de change
113.98Net realised gain on forward foreign currency exchange contracts/Gain net réalisé sur contrats de change à terme232 440.52NET REALISED GAIN/GAIN NET RÉALISÉ
(4 200 838.97)Change in net unrealised appreciation or depreciation on investments/Variation de la plus ou moins-value nette non réaliséesur investissements
(2)
(3 968 398.45)NET DECREASE IN NET ASSETS AS A RESULT OF OPERATIONS/DIMINUTION NETTE DE L'ACTIF NET RÉSULTANTDES OPÉRATIONS
(1 556 922.94)Net subscriptions/(redemptions) including equalisation/Souscriptions/(rachats) nets incluant la régularisation103 269 694.29NET ASSET VALUE AT THE END OF THE PERIOD/VALEUR NETTE D'INVENTAIRE À LA FIN DE LA PÉRIODE

The accompanying notes form an integral part of these financial statements.Les notes annexées font partie intégrante de ces états financiers.
16 PrivilEdge - William Blair Global Leaders · 31/03/2019
382 919.2880 19 528.9170 (34 987.1110) 367 461.0940P - USD - Capitalisation140 908.5490 14 651.9350 (32 496.6490) 123 063.8350P - EUR - Capitalisation
7 791.4840 0.0000 0.0000 7 791.4840R - USD - Capitalisation5 601.4900 0.0000 (2 088.1950) 3 513.2950R - EUR - Capitalisation
0.0000 4 000.0000 0.0000 4 000.0000I - USD - Capitalisation300 000.0000 350 000.0000 0.0000 650 000.0000I - USD - Distribution
1 958 471.7300 410 781.9610 (371 430.5210) 1 997 823.1700M - USD - Capitalisation7 791.0000 67 142.9810 (4 090.0000) 70 843.9810M - USD - Distribution
336 695.2610 38 366.3990 (49 138.5960) 325 923.0640M - EUR - Capitalisation1 792 471.9220 114 706.0000 (713 678.8900) 1 193 499.0320N - USD - Capitalisation
117 069.9840 0.0000 0.0000 117 069.9840N - USD - Distribution278 085.0000 118 646.4350 (12 442.0000) 384 289.4350N - EUR - Capitalisation
Statement of changes in the number of shares outstanding for the period from 01/10/2018 to 31/03/2019 / Étatdes variations du nombre d'actions pour la période du 01/10/2018 au 31/03/2019
Number of Shares01/10/2018/
Nombre d'actions01/10/2018
Number of Sharesissued/
Nombre d'actionsémises
Number of Sharesredeemed/
Nombre d'actionsrachetées
Number of Shares31/03/2019/
Nombre d'actions31/03/2019
30/09/201831/03/2019For the period ended/Pour la période clôturée au
Statistics / Statistiques
30/09/2017
P - USD - Capitalisation
6 456 882.3017.5716
7 030 574.3518.3605
5 788 186.7615.7450
Net Asset Value/Valeur Nette d'InventaireNet Asset Value per share/Valeur Nette d'Inventaire par action
USD USD USD
P - EUR - Capitalisation
2 581 937.2420.9805
2 986 257.4321.1929
2 260 873.2217.8558
Net Asset Value/Valeur Nette d'InventaireNet Asset Value per share/Valeur Nette d'Inventaire par action
EUR EUR EUR
R - USD - Capitalisation
127 159.9216.3204
133 497.6417.1338
49 165.9314.8334
Net Asset Value/Valeur Nette d'InventaireNet Asset Value per share/Valeur Nette d'Inventaire par action
USD USD USD
R - EUR - Capitalisation
68 482.1719.4923
110 813.5419.7829
163 513.2116.8269
Net Asset Value/Valeur Nette d'InventaireNet Asset Value per share/Valeur Nette d'Inventaire par action
EUR EUR EUR
I - USD - Capitalisation
77 944.5619.4861
0.000.0000
0.000.0000
Net Asset Value/Valeur Nette d'InventaireNet Asset Value per share/Valeur Nette d'Inventaire par action
USD USD USD

The accompanying notes form an integral part of these financial statements.Les notes annexées font partie intégrante de ces états financiers.
17PrivilEdge - William Blair Global Leaders · 31/03/2019
30/09/201831/03/2019For the period ended/Pour la période clôturée au
Statistics / Statistiques
30/09/2017
I - USD - Distribution
12 665 982.0619.4861
0.00
6 074 957.9420.2499
0.00
0.000.0000
0.00
Net Asset Value/Valeur Nette d'InventaireNet Asset Value per share/Valeur Nette d'Inventaire par actionDividend per share paid to shareholders/Dividende par action payé aux actionnaires
USD USD USD
M - USD - Capitalisation
36 620 593.0618.3302
37 368 217.8819.0803
24 597 332.7216.2482
Net Asset Value/Valeur Nette d'InventaireNet Asset Value per share/Valeur Nette d'Inventaire par action
USD USD USD
M - USD - Distribution
1 295 075.1218.2807
0.00
148 252.4719.0287
0.00
0.000.0000
0.00
Net Asset Value/Valeur Nette d'InventaireNet Asset Value per share/Valeur Nette d'Inventaire par actionDividend per share paid to shareholders/Dividende par action payé aux actionnaires
USD USD USD
M - EUR - Capitalisation
7 133 299.7821.8865
7 415 350.1822.0239
6 434 616.2418.4265
Net Asset Value/Valeur Nette d'InventaireNet Asset Value per share/Valeur Nette d'Inventaire par action
EUR EUR EUR
N - USD - Capitalisation
23 225 370.4219.4599
36 281 493.1320.2410
7 391 596.3417.1936
Net Asset Value/Valeur Nette d'InventaireNet Asset Value per share/Valeur Nette d'Inventaire par action
USD USD USD
N - USD - Distribution
2 278 175.8719.4599
0.00
2 369 624.0520.2411
0.00
0.000.0000
0.00
Net Asset Value/Valeur Nette d'InventaireNet Asset Value per share/Valeur Nette d'Inventaire par actionDividend per share paid to shareholders/Dividende par action payé aux actionnaires
USD USD USD
N - EUR - Capitalisation
8 493 442.4822.1017
6 180 130.0522.2239
4 414 275.6618.5474
Net Asset Value/Valeur Nette d'InventaireNet Asset Value per share/Valeur Nette d'Inventaire par action
EUR EUR EUR

The accompanying notes form an integral part of these financial statements.Les notes annexées font partie intégrante de ces états financiers.
18 PrivilEdge - William Blair Global Leaders · 31/03/2019
Investments in securities at market value/Portefeuille-titres à la valeur de marché 101 831 674.24 98.61
ARISTOCRAT LEISURE35 361 615 658.87 0.60AUD
Transferable securities admitted to an official stock exchange listing and/or dealt in on anotherregulated market/Valeurs mobilières admises à la cote officielle d'une bourse de valeurs et/ounégociées sur un autre marché réglementé
101 831 674.24 98.61
EQUITIES/ACTIONS 101 831 674.24 98.61
AUSTRALIA/AUSTRALIE 4 033 233.20 3.91
CSL LTD12 451 1 724 159.68 1.67AUDMACQUARIE GROUP18 420 1 693 414.65 1.64AUD
BROOKFIELD ASSET MANAGEMENT INC -A-36 044 1 681 452.60 1.63USD
CANADA/CANADA 1 681 452.60 1.63
ALIBABA GR ADR14 026 2 559 043.70 2.47USD
CAYMAN ISLANDS/ILES CAÏMANS 6 045 414.53 5.84
HUAZHU GROUP -SHS ADR18 718 788 402.16 0.76USDSHENZHOU INTERNATIONAL GROUP62 000 830 881.10 0.80HKDTENCENT HLDG40 600 1 867 087.57 1.81HKD
CHRISTIAN HANSEN9 872 1 001 652.86 0.97DKK
DENMARK/DANEMARK 2 012 688.66 1.95
DSV12 213 1 011 035.80 0.98DKK
LVMH5 277 1 942 899.13 1.88EUR
FRANCE/FRANCE 1 942 899.13 1.88
INFINEON TECHNOLOGIES REG SHS56 057 1 113 157.61 1.08EUR
GERMANY/ALLEMAGNE 2 205 100.27 2.14
MTU AERO ENGINES HOLDING AG4 819 1 091 942.66 1.06EUR
BURFORD CAPITAL LIMITED22 504 494 405.10 0.48GBP
GUERNSEY/ILE DE GUERNESEY 494 405.10 0.48
AIA GROUP LTD214 200 2 132 455.12 2.07HKD
HONG KONG/HONG-KONG 3 582 758.19 3.47
GALAXY ENTERTAINMENT GROUP LTD213 000 1 450 303.07 1.40HKD
HOUSING DEVT FINANCE ADR REPR 3 SHS13 534 1 568 725.94 1.52USD
INDIA/INDE 1 568 725.94 1.52
ALLEGION PLC WI9 745 883 968.95 0.86USD
IRELAND/IRLANDE 883 968.95 0.86
DAIKIN INDUSTRIES LTD9 600 1 124 922.09 1.09JPY
JAPAN/JAPON 7 598 121.34 7.35
KEYENCE CORP2 900 1 807 047.05 1.74JPYMISUMI GROUP17 800 442 567.65 0.43JPYNIHON M&A CENTER INC31 300 856 836.98 0.83JPYNISSAN CHEMICAL CORP9 900 453 476.09 0.44JPYORIX CORP71 700 1 029 653.08 1.00JPYSMC CORP1 800 675 376.08 0.65JPYSO-NET M324 500 411 044.86 0.40JPYZOZO INC42 300 797 197.46 0.77JPY
DELPHI AUTOMOTIVE PLC13 973 1 110 713.77 1.08USD
JERSEY/JERSEY 1 110 713.77 1.08
CARNIVAL CORP25 596 1 298 229.12 1.26USD
PANAMA/PANAMA 1 298 229.12 1.26
Schedule of investments as at 31/03/2019 / Inventaire du portefeuille au 31/03/2019
USD
Market ValueNumber of Shares orNominal Value
Investment % of Net AssetsQuotationCurrency
Valeur de marchéNombre d'actions ouvaleur nominale
Investissement % de l'actif netDevise decotation

The accompanying notes form an integral part of these financial statements.Les notes annexées font partie intégrante de ces états financiers.
19PrivilEdge - William Blair Global Leaders · 31/03/2019
ATLAS COPCO --- REGISTERED SHS -A-34 041 916 234.78 0.89SEK
SWEDEN/SUÈDE 2 478 645.56 2.40
HEXAGON -B-29 880 1 562 410.78 1.51SEK
LONZA GROUP (CHF)4 864 1 508 181.80 1.46CHF
SWITZERLAND/SUISSE 3 063 188.22 2.97
PARTNERS GROUP HLDG NAMEN AKT2 139 1 555 006.42 1.51CHF
TAIWAN SEMICON ADR (REPR 5 SHS)51 109 2 093 424.64 2.03USD
TAIWAN/TAÏWAN 2 093 424.64 2.03
ROYAL DUTCH SHELL PLC44 649 1 402 752.95 1.36EUR
THE NETHERLANDS/PAYS-BAS 1 402 752.95 1.36
COMPASS GROUP76 570 1 800 450.49 1.74GBP
UNITED KINGDOM/ROYAUME-UNI 3 014 821.21 2.92
FEVERTREE DRINK PLC17 201 676 678.63 0.66GBPVICTREX19 139 537 692.09 0.52GBP
ABIOMED INC2 080 594 027.20 0.58USD
UNITED STATES/ÉTATS-UNIS 55 321 130.86 53.56
ADOBE INC6 801 1 812 398.49 1.76USDALIGN TECHNOLOGY INC1 996 567 522.68 0.55USDALPHABET INC2 569 3 023 430.41 2.92USDAMAZON.COM INC1 686 3 002 344.50 2.90USDBLACKROCK INC4 059 1 734 694.83 1.68USDBOEING CO COM.4 124 1 572 976.08 1.52USDCOSTAR GROUP INC1 977 922 112.34 0.89USDDOMINO PIZZA INC4 826 1 245 590.60 1.21USDEOG RESOURCES INC11 829 1 125 884.22 1.09USDESTEE LAUDER COMPANIES INC -A-12 974 2 147 845.70 2.08USDFACEBOOK -A-10 582 1 763 913.58 1.71USDFIFTH THIRD BANCORP36 305 915 612.10 0.89USDGOLDMAN SACHS GROUP INC5 417 1 040 009.83 1.01USDGUIDEWIRE SOFTWARE INC5 725 556 241.00 0.54USDHOME DEPOT INC10 146 1 946 915.94 1.89USDIDEXX LABS CORP2 400 536 640.00 0.52USDILLUMINA INC2 238 695 324.22 0.67USDINTERCONEXCH GR INC21 559 1 641 502.26 1.59USDINTUITIVE SURGICAL1 701 970 556.58 0.94USDJPMORGAN CHASE17 091 1 730 121.93 1.68USDMASTERCARD INC -A-9 958 2 344 611.10 2.27USDNEXTERA ENERGY7 657 1 480 251.24 1.43USDPAYPAL HOLDINGS INC16 423 1 705 364.32 1.65USDPROLOGIS14 112 1 015 358.40 0.98USDRAYTHEON CO10 105 1 839 918.40 1.78USDROPER TECHNOLOGIES4 974 1 700 958.78 1.65USDSALESFORCE COM.INC11 211 1 775 486.07 1.72USDSOUTHWEST AIRLINES - REGISTERED10 635 552 062.85 0.53USDTHERMO FISHER SCIENTIFIC INC6 452 1 766 041.44 1.71USDULTA BEAUTY RG REGISTERED4 323 1 507 559.79 1.46USDUNION PACIFIC CORP12 968 2 168 249.60 2.10USDUNITEDHEALTH GROUP INC9 526 2 355 398.76 2.27USDVAIL RESORTS INC5 790 1 258 167.00 1.22USDVEEVA SYSTEMS -A-4 481 568 459.66 0.55USDWEIGHT WATCHERS13 407 270 151.05 0.26USDWORLDPAY - REGISTERED SHS -A-16 560 1 879 560.00 1.82USDZOETIS INC -A-15 773 1 587 867.91 1.54USD
Schedule of investments as at 31/03/2019 / Inventaire du portefeuille au 31/03/2019
USD
Market ValueNumber of Shares orNominal Value
Investment % of Net AssetsQuotationCurrency
Valeur de marchéNombre d'actions ouvaleur nominale
Investissement % de l'actif netDevise decotation

20

PrivilEdgeis an investment company
with variable capital ("SICAV")incorporated in Luxembourg
PrivilEdgeest une société d’investissement
à capital variable ("SICAV")enregistrée au Luxembourg RCS Luxembourg B0181207
PrivilEdge –Wellington Large Cap US Research
Unaudited semi-annual report · Rapport semestriel non révisé
31.03.2019

The accompanying notes form an integral part of these financial statements.Les notes annexées font partie intégrante de ces états financiers.
22 PrivilEdge - Wellington Large Cap US Research · 31/03/2019
ASSETS/ACTIF
372 895 461.21Investments in securities at market value/Portefeuille-titres à la valeur de marché (2):( USD )321 784 135.09Acquisition cost/Coût d'acquisition
3 616 897.40Cash and term deposits/Liquidité et dépôts à terme787 267.99Receivable on investments sold/À recevoir sur vente de titres161 015.48Amounts receivable on subscriptions/Montants à recevoir sur souscriptions d'actions242 651.20Interest and dividends receivable, net/Intérêt et dividendes nets à recevoir
2 670.09Formation/reorganisation expenses/Frais de constitution/réorganisation (2)377 705 963.37
LIABILITIES/PASSIF
1 043 083.70Payable on investments purchased/À payer sur achat de titres117 047.19Amounts payable on redemptions/Montants à payer sur rachats d'actions236 978.85Management and distribution fees payable/Commission de gestion et de distribution à payer (3)
78 012.85Taxes and expenses payable/Impôts et autres frais à payer125 773.85Unrealised depreciation on forward foreign currency exchange contracts/Moins-value non réalisée sur contrats de change à
terme(2)
1 600 896.44376 105 066.93NET ASSET VALUE/VALEUR NETTE D'INVENTAIRE
Statement of net assets as at 31/03/2019 / État de l'actif net au 31/03/2019
NotesNotes USD

The accompanying notes form an integral part of these financial statements.Les notes annexées font partie intégrante de ces états financiers.
23PrivilEdge - Wellington Large Cap US Research · 31/03/2019
Statement of operations and changes in net assets for the period from 01/10/2018 to 31/03/2019 / État desopérations et des variations de l'actif net pour la période du 01/10/2018 au 31/03/2019
NotesNotes USD
449 405 894.79NET ASSET VALUE AT THE BEGINNING OF THE PERIOD/VALEUR NETTE D'INVENTAIRE AU DÉBUT DE LAPÉRIODE
INCOME/REVENUS
2 434 742.31Dividends, net/Dividendes, nets (2)33 336.18Bank interest/Intérêts bancaires
2 468 078.49EXPENSES/DÉPENSES
1 390 212.96Management fees/Commission de gestion (3)116 073.21Distribution fees/Frais de distribution (3)
3.99Bank interest and other expenses/Intérêts bancaires débiteurs et autres frais504 344.74Fixed Rate of Operational Costs/Taux Fixe de Coûts Opérationnels (4)
10 454.15Formation/Reorganisation expenses/Frais de constitution/réorganisation (2)2 021 089.05
446 989.44NET INVESTMENT INCOME/REVENU NET SUR INVESTISSEMENTS
4 671 667.19Net realised gain on sale of investments/Gain net réalisé sur ventes d'investissements (2)5 277.40Net realised gain on foreign exchange/Gain net réalisé sur opérations de change
(297 147.18)Net realised loss on forward foreign currency exchange contracts/Perte nette réalisée sur contrats de change à terme4 826 786.85NET REALISED GAIN/GAIN NET RÉALISÉ
(20 291 810.85)Change in net unrealised appreciation or depreciation on investments/Variation de la plus ou moins-value nette non réaliséesur investissements
(2)
(106 073.00)Change in net unrealised appreciation or depreciation on forward foreign currency exchange contracts/Variation de la plus oumoins-value nette non réalisée sur contrats de change à terme
(15 571 097.00)NET DECREASE IN NET ASSETS AS A RESULT OF OPERATIONS/DIMINUTION NETTE DE L'ACTIF NET RÉSULTANTDES OPÉRATIONS
(49 164.48)Dividend paid/Dividende payé(57 680 566.38)Net subscriptions/(redemptions) including equalisation/Souscriptions/(rachats) nets incluant la régularisation376 105 066.93NET ASSET VALUE AT THE END OF THE PERIOD/VALEUR NETTE D'INVENTAIRE À LA FIN DE LA PÉRIODE

The accompanying notes form an integral part of these financial statements.Les notes annexées font partie intégrante de ces états financiers.
24 PrivilEdge - Wellington Large Cap US Research · 31/03/2019
1 815 321.9300 65 199.9900 (179 289.5220) 1 701 232.3980P - USD - Capitalisation169 298.8800 23 001.0000 (6 000.0000) 186 299.8800P - USD - Distribution
85 004.4140 52 771.0190 (12 031.0000) 125 744.4330P - EUR - Hedged - Capitalisation1 009.0340 0.0000 0.0000 1 009.0340R - USD - Capitalisation
248 383.5360 61 352.9950 (24 722.0000) 285 014.5310I - USD - Capitalisation491 644.7700 0.0000 0.0000 491 644.7700I - USD - Distribution
12 643 922.7090 874 219.0140 (2 672 485.1640) 10 845 656.5590M - USD - Capitalisation2 305 068.1790 34 046.7400 (1 109 962.4000) 1 229 152.5190M - USD - Distribution
183 695.2630 1 136 806.0060 (253 798.6210) 1 066 702.6480M - EUR - Hedged - Capitalisation0.0000 3 394.6780 0.0000 3 394.6780M - EUR - Hedged - Distribution
4 423 468.9500 167 384.6730 (866 029.3510) 3 724 824.2720N - USD - Capitalisation
Statement of changes in the number of shares outstanding for the period from 01/10/2018 to 31/03/2019 / Étatdes variations du nombre d'actions pour la période du 01/10/2018 au 31/03/2019
Number of Shares01/10/2018/
Nombre d'actions01/10/2018
Number of Sharesissued/
Nombre d'actionsémises
Number of Sharesredeemed/
Nombre d'actionsrachetées
Number of Shares31/03/2019/
Nombre d'actions31/03/2019
30/09/201831/03/2019For the period ended/Pour la période clôturée au
Statistics / Statistiques
30/09/2017
P - USD - Capitalisation
31 633 475.6818.5944
34 887 917.1419.2186
44 314 582.3016.8875
Net Asset Value/Valeur Nette d'InventaireNet Asset Value per share/Valeur Nette d'Inventaire par action
USD USD USD
P - USD - Distribution
3 466 716.5718.6083
0.00
3 256 101.6219.2329
0.00
3 869 637.8916.9001
0.00
Net Asset Value/Valeur Nette d'InventaireNet Asset Value per share/Valeur Nette d'Inventaire par actionDividend per share paid to shareholders/Dividende par action payé aux actionnaires
USD USD USD
P - EUR - Hedged - Capitalisation
1 331 224.2410.5867
946 048.3711.1294
0.000.0000
Net Asset Value/Valeur Nette d'InventaireNet Asset Value per share/Valeur Nette d'Inventaire par action
EUR EUR EUR
R - USD - Capitalisation
17 408.7117.2528
18 082.8417.9209
32 241.4915.9057
Net Asset Value/Valeur Nette d'InventaireNet Asset Value per share/Valeur Nette d'Inventaire par action
USD USD USD
I - USD - Capitalisation
5 877 693.8220.6224
5 266 636.4521.2036
1 844 203.6418.4372
Net Asset Value/Valeur Nette d'InventaireNet Asset Value per share/Valeur Nette d'Inventaire par action
USD USD USD

The accompanying notes form an integral part of these financial statements.Les notes annexées font partie intégrante de ces états financiers.
25PrivilEdge - Wellington Large Cap US Research · 31/03/2019
30/09/201831/03/2019For the period ended/Pour la période clôturée au
Statistics / Statistiques
30/09/2017
I - USD - Distribution
10 087 189.4520.5172
0.10
10 424 652.9021.2036
0.00
9 064 543.2718.4372
0.00
Net Asset Value/Valeur Nette d'InventaireNet Asset Value per share/Valeur Nette d'Inventaire par actionDividend per share paid to shareholders/Dividende par action payé aux actionnaires
USD USD USD
M - USD - Capitalisation
210 360 124.7219.3958
252 548 059.8219.9739
220 557 415.8017.4375
Net Asset Value/Valeur Nette d'InventaireNet Asset Value per share/Valeur Nette d'Inventaire par action
USD USD USD
M - USD - Distribution
23 779 130.4119.3460
0.00
45 922 825.3619.9225
0.00
36 425 857.5817.3927
0.05
Net Asset Value/Valeur Nette d'InventaireNet Asset Value per share/Valeur Nette d'Inventaire par actionDividend per share paid to shareholders/Dividende par action payé aux actionnaires
USD USD USD
M - EUR - Hedged - Capitalisation
11 367 106.3110.6563
2 050 360.5611.1617
1 274 133.6810.0000
Net Asset Value/Valeur Nette d'InventaireNet Asset Value per share/Valeur Nette d'Inventaire par action
EUR EUR EUR
M - EUR - Hedged - Distribution
36 174.7310.6563
0.00
0.000.0000
0.00
0.000.0000
0.00
Net Asset Value/Valeur Nette d'InventaireNet Asset Value per share/Valeur Nette d'Inventaire par actionDividend per share paid to shareholders/Dividende par action payé aux actionnaires
EUR EUR EUR
N - USD - Capitalisation
76 584 388.3220.5605
93 601 289.6921.1602
102 705 751.3918.4270
Net Asset Value/Valeur Nette d'InventaireNet Asset Value per share/Valeur Nette d'Inventaire par action
USD USD USD
N - USD - Distribution
0.000.0000
0.00
0.000.0000
0.00
2 086 678.6518.3042
0.00
Net Asset Value/Valeur Nette d'InventaireNet Asset Value per share/Valeur Nette d'Inventaire par actionDividend per share paid to shareholders/Dividende par action payé aux actionnaires
USD USD USD

The accompanying notes form an integral part of these financial statements.Les notes annexées font partie intégrante de ces états financiers.
26 PrivilEdge - Wellington Large Cap US Research · 31/03/2019
Investments in securities at market value/Portefeuille-titres à la valeur de marché 372 895 461.21 99.15
ATHENE HOLDING REG A49 054 2 001 403.20 0.53USD
Transferable securities admitted to an official stock exchange listing and/or dealt in on anotherregulated market/Valeurs mobilières admises à la cote officielle d'une bourse de valeurs et/ounégociées sur un autre marché réglementé
372 895 461.21 99.15
EQUITIES/ACTIONS 372 895 461.21 99.15
BERMUDA/BERMUDES 7 312 043.04 1.94
IHS MARKIT54 690 2 974 042.20 0.79USDMARVELL TECHNOLOGY GROUP LTD117 476 2 336 597.64 0.62USD
ENCANA CORP67 030 485 297.20 0.13USD
CANADA/CANADA 2 917 494.94 0.78
TRANSCANADA CORP54 121 2 432 197.74 0.65USD
ALLERGAN29 032 4 250 575.12 1.12USD
IRELAND/IRLANDE 6 783 427.02 1.80
INGERSOLL-RAND11 395 1 230 090.25 0.33USDLINDE PLC (USD)7 405 1 302 761.65 0.35USD
TEVA PHARMA ADR SPONS REPR 1 SH60 180 943 622.40 0.25USD
ISRAEL/ISRAËL 943 622.40 0.25
SPOTIFY TECH - REGISTERED SHS3 502 486 077.60 0.13USD
LUXEMBOURG/LUXEMBOURG 486 077.60 0.13
FLEXTRONICS INTERNATIONAL LTD142 730 1 427 300.00 0.38USD
SINGAPORE/SINGAPOUR 1 427 300.00 0.38
MYLAN NV.50 725 1 437 546.50 0.38USD
THE NETHERLANDS/PAYS-BAS 1 437 546.50 0.38
ASTRAZENECA ADR REPR 1SHS112 829 4 561 676.47 1.21USD
UNITED KINGDOM/ROYAUME-UNI 4 561 676.47 1.21
ABBOTT LABORATORIES LTD77 163 6 168 410.22 1.64USD
UNITED STATES/ÉTATS-UNIS 347 026 273.24 92.28
ADOBE INC6 155 1 640 245.95 0.44USDADVANCED MICRO DEVICES INC74 013 1 888 811.76 0.50USDALCOA WHEN ISSUED3 233 91 041.28 0.02USDALEXANDRIA REAL ESTATE13 780 1 964 476.80 0.52USDALLSTATE CORP5 921 557 639.78 0.15USDALNYLAM PHARMACEUTICALS INC3 615 337 821.75 0.09USDALPHABET INC10 687 12 577 423.43 3.34USDAMAZON.COM INC10 763 19 166 212.25 5.11USDAMERICAN EXPRESS CO COM.18 202 1 989 478.60 0.53USDAMERICAN INTERNATIONAL GROUP INC65 455 2 818 492.30 0.75USDAMERICAN TOWER CORP28 569 5 629 807.14 1.50USDAMETEK INC14 499 1 202 982.03 0.32USDANTHEM15 927 4 570 730.46 1.22USDAPPLE INC33 510 6 365 224.50 1.69USDAT&T161 843 6 470 483.14 1.72USDAUTODESK INC3 839 598 192.98 0.16USDAXA EQTBL HLD - REGISTERED SHS49 013 987 121.82 0.26USDBAKER HUGHES-A RG REGISTERED SHS -A43 370 1 202 216.40 0.32USDBALL CORP26 761 1 548 391.46 0.41USDBANK OF AMERICA CORP429 172 11 840 855.48 3.15USDBAXTER INTERNATIONAL INC29 149 2 370 105.19 0.63USD
Schedule of investments as at 31/03/2019 / Inventaire du portefeuille au 31/03/2019
USD
Market ValueNumber of Shares orNominal Value
Investment % of Net AssetsQuotationCurrency
Valeur de marchéNombre d'actions ouvaleur nominale
Investissement % de l'actif netDevise decotation

The accompanying notes form an integral part of these financial statements.Les notes annexées font partie intégrante de ces états financiers.
27PrivilEdge - Wellington Large Cap US Research · 31/03/2019
BERKSHIRE HATHAWAY -B-13 661 2 744 358.29 0.73USDBIOGEN IDEC INC2 877 680 065.26 0.18USDBOEING CO COM.13 069 4 984 777.98 1.33USDBOOKING HLDG719 1 254 590.29 0.33USDBOSTON SCIENTIFIC CORP116 627 4 476 144.26 1.19USDBRISTOL-MYERS SQUIBB CO94 424 4 504 969.04 1.20USDBROADCOM - REGISTERED SHS879 264 324.09 0.07USDCATERPILLAR - REGISTERED9 493 1 286 206.57 0.34USDCELANESE RG REGISTERED SHS16 906 1 667 100.66 0.44USDCHARTER COMM -A-7 058 2 448 490.78 0.65USDCHEVRON CORP23 219 2 860 116.42 0.76USDCOCA-COLA CO140 824 6 599 012.64 1.75USDCONCHO RES4 542 503 980.32 0.13USDCONOCOPHILLIPS CO2 169 144 759.06 0.04USDCROWN HOLDINGS INC16 889 921 632.73 0.25USDDANAHER CORP24 324 3 211 254.48 0.85USDDEERE AND CO6 322 1 010 508.48 0.27USDDEVON ENERGY CORP5 523 174 305.88 0.05USDDIAMONDBACK ENERGY3 011 305 706.83 0.08USDDOWDUPONT43 896 2 340 095.76 0.62USDEDISON INTERNATIONAL39 709 2 458 781.28 0.65USDELECTRONIC ARTS - REGISTERED17 655 1 794 277.65 0.48USDELI LILLY AND CO10 739 1 393 492.64 0.37USDEOG RESOURCES INC1 461 139 057.98 0.04USDEQUIFAX INC6 319 748 801.50 0.20USDEQUINIX3 943 1 786 809.88 0.48USDESSEX PROPERTY TRUST6 373 1 843 326.52 0.49USDEXELON CORP51 772 2 595 330.36 0.69USDEXPEDIA GROUP19 641 2 337 279.00 0.62USDEXXON MOBIL CORP94 762 7 656 769.60 2.04USDFACEBOOK -A-47 781 7 964 614.89 2.12USDFLEETCOR TECHNOLOGIES12 869 3 173 366.71 0.84USDFMC CORP11 913 915 156.66 0.24USDFORTIVE WHEN ISSUED6 036 506 360.04 0.13USDFOX A10 605 389 309.55 0.10USDFREEPORT MCMORAN COPPER AND GOLD INC11 629 149 897.81 0.04USDGENERAL ELECTRIC CO138 106 1 379 678.94 0.37USDGLOBAL PAYMENTS INC31 954 4 362 360.08 1.16USDGODADDY -A-24 482 1 840 801.58 0.49USDHALLIBURTON41 749 1 223 245.70 0.33USDHARRIS CORP12 562 2 006 277.02 0.53USDHARTFORD FINANCIAL SERVICES GROUP INC47 902 2 381 687.44 0.63USDHCA HEALTHCARE RG REGISTERED SHS17 595 2 294 036.10 0.61USDHILTON WORLDWIDE HLDGS INC REG SHS14 504 1 205 427.44 0.32USDILLINOIS TOOL WORKS11 956 1 716 044.68 0.46USDINCYTE CORP6 685 574 976.85 0.15USDINTEL CORP51 873 2 785 580.10 0.74USDINTERNATIONAL PAPER CO22 345 1 033 903.15 0.27USDJACOBS ENGIN GROUP9 152 688 138.88 0.18USDJ.B. HUNT TRANSPORT SERVICES INC9 919 1 004 695.51 0.27USDKLA-TENCOR CORP7 330 875 275.30 0.23USDLENNAR CORP -A-35 092 1 722 666.28 0.46USDLIBERTY MEDIA -C- MEDIA GROUP22 547 790 272.35 0.21USDLOCKHEED MARTIN - REGISTERED15 227 4 570 536.32 1.22USDLOWE'S COMPANIES INC45 308 4 959 866.76 1.32USDMARATHON PETROLEUM30 429 1 821 175.65 0.48USDMARSH MC-LENNAN COS. INC.31 108 2 921 041.20 0.78USDMCDONALD'S CORP21 778 4 135 642.20 1.10USD
Schedule of investments as at 31/03/2019 / Inventaire du portefeuille au 31/03/2019
USD
Market ValueNumber of Shares orNominal Value
Investment % of Net AssetsQuotationCurrency
Valeur de marchéNombre d'actions ouvaleur nominale
Investissement % de l'actif netDevise decotation

The accompanying notes form an integral part of these financial statements.Les notes annexées font partie intégrante de ces états financiers.
28 PrivilEdge - Wellington Large Cap US Research · 31/03/2019
MGM RESORTS INTL34 268 879 316.88 0.23USDMICRON TECHNOLOGY28 848 1 192 287.84 0.32USDMICROSOFT CORP116 516 13 741 897.04 3.65USDMONDELEZ INTERNATIONAL INC37 359 1 864 961.28 0.50USDMONSTER BEVERAGE CORP29 222 1 594 936.76 0.42USDNETFLIX INC6 710 2 392 517.60 0.64USDNEXTERA ENERGY13 500 2 609 820.00 0.69USDNIKE INC38 530 3 244 611.30 0.86USDNOBLE ENERGY INC17 992 444 942.16 0.12USDNORFOLK SOUTHERN CORP31 346 5 858 253.94 1.56USDNORTHERN TRUST CORP27 275 2 465 932.75 0.66USDNRG ENERGY65 219 2 770 503.12 0.74USDNUCOR CORP7 703 449 470.05 0.12USDNVIDIA CORP3 644 654 316.64 0.17USDOCCIDENTAL PETROLEUM CORP3 243 214 686.60 0.06USDONEOK INC (NEW)13 192 921 329.28 0.24USDPAYPAL HOLDINGS INC28 786 2 989 138.24 0.79USDPG AND E CORP27 260 485 228.00 0.13USDPHILIP MORRIS INTERNATIONAL INC44 690 3 950 149.10 1.05USDPIONER NATURAL RESOURCES COMPANY3 198 486 991.44 0.13USDPPG INDUSTRIES INC10 994 1 240 892.78 0.33USDPROCTER AND GAMBLE CO57 427 5 975 279.35 1.59USDPROGRESSIVE CORP17 865 1 287 887.85 0.34USDPRUDENTIAL FINANCIAL INC23 755 2 182 609.40 0.58USDPUBLIC STORAGE INC2 742 597 152.76 0.16USDRAYMOND JAMES FINANCIAL INC21 100 1 696 651.00 0.45USDRAYTHEON CO15 609 2 842 086.72 0.76USDREGENERON PHARMACEUTICALS INC854 350 669.48 0.09USDSALESFORCE COM.INC17 285 2 737 425.45 0.73USDSEATTLE GENETICS INC11 616 850 755.84 0.23USDSEMPRA ENERGY33 502 4 216 561.72 1.12USDSERVICENOW INC3 869 953 669.81 0.25USDSIMON PROPERTY GROUP - REGISTERED7 088 1 291 504.48 0.34USDSOUTHERN COPPER CORP5 545 220 025.60 0.06USDSOUTHWEST AIRLINES - REGISTERED20 324 1 055 018.84 0.28USDSPLUNK3 950 492 170.00 0.13USDSS C TECHNOLOGIERS HOLDINGS85 431 5 441 100.39 1.45USDSYSCO CORP15 331 1 023 497.56 0.27USDTD AMERITRADE HOLDING CORP79 427 3 970 555.73 1.06USDTEXAS INSTRUMENTS INC18 205 1 931 004.35 0.51USDTHERMO FISHER SCIENTIFIC INC15 069 4 124 686.68 1.10USDTJX COS INC93 883 4 995 514.43 1.33USDTOTAL SYSTEM SERVICES INC9 822 933 188.22 0.25USDUNION PACIFIC CORP11 227 1 877 154.40 0.50USDUNITEDHEALTH GROUP INC15 492 3 830 551.92 1.02USDVERIZON COMMUNICATIONS INC120 242 7 109 909.46 1.89USDVERTEX PHARMACEUTICALS INC9 792 1 801 238.40 0.48USDVIACOM -B-12 916 362 552.12 0.10USDVISA INC -A-35 840 5 597 849.60 1.49USDVULCAN MATERIALS CO2 474 292 921.60 0.08USDWALT DISNEY CO17 987 1 997 096.61 0.53USDWASTE MANAGEMENT INC27 979 2 907 297.89 0.77USDWESTERN DIGITAL CORP17 543 843 116.58 0.22USDWORKDAY -A-7 511 1 448 496.35 0.39USDXILINX INC10 969 1 390 759.51 0.37USD3M CO6 890 1 431 604.20 0.38USD
Schedule of investments as at 31/03/2019 / Inventaire du portefeuille au 31/03/2019
USD
Market ValueNumber of Shares orNominal Value
Investment % of Net AssetsQuotationCurrency
Valeur de marchéNombre d'actions ouvaleur nominale
Investissement % de l'actif netDevise decotation

The accompanying notes form an integral part of these financial statements.Les notes annexées font partie intégrante de ces états financiers.
29PrivilEdge - Wellington Large Cap US Research · 31/03/2019
Schedule of investments as at 31/03/2019 / Inventaire du portefeuille au 31/03/2019
Forward Foreign Currency Exchange Contracts/Contrats de change à terme (0.03)(125 773.85)EUR 15 209 790.22 (0.03)USD (129 949.30)13 415 201.12 15/04/2019Caceis BankUSD 828 448.48 0.00EUR 4 175.45935 426.81 15/04/2019Caceis Bank
USD
Unrealised appreciation/(depreciation)
Currency % of NetAssets
Amount bought Maturity Currency Amount soldCounterparty
Plus/(Moins) value non-réalisée
Devise % de l'actifnet
Montant acheté Maturité Devise Montant venduContrepartie

30

PrivilEdgeis an investment company
with variable capital ("SICAV")incorporated in Luxembourg
PrivilEdgeest une société d’investissement
à capital variable ("SICAV")enregistrée au Luxembourg RCS Luxembourg B0181207
PrivilEdge –Sands US Growth
Unaudited semi-annual report · Rapport semestriel non révisé
31.03.2019

The accompanying notes form an integral part of these financial statements.Les notes annexées font partie intégrante de ces états financiers.
32 PrivilEdge - Sands US Growth · 31/03/2019
ASSETS/ACTIF
353 670 318.59Investments in securities at market value/Portefeuille-titres à la valeur de marché (2):( USD )238 438 433.76Acquisition cost/Coût d'acquisition
14 767 783.73Cash and term deposits/Liquidité et dépôts à terme1 175 184.59Receivable on investments sold/À recevoir sur vente de titres1 358 911.31Amounts receivable on subscriptions/Montants à recevoir sur souscriptions d'actions
34 783.70Interest and dividends receivable, net/Intérêt et dividendes nets à recevoir2 465.90Formation/reorganisation expenses/Frais de constitution/réorganisation (2)
371 009 447.82LIABILITIES/PASSIF
429 499.47Amounts payable on redemptions/Montants à payer sur rachats d'actions315 355.71Management and distribution fees payable/Commission de gestion et de distribution à payer (3)
75 311.04Taxes and expenses payable/Impôts et autres frais à payer2 140.12Payable on foreign exchange transactions, net/A payer sur opérations de change, net
112 124.63Unrealised depreciation on forward foreign currency exchange contracts/Moins-value non réalisée sur contrats de change àterme
(2)
934 430.97370 075 016.85NET ASSET VALUE/VALEUR NETTE D'INVENTAIRE
Statement of net assets as at 31/03/2019 / État de l'actif net au 31/03/2019
NotesNotes USD

The accompanying notes form an integral part of these financial statements.Les notes annexées font partie intégrante de ces états financiers.
33PrivilEdge - Sands US Growth · 31/03/2019
Statement of operations and changes in net assets for the period from 01/10/2018 to 31/03/2019 / État desopérations et des variations de l'actif net pour la période du 01/10/2018 au 31/03/2019
NotesNotes USD
410 736 083.16NET ASSET VALUE AT THE BEGINNING OF THE PERIOD/VALEUR NETTE D'INVENTAIRE AU DÉBUT DE LAPÉRIODE
INCOME/REVENUS
254 157.30Dividends, net/Dividendes, nets (2)158 827.74Bank interest/Intérêts bancaires
2 925.88Securities Lending Income/Revenus sur prêt de titres (9)415 910.92
EXPENSES/DÉPENSES
1 817 071.67Management fees/Commission de gestion (3)54 443.47Distribution fees/Frais de distribution (3)
391.53Bank interest and other expenses/Intérêts bancaires débiteurs et autres frais444 229.85Fixed Rate of Operational Costs/Taux Fixe de Coûts Opérationnels (4)
9 635.68Formation/Reorganisation expenses/Frais de constitution/réorganisation (2)2 325 772.20
(1 909 861.28)NET INVESTMENT LOSS/PERTE NETTE SUR INVESTISSEMENTS
25 345 512.93Net realised gain on sale of investments/Gain net réalisé sur ventes d'investissements (2)(1 890.25)Net realised loss on foreign exchange/Perte nette réalisée sur opérations de change
(298 456.80)Net realised loss on forward foreign currency exchange contracts/Perte nette réalisée sur contrats de change à terme23 135 304.60NET REALISED GAIN/GAIN NET RÉALISÉ
(27 049 932.58)Change in net unrealised appreciation or depreciation on investments/Variation de la plus ou moins-value nette non réaliséesur investissements
(2)
(80 432.86)Change in net unrealised appreciation or depreciation on forward foreign currency exchange contracts/Variation de la plus oumoins-value nette non réalisée sur contrats de change à terme
(3 995 060.84)NET DECREASE IN NET ASSETS AS A RESULT OF OPERATIONS/DIMINUTION NETTE DE L'ACTIF NET RÉSULTANTDES OPÉRATIONS
(36 666 005.47)Net subscriptions/(redemptions) including equalisation/Souscriptions/(rachats) nets incluant la régularisation370 075 016.85NET ASSET VALUE AT THE END OF THE PERIOD/VALEUR NETTE D'INVENTAIRE À LA FIN DE LA PÉRIODE

The accompanying notes form an integral part of these financial statements.Les notes annexées font partie intégrante de ces états financiers.
34 PrivilEdge - Sands US Growth · 31/03/2019
540 584.5290 41 960.0410 (87 509.1260) 495 035.4440P - USD - Capitalisation167 412.8490 92 184.8370 (128 834.6560) 130 763.0300P - EUR - Hedged - Capitalisation
3 361 773.1730 451 105.6170 (760 381.4320) 3 052 497.3580M - USD - Capitalisation771 268.4770 80 085.9420 (60 796.7030) 790 557.7160M - USD - Distribution
1 422.2420 234 469.4720 (22 754.8090) 213 136.9050M - EUR - Hedged - Capitalisation11 252.7430 30 739.5900 (1 622.0070) 40 370.3260M - EUR - Hedged - Distribution
0.0000 17 600.0000 (1 900.0000) 15 700.0000M - GBP - Hedged - Distribution2 340 831.6970 301 600.0000 (688 189.5370) 1 954 242.1600N - USD - Capitalisation
502 596.3700 260.0000 (40 915.4840) 461 940.8860N - USD - Distribution79 161.0440 1 344.9000 (23 680.4290) 56 825.5150N - EUR - Capitalisation
1 860.0100 0.0000 0.0000 1 860.0100N - GBP - Capitalisation6 166 533.0460 72 663.4600 (836 954.9830) 5 402 241.5230N - GBP - Distribution
112 963.7300 23 684.0000 (60 255.8370) 76 391.8930N - GBP - Hedged - Distribution
Statement of changes in the number of shares outstanding for the period from 01/10/2018 to 31/03/2019 / Étatdes variations du nombre d'actions pour la période du 01/10/2018 au 31/03/2019
Number of Shares01/10/2018/
Nombre d'actions01/10/2018
Number of Sharesissued/
Nombre d'actionsémises
Number of Sharesredeemed/
Nombre d'actionsrachetées
Number of Shares31/03/2019/
Nombre d'actions31/03/2019
30/09/201831/03/2019For the period ended/Pour la période clôturée au
Statistics / Statistiques
30/09/2017
P - USD - Capitalisation
13 173 010.0826.6102
14 407 972.6926.6526
7 469 459.8520.2359
Net Asset Value/Valeur Nette d'InventaireNet Asset Value per share/Valeur Nette d'Inventaire par action
USD USD USD
P - EUR - Hedged - Capitalisation
2 685 831.1320.5397
3 506 204.4920.9435
919 939.8916.3198
Net Asset Value/Valeur Nette d'InventaireNet Asset Value per share/Valeur Nette d'Inventaire par action
EUR EUR EUR
M - USD - Capitalisation
84 734 073.9227.7589
93 112 165.5427.6973
34 217 381.4920.8824
Net Asset Value/Valeur Nette d'InventaireNet Asset Value per share/Valeur Nette d'Inventaire par action
USD USD USD
M - USD - Distribution
21 946 019.0627.7602
0.00
21 363 036.4827.6986
0.00
1 669 873.8820.8833
0.00
Net Asset Value/Valeur Nette d'InventaireNet Asset Value per share/Valeur Nette d'Inventaire par actionDividend per share paid to shareholders/Dividende par action payé aux actionnaires
USD USD USD

The accompanying notes form an integral part of these financial statements.Les notes annexées font partie intégrante de ces états financiers.
35PrivilEdge - Sands US Growth · 31/03/2019
30/09/201831/03/2019For the period ended/Pour la période clôturée au
Statistics / Statistiques
30/09/2017
M - EUR - Hedged - Capitalisation
4 522 407.6421.2183
30 653.7821.5531
0.000.0000
Net Asset Value/Valeur Nette d'InventaireNet Asset Value per share/Valeur Nette d'Inventaire par action
EUR EUR EUR
M - EUR - Hedged - Distribution
856 587.6521.2182
0.00
242 530.9621.5531
0.00
100 338.4616.7231
0.00
Net Asset Value/Valeur Nette d'InventaireNet Asset Value per share/Valeur Nette d'Inventaire par actionDividend per share paid to shareholders/Dividende par action payé aux actionnaires
EUR EUR EUR
M - GBP - Hedged - Distribution
242 374.7215.4379
0.00
0.000.0000
0.00
0.000.0000
0.00
Net Asset Value/Valeur Nette d'InventaireNet Asset Value per share/Valeur Nette d'Inventaire par actionDividend per share paid to shareholders/Dividende par action payé aux actionnaires
GBP GBP GBP
N - USD - Capitalisation
55 511 603.2328.4057
66 295 839.3428.3215
37 441 607.2721.2997
Net Asset Value/Valeur Nette d'InventaireNet Asset Value per share/Valeur Nette d'Inventaire par action
USD USD USD
N - USD - Distribution
13 121 857.3328.4059
0.00
14 234 392.9028.3217
0.00
10 387 653.8821.2998
0.00
Net Asset Value/Valeur Nette d'InventaireNet Asset Value per share/Valeur Nette d'Inventaire par actionDividend per share paid to shareholders/Dividende par action payé aux actionnaires
USD USD USD
N - EUR - Capitalisation
1 404 624.9024.7182
1 886 000.1323.8249
1 982 509.1217.6042
Net Asset Value/Valeur Nette d'InventaireNet Asset Value per share/Valeur Nette d'Inventaire par action
EUR EUR EUR
N - GBP - Capitalisation
44 664.6924.0131
44 496.7923.9229
50 190.6217.4880
Net Asset Value/Valeur Nette d'InventaireNet Asset Value per share/Valeur Nette d'Inventaire par action
GBP GBP GBP
N - GBP - Distribution
129 728 252.3124.0138
0.00
147 525 071.6923.9235
0.00
159 614 926.9317.4885
0.00
Net Asset Value/Valeur Nette d'InventaireNet Asset Value per share/Valeur Nette d'Inventaire par actionDividend per share paid to shareholders/Dividende par action payé aux actionnaires
GBP GBP GBP

The accompanying notes form an integral part of these financial statements.Les notes annexées font partie intégrante de ces états financiers.
36 PrivilEdge - Sands US Growth · 31/03/2019
30/09/201831/03/2019For the period ended/Pour la période clôturée au
Statistics / Statistiques
30/09/2017
N - GBP - Hedged - Distribution
1 179 889.5515.4452
0.00
1 760 825.9115.5875
0.00
1 128 496.9111.9258
0.00
Net Asset Value/Valeur Nette d'InventaireNet Asset Value per share/Valeur Nette d'Inventaire par actionDividend per share paid to shareholders/Dividende par action payé aux actionnaires
GBP GBP GBP

The accompanying notes form an integral part of these financial statements.Les notes annexées font partie intégrante de ces états financiers.
37PrivilEdge - Sands US Growth · 31/03/2019
Investments in securities at market value/Portefeuille-titres à la valeur de marché 353 670 318.59 95.57
ALIBABA GR ADR127 700 23 298 865.00 6.30USD
Transferable securities admitted to an official stock exchange listing and/or dealt in on anotherregulated market/Valeurs mobilières admises à la cote officielle d'une bourse de valeurs et/ounégociées sur un autre marché réglementé
353 670 318.59 95.57
EQUITIES/ACTIONS 353 670 318.59 95.57
CAYMAN ISLANDS/ILES CAÏMANS 23 298 865.00 6.30
ATLASSIAN -A-38 300 4 304 537.00 1.16USD
UNITED KINGDOM/ROYAUME-UNI 4 304 537.00 1.16
ABIOMED INC13 400 3 826 906.00 1.03USD
UNITED STATES/ÉTATS-UNIS 326 066 916.59 88.11
ACTIVISION BLIZZARD133 900 6 096 467.00 1.65USDADOBE INC60 550 16 135 969.50 4.36USDALIGN TECHNOLOGY INC31 950 9 084 343.50 2.45USDALPHABET INC14 100 16 594 149.00 4.48USDAMAZON.COM INC16 700 29 738 525.00 8.05USDBIOMARIN PHARMACEUTICAL INC68 000 6 040 440.00 1.63USDCOSTAR GROUP INC29 304 13 667 971.68 3.69USDEDWARDS LIFESCIENCES CORP78 300 14 981 139.00 4.05USDFACEBOOK -A-75 777 12 631 268.13 3.41USDFLOOR & DECOR HOLDING INC164 200 6 768 324.00 1.83USDILLUMINA INC39 100 12 147 979.00 3.28USDINTUIT44 800 11 711 168.00 3.16USDMATCH GROUP191 200 10 823 832.00 2.92USDMONSTER BEVERAGE CORP206 480 11 269 678.40 3.05USDNETFLIX INC66 000 23 532 960.00 6.36USDPALO ALTO NET37 900 9 205 152.00 2.49USDREGENERON PHARMACEUTICALS INC19 500 8 007 090.00 2.16USDSALESFORCE COM.INC107 700 17 056 449.00 4.61USDSAREPTA THERAPEUTICS37 502 4 469 863.38 1.21USDSERVICENOW INC117 800 29 036 522.00 7.86USDSPLUNK71 300 8 883 980.00 2.40USDTWILIO INC40 200 5 193 036.00 1.40USDVISA INC -A-181 600 28 364 104.00 7.66USDWORKDAY -A-56 000 10 799 600.00 2.92USD
Schedule of investments as at 31/03/2019 / Inventaire du portefeuille au 31/03/2019
USD
Market ValueNumber of Shares orNominal Value
Investment % of Net AssetsQuotationCurrency
Valeur de marchéNombre d'actions ouvaleur nominale
Investissement % de l'actif netDevise decotation
Forward Foreign Currency Exchange Contracts/Contrats de change à terme (0.03)(112 124.63)EUR 10 012 246.76 (0.02)USD (86 879.72)8 829 721.45 15/04/2019Caceis BankGBP 1 984 804.60 (0.01)USD (30 655.09)1 498 664.94 15/04/2019Caceis BankUSD 87 068.44 0.00GBP 1 198.40114 730.02 15/04/2019Caceis BankUSD 823 276.47 0.00EUR 4 211.78929 649.37 15/04/2019Caceis Bank
USD
Unrealised appreciation/(depreciation)
Currency % of NetAssets
Amount bought Maturity Currency Amount soldCounterparty
Plus/(Moins) value non-réalisée
Devise % de l'actifnet
Montant acheté Maturité Devise Montant venduContrepartie

38

PrivilEdgeis an investment company
with variable capital ("SICAV")incorporated in Luxembourg
PrivilEdgeest une société d’investissement
à capital variable ("SICAV")enregistrée au Luxembourg RCS Luxembourg B0181207
PrivilEdge –Delaware US Large Cap Value
Unaudited semi-annual report · Rapport semestriel non révisé
31.03.2019

The accompanying notes form an integral part of these financial statements.Les notes annexées font partie intégrante de ces états financiers.
40 PrivilEdge - Delaware US Large Cap Value · 31/03/2019
ASSETS/ACTIF
529 868 076.42Investments in securities at market value/Portefeuille-titres à la valeur de marché (2):( USD )480 190 761.85Acquisition cost/Coût d'acquisition
5 522 208.94Cash and term deposits/Liquidité et dépôts à terme224 733.61Amounts receivable on subscriptions/Montants à recevoir sur souscriptions d'actions646 215.04Interest and dividends receivable, net/Intérêt et dividendes nets à recevoir
34.68Receivable on foreign exchange transactions, net/A recevoir sur opérations de change, net536 261 268.69
LIABILITIES/PASSIF
221 148.00Amounts payable on redemptions/Montants à payer sur rachats d'actions302 262.39Management and distribution fees payable/Commission de gestion et de distribution à payer (3)
91 455.14Taxes and expenses payable/Impôts et autres frais à payer138 622.83Unrealised depreciation on forward foreign currency exchange contracts/Moins-value non réalisée sur contrats de change à
terme(2)
753 488.36535 507 780.33NET ASSET VALUE/VALEUR NETTE D'INVENTAIRE
Statement of net assets as at 31/03/2019 / État de l'actif net au 31/03/2019
NotesNotes USD

The accompanying notes form an integral part of these financial statements.Les notes annexées font partie intégrante de ces états financiers.
41PrivilEdge - Delaware US Large Cap Value · 31/03/2019
Statement of operations and changes in net assets for the period from 01/10/2018 to 31/03/2019 / État desopérations et des variations de l'actif net pour la période du 01/10/2018 au 31/03/2019
NotesNotes USD
515 019 544.36NET ASSET VALUE AT THE BEGINNING OF THE PERIOD/VALEUR NETTE D'INVENTAIRE AU DÉBUT DE LAPÉRIODE
INCOME/REVENUS
12 711 088.20Dividends, net/Dividendes, nets (2)130 735.67Bank interest/Intérêts bancaires
12 841 823.87EXPENSES/DÉPENSES
1 781 407.51Management fees/Commission de gestion (3)33 058.34Distribution fees/Frais de distribution (3)
295.38Bank interest and other expenses/Intérêts bancaires débiteurs et autres frais582 573.57Fixed Rate of Operational Costs/Taux Fixe de Coûts Opérationnels (4)
2 397 334.8010 444 489.07NET INVESTMENT INCOME/REVENU NET SUR INVESTISSEMENTS
12 367 120.24Net realised gain on sale of investments/Gain net réalisé sur ventes d'investissements (2)17 911.59Net realised gain on foreign exchange/Gain net réalisé sur opérations de change
(524 423.07)Net realised loss on forward foreign currency exchange contracts/Perte nette réalisée sur contrats de change à terme22 305 097.83NET REALISED GAIN/GAIN NET RÉALISÉ
(35 514 910.95)Change in net unrealised appreciation or depreciation on investments/Variation de la plus ou moins-value nette non réaliséesur investissements
(2)
(81 367.62)Change in net unrealised appreciation or depreciation on forward foreign currency exchange contracts/Variation de la plus oumoins-value nette non réalisée sur contrats de change à terme
(13 291 180.74)NET DECREASE IN NET ASSETS AS A RESULT OF OPERATIONS/DIMINUTION NETTE DE L'ACTIF NET RÉSULTANTDES OPÉRATIONS
(143 810.62)Dividend paid/Dividende payé33 923 227.33Net subscriptions/(redemptions) including equalisation/Souscriptions/(rachats) nets incluant la régularisation
535 507 780.33NET ASSET VALUE AT THE END OF THE PERIOD/VALEUR NETTE D'INVENTAIRE À LA FIN DE LA PÉRIODE

The accompanying notes form an integral part of these financial statements.Les notes annexées font partie intégrante de ces états financiers.
42 PrivilEdge - Delaware US Large Cap Value · 31/03/2019
735 418.6600 142 589.4200 (137 992.7700) 740 015.3100P - USD - Capitalisation21 666.9440 83 156.0890 (58 440.0000) 46 383.0330P - EUR - Hedged - Capitalisation
554 799.5940 1 452 873.7750 (4 490.2850) 2 003 183.0840I - USD - Capitalisation14 841 762.2030 2 991 845.5690 (2 693 985.6840) 15 139 622.0880M - USD - Capitalisation
835 963.2220 305 388.3340 (247 513.2850) 893 838.2710M - USD - Distribution354 281.8510 616 641.1820 (279 274.7100) 691 648.3230M - EUR - Hedged - Capitalisation371 262.2510 21 186.3020 (10 167.3710) 382 281.1820M - EUR - Hedged - Distribution728 749.2810 37 051.9420 (102 108.0400) 663 693.1830M - GBP - Distribution
5 699 176.7140 889 224.2210 (1 212 071.2840) 5 376 329.6510N - USD - Capitalisation6 284.0000 0.0000 0.0000 6 284.0000N - GBP - Distribution
8 576 880.5670 1 343 861.7220 (1 069 331.1570) 8 851 411.1320U - USD - Capitalisation3 425 037.7850 842 851.4670 (291 234.2830) 3 976 654.9690U - EUR - Capitalisation
Statement of changes in the number of shares outstanding for the period from 01/10/2018 to 31/03/2019 / Étatdes variations du nombre d'actions pour la période du 01/10/2018 au 31/03/2019
Number of Shares01/10/2018/
Nombre d'actions01/10/2018
Number of Sharesissued/
Nombre d'actionsémises
Number of Sharesredeemed/
Nombre d'actionsrachetées
Number of Shares31/03/2019/
Nombre d'actions31/03/2019
30/09/201831/03/2019For the period ended/Pour la période clôturée au
Statistics / Statistiques
30/09/2017
P - USD - Capitalisation
10 022 028.2513.5430
10 265 170.7013.9583
13 294 860.6712.2748
Net Asset Value/Valeur Nette d'InventaireNet Asset Value per share/Valeur Nette d'Inventaire par action
USD USD USD
P - EUR - Hedged - Capitalisation
506 675.5210.9237
247 922.1411.4424
139 997.4910.3491
Net Asset Value/Valeur Nette d'InventaireNet Asset Value per share/Valeur Nette d'Inventaire par action
EUR EUR EUR
I - USD - Capitalisation
28 159 062.0914.0572
7 996 183.3314.4127
7 034 018.1512.5420
Net Asset Value/Valeur Nette d'InventaireNet Asset Value per share/Valeur Nette d'Inventaire par action
USD USD USD
M - USD - Capitalisation
209 840 467.1813.8604
211 265 697.5814.2345
185 265 225.9112.4366
Net Asset Value/Valeur Nette d'InventaireNet Asset Value per share/Valeur Nette d'Inventaire par action
USD USD USD
M - USD - Distribution
12 101 453.8213.5388
0.06
11 675 885.2513.9670
0.05
10 173 121.7412.2513
0.05
Net Asset Value/Valeur Nette d'InventaireNet Asset Value per share/Valeur Nette d'Inventaire par actionDividend per share paid to shareholders/Dividende par action payé aux actionnaires
USD USD USD

The accompanying notes form an integral part of these financial statements.Les notes annexées font partie intégrante de ces états financiers.
43PrivilEdge - Delaware US Large Cap Value · 31/03/2019
30/09/201831/03/2019For the period ended/Pour la période clôturée au
Statistics / Statistiques
30/09/2017
M - EUR - Hedged - Capitalisation
7 640 105.9411.0462
4 084 715.1511.5296
7 825 859.7910.3602
Net Asset Value/Valeur Nette d'InventaireNet Asset Value per share/Valeur Nette d'Inventaire par action
EUR EUR EUR
M - EUR - Hedged - Distribution
4 203 535.2610.9959
0.05
4 280 500.0311.5296
0.00
0.000.0000
0.00
Net Asset Value/Valeur Nette d'InventaireNet Asset Value per share/Valeur Nette d'Inventaire par actionDividend per share paid to shareholders/Dividende par action payé aux actionnaires
EUR EUR EUR
M - GBP - Distribution
11 689 587.3317.6129
0.08
13 231 018.4818.1558
0.07
8 443 894.1815.4871
0.06
Net Asset Value/Valeur Nette d'InventaireNet Asset Value per share/Valeur Nette d'Inventaire par actionDividend per share paid to shareholders/Dividende par action payé aux actionnaires
GBP GBP GBP
N - USD - Capitalisation
75 356 317.4714.0163
81 976 746.2114.3840
58 947 464.2012.5358
Net Asset Value/Valeur Nette d'InventaireNet Asset Value per share/Valeur Nette d'Inventaire par action
USD USD USD
N - GBP - Distribution
110 993.1817.6628
0.12
114 584.5118.2343
0.11
97 744.2215.5545
0.05
Net Asset Value/Valeur Nette d'InventaireNet Asset Value per share/Valeur Nette d'Inventaire par actionDividend per share paid to shareholders/Dividende par action payé aux actionnaires
GBP GBP GBP
U - USD - Capitalisation
124 872 343.3514.1076
123 930 637.2614.4494
127 431 218.0712.5475
Net Asset Value/Valeur Nette d'InventaireNet Asset Value per share/Valeur Nette d'Inventaire par action
USD USD USD
U - EUR - Capitalisation
40 888 495.1710.2821
34 869 577.4510.1808
0.000.0000
Net Asset Value/Valeur Nette d'InventaireNet Asset Value per share/Valeur Nette d'Inventaire par action
EUR EUR EUR

The accompanying notes form an integral part of these financial statements.Les notes annexées font partie intégrante de ces états financiers.
44 PrivilEdge - Delaware US Large Cap Value · 31/03/2019
Investments in securities at market value/Portefeuille-titres à la valeur de marché 529 868 076.42 98.95
ABBOTT LABORATORIES LTD222 700 17 802 638.00 3.32USD
Transferable securities admitted to an official stock exchange listing and/or dealt in on anotherregulated market/Valeurs mobilières admises à la cote officielle d'une bourse de valeurs et/ounégociées sur un autre marché réglementé
529 868 076.42 98.95
EQUITIES/ACTIONS 529 868 076.42 98.95
UNITED STATES/ÉTATS-UNIS 529 868 076.42 98.95
ALLSTATE CORP179 887 16 941 757.66 3.16USDAMERICAN INTERNATIONAL GROUP INC386 000 16 621 160.00 3.10USDARCHER-DANIELS MIDLAND CO380 840 16 425 629.20 3.07USDAT&T527 118 16 530 420.48 3.09USDBANK OF NEW YORK MELLON CORP319 300 16 102 299.00 3.01USDBB AND T CORP334 945 15 584 990.85 2.91USDBROADCOM - REGISTERED SHS57 600 17 320 896.00 3.23USDCARDINAL HEALTH INC311 650 15 005 947.50 2.80USDCIGNA --- REGISTERED SHS93 550 15 044 711.00 2.81USDCISCO SYSTEMS INC333 402 18 000 373.98 3.36USDCONOCOPHILLIPS CO246 200 16 431 388.00 3.07USDCVS HEALTH285 782 15 412 223.26 2.88USDDOLLAR TREE INC160 900 16 900 936.00 3.16USDDOWDUPONT280 315 14 943 592.65 2.79USDEDISON INTERNATIONAL276 900 17 145 648.00 3.20USDEQTY RESIDENTIAL PPTYS TR SHS BEN.INT.230 335 17 348 832.20 3.24USDHALLIBURTON521 300 15 274 090.00 2.85USDINTEL CORP326 500 17 533 050.00 3.27USDJOHNSON AND JOHNSON114 775 16 044 397.25 3.00USDLOWE'S COMPANIES INC166 847 18 264 741.09 3.42USDMARATHON OIL CORP969 800 16 205 358.00 3.03USDMARSH MC-LENNAN COS. INC.183 660 17 245 674.00 3.22USDMERCK AND CO196 243 16 321 530.31 3.05USDMONDELEZ INTERNATIONAL INC345 692 17 256 944.64 3.22USDOCCIDENTAL PETROLEUM CORP234 500 15 523 900.00 2.90USDORACLE CORP326 700 17 547 057.00 3.28USDPFIZER INC378 748 16 085 427.56 3.00USDQUEST DIAGNOSTICS171 352 15 407 971.84 2.88USDRAYTHEON CO94 147 17 142 285.76 3.20USDVERIZON COMMUNICATIONS INC284 527 16 824 081.51 3.14USDWASTE MANAGEMENT INC169 648 17 628 123.68 3.29USD
Schedule of investments as at 31/03/2019 / Inventaire du portefeuille au 31/03/2019
USD
Market ValueNumber of Shares orNominal Value
Investment % of Net AssetsQuotationCurrency
Valeur de marchéNombre d'actions ouvaleur nominale
Investissement % de l'actif netDevise decotation
Forward Foreign Currency Exchange Contracts/Contrats de change à terme (0.03)(138 622.83)USD 2 261 664.01 0.00EUR 5 782.662 548 092.25 15/04/2019Caceis BankEUR 16 540 762.86 (0.03)USD (144 405.49)14 586 389.38 15/04/2019Caceis Bank
USD
Unrealised appreciation/(depreciation)
Currency % of NetAssets
Amount bought Maturity Currency Amount soldCounterparty
Plus/(Moins) value non-réalisée
Devise % de l'actifnet
Montant acheté Maturité Devise Montant venduContrepartie

PrivilEdgeis an investment company
with variable capital ("SICAV")incorporated in Luxembourg
PrivilEdgeest une société d’investissement
à capital variable ("SICAV")enregistrée au Luxembourg RCS Luxembourg B0181207
PrivilEdge –WellsCap US Selective Equity
Unaudited semi-annual report · Rapport semestriel non révisé
31.03.2019

The accompanying notes form an integral part of these financial statements.Les notes annexées font partie intégrante de ces états financiers.
46 PrivilEdge - WellsCap US Selective Equity · 31/03/2019
ASSETS/ACTIF
54 986 818.24Investments in securities at market value/Portefeuille-titres à la valeur de marché (2):( USD )53 426 769.13Acquisition cost/Coût d'acquisition
1 553 216.26Cash and term deposits/Liquidité et dépôts à terme331 512.71Receivable on investments sold/À recevoir sur vente de titres
27 632.25Interest and dividends receivable, net/Intérêt et dividendes nets à recevoir56 899 179.46
LIABILITIES/PASSIF
455 419.64Payable on investments purchased/À payer sur achat de titres53 655.96Management and distribution fees payable/Commission de gestion et de distribution à payer (3)11 567.23Taxes and expenses payable/Impôts et autres frais à payer
8 451.56Unrealised depreciation on forward foreign currency exchange contracts/Moins-value non réalisée sur contrats de change àterme
(2)
529 094.3956 370 085.07NET ASSET VALUE/VALEUR NETTE D'INVENTAIRE
Statement of net assets as at 31/03/2019 / État de l'actif net au 31/03/2019
NotesNotes USD

The accompanying notes form an integral part of these financial statements.Les notes annexées font partie intégrante de ces états financiers.
47PrivilEdge - WellsCap US Selective Equity · 31/03/2019
Statement of operations and changes in net assets for the period from 01/10/2018 to 31/03/2019 / État desopérations et des variations de l'actif net pour la période du 01/10/2018 au 31/03/2019
NotesNotes USD
93 927 813.09NET ASSET VALUE AT THE BEGINNING OF THE PERIOD/VALEUR NETTE D'INVENTAIRE AU DÉBUT DE LAPÉRIODE
INCOME/REVENUS
335 204.75Dividends, net/Dividendes, nets (2)17 415.79Bank interest/Intérêts bancaires
352 620.54EXPENSES/DÉPENSES
401 080.85Management fees/Commission de gestion (3)10 602.35Distribution fees/Frais de distribution (3)
163.11Bank interest and other expenses/Intérêts bancaires débiteurs et autres frais89 218.03Fixed Rate of Operational Costs/Taux Fixe de Coûts Opérationnels (4)
501 064.34(148 443.80)NET INVESTMENT LOSS/PERTE NETTE SUR INVESTISSEMENTS
(2 904 545.31)Net realised loss on sale of investments/Perte nette réalisée sur ventes d'investissements (2)3 730.61Net realised gain on foreign exchange/Gain net réalisé sur opérations de change
(20 886.92)Net realised loss on forward foreign currency exchange contracts/Perte nette réalisée sur contrats de change à terme(3 070 145.42)NET REALISED LOSS/PERTE NETTE RÉALISÉE
(6 638 190.33)Change in net unrealised appreciation or depreciation on investments/Variation de la plus ou moins-value nette non réaliséesur investissements
(2)
(7 298.18)Change in net unrealised appreciation or depreciation on forward foreign currency exchange contracts/Variation de la plus oumoins-value nette non réalisée sur contrats de change à terme
(9 715 633.93)NET DECREASE IN NET ASSETS AS A RESULT OF OPERATIONS/DIMINUTION NETTE DE L'ACTIF NET RÉSULTANTDES OPÉRATIONS
(27 842 094.09)Net subscriptions/(redemptions) including equalisation/Souscriptions/(rachats) nets incluant la régularisation56 370 085.07NET ASSET VALUE AT THE END OF THE PERIOD/VALEUR NETTE D'INVENTAIRE À LA FIN DE LA PÉRIODE

The accompanying notes form an integral part of these financial statements.Les notes annexées font partie intégrante de ces états financiers.
48 PrivilEdge - WellsCap US Selective Equity · 31/03/2019
253 250.7250 0.0000 (27 671.0000) 225 579.7250P - USD - Capitalisation650 000.0000 0.0000 (250 000.0000) 400 000.0000I - USD - Capitalisation
1 912 801.1870 40 933.0650 (825 643.4720) 1 128 090.7800M - USD - Capitalisation235 470.8900 5 386.9340 (71 000.0000) 169 857.8240M - USD - Distribution
12 834.7130 88 550.1500 (42 369.7560) 59 015.1070M - EUR - Hedged - Capitalisation1 698 397.9070 4 080.0000 (299 579.4230) 1 402 898.4840N - USD - Capitalisation2 099 361.0000 0.0000 (942 563.0000) 1 156 798.0000N - USD - Distribution
Statement of changes in the number of shares outstanding for the period from 01/10/2018 to 31/03/2019 / Étatdes variations du nombre d'actions pour la période du 01/10/2018 au 31/03/2019
Number of Shares01/10/2018/
Nombre d'actions01/10/2018
Number of Sharesissued/
Nombre d'actionsémises
Number of Sharesredeemed/
Nombre d'actionsrachetées
Number of Shares31/03/2019/
Nombre d'actions31/03/2019
30/09/201831/03/2019For the period ended/Pour la période clôturée au
Statistics / Statistiques
30/09/2017
P - USD - Capitalisation
2 700 215.6511.9701
3 358 600.6313.2620
2 178 809.0311.0413
Net Asset Value/Valeur Nette d'InventaireNet Asset Value per share/Valeur Nette d'Inventaire par action
USD USD USD
I - USD - Capitalisation
4 994 621.8412.4866
8 943 132.7013.7587
7 364 156.8711.3295
Net Asset Value/Valeur Nette d'InventaireNet Asset Value per share/Valeur Nette d'Inventaire par action
USD USD USD
M - USD - Capitalisation
13 914 443.0312.3345
26 033 801.0913.6103
28 319 155.0411.2466
Net Asset Value/Valeur Nette d'InventaireNet Asset Value per share/Valeur Nette d'Inventaire par action
USD USD USD
M - USD - Distribution
2 095 126.4812.3346
0.00
3 204 851.2413.6104
0.00
6 617 294.3111.2467
0.00
Net Asset Value/Valeur Nette d'InventaireNet Asset Value per share/Valeur Nette d'Inventaire par actionDividend per share paid to shareholders/Dividende par action payé aux actionnaires
USD USD USD
M - EUR - Hedged - Capitalisation
676 507.6211.4633
165 178.4212.8697
2 189 565.6510.9397
Net Asset Value/Valeur Nette d'InventaireNet Asset Value per share/Valeur Nette d'Inventaire par action
EUR EUR EUR

The accompanying notes form an integral part of these financial statements.Les notes annexées font partie intégrante de ces états financiers.
49PrivilEdge - WellsCap US Selective Equity · 31/03/2019
30/09/201831/03/2019For the period ended/Pour la période clôturée au
Statistics / Statistiques
30/09/2017
N - USD - Capitalisation
17 486 804.1212.4648
23 342 376.9413.7438
15 740 364.9611.3285
Net Asset Value/Valeur Nette d'InventaireNet Asset Value per share/Valeur Nette d'Inventaire par action
USD USD USD
N - USD - Distribution
14 419 257.3712.4648
0.00
28 853 195.7613.7438
0.00
15 578 654.4811.3286
0.00
Net Asset Value/Valeur Nette d'InventaireNet Asset Value per share/Valeur Nette d'Inventaire par actionDividend per share paid to shareholders/Dividende par action payé aux actionnaires
USD USD USD

The accompanying notes form an integral part of these financial statements.Les notes annexées font partie intégrante de ces états financiers.
50 PrivilEdge - WellsCap US Selective Equity · 31/03/2019
Investments in securities at market value/Portefeuille-titres à la valeur de marché 54 986 818.24 97.55
BANK OF NT BUTTERFIELD47 510 1 704 658.80 3.02USD
Transferable securities admitted to an official stock exchange listing and/or dealt in on anotherregulated market/Valeurs mobilières admises à la cote officielle d'une bourse de valeurs et/ounégociées sur un autre marché réglementé
54 986 818.24 97.55
EQUITIES/ACTIONS 54 986 818.24 97.55
BERMUDA/BERMUDES 3 465 838.74 6.15
MARVELL TECHNOLOGY GROUP LTD88 546 1 761 179.94 3.13USD
AGNICO EAGLE MINES LTD39 342 1 711 377.00 3.04USD
CANADA/CANADA 3 498 180.15 6.21
MDC PARTNERS SUBORD.VTG -A-196 263 441 591.75 0.78USDNORBORD48 828 1 345 211.40 2.39USD
ROYAL CARIBBEAN CRUISES16 961 1 944 069.82 3.45USD
LIBERIA/LIBERIA 1 944 069.82 3.45
MYLAN NV.55 864 1 583 185.76 2.81USD
THE NETHERLANDS/PAYS-BAS 1 583 185.76 2.81
SENSATA TECH(S) -REGISTERED SHS29 710 1 337 544.20 2.37USD
UNITED KINGDOM/ROYAUME-UNI 1 337 544.20 2.37
ALEXION PHARMACEUTICALS15 678 2 119 352.04 3.75USD
UNITED STATES/ÉTATS-UNIS 43 157 999.57 76.56
ALLIANCE BERNSTEIN HOLDING LP51 738 1 494 710.82 2.65USDARROW ELECTRONICS INC24 207 1 865 391.42 3.31USDAVIS BUDGET GROUP55 520 1 935 427.20 3.43USDAXON ENTERPRISE - REGISTERED29 468 1 603 353.88 2.84USDBIG LOTS INC37 562 1 428 107.24 2.53USDBLACKSTONE GROUP PARTNERSHIP UNITS43 364 1 516 439.08 2.69USDBROOKS-PRI AUTOMATION6 691 196 247.03 0.35USDCBS -B-34 486 1 639 119.58 2.91USDCOMMVAULT SYSTEMS24 507 1 586 583.18 2.81USDCONAGRA BRANDS INC48 508 1 345 611.92 2.39USDCONCHO RES16 537 1 834 945.52 3.26USDFLIR SYSTEMS INC26 093 1 241 504.94 2.20USDGARDNER DENVER HLDGS - REGISTERED68 242 1 897 810.02 3.37USDGLOBAL EAGLE ENTERTAINMENT INC126 132 89 478.04 0.16USDGROUPON INC412 849 1 465 613.95 2.60USDHNI CORP19 194 696 550.26 1.24USDINTEGER HOLDINGS CORP17 920 1 351 526.40 2.40USDNCR CORP67 562 1 843 766.98 3.27USDNOBLE ENERGY INC73 374 1 814 539.02 3.22USDNUANCE COMMUNICATIONS INC79 357 1 343 514.01 2.38USDPARSLEY ENERGY INC -A-88 789 1 713 627.70 3.04USDPINNACLE FINANCIAL PARTNERS INC30 042 1 643 297.40 2.92USDQURATE RTL GRP -REGISTERED SHS98 402 1 572 463.96 2.79USDRED HAT7 884 1 440 406.80 2.56USDSHUTTERFLY INC28 501 1 158 280.64 2.05USDSTEELCASE -A-51 758 753 078.90 1.34USDSTERLING BANCORP78 792 1 467 894.96 2.60USDURBAN OUTFITTERS INC41 287 1 223 746.68 2.17USDZENDESK INC22 066 1 875 610.00 3.33USD
Schedule of investments as at 31/03/2019 / Inventaire du portefeuille au 31/03/2019
USD
Market ValueNumber of Shares orNominal Value
Investment % of Net AssetsQuotationCurrency
Valeur de marchéNombre d'actions ouvaleur nominale
Investissement % de l'actif netDevise decotation

The accompanying notes form an integral part of these financial statements.Les notes annexées font partie intégrante de ces états financiers.
51PrivilEdge - WellsCap US Selective Equity · 31/03/2019
Schedule of investments as at 31/03/2019 / Inventaire du portefeuille au 31/03/2019
Forward Foreign Currency Exchange Contracts/Contrats de change à terme (0.01)(8 451.56)EUR 1 074 326.33 (0.01)USD (9 292.44)947 466.49 15/04/2019Caceis BankUSD 275 940.75 0.00EUR 840.88311 022.73 15/04/2019Caceis Bank
USD
Unrealised appreciation/(depreciation)
Currency % of NetAssets
Amount bought Maturity Currency Amount soldCounterparty
Plus/(Moins) value non-réalisée
Devise % de l'actifnet
Montant acheté Maturité Devise Montant venduContrepartie

52

PrivilEdgeis an investment company
with variable capital ("SICAV")incorporated in Luxembourg
PrivilEdgeest une société d’investissement
à capital variable ("SICAV")enregistrée au Luxembourg RCS Luxembourg B0181207
PrivilEdge –Income Partners RMB Debt
Unaudited semi-annual report · Rapport semestriel non révisé
31.03.2019

The accompanying notes form an integral part of these financial statements.Les notes annexées font partie intégrante de ces états financiers.
54 PrivilEdge - Income Partners RMB Debt · 31/03/2019
ASSETS/ACTIF
34 175 009.90Investments in securities at market value/Portefeuille-titres à la valeur de marché (2):( USD )34 005 090.26Acquisition cost/Coût d'acquisition
252 483.38Cash and term deposits/Liquidité et dépôts à terme467 591.05Interest and dividends receivable, net/Intérêt et dividendes nets à recevoir
34 895 084.33LIABILITIES/PASSIF
19 994.95Management and distribution fees payable/Commission de gestion et de distribution à payer (3)7 093.44Taxes and expenses payable/Impôts et autres frais à payer
27 025.12Unrealised depreciation on forward foreign currency exchange contracts/Moins-value non réalisée sur contrats de change àterme
(2)
54 113.5134 840 970.82NET ASSET VALUE/VALEUR NETTE D'INVENTAIRE
Statement of net assets as at 31/03/2019 / État de l'actif net au 31/03/2019
NotesNotes USD

The accompanying notes form an integral part of these financial statements.Les notes annexées font partie intégrante de ces états financiers.
55PrivilEdge - Income Partners RMB Debt · 31/03/2019
Statement of operations and changes in net assets for the period from 01/10/2018 to 31/03/2019 / État desopérations et des variations de l'actif net pour la période du 01/10/2018 au 31/03/2019
NotesNotes USD
34 244 021.09NET ASSET VALUE AT THE BEGINNING OF THE PERIOD/VALEUR NETTE D'INVENTAIRE AU DÉBUT DE LAPÉRIODE
INCOME/REVENUS
783 853.37Interest on bonds, net/Intérêts sur obligations, nets (2)8 350.60Bank interest/Intérêts bancaires
46.32Securities Lending Income/Revenus sur prêt de titres (9)792 250.29
EXPENSES/DÉPENSES
119 655.81Management fees/Commission de gestion (3)1 571.96Distribution fees/Frais de distribution (3)
691.69Bank interest and other expenses/Intérêts bancaires débiteurs et autres frais43 577.36Fixed Rate of Operational Costs/Taux Fixe de Coûts Opérationnels (4)
165 496.82626 753.47NET INVESTMENT INCOME/REVENU NET SUR INVESTISSEMENTS
(137 825.77)Net realised loss on sale of investments/Perte nette réalisée sur ventes d'investissements (2)(214 116.85)Net realised loss on foreign exchange/Perte nette réalisée sur opérations de change
119 147.13Net realised gain on forward foreign currency exchange contracts/Gain net réalisé sur contrats de change à terme393 957.98NET REALISED GAIN/GAIN NET RÉALISÉ
1 645 113.05Change in net unrealised appreciation or depreciation on investments/Variation de la plus ou moins-value nette non réaliséesur investissements
(2)
14 310.91Change in net unrealised appreciation or depreciation on forward foreign currency exchange contracts/Variation de la plus oumoins-value nette non réalisée sur contrats de change à terme
2 053 381.94NET INCREASE IN NET ASSETS AS A RESULT OF OPERATIONS/AUGMENTATION NETTE DE L'ACTIF NETRÉSULTANT DES OPÉRATIONS
(1 456 432.21)Net subscriptions/(redemptions) including equalisation/Souscriptions/(rachats) nets incluant la régularisation34 840 970.82NET ASSET VALUE AT THE END OF THE PERIOD/VALEUR NETTE D'INVENTAIRE À LA FIN DE LA PÉRIODE

The accompanying notes form an integral part of these financial statements.Les notes annexées font partie intégrante de ces états financiers.
56 PrivilEdge - Income Partners RMB Debt · 31/03/2019
58 154.0860 10 150.0000 (8 703.8020) 59 600.2840P - USD - Capitalisation7 000.0000 0.0000 0.0000 7 000.0000P - CHF - Hedged - Capitalisation
85 640.1300 0.0000 0.0000 85 640.1300M - USD - Capitalisation36 800.0000 0.0000 (25 000.0000) 11 800.0000M - CHF - Hedged - Capitalisation28 330.9050 0.0000 0.0000 28 330.9050M - EUR - Hedged - Capitalisation22 145.5470 0.0000 0.0000 22 145.5470M - CNH - Capitalisation98 220.4250 0.0000 0.0000 98 220.4250N - USD - Capitalisation
1 866 754.1130 0.0000 (74 577.0000) 1 792 177.1130N - CNH - Capitalisation
Statement of changes in the number of shares outstanding for the period from 01/10/2018 to 31/03/2019 / Étatdes variations du nombre d'actions pour la période du 01/10/2018 au 31/03/2019
Number of Shares01/10/2018/
Nombre d'actions01/10/2018
Number of Sharesissued/
Nombre d'actionsémises
Number of Sharesredeemed/
Nombre d'actionsrachetées
Number of Shares31/03/2019/
Nombre d'actions31/03/2019
30/09/201831/03/2019For the period ended/Pour la période clôturée au
Statistics / Statistiques
30/09/2017
P - USD - Capitalisation
629 415.5510.5606
579 780.239.9697
544 145.9210.1804
Net Asset Value/Valeur Nette d'InventaireNet Asset Value per share/Valeur Nette d'Inventaire par action
USD USD USD
P - CHF - Hedged - Capitalisation
66 534.429.5049
63 956.149.1366
67 422.639.6318
Net Asset Value/Valeur Nette d'InventaireNet Asset Value per share/Valeur Nette d'Inventaire par action
CHF CHF CHF
M - USD - Capitalisation
920 354.1010.7468
866 343.4510.1161
220 836.4310.2835
Net Asset Value/Valeur Nette d'InventaireNet Asset Value per share/Valeur Nette d'Inventaire par action
USD USD USD
M - CHF - Hedged - Capitalisation
114 246.869.6819
341 495.659.2798
358 371.099.7383
Net Asset Value/Valeur Nette d'InventaireNet Asset Value per share/Valeur Nette d'Inventaire par action
CHF CHF CHF
M - EUR - Hedged - Capitalisation
280 573.589.9034
268 415.759.4743
841 088.779.9092
Net Asset Value/Valeur Nette d'InventaireNet Asset Value per share/Valeur Nette d'Inventaire par action
EUR EUR EUR

The accompanying notes form an integral part of these financial statements.Les notes annexées font partie intégrante de ces états financiers.
57PrivilEdge - Income Partners RMB Debt · 31/03/2019
30/09/201831/03/2019For the period ended/Pour la période clôturée au
Statistics / Statistiques
30/09/2017
M - CNH - Capitalisation
2 568 166.68115.9676
2 473 120.10111.6757
1 245 698.77109.7532
Net Asset Value/Valeur Nette d'InventaireNet Asset Value per share/Valeur Nette d'Inventaire par action
CNH CNH CNH
N - USD - Capitalisation
1 080 058.3410.9963
1 015 831.4510.3424
1 029 547.6810.4820
Net Asset Value/Valeur Nette d'InventaireNet Asset Value per share/Valeur Nette d'Inventaire par action
USD USD USD
N - CNH - Capitalisation
210 574 910.13117.4967
211 044 539.52113.0543
208 012 986.72110.7751
Net Asset Value/Valeur Nette d'InventaireNet Asset Value per share/Valeur Nette d'Inventaire par action
CNH CNH CNH

The accompanying notes form an integral part of these financial statements.Les notes annexées font partie intégrante de ces états financiers.
58 PrivilEdge - Income Partners RMB Debt · 31/03/2019
Investments in securities at market value/Portefeuille-titres à la valeur de marché 34 175 009.90 98.09
COMMONW BK AUSTRALIA 4.20 17-20 26/10A7 000 000 1 061 498.93 3.05CNH
Transferable securities admitted to an official stock exchange listing and/or dealt in on anotherregulated market/Valeurs mobilières admises à la cote officielle d'une bourse de valeurs et/ounégociées sur un autre marché réglementé
32 346 012.05 92.84
BONDS/OBLIGATIONS 29 075 726.98 83.45
AUSTRALIA/AUSTRALIE 1 061 498.93 3.05
BEIJING CAP POL 5.2 18-20 26/03S5 000 000 757 365.40 2.17CNH
BRITISH VIRGIN ISLANDS/ILES VIERGES BRITANNIQUES 4 087 619.68 11.73
CHINALCO CAP HLDG LTD 4.00 16-21 25/08S300 000 298 317.00 0.86USDEASY TACTIC 8.7 5 19-21 10/01S300 000 311 505.00 0.89USDFRANSHION BRILLIANT 5.20 18-21 08/03S5 000 000 760 199.93 2.18CNHNEW METRO GLOBAL 6.5 18-21 23/04S500 000 506 570.00 1.45USDSINOCHEM OFFSHORE 4.40 18-21 14/02S5 000 000 755 334.35 2.17CNHTSINGHUA UNIC LTD 4.75 18-21 31/01S300 000 294 948.00 0.85USDYINGDE GASES INVES 6.25 18-23 19/01S400 000 403 380.00 1.16USD
NATIONAL BANK OF CANA 4.30 17-20 11/10A7 000 000 1 059 421.02 3.04CNH
CANADA/CANADA 1 059 421.02 3.04
CAR INC REGS 6.125 15-20 04/02S300 000 299 301.00 0.86USD
CAYMAN ISLANDS/ILES CAÏMANS 6 262 799.15 17.98
CENTRAL CN REAL 6.50 18-21 05/03S200 000 200 254.00 0.57USDCHINA AOYUAN 7.5 18-21 10/05S300 000 307 596.00 0.88USDCHINA AOYUAN GROUP 8.5 19-22 23/01S300 000 315 555.00 0.91USDCHINA SCE GROUP 7.4500 18-21 17/04S300 000 308 124.00 0.88USDCIFI HOLDINGS 5.50 17-22 23/01S250 000 246 087.50 0.71USDCNI CAPITAL LTD 4.30 16-19 11/11S7 000 000 1 040 808.28 3.00CNHFWD LTD 5.5 18-XX 01/02S250 000 231 312.50 0.66USDHILONG HOLDING LTD 7.25 17-20 22/06S300 000 299 112.00 0.86USDKWG 7.875 18-21 09/08S300 000 311 775.00 0.89USDMODERN LAND CHINA 7.95 18-21 05/03S400 000 371 456.00 1.07USDPOWERLONG REAL ESTATE 6.95 18-21 17/04S300 000 303 270.00 0.87USDSHIMAO PROPERTY HLDG 6.375 18-21 15/10S350 000 364 049.00 1.04USDSHIMAO PROPERTY HLDGS 5.75 18-21 15/03S5 000 000 762 245.87 2.19CNHTIMES PROPERTY HLDG 6.25 18-21 17/01S400 000 400 872.00 1.15USDYUZHOU PROPERTIES 6.00 17-22 25/01S300 000 294 543.00 0.85USDYUZHOU PROPERTIES 7.9 18-21 11/05S200 000 206 438.00 0.59USD
CHINA GOVERNMENT BON 3.39 15-25 21/05S24 000 000 3 624 979.93 10.39CNH
CHINA/CHINE 6 803 455.03 19.52
CHINA GOVT BOND 3.48 12-27 29/06U5 000 000 755 304.59 2.17CNHCHINA GOVT BOND 3.85 16-26 12/12S2 000 000 310 049.63 0.89CNHCHINA REGS 3.38 16-26 06/07S5 000 000 753 094.99 2.16CNHCHINA (REP.) 3.38 14-24 21/11S4 000 000 604 951.93 1.74CNHCHINE 3.60 13-28 27/06S5 000 000 755 073.96 2.17CNH
BSH BOSCH SIEMENS 4.375 12-22 25/07S5 000 000 759 366.68 2.18CNH
GERMANY/ALLEMAGNE 1 804 783.88 5.18
LDKR BADEN-W-FOERD 3.80 16-19 03/06S7 000 000 1 045 417.20 3.00CNH
CHINA CITY IN DEFAULT 5.35 14-17 03/07S - FV, refer to/voir note 21 349 607 0.00 0.00CNH
HONG KONG/HONG-KONG 2 276 121.09 6.53
CHINA DEVELOPMENT BK 4.35 14-24 19/09S10 000 000 1 521 753.91 4.36CNHHONG KONG MORTGAGE 4.050 17-20 06/11A5 000 000 754 367.18 2.17CNH
Schedule of investments as at 31/03/2019 / Inventaire du portefeuille au 31/03/2019
USD
Market ValueNumber of Shares orNominal Value
Investment % of Net AssetsQuotationCurrency
Valeur de marchéNombre d'actions ouvaleur nominale
Investissement % de l'actif netDevise decotation

The accompanying notes form an integral part of these financial statements.Les notes annexées font partie intégrante de ces états financiers.
59PrivilEdge - Income Partners RMB Debt · 31/03/2019
HUNGARY REGS 6.25 16-19 25/04S5 000 000 745 551.09 2.14CNH
HUNGARY/HONGRIE 745 551.09 2.14
ARAB PETROLEUM INVST 4.70 18-21 13/03A5 000 000 751 666.56 2.16CNH
LUXEMBOURG/LUXEMBOURG 751 666.56 2.16
FONTERRA COOPERATIVE 4.00 15-20 22/06S5 000 000 749 058.93 2.15CNH
NEW ZEALAND/NOUVELLE ZELANDE 749 058.93 2.15
ASIAN DEVELOP BANK 2.85 10-20 21/10S5 000 000 743 735.79 2.13CNH
PHILIPPINES/PHILIPPINES 743 735.79 2.13
BANK OF CHINA JOHANN 4.88 17-20 20/04S5 000 000 756 413.11 2.17CNH
SOUTH AFRICA/AFRIQUE DU SUD 756 413.11 2.17
DAIMLER 4.8 18-21 09/04A6 000 000 918 712.50 2.64CNH
THE NETHERLANDS/PAYS-BAS 918 712.50 2.64
HITACHI CAP UK 4.50 17-20 09/10A7 000 000 1 054 890.22 3.03CNH
UNITED KINGDOM/ROYAUME-UNI 1 054 890.22 3.03
ANZ BANKING FL.R 15-25 30/01A5 000 000 755 788.18 2.17CNH
FLOATING RATE NOTES/OBLIGATIONS À TAUX VARIABLE 3 270 285.07 9.39
AUSTRALIA/AUSTRALIE 755 788.18 2.17
BAOXIN AUTO FINANC FL.R 16-49 15/12S300 000 302 442.00 0.87USD
BRITISH VIRGIN ISLANDS/ILES VIERGES BRITANNIQUES 302 442.00 0.87
FWD LTD FL.R 17-XX 24/01S300 000 303 681.00 0.87USD
CAYMAN ISLANDS/ILES CAÏMANS 707 556.00 2.03
KING TALENT FL.R 17-XX 04.12S450 000 403 875.00 1.16USD
CN CONSTRUCTION SUB FL.R 14-24 12/11S4 000 000 599 648.89 1.72CNH
CHINA/CHINE 599 648.89 1.72
BANK OF EAST ASIA FL.R 15-XX 02/06S400 000 401 240.00 1.15USD
HONG KONG/HONG-KONG 904 850.00 2.60
YANCOAL INTERNATIO FL.R 17-49 13/04S500 000 503 610.00 1.45USD
RPKF 7.75 19-21 18/01S300 000 314 706.00 0.90USD
Other transferable securities/Autres valeurs mobilières 1 828 997.85 5.25
BONDS/OBLIGATIONS 1 828 997.85 5.25
BRITISH VIRGIN ISLANDS/ILES VIERGES BRITANNIQUES 314 706.00 0.90
SINOPEC CENTURY 4.00 18-21 31/10S10 000 000 1 514 291.85 4.35CNH
HONG KONG/HONG-KONG 1 514 291.85 4.35
Schedule of investments as at 31/03/2019 / Inventaire du portefeuille au 31/03/2019
USD
Market ValueNumber of Shares orNominal Value
Investment % of Net AssetsQuotationCurrency
Valeur de marchéNombre d'actions ouvaleur nominale
Investissement % de l'actif netDevise decotation

The accompanying notes form an integral part of these financial statements.Les notes annexées font partie intégrante de ces états financiers.
60 PrivilEdge - Income Partners RMB Debt · 31/03/2019
Schedule of investments as at 31/03/2019 / Inventaire du portefeuille au 31/03/2019
Forward Foreign Currency Exchange Contracts/Contrats de change à terme (0.08)(27 025.12)CHF 179 534.04 0.00USD 1 265.23179 836.37 15/04/2019Caceis BankEUR 316 284.44 (0.01)USD (2 761.78)278 913.39 15/04/2019Caceis BankCNH 8 500 000.00 (0.07)USD (25 528.57)56 954 250.00 23/04/2019Caceis Bank
USD
Unrealised appreciation/(depreciation)
Currency % of NetAssets
Amount bought Maturity Currency Amount soldCounterparty
Plus/(Moins) value non-réalisée
Devise % de l'actifnet
Montant acheté Maturité Devise Montant venduContrepartie

PrivilEdgeis an investment company
with variable capital ("SICAV")incorporated in Luxembourg
PrivilEdgeest une société d’investissement
à capital variable ("SICAV")enregistrée au Luxembourg RCS Luxembourg B0181207
PrivilEdge –SMAM Japan Small and Mid Cap
Unaudited semi-annual report · Rapport semestriel non révisé
31.03.2019

The accompanying notes form an integral part of these financial statements.Les notes annexées font partie intégrante de ces états financiers.
62 PrivilEdge - SMAM Japan Small and Mid Cap · 31/03/2019
ASSETS/ACTIF
19 324 443 900Investments in securities at market value/Portefeuille-titres à la valeur de marché (2):( JPY )18 507 912 700Acquisition cost/Coût d'acquisition
428 028 765Cash and term deposits/Liquidité et dépôts à terme3 414 267Receivable on investments sold/À recevoir sur vente de titres
3 666Amounts receivable on subscriptions/Montants à recevoir sur souscriptions d'actions122 781 314Interest and dividends receivable, net/Intérêt et dividendes nets à recevoir
19 878 671 912LIABILITIES/PASSIF
135 386Bank overdrafts/Découverts bancaires30 639 705Payable on investments purchased/À payer sur achat de titres58 010 172Amounts payable on redemptions/Montants à payer sur rachats d'actions14 918 697Management and distribution fees payable/Commission de gestion et de distribution à payer (3)
3 938 492Taxes and expenses payable/Impôts et autres frais à payer20 838 633Unrealised depreciation on forward foreign currency exchange contracts/Moins-value non réalisée sur contrats de change à
terme(2)
128 481 08519 750 190 827NET ASSET VALUE/VALEUR NETTE D'INVENTAIRE
Statement of net assets as at 31/03/2019 / État de l'actif net au 31/03/2019
NotesNotes JPY

The accompanying notes form an integral part of these financial statements.Les notes annexées font partie intégrante de ces états financiers.
63PrivilEdge - SMAM Japan Small and Mid Cap · 31/03/2019
Statement of operations and changes in net assets for the period from 01/10/2018 to 31/03/2019 / État desopérations et des variations de l'actif net pour la période du 01/10/2018 au 31/03/2019
NotesNotes JPY
41 563 071 570NET ASSET VALUE AT THE BEGINNING OF THE PERIOD/VALEUR NETTE D'INVENTAIRE AU DÉBUT DE LAPÉRIODE
INCOME/REVENUS
185 316 448Dividends, net/Dividendes, nets (2)6 206Bank interest/Intérêts bancaires
1 638 182Securities Lending Income/Revenus sur prêt de titres (9)186 960 836
EXPENSES/DÉPENSES
129 268 894Management fees/Commission de gestion (3)1 711 628Distribution fees/Frais de distribution (3)
473 616Bank interest and other expenses/Intérêts bancaires débiteurs et autres frais38 644 286Fixed Rate of Operational Costs/Taux Fixe de Coûts Opérationnels (4)
170 098 42416 862 412NET INVESTMENT INCOME/REVENU NET SUR INVESTISSEMENTS
560 198 220Net realised gain on sale of investments/Gain net réalisé sur ventes d'investissements (2)26 337 761Net realised gain on foreign exchange/Gain net réalisé sur opérations de change
(201 799 685)Net realised loss on forward foreign currency exchange contracts/Perte nette réalisée sur contrats de change à terme401 598 708NET REALISED GAIN/GAIN NET RÉALISÉ
(5 442 258 960)Change in net unrealised appreciation or depreciation on investments/Variation de la plus ou moins-value nette non réaliséesur investissements
(2)
(83 185 974)Change in net unrealised appreciation or depreciation on forward foreign currency exchange contracts/Variation de la plus oumoins-value nette non réalisée sur contrats de change à terme
(5 123 846 226)NET DECREASE IN NET ASSETS AS A RESULT OF OPERATIONS/DIMINUTION NETTE DE L'ACTIF NET RÉSULTANTDES OPÉRATIONS
(540 175)Dividend paid/Dividende payé(16 688 494 342)Net subscriptions/(redemptions) including equalisation/Souscriptions/(rachats) nets incluant la régularisation
19 750 190 827NET ASSET VALUE AT THE END OF THE PERIOD/VALEUR NETTE D'INVENTAIRE À LA FIN DE LA PÉRIODE

The accompanying notes form an integral part of these financial statements.Les notes annexées font partie intégrante de ces états financiers.
64 PrivilEdge - SMAM Japan Small and Mid Cap · 31/03/2019
66 593.3010 53 864.3010 (28 757.5570) 91 700.0450P - USD - Hedged - Capitalisation68 845.3940 12 860.0000 (10 580.0000) 71 125.3940P - EUR - Hedged - Capitalisation14 699.5100 55.0000 (5 910.0000) 8 844.5100P - JPY - Capitalisation
145 663.0850 665 913.0000 (42 670.0000) 768 906.0850I - CHF - Hedged - Capitalisation20 071.5430 0.0000 (300.0000) 19 771.5430I - JPY - Capitalisation
453 048.5790 30 617.6200 (164 528.5590) 319 137.6400M - USD - Hedged - Capitalisation3 200.0000 0.0000 0.0000 3 200.0000M - USD - Hedged - Distribution
835 049.7920 1 012.3640 (728 712.6750) 107 349.4810M - CHF - Hedged - Capitalisation478 372.7340 22 600.0000 (388 008.7380) 112 963.9960M - EUR - Hedged - Capitalisation
60 303.0000 0.0000 (35 660.0000) 24 643.0000M - EUR - Hedged - Distribution812 790.9270 17 793.0770 (639 195.8900) 191 388.1140M - JPY - Capitalisation320 257.5970 11 094.7280 (193 534.0380) 137 818.2870M - JPY - Distribution907 836.5270 0.0000 (319 266.0000) 588 570.5270N - USD - Hedged - Capitalisation413 533.2730 1 410.0000 (88 961.0000) 325 982.2730N - EUR - Hedged - Capitalisation495 114.4260 20 641.0000 (273 607.0910) 242 148.3350N - JPY - Capitalisation
16 368.9280 0.0000 0.0000 16 368.9280N - JPY - Distribution313 535.1080 0.0000 0.0000 313 535.1080U - EUR - Hedged - Capitalisation369 302.8180 27 527.1830 (14 174.6680) 382 655.3330U - JPY - Capitalisation
Statement of changes in the number of shares outstanding for the period from 01/10/2018 to 31/03/2019 / Étatdes variations du nombre d'actions pour la période du 01/10/2018 au 31/03/2019
Number of Shares01/10/2018/
Nombre d'actions01/10/2018
Number of Sharesissued/
Nombre d'actionsémises
Number of Sharesredeemed/
Nombre d'actionsrachetées
Number of Shares31/03/2019/
Nombre d'actions31/03/2019
30/09/201831/03/2019For the period ended/Pour la période clôturée au
Statistics / Statistiques
30/09/2017
P - USD - Hedged - Capitalisation
1 417 106.1415.4537
1 130 851.9516.9815
0.000.0000
Net Asset Value/Valeur Nette d'InventaireNet Asset Value per share/Valeur Nette d'Inventaire par action
USD USD USD
P - EUR - Hedged - Capitalisation
1 030 242.2914.4849
1 112 804.9816.1638
0.000.0000
Net Asset Value/Valeur Nette d'InventaireNet Asset Value per share/Valeur Nette d'Inventaire par action
EUR EUR EUR
P - JPY - Capitalisation
129 499 18514 642
239 495 83616 293
25 816 39814 069
Net Asset Value/Valeur Nette d'InventaireNet Asset Value per share/Valeur Nette d'Inventaire par action
JPY JPY JPY
I - CHF - Hedged - Capitalisation
11 179 979.0414.5401
2 354 222.7916.1621
2 963 395.8213.9434
Net Asset Value/Valeur Nette d'InventaireNet Asset Value per share/Valeur Nette d'Inventaire par action
CHF CHF CHF

The accompanying notes form an integral part of these financial statements.Les notes annexées font partie intégrante de ces états financiers.
65PrivilEdge - SMAM Japan Small and Mid Cap · 31/03/2019
30/09/201831/03/2019For the period ended/Pour la période clôturée au
Statistics / Statistiques
30/09/2017
I - JPY - Capitalisation
298 924 86715 119
335 753 48716 728
12 550 44314 279
Net Asset Value/Valeur Nette d'InventaireNet Asset Value per share/Valeur Nette d'Inventaire par action
JPY JPY JPY
M - USD - Hedged - Capitalisation
4 975 964.6515.5919
7 731 419.1517.0653
8 032 888.7014.3654
Net Asset Value/Valeur Nette d'InventaireNet Asset Value per share/Valeur Nette d'Inventaire par action
USD USD USD
M - USD - Hedged - Distribution
49 894.1715.5919
0.00
54 609.1217.0654
0.00
0.000.0000
0.00
Net Asset Value/Valeur Nette d'InventaireNet Asset Value per share/Valeur Nette d'Inventaire par actionDividend per share paid to shareholders/Dividende par action payé aux actionnaires
USD USD USD
M - CHF - Hedged - Capitalisation
1 549 507.0814.4342
13 421 245.4616.0724
8 559 916.8113.9286
Net Asset Value/Valeur Nette d'InventaireNet Asset Value per share/Valeur Nette d'Inventaire par action
CHF CHF CHF
M - EUR - Hedged - Capitalisation
1 650 028.9914.6067
7 766 406.8816.2351
11 348 203.8714.0037
Net Asset Value/Valeur Nette d'InventaireNet Asset Value per share/Valeur Nette d'Inventaire par action
EUR EUR EUR
M - EUR - Hedged - Distribution
359 911.9714.6050
0.00
978 912.3816.2332
0.00
8 334 087.5614.0022
0.00
Net Asset Value/Valeur Nette d'InventaireNet Asset Value per share/Valeur Nette d'Inventaire par actionDividend per share paid to shareholders/Dividende par action payé aux actionnaires
EUR EUR EUR
M - JPY - Capitalisation
2 861 080 37314 949
13 466 932 37616 569
4 260 006 01614 207
Net Asset Value/Valeur Nette d'InventaireNet Asset Value per share/Valeur Nette d'Inventaire par action
JPY JPY JPY
M - JPY - Distribution
2 060 281 02314 949
0
5 306 324 36216 569
0
990 762 76514 208
0
Net Asset Value/Valeur Nette d'InventaireNet Asset Value per share/Valeur Nette d'Inventaire par actionDividend per share paid to shareholders/Dividende par action payé aux actionnaires
JPY JPY JPY

The accompanying notes form an integral part of these financial statements.Les notes annexées font partie intégrante de ces états financiers.
66 PrivilEdge - SMAM Japan Small and Mid Cap · 31/03/2019
30/09/201831/03/2019For the period ended/Pour la période clôturée au
Statistics / Statistiques
30/09/2017
N - USD - Hedged - Capitalisation
9 235 757.6715.6918
15 578 875.8817.1604
13 289 477.1514.4022
Net Asset Value/Valeur Nette d'InventaireNet Asset Value per share/Valeur Nette d'Inventaire par action
USD USD USD
N - EUR - Hedged - Capitalisation
4 800 793.4414.7272
6 763 491.6016.3554
6 144 494.9214.0653
Net Asset Value/Valeur Nette d'InventaireNet Asset Value per share/Valeur Nette d'Inventaire par action
EUR EUR EUR
N - JPY - Capitalisation
3 650 253 59515 074
8 265 347 86116 694
3 977 157 22214 272
Net Asset Value/Valeur Nette d'InventaireNet Asset Value per share/Valeur Nette d'Inventaire par action
JPY JPY JPY
N - JPY - Distribution
246 224 68315 042
33
273 245 76616 693
0
000
Net Asset Value/Valeur Nette d'InventaireNet Asset Value per share/Valeur Nette d'Inventaire par actionDividend per share paid to shareholders/Dividende par action payé aux actionnaires
JPY JPY JPY
U - EUR - Hedged - Capitalisation
4 635 479.3414.7846
5 136 637.5616.3830
0.000.0000
Net Asset Value/Valeur Nette d'InventaireNet Asset Value per share/Valeur Nette d'Inventaire par action
EUR EUR EUR
U - JPY - Capitalisation
5 803 161 65515 166
6 188 655 84816 758
00
Net Asset Value/Valeur Nette d'InventaireNet Asset Value per share/Valeur Nette d'Inventaire par action
JPY JPY JPY

The accompanying notes form an integral part of these financial statements.Les notes annexées font partie intégrante de ces états financiers.
67PrivilEdge - SMAM Japan Small and Mid Cap · 31/03/2019
Investments in securities at market value/Portefeuille-titres à la valeur de marché 19 324 443 900 97.84
AMIYAKI TEI55 000 191 950 000 0.97JPY
Transferable securities admitted to an official stock exchange listing and/or dealt in on anotherregulated market/Valeurs mobilières admises à la cote officielle d'une bourse de valeurs et/ounégociées sur un autre marché réglementé
19 324 443 900 97.84
EQUITIES/ACTIONS 19 324 443 900 97.84
JAPAN/JAPON 19 324 443 900 97.84
ARCLAND SERVICE H SHS99 000 200 871 000 1.02JPYASAHI INTECC CO LTD49 000 254 800 000 1.29JPYBENEFIT ONE INC150 000 325 800 000 1.65JPYBIC CAMERA INC202 800 235 856 400 1.19JPYCASIO COMPUTER CO LTD139 700 201 866 500 1.02JPYCOMTURE --- REGISTERED SHS66 000 240 240 000 1.22JPYCRESCO61 000 202 825 000 1.03JPYDAIFUKU CO46 000 264 960 000 1.34JPYDAIKOKUTENBUSSAN36 000 138 240 000 0.70JPYDAITO PHARMACEUTICAL CO LTD68 500 189 060 000 0.96JPYDOSHISHA CO LTD86 500 149 385 500 0.76JPYDTS CORP74 500 304 705 000 1.54JPYEIKEN CHEMICAL CO99 500 259 297 000 1.31JPYEPS HLDG116 000 214 136 000 1.08JPYF M CO LTD216 000 253 368 000 1.28JPYFINNING INTERNATIONAL INC108 000 215 244 000 1.09JPYFT GROUP CO LTD144 500 198 543 000 1.01JPYFUJI SEAL INTL74 000 296 000 000 1.50JPYFUJI SOFT57 000 249 660 000 1.26JPYFUJIMORI KOGYO CO LTD65 000 197 600 000 1.00JPYFULLCAST CO LTD135 000 318 600 000 1.61JPYFUNAI CONSULTING CO LTD82 000 218 366 000 1.11JPYGAKUJO CO LTD158 000 194 656 000 0.99JPYGMO PAYMENT GATEWAY INC17 900 140 694 000 0.71JPYHIKARI TSUSHIN15 500 325 035 000 1.65JPYHONDA TSUSHIN KOGYO CO86 000 45 666 000 0.23JPYHOSOKAWA MICRON CORP44 000 217 580 000 1.10JPYINFOMART CORP83 200 112 153 600 0.57JPYINTAGE INC236 000 202 724 000 1.03JPYIR JAPAN HOLDINGS LTD152 500 276 787 500 1.40JPYIRISO ELECTRONICS54 000 273 240 000 1.38JPYITFOR INC150 000 143 250 000 0.73JPYJAPAN BEST RESCUE SYSTEM CO LTD150 000 227 700 000 1.15JPYJAPAN BUSINESS COMPUTER CORPORATION123 000 184 500 000 0.93JPYJCU118 000 204 258 000 1.03JPYKOBE BUSSAN CO LTD70 000 294 000 000 1.49JPYKOSHIDAKA CO LTD256 000 425 216 000 2.16JPYKUSURI NO AOKI HOLDINGS27 000 213 840 000 1.08JPYKYORITSU MAINTENANCE CO LTD60 000 329 400 000 1.67JPYLAC HOLDINGS INC133 000 202 160 000 1.02JPYLINTEC CORP82 000 196 308 000 0.99JPYMACROMILL INC157 000 209 438 000 1.06JPYMANI INC54 000 292 140 000 1.48JPYMEITEC CORP62 000 311 860 000 1.58JPYNICHIRIN105 000 186 480 000 0.94JPYNIFCO INC92 000 259 440 000 1.31JPYNIHON DENGI - REGISTERED29 200 78 840 000 0.40JPYNIHON M&A CENTER INC92 500 280 275 000 1.42JPY
Schedule of investments as at 31/03/2019 / Inventaire du portefeuille au 31/03/2019
JPY
Market ValueNumber of Shares orNominal Value
Investment % of Net AssetsQuotationCurrency
Valeur de marchéNombre d'actions ouvaleur nominale
Investissement % de l'actif netDevise decotation

The accompanying notes form an integral part of these financial statements.Les notes annexées font partie intégrante de ces états financiers.
68 PrivilEdge - SMAM Japan Small and Mid Cap · 31/03/2019
NIPPON AIR CONDITIONING SERVICES CO278 000 189 318 000 0.96JPYNIPPON SIGNAL CO LTD10 000 9 910 000 0.05JPYNOF CORP80 000 301 600 000 1.53JPYNSD SHS86 000 221 622 000 1.12JPYOILES CORP64 000 113 024 000 0.57JPYOKAMURA RG222 000 257 298 000 1.30JPYOPTEX102 700 181 265 500 0.92JPYOUTSOURCING217 000 296 422 000 1.50JPYPACIFIC INDUSTRIAL CO LTD180 000 280 080 000 1.42JPYPIOLAX INC108 500 230 996 500 1.17JPYPRESTIGE INTERNATIONAL INC231 500 321 785 000 1.63JPYRELIA SHS130 000 125 450 000 0.64JPYRELO GROUP SHS102 500 318 775 000 1.61JPYRHEON AUTOMATIC MACHINERY CO LTD129 000 204 207 000 1.03JPYRISO KYOIKU CO LTD440 000 224 400 000 1.14JPYSAKAI MOVING SERVICE CO LTD40 500 284 310 000 1.44JPYSAN-A47 000 208 210 000 1.05JPYSEIREN CO LTD161 000 263 235 000 1.33JPYSHIMA SEIKI MFG LTD27 600 93 840 000 0.48JPYSHINKO KOGYO CO LTD129 500 193 861 500 0.98JPYSIIX CORP130 500 218 718 000 1.11JPYSOFTBANK TECHNOLOGY CORP99 000 236 214 000 1.20JPYSOHGO SECURITY SERVICES CO62 500 301 250 000 1.53JPYSTANLEY ELECTRIC CO LTD93 300 277 567 500 1.41JPYSTAR MICRONICS153 000 257 805 000 1.31JPYSUMIDA CORP95 200 148 702 400 0.75JPYTANSEISHA CO LTD172 000 224 976 000 1.14JPYTECHNOPRO HOLDINGS INC44 000 290 400 000 1.47JPYTOCALO CO LTD270 000 235 440 000 1.19JPYTOSHO90 500 277 835 000 1.41JPYTOTETSU KOGYO CO LTD102 500 312 625 000 1.58JPYTOW CO LTD248 000 180 048 000 0.91JPYTRUST TECH75 000 274 875 000 1.39JPYTSUBAKI NAKASHIMA CO LTD134 000 266 258 000 1.35JPYTSUKUI CORP336 000 233 856 000 1.18JPYUMC ELECTRONICS CO LTD75 000 119 250 000 0.60JPY
Schedule of investments as at 31/03/2019 / Inventaire du portefeuille au 31/03/2019
JPY
Market ValueNumber of Shares orNominal Value
Investment % of Net AssetsQuotationCurrency
Valeur de marchéNombre d'actions ouvaleur nominale
Investissement % de l'actif netDevise decotation
Forward Foreign Currency Exchange Contracts/Contrats de change à terme (0.11)(20 838 633)CHF 1 506 628 552 0.03JPY 4 940 80013 598 893 15/04/2019Caceis BankJPY 880 264 0.00CHF (426 727)97 417 987 15/04/2019Caceis BankJPY 1 593 339 0.00USD 656 080176 817 873 15/04/2019Caceis BankUSD 1 913 921 374 (0.04)JPY (6 659 506)17 250 614 15/04/2019Caceis BankEUR 1 703 227 804 (0.11)JPY (20 478 035)13 539 872 15/04/2019Caceis BankJPY 1 075 104 0.01EUR 1 128 755134 743 767 15/04/2019Caceis Bank
JPY
Unrealised appreciation/(depreciation)
Currency % of NetAssets
Amount bought Maturity Currency Amount soldCounterparty
Plus/(Moins) value non-réalisée
Devise % de l'actifnet
Montant acheté Maturité Devise Montant venduContrepartie

PrivilEdgeis an investment company
with variable capital ("SICAV")incorporated in Luxembourg
PrivilEdgeest une société d’investissement
à capital variable ("SICAV")enregistrée au Luxembourg RCS Luxembourg B0181207
PrivilEdge –Fidelity Technology
Unaudited semi-annual report · Rapport semestriel non révisé
31.03.2019

The accompanying notes form an integral part of these financial statements.Les notes annexées font partie intégrante de ces états financiers.
70 PrivilEdge - Fidelity Technology · 31/03/2019
ASSETS/ACTIF
260 700 052.13Investments in securities at market value/Portefeuille-titres à la valeur de marché (2):( USD )243 031 263.44Acquisition cost/Coût d'acquisition
1 816 077.74Cash and term deposits/Liquidité et dépôts à terme2 863 717.77Receivable on investments sold/À recevoir sur vente de titres
975.57Amounts receivable on subscriptions/Montants à recevoir sur souscriptions d'actions308 224.80Interest and dividends receivable, net/Intérêt et dividendes nets à recevoir
265 689 048.01LIABILITIES/PASSIF
1 660 634.64Payable on investments purchased/À payer sur achat de titres5 347.71Amounts payable on redemptions/Montants à payer sur rachats d'actions
279 486.59Management and distribution fees payable/Commission de gestion et de distribution à payer (3)60 112.21Taxes and expenses payable/Impôts et autres frais à payer
501.67Payable on foreign exchange transactions, net/A payer sur opérations de change, net 303 528.40Unrealised depreciation on forward foreign currency exchange contracts/Moins-value non réalisée sur contrats de change à
terme(2)
2 309 611.22263 379 436.79NET ASSET VALUE/VALEUR NETTE D'INVENTAIRE
Statement of net assets as at 31/03/2019 / État de l'actif net au 31/03/2019
NotesNotes USD

The accompanying notes form an integral part of these financial statements.Les notes annexées font partie intégrante de ces états financiers.
71PrivilEdge - Fidelity Technology · 31/03/2019
Statement of operations and changes in net assets for the period from 01/10/2018 to 31/03/2019 / État desopérations et des variations de l'actif net pour la période du 01/10/2018 au 31/03/2019
NotesNotes USD
284 841 889.97NET ASSET VALUE AT THE BEGINNING OF THE PERIOD/VALEUR NETTE D'INVENTAIRE AU DÉBUT DE LAPÉRIODE
INCOME/REVENUS
1 344 055.27Dividends, net/Dividendes, nets (2)17 691.09Bank interest/Intérêts bancaires
3 443.96Securities Lending Income/Revenus sur prêt de titres (9)1 365 190.32
EXPENSES/DÉPENSES
1 352 065.79Management fees/Commission de gestion (3)304 917.59Distribution fees/Frais de distribution (3)
2 317.90Bank interest and other expenses/Intérêts bancaires débiteurs et autres frais372 352.16Fixed Rate of Operational Costs/Taux Fixe de Coûts Opérationnels (4)
2 031 653.44(666 463.12)NET INVESTMENT LOSS/PERTE NETTE SUR INVESTISSEMENTS
18 285 892.61Net realised gain on sale of investments/Gain net réalisé sur ventes d'investissements (2)(154 857.83)Net realised loss on foreign exchange/Perte nette réalisée sur opérations de change
(1 760 476.70)Net realised loss on forward foreign currency exchange contracts/Perte nette réalisée sur contrats de change à terme15 704 094.96NET REALISED GAIN/GAIN NET RÉALISÉ
(10 887 815.67)Change in net unrealised appreciation or depreciation on investments/Variation de la plus ou moins-value nette non réaliséesur investissements
(2)
(63 866.69)Change in net unrealised appreciation or depreciation on forward foreign currency exchange contracts/Variation de la plus oumoins-value nette non réalisée sur contrats de change à terme
4 752 412.60NET INCREASE IN NET ASSETS AS A RESULT OF OPERATIONS/AUGMENTATION NETTE DE L'ACTIF NETRÉSULTANT DES OPÉRATIONS
(69 299.90)Dividend paid/Dividende payé(26 145 565.88)Net subscriptions/(redemptions) including equalisation/Souscriptions/(rachats) nets incluant la régularisation263 379 436.79NET ASSET VALUE AT THE END OF THE PERIOD/VALEUR NETTE D'INVENTAIRE À LA FIN DE LA PÉRIODE

The accompanying notes form an integral part of these financial statements.Les notes annexées font partie intégrante de ces états financiers.
72 PrivilEdge - Fidelity Technology · 31/03/2019
1 224 430.9510 20 359.0070 (120 231.1480) 1 124 558.8100P - USD - Capitalisation1 339 618.8380 2 082.8460 (34 774.8830) 1 306 926.8010P - USD - Distribution
318 960.8310 8 903.5320 (16 177.0540) 311 687.3090P - EUR - Hedged - Capitalisation392.5290 0.0000 (0.5710) 391.9580R - USD - Capitalisation874.5470 0.0000 0.0000 874.5470R - EUR - Hedged - Capitalisation
2 915 229.7440 178 457.9290 (599 952.7260) 2 493 734.9470M - USD - Capitalisation234 588.8060 5 953.4050 (36 170.4060) 204 371.8050M - USD - Distribution687 084.4200 32 372.3620 (259 199.1850) 460 257.5970M - EUR - Hedged - Capitalisation119 500.0000 7 400.0000 (11 700.0000) 115 200.0000M - EUR - Hedged - Distribution956 410.4950 106 000.4760 (96 297.9710) 966 113.0000N - USD - Capitalisation134 966.8920 0.0000 0.0000 134 966.8920N - USD - Distribution452 977.1960 122 187.6660 (182 246.0620) 392 918.8000N - EUR - Hedged - Capitalisation
37 839.5330 0.0000 (5 740.0000) 32 099.5330N - GBP - Hedged - Distribution
Statement of changes in the number of shares outstanding for the period from 01/10/2018 to 31/03/2019 / Étatdes variations du nombre d'actions pour la période du 01/10/2018 au 31/03/2019
Number of Shares01/10/2018/
Nombre d'actions01/10/2018
Number of Sharesissued/
Nombre d'actionsémises
Number of Sharesredeemed/
Nombre d'actionsrachetées
Number of Shares31/03/2019/
Nombre d'actions31/03/2019
30/09/201831/03/2019For the period ended/Pour la période clôturée au
Statistics / Statistiques
30/09/2017
P - USD - Capitalisation
39 955 308.5135.5298
42 175 540.1734.4450
44 739 376.7128.7998
Net Asset Value/Valeur Nette d'InventaireNet Asset Value per share/Valeur Nette d'Inventaire par action
USD USD USD
P - USD - Distribution
44 807 825.2034.2849
0.00
44 526 431.0433.2381
0.00
39 191 569.4427.7907
0.81
Net Asset Value/Valeur Nette d'InventaireNet Asset Value per share/Valeur Nette d'Inventaire par actionDividend per share paid to shareholders/Dividende par action payé aux actionnaires
USD USD USD
P - EUR - Hedged - Capitalisation
6 798 874.2721.8131
6 862 384.3521.5148
6 111 448.6718.4841
Net Asset Value/Valeur Nette d'InventaireNet Asset Value per share/Valeur Nette d'Inventaire par action
EUR EUR EUR
R - USD - Capitalisation
13 346.2934.0503
13 019.1033.1672
0.000.0000
Net Asset Value/Valeur Nette d'InventaireNet Asset Value per share/Valeur Nette d'Inventaire par action
USD USD USD

The accompanying notes form an integral part of these financial statements.Les notes annexées font partie intégrante de ces états financiers.
73PrivilEdge - Fidelity Technology · 31/03/2019
30/09/201831/03/2019For the period ended/Pour la période clôturée au
Statistics / Statistiques
30/09/2017
R - EUR - Hedged - Capitalisation
18 004.0420.5867
17 841.7620.4011
49 509.9317.6944
Net Asset Value/Valeur Nette d'InventaireNet Asset Value per share/Valeur Nette d'Inventaire par action
EUR EUR EUR
M - USD - Capitalisation
93 412 185.8637.4587
105 464 126.6236.1770
92 238 101.1530.0369
Net Asset Value/Valeur Nette d'InventaireNet Asset Value per share/Valeur Nette d'Inventaire par action
USD USD USD
M - USD - Distribution
7 353 770.5035.9823
0.09
8 174 608.8634.8465
0.00
6 042 784.9428.9323
0.88
Net Asset Value/Valeur Nette d'InventaireNet Asset Value per share/Valeur Nette d'Inventaire par actionDividend per share paid to shareholders/Dividende par action payé aux actionnaires
USD USD USD
M - EUR - Hedged - Capitalisation
10 584 741.2422.9974
15 525 794.0322.5966
9 673 739.5519.2781
Net Asset Value/Valeur Nette d'InventaireNet Asset Value per share/Valeur Nette d'Inventaire par action
EUR EUR EUR
M - EUR - Hedged - Distribution
2 641 790.7622.9322
0.06
2 700 291.3222.5966
0.00
967 758.6319.2781
0.00
Net Asset Value/Valeur Nette d'InventaireNet Asset Value per share/Valeur Nette d'Inventaire par actionDividend per share paid to shareholders/Dividende par action payé aux actionnaires
EUR EUR EUR
N - USD - Capitalisation
38 878 371.8840.2421
37 143 144.7438.8360
28 703 334.1432.1641
Net Asset Value/Valeur Nette d'InventaireNet Asset Value per share/Valeur Nette d'Inventaire par action
USD USD USD
N - USD - Distribution
5 391 283.1539.9452
0.27
5 241 563.3438.8359
0.00
0.000.0000
0.00
Net Asset Value/Valeur Nette d'InventaireNet Asset Value per share/Valeur Nette d'Inventaire par actionDividend per share paid to shareholders/Dividende par action payé aux actionnaires
USD USD USD
N - EUR - Hedged - Capitalisation
9 196 049.2323.4045
10 409 136.9622.9794
5 382 333.1819.5557
Net Asset Value/Valeur Nette d'InventaireNet Asset Value per share/Valeur Nette d'Inventaire par action
EUR EUR EUR

The accompanying notes form an integral part of these financial statements.Les notes annexées font partie intégrante de ces états financiers.
74 PrivilEdge - Fidelity Technology · 31/03/2019
30/09/201831/03/2019For the period ended/Pour la période clôturée au
Statistics / Statistiques
30/09/2017
N - GBP - Hedged - Distribution
564 683.2517.5916
0.09
653 523.7417.2709
0.00
99 555.8114.5559
0.47
Net Asset Value/Valeur Nette d'InventaireNet Asset Value per share/Valeur Nette d'Inventaire par actionDividend per share paid to shareholders/Dividende par action payé aux actionnaires
GBP GBP GBP

The accompanying notes form an integral part of these financial statements.Les notes annexées font partie intégrante de ces états financiers.
75PrivilEdge - Fidelity Technology · 31/03/2019
Investments in securities at market value/Portefeuille-titres à la valeur de marché 260 700 052.13 98.98
MARVELL TECHNOLOGY GROUP LTD367 718 7 313 911.02 2.78USD
Transferable securities admitted to an official stock exchange listing and/or dealt in on anotherregulated market/Valeurs mobilières admises à la cote officielle d'une bourse de valeurs et/ounégociées sur un autre marché réglementé
260 700 052.13 98.98
EQUITIES/ACTIONS 260 700 052.13 98.98
BERMUDA/BERMUDES 7 313 911.02 2.78
MAIL.RU GROUP GDR REPR 1 SH REGS58 841 1 456 903.16 0.55USD
BRITISH VIRGIN ISLANDS/ILES VIERGES BRITANNIQUES 1 456 903.16 0.55
BAIDU -A- SPONS ADR REPR 1/10 SH -A-34 022 5 608 526.70 2.13USD
CAYMAN ISLANDS/ILES CAÏMANS 12 799 306.61 4.86
CHANGYOU -A- -ADR- REP 2 SHS A40 353 690 036.30 0.26USDCTRIP.COM INTL ADR REPR 1/4TH SH61 414 2 683 177.66 1.02USDNETEASE SPONS ADR REPR 25 SHS15 811 3 817 565.95 1.45USD
CRITEO ADR REPR 1 SHS34 786 696 763.58 0.26USD
FRANCE/FRANCE 3 639 831.11 1.38
ESI GROUP17 495 440 031.44 0.17EURINGENICO GROUP35 039 2 503 036.09 0.95EUR
INFINEON TECHNOLOGIES REG SHS269 390 5 349 439.47 2.03EUR
GERMANY/ALLEMAGNE 17 059 938.29 6.48
OSRAM LICHT52 957 1 824 317.71 0.69EURSAP AG85 481 9 886 181.11 3.76EUR
ALPS ALPINE CO LTD96 500 2 013 958.56 0.76JPY
JAPAN/JAPON 18 395 697.95 6.98
JSR CORP193 200 2 995 267.69 1.14JPYRAKUTEN248 900 2 356 662.63 0.89JPYRENESAS ELECTRONICS390 600 1 806 813.96 0.69JPYSOFTBANK GROUP56 300 5 465 451.58 2.07JPYYAHOO JAPAN CORP1 534 700 3 757 543.53 1.43JPY
NAVER23 821 2 602 241.36 0.99KRW
SOUTH KOREA/CORÉE DU SUD 20 575 027.08 7.81
SAMSUNG C&T11 662 1 099 316.42 0.42KRWSAMSUNG ELECTRONICS CO LTD PFD SHS N/VTG513 602 16 402 143.93 6.22KRWWIMCO REGISTERED21 486 471 325.37 0.18KRW
TELEFON AB L.M.ERICSSON332 055 3 058 035.24 1.16SEK
SWEDEN/SUÈDE 3 058 035.24 1.16
DELTA ELECTRONIC INCS279 000 1 439 334.14 0.55TWD
TAIWAN/TAÏWAN 9 163 634.18 3.48
QUANTA COMPUTER INC786 000 1 474 044.81 0.56TWDTAIWAN SEMICONDUCTOR MANUFACTURING CO LTD549 000 4 373 046.96 1.66TWDTONG HSING ELECTRONICS INDUSTRIES LTD559 000 1 877 208.27 0.71TWD
NXP SEMICONDUCTORS90 711 8 017 945.29 3.04USD
THE NETHERLANDS/PAYS-BAS 8 017 945.29 3.04
INMARSAT63 210 457 134.95 0.17GBP
UNITED KINGDOM/ROYAUME-UNI 3 734 508.48 1.42
SAGE GROUP222 295 2 031 127.81 0.78GBPSOPHOS GROUP PLC317 951 1 246 245.72 0.47GBP
Schedule of investments as at 31/03/2019 / Inventaire du portefeuille au 31/03/2019
USD
Market ValueNumber of Shares orNominal Value
Investment % of Net AssetsQuotationCurrency
Valeur de marchéNombre d'actions ouvaleur nominale
Investissement % de l'actif netDevise decotation

The accompanying notes form an integral part of these financial statements.Les notes annexées font partie intégrante de ces états financiers.
76 PrivilEdge - Fidelity Technology · 31/03/2019
ACACIA COMM17 513 1 004 370.55 0.38USD
UNITED STATES/ÉTATS-UNIS 155 485 313.72 59.04
ACTIVISION BLIZZARD123 238 5 611 026.14 2.13USDACUITY BRANDS34 629 4 155 826.29 1.58USDADTRAN105 728 1 448 473.60 0.55USDAKAMAI TECHNOLOGIES74 612 5 350 426.52 2.03USDALPHABET -C-11 195 13 135 205.45 5.00USDAPPLE INC90 910 17 268 354.50 6.57USDBOOKING HLDG1 131 1 973 493.21 0.75USDBOX INC121 645 2 348 964.95 0.89USDELECTRONIC ARTS - REGISTERED78 843 8 012 814.09 3.04USDFACEBOOK -A-30 571 5 095 879.99 1.93USDIBM CORP76 957 10 858 632.70 4.12USDINTEL CORP207 778 11 157 678.60 4.25USDJUNIPER NETWORKS INC141 561 3 747 119.67 1.42USDKLA-TENCOR CORP35 108 4 192 246.28 1.59USDLAM RESEARCH CORP18 394 3 292 709.94 1.25USDMAXIM INTEGRATED PRODUCTS INC48 775 2 593 366.75 0.98USDMICROSOFT CORP85 773 10 116 067.62 3.84USDNUANCE COMMUNICATIONS INC257 984 4 367 669.12 1.66USDNUTANIX -A-57 569 2 172 654.06 0.82USDNVIDIA CORP10 739 1 928 294.84 0.73USDORACLE CORP108 404 5 822 378.84 2.21USDQUALCOMM INC137 368 7 834 097.04 2.97USDSABRE111 029 2 374 910.31 0.90USDSYMANTEC CORP140 451 3 228 968.49 1.23USDTESLA MOTORS INC11 166 3 124 916.76 1.19USDTRIMBLE120 855 4 882 542.00 1.85USDTRIPADVISOR INC WHEN ISSUED80 921 4 163 385.45 1.58USDWESTERN DIGITAL CORP87 866 4 222 839.96 1.60USD
Schedule of investments as at 31/03/2019 / Inventaire du portefeuille au 31/03/2019
USD
Market ValueNumber of Shares orNominal Value
Investment % of Net AssetsQuotationCurrency
Valeur de marchéNombre d'actions ouvaleur nominale
Investissement % de l'actif netDevise decotation
Forward Foreign Currency Exchange Contracts/Contrats de change à terme (0.12)(303 528.40)GBP 776 806.57 0.00USD (12 192.44)586 393.40 15/04/2019Caceis BankUSD 23 935.20 0.00GBP 309.1031 519.04 15/04/2019Caceis BankUSD 1 877 896.47 0.00EUR 10 947.242 121 875.09 15/04/2019Caceis BankEUR 35 161 618.03 (0.12)USD (302 592.30)31 010 992.96 15/04/2019Caceis Bank
USD
Unrealised appreciation/(depreciation)
Currency % of NetAssets
Amount bought Maturity Currency Amount soldCounterparty
Plus/(Moins) value non-réalisée
Devise % de l'actifnet
Montant acheté Maturité Devise Montant venduContrepartie

PrivilEdgeis an investment company
with variable capital ("SICAV")incorporated in Luxembourg
PrivilEdgeest une société d’investissement
à capital variable ("SICAV")enregistrée au Luxembourg RCS Luxembourg B0181207
PrivilEdge –Ashmore Emerging Market Local
Currency BondUnaudited semi-annual report · Rapport semestriel non révisé
31.03.2019

The accompanying notes form an integral part of these financial statements.Les notes annexées font partie intégrante de ces états financiers.
78 PrivilEdge - Ashmore Emerging Market Local Currency Bond · 31/03/2019
ASSETS/ACTIF
559 936 203.78Investments in securities at market value/Portefeuille-titres à la valeur de marché (2):( USD )597 665 590.06Acquisition cost/Coût d'acquisition
32 166 209.81Cash and term deposits/Liquidité et dépôts à terme1 300 319.43Receivable on investments sold/À recevoir sur vente de titres
791 596.78Amounts receivable on subscriptions/Montants à recevoir sur souscriptions d'actions8 585 496.48Interest and dividends receivable, net/Intérêt et dividendes nets à recevoir
419 779.80Interest on swaps receivable/Intérêt à recevoir sur swaps9 505.29Formation/reorganisation expenses/Frais de constitution/réorganisation (2)
603 209 111.37LIABILITIES/PASSIF
342 264.20Bank overdrafts/Découverts bancaires1 273 771.65Payable on investments purchased/À payer sur achat de titres
123 852.25Amounts payable on redemptions/Montants à payer sur rachats d'actions462 061.23Management and distribution fees payable/Commission de gestion et de distribution à payer (3)121 480.68Taxes and expenses payable/Impôts et autres frais à payer842 088.83Unrealised depreciation on IRS/Moins-value non réalisée sur IRS (2)435 246.88Interest on swaps payable/Intérêt à payer sur swaps
15 122.79Payable on foreign exchange transactions, net/A payer sur opérations de change, net 4 119 299.89Unrealised depreciation on forward foreign currency exchange contracts/Moins-value non réalisée sur contrats de change à
terme(2)
7 735 188.40595 473 922.97NET ASSET VALUE/VALEUR NETTE D'INVENTAIRE
Statement of net assets as at 31/03/2019 / État de l'actif net au 31/03/2019
NotesNotes USD

The accompanying notes form an integral part of these financial statements.Les notes annexées font partie intégrante de ces états financiers.
79PrivilEdge - Ashmore Emerging Market Local Currency Bond · 31/03/2019
Statement of operations and changes in net assets for the period from 01/10/2018 to 31/03/2019 / État desopérations et des variations de l'actif net pour la période du 01/10/2018 au 31/03/2019
NotesNotes USD
531 246 936.54NET ASSET VALUE AT THE BEGINNING OF THE PERIOD/VALEUR NETTE D'INVENTAIRE AU DÉBUT DE LAPÉRIODE
INCOME/REVENUS
1 306 711.38Dividends, net/Dividendes, nets (2)18 151 949.10Interest on bonds, net/Intérêts sur obligations, nets (2)
235 617.62Bank interest/Intérêts bancaires19 694 278.10
EXPENSES/DÉPENSES
2 501 450.01Management fees/Commission de gestion (3)47 005.81Distribution fees/Frais de distribution (3)
9 450.87Bank interest and other expenses/Intérêts bancaires débiteurs et autres frais723 220.80Fixed Rate of Operational Costs/Taux Fixe de Coûts Opérationnels (4)
66 005.75Interest on swaps, net/Intérêts sur contrats de swaps, nets2 898.28Formation/Reorganisation expenses/Frais de constitution/réorganisation (2)
3 350 031.5216 344 246.58NET INVESTMENT INCOME/REVENU NET SUR INVESTISSEMENTS
(2 661 774.78)Net realised loss on sale of investments/Perte nette réalisée sur ventes d'investissements (2)(46 485.37)Net realised loss on swaps/Perte nette réalisée sur swaps (2)
(9 108 695.19)Net realised loss on foreign exchange/Perte nette réalisée sur opérations de change(6 277 693.61)Net realised loss on forward foreign currency exchange contracts/Perte nette réalisée sur contrats de change à terme(1 750 402.37)NET REALISED LOSS/PERTE NETTE RÉALISÉE
28 022 542.05Change in net unrealised appreciation or depreciation on investments/Variation de la plus ou moins-value nette non réaliséesur investissements
(2)
(431 346.59)Change in net unrealised appreciation or depreciation on IRS/Variation de la plus ou moins-value nette non réalisée sur IRS (2)(8 644 424.11)Change in net unrealised appreciation or depreciation on forward foreign currency exchange contracts/Variation de la plus ou
moins-value nette non réalisée sur contrats de change à terme17 196 368.98NET INCREASE IN NET ASSETS AS A RESULT OF OPERATIONS/AUGMENTATION NETTE DE L'ACTIF NET
RÉSULTANT DES OPÉRATIONS(3 834 073.88)Dividend paid/Dividende payé50 864 691.33Net subscriptions/(redemptions) including equalisation/Souscriptions/(rachats) nets incluant la régularisation
595 473 922.97NET ASSET VALUE AT THE END OF THE PERIOD/VALEUR NETTE D'INVENTAIRE À LA FIN DE LA PÉRIODE

The accompanying notes form an integral part of these financial statements.Les notes annexées font partie intégrante de ces états financiers.
80 PrivilEdge - Ashmore Emerging Market Local Currency Bond · 31/03/2019
931 492.6650 69 116.2070 (156 987.7230) 843 621.1490P - USD - Capitalisation94 455.0710 5 000.0000 (3 690.0710) 95 765.0000P - CHF - Hedged - Capitalisation
689 852.4090 325 913.1740 (212 578.5980) 803 186.9850P - EUR - Hedged - Capitalisation19 449.9190 0.0000 (8 499.9190) 10 950.0000P - EUR - Hedged - Distribution
8 417 362.4690 1 860 541.0850 (1 239 183.4970) 9 038 720.0570I - USD - Capitalisation37 000.0000 572 391.3410 (37 000.0000) 572 391.3410I - USD - Distribution
888 204.5780 20 500.0000 (352 898.0000) 555 806.5780I - CHF - Hedged - Capitalisation17 312 171.8210 4 402 194.1410 (2 841 595.2040) 18 872 770.7580M - USD - Capitalisation
3 536 526.6050 853 418.5350 (293 210.3810) 4 096 734.7590M - USD - Distribution2 532 901.6000 157 634.1780 (139 144.3390) 2 551 391.4390M - CHF - Hedged - Capitalisation
10 000.0000 0.0000 0.0000 10 000.0000M - CHF - Hedged - Distribution4 794 400.8630 670 407.0590 (454 845.4310) 5 009 962.4910M - EUR - Hedged - Capitalisation1 623 885.3050 273 594.0320 (97 689.8440) 1 799 789.4930M - EUR - Hedged - Distribution
654 543.0000 249 332.0000 (12 880.0000) 890 995.0000M - GBP - Distribution175 717.7080 60 820.6860 (38 789.5530) 197 748.8410M - GBP - Hedged - Capitalisation
54 339.2060 16 455.5590 0.0000 70 794.7650M - GBP - Hedged - Distribution2 703.0000 0.0000 (2 703.0000) 0.0000M - JPY - Hedged - Capitalisation
4 865 102.7130 1 862 751.0580 (862 472.4810) 5 865 381.2900N - USD - Capitalisation878 697.7320 322 877.5380 (592 481.1730) 609 094.0970N - USD - Distribution220 209.7640 100 000.0000 0.0000 320 209.7640N - CHF - Hedged - Capitalisation540 085.9480 0.0000 (31 646.1600) 508 439.7880N - EUR - Hedged - Capitalisation213 083.2880 0.0000 (136 672.5270) 76 410.7610N - EUR - Hedged - Distribution200 000.0000 0.0000 0.0000 200 000.0000N - GBP - Hedged - Capitalisation
Statement of changes in the number of shares outstanding for the period from 01/10/2018 to 31/03/2019 / Étatdes variations du nombre d'actions pour la période du 01/10/2018 au 31/03/2019
Number of Shares01/10/2018/
Nombre d'actions01/10/2018
Number of Sharesissued/
Nombre d'actionsémises
Number of Sharesredeemed/
Nombre d'actionsrachetées
Number of Shares31/03/2019/
Nombre d'actions31/03/2019
30/09/201831/03/2019For the period ended/Pour la période clôturée au
Statistics / Statistiques
30/09/2017
P - USD - Capitalisation
9 389 138.1411.1296
9 907 335.4510.6360
6 086 348.4411.7168
Net Asset Value/Valeur Nette d'InventaireNet Asset Value per share/Valeur Nette d'Inventaire par action
USD USD USD
P - CHF - Hedged - Capitalisation
991 528.3510.3538
952 356.3210.0826
499 830.2511.4793
Net Asset Value/Valeur Nette d'InventaireNet Asset Value per share/Valeur Nette d'Inventaire par action
CHF CHF CHF
P - EUR - Hedged - Capitalisation
8 373 044.6110.4248
6 992 575.6910.1363
4 328 901.6211.5101
Net Asset Value/Valeur Nette d'InventaireNet Asset Value per share/Valeur Nette d'Inventaire par action
EUR EUR EUR

The accompanying notes form an integral part of these financial statements.Les notes annexées font partie intégrante de ces états financiers.
81PrivilEdge - Ashmore Emerging Market Local Currency Bond · 31/03/2019
30/09/201831/03/2019For the period ended/Pour la période clôturée au
Statistics / Statistiques
30/09/2017
P - EUR - Hedged - Distribution
108 818.879.9378
0.47
197 151.4510.1364
0.00
0.000.0000
0.00
Net Asset Value/Valeur Nette d'InventaireNet Asset Value per share/Valeur Nette d'Inventaire par actionDividend per share paid to shareholders/Dividende par action payé aux actionnaires
EUR EUR EUR
I - USD - Capitalisation
102 490 293.4411.3390
90 849 662.6310.7931
102 465 116.7111.7952
Net Asset Value/Valeur Nette d'InventaireNet Asset Value per share/Valeur Nette d'Inventaire par action
USD USD USD
I - USD - Distribution
6 228 305.8410.8812
0.00
383 219.9610.3573
0.47
482 422.3811.7952
0.00
Net Asset Value/Valeur Nette d'InventaireNet Asset Value per share/Valeur Nette d'Inventaire par actionDividend per share paid to shareholders/Dividende par action payé aux actionnaires
USD USD USD
I - CHF - Hedged - Capitalisation
5 852 111.7610.5290
9 070 891.6010.2126
12 696 916.5611.5346
Net Asset Value/Valeur Nette d'InventaireNet Asset Value per share/Valeur Nette d'Inventaire par action
CHF CHF CHF
I - EUR - Hedged - Capitalisation
0.000.0000
0.000.0000
92 676.9011.5846
Net Asset Value/Valeur Nette d'InventaireNet Asset Value per share/Valeur Nette d'Inventaire par action
EUR EUR EUR
M - USD - Capitalisation
212 578 154.6111.2637
185 827 638.2810.7339
175 093 167.4311.7657
Net Asset Value/Valeur Nette d'InventaireNet Asset Value per share/Valeur Nette d'Inventaire par action
USD USD USD
M - USD - Distribution
42 113 700.1610.2798
0.53
36 521 576.1210.3270
0.44
34 942 916.8211.7657
0.00
Net Asset Value/Valeur Nette d'InventaireNet Asset Value per share/Valeur Nette d'Inventaire par actionDividend per share paid to shareholders/Dividende par action payé aux actionnaires
USD USD USD
M - CHF - Hedged - Capitalisation
26 703 137.2010.4661
25 742 803.6110.1634
20 017 777.0611.5135
Net Asset Value/Valeur Nette d'InventaireNet Asset Value per share/Valeur Nette d'Inventaire par action
CHF CHF CHF

The accompanying notes form an integral part of these financial statements.Les notes annexées font partie intégrante de ces états financiers.
82 PrivilEdge - Ashmore Emerging Market Local Currency Bond · 31/03/2019
30/09/201831/03/2019For the period ended/Pour la période clôturée au
Statistics / Statistiques
30/09/2017
M - CHF - Hedged - Distribution
94 497.439.4497
0.50
96 799.329.6799
0.43
114 037.0811.4037
0.00
Net Asset Value/Valeur Nette d'InventaireNet Asset Value per share/Valeur Nette d'Inventaire par actionDividend per share paid to shareholders/Dividende par action payé aux actionnaires
CHF CHF CHF
M - EUR - Hedged - Capitalisation
52 857 593.9810.5505
49 045 380.0710.2297
63 926 356.8411.5582
Net Asset Value/Valeur Nette d'InventaireNet Asset Value per share/Valeur Nette d'Inventaire par action
EUR EUR EUR
M - EUR - Hedged - Distribution
17 331 494.009.6297
0.52
16 012 222.789.8604
0.41
16 704 274.9811.5582
0.00
Net Asset Value/Valeur Nette d'InventaireNet Asset Value per share/Valeur Nette d'Inventaire par actionDividend per share paid to shareholders/Dividende par action payé aux actionnaires
EUR EUR EUR
M - GBP - Distribution
8 440 562.739.4732
0.48
6 211 832.889.4903
0.33
6 498 667.0710.4490
0.00
Net Asset Value/Valeur Nette d'InventaireNet Asset Value per share/Valeur Nette d'Inventaire par actionDividend per share paid to shareholders/Dividende par action payé aux actionnaires
GBP GBP GBP
M - GBP - Hedged - Capitalisation
2 138 747.4010.8155
1 830 909.0610.4196
1 186 640.2411.6394
Net Asset Value/Valeur Nette d'InventaireNet Asset Value per share/Valeur Nette d'Inventaire par action
GBP GBP GBP
M - GBP - Hedged - Distribution
699 144.539.8757
0.53
545 922.1310.0466
0.41
561 370.0011.6395
0.00
Net Asset Value/Valeur Nette d'InventaireNet Asset Value per share/Valeur Nette d'Inventaire par actionDividend per share paid to shareholders/Dividende par action payé aux actionnaires
GBP GBP GBP
M - JPY - Hedged - Capitalisation
00
27 035 32510 002
00
Net Asset Value/Valeur Nette d'InventaireNet Asset Value per share/Valeur Nette d'Inventaire par action
JPY JPY JPY
N - USD - Capitalisation
66 352 907.4211.3126
52 413 500.3910.7734
52 517 821.6411.7853
Net Asset Value/Valeur Nette d'InventaireNet Asset Value per share/Valeur Nette d'Inventaire par action
USD USD USD

The accompanying notes form an integral part of these financial statements.Les notes annexées font partie intégrante de ces états financiers.
83PrivilEdge - Ashmore Emerging Market Local Currency Bond · 31/03/2019
30/09/201831/03/2019For the period ended/Pour la période clôturée au
Statistics / Statistiques
30/09/2017
N - USD - Distribution
6 401 603.2310.5100
0.56
9 287 450.2710.5696
0.22
10 355 777.6611.7854
0.00
Net Asset Value/Valeur Nette d'InventaireNet Asset Value per share/Valeur Nette d'Inventaire par actionDividend per share paid to shareholders/Dividende par action payé aux actionnaires
USD USD USD
N - CHF - Hedged - Capitalisation
3 365 797.3710.5112
2 246 228.7010.2004
1 741 383.2911.5323
Net Asset Value/Valeur Nette d'InventaireNet Asset Value per share/Valeur Nette d'Inventaire par action
CHF CHF CHF
N - EUR - Hedged - Capitalisation
5 387 576.6410.5963
5 545 226.7210.2673
4 512 642.3111.5775
Net Asset Value/Valeur Nette d'InventaireNet Asset Value per share/Valeur Nette d'Inventaire par action
EUR EUR EUR
N - EUR - Hedged - Distribution
760 246.739.9495
0.56
2 174 331.7110.2041
0.07
1 582 323.6311.5775
0.00
Net Asset Value/Valeur Nette d'InventaireNet Asset Value per share/Valeur Nette d'Inventaire par actionDividend per share paid to shareholders/Dividende par action payé aux actionnaires
EUR EUR EUR
N - GBP - Hedged - Capitalisation
2 168 129.2210.8406
2 087 384.4810.4369
0.000.0000
Net Asset Value/Valeur Nette d'InventaireNet Asset Value per share/Valeur Nette d'Inventaire par action
GBP GBP GBP

The accompanying notes form an integral part of these financial statements.Les notes annexées font partie intégrante de ces états financiers.
84 PrivilEdge - Ashmore Emerging Market Local Currency Bond · 31/03/2019
Investments in securities at market value/Portefeuille-titres à la valeur de marché 559 936 203.78 94.03
BRASIL 10.00 18-29 05/01S12 620 3 455 086.16 0.58BRL
Transferable securities admitted to an official stock exchange listing and/or dealt in on anotherregulated market/Valeurs mobilières admises à la cote officielle d'une bourse de valeurs et/ounégociées sur un autre marché réglementé
534 285 814.24 89.72
BONDS/OBLIGATIONS 529 569 903.00 88.93
BRAZIL/BRÉSIL 89 774 511.94 15.07
BRAZIL -DY- 0.00 10-23 01/01S109 625 30 439 982.47 5.11BRLBRAZIL -DY- 0.00 14-25 01/01S54 739 15 257 433.87 2.56BRLBRAZIL -DY- 10.00 16-27 01/01S69 859 19 459 939.07 3.27BRLBRAZIL T BILL 17-21 01/07U84 629 18 483 165.28 3.10BRLBRESIL TREASURY BILLS 18-22 01/01U12 820 2 678 905.09 0.45BRL
CHILI 4.50 15-26 01/03S1 215 000 000 1 853 117.03 0.31CLP
CHILE/CHILI 14 590 853.45 2.45
CHILI -DY- 5.00 15-35 01/03S7 990 000 000 12 737 736.42 2.14CLP
COLOMBIA B 7.00 12-22 04/05A14 147 600 000 4 656 989.65 0.78COP
COLOMBIA/COLOMBIE 22 382 310.59 3.76
EMPRESA TELECOM. 7.00 13-23 17/01A10 330 000 000 2 908 901.21 0.49COPEMPRESAS REGS 8.375 17-27 08/11A23 841 000 000 7 588 183.25 1.28COPTITULOS DE TESORERIA 7.75 15-30 18/09A21 158 000 000 7 228 236.48 1.21COP
HUNGARY 1.75 17-22 26/10A237 000 000 839 840.26 0.14HUF
HUNGARY/HONGRIE 10 801 621.29 1.81
HUNGARY -B- 5.50 13-25 24/06A1 327 300 000 5 570 484.15 0.93HUFHUNGARY GOVT BD 3.00 15-24 26/06A1 181 720 000 4 391 296.88 0.74HUF
HOUSING DEVELOPMENT 7.00 16-20 09/01S420 000 000 5 996 590.11 1.01INR
INDIA/INDE 27 940 505.44 4.69
INDIA 7.72 15-25 25/05S190 000 000 2 815 539.30 0.47INRINDIA GOVT BOND 7.35 09-24 22/06S830 000 000 12 167 188.24 2.04INRREPUBLIQUE DE L'INDE 7.37 18-23 16/04S473 500 000 6 961 187.79 1.17INR
INDENOSIA 7.75 16-32 15/08A76 257 000 000 5 114 626.28 0.86IDR
INDONESIA/INDONÉSIE 70 298 361.03 11.81
INDENOSIA GOVT 7.00 11-27 15/05S68 507 000 000 4 631 630.00 0.78IDRINDONESIA 5.625 12-23 15/05S55 158 000 000 3 681 291.95 0.62IDRINDONESIA 8.25 16-36 15/05S37 069 000 000 2 649 495.64 0.44IDRINDONESIA -FR0056- 8.375 10-26 15/09S107 888 000 000 7 935 826.96 1.33IDRINDONESIA -FR0061- 7.00 11-22 15/05S23 033 000 000 1 617 970.76 0.27IDRINDONESIA FR0064 6.125 12-28 15/05M113 001 000 000 7 186 750.55 1.21IDRINDONESIA FR0068 8.375 13-34 15/03S115 551 000 000 8 327 216.26 1.41IDRINDONESIA FR53 8.25 10-21 15/07S70 760 000 000 5 123 141.87 0.86IDRINDONESIA GOV FR0073 8.75 15-31 15/05S40 920 000 000 3 061 642.77 0.51IDRINDONESIA GOVT 8.375 13-24 15/03S86 626 000 000 6 375 525.87 1.07IDRINDONESIA GVT -FR52 10.50 09-30 15/08S14 200 000 000 1 190 346.58 0.20IDRINDONESIE 6.625 12-33 15/05S49 648 000 000 3 063 043.68 0.51IDRINDONESIE 8.25 11-32 15/06S2 272 000 000 161 878.36 0.03IDRINDONESIE 8.25 18-29 27/09S51 030 000 000 3 744 719.43 0.63IDRINDONESIE 9.00 13-29 15/03S67 528 000 000 5 142 274.77 0.86IDRINDONESIE 7.50 17-38 15/05S19 542 000 000 1 290 979.30 0.22IDR
ALFA BANK 9.25 17-22 16/02S346 300 000 5 330 959.07 0.90RUB
IRELAND/IRLANDE 5 330 959.07 0.90
Schedule of investments as at 31/03/2019 / Inventaire du portefeuille au 31/03/2019
USD
Market ValueNumber of Shares orNominal Value
Investment % of Net AssetsQuotationCurrency
Valeur de marchéNombre d'actions ouvaleur nominale
Investissement % de l'actif netDevise decotation

The accompanying notes form an integral part of these financial statements.Les notes annexées font partie intégrante de ces états financiers.
85PrivilEdge - Ashmore Emerging Market Local Currency Bond · 31/03/2019
REPUBLICA ORIENT U 9.875 17-22 20/06S30 517 000 906 487.07 0.15UYU
LUXEMBOURG/LUXEMBOURG 906 487.07 0.15
MALAISIE 3.882 17-22 10/03S20 153 000 5 004 838.76 0.85MYR
MALAYSIA/MALAISIE 22 069 153.70 3.71
MALAISIE 4.642 18-33 07/11S5 287 000 1 375 936.48 0.23MYRMALAISIE S 0112 3.418 12-22 15/08S11 344 000 2 771 761.60 0.47MYRMALAYSIA 3.757 20.04.23S4 455 000 1 100 329.60 0.18MYRMALAYSIA GOVERNMEN 3.62 16-21 30/11S3 199 000 787 370.67 0.13MYRMALAYSIA GOVERNMEN 3.795 15-22 30/09S4 749 000 1 174 083.93 0.20MYRMALAYSIA GOVERNMEN 3.955000 15-25 15/09A6 933 000 1 720 753.97 0.29MYRMALAYSIAN GOV 0411 4.232 11-31 30/06S6 495 000 1 624 500.43 0.27MYRMALAYSIAN GOV-10/003 4.498 10-30 15/04S6 295 000 1 617 343.31 0.27MYRMALAYSIAN S.0114 4.181 14-24 15/07S18 234 000 4 574 675.78 0.77MYRMALAYSIAN 13/0004 3.844 13-33 15/04S1 329 000 317 559.17 0.05MYR
AMERIC MOVIL REGS 8.46 07-36 18/12S33 500 000 1 525 636.90 0.26MXN
MEXICO/MEXIQUE 75 274 706.81 12.64
COMISION FED DE ELEC 8.18 17-27 23/12S75 736 600 3 562 126.01 0.60MXNGRUPO TELEVISA 7.25 13-43 15/05S79 890 000 2 815 021.14 0.47MXNMEX BONOS DESARR FIX 10.00 05-24 05/12S4 885 700 27 658 367.39 4.63MXNMEXICAN BONOS 6.50 11-22 09/06S3 468 200 17 224 321.93 2.89MXNMEXICAN BONOS 7.50 06-27 03/06S748 600 3 740 121.92 0.63MXNMEXICAN BONOS 8.50 09-29 31/05S772 500 4 096 606.40 0.69MXNMEXICAN BONOS -M20 8.00 03-23 07/12S684 000 3 549 603.70 0.60MXNPEMEX 7.19 13-24 12/09S107 590 000 4 681 762.90 0.79MXNRED CARRETERAS OCC 9.0 13-28 10/06S128 830 000 6 421 138.52 1.08MXN
BANCO DE CREDITO 4.85 17-20 30/10S28 074 000 8 470 397.55 1.43PEN
PERU/PÉROU 23 150 419.82 3.89
FONDO MIVIV REGS 7.00 17-24 14/02S6 440 000 2 087 877.15 0.35PENPERU 6.15 17-32 12/08S6 379 000 2 020 066.53 0.34PENPERU BONO SOBERANO 6.90 07-37 12/08S23 457 000 7 889 928.81 1.32PENPERU (REP OF) REGS 6.95 08-31 12/08S7 947 000 2 682 149.78 0.45PEN
PHILIPPINES 4.95 10-21 15/01S10 000 000 190 293.13 0.03PHP
PHILIPPINES/PHILIPPINES 1 462 466.96 0.25
PHILIPPINES 6.25 11-36 14/01S24 000 000 499 145.68 0.08PHPPHILIPPINES REPU OF 3.90 12-22 26/11S42 000 000 773 028.15 0.14PHP
POLAND 3.25 13-25 25/07A16 962 000 4 650 749.12 0.78PLN
POLAND/POLOGNE 11 187 471.30 1.88
POLAND DS0726 2.50 15-26 25/07A23 949 000 6 230 724.87 1.05PLNPOLAND PS 0816 INDEXE 2.75 08-23 25/08A877 000 305 997.31 0.05PLN
ROMANIA 5.80 11-27 26/07A4 260 000 1 083 830.31 0.18RON
ROMANIA/ROUMANIE 1 083 830.31 0.18
RUSSIA 7.05 13-28 19/01S83 941 000 1 196 020.11 0.20RUB
RUSSIA/RUSSIE 29 677 521.12 4.98
RUSSIA GOVT BD 7.50 15-21 18/08S129 510 000 1 963 955.91 0.33RUBRUSSIA GOVT BOND 7.10 17-24 16/10S181 593 000 2 658 491.36 0.45RUBRUSSIA GOVT BOND - 8.50 16-31 17/09S305 339 000 4 736 469.22 0.80RUBRUSSIA GOVT BOND - 7.70 17-33 23/03S197 077 000 2 860 666.46 0.48RUBRUSSIAN FEDERAL BOND 6.5 18-22 28/02S144 975 000 2 077 702.06 0.35RUBRUSSIE (FED OF) 7.60 11-21 14/04S51 772 000 787 902.51 0.13RUBRUSSIE (FED OF) 7.75 16-26 16/09S498 200 000 7 454 330.07 1.24RUBRUSSIE FEDERATION 7.00 13-23 16/08S162 399 000 2 393 413.57 0.40RUBRUSSIE FEDERATION 7.40 17-22 07/12S236 531 000 3 548 569.85 0.60RUB
Schedule of investments as at 31/03/2019 / Inventaire du portefeuille au 31/03/2019
USD
Market ValueNumber of Shares orNominal Value
Investment % of Net AssetsQuotationCurrency
Valeur de marchéNombre d'actions ouvaleur nominale
Investissement % de l'actif netDevise decotation

The accompanying notes form an integral part of these financial statements.Les notes annexées font partie intégrante de ces états financiers.
86 PrivilEdge - Ashmore Emerging Market Local Currency Bond · 31/03/2019
AFRIQUE DU SUD R186 10.50 98-26 21/12S249 469 000 19 126 777.60 3.21ZAR
SOUTH AFRICA/AFRIQUE DU SUD 71 572 143.39 12.02
AFRIQUE DU SUD R2030 8.00 13-30 31/01S133 626 000 8 542 494.03 1.43ZARSOUTH AFRICA 6.25 06-36 31/03S6 920 000 348 670.48 0.06ZARSOUTH AFRICA 6.50 10-41 28/02S35 540 000 1 746 626.86 0.29ZARSOUTH AFRICA 7.00 10-31 28/02S176 667 000 10 268 184.83 1.72ZARSOUTH AFRICA 7.75 12-23 28/02S110 610 000 7 672 209.08 1.29ZARSOUTH AFRICA 8.25 14-32 31/03S45 749 000 2 906 038.03 0.49ZARSOUTH AFRICA 8.50 13-37 31/01S62 628 000 3 914 419.90 0.66ZARSOUTH AFRICA 8.75 14-44 31/01S103 867 000 6 536 047.56 1.10ZARSOUTH AFRICA (REP OF) 8.75 12-48 28/02S103 989 000 6 542 282.52 1.10ZARSOUTH AFRICA 2040 9.00 15-40 31/01S61 424 000 3 968 392.50 0.67ZAR
MIN OF FIN THAILAND 3.30 18-38 17/06S86 272 000 2 846 499.85 0.48THB
THAILAND/THAÏLANDE 39 317 309.34 6.60
MINISTRY FINANCE 2.4 18-23 17/08S63 476 000 2 029 131.51 0.34THBMINISTRY FIN.THAILAND 2.875 16-46 17/06S24 637 000 744 342.74 0.13THBMINISTRY OF FINANCE 3.85 10-25 12/12S41 020 000 1 420 169.45 0.24THBTHAILAND GOVERN 2.8750 18-28 17/12S201 690 000 6 595 487.67 1.11THBTHAILAND GOVT 2.125 16-26 17/12S63 636 000 1 975 513.01 0.33THBTHAILAND GOVT 3.40 15-36 17/06S83 449 000 2 814 861.77 0.47THBTHAILAND GOVT 3.625 10-23 16/06S81 995 000 2 749 848.62 0.46THBTHAILAND GOVT 3.65 10-31 20/06S30 136 000 1 050 026.02 0.18THBTHAILAND GOVT 3.775 12-32 25/06S227 425 000 7 982 268.77 1.34THBTHAILAND GOVT 4.875 09-29 22/06S18 942 000 723 909.12 0.12THBTHAILAND GOVT BOND 2.00 17-22 17/12S202 007 000 6 377 525.89 1.07THBTHAILAND GOVT INDEXEE 1.20 11-21 14/07S16 500 000 557 663.03 0.09THBTHAILAND GOVT INDEXEE 1.25 13-28 12/03S47 236 000 1 450 061.89 0.24THB
TURKEY 11.00 17-27 24/02S10 884 980 1 364 746.33 0.23TRY
TURKEY/TURQUIE 12 325 736.62 2.07
TURKEY 8.00 15-25 12/03S8 830 000 968 899.83 0.16TRYTURKEY 8.50 12-22 14/09S2 759 000 368 252.67 0.06TRYTURKEY 8.80 13-23 27/09S3 952 000 460 241.48 0.08TRYTURKEY 10.70 17-22 17/08S5 939 868 793 707.09 0.13TRYTURKEY 11.00 17-22 02/03S11 510 000 1 577 715.91 0.26TRYTURKEY(REP.OF) 10.40 14-24 20/03S3 050 000 387 048.31 0.06TRYTURQUIE 10.50 17-27 11/08S3 614 000 418 179.22 0.07TRYTURQUIE INDEXEE 3.00 12-22 23/02S5 473 400 1 867 768.54 0.32TRYTURQUIE (REPU OF ) 7.10 13-23 08/03A24 186 450 2 707 876.92 0.46TRYTURQUIE (REPU OF ) 9.50 12-22 12/01S10 596 000 1 411 300.32 0.24TRY
REPUBLICA ORIENT U 8.500 17-28 15/03S16 304 000 423 533.75 0.07UYU
URUGUAY/URUGUAY 423 533.75 0.07
ARGENTINA POLITICA-DY-FL.R 17-20 21/06Q59 814 691 1 565 152.56 0.27ARS
FLOATING RATE NOTES/OBLIGATIONS À TAUX VARIABLE 4 715 911.24 0.79
ARGENTINA/ARGENTINE 4 715 911.24 0.79
CITY OF BUENOS AIRES FL.R 17-24 29/0338 168 171 790 163.46 0.13ARSPROVINCIA DE BU AIRE FL.R 18-25 12/04Q55 292 000 1 260 752.77 0.21ARSREPUBLIC OF ARG-DY- FL.R 17-22 03/04Q44 346 150 1 099 842.45 0.18ARS
COLOMBIA 6.00 12-28 28/04A10 130 000 000 3 091 521.47 0.52COP
Other transferable securities/Autres valeurs mobilières 19 742 267.18 3.32
BONDS/OBLIGATIONS 19 742 267.18 3.32
COLOMBIA/COLOMBIE 14 060 960.75 2.37
Schedule of investments as at 31/03/2019 / Inventaire du portefeuille au 31/03/2019
USD
Market ValueNumber of Shares orNominal Value
Investment % of Net AssetsQuotationCurrency
Valeur de marchéNombre d'actions ouvaleur nominale
Investissement % de l'actif netDevise decotation

The accompanying notes form an integral part of these financial statements.Les notes annexées font partie intégrante de ces états financiers.
87PrivilEdge - Ashmore Emerging Market Local Currency Bond · 31/03/2019
COLOMBIA 10.00 08-24 24/07A8 232 500 000 3 074 743.38 0.52COPCOLOMBIE 6.25 17-25 26/11A10 084 900 000 3 211 231.82 0.54COPTITULOS DE TESO 7.2500 19-34 18/10A4 947 500 000 1 611 601.20 0.27COPTITULOS DE TESORER 7 17-32 30/06A9 618 100 000 3 071 862.88 0.52COP
HOUSING DEV FIN 8.2200 19-22 28/03A220 000 000 3 178 957.71 0.53INR
INDIA/INDE 3 178 957.71 0.53
BONOS DE TESORE 5.9400 18-29 12/02S7 894 000 2 502 348.72 0.42PEN
PERU/PÉROU 2 502 348.72 0.42
EGYP TREA BILL ZCP 13-08-1916 300 000 858 499.11 0.14EGP
Money market instruments/Instruments du marché monétaire 5 908 122.36 0.99
BONDS/OBLIGATIONS 5 908 122.36 0.99
EGYPT/EGYPTE 5 908 122.36 0.99
EGYPT TREASURY BILLS ZCP 16071923 425 000 1 249 038.70 0.21EGPEGYPT TREASURY BILLS ZCP 22101962 350 000 3 195 152.62 0.54EGPEGYPT TREASURY BILLS ZCP 30071911 425 000 605 431.93 0.10EGP
Schedule of investments as at 31/03/2019 / Inventaire du portefeuille au 31/03/2019
USD
Market ValueNumber of Shares orNominal Value
Investment % of Net AssetsQuotationCurrency
Valeur de marchéNombre d'actions ouvaleur nominale
Investissement % de l'actif netDevise decotation
810 000 000.00 6.56% (362 318.25)13/12/2023 INR OIS OVERNIGHTCOMPOUNDED
INR (0.06)HSBC BANKLONDRES
277 000 000.00 8.20% (169 369.49)06/12/2028 MXN TIIE 28DMXN (0.03)HSBC BANKLONDRES
225 000 000.00 8.40% (296 105.11)06/12/2028 MXN TIIE 28DMXN (0.05)HSBC BANKLONDRES
41 850 000.00 PLN WIBOR 6 MONTHS 214 614.6526/03/2023 2.39%PLN 0.04BNP-PARIBAS SAPARIS
315 200 000.00 MXN TIIE 28D (228 910.63)14/06/2023 7.33%MXN (0.04)BNP PARIBASLONDON BRANCHGB
Interest rate swap (IRS)/Interest rate swap (IRS) (842 088.83) (0.14)
Sub-Fund receivesNominal Unrealisedappreciation/
(depreciation)
Currency Maturity Sub-Fund pays % of netassets
Counterparty
Compartiment reçoitNominal Plus-value/(moins-
value) nonréalisée
Devise Maturité Compartiment paie % de l'actifnet
Contrepartie
USD
Forward Foreign Currency Exchange Contracts/Contrats de change à terme (0.69)(4 119 299.89)USD 23 588 263.40 0.00BRL 9 834.376 071 000.00 02/04/2019Deutsche BankUSD 54 026 431.98 0.00BRL 6 081.6813 888 542.92 02/04/2019Hsbc BankBRL 736 200.00 0.00USD (18 785.53)2 791 964.88 02/04/2019Morgan StanleyUSD 10 461 854.71 0.02BRL 114 460.292 802 705.42 02/04/2019BNP
USD
Unrealised appreciation/(depreciation)
Currency % of NetAssets
Amount bought Maturity Currency Amount soldCounterparty
Plus/(Moins) value non-réalisée
Devise % de l'actifnet
Montant acheté Maturité Devise Montant venduContrepartie

The accompanying notes form an integral part of these financial statements.Les notes annexées font partie intégrante de ces états financiers.
88 PrivilEdge - Ashmore Emerging Market Local Currency Bond · 31/03/2019
Schedule of investments as at 31/03/2019 / Inventaire du portefeuille au 31/03/2019
BRL 2 057 900.00 (0.01)USD (77 736.17)7 706 211.81 02/04/2019Goldman SachsBRL 24 565 617.81 (0.16)USD (1 016 938.27)91 644 493.80 02/04/2019BNPUSD 14 066 120.40 0.02BRL 102 203.703 716 589.55 02/04/2019Morgan StanleyUSD 49 171 416.00 0.01ARS 45 907.511 168 800.00 08/04/2019BNPARS 845 000.00 (0.01)USD (43 696.26)35 067 500.00 08/04/2019BNPUSD 73 876 374.00 0.01ARS 41 971.151 722 060.00 11/04/2019JP MorganARS 1 175 000.00 (0.01)USD (64 770.25)48 786 000.00 11/04/2019Goldman SachsARS 1 175 000.00 (0.02)USD (92 638.58)47 822 500.00 15/04/2019Goldman SachsEUR 100 107 598.76 (0.15)USD (876 965.62)88 276 720.33 15/04/2019Caceis BankUSD 1 426 027.54 0.00CHF (5 290.80)1 428 364.26 15/04/2019Caceis BankUSD 3 490 847.93 0.00EUR 8 632.233 932 652.53 15/04/2019Caceis BankCHF 38 330 531.81 0.04USD 267 657.0238 392 623.35 15/04/2019Caceis BankGBP 6 895 766.25 (0.02)USD (108 736.94)5 205 068.91 15/04/2019Caceis BankUSD 170 034.93 0.00GBP 1 843.14223 557.42 15/04/2019Caceis BankARS 756 755.11 (0.01)USD (59 914.58)31 087 500.00 22/04/2019BNPUSD 19 226 564 241.00 0.01COP 44 473.646 069 690.84 30/04/2019Deutsche BankUSD 413 764 105.65 0.01INR 58 352.686 000 929.74 30/04/2019Deutsche BankUSD 1 867 386 673.48 (0.14)INR (857 275.30)25 968 181.55 30/04/2019BNPUSD 205 648 822.49 0.00RUB (23 295.60)3 092 510.00 30/04/2019Morgan StanleyCLP 335 000.00 0.00USD (14 661.82)217 969 928.00 30/04/2019BNPCNH 501 100.00 0.00USD (1 751.75)3 355 994.00 30/04/2019Morgan StanleyRON 220 100.00 0.00USD (2 522.86)927 065.38 30/04/2019Deutsche BankRUB 4 556 164.32 0.01USD 69 786.26305 331 351.59 30/04/2019Goldman SachsTHB 1 053 900.00 0.00USD (17 463.30)32 868 069.95 30/04/2019JP MorganTHB 5 444 959.61 (0.02)USD (93 978.69)169 693 349.70 30/04/2019Goldman SachsUSD 3 965 162 880.00 0.02CLP 124 615.925 952 000.00 30/04/2019Morgan StanleyUSD 31 098 627.44 0.00CNH (16 556.70)4 610 700.00 30/04/2019Morgan StanleyUSD 22 415 283.24 0.00MXN 1 865.501 152 273.95 30/04/2019Morgan StanleyUSD 616 106 113.52 0.03MXN 151 736.3731 771 395.98 30/04/2019Hsbc BankUSD 1 053 156.00 0.00PEN (2 681.40)314 000.00 30/04/2019BNPCLP 217 100.00 0.00USD (6 788.74)143 103 551.00 30/04/2019Goldman SachsHUF 260 000.00 0.00USD (9 331.92)71 650 389.20 30/04/2019JP MorganMXN 4 688 609.11 0.00USD (29 044.43)90 789 138.94 30/04/2019Hsbc BankPLN 1 902 960.00 (0.01)USD (54 932.39)7 078 816.49 30/04/2019BNPUSD 864 243 908.00 0.00COP 2 163.69273 000.00 30/04/2019BNPUSD 119 722 081 189.00 0.02IDR 100 227.358 457 935.80 30/04/2019JP MorganUSD 24 057 572.50 0.00MXN 15 364.801 250 000.00 30/04/2019Goldman SachsUSD 4 231 713.95 0.00PLN 4 325.401 109 079.39 30/04/2019BNPUSD 45 983 274.24 0.00RUB (645.13)696 030.79 30/04/2019JP MorganUSD 539 392 952.50 0.01RUB 81 179.728 252 914.55 30/04/2019Hsbc BankZAR 4 692 146.69 (0.01)USD (83 288.42)66 689 294.65 30/04/2019Morgan StanleyZAR 715 000.00 0.00USD (1 614.78)10 322 547.24 30/04/2019Deutsche BankCZK 6 125 335.07 (0.01)USD (74 654.34)139 086 077.82 30/04/2019Deutsche BankCNH 652 318.00 0.00USD 4 286.324 412 872.56 30/04/2019BNPCZK 712 300.00 0.00USD (11 282.17)16 114 190.29 30/04/2019Hsbc BankINR 4 887 170.03 0.02USD 145 938.84350 422 941.67 30/04/2019BNPMXN 964 000.00 0.00USD (2 304.07)18 738 133.64 30/04/2019Goldman SachsMYR 885 060.46 0.00USD (4 123.32)3 595 027.10 30/04/2019Deutsche BankPLN 1 286 500.00 0.00USD (3 500.72)4 914 491.75 30/04/2019Morgan StanleyPLN 6 492 800.00 (0.01)USD (32 097.05)24 747 536.35 30/04/2019Deutsche BankRON 11 497 066.14 (0.03)USD (168 971.00)48 267 409.53 30/04/2019BNPTRY 1 684 600.00 (0.02)USD (94 000.71)9 280 655.96 30/04/2019BNPUSD 1 675 953 544.00 0.01CLP 76 940.942 540 000.00 30/04/2019Goldman SachsUSD 21 255 020 000.00 0.00IDR (3 923.93)1 480 000.00 30/04/2019BNPUSD 2 941 773.66 0.00PEN 3 785.78888 350.79 30/04/2019Deutsche BankZAR 3 159 000.00 (0.01)USD (66 752.08)44 744 233.95 30/04/2019Goldman SachsZAR 6 438 490.00 (0.01)USD (83 599.24)91 954 049.68 30/04/2019BNPZAR 540 300.00 0.00USD (16 603.60)7 577 786.38 30/04/2019Hsbc Bank
USD
Unrealised appreciation/(depreciation)
Currency % of NetAssets
Amount bought Maturity Currency Amount soldCounterparty
Plus/(Moins) value non-réalisée
Devise % de l'actifnet
Montant acheté Maturité Devise Montant venduContrepartie

The accompanying notes form an integral part of these financial statements.Les notes annexées font partie intégrante de ces états financiers.
89PrivilEdge - Ashmore Emerging Market Local Currency Bond · 31/03/2019
Schedule of investments as at 31/03/2019 / Inventaire du portefeuille au 31/03/2019
ARS 1 230 384.17 (0.01)USD (73 079.15)52 208 553.00 30/04/2019Hsbc BankCLP 12 317 726.73 (0.03)USD (171 587.05)8 264 682 129.00 30/04/2019Hsbc BankCNH 8 002 682.00 0.01USD 62 640.4154 205 003.97 30/04/2019Hsbc BankCOP 3 650 880.00 (0.01)USD (53 871.62)11 477 961 667.00 30/04/2019Deutsche BankPEN 426 200.00 0.00USD (1 764.69)1 411 522.49 30/04/2019Goldman SachsRON 223 900.00 0.00USD (2 794.93)942 097.42 30/04/2019Goldman SachsTRY 822 900.00 (0.01)USD (46 732.37)4 528 698.57 30/04/2019Hsbc BankUSD 284 821 835.00 0.00HUF 21 222.211 017 712.71 30/04/2019Deutsche BankUSD 19 803 079.54 (0.01)PEN (43 888.21)5 910 837.70 30/04/2019JP MorganUSD 8 809 613.34 0.01TRY 85 430.351 592 526.27 30/04/2019Morgan StanleyUSD 24 693 011.17 0.02ZAR 135 415.511 841 480.00 30/04/2019Morgan StanleyUSD 27 691 167.50 0.00ZAR (7 867.97)1 905 877.72 30/04/2019BNPUSD 144 272 525.80 0.06ZAR 377 768.7010 347 086.12 30/04/2019Hsbc BankCOP 677 900.00 0.00USD (23 975.12)2 086 657 548.00 30/04/2019Morgan StanleyCOP 8 078 372.80 (0.03)USD (178 415.91)25 208 560 128.00 30/04/2019Hsbc BankIDR 290 000.00 0.00USD (3 395.95)4 105 240 000.00 30/04/2019Deutsche BankPEN 862 600.00 0.00USD 2 814.732 878 064.90 30/04/2019Hsbc BankPLN 11 929 547.81 (0.03)USD (184 904.46)44 987 517.71 30/04/2019Goldman SachsTHB 477 500.00 0.00USD (7 871.39)14 893 129.50 30/04/2019BNPTRY 9 603 038.61 (0.05)USD (298 214.21)54 290 778.79 30/04/2019JP MorganUSD 5 534 298 317.00 0.01COP 51 470.591 785 741.40 30/04/2019Morgan StanleyUSD 7 164 881.56 0.01RON 57 759.871 739 260.00 30/04/2019Hsbc BankUSD 31 383 912.78 0.00THB 15 361.561 005 008.82 30/04/2019JP MorganUSD 5 237 734.25 0.01TRY 53 856.57949 799.47 30/04/2019Hsbc BankUSD 145 107 191.82 0.03ZAR 205 848.8810 233 426.06 30/04/2019Deutsche BankCZK 1 102 170.00 0.00USD (759.87)25 317 947.07 30/04/2019JP MorganMXN 2 634 600.00 0.00USD (813.34)51 317 931.99 30/04/2019BNPRUB 6 757 305.95 0.01USD 87 454.65451 781 741.47 30/04/2019Morgan StanleyUSD 4 913 377 774.00 0.01COP 31 501.241 571 220.00 30/04/2019Goldman SachsUSD 5 244 116 061.00 0.01COP 34 151.881 677 514.09 30/04/2019Hsbc BankUSD 220 000 000.00 0.00INR 16 673.193 176 436.62 30/04/2019Hsbc BankUSD 124 043 965.67 (0.01)MXN (41 186.77)6 325 290.00 30/04/2019Deutsche BankUSD 3 688 453.44 0.00RON (89.75)865 570.00 30/04/2019JP MorganHUF 5 814 725.87 (0.02)USD (142 494.82)1 621 337 534.58 30/04/2019BNPRUB 2 149 800.00 0.00USD 17 115.05143 025 111.96 30/04/2019BNPRUB 1 837 988.02 0.00USD 14 765.26122 289 171.10 30/04/2019Hsbc BankTHB 4 058 309.60 (0.01)USD (60 795.31)126 771 446.24 30/04/2019Hsbc BankUSD 170 093 000.00 0.01ARS 83 100.803 850 000.00 30/04/2019Deutsche BankUSD 30 445 799.00 0.00CNH (12 120.38)4 518 000.00 30/04/2019Hsbc BankUSD 97 243 475.00 0.00HUF 9 774.26350 000.00 30/04/2019Hsbc BankUSD 17 471 195.00 0.00INR (5 967.62)245 000.00 30/04/2019Goldman SachsUSD 4 998 091.85 0.00PLN 19 056.641 323 897.52 30/04/2019Deutsche BankUSD 66 980 855.94 0.00RUB (13 231.30)1 001 628.47 30/04/2019Goldman SachsCOP 4 313 700.00 (0.01)USD (86 334.70)13 489 414 407.00 30/04/2019Goldman SachsCZK 2 723 020.00 (0.01)USD (52 013.17)61 398 027.93 30/04/2019BNPHUF 3 244 900.00 (0.01)USD (74 740.72)906 151 068.64 30/04/2019Hsbc BankTRY 675 300.00 (0.01)USD (35 812.79)3 731 210.53 30/04/2019Morgan StanleyBRL 13 864 307.12 0.00USD (7 056.72)54 026 431.98 03/05/2019Hsbc BankUSD 8 896 539.96 0.00BRL (4 222.61)2 277 660.00 03/05/2019BNPUSD 11 116 228.05 0.00BRL (27 833.64)2 823 420.00 03/05/2019Deutsche BankUSD 54 192 138 269.00 0.00IDR 18 269.223 781 897.95 31/05/2019Goldman SachsUSD 34 215 628 000.00 0.00IDR (2 418.98)2 374 000.00 31/05/2019BNPPLN 12 600 163.69 (0.01)USD (64 359.35)47 970 524.19 31/05/2019Deutsche BankPLN 13 124 229.10 (0.01)USD (76 759.27)49 928 504.77 31/05/2019Hsbc BankCNH 11 912 335.99 0.00USD (6 559.11)80 021 116.97 31/05/2019BNPUSD 219 760 800.00 (0.02)INR (96 861.93)3 048 000.00 31/05/2019Goldman SachsUSD 220 357 328.00 (0.02)INR (104 463.95)3 049 000.00 31/05/2019Deutsche BankCZK 6 531 736.16 (0.02)USD (137 230.27)146 866 087.63 31/05/2019BNP
USD
Unrealised appreciation/(depreciation)
Currency % of NetAssets
Amount bought Maturity Currency Amount soldCounterparty
Plus/(Moins) value non-réalisée
Devise % de l'actifnet
Montant acheté Maturité Devise Montant venduContrepartie

The accompanying notes form an integral part of these financial statements.Les notes annexées font partie intégrante de ces états financiers.
90 PrivilEdge - Ashmore Emerging Market Local Currency Bond · 31/03/2019
Schedule of investments as at 31/03/2019 / Inventaire du portefeuille au 31/03/2019
INR 5 971 000.00 0.01USD 77 870.26422 806 510.00 31/05/2019Hsbc BankRON 2 149 868.88 0.00USD (28 184.09)9 050 087.99 31/05/2019BNPUSD 19 707 474 388.00 0.00IDR 2 227.691 370 954.74 31/05/2019Hsbc BankUSD 29 500 000 000.00 0.00IDR (8 006.33)2 040 957.52 31/05/2019JP MorganTRY 726 236.62 (0.01)USD (34 423.15)4 132 940.00 31/05/2019JP MorganHUF 6 647 836.00 (0.03)USD (172 098.73)1 846 835 318.98 31/05/2019Hsbc BankUSD 104 604 802.48 0.00ZAR (7 048.04)7 195 564.71 31/05/2019Deutsche BankRUB 5 622 886.86 0.00USD (17 738.57)371 419 791.48 31/05/2019Hsbc BankRON 2 582 355.07 (0.01)USD (35 126.50)10 875 588.37 28/06/2019JP MorganPLN 4 002 542.78 (0.01)USD (40 050.17)15 150 344.89 28/06/2019JP MorganCZK 9 144 670.75 (0.03)USD (172 469.32)205 909 636.70 28/06/2019BNPPLN 4 000 830.49 (0.01)USD (38 337.88)15 150 344.88 28/06/2019BNPHUF 6 742 858.84 (0.04)USD (253 785.39)1 846 835 319.00 28/06/2019Hsbc BankUSD 92 035 304.31 0.00BRL 18 392.3223 199 058.36 03/12/2019BNP
USD
Unrealised appreciation/(depreciation)
Currency % of NetAssets
Amount bought Maturity Currency Amount soldCounterparty
Plus/(Moins) value non-réalisée
Devise % de l'actifnet
Montant acheté Maturité Devise Montant venduContrepartie

PrivilEdgeis an investment company
with variable capital ("SICAV")incorporated in Luxembourg
PrivilEdgeest une société d’investissement
à capital variable ("SICAV")enregistrée au Luxembourg RCS Luxembourg B0181207
PrivilEdge –Baird US Aggregate Bond
Unaudited semi-annual report · Rapport semestriel non révisé
31.03.2019

The accompanying notes form an integral part of these financial statements.Les notes annexées font partie intégrante de ces états financiers.
92 PrivilEdge - Baird US Aggregate Bond · 31/03/2019
ASSETS/ACTIF
40 913 673.96Investments in securities at market value/Portefeuille-titres à la valeur de marché (2):( USD )41 556 971.17Acquisition cost/Coût d'acquisition
987 608.00Cash and term deposits/Liquidité et dépôts à terme41 373.60Amounts receivable on subscriptions/Montants à recevoir sur souscriptions d'actions
277 075.54Interest and dividends receivable, net/Intérêt et dividendes nets à recevoir9 505.29Formation/reorganisation expenses/Frais de constitution/réorganisation (2)
42 229 236.39LIABILITIES/PASSIF
5.72Bank overdrafts/Découverts bancaires713 415.92Payable on investments purchased/À payer sur achat de titres
17 359.62Management and distribution fees payable/Commission de gestion et de distribution à payer (3)6 327.06Taxes and expenses payable/Impôts et autres frais à payer
11 374.07Unrealised depreciation on forward foreign currency exchange contracts/Moins-value non réalisée sur contrats de change àterme
(2)
748 482.3941 480 754.00NET ASSET VALUE/VALEUR NETTE D'INVENTAIRE
Statement of net assets as at 31/03/2019 / État de l'actif net au 31/03/2019
NotesNotes USD

The accompanying notes form an integral part of these financial statements.Les notes annexées font partie intégrante de ces états financiers.
93PrivilEdge - Baird US Aggregate Bond · 31/03/2019
Statement of operations and changes in net assets for the period from 01/10/2018 to 31/03/2019 / État desopérations et des variations de l'actif net pour la période du 01/10/2018 au 31/03/2019
NotesNotes USD
43 158 583.77NET ASSET VALUE AT THE BEGINNING OF THE PERIOD/VALEUR NETTE D'INVENTAIRE AU DÉBUT DE LAPÉRIODE
INCOME/REVENUS
722 391.55Interest on bonds, net/Intérêts sur obligations, nets (2)6 157.83Bank interest/Intérêts bancaires
728 549.38EXPENSES/DÉPENSES
109 802.59Management fees/Commission de gestion (3)1.88Bank interest and other expenses/Intérêts bancaires débiteurs et autres frais
41 506.03Fixed Rate of Operational Costs/Taux Fixe de Coûts Opérationnels (4)2 898.28Formation/Reorganisation expenses/Frais de constitution/réorganisation (2)
154 208.78574 340.60NET INVESTMENT INCOME/REVENU NET SUR INVESTISSEMENTS
(192 527.77)Net realised loss on sale of investments/Perte nette réalisée sur ventes d'investissements (2)12 328.35Net realised gain on foreign exchange/Gain net réalisé sur opérations de change
(107 711.70)Net realised loss on forward foreign currency exchange contracts/Perte nette réalisée sur contrats de change à terme286 429.48NET REALISED GAIN/GAIN NET RÉALISÉ
1 482 520.52Change in net unrealised appreciation or depreciation on investments/Variation de la plus ou moins-value nette non réaliséesur investissements
(2)
6 545.51Change in net unrealised appreciation or depreciation on forward foreign currency exchange contracts/Variation de la plus oumoins-value nette non réalisée sur contrats de change à terme
1 775 495.51NET INCREASE IN NET ASSETS AS A RESULT OF OPERATIONS/AUGMENTATION NETTE DE L'ACTIF NETRÉSULTANT DES OPÉRATIONS
(70 367.56)Dividend paid/Dividende payé(3 382 957.72)Net subscriptions/(redemptions) including equalisation/Souscriptions/(rachats) nets incluant la régularisation41 480 754.00NET ASSET VALUE AT THE END OF THE PERIOD/VALEUR NETTE D'INVENTAIRE À LA FIN DE LA PÉRIODE

The accompanying notes form an integral part of these financial statements.Les notes annexées font partie intégrante de ces états financiers.
94 PrivilEdge - Baird US Aggregate Bond · 31/03/2019
1 120 000.0000 0.0000 0.0000 1 120 000.0000I - USD - Capitalisation1 916 780.4610 156 743.0000 (297 004.1200) 1 776 519.3410M - USD - Capitalisation
279 156.0000 38 782.4010 (43 091.0000) 274 847.4010M - USD - Distribution16 000.0000 0.0000 (5 000.0000) 11 000.0000M - CHF - Hedged - Capitalisation
222 903.5740 0.0000 (138 010.0000) 84 893.5740M - EUR - Hedged - Capitalisation30 800.0000 0.0000 (15 100.0000) 15 700.0000M - GBP - Hedged - Capitalisation20 500.0000 0.0000 (17 000.0000) 3 500.0000M - GBP - Hedged - Distribution
719 068.1790 0.0000 0.0000 719 068.1790N - USD - Capitalisation
Statement of changes in the number of shares outstanding for the period from 01/10/2018 to 31/03/2019 / Étatdes variations du nombre d'actions pour la période du 01/10/2018 au 31/03/2019
Number of Shares01/10/2018/
Nombre d'actions01/10/2018
Number of Sharesissued/
Nombre d'actionsémises
Number of Sharesredeemed/
Nombre d'actionsrachetées
Number of Shares31/03/2019/
Nombre d'actions31/03/2019
30/09/201831/03/2019For the period ended/Pour la période clôturée au
Statistics / Statistiques
30/09/2017
I - USD - Capitalisation
11 654 564.9710.4059
11 131 057.439.9384
10 095 616.9610.0956
Net Asset Value/Valeur Nette d'InventaireNet Asset Value per share/Valeur Nette d'Inventaire par action
USD USD USD
M - USD - Capitalisation
18 364 719.4610.3375
18 947 851.079.8852
25 875 906.5610.0697
Net Asset Value/Valeur Nette d'InventaireNet Asset Value per share/Valeur Nette d'Inventaire par action
USD USD USD
M - USD - Distribution
2 715 496.069.8800
0.24
2 704 714.949.6889
0.20
3 691 172.9210.0697
0.00
Net Asset Value/Valeur Nette d'InventaireNet Asset Value per share/Valeur Nette d'Inventaire par actionDividend per share paid to shareholders/Dividende par action payé aux actionnaires
USD USD USD
M - CHF - Hedged - Capitalisation
105 960.009.6327
150 049.269.3781
474 902.879.8528
Net Asset Value/Valeur Nette d'InventaireNet Asset Value per share/Valeur Nette d'Inventaire par action
CHF CHF CHF
M - EUR - Hedged - Capitalisation
826 702.529.7381
2 108 760.099.4604
1 500 834.649.8941
Net Asset Value/Valeur Nette d'InventaireNet Asset Value per share/Valeur Nette d'Inventaire par action
EUR EUR EUR

The accompanying notes form an integral part of these financial statements.Les notes annexées font partie intégrante de ces états financiers.
95PrivilEdge - Baird US Aggregate Bond · 31/03/2019
30/09/201831/03/2019For the period ended/Pour la période clôturée au
Statistics / Statistiques
30/09/2017
M - GBP - Hedged - Capitalisation
156 649.369.9777
296 578.979.6292
315 936.959.9665
Net Asset Value/Valeur Nette d'InventaireNet Asset Value per share/Valeur Nette d'Inventaire par action
GBP GBP GBP
M - GBP - Hedged - Distribution
33 342.739.5265
0.25
193 633.329.4455
0.19
581 056.399.9667
0.00
Net Asset Value/Valeur Nette d'InventaireNet Asset Value per share/Valeur Nette d'Inventaire par actionDividend per share paid to shareholders/Dividende par action payé aux actionnaires
GBP GBP GBP
N - USD - Capitalisation
7 463 742.9210.3797
7 132 734.279.9194
7 299 990.7910.0864
Net Asset Value/Valeur Nette d'InventaireNet Asset Value per share/Valeur Nette d'Inventaire par action
USD USD USD

The accompanying notes form an integral part of these financial statements.Les notes annexées font partie intégrante de ces états financiers.
96 PrivilEdge - Baird US Aggregate Bond · 31/03/2019
Investments in securities at market value/Portefeuille-titres à la valeur de marché 40 913 673.96 98.63
MACQUARIE BANK LTD 6.625 11-21 07/04S175 000 186 467.75 0.45USD
Transferable securities admitted to an official stock exchange listing and/or dealt in on anotherregulated market/Valeurs mobilières admises à la cote officielle d'une bourse de valeurs et/ounégociées sur un autre marché réglementé
40 561 923.96 97.78
BONDS/OBLIGATIONS 25 607 120.67 61.73
AUSTRALIA/AUSTRALIE 186 467.75 0.45
NORDEA BANK 4.25 12-22 21/09S250 000 255 732.50 0.62USD
FINLAND/FINLANDE 255 732.50 0.62
BPCE 144A SUB 5.70 13-23 22/10S325 000 347 174.75 0.84USD
FRANCE/FRANCE 762 462.75 1.84
PERNOD RICARD 144A 4.25 12-22 15/07S400 000 415 288.00 1.00USD
CS GR FUNDING 3.80 16-23 09/06S400 000 406 644.00 0.98USD
GUERNSEY/ILE DE GUERNESEY 406 644.00 0.98
MIZUHO FINANCIAL G 2.632 16-21 12/04S400 000 397 648.00 0.96USD
JAPAN/JAPON 671 608.50 1.62
SUMITOMO MITSUI FINL 2.784 17-22 12/07S275 000 273 960.50 0.66USD
ACTAVIS FUNDING SCS 3.85 14-24 15/06S400 000 405 832.00 0.98USD
LUXEMBOURG/LUXEMBOURG 405 832.00 0.98
UBS GROUP FDG 144A 2.65 16-22 01/02S400 000 396 492.00 0.96USD
SWITZERLAND/SUISSE 396 492.00 0.96
ABN AMRO 144A 4.75 15-25 28/07S375 000 390 112.50 0.94USD
THE NETHERLANDS/PAYS-BAS 390 112.50 0.94
BARCLAYS PLC 3.684 17-23 10/01S400 000 400 048.00 0.96USD
UNITED KINGDOM/ROYAUME-UNI 1 076 095.25 2.59
NATIONWIDE BLDG SO 4 16-26 14/09S275 000 265 383.25 0.64USDSANTANDER UK 144A 5.00 13-23 07/11S400 000 410 664.00 0.99USD
ALABAMA ECON SETTL 4.263 16-32 15/9S275 000 290 435.75 0.70USD
UNITED STATES/ÉTATS-UNIS 21 055 673.42 50.75
ALLEGION US HOLDING 3.20 17-24 01/10S275 000 265 471.66 0.64USDAMERICAN INTL GRP 3.75 15-25 10/07S375 000 376 447.50 0.91USDAT T INC 3.40 15-25 15/05S400 000 396 424.00 0.96USDAT&T INC 4.8500 19-39 01/03S50 000 50 381.00 0.12USDBECTION DICKINSON 3.734 14-24 15/12S400 000 406 616.00 0.98USDCAPITAL ONE BANK 3.375 13-23 15/02S400 000 399 416.00 0.96USDCHARTER COM OPERATING 4.464 16-22 27/03S375 000 388 185.00 0.94USDCITIGROUP 2.40 15-20 18/02S300 000 299 247.00 0.72USDCNA FINANCIAL 3.45 17-27 15/08S275 000 267 899.50 0.65USDCOMPASS BANK SUB 3.875 15-25 10/04S400 000 398 184.00 0.96USDCOX COMMUNICATIONS 3.25 12-22 15/10S400 000 402 500.00 0.97USDCVS HEALTH CORP 4.78 18-38 25/03S50 000 49 656.00 0.12USDCVS HEALTH CORP 5.05 18-48 25/03S50 000 50 454.00 0.12USDDAIMLER FINANCE NA 1.75 16-19 30/10S400 000 397 600.00 0.96USDDEUTSCHE BANK AG 4.25 18-21 14/10S250 000 251 352.50 0.61USDDISCOVER BANK 3.45 16-26 27/07S400 000 387 944.00 0.94USDDUKE ENERGY CORP 3.75 16-46 01/09S400 000 375 044.00 0.90USDDXC TECHNOLOGY 4.25 17-24 15/04S275 000 280 453.25 0.68USDENERGY TRANSFER PART 4.15 13-20 01/10S250 000 254 007.50 0.61USDEQM MIDSTREAM PART 4.125 16-26 01/12S250 000 233 422.50 0.56USD
Schedule of investments as at 31/03/2019 / Inventaire du portefeuille au 31/03/2019
USD
Market ValueNumber of Shares orNominal Value
Investment % of Net AssetsQuotationCurrency
Valeur de marchéNombre d'actions ouvaleur nominale
Investissement % de l'actif netDevise decotation

The accompanying notes form an integral part of these financial statements.Les notes annexées font partie intégrante de ces états financiers.
97PrivilEdge - Baird US Aggregate Bond · 31/03/2019
EXPRESS SCRIPTS HO 4.75 13-21 15/11S350 000 365 767.50 0.88USDFANNIE MAE 4.50 15-15 01/06M337 549 357 190.46 0.86USDFORD MOTOR CREDIT 3.2 15-21 15/01U400 000 394 548.00 0.95USDGENERAL MOTORS 3.20 16-21 06/07S400 000 398 796.00 0.96USDGLENCORE FUNDING L 4.00 17-27 27/03S250 000 242 847.50 0.59USDGOLDMAN SACHS 5.25 11-21 27/07S300 000 315 477.00 0.76USDHYUNDAI CAPITAL AM 2.00 16-19 01/07S400 000 399 024.00 0.96USDKINDER MORGAN ENERGY 5.80 09-21 01/03S350 000 368 487.00 0.89USDKRAFT FOODS 5.375 12-20 10/02S375 000 383 073.75 0.92USDMASSACHUSET INSUR 4.90 17-77 01/04S75 000 80 334.00 0.19USDMASSACHUSETTS ST 144A 8.875 09-39 01/06S76 000 116 632.34 0.28USDNEW YORK LIFE INSU 6.75 09-39 15/11S225 000 308 877.75 0.74USDRELIANCE STAND LIFE 2.375 15-20 04/05S400 000 397 790.00 0.96USDSOUTHERN CO 4.25 16-36 01/07S400 000 395 176.00 0.95USDSUNTRUST BANK 3.30 16-26 15/05A400 000 396 780.00 0.96USDSYNCHRONY FINANCIAL 4.50 15-25 23/07S375 000 377 295.00 0.91USDTC PIPELINES 4.375 15-25 13/03S250 000 256 755.00 0.62USDTTX CO 144A 4.65 14-44 15/06S400 000 434 105.20 1.05USDUS TREAS N C-2024 2.50 14-24 15/05S125 000 126 494.14 0.30USDUS TREASURY N/B 1.875 17-22 31/2011 150 000 1 139 083.98 2.75USDUS TREASURY NOTE 2.25 17-27 15/11S1 600 000 1 584 000.00 3.81USDUSA T NOTES 2.875 13-43 15/05S1 825 000 1 855 796.88 4.46USDUSA TREASURY BONDS 2.50 15-45 15/02S925 000 874 125.00 2.11USDUSA TREASURY BONDS 3.50 09-39 15/02S650 000 737 496.10 1.78USDUSA TREASURY NOTES 1.75 15-22 31/03S500 000 493 261.72 1.19USDUSA TREASURY NOTES 2.00 16-26 15/11S450 000 439 242.19 1.06USDVALERO ENERGY CORP 3.65 15-25 15/03S400 000 405 840.00 0.98USDVERIZON COMM 4.40 14-34 01/11S525 000 547 218.00 1.32USDVOYA FINANCIAL INC 3.125 17-24 15/07S275 000 271 449.75 0.65USDWESTINGHOUSE AIR 3.45 17-26 15/11S400 000 371 568.00 0.90USD
BANK OF AMERICA FL.R 17-23 20/12S323 000 321 985.78 0.78USD
FLOATING RATE NOTES/OBLIGATIONS À TAUX VARIABLE 651 990.78 1.57
UNITED STATES/ÉTATS-UNIS 651 990.78 1.57
MORGAN STANLEY FL.R 16-23 24/10Q325 000 330 005.00 0.79USD
FHMS K158 A3 FL.R 18-33 25/10M75 000 81 135.17 0.20USD
MORTGAGE AND ASSET BACKED SECURITIES/Titres de créances hypothécaires et assimilés 14 302 812.51 34.48
LUXEMBOURG/LUXEMBOURG 617 123.83 1.49
POPLR 2006-E A2 FL.R 06-37 25/01M83 327 83 323.89 0.20USDTPMT 2017-2 A1 2.75 17-57 25/04M112 744 111 721.89 0.27USDTPMT 2017-6 A1 2.75 17-57 25/10M140 622 139 055.83 0.34USDTPMT 2018-1 A1 FL.R 18-58 28/01M203 497 201 887.05 0.48USD
ABSHE 2006-HE1 A FL.R 06-36 25/01M85 035 85 136.98 0.21USD
UNITED STATES/ÉTATS-UNIS 13 685 688.68 32.99
ABSHE 2006-HE6 A FL.R 06-36 25/11M112 038 108 750.89 0.26USDCOMM 2013-CR10 A3 3.923 13-23 10/07M225 000 235 497.64 0.57USDCWL 2006-3 2A3 FL.R 06-36 25/06M105 407 105 540.73 0.25USDFG G07849 3.50 14-44 01/05M200 844 205 630.91 0.50USDFG G08706 3.50 16-46 01/05M1 162 625 1 183 204.27 2.84USDFG G16074 3.00 17-32 01/02M319 948 323 957.16 0.78USDFG G67700 3.5 16-46 01/08M162 028 165 462.17 0.40USDFG Q06999 4.00 12-42 01/03M355 205 368 255.17 0.89USDFG V61346 2.50 16-31 01/10M273 716 273 094.93 0.66USDFHLMC K029 A2 FL.R 13-23 25/02M225 000 231 193.24 0.56USDFHMS KO28 A2 3.111 13-23 01/02M250 000 254 951.47 0.61USD
Schedule of investments as at 31/03/2019 / Inventaire du portefeuille au 31/03/2019
USD
Market ValueNumber of Shares orNominal Value
Investment % of Net AssetsQuotationCurrency
Valeur de marchéNombre d'actions ouvaleur nominale
Investissement % de l'actif netDevise decotation

The accompanying notes form an integral part of these financial statements.Les notes annexées font partie intégrante de ces états financiers.
98 PrivilEdge - Baird US Aggregate Bond · 31/03/2019
FHMS KO41 A2 3.171 14-24 25/10M225 000 230 406.34 0.56USDFHMS KO50 A2 3.334 15-25 25/08M250 000 258 393.10 0.62USDFHMS K062 A2 3.413 17-26 25/12M225 000 233 743.72 0.56USDFHMS K064 A2 FL.R 17-27 25/03M125 000 128 239.97 0.31USDFN -POOL AT5900- 3.00 13-43 01/06M549 773 550 538.31 1.33USDFN AB9858 3.00 13-43 01/07M587 145 589 763.35 1.42USDFN AE0113 4.00 10-40 01/07M343 851 358 661.67 0.86USDFN AJ9278 3.50 11-41 01/12M130 457 133 211.63 0.32USDFN AL7521 5.00 15-39 01/06M414 287 448 486.50 1.08USDFN AL7822 4.00 15-43 01/07M446 270 462 224.46 1.11USDFN AL8044 4.50 16-42 01/11M184 633 194 004.60 0.47USDFN AO0800 3 13-43 01/04M260 668 264 500.31 0.64USDFN AO8044 3.5000 12-42 01/07M290 845 297 920.27 0.72USDFN AS4582 4.00 15-45 01/03M441 600 459 705.72 1.11USDFN AS6227 4.00 15-45 01/11M190 779 197 209.96 0.48USDFN AT0682 3.1 16-26 15/11S271 316 271 884.39 0.66USDFN AT2725 3.00 13-43 01/05M256 907 257 354.95 0.62USDFN BM2001 3.50 17-46 01/12M385 330 391 951.56 0.94USDFN MA1608 3.50 13-XX 01/09M245 073 252 177.59 0.61USDFNCL POOL AL0160 4.50 11-41 01/05M86 957 92 016.16 0.22USDFORDR 2016-2 A 2.03 16-27 15/12M175 000 172 040.09 0.41USDFORDR 2018-1 A 3.19 18-31 15/07M125 000 125 128.05 0.30USDFREDDIE MAC 3.194 17-27 01/07M175 000 178 902.27 0.43USDGNMA II 3.50 16-46 20/10M489 689 501 378.46 1.21USDG2 MA4003 3.00 16-46 20/10M616 670 620 777.44 1.49USDJPMBB 2014-C25 A5 3.672 14-47 15/11M400 000 413 271.60 1.00USDMSBAM 2012-C5 A4 3.176 12-45 15/08M375 000 380 832.64 0.92USDMSBAM 2012-C6 A4 2.858 12-22 15/09M347 737 349 894.23 0.84USDMSBAM 2014-C16 A4 3.6000 14-47 15/06M175 000 180 330.34 0.43USDNRZT 2017-3A A1 4.00 17-57 25/04M67 606 69 130.06 0.17USDNRZT 2018-1A A1A 4.0 18-57 25/12M120 306 123 179.02 0.30USDTPMT 2016-4 A1 FL.R 16-56 25/07M180 895 177 798.24 0.43USDWAMU 2004-AR14 A1 FL.R 04-35 25/01M59 859 60 434.92 0.15USDWAMU 2004-AR3 A2 FL.R 04-34 25/06M105 396 106 730.46 0.26USDWFCM 2015-C26 ASB 2.991 15-48 15/02M250 000 251 607.08 0.61USDWFCM 2015-P2 ASB 3.656 15-48 15/12M350 000 361 183.66 0.87USD
ANHEUSER 4.9 18-46 13/11S350 000 351 750.00 0.85USD
Other transferable securities/Autres valeurs mobilières 351 750.00 0.85
BONDS/OBLIGATIONS 351 750.00 0.85
UNITED STATES/ÉTATS-UNIS 351 750.00 0.85
Schedule of investments as at 31/03/2019 / Inventaire du portefeuille au 31/03/2019
USD
Market ValueNumber of Shares orNominal Value
Investment % of Net AssetsQuotationCurrency
Valeur de marchéNombre d'actions ouvaleur nominale
Investissement % de l'actif netDevise decotation
Forward Foreign Currency Exchange Contracts/Contrats de change à terme (0.03)(11 374.07)EUR 937 372.78 (0.02)USD (8 149.80)826 647.53 15/04/2019Caceis BankCHF 105 796.83 0.00USD 730.66105 960.14 15/04/2019Caceis BankGBP 251 161.86 (0.01)USD (3 954.93)189 586.50 15/04/2019Caceis Bank
USD
Unrealised appreciation/(depreciation)
Currency % of NetAssets
Amount bought Maturity Currency Amount soldCounterparty
Plus/(Moins) value non-réalisée
Devise % de l'actifnet
Montant acheté Maturité Devise Montant venduContrepartie

PrivilEdgeis an investment company
with variable capital ("SICAV")incorporated in Luxembourg
PrivilEdgeest une société d’investissement
à capital variable ("SICAV")enregistrée au Luxembourg RCS Luxembourg B0181207
PrivilEdge –Baird US Short Duration Bond
Unaudited semi-annual report · Rapport semestriel non révisé
31.03.2019

The accompanying notes form an integral part of these financial statements.Les notes annexées font partie intégrante de ces états financiers.
100 PrivilEdge - Baird US Short Duration Bond · 31/03/2019
ASSETS/ACTIF
39 006 340.99Investments in securities at market value/Portefeuille-titres à la valeur de marché (2):( USD )39 140 577.06Acquisition cost/Coût d'acquisition
1 381 189.80Cash and term deposits/Liquidité et dépôts à terme282 825.48Amounts receivable on subscriptions/Montants à recevoir sur souscriptions d'actions277 118.38Interest and dividends receivable, net/Intérêt et dividendes nets à recevoir
9 505.29Formation/reorganisation expenses/Frais de constitution/réorganisation (2)40 956 979.94
LIABILITIES/PASSIF
1 384 269.74Payable on investments purchased/À payer sur achat de titres19 163.54Management and distribution fees payable/Commission de gestion et de distribution à payer (3)
6 354.57Taxes and expenses payable/Impôts et autres frais à payer19 734.76Unrealised depreciation on forward foreign currency exchange contracts/Moins-value non réalisée sur contrats de change à
terme(2)
1 429 522.6139 527 457.33NET ASSET VALUE/VALEUR NETTE D'INVENTAIRE
Statement of net assets as at 31/03/2019 / État de l'actif net au 31/03/2019
NotesNotes USD

The accompanying notes form an integral part of these financial statements.Les notes annexées font partie intégrante de ces états financiers.
101PrivilEdge - Baird US Short Duration Bond · 31/03/2019
Statement of operations and changes in net assets for the period from 01/10/2018 to 31/03/2019 / État desopérations et des variations de l'actif net pour la période du 01/10/2018 au 31/03/2019
NotesNotes USD
36 263 321.86NET ASSET VALUE AT THE BEGINNING OF THE PERIOD/VALEUR NETTE D'INVENTAIRE AU DÉBUT DE LAPÉRIODE
INCOME/REVENUS
516 084.69Interest on bonds, net/Intérêts sur obligations, nets (2)12 955.90Bank interest/Intérêts bancaires
529 040.59EXPENSES/DÉPENSES
108 899.28Management fees/Commission de gestion (3)4 767.68Distribution fees/Frais de distribution (3)
129.30Bank interest and other expenses/Intérêts bancaires débiteurs et autres frais39 878.75Fixed Rate of Operational Costs/Taux Fixe de Coûts Opérationnels (4)
2 898.28Formation/Reorganisation expenses/Frais de constitution/réorganisation (2)156 573.29372 467.30NET INVESTMENT INCOME/REVENU NET SUR INVESTISSEMENTS
(160 650.09)Net realised loss on sale of investments/Perte nette réalisée sur ventes d'investissements (2)13 217.71Net realised gain on foreign exchange/Gain net réalisé sur opérations de change
(153 758.50)Net realised loss on forward foreign currency exchange contracts/Perte nette réalisée sur contrats de change à terme71 276.42NET REALISED GAIN/GAIN NET RÉALISÉ
590 877.14Change in net unrealised appreciation or depreciation on investments/Variation de la plus ou moins-value nette non réaliséesur investissements
(2)
4 785.35Change in net unrealised appreciation or depreciation on forward foreign currency exchange contracts/Variation de la plus oumoins-value nette non réalisée sur contrats de change à terme
666 938.91NET INCREASE IN NET ASSETS AS A RESULT OF OPERATIONS/AUGMENTATION NETTE DE L'ACTIF NETRÉSULTANT DES OPÉRATIONS
(173 251.70)Dividend paid/Dividende payé2 770 448.26Net subscriptions/(redemptions) including equalisation/Souscriptions/(rachats) nets incluant la régularisation
39 527 457.33NET ASSET VALUE AT THE END OF THE PERIOD/VALEUR NETTE D'INVENTAIRE À LA FIN DE LA PÉRIODE

The accompanying notes form an integral part of these financial statements.Les notes annexées font partie intégrante de ces états financiers.
102 PrivilEdge - Baird US Short Duration Bond · 31/03/2019
239 226.2700 0.0000 0.0000 239 226.2700P - USD - Capitalisation2 047 036.4900 748 034.9060 (410 066.0000) 2 385 005.3960M - USD - Capitalisation
554 961.3050 228 614.0210 (92 978.2350) 690 597.0910M - USD - Distribution27 570.0000 0.0000 (4 000.0000) 23 570.0000M - CHF - Hedged - Capitalisation
194 596.0000 0.0000 (155 325.0000) 39 271.0000M - EUR - Hedged - Capitalisation27 250.0000 950.0000 0.0000 28 200.0000M - GBP - Hedged - Capitalisation
121 906.2560 100 315.0000 (121 906.2560) 100 315.0000N - USD - Capitalisation250 000.0000 0.0000 0.0000 250 000.0000N - USD - Distribution123 000.0000 0.0000 0.0000 123 000.0000N - EUR - Hedged - Capitalisation
Statement of changes in the number of shares outstanding for the period from 01/10/2018 to 31/03/2019 / Étatdes variations du nombre d'actions pour la période du 01/10/2018 au 31/03/2019
Number of Shares01/10/2018/
Nombre d'actions01/10/2018
Number of Sharesissued/
Nombre d'actionsémises
Number of Sharesredeemed/
Nombre d'actionsrachetées
Number of Shares31/03/2019/
Nombre d'actions31/03/2019
30/09/201831/03/2019For the period ended/Pour la période clôturée au
Statistics / Statistiques
30/09/2017
P - USD - Capitalisation
2 426 457.0910.1429
2 380 458.809.9507
8 063 862.5210.0108
Net Asset Value/Valeur Nette d'InventaireNet Asset Value per share/Valeur Nette d'Inventaire par action
USD USD USD
I - USD - Capitalisation
0.000.0000
0.000.0000
8 857 421.6610.0644
Net Asset Value/Valeur Nette d'InventaireNet Asset Value per share/Valeur Nette d'Inventaire par action
USD USD USD
M - USD - Capitalisation
24 429 719.7810.2430
20 526 133.9710.0272
21 581 464.8210.0475
Net Asset Value/Valeur Nette d'InventaireNet Asset Value per share/Valeur Nette d'Inventaire par action
USD USD USD
M - USD - Distribution
6 834 311.319.8962
0.21
5 492 544.969.8972
0.13
7 386 525.3510.0475
0.00
Net Asset Value/Valeur Nette d'InventaireNet Asset Value per share/Valeur Nette d'Inventaire par actionDividend per share paid to shareholders/Dividende par action payé aux actionnaires
USD USD USD
M - CHF - Hedged - Capitalisation
225 220.419.5554
262 540.219.5227
7 244 274.819.8445
Net Asset Value/Valeur Nette d'InventaireNet Asset Value per share/Valeur Nette d'Inventaire par action
CHF CHF CHF

The accompanying notes form an integral part of these financial statements.Les notes annexées font partie intégrante de ces états financiers.
103PrivilEdge - Baird US Short Duration Bond · 31/03/2019
30/09/201831/03/2019For the period ended/Pour la période clôturée au
Statistics / Statistiques
30/09/2017
M - EUR - Hedged - Capitalisation
379 165.939.6551
1 868 414.059.6015
2 780 675.139.8791
Net Asset Value/Valeur Nette d'InventaireNet Asset Value per share/Valeur Nette d'Inventaire par action
EUR EUR EUR
M - GBP - Hedged - Capitalisation
279 026.659.8946
266 454.659.7782
239 900.399.9544
Net Asset Value/Valeur Nette d'InventaireNet Asset Value per share/Valeur Nette d'Inventaire par action
GBP GBP GBP
N - USD - Capitalisation
1 008 892.4510.0572
1 226 599.9610.0618
2 028 341.7010.0641
Net Asset Value/Valeur Nette d'InventaireNet Asset Value per share/Valeur Nette d'Inventaire par action
USD USD USD
N - USD - Distribution
2 476 771.379.9071
0.22
2 477 896.229.9116
0.15
2 516 031.0910.0641
0.00
Net Asset Value/Valeur Nette d'InventaireNet Asset Value per share/Valeur Nette d'Inventaire par actionDividend per share paid to shareholders/Dividende par action payé aux actionnaires
USD USD USD
N - CHF - Hedged - Distribution
0.000.0000
0.00
0.000.0000
0.14
3 990 764.809.8537
0.00
Net Asset Value/Valeur Nette d'InventaireNet Asset Value per share/Valeur Nette d'Inventaire par actionDividend per share paid to shareholders/Dividende par action payé aux actionnaires
CHF CHF CHF
N - EUR - Hedged - Capitalisation
1 189 671.369.6721
1 182 319.379.6124
0.000.0000
Net Asset Value/Valeur Nette d'InventaireNet Asset Value per share/Valeur Nette d'Inventaire par action
EUR EUR EUR

The accompanying notes form an integral part of these financial statements.Les notes annexées font partie intégrante de ces états financiers.
104 PrivilEdge - Baird US Short Duration Bond · 31/03/2019
Investments in securities at market value/Portefeuille-titres à la valeur de marché 39 006 340.99 98.68
SINOPEC GR OVER 144A 2.375 17-20 12/04S300 000 298 317.00 0.75USD
Transferable securities admitted to an official stock exchange listing and/or dealt in on anotherregulated market/Valeurs mobilières admises à la cote officielle d'une bourse de valeurs et/ounégociées sur un autre marché réglementé
38 443 518.19 97.26
BONDS/OBLIGATIONS 33 687 416.81 85.22
BRITISH VIRGIN ISLANDS/ILES VIERGES BRITANNIQUES 298 317.00 0.75
MANULIFE FINANCIAL 4.90 10-20 17/09S400 000 411 863.60 1.05USD
CANADA/CANADA 1 020 598.40 2.59
NATIONAL BK OF CANADA 2.15 17-20 12/06S300 000 298 278.00 0.75USDRBC 5.25 10-20 15/09S300 000 310 456.80 0.79USD
CK HUTCHISON INTL 17 2.25 17-20 29/09S325 000 321 759.75 0.81USD
CAYMAN ISLANDS/ILES CAÏMANS 321 759.75 0.81
BFCM 2.20 17-20 20/07S200 000 198 374.00 0.50USD
FRANCE/FRANCE 649 525.10 1.64
BPCE SA 3.00 17-22 22/05S250 000 248 097.50 0.63USDELECT.DE FRANCE 144A 4.60 10-20 27/01S200 000 203 053.60 0.51USD
PERRIGO FINANCE UN 3.50 16-21 15/03S200 000 198 916.80 0.50USD
IRELAND/IRLANDE 834 506.67 2.11
SHIRE ACQ INV IRL 1.90 16-19 23/09S300 000 298 389.00 0.75USDWILLIS GROUP HOLD 5.75 11-21 15/03S321 000 337 200.87 0.86USD
MIZUHO FINANCIAL G 2.632 16-21 12/04S200 000 198 824.00 0.50USD
JAPAN/JAPON 198 824.00 0.50
GRUPO BIMBO SAB DE 4.875 10-20 30/06S325 000 332 153.25 0.84USD
MEXICO/MEXIQUE 522 842.95 1.32
PEMEX 8.00 09-19 03/05S190 000 190 689.70 0.48USD
DNB BANK ASA 2.125 17-20 02/10S325 000 321 922.25 0.81USD
NORWAY/NORVÈGE 321 922.25 0.81
COMPASS BANK 2.75 14-19 29/09S350 000 349 333.25 0.88USD
THAILAND/THAÏLANDE 349 333.25 0.88
STAND CHRTERED 144A 2.40 14-19 08/09400 000 398 571.00 1.01USD
UNITED KINGDOM/ROYAUME-UNI 398 571.00 1.01
AIR LEASE 2.625 17-22 01/07S150 000 146 488.95 0.37USD
UNITED STATES/ÉTATS-UNIS 28 771 216.44 72.80
ALLERGAN FINANCE LLC 3.25 12-22 01/10S300 000 299 859.00 0.76USDAUTONATION INC 3.35 15-21 15/01S175 000 174 679.57 0.44USDBECTON DICKINSON 2.404 17-20 05/06S300 000 298 269.00 0.75USDBROADCOM CORP 2.375 18-20 15/01S325 000 323 345.75 0.82USDCHARTER COM OPER 3.579 16-20 23/07S64 000 64 445.44 0.16USDCNA FINANCIAL 5.875 10-20 15/08S250 000 260 045.00 0.66USDCOLUMBIA PIPELINE 3.30 15-20 01/06S165 000 165 559.35 0.42USDCONSTELLATION ENER 5.15 10-20 01/12S300 000 308 883.00 0.78USDDAIMLER FINANCE NA 1.75 16-19 30/10S400 000 397 600.00 1.01USDDISCOVER FINANC 5.2000 12-22 27/04S150 000 158 950.73 0.40USDDXC TECHNOLOGY CO 2.875 17-20 27/03S325 000 324 892.26 0.82USDENBRIDGE ENERGY 4.375 15-20 15/10S275 000 280 552.94 0.71USDENERGY TRANSFER PART 4.15 13-20 01/10S300 000 304 809.00 0.77USDEXPRESS SCRIPTS HO 4.75 13-21 15/11S150 000 156 757.50 0.40USD
Schedule of investments as at 31/03/2019 / Inventaire du portefeuille au 31/03/2019
USD
Market ValueNumber of Shares orNominal Value
Investment % of Net AssetsQuotationCurrency
Valeur de marchéNombre d'actions ouvaleur nominale
Investissement % de l'actif netDevise decotation

The accompanying notes form an integral part of these financial statements.Les notes annexées font partie intégrante de ces états financiers.
105PrivilEdge - Baird US Short Duration Bond · 31/03/2019
FMC CORP 3.9500 11-22 01/02S200 000 204 449.30 0.52USDFORD MOTOR CREDIT 3.2 15-21 15/01U300 000 295 911.00 0.75USDFRESENIUS MED.C.REGD 4.125 14-20 15/10S300 000 302 812.50 0.77USDGENERAL MOTORS 2.40 16-19 09/05S400 000 399 788.00 1.01USDGOLDMAN SACHS 5.25 11-21 27/07S275 000 289 187.25 0.73USDHAWAII (STATE OF) 1.467 14-22 01/07S143 809 142 685.97 0.36USDHYUNDAI CAPITAL AM 2.00 16-19 01/07S400 000 399 024.00 1.01USDJEFFERIES GROUP 6.875 10-21 15/04S300 000 321 075.00 0.81USDKEYSIGHT TECH 3.30 15-19 30/10S400 000 400 165.20 1.01USDKINDER MORGAN ENER 5.30 10-20 15/09S287 000 296 740.78 0.75USDMASCO CORP 5.95 12-22 15/03S175 000 188 395.03 0.48USDNISSAN MOTOR AC 3.6500 18-21 21/09S175 000 176 071.00 0.45USDNORFOLK SOUTHERN 9.75 04-20 15/06S325 000 351 348.23 0.89USDNV ENERGY 6.25 10-20 15/11S250 000 263 517.50 0.67USDPROTECTIVE LIFE CO 7.375 09-19 15/10S350 000 358 192.10 0.91USDSABINE PASS 5.625 14-21 01/02S175 000 181 858.25 0.46USDSANTANDER HOLDI 4.4500 18-21 03/12S200 000 206 014.00 0.52USDSMITHFIELD FOODS I 2.70 17-20 31/01S298 000 295 922.94 0.75USDSTIFEL FINANCIAL 3.50 15-20 01/12S300 000 301 902.75 0.76USDSYNCHRONY FINANCIAL 2.70 15-20 03/02S300 000 299 874.00 0.76USDUS TREASURY N/B 1.875 17-22 31/2013 050 000 3 021 048.83 7.64USDUS TREASURY N/B 2.3750 18-21 15/04S4 750 000 4 760 019.56 12.04USDUS TREASURY NOTE 2.00 14-21 31/08S4 150 000 4 125 683.62 10.44USDUS TREASURY NOTES 2.125 15-22 31/12S825 000 821 970.71 2.08USDUSA T NOTES 1.125 16-21 30/09S5 875 000 5 720 322.30 14.48USDUSA TREASURY NOTES 1.75 15-22 31/03S675 000 665 903.33 1.68USDVERISK ANALYTICS I 5.80 11-21 01/05S300 000 316 195.80 0.80USD
VULCAN MATERIALS C FL.R 17-20 15/06Q150 000 149 099.78 0.38USD
FLOATING RATE NOTES/OBLIGATIONS À TAUX VARIABLE 149 099.78 0.38
UNITED STATES/ÉTATS-UNIS 149 099.78 0.38
MCCT 2017-1A A 2.26 17-21 21/07A305 000 303 547.37 0.77USD
MORTGAGE AND ASSET BACKED SECURITIES/Titres de créances hypothécaires et assimilés 4 607 001.60 11.66
CANADA/CANADA 303 547.37 0.77
CARMAX AUTO 2018-4 A3 3.36 18-23 15/09M200 000 203 129.02 0.51USD
LUXEMBOURG/LUXEMBOURG 451 361.05 1.14
POPLR 2006-E A2 FL.R 06-37 25/01M83 327 83 323.89 0.21USDTPMT 2015-4 A1 3.50 15-55 25/04M164 851 164 908.14 0.42USD
ABSHE 2006-HE1 A FL.R 06-36 25/01M91 109 91 218.20 0.23USD
UNITED STATES/ÉTATS-UNIS 3 852 093.18 9.75
BACCT 2018-A2 A2 3.0000 18-23 15/09M175 000 176 524.81 0.45USDBWSTA 2018-1 A3 FL.R 18-22 15/12M150 000 151 104.35 0.38USDCCCIT 2018-A1 A1 2.4900 18-23 20/01S175 000 174 899.02 0.44USDCFII 2018-1A A1 3.0400 18-30 15/04M132 459 132 469.38 0.34USDCOMM 2012-CR1 ASB 3.053 12-45 15/05M203 548 205 501.98 0.52USDDEFT 2018-1 A3 3.1800 18-23 22/06M175 000 175 743.30 0.44USDFHMS KO14 A2 3.871 11-21 25/04M319 320 325 737.16 0.83USDFORD CR AUTO OWNER 2.31 14-19 15/10M150 000 149 481.23 0.38USDHART 2017-A A4 2.0900 17-23 17/04M125 000 123 727.96 0.31USDJPMBB 2013-C14 C14 ASB FL.R 13-46 15/18M129 423 132 025.18 0.33USDMSBAM 2013-C9 AAB 2.657 13-46 15/05M122 760 122 595.99 0.31USDPFSFC 2017-D A 2.400 17-20 15/10M175 000 173 319.02 0.44USDSYNCHRONY 3.38 18-24 26/09M175 000 177 697.85 0.45USDSYNCHRONY CREDITCARD 2.95 19-25 17/03M150 000 151 023.68 0.38USD
Schedule of investments as at 31/03/2019 / Inventaire du portefeuille au 31/03/2019
USD
Market ValueNumber of Shares orNominal Value
Investment % of Net AssetsQuotationCurrency
Valeur de marchéNombre d'actions ouvaleur nominale
Investissement % de l'actif netDevise decotation

The accompanying notes form an integral part of these financial statements.Les notes annexées font partie intégrante de ces états financiers.
106 PrivilEdge - Baird US Short Duration Bond · 31/03/2019
TOWD POINT MTGE TRUST FL.R 17-56 25/10M155 392 154 033.96 0.39USDTPMT 2017-3 A1 2.75 17-57 25/06M227 645 225 561.03 0.57USDTPMT 2017-5 A1 FL.R 17-57 25/02M129 653 129 068.64 0.33USDVZOT 2018-1A A1 2.8200 18-22 20/09M150 000 150 308.69 0.38USDWAMU 2004-AR3 A2 FL.R 04-34 25/06M119 888 121 405.91 0.31USDWFNMT 2010-A A 2.03 16-25 15/04M325 000 319 816.02 0.81USDWFRBS 2.445 12-22 01/10M109 651 109 419.89 0.28USDWFRBS COMMERICAL MTG 3.636 14-24 15/07M175 000 179 409.93 0.45USD
SMBC AVIATION CAPITAL 2.65 16-21 15/07S200 000 196 294.30 0.49USD
Other transferable securities/Autres valeurs mobilières 562 822.80 1.42
BONDS/OBLIGATIONS 374 670.05 0.94
IRELAND/IRLANDE 196 294.30 0.49
CONAGRA BRANDS 3.80 18-21 22/10S175 000 178 375.75 0.45USD
UNITED STATES/ÉTATS-UNIS 178 375.75 0.45
FORDR 2016-1 A 2.31 16-27 15/08M190 000 188 152.75 0.48USD
MORTGAGE AND ASSET BACKED SECURITIES/Titres de créances hypothécaires et assimilés 188 152.75 0.48
UNITED STATES/ÉTATS-UNIS 188 152.75 0.48
Schedule of investments as at 31/03/2019 / Inventaire du portefeuille au 31/03/2019
USD
Market ValueNumber of Shares orNominal Value
Investment % of Net AssetsQuotationCurrency
Valeur de marchéNombre d'actions ouvaleur nominale
Investissement % de l'actif netDevise decotation
Forward Foreign Currency Exchange Contracts/Contrats de change à terme (0.05)(19 734.76)CHF 223 333.59 0.00USD 1 573.90223 709.68 15/04/2019Caceis BankEUR 1 772 705.21 (0.04)USD (15 479.15)1 563 248.65 15/04/2019Caceis BankGBP 369 861.48 (0.01)USD (5 829.51)279 181.27 15/04/2019Caceis Bank
USD
Unrealised appreciation/(depreciation)
Currency % of NetAssets
Amount bought Maturity Currency Amount soldCounterparty
Plus/(Moins) value non-réalisée
Devise % de l'actifnet
Montant acheté Maturité Devise Montant venduContrepartie

PrivilEdgeis an investment company
with variable capital ("SICAV")incorporated in Luxembourg
PrivilEdgeest une société d’investissement
à capital variable ("SICAV")enregistrée au Luxembourg RCS Luxembourg B0181207
PrivilEdge –Columbia US Short Duration High Yield
Unaudited semi-annual report · Rapport semestriel non révisé
31.03.2019

The accompanying notes form an integral part of these financial statements.Les notes annexées font partie intégrante de ces états financiers.
108 PrivilEdge - Columbia US Short Duration High Yield · 31/03/2019
ASSETS/ACTIF
28 400 850.23Investments in securities at market value/Portefeuille-titres à la valeur de marché (2):( USD )28 682 489.61Acquisition cost/Coût d'acquisition
307 060.83Cash and term deposits/Liquidité et dépôts à terme412 239.96Interest and dividends receivable, net/Intérêt et dividendes nets à recevoir
9 505.29Formation/reorganisation expenses/Frais de constitution/réorganisation (2)6 137.77Unrealised appreciation on forward foreign currency exchange contracts/Plus-value non réalisée sur contrats de change à
terme(2)
29 135 794.08LIABILITIES/PASSIF
76 467.57Payable on investments purchased/À payer sur achat de titres17 506.20Management and distribution fees payable/Commission de gestion et de distribution à payer (3)
4 983.61Taxes and expenses payable/Impôts et autres frais à payer98 957.38
29 036 836.70NET ASSET VALUE/VALEUR NETTE D'INVENTAIRE
Statement of net assets as at 31/03/2019 / État de l'actif net au 31/03/2019
NotesNotes USD

The accompanying notes form an integral part of these financial statements.Les notes annexées font partie intégrante de ces états financiers.
109PrivilEdge - Columbia US Short Duration High Yield · 31/03/2019
Statement of operations and changes in net assets for the period from 01/10/2018 to 31/03/2019 / État desopérations et des variations de l'actif net pour la période du 01/10/2018 au 31/03/2019
NotesNotes USD
86 428 737.47NET ASSET VALUE AT THE BEGINNING OF THE PERIOD/VALEUR NETTE D'INVENTAIRE AU DÉBUT DE LAPÉRIODE
INCOME/REVENUS
954 472.99Interest on bonds, net/Intérêts sur obligations, nets (2)4 831.29Bank interest/Intérêts bancaires
959 304.28EXPENSES/DÉPENSES
130 526.58Management fees/Commission de gestion (3)6 294.35Distribution fees/Frais de distribution (3)
459.50Bank interest and other expenses/Intérêts bancaires débiteurs et autres frais44 413.49Fixed Rate of Operational Costs/Taux Fixe de Coûts Opérationnels (4)
2 898.28Formation/Reorganisation expenses/Frais de constitution/réorganisation (2)184 592.20774 712.08NET INVESTMENT INCOME/REVENU NET SUR INVESTISSEMENTS
(1 918 997.29)Net realised loss on sale of investments/Perte nette réalisée sur ventes d'investissements (2)36 309.61Net realised gain on foreign exchange/Gain net réalisé sur opérations de change
(763 398.64)Net realised loss on forward foreign currency exchange contracts/Perte nette réalisée sur contrats de change à terme(1 871 374.24)NET REALISED LOSS/PERTE NETTE RÉALISÉE
1 684 317.76Change in net unrealised appreciation or depreciation on investments/Variation de la plus ou moins-value nette non réaliséesur investissements
(2)
165 681.78Change in net unrealised appreciation or depreciation on forward foreign currency exchange contracts/Variation de la plus oumoins-value nette non réalisée sur contrats de change à terme
(21 374.70)NET DECREASE IN NET ASSETS AS A RESULT OF OPERATIONS/DIMINUTION NETTE DE L'ACTIF NET RÉSULTANTDES OPÉRATIONS
(331 530.86)Dividend paid/Dividende payé(57 038 995.21)Net subscriptions/(redemptions) including equalisation/Souscriptions/(rachats) nets incluant la régularisation
29 036 836.70NET ASSET VALUE AT THE END OF THE PERIOD/VALEUR NETTE D'INVENTAIRE À LA FIN DE LA PÉRIODE

The accompanying notes form an integral part of these financial statements.Les notes annexées font partie intégrante de ces états financiers.
110 PrivilEdge - Columbia US Short Duration High Yield · 31/03/2019
215 572.3040 2 800.0000 (66 404.8360) 151 967.4680P - USD - Capitalisation165 293.4620 0.0000 (155 293.4620) 10 000.0000P - CHF - Hedged - Capitalisation
71 129.0000 0.0000 (59 500.0000) 11 629.0000P - EUR - Hedged - Capitalisation569 479.2260 0.0000 (7 490.0000) 561 989.2260I - USD - Capitalisation964 124.9120 0.0000 (964 124.9120) 0.0000I - USD - Distribution
3 441 456.6010 11 200.0000 (2 849 510.5570) 603 146.0440M - USD - Capitalisation609 522.7390 32 224.7310 (486 070.8760) 155 676.5940M - USD - Distribution326 183.0000 0.0000 (225 182.0000) 101 001.0000M - CHF - Hedged - Capitalisation309 819.0000 13 800.0000 (189 899.0000) 133 720.0000M - EUR - Hedged - Capitalisation
24 100.0000 0.0000 (17 900.0000) 6 200.0000M - GBP - Hedged - Capitalisation630 699.4270 0.0000 (525 648.0480) 105 051.3790N - USD - Capitalisation265 000.0000 0.0000 0.0000 265 000.0000N - USD - Distribution165 000.0000 0.0000 0.0000 165 000.0000N - CHF - Hedged - Capitalisation310 000.0000 0.0000 0.0000 310 000.0000N - CHF - Hedged - Distribution179 929.0000 0.0000 0.0000 179 929.0000N - EUR - Hedged - Capitalisation
Statement of changes in the number of shares outstanding for the period from 01/10/2018 to 31/03/2019 / Étatdes variations du nombre d'actions pour la période du 01/10/2018 au 31/03/2019
Number of Shares01/10/2018/
Nombre d'actions01/10/2018
Number of Sharesissued/
Nombre d'actionsémises
Number of Sharesredeemed/
Nombre d'actionsrachetées
Number of Shares31/03/2019/
Nombre d'actions31/03/2019
30/09/201831/03/2019For the period ended/Pour la période clôturée au
Statistics / Statistiques
30/09/2017
P - USD - Capitalisation
1 614 333.1010.6229
2 234 770.1410.3667
2 535 299.0010.3078
Net Asset Value/Valeur Nette d'InventaireNet Asset Value per share/Valeur Nette d'Inventaire par action
USD USD USD
P - CHF - Hedged - Capitalisation
99 349.369.9349
1 630 701.969.8655
1 671 138.6910.1101
Net Asset Value/Valeur Nette d'InventaireNet Asset Value per share/Valeur Nette d'Inventaire par action
CHF CHF CHF
P - EUR - Hedged - Capitalisation
116 701.0610.0353
707 440.099.9459
143 470.8810.1544
Net Asset Value/Valeur Nette d'InventaireNet Asset Value per share/Valeur Nette d'Inventaire par action
EUR EUR EUR
I - USD - Capitalisation
6 079 772.6410.8183
5 988 942.5110.5165
5 908 631.5910.3755
Net Asset Value/Valeur Nette d'InventaireNet Asset Value per share/Valeur Nette d'Inventaire par action
USD USD USD

The accompanying notes form an integral part of these financial statements.Les notes annexées font partie intégrante de ces états financiers.
111PrivilEdge - Columbia US Short Duration High Yield · 31/03/2019
30/09/201831/03/2019For the period ended/Pour la période clôturée au
Statistics / Statistiques
30/09/2017
I - USD - Distribution
0.000.0000
0.00
10 139 286.5910.5166
0.00
0.000.0000
0.00
Net Asset Value/Valeur Nette d'InventaireNet Asset Value per share/Valeur Nette d'Inventaire par actionDividend per share paid to shareholders/Dividende par action payé aux actionnaires
USD USD USD
M - USD - Capitalisation
6 477 287.1010.7392
35 968 568.9410.4516
47 762 479.7410.3455
Net Asset Value/Valeur Nette d'InventaireNet Asset Value per share/Valeur Nette d'Inventaire par action
USD USD USD
M - USD - Distribution
1 555 606.539.9926
0.39
6 166 995.1510.1177
0.33
5 592 939.3910.3455
0.00
Net Asset Value/Valeur Nette d'InventaireNet Asset Value per share/Valeur Nette d'Inventaire par actionDividend per share paid to shareholders/Dividende par action payé aux actionnaires
USD USD USD
M - CHF - Hedged - Capitalisation
1 014 221.2010.0417
3 243 651.509.9443
4 659 900.9810.1451
Net Asset Value/Valeur Nette d'InventaireNet Asset Value per share/Valeur Nette d'Inventaire par action
CHF CHF CHF
M - EUR - Hedged - Capitalisation
1 355 841.6010.1394
3 104 871.5210.0216
5 875 276.4210.1856
Net Asset Value/Valeur Nette d'InventaireNet Asset Value per share/Valeur Nette d'Inventaire par action
EUR EUR EUR
M - GBP - Hedged - Capitalisation
64 285.6710.3687
245 555.0610.1890
407 917.1210.2492
Net Asset Value/Valeur Nette d'InventaireNet Asset Value per share/Valeur Nette d'Inventaire par action
GBP GBP GBP
N - USD - Capitalisation
1 133 857.0910.7934
6 620 322.3710.4968
12 590 121.1010.3664
Net Asset Value/Valeur Nette d'InventaireNet Asset Value per share/Valeur Nette d'Inventaire par action
USD USD USD
N - USD - Distribution
2 651 098.1010.0041
0.41
2 687 647.9810.1421
0.35
2 747 094.8710.3664
0.00
Net Asset Value/Valeur Nette d'InventaireNet Asset Value per share/Valeur Nette d'Inventaire par actionDividend per share paid to shareholders/Dividende par action payé aux actionnaires
USD USD USD

The accompanying notes form an integral part of these financial statements.Les notes annexées font partie intégrante de ces états financiers.
112 PrivilEdge - Columbia US Short Duration High Yield · 31/03/2019
30/09/201831/03/2019For the period ended/Pour la période clôturée au
Statistics / Statistiques
30/09/2017
N - CHF - Hedged - Capitalisation
1 663 972.8110.0847
1 646 652.759.9797
2 813 723.5510.1578
Net Asset Value/Valeur Nette d'InventaireNet Asset Value per share/Valeur Nette d'Inventaire par action
CHF CHF CHF
N - CHF - Hedged - Distribution
2 931 393.289.4561
0.40
3 026 395.659.7626
0.22
3 148 930.9010.1578
0.00
Net Asset Value/Valeur Nette d'InventaireNet Asset Value per share/Valeur Nette d'Inventaire par actionDividend per share paid to shareholders/Dividende par action payé aux actionnaires
CHF CHF CHF
N - EUR - Hedged - Capitalisation
1 830 385.6410.1728
1 807 821.4310.0474
1 085 157.1610.1884
Net Asset Value/Valeur Nette d'InventaireNet Asset Value per share/Valeur Nette d'Inventaire par action
EUR EUR EUR

The accompanying notes form an integral part of these financial statements.Les notes annexées font partie intégrante de ces états financiers.
113PrivilEdge - Columbia US Short Duration High Yield · 31/03/2019
Investments in securities at market value/Portefeuille-titres à la valeur de marché 28 400 850.23 97.81
HUDBAY MINERALS INC 7.25 16-23 15/01S216 000 224 640.00 0.77USD
Transferable securities admitted to an official stock exchange listing and/or dealt in on anotherregulated market/Valeurs mobilières admises à la cote officielle d'une bourse de valeurs et/ounégociées sur un autre marché réglementé
27 673 328.54 95.30
BONDS/OBLIGATIONS 27 125 928.54 93.41
CANADA/CANADA 1 027 206.83 3.54
MASONITE INTL 144A 5.625 15-23 15/03S152 000 156 180.00 0.54USDVALEANT PHARMA 144A 6.00 17-22 15/03S197 000 204 090.03 0.70USD1011778 BC / NEW R 4.625 15-22 15/01S440 000 442 296.80 1.53USD
AVOLON HOLDINGS 5.1250 18-23 01/10S156 000 159 714.36 0.56USD
CAYMAN ISLANDS/ILES CAÏMANS 370 619.04 1.28
AVOLON HOLDINGS FUNDI 5.25 19-24 15/05S71 000 73 485.00 0.25USDPARK AEROSPACE HLD 5.25 17-22 15/08S134 000 137 419.68 0.47USD
IHO VERWALTUNGS 4.125 16-21 15/09S416 000 418 600.00 1.44USD
GERMANY/ALLEMAGNE 418 600.00 1.44
ARDAGH PACKAGING 144A 4.25 17-22 15/09S401 000 401 629.57 1.38USD
IRELAND/IRLANDE 401 629.57 1.38
INTL GAME TECH 144A 6.25 15-22 15/02S226 000 235 605.00 0.81USD
UNITED KINGDOM/ROYAUME-UNI 512 677.69 1.77
VIRGIN MEDIA SECUR 5.25 11-21 15/01S269 000 277 072.69 0.96USD
ABC SUPPLY CO INC 5.75 15-23 15/12S322 000 334 075.00 1.15USD
UNITED STATES/ÉTATS-UNIS 24 395 195.41 84.00
ACADIA HEALTHCARE 5.125 14-22 01/07S219 000 220 095.00 0.76USDADT CORP 5.25 14-20 15/03S170 000 171 888.70 0.59USDAES CORP 4.0 18-21 15/03S155 000 157 050.65 0.54USDAPX GROUP INC 7.875 16-22 01/12S159 000 159 337.08 0.55USDARAMARK 5.125 15-24 15/01S205 000 211 084.40 0.73USDBEACON ROOFING SUPP 6.375 16-23 01/10S322 000 334 670.70 1.15USDBERRY PLASTICS COR 5.50 14-22 15/05S288 000 292 682.88 1.01USDBG FOODS INC 4.625 13-21 01/06S329 000 328 990.13 1.13USDBOYD GAMING 6.875 15-23 15/05S480 000 499 147.20 1.73USDBWAY HOLDING 144A 5.50 17-24 15/04S46 000 45 656.84 0.16USDCARRIZO OIL GAS 6.25 15-23 15/04S325 000 321 343.75 1.11USDCBS OUT AM CAP 5.25 15-22 15/02S215 000 218 500.20 0.75USDCBS OUT AM CAP 5.625 15-24 15/02S205 000 211 365.25 0.73USDCCO HLDGS LLC/CAP COR 4.00 17-23 01/03S324 000 323 245.08 1.11USDCCO HOLDINGS 5.125 12-23 15/02S290 000 295 347.60 1.02USDCENTENE 5.625 16-21 15/02S132 000 134 193.84 0.46USDCENTENE CORP 4.75 14-22 15/05S127 000 129 373.63 0.45USDCENTURYLINK 5.625 13-20 01/04S443 000 450 823.38 1.55USDCFX ESCROW CROP 6.00 19-24 15/02S38 000 39 681.50 0.14USDCHEMOURS CO 6.625 16-23 15/05S151 000 156 587.00 0.54USDCINEMARK USA 4.875 13-23 01/06S85 000 86 329.40 0.30USDCINEMARK USA INC 5.125 13-22 15/12S105 000 107 110.50 0.37USDCOMMSCOPE FINAN 5.5000 19-24 01/03S88 000 90 101.44 0.31USDCORRECTION CORP OF AM 4.125 13-20 01/04S209 000 210 488.08 0.72USDCSC HOLDINGS 6.75 11-21 15/11S196 000 209 661.20 0.72USDCSC HOLDINGS LLC 5.125 18-21 15/12S101 000 101 285.83 0.35USDCYRUSONE LP 5.00 18-24 15/03S210 000 215 539.80 0.74USDDAVITA 5.75 12-22 15/08S182 000 185 718.26 0.64USDDCP MIDSTREAM OPERAT 3.875 13-23 15/03S235 000 235 935.30 0.81USD
Schedule of investments as at 31/03/2019 / Inventaire du portefeuille au 31/03/2019
USD
Market ValueNumber of Shares orNominal Value
Investment % of Net AssetsQuotationCurrency
Valeur de marchéNombre d'actions ouvaleur nominale
Investissement % de l'actif netDevise decotation

The accompanying notes form an integral part of these financial statements.Les notes annexées font partie intégrante de ces états financiers.
114 PrivilEdge - Columbia US Short Duration High Yield · 31/03/2019
DISH DBS CORPORATION 5.125 13-20 01/05S96 000 96 876.48 0.33USDDISH DBS CORPORATION 6.75 11-21 01/06S68 000 70 114.12 0.24USDELDORADO RESORTS 7.00 16-23 01/08S395 000 413 071.25 1.42USDENERGY TRANSFER OPE 4.25 19-23 15/03S148 000 152 081.84 0.52USDEQUINIX INC 5.375 14-22 01/01S184 000 188 787.68 0.65USDFIRST DATA 144A 5.375 15-23 15/08S95 000 97 070.05 0.33USDFREEPORT MCMORAN 3.55 12-22 01/03S437 000 433 656.95 1.49USDFREEPORT MCMORAN 3.875 13-23 15/03S260 000 255 489.00 0.88USDGANNETT CO 5.125 13-19 15/10S131 000 131 503.04 0.45USDGATES GLOBAL 144A 6.00 14-22 15/07S230 000 231 127.00 0.80USDGROUP 1 AUTO 5.00 15-22 01/06S173 000 175 269.76 0.60USDHILL-ROM HOLDINGS INC 5.75 15-23 01/09S138 000 143 002.50 0.49USDIRON MOUNTAIN 4.375 16-21 01/06S169 000 170 291.16 0.59USDISTAR INC 4.625 17-20 15/09S250 000 253 387.50 0.87USDKB HOME 7.00 13-21 15/12S92 000 99 107.92 0.34USDLAMAR MEDIA 5.375 14-24 15/01S99 000 101 560.14 0.35USDLENNAR CORP 4.125 17-22 15/01S559 000 566 004.27 1.96USDLEVEL 3 FIN 6.125 14-21 15/01S294 000 296 237.34 1.02USDLIVE NATION ENT 144A 5.375 14-22 15/06S227 000 230 688.75 0.79USDMATCH GROUP INC 6.375 16-24 01/06S68 000 71 712.12 0.25USDMERITAGE HOME 7.00 12-22 01/04S66 000 70 956.60 0.24USDMERITAGE HOME 7.15 10-20 15/04S282 000 293 945.52 1.01USDMGM RESORT 6.625 12-21 15/12S445 000 477 258.05 1.65USDMGM RESORTS INTL 6.00 14-23 15/03S111 000 117 446.88 0.40USDMURPHY OIL CORP 4.70 12-22 01/12S185 000 186 233.95 0.64USDNABORS INDUSTRIES 5.00 11-20 15/09S131 000 133 103.86 0.46USDNABORS INDUSTRIES INC 4.625 12-21 15/09S90 000 89 066.70 0.31USDNATIONAL CINEMEDIA 6.00 12-22 15/04S135 000 137 025.00 0.47USDNAVIENT CORP 8.00 10-20 25/03S199 000 207 206.76 0.71USDNAVIENT CORP 5.00 14-20 26/10S165 000 167 562.45 0.58USDNAVIENT CORP 6.625 16-21 26/07S345 000 361 221.90 1.24USDNCR 5.875 14-21 15/12S120 000 121 483.20 0.42USDNCR CORP 5.00 13-22 15/07S180 000 179 404.20 0.62USDNCR CORP 4.625 13-21 15/02S210 000 210 438.90 0.72USDNETFLIX INC 5.50 15-22 15/02S268 000 281 836.84 0.97USDNGPL PIPE 4.375 17-22 15/08S312 000 318 851.52 1.10USDNIELSEN FINANCE 4.50 13-20 01/10S177 000 177 194.70 0.61USDNRG ENERGY 6.25 15-24 01/05S49 000 50 668.94 0.17USDNRG YLD OPER 5.375 15-24 15/08S77 000 77 023.87 0.27USDNUSTAR LOGISTICS L 4.80 10-20 01/09S438 000 443 983.08 1.53USDOWENS BROCKWAY 144A 5.00 14-22 15/01S186 000 190 757.88 0.66USDPENSKE AUTO GROUP 5.75 13-22 01/10S377 000 384 117.76 1.32USDPQ CORP 6.75 16-22 15/11S308 000 320 320.00 1.10USDPRESTIGE BRANDS INC 5.375 13-21 15/12S285 000 288 562.50 0.99USDQUINTILES TRANSN 144A 4.875 15-23 15/05S220 000 224 675.00 0.77USDRANGE RESOURCES CO 5.00 17-22 15/08S72 000 71 224.56 0.25USDREALOGY GR 144A 5.25 14-21 01/12S409 000 414 251.56 1.43USDREYNOLDS GROUP 144A 5.125 16-23 15/07S59 000 60 003.00 0.21USDRHP 5.00 13-21 15/04S252 000 252 942.48 0.87USDSBA COMMUNICATIONS 4.00 18-22 01/10S381 000 382 238.25 1.32USDSBA COMMUNICATIONS 4.875 15-22 15/07S147 000 149 335.83 0.51USDSCOTTS MIRACLE 6.00 16-23 15/10S245 000 255 010.70 0.88USDSERVICE CORP INTL 4.50 12-20 15/11S201 000 201 502.50 0.69USDSIRIUS XM RADIO INC 3.875 17-22 01/08S452 000 452 185.32 1.56USDSPECTRUM BRANDS 6.625 14-22 15/11S370 000 379 993.70 1.31USDSPRINGLEAF FINANCE 6.125 17-22 15/05S198 000 206 139.78 0.71USDSTARWOOD PRPTY 3.625 18-21 01/02S235 000 234 706.25 0.81USDSTEEL DYNAMICS INC 5.125 15-21 01/10S171 000 172 795.50 0.60USD
Schedule of investments as at 31/03/2019 / Inventaire du portefeuille au 31/03/2019
USD
Market ValueNumber of Shares orNominal Value
Investment % of Net AssetsQuotationCurrency
Valeur de marchéNombre d'actions ouvaleur nominale
Investissement % de l'actif netDevise decotation

The accompanying notes form an integral part of these financial statements.Les notes annexées font partie intégrante de ces états financiers.
115PrivilEdge - Columbia US Short Duration High Yield · 31/03/2019
STERIGENICS-NORDION 6.50 15-23 15/05S225 000 227 812.50 0.78USDSUNOCO LP/FINAN 4.8750 18-23 15/01S168 000 170 100.00 0.59USDT MOBILE US 6.00 14-23 01/03S235 000 241 669.30 0.83USDTALLGRASS NRG P 4.7500 18-23 01/10S334 000 336 922.50 1.16USDTARGA RES 4.25 13-23 15/11S100 000 99 969.00 0.34USDTARGA RESOURCES PTNR 6.75 15-24 15/03S205 000 215 541.10 0.74USDTAYLOR MOR COM 144 5.25 13-21 15/04S332 000 332 830.00 1.15USDTAYLOR MOR COM 144 5.875 15-23 15/04S86 000 87 290.00 0.30USDTENET HEALTHCARE 4.50 13-21 01/04S392 000 398 032.88 1.37USDTERRAFORM POWER OP 4.25 17-23 31/01S346 000 343 117.82 1.18USDT-MOBILE USA INC 6.50 13-24 15/01S370 000 384 267.20 1.32USDTRANSDIGM INC 6.50 14-24 15/07S71 000 72 826.12 0.25USDTRANSDIGM SUB 6.00 14-22 15/07S71 000 72 173.63 0.25USDTRI POINTE GROUP 4.875 16-21 01/07S157 000 157 662.54 0.54USDTRIBUNE MEDIA 5.875 16-22 15/07S135 000 137 998.35 0.48USDVALVOLINE INC 5.5 17-24 15/07S100 000 101 924.00 0.35USDWESCO DISTRIBUTION 5.375 14-21 15/12S322 000 326 933.04 1.13USDWHITING PETROLEUM 5.75 13-21 15/03S138 000 139 131.60 0.48USDWPX ENERGY 6.00 11-22 15/01S435 000 452 239.05 1.56USDWYNN LAS VEGAS 4.2500 13-23 30/05S233 000 230 210.99 0.79USDXPO LOGISTICS INC 6.50 15-22 15/06S83 000 84 971.25 0.29USDZAYO GROUP 6.00 15-23 01/04S379 000 384 548.56 1.32USD
REYNOLDS GRP ISS/R 4.38 16-21 15/07Q544 000 547 400.00 1.89USD
FLOATING RATE NOTES/OBLIGATIONS À TAUX VARIABLE 547 400.00 1.89
UNITED STATES/ÉTATS-UNIS 547 400.00 1.89
CSC HLDG 5.375 18-23 15/07S500 000 510 480.00 1.76USD
Other transferable securities/Autres valeurs mobilières 727 521.69 2.51
BONDS/OBLIGATIONS 727 521.69 2.51
UNITED STATES/ÉTATS-UNIS 727 521.69 2.51
HOLLY ENERGY PARTN 6.00 16-24 01/08S70 000 72 800.00 0.25USDPARSLEY ENERGY LLC 6.25 16-24 01/06S139 000 144 241.69 0.50USD
Schedule of investments as at 31/03/2019 / Inventaire du portefeuille au 31/03/2019
USD
Market ValueNumber of Shares orNominal Value
Investment % of Net AssetsQuotationCurrency
Valeur de marchéNombre d'actions ouvaleur nominale
Investissement % de l'actif netDevise decotation
Forward Foreign Currency Exchange Contracts/Contrats de change à terme 0.026 137.77CHF 5 668 065.79 0.13USD 39 944.635 677 610.81 15/04/2019Caceis BankEUR 3 718 981.05 (0.11)USD (32 473.91)3 279 559.44 15/04/2019Caceis BankGBP 84 477.80 0.00USD (1 332.95)63 764.96 15/04/2019Caceis Bank
USD
Unrealised appreciation/(depreciation)
Currency % of NetAssets
Amount bought Maturity Currency Amount soldCounterparty
Plus/(Moins) value non-réalisée
Devise % de l'actifnet
Montant acheté Maturité Devise Montant venduContrepartie

116

PrivilEdgeis an investment company
with variable capital ("SICAV")incorporated in Luxembourg
PrivilEdgeest une société d’investissement
à capital variable ("SICAV")enregistrée au Luxembourg RCS Luxembourg B0181207
PrivilEdge –DPAM European Real Estate
Unaudited semi-annual report · Rapport semestriel non révisé
31.03.2019

The accompanying notes form an integral part of these financial statements.Les notes annexées font partie intégrante de ces états financiers.
118 PrivilEdge - DPAM European Real Estate · 31/03/2019
ASSETS/ACTIF
134 126 159.11Investments in securities at market value/Portefeuille-titres à la valeur de marché (2):( EUR )125 658 652.70Acquisition cost/Coût d'acquisition
4 611 346.91Cash and term deposits/Liquidité et dépôts à terme95 615.90Receivable on investments sold/À recevoir sur vente de titres
434 270.19Amounts receivable on subscriptions/Montants à recevoir sur souscriptions d'actions904 465.58Interest and dividends receivable, net/Intérêt et dividendes nets à recevoir
8 181.06Formation/reorganisation expenses/Frais de constitution/réorganisation (2)140 180 038.75
LIABILITIES/PASSIF
782 063.15Payable on investments purchased/À payer sur achat de titres60 305.70Amounts payable on redemptions/Montants à payer sur rachats d'actions
106 439.48Management and distribution fees payable/Commission de gestion et de distribution à payer (3)27 425.33Taxes and expenses payable/Impôts et autres frais à payer17 950.00Unrealised depreciation on futures contracts/Moins-value non réalisée sur contrats futures (2)
880.66Payable on foreign exchange transactions, net/A payer sur opérations de change, net 228 993.26Unrealised depreciation on forward foreign currency exchange contracts/Moins-value non réalisée sur contrats de change à
terme(2)
1 224 057.58138 955 981.17NET ASSET VALUE/VALEUR NETTE D'INVENTAIRE
Statement of net assets as at 31/03/2019 / État de l'actif net au 31/03/2019
NotesNotes EUR

The accompanying notes form an integral part of these financial statements.Les notes annexées font partie intégrante de ces états financiers.
119PrivilEdge - DPAM European Real Estate · 31/03/2019
Statement of operations and changes in net assets for the period from 01/10/2018 to 31/03/2019 / État desopérations et des variations de l'actif net pour la période du 01/10/2018 au 31/03/2019
NotesNotes EUR
129 133 884.69NET ASSET VALUE AT THE BEGINNING OF THE PERIOD/VALEUR NETTE D'INVENTAIRE AU DÉBUT DE LAPÉRIODE
INCOME/REVENUS
941 648.57Dividends, net/Dividendes, nets (2)498 597.54Interest on bonds, net/Intérêts sur obligations, nets (2)
682.03Bank interest/Intérêts bancaires6 389.14Securities Lending Income/Revenus sur prêt de titres (9)
1 447 317.28EXPENSES/DÉPENSES
607 961.08Management fees/Commission de gestion (3)12 190.84Distribution fees/Frais de distribution (3)
4 056.13Bank interest and other expenses/Intérêts bancaires débiteurs et autres frais174 731.79Fixed Rate of Operational Costs/Taux Fixe de Coûts Opérationnels (4)
2 500.47Formation/Reorganisation expenses/Frais de constitution/réorganisation (2)801 440.31645 876.97NET INVESTMENT INCOME/REVENU NET SUR INVESTISSEMENTS
531 767.34Net realised gain on sale of investments/Gain net réalisé sur ventes d'investissements (2)(5 461.44)Net realised loss on futures contracts/Perte nette réalisée sur contrats futures
104 971.75Net realised gain on foreign exchange/Gain net réalisé sur opérations de change(274 239.99)Net realised loss on forward foreign currency exchange contracts/Perte nette réalisée sur contrats de change à terme1 002 914.63NET REALISED GAIN/GAIN NET RÉALISÉ
3 543 518.85Change in net unrealised appreciation or depreciation on investments/Variation de la plus ou moins-value nette non réaliséesur investissements
(2)
(24 780.00)Change in net unrealised appreciation or depreciation on futures contracts/Variation de la plus ou moins-value nette nonréalisée sur contrats futures
(118 781.41)Change in net unrealised appreciation or depreciation on forward foreign currency exchange contracts/Variation de la plus oumoins-value nette non réalisée sur contrats de change à terme
4 402 872.07NET INCREASE IN NET ASSETS AS A RESULT OF OPERATIONS/AUGMENTATION NETTE DE L'ACTIF NETRÉSULTANT DES OPÉRATIONS
(750 135.78)Dividend paid/Dividende payé6 169 360.19Net subscriptions/(redemptions) including equalisation/Souscriptions/(rachats) nets incluant la régularisation
138 955 981.17NET ASSET VALUE AT THE END OF THE PERIOD/VALEUR NETTE D'INVENTAIRE À LA FIN DE LA PÉRIODE

The accompanying notes form an integral part of these financial statements.Les notes annexées font partie intégrante de ces états financiers.
120 PrivilEdge - DPAM European Real Estate · 31/03/2019
31 537.9850 0.0000 (4 893.3950) 26 644.5900P - USD - Hedged - Distribution386 771.5880 142 978.1790 (10 825.1420) 518 924.6250P - EUR - Capitalisation412 000.0000 0.0000 0.0000 412 000.0000I - CHF - Hedged - Capitalisation
0.0000 413 227.3310 0.0000 413 227.3310I - EUR - Capitalisation753 872.0110 2 900.0000 (131 555.0000) 625 217.0110I - EUR - Distribution
11 300.0000 0.0000 0.0000 11 300.0000M - USD - Hedged - Capitalisation554 548.7340 86 679.1560 (55 300.0000) 585 927.8900M - CHF - Hedged - Capitalisation
23 700.0000 0.0000 0.0000 23 700.0000M - CHF - Hedged - Distribution4 388 565.2870 544 170.2850 (461 481.4170) 4 471 254.1550M - EUR - Capitalisation2 455 088.2690 279 737.3440 (116 197.3920) 2 618 628.2210M - EUR - Distribution
541 134.7000 91 375.3510 (43 923.7000) 588 586.3510M - GBP - Hedged - Distribution100 000.0000 115 000.0000 0.0000 215 000.0000N - CHF - Hedged - Capitalisation
1 594 971.2270 192 000.0000 (490 089.2780) 1 296 881.9490N - EUR - Capitalisation
Statement of changes in the number of shares outstanding for the period from 01/10/2018 to 31/03/2019 / Étatdes variations du nombre d'actions pour la période du 01/10/2018 au 31/03/2019
Number of Shares01/10/2018/
Nombre d'actions01/10/2018
Number of Sharesissued/
Nombre d'actionsémises
Number of Sharesredeemed/
Nombre d'actionsrachetées
Number of Shares31/03/2019/
Nombre d'actions31/03/2019
30/09/201831/03/2019For the period ended/Pour la période clôturée au
Statistics / Statistiques
30/09/2017
P - USD - Hedged - Distribution
326 548.4912.2557
0.13
375 208.8011.8970
0.10
199 373.9211.2803
0.00
Net Asset Value/Valeur Nette d'InventaireNet Asset Value per share/Valeur Nette d'Inventaire par actionDividend per share paid to shareholders/Dividende par action payé aux actionnaires
USD USD USD
P - EUR - Capitalisation
6 113 426.2411.7810
4 436 378.5311.4703
2 794 507.5811.0449
Net Asset Value/Valeur Nette d'InventaireNet Asset Value per share/Valeur Nette d'Inventaire par action
EUR EUR EUR
I - CHF - Hedged - Capitalisation
4 870 418.2411.8214
4 735 041.0311.4928
0.000.0000
Net Asset Value/Valeur Nette d'InventaireNet Asset Value per share/Valeur Nette d'Inventaire par action
CHF CHF CHF
I - EUR - Capitalisation
4 824 129.1411.6743
0.000.0000
0.000.0000
Net Asset Value/Valeur Nette d'InventaireNet Asset Value per share/Valeur Nette d'Inventaire par action
EUR EUR EUR

The accompanying notes form an integral part of these financial statements.Les notes annexées font partie intégrante de ces états financiers.
121PrivilEdge - DPAM European Real Estate · 31/03/2019
30/09/201831/03/2019For the period ended/Pour la période clôturée au
Statistics / Statistiques
30/09/2017
I - EUR - Distribution
7 298 930.2811.6742
0.22
8 704 665.0111.5466
0.17
9 295 920.9811.1970
0.00
Net Asset Value/Valeur Nette d'InventaireNet Asset Value per share/Valeur Nette d'Inventaire par actionDividend per share paid to shareholders/Dividende par action payé aux actionnaires
EUR EUR EUR
M - USD - Hedged - Capitalisation
140 857.4612.4653
134 828.2611.9317
0.000.0000
Net Asset Value/Valeur Nette d'InventaireNet Asset Value per share/Valeur Nette d'Inventaire par action
USD USD USD
M - CHF - Hedged - Capitalisation
6 901 144.0911.7781
6 357 383.0611.4641
7 573 579.1311.0413
Net Asset Value/Valeur Nette d'InventaireNet Asset Value per share/Valeur Nette d'Inventaire par action
CHF CHF CHF
M - CHF - Hedged - Distribution
270 661.8111.4203
0.18
267 820.0711.3004
0.16
62 935.5111.0413
0.00
Net Asset Value/Valeur Nette d'InventaireNet Asset Value per share/Valeur Nette d'Inventaire par actionDividend per share paid to shareholders/Dividende par action payé aux actionnaires
CHF CHF CHF
M - EUR - Capitalisation
53 306 397.1411.9220
50 797 553.2611.5750
36 412 259.2611.0901
Net Asset Value/Valeur Nette d'InventaireNet Asset Value per share/Valeur Nette d'Inventaire par action
EUR EUR EUR
M - EUR - Distribution
30 306 243.1111.5733
0.19
28 064 496.8911.4312
0.14
24 508 771.2911.0901
0.00
Net Asset Value/Valeur Nette d'InventaireNet Asset Value per share/Valeur Nette d'Inventaire par actionDividend per share paid to shareholders/Dividende par action payé aux actionnaires
EUR EUR EUR
M - GBP - Hedged - Distribution
6 903 951.0911.7297
0.19
6 237 821.0111.5273
0.14
1 923 627.2011.0865
0.00
Net Asset Value/Valeur Nette d'InventaireNet Asset Value per share/Valeur Nette d'Inventaire par actionDividend per share paid to shareholders/Dividende par action payé aux actionnaires
GBP GBP GBP
N - CHF - Hedged - Capitalisation
2 537 665.0711.8031
1 148 072.2911.4807
0.000.0000
Net Asset Value/Valeur Nette d'InventaireNet Asset Value per share/Valeur Nette d'Inventaire par action
CHF CHF CHF

The accompanying notes form an integral part of these financial statements.Les notes annexées font partie intégrante de ces états financiers.
122 PrivilEdge - DPAM European Real Estate · 31/03/2019
30/09/201831/03/2019For the period ended/Pour la période clôturée au
Statistics / Statistiques
30/09/2017
N - EUR - Capitalisation
15 640 445.0712.0600
18 663 084.8611.7012
9 788 758.8911.1886
Net Asset Value/Valeur Nette d'InventaireNet Asset Value per share/Valeur Nette d'Inventaire par action
EUR EUR EUR

The accompanying notes form an integral part of these financial statements.Les notes annexées font partie intégrante de ces états financiers.
123PrivilEdge - DPAM European Real Estate · 31/03/2019
Investments in securities at market value/Portefeuille-titres à la valeur de marché 134 126 159.11 96.52
CA-IMMOBILIEN-ANLAGEN AG68 000 2 189 600.00 1.57EUR
Transferable securities admitted to an official stock exchange listing and/or dealt in on anotherregulated market/Valeurs mobilières admises à la cote officielle d'une bourse de valeurs et/ounégociées sur un autre marché réglementé
123 762 101.66 89.06
EQUITIES/ACTIONS 85 174 568.70 61.30
AUSTRIA/AUTRICHE 3 185 900.00 2.29
IMMOFINANZ --- BEARER SHS45 000 996 300.00 0.72EUR
COFINIMMO SA12 000 1 420 800.00 1.02EUR
BELGIUM/BELGIQUE 3 289 360.00 2.37
INTERVEST OFFICES50 000 1 202 500.00 0.87EURRETAIL ESTATES3 800 308 560.00 0.22EURWAREHOUSING DISTRIBUTION DE PAUW SICAFI2 500 357 500.00 0.26EUR
ALTAREA4 500 827 100.00 0.60EUR
FRANCE/FRANCE 21 809 645.07 15.70
ARGAN47 957 2 781 506.00 2.00EURCARMILLA SAS45 896 781 149.92 0.56EURCOVIVIO SA19 000 1 797 400.00 1.29EURFREY17 000 510 000.00 0.37EURGECINA SA REG SHS15 438 2 034 728.40 1.46EURICADE SA17 100 1 289 340.00 0.93EURKLEPIERRE SA124 400 3 878 792.00 2.80EURMERCIALYS SA35 000 437 500.00 0.31EURPATRIMOINE ET COMMERCE37 965 687 166.50 0.49EURSCBSM30 995 212 315.75 0.15EURUNIBAIL RODAMCO44 975 6 572 646.50 4.74EUR
ALSTRIA OFFICE REIT AG70 000 1 015 000.00 0.73EUR
GERMANY/ALLEMAGNE 19 107 597.70 13.75
DEUTSCHE WOHNEN AG150 500 6 506 115.00 4.68EURLEG IMMOBILIEN - NAMEN AKT33 950 3 715 827.50 2.67EURVIB VERMOEGEN AG40 656 983 875.20 0.71EURVONOVIA SE149 000 6 886 780.00 4.96EUR
COIMA RES S.P.A.57 500 461 150.00 0.33EUR
ITALY/ITALIE 461 150.00 0.33
PHOENIX SPREE - REGISTERED SHS232 458 998 136.94 0.72GBP
JERSEY/JERSEY 998 136.94 0.72
ADO PROPERTIES12 400 628 060.00 0.45EUR
LUXEMBOURG/LUXEMBOURG 5 143 206.50 3.70
AROUNDTOWN SA425 000 3 123 750.00 2.25EURGRANDE CITY PROPERTIES S.A.54 585 1 173 577.50 0.84EURSHURGARD SELF STORAGE SA_ORDSHR7 400 217 819.00 0.16EUR
INMOBILIARIA COLONIAL SA120 200 1 101 633.00 0.79EUR
SPAIN/ESPAGNE 3 574 613.00 2.57
MERLIN PROPERTIES SOCIMI S.A.212 000 2 472 980.00 1.78EUR
CASTELLUM94 331 1 633 509.77 1.18SEK
SWEDEN/SUÈDE 6 438 361.29 4.63
CATENA31 997 791 111.40 0.57SEKFABEGE --REGISTERED SHS112 000 1 451 787.13 1.04SEKFASTIGHETS BALDER -B32 900 941 376.41 0.68SEK
Schedule of investments as at 31/03/2019 / Inventaire du portefeuille au 31/03/2019
EUR
Market ValueNumber of Shares orNominal Value
Investment % of Net AssetsQuotationCurrency
Valeur de marchéNombre d'actions ouvaleur nominale
Investissement % de l'actif netDevise decotation

The accompanying notes form an integral part of these financial statements.Les notes annexées font partie intégrante de ces états financiers.
124 PrivilEdge - DPAM European Real Estate · 31/03/2019
HUFVUDSTADEN AB -A-27 000 418 166.54 0.30SEKKUNGSLEDEN106 000 753 162.58 0.54SEKNYFOSA --- REGISTERED SHS84 000 449 247.46 0.32SEK
PSP SWISS PROPERTY AG9 600 928 879.95 0.67CHF
SWITZERLAND/SUISSE 2 903 035.55 2.09
SWISS PRIME SITE AG-NAMEN AKT25 302 1 974 155.60 1.42CHF
NSI NV9 000 340 650.00 0.25EUR
THE NETHERLANDS/PAYS-BAS 340 650.00 0.25
BRITISH LAND CO PLC REIT427 000 2 918 684.00 2.10GBP
UNITED KINGDOM/ROYAUME-UNI 17 922 912.65 12.90
DERWENT LONDON PLC27 700 1 036 057.79 0.75GBPGREAT PORT EST REIT -REGISTERED SHS81 500 706 043.29 0.51GBPHAMMERSON PLC111 500 434 509.69 0.31GBPINTU192 941 238 685.28 0.17GBPLAND SEC R.E.I.T287 000 3 042 193.34 2.19GBPLONDON STAMFORD PTY250 000 579 377.97 0.42GBPNEWRIVER REIT PLC169 483 469 092.45 0.34GBPSEGRO (REIT)463 500 3 622 152.72 2.61GBPSHAFTESBURY56 000 571 892.77 0.41GBPST.MODWEN PROPERTIES PLC70 000 322 339.56 0.23GBPTRITAX BIG BOX REIT PLC701 782 1 169 500.93 0.84GBPUNITE GROUP PLC151 900 1 617 363.93 1.16GBPURBAN & CIVIC PLC377 197 1 195 018.93 0.86GBP
VGP 3.90 16-23 21/09A300 000 311 676.00 0.22EUR
BONDS/OBLIGATIONS 33 560 458.90 24.15
BELGIUM/BELGIQUE 416 232.00 0.30
WDP 3.375 14-21 13/06A100 000 104 556.00 0.08EUR
ALTAREA 2.25 17-24 05/07A700 000 712 866.00 0.51EUR
FRANCE/FRANCE 9 286 534.20 6.68
ALTAREIT 2.875 18-25 02/07A600 000 587 832.00 0.42EURARGAN 3.25 17-23 04/07A600 000 622 711.20 0.45EURBENI STABILI SPA 1.625 17-24 17/10A500 000 506 300.00 0.36EURCARMILA 2.125 18-28 07/03A1 000 000 995 590.00 0.72EURCARMILA 2.375 16-24 16/09S500 000 527 255.00 0.38EURGECINA 2.00 15-24 17/06A600 000 645 804.00 0.46EURICADE 1.625 18-28 28/02A500 000 501 375.00 0.36EURKLEPIERRE 1.75 14-24 06/11A900 000 959 139.00 0.69EURMERCIALYS SA 1.787 14-23 31/03A1 000 000 1 022 250.00 0.75EURMERCIALYS SA 1.8 18-26 27/02A1 000 000 957 430.00 0.69EURPRIAMS 5.75 16-21 07/12A600 000 618 000.00 0.44EURUNIBAIL RODAMCO 1.50 17-28 22/02A600 000 629 982.00 0.45EUR
ADLER REAL ESTATE 4.75 15-20 08/04S190 000 190 518.70 0.14EUR
GERMANY/ALLEMAGNE 3 516 155.70 2.53
ALSTRIA OFFICE 1.50 17-27 15/11A500 000 484 975.00 0.35EURDEUTSCHE WOHNEN 1.375 15-20 24/07A800 000 814 696.00 0.59EURLEG IMMOBILIEN AG 1.25 17-24 23/01A1 400 000 1 421 868.00 1.02EURTLG IMMOBILEN AG 1.375 17-24 27/11Q600 000 604 098.00 0.43EUR
ATRIUM EUROPEAN REAL 3.0 18-25 11/09A100 000 104 186.00 0.07EUR
JERSEY/JERSEY 104 186.00 0.07
AROUNDTOWN SA 1.00 17-25 07/01A500 000 487 760.00 0.35EUR
LUXEMBOURG/LUXEMBOURG 9 801 512.00 7.06
Schedule of investments as at 31/03/2019 / Inventaire du portefeuille au 31/03/2019
EUR
Market ValueNumber of Shares orNominal Value
Investment % of Net AssetsQuotationCurrency
Valeur de marchéNombre d'actions ouvaleur nominale
Investissement % de l'actif netDevise decotation

The accompanying notes form an integral part of these financial statements.Les notes annexées font partie intégrante de ces états financiers.
125PrivilEdge - DPAM European Real Estate · 31/03/2019
AROUNDTOWN SA 1.625 18-28 31/01A700 000 671 881.00 0.48EURATF NETHERLANDS BV 2.125 16-23 13/03A200 000 209 946.00 0.15EURATF NETHERLANDS B.V. 1.875 17-26 19/01A500 000 506 270.00 0.36EURBLACKSTONE PP E 1.4000 18-22 06/07A500 000 509 890.00 0.37EURBLACKSTONE PP E 2.2000 18-25 24/07A300 000 306 456.00 0.22EURBLACKSTONE PROPERTY 2.00 19-24 15/02A500 000 512 795.00 0.37EURCPI PROPERTY GR 1.4500 18-22 14/04A700 000 707 791.00 0.51EURCPI PROPERTY GROUP 2.125 17-24 04/10A400 000 404 544.00 0.29EURDREAM GLOBAL FUNDING 1.375 17-21 21/12A800 000 806 496.00 0.58EURGELF BOND ISSUER I 0.875 16-22 18/10A1 100 000 1 108 261.00 0.80EURGRAND CITY PRO 1.50 15-25 17/04S200 000 204 402.00 0.15EURGRAND CITY PRO 1.50 18-27 22/02A500 000 494 915.00 0.36EURGRAND CITY PROPERTIES 1.375 17-26 03/08A700 000 694 911.00 0.50EURPROLOGIS INTL FUND II 1.876 15-25 17/04A1 100 000 1 162 524.00 0.84EURSELP FINANCE SARL 1.25 16-23 25/10A1 000 000 1 012 670.00 0.73EUR
GLOBALWORTH RE ESTATE 2.875 17-22 20/06A1 500 000 1 576 980.00 1.13EUR
ROMANIA/ROUMANIE 3 641 180.00 2.62
GLOBALWORTH RE ESTATE 3.000 18-25 29/03A2 000 000 2 064 200.00 1.49EUR
INMOBILIARIA CO 2.0000 18-26 17/04A600 000 613 788.00 0.44EUR
SPAIN/ESPAGNE 4 406 836.00 3.17
INMOBILIARIA COLONIA 1.45 16-24 28/10A700 000 705 355.00 0.50EURINMOBILIARIA COLONIA 1.625 17-25 28/11A700 000 703 234.00 0.51EURINMOBILIARIA COLONIA 2.728 15-23 05/06A400 000 431 480.00 0.31EURMERLIN PROP 1.75 17-25 26/05A500 000 506 605.00 0.36EURMERLIN PROP SOCIMI 2.225 16-23 25/04A300 000 314 904.00 0.23EURMERLIN PROPERTIES 2.375 17-29 18/09A600 000 605 880.00 0.44EURMETROVASECA EMTN 2.375 16-22 23/05A500 000 525 590.00 0.38EUR
VONOVIA FINANCE 1.25 16-24 06/12A600 000 616 182.00 0.44EUR
THE NETHERLANDS/PAYS-BAS 1 872 173.00 1.35
VONOVIA FINANCE BV 0.75 18-24 15/01A500 000 501 940.00 0.36EURVONOVIA FINANCE BV 2.75 18-38 22/03A500 000 551 035.00 0.40EURVONOVIA FINANCE BV 0.75 17-22 25/01A200 000 203 016.00 0.15EUR
HAMMERSON PLC 2.00 14 22 01/07A500 000 515 650.00 0.37EUR
UNITED KINGDOM/ROYAUME-UNI 515 650.00 0.37
BOIS SCIERIES MANCHE 2.50 17-23 15/05S51 000 411 827.27 0.30EUR
CONVERTIBLE BONDS/OBLIGATIONS CONVERTIBLES 1 617 204.06 1.16
FRANCE/FRANCE 1 617 204.06 1.16
CBO TERRITORIA 6.00 12-20 01/01M127 974 470 754.29 0.34EURFREY 6.00 12-22 15/11A28 671 734 622.50 0.52EUR
UNIBAIL RODAMCO FL.R 18-XX 25/04A500 000 495 795.00 0.36EUR
FLOATING RATE NOTES/OBLIGATIONS À TAUX VARIABLE 3 409 870.00 2.45
FRANCE/FRANCE 495 795.00 0.36
AROUNDTOWN SA FL.R 18-XX 17/01A500 000 453 605.00 0.33EUR
LUXEMBOURG/LUXEMBOURG 1 494 425.00 1.07
GRANDE CITY PROPERT. FL.R 15-XX 18/02A1 000 000 1 040 820.00 0.74EUR
ATF NETHERLANDS BV FL.R 16-XX 20/01A1 300 000 1 312 779.00 0.94EUR
THE NETHERLANDS/PAYS-BAS 1 419 650.00 1.02
VONOVIA SE FL.R 14-XX 17/12A100 000 106 871.00 0.08EUR
Schedule of investments as at 31/03/2019 / Inventaire du portefeuille au 31/03/2019
EUR
Market ValueNumber of Shares orNominal Value
Investment % of Net AssetsQuotationCurrency
Valeur de marchéNombre d'actions ouvaleur nominale
Investissement % de l'actif netDevise decotation

The accompanying notes form an integral part of these financial statements.Les notes annexées font partie intégrante de ces états financiers.
126 PrivilEdge - DPAM European Real Estate · 31/03/2019
CODIC INTL 4.625 19/24 13/03A100 000 100 846.00 0.07EUR
Other transferable securities/Autres valeurs mobilières 9 787 046.90 7.04
BONDS/OBLIGATIONS 8 257 990.50 5.94
BELGIUM/BELGIQUE 100 846.00 0.07
GECINA 1.375 17-27 30/06A400 000 411 844.00 0.30EUR
FRANCE/FRANCE 2 965 631.00 2.13
GECINA 1.375 17-28 26/01A600 000 612 066.00 0.44EURSTE FONCIERE LYON. 1.5 18-25 29/05A1 000 000 1 012 760.00 0.72EURUNIBAIL-RODAMCO SE 1.50 17-29 29/05A400 000 415 776.00 0.30EURUNIBAIL-RODAMCO SE 0.875 16-25 21/02A500 000 513 185.00 0.37EUR
FINANCE APSYS 4.75 17-22 28/07A500 000 500 000.00 0.36EUR
LUXEMBOURG/LUXEMBOURG 3 247 441.50 2.34
LOGICOR FIN 1.5 18-22 13/11A1 400 000 1 415 176.00 1.02EURPROLOGIS INTL FUND II 1.75 18-28 15/03A500 000 516 815.00 0.37EURQUARTUS SAS 7 18-22 19/06S500 000 515 963.50 0.37EURSELP FINANCE SARL 1.50 17-25 20/11A300 000 299 487.00 0.22EUR
MERLIN PROPERTIES 1.875 16-26 02/11A400 000 404 472.00 0.29EUR
SPAIN/ESPAGNE 404 472.00 0.29
AB SAGAX 2.25 19-25 13/03A500 000 507 520.00 0.37EUR
SWEDEN/SUÈDE 610 818.00 0.44
CASTELLUM AB 2.125 18-23 20/11A100 000 103 298.00 0.07EUR
VESTEDA FINANCE BV 2 18-26 10/07A900 000 928 782.00 0.67EUR
THE NETHERLANDS/PAYS-BAS 928 782.00 0.67
CBO TERRITORIA CV 3.75 18-24 01/07A53 000 253 003.40 0.18EUR
CONVERTIBLE BONDS/OBLIGATIONS CONVERTIBLES 253 003.40 0.18
FRANCE/FRANCE 253 003.40 0.18
CPI PROPERY FL.R 18-99 09/05A600 000 592 680.00 0.43EUR
FLOATING RATE NOTES/OBLIGATIONS À TAUX VARIABLE 1 265 093.00 0.91
LUXEMBOURG/LUXEMBOURG 1 265 093.00 0.91
GRAND CITY PROP FL.R 18-XX 24/04A700 000 672 413.00 0.48EUR
COFINIMMO RIGHT4 000 10 960.00 0.01EUR
WARRANTS, RIGHTS/WARRANTS, DROITS 10 960.00 0.01
BELGIUM/BELGIQUE 10 960.00 0.01
AEDIFICA1 260 107 226.00 0.08EUR
Shares of UCITS/UCI/Parts d'organismes de placement collectif 577 010.55 0.42
UCITS/UCI/Organismes de placement collectif 577 010.55 0.42
BELGIUM/BELGIQUE 107 226.00 0.08
GLBWR RE EST - EUR53 083 469 784.55 0.34EUR
ROMANIA/ROUMANIE 469 784.55 0.34
Schedule of investments as at 31/03/2019 / Inventaire du portefeuille au 31/03/2019
EUR
Market ValueNumber of Shares orNominal Value
Investment % of Net AssetsQuotationCurrency
Valeur de marchéNombre d'actions ouvaleur nominale
Investissement % de l'actif netDevise decotation

The accompanying notes form an integral part of these financial statements.Les notes annexées font partie intégrante de ces états financiers.
127PrivilEdge - DPAM European Real Estate · 31/03/2019
Schedule of investments as at 31/03/2019 / Inventaire du portefeuille au 31/03/2019
Futures Contracts/Contrats futures (0.01)(17 950.00)EURO BUND FUTURE Caceis Bank (831 700.00) (0.01)EUR (17 950.00)30/06/2019(5)
EUR EUR
Unrealised appreciation/(depreciation)
Underlying Intermediary % of NetAssets
Maturity Currency CommitmentNumber ofcontracts
Plus/(Moins) value non-réalisée
Sous-jacent Intermédiaire % de l'actifnet
Maturité Devise EngagementNombre decontrats
Forward Foreign Currency Exchange Contracts/Contrats de change à terme (0.16)(228 993.26)EUR 25 187.03 0.00GBP 104.5029 321.13 15/04/2019Caceis BankEUR 20 056.08 0.00CHF (47.28)17 890.37 15/04/2019Caceis BankCHF 12 848 434.97 0.14EUR 196 596.2914 585 643.63 15/04/2019Caceis BankUSD 411 142.03 0.00EUR 3 515.61466 110.55 15/04/2019Caceis BankGBP 8 077 226.11 (0.04)EUR (58 353.50)6 912 887.95 15/04/2019Caceis BankEUR 3 000 000.00 (0.03)CHF (39 085.19)2 645 152.76 27/05/2019Caceis BankEUR 60 000 000.00 (0.07)SEK (102 921.85)5 655 149.01 28/05/2019Caceis BankEUR 15 900 000.00 (0.16)GBP (228 801.84)18 188 057.65 28/05/2019Caceis Bank
EUR
Unrealised appreciation/(depreciation)
Currency % of NetAssets
Amount bought Maturity Currency Amount soldCounterparty
Plus/(Moins) value non-réalisée
Devise % de l'actifnet
Montant acheté Maturité Devise Montant venduContrepartie

128

PrivilEdgeis an investment company
with variable capital ("SICAV")incorporated in Luxembourg
PrivilEdgeest une société d’investissement
à capital variable ("SICAV")enregistrée au Luxembourg RCS Luxembourg B0181207
PrivilEdge –H2O High Conviction Bonds
Unaudited semi-annual report · Rapport semestriel non révisé
31.03.2019

The accompanying notes form an integral part of these financial statements.Les notes annexées font partie intégrante de ces états financiers.
130 PrivilEdge - H2O High Conviction Bonds · 31/03/2019
ASSETS/ACTIF
305 476 319.67Investments in securities at market value/Portefeuille-titres à la valeur de marché (2):( EUR )299 084 998.14Acquisition cost/Coût d'acquisition
68 639 864.64Cash and term deposits/Liquidité et dépôts à terme4 719 817.51Amounts receivable on subscriptions/Montants à recevoir sur souscriptions d'actions2 032 866.18Interest and dividends receivable, net/Intérêt et dividendes nets à recevoir
8 181.06Formation/reorganisation expenses/Frais de constitution/réorganisation (2)1 684 517.06Unrealised appreciation on futures contracts/Plus-value non réalisée sur contrats futures (2)5 294 979.75Unrealised appreciation on forward foreign currency exchange contracts/Plus-value non réalisée sur contrats de change à
terme(2)
387 856 545.87LIABILITIES/PASSIF
209 232.98Net options at market value/Position nette en options à la valeur de marché (2):( EUR )354 956.35Acquisition cost/Coût d'acquisition
13 125 851.65Bank overdrafts/Découverts bancaires71 833.78Amounts payable on redemptions/Montants à payer sur rachats d'actions
228 599.38Management and distribution fees payable/Commission de gestion et de distribution à payer (3)2 845 082.45Taxes and expenses payable/Impôts et autres frais à payer
107 917.84Payable on foreign exchange transactions, net/A payer sur opérations de change, net 16 588 518.08
371 268 027.79NET ASSET VALUE/VALEUR NETTE D'INVENTAIRE
Statement of net assets as at 31/03/2019 / État de l'actif net au 31/03/2019
NotesNotes EUR

The accompanying notes form an integral part of these financial statements.Les notes annexées font partie intégrante de ces états financiers.
131PrivilEdge - H2O High Conviction Bonds · 31/03/2019
Statement of operations and changes in net assets for the period from 01/10/2018 to 31/03/2019 / État desopérations et des variations de l'actif net pour la période du 01/10/2018 au 31/03/2019
NotesNotes EUR
257 668 383.16NET ASSET VALUE AT THE BEGINNING OF THE PERIOD/VALEUR NETTE D'INVENTAIRE AU DÉBUT DE LAPÉRIODE
INCOME/REVENUS
2 140 318.36Interest on bonds, net/Intérêts sur obligations, nets (2)45 040.14Bank interest/Intérêts bancaires
2 185 358.50EXPENSES/DÉPENSES
1 148 091.49Management fees/Commission de gestion (3)33 900.12Distribution fees/Frais de distribution (3)
6 294 792.43Performance fees/Commission de performance (3)106 789.60Bank interest and other expenses/Intérêts bancaires débiteurs et autres frais406 257.55Fixed Rate of Operational Costs/Taux Fixe de Coûts Opérationnels (4)
2 500.47Formation/Reorganisation expenses/Frais de constitution/réorganisation (2)7 992 331.66
(5 806 973.16)NET INVESTMENT LOSS/PERTE NETTE SUR INVESTISSEMENTS
(408 834.34)Net realised loss on sale of investments/Perte nette réalisée sur ventes d'investissements (2)563 158.51Net realised gain on options/Gain net réalisé sur options
13 721 976.30Net realised gain on futures contracts/Gain net réalisé sur contrats futures1 370 889.79Net realised gain on foreign exchange/Gain net réalisé sur opérations de change
31 806 464.01Net realised gain on forward foreign currency exchange contracts/Gain net réalisé sur contrats de change à terme41 246 681.11NET REALISED GAIN/GAIN NET RÉALISÉ
3 024 717.20Change in net unrealised appreciation or depreciation on investments/Variation de la plus ou moins-value nette non réaliséesur investissements
(2)
(174 499.22)Change in net unrealised appreciation or depreciation on options/Variation de la plus ou moins-value non réalisée sur options(4 162 925.28)Change in net unrealised appreciation or depreciation on futures contracts/Variation de la plus ou moins-value nette non
réalisée sur contrats futures5 181 994.92Change in net unrealised appreciation or depreciation on forward foreign currency exchange contracts/Variation de la plus ou
moins-value nette non réalisée sur contrats de change à terme45 115 968.73NET INCREASE IN NET ASSETS AS A RESULT OF OPERATIONS/AUGMENTATION NETTE DE L'ACTIF NET
RÉSULTANT DES OPÉRATIONS68 483 675.90Net subscriptions/(redemptions) including equalisation/Souscriptions/(rachats) nets incluant la régularisation
371 268 027.79NET ASSET VALUE AT THE END OF THE PERIOD/VALEUR NETTE D'INVENTAIRE À LA FIN DE LA PÉRIODE

The accompanying notes form an integral part of these financial statements.Les notes annexées font partie intégrante de ces états financiers.
132 PrivilEdge - H2O High Conviction Bonds · 31/03/2019
191 946.6290 427 359.2910 (58 663.0650) 560 642.8550P - USD - Hedged - Capitalisation443 602.4990 69 490.0020 (105 466.2350) 407 626.2660P - CHF - Hedged - Capitalisation263 974.5510 784 691.4710 (102 823.6440) 945 842.3780P - EUR - Capitalisation
1 089.6710 0.0000 0.0000 1 089.6710P - GBP - Hedged - Capitalisation442 717.0000 98 789.4180 (135 000.0000) 406 506.4180I - EUR - Capitalisation
3 144 031.0690 563 098.8000 (315 285.8520) 3 391 844.0170M - USD - Hedged - Capitalisation271 517.0210 214 879.1190 (46 857.3050) 439 538.8350M - USD - Hedged - Distribution
3 967 782.5610 1 258 446.5350 (664 550.4880) 4 561 678.6080M - CHF - Hedged - Capitalisation187 805.3910 16 720.0000 (11 550.0000) 192 975.3910M - CHF - Hedged - Distribution
6 479 571.6680 1 254 849.2120 (566 076.4790) 7 168 344.4010M - EUR - Capitalisation1 325 791.2870 415 967.1890 (127 854.0000) 1 613 904.4760M - EUR - Distribution
76 595.2140 10 600.0000 0.0000 87 195.2140M - GBP - Hedged - Capitalisation187 144.0960 21 022.3460 (59 323.0000) 148 843.4420M - GBP - Hedged - Distribution
0.0000 1 000.0000 0.0000 1 000.0000M - JPY - Hedged - Capitalisation2 018 696.4980 819 907.6230 (297 138.0000) 2 541 466.1210N - USD - Hedged - Capitalisation
85 000.0000 20 000.0000 0.0000 105 000.0000N - USD - Hedged - Distribution1 383 620.7420 1 472 564.9170 (284 956.2800) 2 571 229.3790N - CHF - Hedged - Capitalisation
0.0000 18 627.2490 0.0000 18 627.2490N - CHF - Hedged - Distribution1 323 987.6880 531 349.8340 (73 200.0000) 1 782 137.5220N - EUR - Capitalisation
283 688.3420 154 293.4960 0.0000 437 981.8380N - EUR - Distribution
Statement of changes in the number of shares outstanding for the period from 01/10/2018 to 31/03/2019 / Étatdes variations du nombre d'actions pour la période du 01/10/2018 au 31/03/2019
Number of Shares01/10/2018/
Nombre d'actions01/10/2018
Number of Sharesissued/
Nombre d'actionsémises
Number of Sharesredeemed/
Nombre d'actionsrachetées
Number of Shares31/03/2019/
Nombre d'actions31/03/2019
30/09/201831/03/2019For the period ended/Pour la période clôturée au
Statistics / Statistiques
30/09/2017
P - USD - Hedged - Capitalisation
8 166 620.5814.5665
2 416 016.5712.5869
715 918.0410.6380
Net Asset Value/Valeur Nette d'InventaireNet Asset Value per share/Valeur Nette d'Inventaire par action
USD USD USD
P - CHF - Hedged - Capitalisation
5 688 213.1913.9545
5 428 087.9612.2364
3 722 973.4610.5616
Net Asset Value/Valeur Nette d'InventaireNet Asset Value per share/Valeur Nette d'Inventaire par action
CHF CHF CHF
P - EUR - Capitalisation
13 464 100.2314.2350
3 285 533.0612.4464
1 539 757.3910.6954
Net Asset Value/Valeur Nette d'InventaireNet Asset Value per share/Valeur Nette d'Inventaire par action
EUR EUR EUR

The accompanying notes form an integral part of these financial statements.Les notes annexées font partie intégrante de ces états financiers.
133PrivilEdge - H2O High Conviction Bonds · 31/03/2019
30/09/201831/03/2019For the period ended/Pour la période clôturée au
Statistics / Statistiques
30/09/2017
P - GBP - Hedged - Capitalisation
15 728.4914.4342
13 688.2912.5619
0.000.0000
Net Asset Value/Valeur Nette d'InventaireNet Asset Value per share/Valeur Nette d'Inventaire par action
GBP GBP GBP
I - EUR - Capitalisation
5 814 914.8614.3046
5 515 057.0812.4573
2 178 692.3010.6278
Net Asset Value/Valeur Nette d'InventaireNet Asset Value per share/Valeur Nette d'Inventaire par action
EUR EUR EUR
M - USD - Hedged - Capitalisation
50 319 892.3714.8356
40 204 320.2512.7875
20 706 866.7410.7555
Net Asset Value/Valeur Nette d'InventaireNet Asset Value per share/Valeur Nette d'Inventaire par action
USD USD USD
M - USD - Hedged - Distribution
6 509 806.5814.8105
0.00
3 466 721.6712.7680
0.00
990 300.8610.7437
0.00
Net Asset Value/Valeur Nette d'InventaireNet Asset Value per share/Valeur Nette d'Inventaire par actionDividend per share paid to shareholders/Dividende par action payé aux actionnaires
USD USD USD
M - CHF - Hedged - Capitalisation
64 415 448.3414.1210
48 990 223.5212.3470
32 394 615.1110.6079
Net Asset Value/Valeur Nette d'InventaireNet Asset Value per share/Valeur Nette d'Inventaire par action
CHF CHF CHF
M - CHF - Hedged - Distribution
2 727 966.0814.1363
0.00
2 322 112.0812.3645
0.00
1 220 107.9510.6282
0.00
Net Asset Value/Valeur Nette d'InventaireNet Asset Value per share/Valeur Nette d'Inventaire par actionDividend per share paid to shareholders/Dividende par action payé aux actionnaires
CHF CHF CHF
M - EUR - Capitalisation
102 191 754.9814.2560
80 556 321.0112.4324
35 078 174.2210.6380
Net Asset Value/Valeur Nette d'InventaireNet Asset Value per share/Valeur Nette d'Inventaire par action
EUR EUR EUR
M - EUR - Distribution
22 974 541.3814.2354
0.00
16 457 346.8712.4132
0.00
5 739 316.7910.6214
0.00
Net Asset Value/Valeur Nette d'InventaireNet Asset Value per share/Valeur Nette d'Inventaire par actionDividend per share paid to shareholders/Dividende par action payé aux actionnaires
EUR EUR EUR

The accompanying notes form an integral part of these financial statements.Les notes annexées font partie intégrante de ces états financiers.
134 PrivilEdge - H2O High Conviction Bonds · 31/03/2019
30/09/201831/03/2019For the period ended/Pour la période clôturée au
Statistics / Statistiques
30/09/2017
M - GBP - Hedged - Capitalisation
1 267 159.2214.5324
966 090.3612.6129
386 886.1010.7171
Net Asset Value/Valeur Nette d'InventaireNet Asset Value per share/Valeur Nette d'Inventaire par action
GBP GBP GBP
M - GBP - Hedged - Distribution
2 161 839.0714.5242
0.00
2 359 694.0412.6090
0.00
2 155 421.2010.7131
0.00
Net Asset Value/Valeur Nette d'InventaireNet Asset Value per share/Valeur Nette d'Inventaire par actionDividend per share paid to shareholders/Dividende par action payé aux actionnaires
GBP GBP GBP
M - JPY - Hedged - Capitalisation
10 280 82710 281
00
00
Net Asset Value/Valeur Nette d'InventaireNet Asset Value per share/Valeur Nette d'Inventaire par action
JPY JPY JPY
N - USD - Hedged - Capitalisation
37 876 386.2614.9034
25 919 489.9212.8397
4 981 365.4210.7803
Net Asset Value/Valeur Nette d'InventaireNet Asset Value per share/Valeur Nette d'Inventaire par action
USD USD USD
N - USD - Hedged - Distribution
1 567 537.3314.9289
0.00
1 092 179.8412.8492
0.00
0.000.0000
0.00
Net Asset Value/Valeur Nette d'InventaireNet Asset Value per share/Valeur Nette d'Inventaire par actionDividend per share paid to shareholders/Dividende par action payé aux actionnaires
USD USD USD
N - CHF - Hedged - Capitalisation
36 426 478.1214.1670
17 118 926.2312.3726
1 187 948.1310.6067
Net Asset Value/Valeur Nette d'InventaireNet Asset Value per share/Valeur Nette d'Inventaire par action
CHF CHF CHF
N - CHF - Hedged - Distribution
263 925.3114.1688
0.00
0.000.0000
0.00
0.000.0000
0.00
Net Asset Value/Valeur Nette d'InventaireNet Asset Value per share/Valeur Nette d'Inventaire par actionDividend per share paid to shareholders/Dividende par action payé aux actionnaires
CHF CHF CHF
N - EUR - Capitalisation
25 546 700.2014.3349
16 537 453.6412.4906
7 281 154.9610.6651
Net Asset Value/Valeur Nette d'InventaireNet Asset Value per share/Valeur Nette d'Inventaire par action
EUR EUR EUR

The accompanying notes form an integral part of these financial statements.Les notes annexées font partie intégrante de ces états financiers.
135PrivilEdge - H2O High Conviction Bonds · 31/03/2019
30/09/201831/03/2019For the period ended/Pour la période clôturée au
Statistics / Statistiques
30/09/2017
N - EUR - Distribution
6 241 610.0714.2508
0.00
3 532 301.8612.4513
0.00
0.000.0000
0.00
Net Asset Value/Valeur Nette d'InventaireNet Asset Value per share/Valeur Nette d'Inventaire par actionDividend per share paid to shareholders/Dividende par action payé aux actionnaires
EUR EUR EUR

The accompanying notes form an integral part of these financial statements.Les notes annexées font partie intégrante de ces états financiers.
136 PrivilEdge - H2O High Conviction Bonds · 31/03/2019
Investments in securities at market value/Portefeuille-titres à la valeur de marché 305 476 319.67 82.28
HELLENIC REPUBLIC 3.50 17-23 30/01A5 809 875 6 091 305.34 1.64EUR
Transferable securities admitted to an official stock exchange listing and/or dealt in on anotherregulated market/Valeurs mobilières admises à la cote officielle d'une bourse de valeurs et/ounégociées sur un autre marché réglementé
102 184 796.05 27.52
BONDS/OBLIGATIONS 98 766 352.25 26.60
GREECE/GRÈCE 34 313 190.38 9.23
HELLENIC REPUBLIC 3.75 17-28 30/01A13 246 500 13 402 013.91 3.61EURHELLENIC REPUBLIC 3.90 17-33 30/01A130 000 127 002.20 0.03EURHELLENIC REPUBLIC 4.00 17-37 30/01A202 500 192 648.38 0.05EURHELLENIC REPUBLIC 4.20 17-42 30/01A1 810 000 1 719 337.10 0.46EURHELLENIC REPUBLIC 4.375 17-22 01/08A1 200 000 1 293 756.00 0.35EURHELLENIC REPUBLIC 4.75 14-19 17/04A11 465 000 11 487 127.45 3.09EUR
BANCA CARIGE CASSA DI 0.75 19-20 26/07U3 000 000 3 006 600.00 0.81EUR
ITALY/ITALIE 11 272 818.50 3.04
ITALY BTP 4.75 13-44 01/09S5 150 000 6 263 378.50 1.69EURITALY BTP 3.45 17-48 01/03S2 000 000 2 002 840.00 0.54EUR
MEX BONOS DESARR FIX 10.00 05-24 05/12S1 860 000 9 377 583.61 2.53MXN
MEXICO/MEXIQUE 31 625 236.32 8.52
MEXICAN BONOS 7.50 06-27 03/06S5 000 000 22 247 652.71 5.99MXN
PORTUGAL 2.875 15-25 15/10A2 640 000 3 035 947.20 0.82EUR
PORTUGAL/PORTUGAL 14 746 359.50 3.97
PORTUGAL 4.95 08-23 25/10A2 700 000 3 305 178.00 0.89EURPORTUGAL REGS 144A 4.125 17-27 14/04A1 900 000 2 369 395.00 0.64EURPORTUGAL REPU OF 4.10 06-37 15/04A4 400 000 5 803 468.00 1.56EURPORTUGUESE OT'S 4.75 09-19 14/06A230 000 232 371.30 0.06EUR
MINISTRY RUSSIA 6.9 18-29 07/03S65 000 000 802 477.07 0.22RUB
RUSSIA/RUSSIE 802 477.07 0.22
SENEGAL REGS 6.25 14-24 30/07S200 000 185 502.96 0.05USD
SENEGAL/SENEGAL 185 502.96 0.05
REPUBLIC OF TUR 7.2500 18-23 23/12S1 300 000 1 167 586.05 0.31USD
TURKEY/TURQUIE 4 258 715.76 1.15
REPUBLIC OF TURKEY 4.875 13-43 16/04S2 250 000 1 488 083.89 0.41USDTURKEY (REP OF) 4.875 16-26 09/10S500 000 384 757.53 0.10USDTURQUIE 6.125 18-28 24/10S1 500 000 1 218 288.29 0.33USD
UK TSY 3.25 12-44 22/01S1 000 000 1 562 051.76 0.42GBP
UNITED KINGDOM/ROYAUME-UNI 1 562 051.76 0.42
KBC GROUPE SA FL.R 19-99 31/12S600 000 601 764.00 0.16EUR
FLOATING RATE NOTES/OBLIGATIONS À TAUX VARIABLE 3 418 443.80 0.92
BELGIUM/BELGIQUE 601 764.00 0.16
SOCIETE GENERALE REGS FL.R 18-XX 04/04A600 000 532 270.57 0.14USD
FRANCE/FRANCE 532 270.57 0.14
BANCO SANTANDER FL.R 19-24 02/08Q600 000 534 659.13 0.14USD
SPAIN/ESPAGNE 1 601 569.18 0.43
BANKIA SUB FL.R 17-XX 18/07Q600 000 588 978.00 0.16EURBBVA SUB FL.R 17-XX 16/11Q600 000 477 932.05 0.13USD
Schedule of investments as at 31/03/2019 / Inventaire du portefeuille au 31/03/2019
EUR
Market ValueNumber of Shares orNominal Value
Investment % of Net AssetsQuotationCurrency
Valeur de marchéNombre d'actions ouvaleur nominale
Investissement % de l'actif netDevise decotation

The accompanying notes form an integral part of these financial statements.Les notes annexées font partie intégrante de ces états financiers.
137PrivilEdge - H2O High Conviction Bonds · 31/03/2019
UBS GROUP FUNDING FL.R 18-XX 31/01A600 000 464 680.05 0.13USD
SWITZERLAND/SUISSE 464 680.05 0.13
COOP RABOBANK UA FL.R 16-49 26/04A200 000 218 160.00 0.06EUR
THE NETHERLANDS/PAYS-BAS 218 160.00 0.06
BELFIUS BANK SA FL.R 18-XX 16/04S600 000 484 716.00 0.13EUR
Other transferable securities/Autres valeurs mobilières 1 844 598.05 0.50
FLOATING RATE NOTES/OBLIGATIONS À TAUX VARIABLE 1 844 598.05 0.50
BELGIUM/BELGIQUE 484 716.00 0.13
FCA BANK SPA IRELAND FL.R 17-19 18/12Q300 000 300 066.30 0.08EUR
IRELAND/IRLANDE 300 066.30 0.08
INTESA SAN PAOLO FL.R 17-XX 11/07S300 000 325 749.00 0.09EUR
ITALY/ITALIE 325 749.00 0.09
COOPERATIVE RABOBANK FL.R 18-XX 29/12S200 000 203 442.00 0.05EUR
THE NETHERLANDS/PAYS-BAS 734 066.75 0.20
ING GROEP NV FL.R 19-XX 16/04S600 000 530 624.75 0.15USD
FRANCE TREASURY BILL ZCP 1306197 000 000 7 007 627.47 1.89EUR
Money market instruments/Instruments du marché monétaire 201 446 925.57 54.26
BONDS/OBLIGATIONS 201 446 925.57 54.26
FRANCE/FRANCE 7 007 627.47 1.89
JAPAN TREASURY DISC ZCP 0404191 347 000 000 10 838 547.39 2.92JPY
JAPAN/JAPON 26 996 318.55 7.27
JAPAN TREASURY DISC ZCP 0804191 608 000 000 12 938 893.63 3.48JPYJAPAN TREASURY DISC ZCP 220419400 000 000 3 218 877.53 0.87JPY
UNIT STAT TREA BIL ZCP 05-07-1916 000 000 14 159 694.03 3.81USD
UNITED STATES/ÉTATS-UNIS 167 442 979.55 45.10
UNIT STAT TREA BIL ZCP 25-04-1934 500 000 30 673 537.20 8.27USDUS TREASURY BILL ZCP 02051934 500 000 30 657 628.29 8.26USDUS TREASURY BILL ZCP 07051934 500 000 30 646 648.65 8.25USDUS TREASURY BILL ZCP 09051934 500 000 30 642 628.32 8.25USDUS TREASURY BILL ZCP 30041934 500 000 30 662 843.06 8.26USD
Schedule of investments as at 31/03/2019 / Inventaire du portefeuille au 31/03/2019
EUR
Market ValueNumber of Shares orNominal Value
Investment % of Net AssetsQuotationCurrency
Valeur de marchéNombre d'actions ouvaleur nominale
Investissement % de l'actif netDevise decotation
Net options at market value/Position nette en options à la valeur de marché (209 232.98) (0.06)
EURO BUND JUN 164.00 24.05.19 CALL(80) (114 400.00) (0.03)EUR
Listed options (Counterparty, please refer to Note 2) /Options listées (Contreparties voir la note 2) (216 800.00) (0.06)
Sold listed options at market value/Positions courtes en options listées à la valeur de marché (216 800.00) (0.06)
EURO BUND JUN 164.50 24.05.19 CALL(80) (102 400.00) (0.03)EUR
EUR(P)/GBP(C)OTC APR 0.860 01.04.19 PUT10 000 000 37 374.80 0.01EUR
OTC options (Counterparties refer to Note 2) /Options OTC (Contreparties voir la note 2) 7 567.02 0.00
Purchased OTC options at market value/Positions longues en options OTC à la valeur de marché 44 944.82 0.01
USD(P)/TRY(C)OTC JUL 4.505 31.07.19 PUT200 000 7 570.02 0.00USD
EUR(C)/GBP(P)OTC APR 0.935 01.04.19 CALL(30 000 000) (3.00) 0.00EUR
Sold OTC options at market value/Positions courtes en options OTC à la valeur de marché (37 377.80) (0.01)
EUR(P)/GBP(C)OTC APR 0.860 01.04.19 PUT(10 000 000) (37 374.80) (0.01)EUR

The accompanying notes form an integral part of these financial statements.Les notes annexées font partie intégrante de ces états financiers.
138 PrivilEdge - H2O High Conviction Bonds · 31/03/2019
Schedule of investments as at 31/03/2019 / Inventaire du portefeuille au 31/03/2019
Futures Contracts/Contrats futures 0.451 684 517.06AUSTR 10YR BOND Caceis Bank 262 965.52 0.00AUD 4 884.7430/06/20193EURO BOBL FUTURE Caceis Bank (11 183 760.00) (0.02)EUR (90 090.00)30/06/2019(84)EURO BTP FUTURE -EUX Caceis Bank 359 279 250.00 1.73EUR 6 457 550.0030/06/20192 775EURO BUND FUTURE Caceis Bank (34 598 720.00) (0.07)EUR (269 960.00)30/06/2019(208)EURO BUXL FUTURE Caceis Bank (1 533 280.00) (0.02)EUR (64 480.00)30/06/2019(8)EURO SCHATZ FUTURE Caceis Bank (230 668 500.00) (0.11)EUR (414 616.95)30/06/2019(2 060)JPN 10 YEARS BOND Caceis Bank 2 466 635.53 0.00JPY 8 609.4130/06/20192LONG GILT FUTURE-LIF Caceis Bank 8 857 873.97 0.04GBP 137 913.4330/06/201959US TREASURY BOND Caceis Bank (146 477 462.48) (0.92)USD (3 396 936.37)30/06/2019(1 099)US ULTRA BD CBT 30YR Caceis Bank 62 989 713.68 0.18USD 655 558.4030/06/2019421US 10 YEARS NOTE Caceis Bank (22 236 245.94) (0.08)USD (312 924.42)30/06/2019(201)US 2 YEARS NOTE- CBT Caceis Bank (948 896.78) 0.00USD (3 764.14)30/06/2019(5)US 5 YEARS NOTE-CBT Caceis Bank (401 274 797.39) (0.28)USD (1 027 227.04)30/06/2019(3 890)
EUR EUR
Unrealised appreciation/(depreciation)
Underlying Intermediary % of NetAssets
Maturity Currency CommitmentNumber ofcontracts
Plus/(Moins) value non-réalisée
Sous-jacent Intermédiaire % de l'actifnet
Maturité Devise EngagementNombre decontrats
Forward Foreign Currency Exchange Contracts/Contrats de change à terme 1.435 294 979.75USD 427 360 000.00 0.00IDR 222.3830 260.93 01/04/2019Deutsche BankBRL 400 000.00 0.00USD (6 371.37)1 528 840.00 01/04/2019Morgan StanleyIDR 30 114.86 0.00USD (92.29)427 360 000.00 01/04/2019Goldman SachsUSD 133 000 000.00 0.17ZAR 628 103.879 927 739.77 02/04/2019Goldman SachsBRL 3 489 066.32 (0.01)USD (19 325.80)13 493 964.00 02/04/2019Goldman SachsMXN 2 804 125.95 0.04USD 165 186.9358 000 000.00 03/04/2019Goldman SachsUSD 13 493 964.00 0.01BRL 23 457.563 493 221.16 04/04/2019Goldman SachsBRL 9 203 310.87 0.05USD 176 376.0536 592 364.00 04/04/2019Morgan StanleyUSD 23 098 400.00 0.02BRL 76 244.716 020 068.28 04/04/2019Deutsche BankUSD 50 000 000.00 0.12NZD 447 196.7934 604 385.00 05/04/2019Goldman SachsUSD 36 592 364.00 (0.05)BRL (177 171.72)9 201 806.55 05/04/2019Morgan StanleyBRL 9 193 140.48 0.05USD 184 853.2836 592 364.00 05/04/2019Morgan StanleyUSD 3 406 093 100.00 0.00KRW 12 104.243 010 000.00 08/04/2019JP MorganUSD 1 201 702 166.00 0.09TWD 330 652.3739 320 141.55 08/04/2019Deutsche BankUSD 3 100 000.00 0.01CHF 47 912.923 168 364.76 08/04/2019Goldman SachsUSD 1 952 604 380.00 0.01KRW 19 838.081 740 000.00 08/04/2019Morgan StanleyAUD 11 347 744.00 0.00USD 17 179.5716 000 000.00 08/04/2019Goldman SachsEUR 2 250 000 000.00 0.00JPY (17 371.28)18 085 743.79 08/04/2019Deutsche BankTWD 38 934 137.92 0.00USD 13 473.901 201 702 167.00 08/04/2019Goldman SachsBRL 3 469 509.68 0.00USD (3 193.10)13 493 964.00 08/04/2019Goldman SachsUSD 89 000 000.00 0.00AUD 6 686.6863 236 636.00 08/04/2019Goldman SachsUSD 3 770 724 586.00 0.00KRW 11 412.393 330 000.00 08/04/2019Goldman SachsUSD 8 779 033 529.00 0.00COP 17 298.822 774 224.53 09/04/2019Deutsche BankUSD 1 558 680.00 0.00BRL (284.37)400 000.00 09/04/2019Morgan StanleyUSD 92 822 800.00 0.00CLP 3 195.93140 000.00 10/04/2019Deutsche BankUSD 318 581 100.00 0.00CLP 1 617.87470 000.00 10/04/2019JP MorganUSD 120 286 500.00 0.00CLP 2 875.00180 000.00 10/04/2019Société GénéraleUSD 211 380 861.00 0.00CLP 8 333.08320 000.00 10/04/2019Goldman SachsBRL 200 000.00 0.00USD (96.94)778 380.00 11/04/2019Morgan StanleyUSD 305 890 002.00 0.00TWD (1 368.54)9 911 862.92 11/04/2019Deutsche BankUSD 7 392 497 259.00 0.03KRW 102 158.676 616 690.32 11/04/2019Deutsche BankTRY 24 843 958.78 (0.31)USD (1 139 732.97)135 000 000.00 11/04/2019Goldman Sachs
EUR
Unrealised appreciation/(depreciation)
Currency % of NetAssets
Amount bought Maturity Currency Amount soldCounterparty
Plus/(Moins) value non-réalisée
Devise % de l'actifnet
Montant acheté Maturité Devise Montant venduContrepartie

The accompanying notes form an integral part of these financial statements.Les notes annexées font partie intégrante de ces états financiers.
139PrivilEdge - H2O High Conviction Bonds · 31/03/2019
Schedule of investments as at 31/03/2019 / Inventaire du portefeuille au 31/03/2019
USD 5 544 372 944.00 0.02KRW 86 540.944 973 640.66 11/04/2019Goldman SachsUSD 701 550 000.00 (0.03)INR (92 971.40)10 000 000.00 12/04/2019Société GénéraleEUR 3 048 323.78 0.00CHF (10 850.20)2 715 492.14 15/04/2019Caceis BankUSD 93 452 270.68 0.20EUR 731 488.81105 870 577.65 15/04/2019Caceis BankGBP 4 049 845.24 (0.01)EUR (28 446.46)3 466 756.54 15/04/2019Caceis BankEUR 107 650.00 0.00JPY (2.65)863.53 15/04/2019Caceis BankEUR 156.91 0.00GBP 1.64183.65 15/04/2019Caceis BankUSD 1 891 475 994.00 0.00KRW 10 177.241 675 255.02 15/04/2019Société GénéraleUSD 20 272 050 400.00 0.04COP 139 904.216 515 838.12 15/04/2019Goldman SachsJPY 82 353.05 0.00EUR 1 002.7110 359 544.00 15/04/2019Caceis BankCHF 98 971 939.24 0.40EUR 1 475 836.50112 310 613.16 15/04/2019Caceis BankEUR 955 051.81 0.00USD (9 811.93)839 824.01 15/04/2019Caceis BankUSD 20 095 469 400.00 0.00IDR 10 343.221 417 269.86 15/04/2019Goldman SachsUSD 1 283 920 000.00 0.00IDR 189.4390 000.00 17/04/2019JP MorganUSD 855 000 000.00 0.00IDR 227.6360 047.11 17/04/2019Goldman SachsUSD 425 932 000.00 0.00IDR 190.8230 000.00 17/04/2019Morgan StanleyUSD 561 806 000.00 0.00IDR 329.5039 651.96 18/04/2019Société GénéraleUSD 9 034 576 355.00 0.02KRW 72 482.328 029 400.23 19/04/2019Goldman SachsUSD 110 417 600.00 0.00TWD 117.843 580 000.00 22/04/2019Goldman SachsUSD 92 000 000.00 0.07CAD 263 000.1269 196 615.26 22/04/2019Goldman SachsUSD 2 942 853 800.00 0.00COP 6 507.25930 000.00 22/04/2019Morgan StanleyCAD 57 058 869.06 (0.03)USD (125 145.64)76 000 000.00 22/04/2019Goldman SachsUSD 57 580 104.00 0.00TWD 3 597.341 870 850.53 22/04/2019Société GénéraleUSD 4 097 551.00 0.00BRL (10 373.70)1 040 000.00 22/04/2019Goldman SachsUSD 3 886 747.50 0.00BRL 2 200.991 000 000.00 22/04/2019JP MorganUSD 24 939 900.00 0.00TWD 1 264.95810 000.00 22/04/2019Deutsche BankUSD 42 239 936.00 0.00TWD 474.021 370 000.00 22/04/2019Morgan StanleyUSD 2 087 559 400.00 0.00COP 16 358.37672 878.81 22/04/2019Goldman SachsUSD 16 630 040.00 0.00TWD 743.89540 000.00 22/04/2019JP MorganEUR 289 000 000.00 (1.02)CHF (3 811 172.26)254 684 004.57 23/04/2019Société GénéraleEUR 61 000 000.00 0.01NOK 30 620.496 332 859.69 24/04/2019Morgan StanleyZAR 400 000.00 0.00USD 2 060.305 818 624.98 26/04/2019Morgan StanleyUSD 12 116 036 907.00 0.02KRW 69 405.4410 739 638.21 29/04/2019Goldman SachsUSD 14 785 612 677.00 0.01KRW 36 557.7813 051 954.11 29/04/2019Société GénéraleTRY 755 020.21 (0.01)USD (30 715.62)4 200 000.00 29/04/2019Morgan StanleyUSD 1 551 280.00 0.00BRL 1 799.45400 000.00 29/04/2019Morgan StanleyUSD 4 500 000.00 0.00INR (1 639.11)62 801.97 30/04/2019Deutsche BankUSD 10 884 081 159.50 0.02COP 70 222.233 487 358.63 13/05/2019Goldman SachsTRY 558 900.65 (0.01)USD (29 334.03)3 100 000.00 13/05/2019JP MorganEUR 3 803 393 160.00 0.05HUF 179 535.4712 000 000.00 15/05/2019BNPEUR 8 104 871.00 0.00NZD (4 417.97)4 904 664.97 15/05/2019Goldman SachsEUR 61 534.53 0.00SGD (346.31)40 000.00 15/05/2019Société GénéraleEUR 5 303 763.52 0.00ZAR (4 720.19)320 000.00 15/05/2019JP MorganEUR 88 200 000.00 (0.02)ZAR (92 475.08)5 307 646.33 15/05/2019Deutsche BankNOK 1 100 000.00 0.00EUR (4 094.87)10 617 447.83 15/05/2019Morgan StanleyRUB 60 000.00 0.00EUR (750.65)4 415 607.00 15/05/2019Deutsche BankSEK 64 411 019.46 0.03EUR 98 489.90672 123 756.63 15/05/2019Goldman SachsTRY 510 000.00 (0.01)EUR (18 951.11)3 266 342.94 15/05/2019JP MorganUSD 11 000 000.00 0.01CHF 33 485.8911 127 826.46 15/05/2019Goldman SachsUSD 173 000 000.00 0.04ZAR 136 724.0612 087 324.42 15/05/2019Deutsche BankEUR 6 910 430.80 0.00CHF (14 805.04)6 167 592.81 15/05/2019Deutsche BankEUR 9 633 910.93 (0.01)CHF (50 949.67)8 567 988.85 15/05/2019Société GénéraleEUR 309 956 368.00 0.01CZK 31 703.4012 002 000.00 15/05/2019BNPEUR 21 780 000.00 (0.03)USD (94 977.72)19 232 503.19 15/05/2019Deutsche BankJPY 380 000.00 0.00EUR (102.74)47 217 485.00 15/05/2019Goldman SachsRUB 1 046 652.06 0.00EUR (13 453.22)77 000 000.00 15/05/2019Goldman SachsUSD 22 531 000.00 0.01CHF 38 159.5222 758 517.91 15/05/2019Deutsche BankUSD 193 882 034.77 0.36EUR 1 341 922.20220 000 000.00 15/05/2019Goldman Sachs
EUR
Unrealised appreciation/(depreciation)
Currency % of NetAssets
Amount bought Maturity Currency Amount soldCounterparty
Plus/(Moins) value non-réalisée
Devise % de l'actifnet
Montant acheté Maturité Devise Montant venduContrepartie

The accompanying notes form an integral part of these financial statements.Les notes annexées font partie intégrante de ces états financiers.
140 PrivilEdge - H2O High Conviction Bonds · 31/03/2019
Schedule of investments as at 31/03/2019 / Inventaire du portefeuille au 31/03/2019
EUR 210 000 000.00 0.01CZK 53 019.478 162 995.27 15/05/2019Goldman SachsGBP 110 000.00 0.00EUR (1 004.23)94 060.05 15/05/2019Morgan StanleyJPY 590 000.00 0.00EUR 2 270.7773 613 419.00 15/05/2019Deutsche BankJPY 12 835 777.93 0.01EUR 37 326.551 600 000 000.00 15/05/2019Société GénéraleMXN 106 172 967.15 (0.07)EUR (259 769.49)2 331 028 684.87 15/05/2019Goldman SachsTRY 1 200 000.00 0.00USD (14 990.53)6 983 940.42 15/05/2019Morgan StanleyEUR 1 426 337.10 0.00AUD 175.29900 000.00 15/05/2019Morgan StanleyEUR 481 022.64 0.00AUD (3 469.72)300 000.00 15/05/2019Société GénéraleEUR 169 000 000.00 0.00USD (11 269.90)149 956 006.99 15/05/2019JP MorganGBP 11 683 647.19 0.03EUR 115 379.3610 182 202.90 15/05/2019Goldman SachsNOK 3 597 859.77 0.00EUR 11 868.0634 972 093.65 15/05/2019Goldman SachsNOK 360 000.00 0.00EUR (1 525.43)3 473 006.00 15/05/2019Société GénéraleSEK 240 000.00 0.00EUR 326.872 503 962.65 15/05/2019Société GénéraleTRY 170 000.00 0.00EUR (5 496.17)1 094 241.21 15/05/2019Société GénéraleZAR 533 557.73 0.00EUR 5 154.888 800 000.00 15/05/2019Goldman SachsEUR 22 038 965.82 (0.01)AUD (31 160.82)13 872 523.57 15/05/2019Deutsche BankMXN 2 980 000.00 0.00EUR (2 137.26)65 539 362.61 15/05/2019JP MorganNOK 1 023 658.51 0.00EUR (1 806.46)9 900 000.00 15/05/2019Deutsche BankTRY 170 000.00 0.00EUR 1 201.641 138 793.45 15/05/2019Deutsche BankUSD 12 000 000.00 0.01SGD 22 774.958 891 962.87 15/05/2019Société GénéraleEUR 7 368 659.32 0.00CHF 1 282.236 593 640.49 15/05/2019Goldman SachsEUR 93 000 000.00 (0.19)USD (693 563.80)81 835 285.63 15/05/2019Société GénéraleEUR 8 133 805.10 0.00ZAR (3 516.79)494 438.78 15/05/2019Goldman SachsEUR 4 930 045.20 0.00ZAR (1 817.05)300 000.00 15/05/2019Morgan StanleyMXN 400 000.00 0.00USD (2 978.85)7 746 802.84 15/05/2019Morgan StanleyUSD 45 000 000.00 0.01MXN 41 004.902 349 824.77 15/05/2019Société GénéraleBRL 3 393 435.92 0.02USD 57 514.5513 493 964.00 15/05/2019JP MorganEUR 1 642 124.00 0.00CAD (7 487.74)1 084 472.21 15/05/2019Deutsche BankEUR 60 500 000.00 0.00RUB 9 495.75821 189.63 15/05/2019Deutsche BankEUR 168 258.93 0.00SGD (320.48)110 000.00 15/05/2019JP MorganEUR 244 650.52 0.00SGD (407.14)160 000.00 15/05/2019Deutsche BankEUR 2 500 000.00 0.00USD (6 735.56)2 211 738.97 15/05/2019Goldman SachsEUR 1 650 414.02 0.00ZAR (1 042.02)100 000.00 15/05/2019Société GénéraleSEK 790 000.00 0.00EUR 2 330.718 255 283.54 15/05/2019Deutsche BankUSD 7 720 000.00 0.01EUR 40 595.438 745 499.38 15/05/2019Deutsche BankUSD 71 000 000.00 0.16NZD 587 713.2149 122 493.10 15/05/2019JP MorganZAR 1 200 000.00 0.00USD 11 978.1117 589 713.80 15/05/2019Morgan StanleyEUR 7 000 000.00 0.00MXN 1 659.36319 691.34 15/05/2019Deutsche BankGBP 360 000.00 0.00EUR (1 356.09)309 498.84 15/05/2019Deutsche BankGBP 110 000.00 0.00EUR 992.7495 783.38 15/05/2019Société GénéraleTRY 2 478 613.94 (0.03)USD (95 147.89)14 000 000.00 15/05/2019Goldman SachsTRY 187 296.62 0.00USD (839.56)1 100 000.00 15/05/2019Deutsche BankUSD 2 000 000.00 0.00AUD (2 263.53)1 419 314.00 15/05/2019Goldman SachsUSD 6 370 000.00 0.00EUR 3 737.097 182 633.64 15/05/2019JP MorganUSD 1 910 000.00 0.01EUR 23 821.852 179 244.87 15/05/2019Morgan StanleyUSD 1 905 257 600.00 0.00COP 4 687.09601 743.27 20/05/2019Goldman SachsNOK 62 598 856.15 0.18EUR 659 043.23613 000 000.00 20/05/2019Goldman SachsUSD 37 861 760.00 0.04BRL 152 154.219 869 342.86 20/05/2019Société GénéraleTRY 1 216 604.94 (0.01)USD (46 327.34)6 900 000.00 20/05/2019Société GénéraleUSD 15 320 860.00 0.00INR 483.09220 000.00 21/05/2019JP MorganUSD 11 862 600.00 0.00INR 67.92170 000.00 21/05/2019Deutsche BankUSD 12 587 580.00 0.00INR (277.50)180 000.00 21/05/2019Goldman SachsUSD 2 103 240.00 0.00INR (114.52)30 000.00 21/05/2019Société GénéraleUSD 129 000 000.00 (0.07)CHF (263 382.17)129 844 103.53 22/05/2019Goldman SachsUSD 127 162 930.00 0.00TWD 13 315.024 142 519.79 22/05/2019Deutsche BankUSD 18 396 549 700.00 0.03COP 109 536.535 881 663.58 22/05/2019Goldman SachsUSD 67 601 221.00 0.10BRL 383 748.4217 741 705.64 24/05/2019Goldman SachsUSD 29 631 023.00 0.00TWD 1 775.83963 861.25 24/05/2019Goldman Sachs
EUR
Unrealised appreciation/(depreciation)
Currency % of NetAssets
Amount bought Maturity Currency Amount soldCounterparty
Plus/(Moins) value non-réalisée
Devise % de l'actifnet
Montant acheté Maturité Devise Montant venduContrepartie

The accompanying notes form an integral part of these financial statements.Les notes annexées font partie intégrante de ces états financiers.
141PrivilEdge - H2O High Conviction Bonds · 31/03/2019
Schedule of investments as at 31/03/2019 / Inventaire du portefeuille au 31/03/2019
MXN 33 332 038.36 (0.13)EUR (493 332.65)725 000 000.00 28/05/2019Morgan StanleyUSD 31 730 838.79 0.06BRL 222 579.558 372 694.81 28/05/2019Deutsche BankUSD 24 712 500 000.00 0.02KRW 68 001.0321 840 139.27 28/05/2019Société GénéraleBRL 387 273.60 0.00USD 3 685.401 528 840.00 28/05/2019Morgan StanleyUSD 1 201 702 167.00 (0.01)TWD (28 854.63)38 992 250.46 03/06/2019Goldman SachsUSD 35 016 044.00 (0.05)BRL (179 832.21)8 759 704.81 03/06/2019Morgan StanleyUSD 6 897 884 868.00 0.10CLP 372 357.7610 555 679.93 04/06/2019Société GénéraleUSD 6 126 389 062.00 0.00KRW 4 544.715 402 078.39 07/06/2019JP MorganUSD 10 884 081 159.50 0.02COP 73 178.153 485 850.82 11/06/2019JP MorganUSD 203 164 157.00 0.00TWD (8 199.71)6 591 744.48 13/06/2019Deutsche BankMXN 15 500 000.00 0.43USD 1 578 288.95338 927 650.00 14/06/2019Goldman SachsUSD 10 388 155.40 0.02BRL 67 573.232 730 276.34 19/06/2019Goldman SachsUSD 22 000 000.00 0.01NZD 50 157.0915 083 948.00 24/06/2019Deutsche BankUSD 800 553 850.00 0.00KRW 2 496.53708 490.78 27/06/2019Société GénéraleUSD 3 633 704 566.00 0.01KRW 32 910.893 241 597.67 11/07/2019Morgan StanleyUSD 41 418 150.00 0.06BRL 218 683.2510 790 472.59 29/07/2019Deutsche BankTRY 6 700 000.00 0.28USD 1 039 984.3351 296 100.00 15/10/2019Deutsche Bank
EUR
Unrealised appreciation/(depreciation)
Currency % of NetAssets
Amount bought Maturity Currency Amount soldCounterparty
Plus/(Moins) value non-réalisée
Devise % de l'actifnet
Montant acheté Maturité Devise Montant venduContrepartie

142

PrivilEdgeis an investment company
with variable capital ("SICAV")incorporated in Luxembourg
PrivilEdgeest une société d’investissement
à capital variable ("SICAV")enregistrée au Luxembourg RCS Luxembourg B0181207
PrivilEdge –American Century Emerging Markets Equity*Unaudited semi-annual report · Rapport semestriel non révisé
31.03.2019
*formerly · anciennement Aberdeen Emerging Market All Cap

The accompanying notes form an integral part of these financial statements.Les notes annexées font partie intégrante de ces états financiers.
144 PrivilEdge - American Century Emerging Markets Equity · 31/03/2019
ASSETS/ACTIF
191 127 273.11Investments in securities at market value/Portefeuille-titres à la valeur de marché (2):( USD )174 415 490.38Acquisition cost/Coût d'acquisition
1 781 174.29Cash and term deposits/Liquidité et dépôts à terme33 008.12Amounts receivable on subscriptions/Montants à recevoir sur souscriptions d'actions
131 869.72Interest and dividends receivable, net/Intérêt et dividendes nets à recevoir9 510.66Formation/reorganisation expenses/Frais de constitution/réorganisation (2)
193 082 835.90LIABILITIES/PASSIF
59 762.56Payable on investments purchased/À payer sur achat de titres676 306.77Amounts payable on redemptions/Montants à payer sur rachats d'actions167 434.38Management and distribution fees payable/Commission de gestion et de distribution à payer (3)
48 063.30Taxes and expenses payable/Impôts et autres frais à payer22 297.67Unrealised depreciation on forward foreign currency exchange contracts/Moins-value non réalisée sur contrats de change à
terme(2)
973 864.68192 108 971.22NET ASSET VALUE/VALEUR NETTE D'INVENTAIRE
Statement of net assets as at 31/03/2019 / État de l'actif net au 31/03/2019
NotesNotes USD

The accompanying notes form an integral part of these financial statements.Les notes annexées font partie intégrante de ces états financiers.
145PrivilEdge - American Century Emerging Markets Equity · 31/03/2019
Statement of operations and changes in net assets for the period from 01/10/2018 to 31/03/2019 / État desopérations et des variations de l'actif net pour la période du 01/10/2018 au 31/03/2019
NotesNotes USD
199 550 978.63NET ASSET VALUE AT THE BEGINNING OF THE PERIOD/VALEUR NETTE D'INVENTAIRE AU DÉBUT DE LAPÉRIODE
INCOME/REVENUS
711 968.30Dividends, net/Dividendes, nets (2)45 801.94Bank interest/Intérêts bancaires
3 848.19Securities Lending Income/Revenus sur prêt de titres (9)761 618.43
EXPENSES/DÉPENSES
1 003 130.78Management fees/Commission de gestion (3)23 287.76Distribution fees/Frais de distribution (3)
6 216.30Bank interest and other expenses/Intérêts bancaires débiteurs et autres frais299 690.66Fixed Rate of Operational Costs/Taux Fixe de Coûts Opérationnels (4)
2 899.55Formation/Reorganisation expenses/Frais de constitution/réorganisation (2)1 335 225.05(573 606.62)NET INVESTMENT LOSS/PERTE NETTE SUR INVESTISSEMENTS
(18 009 963.45)Net realised loss on sale of investments/Perte nette réalisée sur ventes d'investissements (2)(10 592 930.42)Net realised loss on foreign exchange/Perte nette réalisée sur opérations de change
(404 567.13)Net realised loss on forward foreign currency exchange contracts/Perte nette réalisée sur contrats de change à terme(29 581 067.62)NET REALISED LOSS/PERTE NETTE RÉALISÉE
36 031 261.37Change in net unrealised appreciation or depreciation on investments/Variation de la plus ou moins-value nette non réaliséesur investissements
(2)
38 267.67Change in net unrealised appreciation or depreciation on forward foreign currency exchange contracts/Variation de la plus oumoins-value nette non réalisée sur contrats de change à terme
6 488 461.42NET INCREASE IN NET ASSETS AS A RESULT OF OPERATIONS/AUGMENTATION NETTE DE L'ACTIF NETRÉSULTANT DES OPÉRATIONS
(72 668.16)Dividend paid/Dividende payé(13 857 800.67)Net subscriptions/(redemptions) including equalisation/Souscriptions/(rachats) nets incluant la régularisation192 108 971.22NET ASSET VALUE AT THE END OF THE PERIOD/VALEUR NETTE D'INVENTAIRE À LA FIN DE LA PÉRIODE

The accompanying notes form an integral part of these financial statements.Les notes annexées font partie intégrante de ces états financiers.
146 PrivilEdge - American Century Emerging Markets Equity · 31/03/2019
428 926.5610 140 493.2980 (52 286.9870) 517 132.8720P - USD - Capitalisation16 000.0000 0.0000 0.0000 16 000.0000P - CHF - Hedged - Capitalisation
254 061.7030 272 934.6540 (317 614.3990) 209 381.9580P - EUR - Hedged - Capitalisation859 534.6450 184 599.0000 (99 384.7400) 944 748.9050I - USD - Capitalisation720 000.0000 0.0000 0.0000 720 000.0000I - USD - Distribution
10 300.0000 0.0000 0.0000 10 300.0000I - CHF - Hedged - Capitalisation11 686 619.4950 2 357 909.5620 (2 957 411.7200) 11 087 117.3370M - USD - Capitalisation
2 144 570.8150 98 441.0000 (633 619.0000) 1 609 392.8150M - USD - Distribution186 781.9390 16 807.8010 (58 201.9390) 145 387.8010M - CHF - Hedged - Capitalisation192 228.9120 22 000.0000 (32 500.0000) 181 728.9120M - EUR - Hedged - Capitalisation
13 151.5420 0.0000 (1 300.0000) 11 851.5420M - EUR - Hedged - Distribution4 821 157.2580 658 980.1620 (1 199 650.0000) 4 280 487.4200N - USD - Capitalisation
0.0000 166 137.0000 0.0000 166 137.0000N - USD - Distribution60 000.0000 0.0000 0.0000 60 000.0000N - CHF - Hedged - Capitalisation
Statement of changes in the number of shares outstanding for the period from 01/10/2018 to 31/03/2019 / Étatdes variations du nombre d'actions pour la période du 01/10/2018 au 31/03/2019
Number of Shares01/10/2018/
Nombre d'actions01/10/2018
Number of Sharesissued/
Nombre d'actionsémises
Number of Sharesredeemed/
Nombre d'actionsrachetées
Number of Shares31/03/2019/
Nombre d'actions31/03/2019
30/09/201831/03/2019For the period ended/Pour la période clôturée au
Statistics / Statistiques
30/09/2017
P - USD - Capitalisation
4 932 223.619.5376
3 973 068.599.2628
1 269 701.8610.3707
Net Asset Value/Valeur Nette d'InventaireNet Asset Value per share/Valeur Nette d'Inventaire par action
USD USD USD
P - CHF - Hedged - Capitalisation
143 201.438.9501
141 681.078.8551
153 700.0310.2467
Net Asset Value/Valeur Nette d'InventaireNet Asset Value per share/Valeur Nette d'Inventaire par action
CHF CHF CHF
P - EUR - Hedged - Capitalisation
1 883 450.698.9953
2 258 158.898.8882
201 385.7810.2445
Net Asset Value/Valeur Nette d'InventaireNet Asset Value per share/Valeur Nette d'Inventaire par action
EUR EUR EUR
I - USD - Capitalisation
9 142 041.089.6767
8 033 413.629.3462
6 084 473.4310.3444
Net Asset Value/Valeur Nette d'InventaireNet Asset Value per share/Valeur Nette d'Inventaire par action
USD USD USD

The accompanying notes form an integral part of these financial statements.Les notes annexées font partie intégrante de ces états financiers.
147PrivilEdge - American Century Emerging Markets Equity · 31/03/2019
30/09/201831/03/2019For the period ended/Pour la période clôturée au
Statistics / Statistiques
30/09/2017
I - USD - Distribution
6 889 993.989.5694
0.10
6 729 288.119.3462
0.00
7 447 996.7110.3444
0.00
Net Asset Value/Valeur Nette d'InventaireNet Asset Value per share/Valeur Nette d'Inventaire par actionDividend per share paid to shareholders/Dividende par action payé aux actionnaires
USD USD USD
I - CHF - Hedged - Capitalisation
94 042.599.1303
92 540.228.9845
23 638.0710.2774
Net Asset Value/Valeur Nette d'InventaireNet Asset Value per share/Valeur Nette d'Inventaire par action
CHF CHF CHF
M - USD - Capitalisation
106 582 280.279.6132
108 666 482.549.2984
190 216 677.4610.3327
Net Asset Value/Valeur Nette d'InventaireNet Asset Value per share/Valeur Nette d'Inventaire par action
USD USD USD
M - USD - Distribution
15 471 368.869.6132
0.00
19 941 022.029.2984
0.00
37 217 735.8410.3327
0.00
Net Asset Value/Valeur Nette d'InventaireNet Asset Value per share/Valeur Nette d'Inventaire par actionDividend per share paid to shareholders/Dividende par action payé aux actionnaires
USD USD USD
M - CHF - Hedged - Capitalisation
1 319 086.519.0729
1 670 001.158.9409
5 276 214.6410.2686
Net Asset Value/Valeur Nette d'InventaireNet Asset Value per share/Valeur Nette d'Inventaire par action
CHF CHF CHF
M - EUR - Hedged - Capitalisation
1 656 786.759.1168
1 725 241.088.9749
3 682 273.8810.2671
Net Asset Value/Valeur Nette d'InventaireNet Asset Value per share/Valeur Nette d'Inventaire par action
EUR EUR EUR
M - EUR - Hedged - Distribution
107 420.889.0639
0.05
118 034.318.9749
0.00
254 746.7810.2671
0.00
Net Asset Value/Valeur Nette d'InventaireNet Asset Value per share/Valeur Nette d'Inventaire par actionDividend per share paid to shareholders/Dividende par action payé aux actionnaires
EUR EUR EUR
N - USD - Capitalisation
41 282 224.049.6443
44 944 148.319.3223
72 900 245.1810.3386
Net Asset Value/Valeur Nette d'InventaireNet Asset Value per share/Valeur Nette d'Inventaire par action
USD USD USD

The accompanying notes form an integral part of these financial statements.Les notes annexées font partie intégrante de ces états financiers.
148 PrivilEdge - American Century Emerging Markets Equity · 31/03/2019
30/09/201831/03/2019For the period ended/Pour la période clôturée au
Statistics / Statistiques
30/09/2017
N - USD - Distribution
1 602 276.119.6443
0.00
0.000.0000
0.00
1 336 747.2210.3386
0.00
Net Asset Value/Valeur Nette d'InventaireNet Asset Value per share/Valeur Nette d'Inventaire par actionDividend per share paid to shareholders/Dividende par action payé aux actionnaires
USD USD USD
N - CHF - Hedged - Capitalisation
545 812.289.0969
537 516.258.9586
0.000.0000
Net Asset Value/Valeur Nette d'InventaireNet Asset Value per share/Valeur Nette d'Inventaire par action
CHF CHF CHF

The accompanying notes form an integral part of these financial statements.Les notes annexées font partie intégrante de ces états financiers.
149PrivilEdge - American Century Emerging Markets Equity · 31/03/2019
Investments in securities at market value/Portefeuille-titres à la valeur de marché 191 127 273.11 99.49
CHINA GAS HOLDINGS LTD498 200 1 751 637.59 0.91HKD
Transferable securities admitted to an official stock exchange listing and/or dealt in on anotherregulated market/Valeurs mobilières admises à la cote officielle d'une bourse de valeurs et/ounégociées sur un autre marché réglementé
190 321 971.51 99.07
EQUITIES/ACTIONS 190 321 971.51 99.07
BERMUDA/BERMUDES 5 611 260.46 2.92
CREDICORP10 626 2 549 708.70 1.33USDHAIER ELECTRONICS GROUP CO LTD451 000 1 309 914.17 0.68HKD
BANCO BRADESCO PFD ADR REPR 1259 609 2 832 334.19 1.48USD
BRAZIL/BRÉSIL 13 445 500.91 7.00
B3 - REGISTERED SHS259 500 2 141 771.24 1.11BRLDURATEX435 700 1 228 158.36 0.64BRLITAU UNIBANCO PFD ADR REPR 1 PFD SHS109 080 960 994.80 0.50USDLOCALIZA RENT A CAR SA269 022 2 285 340.04 1.19BRLLOJAS RENNER201 224 2 264 717.68 1.18BRLMAGAZINE LUIZA SA39 000 1 732 184.60 0.90BRL
ALIBABA GR ADR58 149 10 609 285.05 5.52USD
CAYMAN ISLANDS/ILES CAÏMANS 46 933 789.88 24.42
BAOZUN A ADR REPR 3SHS -A-51 259 2 129 298.86 1.11USDCHAILEASE HOLDING COMPANY LTD791 000 3 233 756.61 1.68TWDCIFI HOLDINGS GROUP CO LTD2 662 000 2 017 699.42 1.05HKDGDS HOLDINGS -A- ADR REP 8 SHS-A-67 229 2 399 403.01 1.25USDGEELY AUTOMOBILE748 000 1 429 303.01 0.74HKDHUAZHU GROUP -SHS ADR31 966 1 346 407.92 0.70USDLI NING CO984 500 1 545 104.58 0.80HKDNEW ORIENTAL EDUCATION & TECH.GR ADR RE130 371 2 736 123.39 1.42USDPAGSEGURO DIGITAL LTD52 284 1 560 677.40 0.81USDSHENZHOU INTERNATIONAL GROUP186 100 2 493 983.44 1.30HKDSUNNY OPTI TECH SHS115 700 1 381 771.04 0.72HKDTAL EDUCAT GR -A- ADR REPR 1/3 SH -A-62 251 2 246 016.08 1.17USDTENCENT HLDG256 700 11 804 960.07 6.15HKD
ANHUI CONCH CEMENT CO -H-332 500 2 031 008.37 1.06HKD
CHINA/CHINE 15 332 273.99 7.98
CHINA CONSTRUCTION BANK CORPORATION -H-4 375 000 3 750 805.75 1.95HKDCRRC CORP -H- SHS -HCOMPANY1 430 000 1 348 028.92 0.70HKDINDUS.AND COMMERCIAL BANK OF CHINA -H-4 876 000 3 571 601.47 1.86HKDKWEICHOW MOUTAI CO LTD8 200 1 042 036.88 0.54CNYPING AN INS (GRP) CO -H-320 500 3 588 792.60 1.87HKD
BANCOLOMBIA ADR REPR.4 PREF SHS18 369 937 921.14 0.49USD
COLOMBIA/COLOMBIE 937 921.14 0.49
MONETA MONEY BANK288 406 995 417.60 0.52CZK
CZECH REPUBLIC/RÉPUBLIQUE TCHÈQUE 995 417.60 0.52
BRILLIANCE CHINA AUTO HLDGS1 944 000 1 926 669.89 1.00HKD
HONG KONG/HONG-KONG 6 706 248.97 3.49
CHINA OVERSEAS LAND INVESTMENT LTD -RC-160 000 607 390.09 0.32HKDCNOOC LTD -RC-2 228 000 4 172 188.99 2.17HKD
OTP BANK LTD37 078 1 630 992.76 0.85HUF
HUNGARY/HONGRIE 1 630 992.76 0.85
Schedule of investments as at 31/03/2019 / Inventaire du portefeuille au 31/03/2019
USD
Market ValueNumber of Shares orNominal Value
Investment % of Net AssetsQuotationCurrency
Valeur de marchéNombre d'actions ouvaleur nominale
Investissement % de l'actif netDevise decotation

The accompanying notes form an integral part of these financial statements.Les notes annexées font partie intégrante de ces états financiers.
150 PrivilEdge - American Century Emerging Markets Equity · 31/03/2019
BATA INDIA LTD111 595 2 263 394.05 1.18INR
INDIA/INDE 17 127 176.27 8.92
BHARAT FIN SHS173 037 2 823 045.86 1.47INRGODREJ CONSUMER DEMATERIALISED104 181 1 031 659.29 0.54INRHOUSING DEVT FINANCE ADR REPR 3 SHS41 979 4 865 785.89 2.53USDINDRAPRASTHA GAS LTD91 324 402 669.48 0.21INRJUBILANT FOODWORKS LTD93 055 1 939 682.11 1.01INRLARSEN & TOUBRO LTD DEMATERIALISED53 188 1 063 606.91 0.55INRNESTLE INDIA DEMATERAILISED6 045 956 462.96 0.50INRTATA CONSULT.SERVICES SVS DEMATERIALISED61 634 1 780 869.72 0.93INR
ASTRA INTERNATIONAL TBK2 319 100 1 192 935.60 0.62IDR
INDONESIA/INDONÉSIE 6 769 908.52 3.52
BANK RAKYAT INDONESIA10 254 800 2 966 977.84 1.54IDRTELKOM INDONESIA -B-9 409 200 2 609 995.08 1.36IDR
AMERICA MOVIL SHS -L- ADR REPR.20 SHS138 046 1 971 296.88 1.03USD
MEXICO/MEXIQUE 5 908 764.07 3.08
GRUPO AEROPORT CENT -B-285 917 1 616 669.77 0.84MXNWAL MART867 059 2 320 797.42 1.21MXN
AYALA LAND INC2 563 300 2 191 812.59 1.14PHP
PHILIPPINES/PHILIPPINES 2 191 812.59 1.14
NOVATEK GDR REPR 1/100 SHS REG-S23 187 3 974 251.80 2.06USD
RUSSIA/RUSSIE 5 963 583.30 3.10
SBERBANK ADR 4 SHS150 025 1 989 331.50 1.04USD
CAPITEC BANK HOLDINGS LTD28 347 2 653 587.56 1.38ZAR
SOUTH AFRICA/AFRIQUE DU SUD 10 831 785.13 5.64
DISCOVERY LIMITED118 041 1 119 733.69 0.58ZARKUMBA IRON ORE50 675 1 512 031.61 0.79ZARNASPERS -N-20 033 4 628 763.58 2.41ZARTHE FOSCHINI GROUP LTD81 190 917 668.69 0.48ZAR
CJ KOREA EXPRESS15 541 2 265 911.06 1.18KRW
SOUTH KOREA/CORÉE DU SUD 24 029 807.47 12.51
COSMAX INC17 316 2 311 139.24 1.20KRWDOOSAN INFRACORE133 449 828 839.31 0.43KRWFILA KOREA CO LTD70 460 4 841 758.71 2.52KRWHOTEL SHILLA22 347 1 878 163.97 0.98KRWHYUNDAI HEAVY INDUSTRIES CO LTD16 471 1 726 763.38 0.90KRWMEDYTOX69 35 487.80 0.02KRWORION REGISTERED13 655 1 202 977.78 0.63KRWPOSCO CHEMICAL CO. LTD.20 538 1 089 232.38 0.57KRWSAMSUNG ELECTRO MECHANICS10 508 967 391.47 0.50KRWSAMSUNG ELECTRONICS CO LTD174 959 6 882 142.37 3.58KRW
CHROMA ATE335 000 1 592 365.40 0.83TWD
TAIWAN/TAÏWAN 15 398 484.02 8.02
GLOBALWAFERS CO LTD55 000 540 711.52 0.28TWDPRESIDENT CHAIN STORE CORP193 000 1 900 536.89 0.99TWDTAIWAN CEMENT - PFD REGISTERED SHS -B-63 899 107 809.67 0.06TWDTAIWAN CEMENT CORP1 275 000 1 706 453.42 0.89TWDTAIWAN SEMICONDUCTOR MANUFACTURING CO LTD1 199 000 9 550 607.12 4.97TWD
AIRPORT OF THAILAND PUB CO -F-688 900 1 476 136.54 0.77THB
THAILAND/THAÏLANDE 6 090 073.17 3.17
CP SEVEN ELEVEN ALL FOREIGN REGISTERED685 600 1 614 891.84 0.84THB
Schedule of investments as at 31/03/2019 / Inventaire du portefeuille au 31/03/2019
USD
Market ValueNumber of Shares orNominal Value
Investment % of Net AssetsQuotationCurrency
Valeur de marchéNombre d'actions ouvaleur nominale
Investissement % de l'actif netDevise decotation

The accompanying notes form an integral part of these financial statements.Les notes annexées font partie intégrante de ces états financiers.
151PrivilEdge - American Century Emerging Markets Equity · 31/03/2019
KASIKORNBANK -F-46 700 276 653.50 0.14THBMINOR INTERNATIONAL FOREIGN REGISTERED1 186 900 1 458 613.31 0.76THBMUANGTHAI CAPITAL PUBLIC COMPANY LTD911 500 1 263 777.98 0.66THB
YANDEX N.V.67 002 2 300 848.68 1.20USD
THE NETHERLANDS/PAYS-BAS 2 300 848.68 1.20
BIM BIRLESIK MAGAZALAR63 895 861 795.80 0.45TRY
TURKEY/TURQUIE 861 795.80 0.45
NMC HEALTH PLC42 152 1 254 526.78 0.65GBP
UNITED KINGDOM/ROYAUME-UNI 1 254 526.78 0.65
KASIKORNBANK UNITS NVDR136 300 805 301.60 0.42THB
Other transferable securities/Autres valeurs mobilières 805 301.60 0.42
EQUITIES/ACTIONS 805 301.60 0.42
THAILAND/THAÏLANDE 805 301.60 0.42
Schedule of investments as at 31/03/2019 / Inventaire du portefeuille au 31/03/2019
USD
Market ValueNumber of Shares orNominal Value
Investment % of Net AssetsQuotationCurrency
Valeur de marchéNombre d'actions ouvaleur nominale
Investissement % de l'actif netDevise decotation
Forward Foreign Currency Exchange Contracts/Contrats de change à terme (0.01)(22 297.67)EUR 4 314 800.59 (0.02)USD (37 807.44)3 804 862.63 15/04/2019Caceis BankCHF 2 162 236.47 0.01USD 14 950.432 165 591.69 15/04/2019Caceis BankUSD 220 067.23 0.00EUR 1 110.26248 485.83 15/04/2019Caceis BankUSD 99 736.71 0.00CHF (550.92)99 719.04 15/04/2019Caceis Bank
USD
Unrealised appreciation/(depreciation)
Currency % of NetAssets
Amount bought Maturity Currency Amount soldCounterparty
Plus/(Moins) value non-réalisée
Devise % de l'actifnet
Montant acheté Maturité Devise Montant venduContrepartie

152

PrivilEdgeis an investment company
with variable capital ("SICAV")incorporated in Luxembourg
PrivilEdgeest une société d’investissement
à capital variable ("SICAV")enregistrée au Luxembourg RCS Luxembourg B0181207
PrivilEdge –AXA IM Short Duration Inflation Bond
Unaudited semi-annual report · Rapport semestriel non révisé
31.03.2019

The accompanying notes form an integral part of these financial statements.Les notes annexées font partie intégrante de ces états financiers.
154 PrivilEdge - AXA IM Short Duration Inflation Bond · 31/03/2019
ASSETS/ACTIF
34 627 482.34Investments in securities at market value/Portefeuille-titres à la valeur de marché (2):( USD )34 641 126.44Acquisition cost/Coût d'acquisition
680 045.46Cash and term deposits/Liquidité et dépôts à terme3 802 209.57Receivable on investments sold/À recevoir sur vente de titres
87 206.78Interest and dividends receivable, net/Intérêt et dividendes nets à recevoir9 510.66Formation/reorganisation expenses/Frais de constitution/réorganisation (2)1 221.26Receivable on foreign exchange transactions, net/A recevoir sur opérations de change, net
123 995.24Unrealised appreciation on forward foreign currency exchange contracts/Plus-value non réalisée sur contrats de change àterme
(2)
39 331 671.31LIABILITIES/PASSIF
4 259 064.27Amounts payable on redemptions/Montants à payer sur rachats d'actions14 408.93Management and distribution fees payable/Commission de gestion et de distribution à payer (3)
5 550.68Taxes and expenses payable/Impôts et autres frais à payer45 107.34Unrealised depreciation on futures contracts/Moins-value non réalisée sur contrats futures (2)
4 324 131.2235 007 540.09NET ASSET VALUE/VALEUR NETTE D'INVENTAIRE
Statement of net assets as at 31/03/2019 / État de l'actif net au 31/03/2019
NotesNotes USD

The accompanying notes form an integral part of these financial statements.Les notes annexées font partie intégrante de ces états financiers.
155PrivilEdge - AXA IM Short Duration Inflation Bond · 31/03/2019
Statement of operations and changes in net assets for the period from 01/10/2018 to 31/03/2019 / État desopérations et des variations de l'actif net pour la période du 01/10/2018 au 31/03/2019
NotesNotes USD
32 603 132.73NET ASSET VALUE AT THE BEGINNING OF THE PERIOD/VALEUR NETTE D'INVENTAIRE AU DÉBUT DE LAPÉRIODE
INCOME/REVENUS
170 135.78Interest on bonds, net/Intérêts sur obligations, nets (2)4 983.64Bank interest/Intérêts bancaires
175 119.42EXPENSES/DÉPENSES
91 304.13Management fees/Commission de gestion (3)114.70Distribution fees/Frais de distribution (3)
1 420.12Bank interest and other expenses/Intérêts bancaires débiteurs et autres frais33 313.82Fixed Rate of Operational Costs/Taux Fixe de Coûts Opérationnels (4)
2 899.55Formation/Reorganisation expenses/Frais de constitution/réorganisation (2)129 052.32
46 067.10NET INVESTMENT INCOME/REVENU NET SUR INVESTISSEMENTS
(226 762.69)Net realised loss on sale of investments/Perte nette réalisée sur ventes d'investissements (2)14 410.75Net realised gain on futures contracts/Gain net réalisé sur contrats futures28 203.45Net realised gain on foreign exchange/Gain net réalisé sur opérations de change
(981 351.83)Net realised loss on forward foreign currency exchange contracts/Perte nette réalisée sur contrats de change à terme(1 119 433.22)NET REALISED LOSS/PERTE NETTE RÉALISÉE
169 763.99Change in net unrealised appreciation or depreciation on investments/Variation de la plus ou moins-value nette non réaliséesur investissements
(2)
(54 341.27)Change in net unrealised appreciation or depreciation on futures contracts/Variation de la plus ou moins-value nette nonréalisée sur contrats futures
407 653.68Change in net unrealised appreciation or depreciation on forward foreign currency exchange contracts/Variation de la plus oumoins-value nette non réalisée sur contrats de change à terme
(596 356.82)NET DECREASE IN NET ASSETS AS A RESULT OF OPERATIONS/DIMINUTION NETTE DE L'ACTIF NET RÉSULTANTDES OPÉRATIONS
3 000 764.18Net subscriptions/(redemptions) including equalisation/Souscriptions/(rachats) nets incluant la régularisation35 007 540.09NET ASSET VALUE AT THE END OF THE PERIOD/VALEUR NETTE D'INVENTAIRE À LA FIN DE LA PÉRIODE

The accompanying notes form an integral part of these financial statements.Les notes annexées font partie intégrante de ces états financiers.
156 PrivilEdge - AXA IM Short Duration Inflation Bond · 31/03/2019
0.0000 4 200.0000 0.0000 4 200.0000P - USD - Capitalisation2 800.0000 0.0000 (2 800.0000) 0.0000P - CHF - Hedged - Capitalisation
350 000.0000 0.0000 0.0000 350 000.0000I - USD - Capitalisation560 847.8810 0.0000 0.0000 560 847.8810I - CHF - Hedged - Capitalisation450 000.0000 0.0000 0.0000 450 000.0000I - EUR - Hedged - Capitalisation283 825.0000 532 751.1650 (295 985.0000) 520 591.1650M - USD - Capitalisation318 575.0000 2 774.5800 (128 425.0000) 192 924.5800M - CHF - Hedged - Capitalisation517 536.4530 20 024.3600 (116 926.3330) 420 634.4800M - EUR - Hedged - Capitalisation
5 300.1200 4 050.0000 0.0000 9 350.1200M - EUR - Hedged - Distribution94 600.0000 0.0000 0.0000 94 600.0000M - GBP - Hedged - Distribution
0.0000 700 957.0000 (568 157.0000) 132 800.0000N - USD - Capitalisation0.0000 165 425.0000 (6 851.0000) 158 574.0000N - USD - Distribution
459 500.0000 0.0000 0.0000 459 500.0000N - CHF - Hedged - Capitalisation63 500.0000 0.0000 0.0000 63 500.0000N - EUR - Hedged - Capitalisation
Statement of changes in the number of shares outstanding for the period from 01/10/2018 to 31/03/2019 / Étatdes variations du nombre d'actions pour la période du 01/10/2018 au 31/03/2019
Number of Shares01/10/2018/
Nombre d'actions01/10/2018
Number of Sharesissued/
Nombre d'actionsémises
Number of Sharesredeemed/
Nombre d'actionsrachetées
Number of Shares31/03/2019/
Nombre d'actions31/03/2019
30/09/201831/03/2019For the period ended/Pour la période clôturée au
Statistics / Statistiques
30/09/2017
P - USD - Capitalisation
42 525.0610.1250
0.000.0000
0.000.0000
Net Asset Value/Valeur Nette d'InventaireNet Asset Value per share/Valeur Nette d'Inventaire par action
USD USD USD
P - CHF - Hedged - Capitalisation
0.000.0000
26 895.039.6054
522 024.219.8868
Net Asset Value/Valeur Nette d'InventaireNet Asset Value per share/Valeur Nette d'Inventaire par action
CHF CHF CHF
I - USD - Capitalisation
3 560 073.7110.1716
3 523 393.3610.0668
3 495 391.229.9868
Net Asset Value/Valeur Nette d'InventaireNet Asset Value per share/Valeur Nette d'Inventaire par action
USD USD USD
I - CHF - Hedged - Capitalisation
5 393 292.729.6163
5 434 382.449.6896
4 954 144.309.9083
Net Asset Value/Valeur Nette d'InventaireNet Asset Value per share/Valeur Nette d'Inventaire par action
CHF CHF CHF

The accompanying notes form an integral part of these financial statements.Les notes annexées font partie intégrante de ces états financiers.
157PrivilEdge - AXA IM Short Duration Inflation Bond · 31/03/2019
30/09/201831/03/2019For the period ended/Pour la période clôturée au
Statistics / Statistiques
30/09/2017
I - EUR - Hedged - Capitalisation
4 358 977.869.6866
4 382 800.239.7396
0.000.0000
Net Asset Value/Valeur Nette d'InventaireNet Asset Value per share/Valeur Nette d'Inventaire par action
EUR EUR EUR
M - USD - Capitalisation
5 280 308.7510.1429
2 851 511.4810.0467
2 777 696.509.9818
Net Asset Value/Valeur Nette d'InventaireNet Asset Value per share/Valeur Nette d'Inventaire par action
USD USD USD
M - CHF - Hedged - Capitalisation
1 849 984.279.5892
3 080 691.469.6702
4 526 384.829.9033
Net Asset Value/Valeur Nette d'InventaireNet Asset Value per share/Valeur Nette d'Inventaire par action
CHF CHF CHF
M - EUR - Hedged - Capitalisation
4 063 935.559.6614
5 031 641.739.7223
4 919 117.179.9205
Net Asset Value/Valeur Nette d'InventaireNet Asset Value per share/Valeur Nette d'Inventaire par action
EUR EUR EUR
M - EUR - Hedged - Distribution
90 335.819.6615
0.00
51 529.389.7223
0.00
242 862.279.9205
0.00
Net Asset Value/Valeur Nette d'InventaireNet Asset Value per share/Valeur Nette d'Inventaire par actionDividend per share paid to shareholders/Dividende par action payé aux actionnaires
EUR EUR EUR
M - GBP - Hedged - Distribution
931 993.669.8519
0.00
932 070.469.8528
0.00
1 456 751.619.9437
0.00
Net Asset Value/Valeur Nette d'InventaireNet Asset Value per share/Valeur Nette d'Inventaire par actionDividend per share paid to shareholders/Dividende par action payé aux actionnaires
GBP GBP GBP
N - USD - Capitalisation
1 347 390.3610.1460
0.000.0000
0.000.0000
Net Asset Value/Valeur Nette d'InventaireNet Asset Value per share/Valeur Nette d'Inventaire par action
USD USD USD
N - USD - Distribution
1 608 887.3510.1460
0.00
0.000.0000
0.00
0.000.0000
0.00
Net Asset Value/Valeur Nette d'InventaireNet Asset Value per share/Valeur Nette d'Inventaire par actionDividend per share paid to shareholders/Dividende par action payé aux actionnaires
USD USD USD

The accompanying notes form an integral part of these financial statements.Les notes annexées font partie intégrante de ces états financiers.
158 PrivilEdge - AXA IM Short Duration Inflation Bond · 31/03/2019
30/09/201831/03/2019For the period ended/Pour la période clôturée au
Statistics / Statistiques
30/09/2017
N - CHF - Hedged - Capitalisation
4 413 561.909.6051
4 449 396.329.6831
2 763 951.699.9066
Net Asset Value/Valeur Nette d'InventaireNet Asset Value per share/Valeur Nette d'Inventaire par action
CHF CHF CHF
N - EUR - Hedged - Capitalisation
614 521.749.6775
618 187.349.7352
1 074 749.479.9238
Net Asset Value/Valeur Nette d'InventaireNet Asset Value per share/Valeur Nette d'Inventaire par action
EUR EUR EUR

The accompanying notes form an integral part of these financial statements.Les notes annexées font partie intégrante de ces états financiers.
159PrivilEdge - AXA IM Short Duration Inflation Bond · 31/03/2019
Investments in securities at market value/Portefeuille-titres à la valeur de marché 34 627 482.34 98.91
AUSTRALIA 1.25 12-22 21/02Q560 000 534 094.46 1.53AUD
Transferable securities admitted to an official stock exchange listing and/or dealt in on anotherregulated market/Valeurs mobilières admises à la cote officielle d'une bourse de valeurs et/ounégociées sur un autre marché réglementé
34 627 482.34 98.91
BONDS/OBLIGATIONS 34 627 482.34 98.91
AUSTRALIA/AUSTRALIE 1 163 762.63 3.32
AUSTRALIA(IDX) 4.00 09-19 15/04Q490 000 629 668.17 1.79AUD
CANADA (INDEXED) 4.25 91-21 01/12S985 000 1 320 430.41 3.77CAD
CANADA/CANADA 1 320 430.41 3.77
FRANCE OAT INDEX 2.10 08-23 25/07A270 000 392 918.22 1.12EUR
FRANCE/FRANCE 4 921 490.40 14.06
FRANCE OAT INDEXE 1.10 10-22 25/07A1 617 493 2 214 398.56 6.33EURFRANCE OAT INDEXE 1.85 10-27 25/07A880 000 1 361 773.84 3.89EURFRANCE OAT (INDEXED) 0.10 12-21 25/07A220 000 266 101.09 0.76EURFRANCE OAT (INDEXED) 0.25 13-24 25/07A349 122 445 931.00 1.27EURFRANCE OAT INDEXEE 0.70 13-30 25/07A177 200 240 367.69 0.69EUR
BRD INDEXEE 0.10 12-23 15/04A2 060 000 2 625 409.90 7.50EUR
GERMANY/ALLEMAGNE 2 625 409.90 7.50
ITALIAN REPUB INDEX 0.1 18-23 15/05S630 000 700 837.55 2.00EUR
ITALY/ITALIE 2 996 833.40 8.56
ITALY INFL INDEX 2.10 10-21 15/09S425 000 563 902.16 1.61EURITALY INFL. INDEX 0.10 16-22 15/05S80 000 92 727.93 0.26EURITALY INFL. INDEX 1.30 16-28 15/05S1 000 000 1 121 211.12 3.21EURITALY INFL. INDEX 2.60 07-23 15/09S362 000 518 154.64 1.48EUR
JAPAN (INDEXED) 0.10 13-23 10/09S512 200 000 4 962 677.34 14.18JPY
JAPAN/JAPON 4 962 677.34 14.18
SWEDEN INDEXED -3102- 4.00 96-20 01/12A90 000 14 539.68 0.04SEK
SWEDEN/SUÈDE 14 539.68 0.04
TSY INFL IX N/B 0.625 18-23 15/04S5 101 000 5 207 565.56 14.87USD
UNITED STATES/ÉTATS-UNIS 16 622 338.58 47.48
US TREASURY INDEX 0.75 18-28 15/07S536 700 550 611.20 1.57USDUS TREASURY INDEXEE 0.125 13-23 15/01S1 200 000 1 294 440.54 3.70USDUS TREASURY INDEXEE 0.625 11-21 15/07S2 460 000 2 772 894.40 7.92USDUS TREASURY INDEXEE 0.625 14-24 15/01S170 000 185 269.51 0.53USDUS TREASURY INDEXEE 1.25 10-20 15/07S110 000 128 875.24 0.37USDUSA T NOTES INDEX 0.125 12-22 15/01S200 000 220 755.82 0.63USDUSA T NOTES INDEX 0.125 12-22 15/07S260 000 283 234.55 0.81USDUSA T NOTES INDEX 0.125 16-21 15/04S3 660 000 3 857 457.88 11.02USDUSA TREASURY INDEXED 0.125 17-22 15/04S2 070 000 2 121 233.88 6.06USD
Schedule of investments as at 31/03/2019 / Inventaire du portefeuille au 31/03/2019
USD
Market ValueNumber of Shares orNominal Value
Investment % of Net AssetsQuotationCurrency
Valeur de marchéNombre d'actions ouvaleur nominale
Investissement % de l'actif netDevise decotation

The accompanying notes form an integral part of these financial statements.Les notes annexées font partie intégrante de ces états financiers.
160 PrivilEdge - AXA IM Short Duration Inflation Bond · 31/03/2019
Schedule of investments as at 31/03/2019 / Inventaire du portefeuille au 31/03/2019
Futures Contracts/Contrats futures (0.13)(45 107.34)EURO BTP FUTURE -EUX Caceis Bank (1 308 378.51) (0.07)EUR (24 960.96)30/06/2019(9)EURO SCHATZ FUTURE Caceis Bank (3 143 278.22) (0.02)EUR (6 175.68)30/06/2019(25)EURO-OAT-FUTURES-EUX Caceis Bank (913 270.05) (0.07)EUR (25 095.70)30/06/2019(5)US 2 YEARS NOTE- CBT Caceis Bank 3 409 500.00 0.03USD 11 125.0030/06/201916
USD USD
Unrealised appreciation/(depreciation)
Underlying Intermediary % of NetAssets
Maturity Currency CommitmentNumber ofcontracts
Plus/(Moins) value non-réalisée
Sous-jacent Intermédiaire % de l'actifnet
Maturité Devise EngagementNombre decontrats
Forward Foreign Currency Exchange Contracts/Contrats de change à terme 0.35123 995.24USD 1 586 000.00 0.00AUD 1 038.361 127 700.71 04/04/2019Morgan StanleyEUR 389 012.39 0.00USD (1 563.10)345 000.00 04/04/2019JP MorganCAD 381 227.95 0.00USD 549.04510 000.00 04/04/2019Hsbc BankGBP 503 066.96 (0.02)USD (7 851.18)380 000.00 04/04/2019Hsbc BankUSD 630 000.00 0.04GBP 14 376.75835 393.86 04/04/2019JP MorganUSD 160 000.00 0.00SEK 130.5117 383.24 04/04/2019JP MorganUSD 552 000 000.00 (0.12)JPY (41 951.58)4 945 945.83 04/04/2019JP MorganUSD 2 330 000.00 0.09CAD 31 225.551 775 424.09 04/04/2019JP MorganUSD 11 732 000.00 0.55EUR 192 585.6813 368 139.59 04/04/2019JP MorganGBP 1 235 913.68 (0.06)USD (19 489.52)932 892.92 15/04/2019Caceis BankEUR 10 410 951.74 (0.26)USD (90 995.98)9 180 752.15 15/04/2019Caceis BankCHF 11 668 936.33 0.23USD 81 977.2411 688 330.79 15/04/2019Caceis BankUSD 81 631.39 0.00EUR 736.8092 498.26 15/04/2019Caceis BankUSD 26 725.80 0.00CHF 65.6526 934.60 15/04/2019Caceis BankEUR 901 460.72 0.00USD (457.22)800 000.00 08/05/2019Hsbc BankGBP 261 941.82 0.00USD (860.16)200 000.00 08/05/2019Hsbc BankEUR 1 238 496.10 (0.10)USD (35 521.60)1 050 000.00 04/12/2019Morgan Stanley
USD
Unrealised appreciation/(depreciation)
Currency % of NetAssets
Amount bought Maturity Currency Amount soldCounterparty
Plus/(Moins) value non-réalisée
Devise % de l'actifnet
Montant acheté Maturité Devise Montant venduContrepartie

PrivilEdgeis an investment company
with variable capital ("SICAV")incorporated in Luxembourg
PrivilEdgeest une société d’investissement
à capital variable ("SICAV")enregistrée au Luxembourg RCS Luxembourg B0181207
PrivilEdge –Franklin Flexible Euro Aggregate Bond
Unaudited semi-annual report · Rapport semestriel non révisé
31.03.2019

The accompanying notes form an integral part of these financial statements.Les notes annexées font partie intégrante de ces états financiers.
162 PrivilEdge - Franklin Flexible Euro Aggregate Bond · 31/03/2019
ASSETS/ACTIF
99 411 467.73Investments in securities at market value/Portefeuille-titres à la valeur de marché (2):( EUR )96 646 277.03Acquisition cost/Coût d'acquisition
2 052 840.75Cash and term deposits/Liquidité et dépôts à terme593 371.36Interest and dividends receivable, net/Intérêt et dividendes nets à recevoir
8 188.12Formation/reorganisation expenses/Frais de constitution/réorganisation (2)320 825.11Unrealised appreciation on forward foreign currency exchange contracts/Plus-value non réalisée sur contrats de change à
terme(2)
102 386 693.07LIABILITIES/PASSIF
12 920.00Net options at market value/Position nette en options à la valeur de marché (2)39 371.01Bank overdrafts/Découverts bancaires49 672.79Management and distribution fees payable/Commission de gestion et de distribution à payer (3)17 108.93Taxes and expenses payable/Impôts et autres frais à payer
1 068 270.00Unrealised depreciation on futures contracts/Moins-value non réalisée sur contrats futures (2)1 187 342.73
101 199 350.34NET ASSET VALUE/VALEUR NETTE D'INVENTAIRE
Statement of net assets as at 31/03/2019 / État de l'actif net au 31/03/2019
NotesNotes EUR

The accompanying notes form an integral part of these financial statements.Les notes annexées font partie intégrante de ces états financiers.
163PrivilEdge - Franklin Flexible Euro Aggregate Bond · 31/03/2019
Statement of operations and changes in net assets for the period from 01/10/2018 to 31/03/2019 / État desopérations et des variations de l'actif net pour la période du 01/10/2018 au 31/03/2019
NotesNotes EUR
128 820 228.27NET ASSET VALUE AT THE BEGINNING OF THE PERIOD/VALEUR NETTE D'INVENTAIRE AU DÉBUT DE LAPÉRIODE
INCOME/REVENUS
946 887.18Interest on bonds, net/Intérêts sur obligations, nets (2)417.00Bank interest/Intérêts bancaires
1 115.53Securities Lending Income/Revenus sur prêt de titres (9)948 419.71
EXPENSES/DÉPENSES
326 132.52Management fees/Commission de gestion (3)3 098.25Distribution fees/Frais de distribution (3)
12 934.67Bank interest and other expenses/Intérêts bancaires débiteurs et autres frais120 218.40Fixed Rate of Operational Costs/Taux Fixe de Coûts Opérationnels (4)
2 497.83Formation/Reorganisation expenses/Frais de constitution/réorganisation (2)464 881.67483 538.04NET INVESTMENT INCOME/REVENU NET SUR INVESTISSEMENTS
(349 244.86)Net realised loss on sale of investments/Perte nette réalisée sur ventes d'investissements (2)(37.40)Net realised loss on options/Perte nette réalisée sur options
(1 031 254.69)Net realised loss on futures contracts/Perte nette réalisée sur contrats futures(174 800.58)Net realised loss on foreign exchange/Perte nette réalisée sur opérations de change
(73 044.60)Net realised loss on forward foreign currency exchange contracts/Perte nette réalisée sur contrats de change à terme(1 144 844.09)NET REALISED LOSS/PERTE NETTE RÉALISÉE
3 897 300.62Change in net unrealised appreciation or depreciation on investments/Variation de la plus ou moins-value nette non réaliséesur investissements
(2)
(12 920.00)Change in net unrealised appreciation or depreciation on options/Variation de la plus ou moins-value non réalisée sur options(1 631 820.00)Change in net unrealised appreciation or depreciation on futures contracts/Variation de la plus ou moins-value nette non
réalisée sur contrats futures273 723.46Change in net unrealised appreciation or depreciation on forward foreign currency exchange contracts/Variation de la plus ou
moins-value nette non réalisée sur contrats de change à terme1 381 439.99NET INCREASE IN NET ASSETS AS A RESULT OF OPERATIONS/AUGMENTATION NETTE DE L'ACTIF NET
RÉSULTANT DES OPÉRATIONS(110 681.58)Dividend paid/Dividende payé
(28 891 636.34)Net subscriptions/(redemptions) including equalisation/Souscriptions/(rachats) nets incluant la régularisation101 199 350.34NET ASSET VALUE AT THE END OF THE PERIOD/VALEUR NETTE D'INVENTAIRE À LA FIN DE LA PÉRIODE

The accompanying notes form an integral part of these financial statements.Les notes annexées font partie intégrante de ces états financiers.
164 PrivilEdge - Franklin Flexible Euro Aggregate Bond · 31/03/2019
147 724.9400 61 824.7680 (4 997.5010) 204 552.2070P - EUR - Capitalisation20 000.0000 0.0000 (3 000.0000) 17 000.0000I - CHF - Hedged - Capitalisation
500 000.0000 0.0000 0.0000 500 000.0000I - EUR - Capitalisation76 278.9840 0.0000 (10 248.9840) 66 030.0000M - USD - Hedged - Capitalisation
1 225 745.4800 5 770.0000 (273 223.0000) 958 292.4800M - CHF - Hedged - Capitalisation43 440.0000 0.0000 (3 440.0000) 40 000.0000M - CHF - Hedged - Distribution
6 938 252.0020 649 984.1020 (1 892 230.3790) 5 696 005.7250M - EUR - Capitalisation2 057 488.4300 73 825.0000 (1 305 903.0000) 825 410.4300M - EUR - Distribution
400 000.0000 0.0000 0.0000 400 000.0000N - USD - Hedged - Capitalisation390 000.0000 0.0000 0.0000 390 000.0000N - CHF - Hedged - Capitalisation
1 369 139.0280 170 000.0000 (423 488.0000) 1 115 651.0280N - EUR - Capitalisation100 000.0000 0.0000 0.0000 100 000.0000N - EUR - Distribution
Statement of changes in the number of shares outstanding for the period from 01/10/2018 to 31/03/2019 / Étatdes variations du nombre d'actions pour la période du 01/10/2018 au 31/03/2019
Number of Shares01/10/2018/
Nombre d'actions01/10/2018
Number of Sharesissued/
Nombre d'actionsémises
Number of Sharesredeemed/
Nombre d'actionsrachetées
Number of Shares31/03/2019/
Nombre d'actions31/03/2019
30/09/201831/03/2019For the period ended/Pour la période clôturée au
Statistics / Statistiques
30/09/2017
P - CHF - Hedged - Capitalisation
0.000.0000
0.000.0000
100 202.2810.0202
Net Asset Value/Valeur Nette d'InventaireNet Asset Value per share/Valeur Nette d'Inventaire par action
CHF CHF CHF
P - EUR - Capitalisation
2 030 029.019.9243
1 454 300.739.8447
494 885.9810.0321
Net Asset Value/Valeur Nette d'InventaireNet Asset Value per share/Valeur Nette d'Inventaire par action
EUR EUR EUR
I - CHF - Hedged - Capitalisation
169 369.729.9629
197 471.389.8736
42 168.6310.0401
Net Asset Value/Valeur Nette d'InventaireNet Asset Value per share/Valeur Nette d'Inventaire par action
CHF CHF CHF
I - EUR - Capitalisation
5 023 074.9010.0461
4 965 963.549.9319
0.000.0000
Net Asset Value/Valeur Nette d'InventaireNet Asset Value per share/Valeur Nette d'Inventaire par action
EUR EUR EUR
M - USD - Hedged - Capitalisation
692 260.5910.4840
780 051.9710.2263
3 688 869.7110.1217
Net Asset Value/Valeur Nette d'InventaireNet Asset Value per share/Valeur Nette d'Inventaire par action
USD USD USD

The accompanying notes form an integral part of these financial statements.Les notes annexées font partie intégrante de ces états financiers.
165PrivilEdge - Franklin Flexible Euro Aggregate Bond · 31/03/2019
30/09/201831/03/2019For the period ended/Pour la période clôturée au
Statistics / Statistiques
30/09/2017
M - CHF - Hedged - Capitalisation
9 500 543.369.9140
12 057 875.719.8372
25 177 183.6710.0312
Net Asset Value/Valeur Nette d'InventaireNet Asset Value per share/Valeur Nette d'Inventaire par action
CHF CHF CHF
M - CHF - Hedged - Distribution
392 484.879.8121
0.10
427 327.159.8372
0.00
461 434.6910.0312
0.00
Net Asset Value/Valeur Nette d'InventaireNet Asset Value per share/Valeur Nette d'Inventaire par actionDividend per share paid to shareholders/Dividende par action payé aux actionnaires
CHF CHF CHF
M - EUR - Capitalisation
56 964 049.2310.0007
68 682 684.049.8991
67 355 912.1510.0474
Net Asset Value/Valeur Nette d'InventaireNet Asset Value per share/Valeur Nette d'Inventaire par action
EUR EUR EUR
M - EUR - Distribution
8 170 365.789.8985
0.10
20 367 204.519.8991
0.00
22 762 066.0010.0473
0.00
Net Asset Value/Valeur Nette d'InventaireNet Asset Value per share/Valeur Nette d'Inventaire par actionDividend per share paid to shareholders/Dividende par action payé aux actionnaires
EUR EUR EUR
M - GBP - Hedged - Capitalisation
0.000.0000
0.000.0000
41 316.7610.0773
Net Asset Value/Valeur Nette d'InventaireNet Asset Value per share/Valeur Nette d'Inventaire par action
GBP GBP GBP
M - GBP - Hedged - Distribution
0.000.0000
0.00
0.000.0000
0.00
30 232.4410.0775
0.00
Net Asset Value/Valeur Nette d'InventaireNet Asset Value per share/Valeur Nette d'Inventaire par actionDividend per share paid to shareholders/Dividende par action payé aux actionnaires
GBP GBP GBP
N - USD - Hedged - Capitalisation
4 206 990.5510.5175
4 100 984.1910.2525
5 084 945.4210.1294
Net Asset Value/Valeur Nette d'InventaireNet Asset Value per share/Valeur Nette d'Inventaire par action
USD USD USD
N - CHF - Hedged - Capitalisation
3 878 518.179.9449
3 846 025.119.8616
4 100 703.0210.0380
Net Asset Value/Valeur Nette d'InventaireNet Asset Value per share/Valeur Nette d'Inventaire par action
CHF CHF CHF

The accompanying notes form an integral part of these financial statements.Les notes annexées font partie intégrante de ces états financiers.
166 PrivilEdge - Franklin Flexible Euro Aggregate Bond · 31/03/2019
30/09/201831/03/2019For the period ended/Pour la période clôturée au
Statistics / Statistiques
30/09/2017
N - EUR - Capitalisation
11 191 973.2210.0318
13 586 848.569.9236
19 098 521.5610.0541
Net Asset Value/Valeur Nette d'InventaireNet Asset Value per share/Valeur Nette d'Inventaire par action
EUR EUR EUR
N - EUR - Distribution
989 903.889.8990
0.13
992 364.429.9236
0.00
4 021 658.8610.0541
0.00
Net Asset Value/Valeur Nette d'InventaireNet Asset Value per share/Valeur Nette d'Inventaire par actionDividend per share paid to shareholders/Dividende par action payé aux actionnaires
EUR EUR EUR

The accompanying notes form an integral part of these financial statements.Les notes annexées font partie intégrante de ces états financiers.
167PrivilEdge - Franklin Flexible Euro Aggregate Bond · 31/03/2019
Investments in securities at market value/Portefeuille-titres à la valeur de marché 99 411 467.73 98.23
APT PIPELINES 1.375 15-22 22/03A1 500 000 1 541 355.00 1.52EUR
Transferable securities admitted to an official stock exchange listing and/or dealt in on anotherregulated market/Valeurs mobilières admises à la cote officielle d'une bourse de valeurs et/ounégociées sur un autre marché réglementé
91 179 674.73 90.09
BONDS/OBLIGATIONS 88 987 923.13 87.92
AUSTRALIA/AUSTRALIE 1 541 355.00 1.52
BELGIUM KINGDOM 1.25 18-33 22/04A4 600 000 4 917 952.00 4.86EUR
BELGIUM/BELGIQUE 4 917 952.00 4.86
BACARDI 2.75 13-23 03/07A600 000 638 412.00 0.63EUR
BERMUDA/BERMUDES 638 412.00 0.63
NYKREDIT REALKREDIT 2.00 17-50 01/10Q40 046 593 5 558 121.29 5.49DKK
DENMARK/DANEMARK 8 511 513.25 8.41
NYKREDIT REALKREDIT A 1.5 17-50 01/10Q22 000 000 2 953 391.96 2.92DKK
EESTI ENERGIA AS 2.384 15-23 22/09A2 017 000 2 099 374.28 2.07EUR
ESTONIA/ESTONIE 2 099 374.28 2.07
FINNISH GOVT 0.875 15-25 15/09A1 600 000 1 708 624.00 1.69EUR
FINLAND/FINLANDE 1 708 624.00 1.69
ORANO SA 3.125 14-23 20/03A600 000 627 216.00 0.62EUR
FRANCE/FRANCE 627 216.00 0.62
ALLEMAGNE 1.25 17-48 15/08A3 300 000 3 903 141.00 3.86EUR
GERMANY/ALLEMAGNE 6 173 123.00 6.10
COMMERZBANK AG 0.625 18-25 28/05A2 200 000 2 269 982.00 2.24EUR
HUNGARY 1.25 18-25 22/10A1 700 000 1 761 523.00 1.74EUR
HUNGARY/HONGRIE 1 761 523.00 1.74
ITALIE 2.00 18-28 01/02S6 300 000 6 156 171.00 6.08EUR
ITALY/ITALIE 16 169 836.50 15.97
ITALY 0.95 18-23 01/03S2 800 000 2 764 132.00 2.73EURITALY BOT 4.75 13-28 01/09S6 050 000 7 249 533.50 7.16EUR
LINCOLN FINANCE REGS 6.875 16-21 15/04S600 000 612 528.00 0.61EUR
JERSEY/JERSEY 612 528.00 0.61
LITUANIE REGS 2.125 14-26 29/10A2 700 000 3 032 586.00 2.99EUR
LITHUANIA/LITHUANIE 4 080 066.00 4.03
REPUBLIC OF LITHUANIA 1.125 18-28 30/05A1 000 000 1 047 480.00 1.04EUR
AROUNDTOWN SA 1.625 18-28 31/01A1 200 000 1 151 796.00 1.14EUR
LUXEMBOURG/LUXEMBOURG 1 151 796.00 1.14
SPAREBANK 1 OSTFOLD 0.875 18-23 13/03A1 400 000 1 418 256.00 1.40EUR
NORWAY/NORVÈGE 1 418 256.00 1.40
POLAND DS0726 2.50 15-26 25/07A33 000 000 7 646 160.10 7.56PLN
POLAND/POLOGNE 7 646 160.10 7.56
ROMANIA 2.875 18-29 11/03S3 000 000 3 041 340.00 3.01EUR
ROMANIA/ROUMANIE 3 041 340.00 3.01
ESPAGNE 1.40 18-28 30/04A4 000 000 4 168 040.00 4.12EUR
SPAIN/ESPAGNE 11 719 322.00 11.57
Schedule of investments as at 31/03/2019 / Inventaire du portefeuille au 31/03/2019
EUR
Market ValueNumber of Shares orNominal Value
Investment % of Net AssetsQuotationCurrency
Valeur de marchéNombre d'actions ouvaleur nominale
Investissement % de l'actif netDevise decotation

The accompanying notes form an integral part of these financial statements.Les notes annexées font partie intégrante de ces états financiers.
168 PrivilEdge - Franklin Flexible Euro Aggregate Bond · 31/03/2019
ESPAGNE 1.45 19-29 29/01A6 000 000 6 203 520.00 6.12EURFCC AQUALIA 2.629 17-27 08/06A1 300 000 1 347 762.00 1.33EUR
AKELIUS RESIDENTIAL 1.125 17-24 14/03A1 200 000 1 189 788.00 1.18EUR
SWEDEN/SUÈDE 4 239 018.00 4.19
KINGDOM OF SWEDEN 0.125 18-23 24/04A3 000 000 3 049 230.00 3.01EUR
ALTICE FRANCE S 5.8750 18-27 01/02S500 000 516 715.00 0.51EUR
THE NETHERLANDS/PAYS-BAS 4 941 251.00 4.88
NE PROPERTY COOP 1.75 17-24 23/11A1 400 000 1 276 366.00 1.26EURNETHERLANDS 0.50 16-26 15/07A3 000 000 3 148 170.00 3.11EUR
BARCLAYS PLC 0.625 17-23 14/11A1 500 000 1 473 435.00 1.46EUR
UNITED KINGDOM/ROYAUME-UNI 1 473 435.00 1.46
BERKSHIRE HATHAWAY 1.125 15-27 16/03A1 700 000 1 753 397.00 1.73EUR
UNITED STATES/ÉTATS-UNIS 4 515 822.00 4.46
PROCTER & GAMBLE 0.50 17-24 25/10A1 600 000 1 624 816.00 1.61EURWELLS FARGO & COMP 1.5 17-27 24/05A1 100 000 1 137 609.00 1.12EUR
TOTAL SA FL.R 15-XX 26/02A1 500 000 1 566 975.00 1.55EUR
FLOATING RATE NOTES/OBLIGATIONS À TAUX VARIABLE 2 191 751.60 2.17
FRANCE/FRANCE 1 566 975.00 1.55
ENEL SUB FL.R 14-76 15/09A500 000 624 776.60 0.62GBP
ITALY/ITALIE 624 776.60 0.62
DANSKE 1.625 19-24 15/03A1 200 000 1 200 816.00 1.19EUR
Other transferable securities/Autres valeurs mobilières 8 231 793.00 8.13
BONDS/OBLIGATIONS 7 628 583.00 7.53
DENMARK/DANEMARK 1 200 816.00 1.19
MITSUBISHI UFJ 0.9800 18-23 09/10A1 200 000 1 228 368.00 1.21EUR
JAPAN/JAPON 1 228 368.00 1.21
ESPAGNE 1.85 19-35 05/03A5 100 000 5 199 399.00 5.13EUR
SPAIN/ESPAGNE 5 199 399.00 5.13
BANKIA SA FL.R 19-29 15/02A600 000 603 210.00 0.60EUR
FLOATING RATE NOTES/OBLIGATIONS À TAUX VARIABLE 603 210.00 0.60
SPAIN/ESPAGNE 603 210.00 0.60
Schedule of investments as at 31/03/2019 / Inventaire du portefeuille au 31/03/2019
EUR
Market ValueNumber of Shares orNominal Value
Investment % of Net AssetsQuotationCurrency
Valeur de marchéNombre d'actions ouvaleur nominale
Investissement % de l'actif netDevise decotation
Net options at market value/Position nette en options à la valeur de marché (12 920.00) (0.01)
EURO BUND JUN 165.00 24.05.19 PUT68 (12 920.00) (0.01)EUR
Options (Counterparties refer to Note 2)/Options (Contreparties voir la Note 2) (12 920.00) (0.01)

The accompanying notes form an integral part of these financial statements.Les notes annexées font partie intégrante de ces états financiers.
169PrivilEdge - Franklin Flexible Euro Aggregate Bond · 31/03/2019
Schedule of investments as at 31/03/2019 / Inventaire du portefeuille au 31/03/2019
Futures Contracts/Contrats futures (1.06)(1 068 270.00)EURO BUND FUTURE Citibank (24 951 000.00) (0.51)EUR (516 000.00)30/06/2019(150)EURO-OAT-FUTURES-EUX Citibank (20 008 410.00) (0.55)EUR (552 270.00)30/06/2019(123)
EUR EUR
Unrealised appreciation/(depreciation)
Underlying Intermediary % of NetAssets
Maturity Currency CommitmentNumber ofcontracts
Plus/(Moins) value non-réalisée
Sous-jacent Intermédiaire % de l'actifnet
Maturité Devise EngagementNombre decontrats
Forward Foreign Currency Exchange Contracts/Contrats de change à terme 0.32320 825.11CHF 12 253 598.09 0.19EUR 194 014.0213 917 669.54 15/04/2019Caceis BankEUR 16 862.17 0.00USD (38.00)14 962.83 15/04/2019Caceis BankEUR 71 025.15 0.00CHF (120.01)63 403.07 15/04/2019Caceis BankUSD 4 296 613.22 0.04EUR 37 269.854 871 654.16 15/04/2019Caceis BankPLN 1 163 188.89 (0.01)EUR (5 984.14)5 000 000.00 11/06/2019JP MorganEUR 37 000 000.00 0.00PLN (4 073.15)8 559 419.61 11/06/2019JP MorganEUR 700 000.00 0.00GBP 1 641.79812 024.18 11/06/2019Morgan StanleyNOK 6 613 003.48 0.10EUR 98 114.7565 100 000.00 11/06/2019JP Morgan
EUR
Unrealised appreciation/(depreciation)
Currency % of NetAssets
Amount bought Maturity Currency Amount soldCounterparty
Plus/(Moins) value non-réalisée
Devise % de l'actifnet
Montant acheté Maturité Devise Montant venduContrepartie

170

PrivilEdgeis an investment company
with variable capital ("SICAV")incorporated in Luxembourg
PrivilEdgeest une société d’investissement
à capital variable ("SICAV")enregistrée au Luxembourg RCS Luxembourg B0181207
PrivilEdge –Henderson Pan European Equity
Unaudited semi-annual report · Rapport semestriel non révisé
Closed on 7 December 2018 · Fermé le 7 décembre 2018

The accompanying notes form an integral part of these financial statements.Les notes annexées font partie intégrante de ces états financiers.
172 PrivilEdge - Henderson Pan European Equity · 31/03/2019
Statement of operations and changes in net assets for the period from 01/10/2018 to 07/12/2018 / État desopérations et des variations de l'actif net pour la période du 01/10/2018 au 07/12/2018
NotesNotes EUR
14 850 523.05NET ASSET VALUE AT THE BEGINNING OF THE PERIOD/VALEUR NETTE D'INVENTAIRE AU DÉBUT DE LAPÉRIODE
INCOME/REVENUS
23 266.04Dividends, net/Dividendes, nets (2)63.22Securities Lending Income/Revenus sur prêt de titres (9)
23 329.26EXPENSES/DÉPENSES
18 690.72Management fees/Commission de gestion (3)383.53Distribution fees/Frais de distribution (3)
9 770.07Performance fees/Commission de performance (3)329.59Bank interest and other expenses/Intérêts bancaires débiteurs et autres frais
7 294.45Fixed Rate of Operational Costs/Taux Fixe de Coûts Opérationnels (4)915.88Formation/Reorganisation expenses/Frais de constitution/réorganisation (2)
37 384.24(14 054.98)NET INVESTMENT LOSS/PERTE NETTE SUR INVESTISSEMENTS
(1 522 228.65)Net realised loss on sale of investments/Perte nette réalisée sur ventes d'investissements (2)(62 164.68)Net realised loss on foreign exchange/Perte nette réalisée sur opérations de change
7 419.75Net realised gain on forward foreign currency exchange contracts/Gain net réalisé sur contrats de change à terme(1 591 028.56)NET REALISED LOSS/PERTE NETTE RÉALISÉE
(47 382.69)Change in net unrealised appreciation or depreciation on investments/Variation de la plus ou moins-value nette non réaliséesur investissements
(2)
(846.23)Change in net unrealised appreciation or depreciation on forward foreign currency exchange contracts/Variation de la plus oumoins-value nette non réalisée sur contrats de change à terme
(1 639 257.48)NET DECREASE IN NET ASSETS AS A RESULT OF OPERATIONS/DIMINUTION NETTE DE L'ACTIF NET RÉSULTANTDES OPÉRATIONS
(28 879.43)Dividend paid/Dividende payé(13 182 386.14)Net subscriptions/(redemptions) including equalisation/Souscriptions/(rachats) nets incluant la régularisation
0.00NET ASSET VALUE AT THE END OF THE PERIOD/VALEUR NETTE D'INVENTAIRE À LA FIN DE LA PÉRIODE

The accompanying notes form an integral part of these financial statements.Les notes annexées font partie intégrante de ces états financiers.
173PrivilEdge - Henderson Pan European Equity · 31/03/2019
25 405.5690 0.0000 (25 405.5690) 0.0000P - USD - Hedged - Capitalisation12 353.2790 0.0000 (12 353.2790) 0.0000P - EUR - Capitalisation
245 000.0000 0.0000 (245 000.0000) 0.0000I - EUR - Capitalisation33 000.0000 0.0000 (33 000.0000) 0.0000M - USD - Hedged - Capitalisation
4 160.0000 0.0000 (4 160.0000) 0.0000M - USD - Hedged - Distribution37 000.0000 0.0000 (37 000.0000) 0.0000M - CHF - Hedged - Capitalisation
724 776.9890 0.0000 (724 776.9890) 0.0000M - EUR - Capitalisation159 423.3030 0.0000 (159 423.3030) 0.0000M - EUR - Distribution244 717.8990 0.0000 (244 717.8990) 0.0000N - EUR - Capitalisation
50 091.0000 0.0000 (50 091.0000) 0.0000N - EUR - Distribution
Statement of changes in the number of shares outstanding for the period from 01/10/2018 to 07/12/2018 / Étatdes variations du nombre d'actions pour la période du 01/10/2018 au 07/12/2018
Number of Shares01/10/2018/
Nombre d'actions01/10/2018
Number of Sharesissued/
Nombre d'actionsémises
Number of Sharesredeemed/
Nombre d'actionsrachetées
Number of Shares07/12/2018/
Nombre d'actions07/12/2018
30/09/201831/03/2019For the period ended/Pour la période clôturée au
Statistics / Statistiques
30/09/2017
P - USD - Hedged - Capitalisation
0.000.0000
252 436.899.9363
92 502.579.8345
Net Asset Value/Valeur Nette d'InventaireNet Asset Value per share/Valeur Nette d'Inventaire par action
USD USD USD
P - EUR - Capitalisation
0.000.0000
119 214.109.6504
222 617.619.7754
Net Asset Value/Valeur Nette d'InventaireNet Asset Value per share/Valeur Nette d'Inventaire par action
EUR EUR EUR
I - EUR - Capitalisation
0.000.0000
2 397 395.169.7853
2 404 283.829.8134
Net Asset Value/Valeur Nette d'InventaireNet Asset Value per share/Valeur Nette d'Inventaire par action
EUR EUR EUR
M - USD - Hedged - Capitalisation
0.000.0000
330 805.2510.0244
2 531 320.609.8572
Net Asset Value/Valeur Nette d'InventaireNet Asset Value per share/Valeur Nette d'Inventaire par action
USD USD USD
M - USD - Hedged - Distribution
0.000.0000
0.14
41 687.4310.0210
0.00
0.000.0000
0.00
Net Asset Value/Valeur Nette d'InventaireNet Asset Value per share/Valeur Nette d'Inventaire par actionDividend per share paid to shareholders/Dividende par action payé aux actionnaires
USD USD USD

The accompanying notes form an integral part of these financial statements.Les notes annexées font partie intégrante de ces états financiers.
174 PrivilEdge - Henderson Pan European Equity · 31/03/2019
30/09/201831/03/2019For the period ended/Pour la période clôturée au
Statistics / Statistiques
30/09/2017
M - CHF - Hedged - Capitalisation
0.000.0000
362 596.689.7999
19 827.169.9136
Net Asset Value/Valeur Nette d'InventaireNet Asset Value per share/Valeur Nette d'Inventaire par action
CHF CHF CHF
M - CHF - Hedged - Distribution
0.000.0000
0.00
0.000.0000
0.00
72 916.719.9139
0.00
Net Asset Value/Valeur Nette d'InventaireNet Asset Value per share/Valeur Nette d'Inventaire par actionDividend per share paid to shareholders/Dividende par action payé aux actionnaires
CHF CHF CHF
M - EUR - Capitalisation
0.000.0000
7 058 157.009.7384
52 424 765.219.8007
Net Asset Value/Valeur Nette d'InventaireNet Asset Value per share/Valeur Nette d'Inventaire par action
EUR EUR EUR
M - EUR - Distribution
0.000.0000
0.14
1 543 050.379.6790
0.06
13 946 150.659.8004
0.00
Net Asset Value/Valeur Nette d'InventaireNet Asset Value per share/Valeur Nette d'Inventaire par actionDividend per share paid to shareholders/Dividende par action payé aux actionnaires
EUR EUR EUR
N - EUR - Capitalisation
0.000.0000
2 389 473.129.7642
16 098 129.309.8070
Net Asset Value/Valeur Nette d'InventaireNet Asset Value per share/Valeur Nette d'Inventaire par action
EUR EUR EUR
N - EUR - Distribution
0.000.0000
0.15
485 601.509.6944
0.07
2 960 579.659.8063
0.00
Net Asset Value/Valeur Nette d'InventaireNet Asset Value per share/Valeur Nette d'Inventaire par actionDividend per share paid to shareholders/Dividende par action payé aux actionnaires
EUR EUR EUR

PrivilEdgeis an investment company
with variable capital ("SICAV")incorporated in Luxembourg
PrivilEdgeest une société d’investissement
à capital variable ("SICAV")enregistrée au Luxembourg RCS Luxembourg B0181207
PrivilEdge –William Blair US Small and Mid Cap
Unaudited semi-annual report · Rapport semestriel non révisé
31.03.2019

The accompanying notes form an integral part of these financial statements.Les notes annexées font partie intégrante de ces états financiers.
176 PrivilEdge - William Blair US Small and Mid Cap · 31/03/2019
ASSETS/ACTIF
288 423 658.88Investments in securities at market value/Portefeuille-titres à la valeur de marché (2):( USD )265 208 167.12Acquisition cost/Coût d'acquisition
2 387 716.18Cash and term deposits/Liquidité et dépôts à terme2 473 815.65Receivable on investments sold/À recevoir sur vente de titres
117 383.27Amounts receivable on subscriptions/Montants à recevoir sur souscriptions d'actions177 692.83Interest and dividends receivable, net/Intérêt et dividendes nets à recevoir
9 510.66Formation/reorganisation expenses/Frais de constitution/réorganisation (2)293 589 777.47
LIABILITIES/PASSIF
1 050 212.01Payable on investments purchased/À payer sur achat de titres478 897.93Amounts payable on redemptions/Montants à payer sur rachats d'actions250 476.77Management and distribution fees payable/Commission de gestion et de distribution à payer (3)
59 174.26Taxes and expenses payable/Impôts et autres frais à payer125 348.73Unrealised depreciation on forward foreign currency exchange contracts/Moins-value non réalisée sur contrats de change à
terme(2)
1 964 109.70291 625 667.77NET ASSET VALUE/VALEUR NETTE D'INVENTAIRE
Statement of net assets as at 31/03/2019 / État de l'actif net au 31/03/2019
NotesNotes USD

The accompanying notes form an integral part of these financial statements.Les notes annexées font partie intégrante de ces états financiers.
177PrivilEdge - William Blair US Small and Mid Cap · 31/03/2019
Statement of operations and changes in net assets for the period from 01/10/2018 to 31/03/2019 / État desopérations et des variations de l'actif net pour la période du 01/10/2018 au 31/03/2019
NotesNotes USD
387 124 309.63NET ASSET VALUE AT THE BEGINNING OF THE PERIOD/VALEUR NETTE D'INVENTAIRE AU DÉBUT DE LAPÉRIODE
INCOME/REVENUS
1 454 281.41Dividends, net/Dividendes, nets (2)46 790.24Bank interest/Intérêts bancaires
232 579.20Other income/Autres revenus1 733 650.85
EXPENSES/DÉPENSES
1 653 036.33Management fees/Commission de gestion (3)21 087.58Distribution fees/Frais de distribution (3)
4.47Bank interest and other expenses/Intérêts bancaires débiteurs et autres frais434 767.30Fixed Rate of Operational Costs/Taux Fixe de Coûts Opérationnels (4)
2 899.55Formation/Reorganisation expenses/Frais de constitution/réorganisation (2)2 111 795.23(378 144.38)NET INVESTMENT LOSS/PERTE NETTE SUR INVESTISSEMENTS
(1 082 424.91)Net realised loss on sale of investments/Perte nette réalisée sur ventes d'investissements (2)65 578.41Net realised gain on foreign exchange/Gain net réalisé sur opérations de change
(760 647.16)Net realised loss on forward foreign currency exchange contracts/Perte nette réalisée sur contrats de change à terme(2 155 638.04)NET REALISED LOSS/PERTE NETTE RÉALISÉE
(21 012 814.09)Change in net unrealised appreciation or depreciation on investments/Variation de la plus ou moins-value nette non réaliséesur investissements
(2)
(25 978.48)Change in net unrealised appreciation or depreciation on forward foreign currency exchange contracts/Variation de la plus oumoins-value nette non réalisée sur contrats de change à terme
(23 194 430.61)NET DECREASE IN NET ASSETS AS A RESULT OF OPERATIONS/DIMINUTION NETTE DE L'ACTIF NET RÉSULTANTDES OPÉRATIONS
(72 304 211.25)Net subscriptions/(redemptions) including equalisation/Souscriptions/(rachats) nets incluant la régularisation291 625 667.77NET ASSET VALUE AT THE END OF THE PERIOD/VALEUR NETTE D'INVENTAIRE À LA FIN DE LA PÉRIODE

The accompanying notes form an integral part of these financial statements.Les notes annexées font partie intégrante de ces états financiers.
178 PrivilEdge - William Blair US Small and Mid Cap · 31/03/2019
537 435.7050 52 745.5650 (88 034.4730) 502 146.7970P - USD - Capitalisation11 239.0120 0.0000 0.0000 11 239.0120P - EUR - Hedged - Capitalisation
2 679 504.8830 523 648.0000 (1 179 260.0000) 2 023 892.8830I - USD - Capitalisation604 605.6730 0.0000 0.0000 604 605.6730I - USD - Distribution
500.0000 0.0000 0.0000 500.0000I - CHF - Hedged - Capitalisation102 756.0000 14 677.0000 (30 255.0000) 87 178.0000S - EUR - Hedged - Capitalisation
16 168 454.1740 1 074 768.7240 (5 132 647.7480) 12 110 575.1500M - USD - Capitalisation4 336 940.1010 100 147.7440 (949 782.4060) 3 487 305.4390M - USD - Distribution
328 881.9660 353 203.9970 (199 243.7520) 482 842.2110M - EUR - Hedged - Capitalisation344 028.6010 165 420.9970 (106 183.8580) 403 265.7400M - EUR - Hedged - Distribution
4 758 202.3820 740 085.6140 (1 682 957.4370) 3 815 330.5590N - USD - Capitalisation1 099 515.3580 109 770.0000 (22 260.0000) 1 187 025.3580N - USD - Distribution
187 015.0000 0.0000 (187 015.0000) 0.0000N - CHF - Hedged - Capitalisation155 955.3720 38 139.0000 (74 851.3720) 119 243.0000N - EUR - Hedged - Capitalisation
0.0000 4 205.3720 (1 373.0000) 2 832.3720N - EUR - Hedged - Distribution
Statement of changes in the number of shares outstanding for the period from 01/10/2018 to 31/03/2019 / Étatdes variations du nombre d'actions pour la période du 01/10/2018 au 31/03/2019
Number of Shares01/10/2018/
Nombre d'actions01/10/2018
Number of Sharesissued/
Nombre d'actionsémises
Number of Sharesredeemed/
Nombre d'actionsrachetées
Number of Shares31/03/2019/
Nombre d'actions31/03/2019
30/09/201831/03/2019For the period ended/Pour la période clôturée au
Statistics / Statistiques
30/09/2017
P - USD - Capitalisation
5 798 828.7611.5481
6 556 494.8812.1996
1 930 863.6010.6396
Net Asset Value/Valeur Nette d'InventaireNet Asset Value per share/Valeur Nette d'Inventaire par action
USD USD USD
P - EUR - Hedged - Capitalisation
121 850.3010.8417
130 924.1211.6491
0.000.0000
Net Asset Value/Valeur Nette d'InventaireNet Asset Value per share/Valeur Nette d'Inventaire par action
EUR EUR EUR
I - USD - Capitalisation
23 825 678.2411.7722
33 149 756.6412.3716
20 471 891.7310.6769
Net Asset Value/Valeur Nette d'InventaireNet Asset Value per share/Valeur Nette d'Inventaire par action
USD USD USD
I - USD - Distribution
7 117 531.2211.7722
0.00
7 479 928.1412.3716
0.00
0.000.0000
0.00
Net Asset Value/Valeur Nette d'InventaireNet Asset Value per share/Valeur Nette d'Inventaire par actionDividend per share paid to shareholders/Dividende par action payé aux actionnaires
USD USD USD

The accompanying notes form an integral part of these financial statements.Les notes annexées font partie intégrante de ces états financiers.
179PrivilEdge - William Blair US Small and Mid Cap · 31/03/2019
30/09/201831/03/2019For the period ended/Pour la période clôturée au
Statistics / Statistiques
30/09/2017
I - CHF - Hedged - Capitalisation
5 443.7310.8875
5 827.4611.6549
0.000.0000
Net Asset Value/Valeur Nette d'InventaireNet Asset Value per share/Valeur Nette d'Inventaire par action
CHF CHF CHF
S - EUR - Hedged - Capitalisation
988 083.5611.3341
1 238 681.0212.0546
1 993 877.5210.5820
Net Asset Value/Valeur Nette d'InventaireNet Asset Value per share/Valeur Nette d'Inventaire par action
EUR EUR EUR
M - USD - Capitalisation
141 704 446.2311.7009
199 098 288.3812.3140
108 920 525.0510.6644
Net Asset Value/Valeur Nette d'InventaireNet Asset Value per share/Valeur Nette d'Inventaire par action
USD USD USD
M - USD - Distribution
40 804 559.0911.7009
0.00
53 405 064.6112.3140
0.00
22 043 438.3910.6644
0.00
Net Asset Value/Valeur Nette d'InventaireNet Asset Value per share/Valeur Nette d'Inventaire par actionDividend per share paid to shareholders/Dividende par action payé aux actionnaires
USD USD USD
M - EUR - Hedged - Capitalisation
5 285 076.9110.9458
3 853 216.3011.7161
2 872 750.2710.4246
Net Asset Value/Valeur Nette d'InventaireNet Asset Value per share/Valeur Nette d'Inventaire par action
EUR EUR EUR
M - EUR - Hedged - Distribution
4 414 037.9810.9457
0.00
4 030 663.3711.7161
0.00
0.000.0000
0.00
Net Asset Value/Valeur Nette d'InventaireNet Asset Value per share/Valeur Nette d'Inventaire par actionDividend per share paid to shareholders/Dividende par action payé aux actionnaires
EUR EUR EUR
N - USD - Capitalisation
44 791 690.1111.7399
58 748 957.4212.3469
34 311 021.2610.6715
Net Asset Value/Valeur Nette d'InventaireNet Asset Value per share/Valeur Nette d'Inventaire par action
USD USD USD
N - USD - Distribution
13 935 584.3011.7399
0.00
13 575 582.0112.3469
0.00
8 229 039.3210.6715
0.00
Net Asset Value/Valeur Nette d'InventaireNet Asset Value per share/Valeur Nette d'Inventaire par actionDividend per share paid to shareholders/Dividende par action payé aux actionnaires
USD USD USD

The accompanying notes form an integral part of these financial statements.Les notes annexées font partie intégrante de ces états financiers.
180 PrivilEdge - William Blair US Small and Mid Cap · 31/03/2019
30/09/201831/03/2019For the period ended/Pour la période clôturée au
Statistics / Statistiques
30/09/2017
N - CHF - Hedged - Capitalisation
0.000.0000
2 177 280.9611.6423
1 272 841.3710.3857
Net Asset Value/Valeur Nette d'InventaireNet Asset Value per share/Valeur Nette d'Inventaire par action
CHF CHF CHF
N - EUR - Hedged - Capitalisation
1 309 191.6610.9792
1 831 553.3111.7441
111 701.5510.4287
Net Asset Value/Valeur Nette d'InventaireNet Asset Value per share/Valeur Nette d'Inventaire par action
EUR EUR EUR
N - EUR - Hedged - Distribution
31 097.1510.9792
0.00
0.000.0000
0.00
0.000.0000
0.00
Net Asset Value/Valeur Nette d'InventaireNet Asset Value per share/Valeur Nette d'Inventaire par actionDividend per share paid to shareholders/Dividende par action payé aux actionnaires
EUR EUR EUR

The accompanying notes form an integral part of these financial statements.Les notes annexées font partie intégrante de ces états financiers.
181PrivilEdge - William Blair US Small and Mid Cap · 31/03/2019
Investments in securities at market value/Portefeuille-titres à la valeur de marché 288 423 658.88 98.90
GENPACT LTD100 622 3 539 881.96 1.21USD
Transferable securities admitted to an official stock exchange listing and/or dealt in on anotherregulated market/Valeurs mobilières admises à la cote officielle d'une bourse de valeurs et/ounégociées sur un autre marché réglementé
288 419 586.09 98.90
EQUITIES/ACTIONS 288 419 586.09 98.90
BERMUDA/BERMUDES 3 539 881.96 1.21
CAMECO CORP267 283 3 151 266.57 1.08USD
CANADA/CANADA 11 811 572.61 4.05
COLLIERS INT GR WHEN ISSUD SUB VTG26 058 1 739 632.08 0.60USDCOTT CORP (QUEBEC)159 204 2 325 970.44 0.80USDFIRSTSERVICE CORP WI23 928 2 137 727.52 0.73USDRITCHIE BROTHERS AUCTIONEERS72 264 2 456 976.00 0.84USD
HORIZON PHARMA PLC178 711 4 723 331.73 1.62USD
IRELAND/IRLANDE 4 723 331.73 1.62
NICE SYSTEMS ADR REPR.SHS35 632 4 365 276.32 1.50USD
ISRAEL/ISRAËL 4 365 276.32 1.50
ORION ENGINEERED CARBONS REG SHS179 303 3 404 963.97 1.17USD
LUXEMBOURG/LUXEMBOURG 3 404 963.97 1.17
BRIGHTSPHERE INVESTMENT156 344 2 120 024.64 0.73USD
UNITED KINGDOM/ROYAUME-UNI 6 456 252.88 2.21
LUXFER HOLDINGS PLC173 588 4 336 228.24 1.48USD
ADTLM GLBL EDCT - REGISTERED103 661 4 801 577.52 1.65USD
UNITED STATES/ÉTATS-UNIS 254 118 306.62 87.14
ADVANCE AUTO PARTS13 984 2 384 691.52 0.82USDAMERICAN CAMPUS COMMUNITIES INC85 733 4 079 176.14 1.40USDAPPLE HOSP REIT164 754 2 685 490.20 0.92USDARGAN INC78 035 3 897 848.25 1.34USDARMSTRONG WORLD INDUSTRIES45 956 3 649 825.52 1.25USDARTHUR J.GALLAGHER AN CO57 127 4 461 618.70 1.53USDAT HOME GROUP INC63 505 1 134 199.30 0.39USDBLUE BIRD CORP - REGISTERED272 290 4 609 869.70 1.58USDBOOT BARN HOLDINGS INC121 751 3 584 349.44 1.23USDBOOZ ALLEN HAMILTON -A-88 184 5 127 017.76 1.75USDBRINKS CO80 202 6 048 032.82 2.06USDBURLINGTON STORES INC24 132 3 781 001.76 1.30USDBWX TECHN124 455 6 170 478.90 2.11USDCABLE ONE2 799 2 746 882.62 0.94USDCAMBREX CORP85 988 3 340 633.80 1.15USDCASELLA WASTE SYSTEMS INC -A-73 624 2 618 069.44 0.90USDCATALENT98 104 3 982 041.36 1.37USDCBOE HOLDINGS INC49 150 4 690 876.00 1.61USDCENTENNIAL RES -A-176 068 1 547 637.72 0.53USDCODEXIS94 337 1 936 738.61 0.66USDCONAGRA BRANDS INC62 955 1 746 371.70 0.60USDCOPART INC102 325 6 199 871.75 2.12USDCORESITE REALTY CORP41 040 4 392 100.80 1.51USDCROWN HOLDINGS INC65 328 3 564 948.96 1.22USDDAVE AND BUSTER ENTERTAINMENT INC40 967 2 043 024.29 0.70USDDIAMONDBACK ENERGY12 623 1 281 613.19 0.44USDDINEEQUITY27 407 2 501 985.03 0.86USD
Schedule of investments as at 31/03/2019 / Inventaire du portefeuille au 31/03/2019
USD
Market ValueNumber of Shares orNominal Value
Investment % of Net AssetsQuotationCurrency
Valeur de marchéNombre d'actions ouvaleur nominale
Investissement % de l'actif netDevise decotation

The accompanying notes form an integral part of these financial statements.Les notes annexées font partie intégrante de ces états financiers.
182 PrivilEdge - William Blair US Small and Mid Cap · 31/03/2019
DOLBY LABORATORIES -A-66 737 4 202 428.89 1.44USDDONALDSON CO39 559 1 980 323.54 0.68USDDOUGLAS DYNAMICS INC68 655 2 613 695.85 0.90USDDOUGLAS EMMETT80 228 3 242 815.76 1.11USDEAGLE MATERIALS INC30 271 2 551 845.30 0.88USDEAST WEST BANCORP INC71 645 3 436 810.65 1.18USDENCOMPASS HLTH72 107 4 211 048.80 1.44USDENCORE CAPITAL GROUP INC147 816 4 025 029.68 1.38USDEURONET SERVICES43 698 6 230 897.82 2.13USDFIRST CASH FINANCIAL SERVICES INC28 571 2 471 391.50 0.85USDFMC CORP42 659 3 277 064.38 1.12USDGENESEE&WYOMING -A-33 369 2 907 774.66 1.00USDGENTHERM INC63 080 2 325 128.80 0.80USDGRAND CANYON EDUCATION INC31 810 3 642 563.10 1.25USDHANGER ORTHOPEDIC236 619 4 507 591.95 1.55USDHEALTHCARE SERVICES GROUP INC93 041 3 069 422.59 1.05USDHILTON GRAND VACATIONS INC67 989 2 097 460.65 0.72USDIDACORP INC46 788 4 657 277.52 1.60USDJOHN BEAN TECH W.ISS33 021 3 034 299.69 1.04USDJONES LANG LASALLE INC13 165 2 029 779.70 0.70USDJ2 GLOBAL INC44 765 3 876 649.00 1.33USDLAMB WESTON HOLDINGS REG WI48 537 3 637 362.78 1.25USDLHC GROUP32 034 3 551 289.24 1.22USDLIVE NATION64 916 4 124 762.64 1.41USDMIDDLEBY CORP25 084 3 261 672.52 1.12USDNORDSON16 919 2 242 105.88 0.77USDPARSLEY ENERGY INC -A-110 374 2 130 218.20 0.73USDPORTOLA PHARMA113 042 3 922 557.40 1.35USDPRIMO WATER CORP170 741 2 639 655.86 0.91USDREXFORD INDUSTRIAL REALTY TRUST UNITS99 713 3 570 722.53 1.22USDROGERS CORP26 960 4 283 404.80 1.47USDSABRE182 063 3 894 327.57 1.34USDSERVICE CORPORATION INTERNATIONAL47 156 1 893 313.40 0.65USDSIGNATURE BANK34 224 4 383 067.68 1.50USDSVB FINANCIAL GROUP22 077 4 909 041.72 1.67USDTAKE TWO INTERACTIVE SOFTWARE INC29 415 2 775 893.55 0.95USDTELEDYNE TECHNOLOGIES12 016 2 847 912.16 0.98USDTELEFLEX INC14 184 4 285 837.44 1.47USDTERRENO REALTY79 209 3 329 946.36 1.14USDTORO CO36 494 2 512 246.96 0.86USDTRANSUNION48 342 3 231 179.28 1.11USDTREX COMPANY INC24 041 1 479 002.32 0.51USDVAIL RESORTS INC16 898 3 671 935.40 1.26USDVERRA MOBILITY - REGISTERED SHS -A-91 453 1 088 290.70 0.37USDVIRTU FINANCL -A-127 842 3 036 247.50 1.04USDWESTERN ALLIANCE108 755 4 463 305.20 1.53USDWEX18 510 3 553 734.90 1.22USD
HERBALIFE CONTINGENT VALUE 31.12.49 RIGHT - FV, refer to/voir note 231 971 4 072.79 0.00USD
Other transferable securities/Autres valeurs mobilières 4 072.79 0.00
WARRANTS, RIGHTS/WARRANTS, DROITS 4 072.79 0.00
CAYMAN ISLANDS/ILES CAÏMANS 4 072.79 0.00
Schedule of investments as at 31/03/2019 / Inventaire du portefeuille au 31/03/2019
USD
Market ValueNumber of Shares orNominal Value
Investment % of Net AssetsQuotationCurrency
Valeur de marchéNombre d'actions ouvaleur nominale
Investissement % de l'actif netDevise decotation

The accompanying notes form an integral part of these financial statements.Les notes annexées font partie intégrante de ces états financiers.
183PrivilEdge - William Blair US Small and Mid Cap · 31/03/2019
Schedule of investments as at 31/03/2019 / Inventaire du portefeuille au 31/03/2019
Forward Foreign Currency Exchange Contracts/Contrats de change à terme (0.04)(125 348.73)USD 186.06 0.00CHF (0.45)186.61 15/04/2019Caceis BankCHF 5 552.65 0.00USD 38.825 561.70 15/04/2019Caceis BankUSD 1 933 249.46 0.00EUR 8 342.272 181 488.70 15/04/2019Caceis BankEUR 16 054 309.83 (0.04)USD (133 729.37)14 163 132.74 15/04/2019Caceis Bank
USD
Unrealised appreciation/(depreciation)
Currency % of NetAssets
Amount bought Maturity Currency Amount soldCounterparty
Plus/(Moins) value non-réalisée
Devise % de l'actifnet
Montant acheté Maturité Devise Montant venduContrepartie

184

PrivilEdgeis an investment company
with variable capital ("SICAV")incorporated in Luxembourg
PrivilEdgeest une société d’investissement
à capital variable ("SICAV")enregistrée au Luxembourg RCS Luxembourg B0181207
PrivilEdge –BlackRock Emerging Market Dynamic BondUnaudited semi-annual report · Rapport semestriel non révisé
31.03.2019

The accompanying notes form an integral part of these financial statements.Les notes annexées font partie intégrante de ces états financiers.
186 PrivilEdge - BlackRock Emerging Market Dynamic Bond · 31/03/2019
ASSETS/ACTIF
38 001 860.97Investments in securities at market value/Portefeuille-titres à la valeur de marché (2):( USD )38 885 029.98Acquisition cost/Coût d'acquisition
75 530.47Net options at market value/Position nette en options à la valeur de marché (2):( USD )145 349.27Acquisition cost/Coût d'acquisition
1 980 729.43Cash and term deposits/Liquidité et dépôts à terme190 304.41Receivable on investments sold/À recevoir sur vente de titres681 748.48Interest and dividends receivable, net/Intérêt et dividendes nets à recevoir
46 902.88Interest on swaps receivable/Intérêt à recevoir sur swaps114 954.33Unrealised appreciation on IRS/Plus-value non réalisée sur IRS (2)
3 969.56Unrealised appreciation on futures contracts/Plus-value non réalisée sur contrats futures (2)495 185.92Other assets/Autres actifs
41 591 186.45LIABILITIES/PASSIF
6 650.63Bank overdrafts/Découverts bancaires1 296 955.54Payable on investments purchased/À payer sur achat de titres
30 353.24Management and distribution fees payable/Commission de gestion et de distribution à payer (3)8 159.76Taxes and expenses payable/Impôts et autres frais à payer
434 554.89Unrealised depreciation on CDS/Moins-value non réalisée sur CDS (2)1 090 330.53Interest on swaps payable/Intérêt à payer sur swaps
110 016.45Unrealised depreciation on forward foreign currency exchange contracts/Moins-value non réalisée sur contrats de change àterme
(2)
2 977 021.0438 614 165.41NET ASSET VALUE/VALEUR NETTE D'INVENTAIRE
Statement of net assets as at 31/03/2019 / État de l'actif net au 31/03/2019
NotesNotes USD

The accompanying notes form an integral part of these financial statements.Les notes annexées font partie intégrante de ces états financiers.
187PrivilEdge - BlackRock Emerging Market Dynamic Bond · 31/03/2019
Statement of operations and changes in net assets for the period from 01/10/2018 to 31/03/2019 / État desopérations et des variations de l'actif net pour la période du 01/10/2018 au 31/03/2019
NotesNotes USD
72 038 665.21NET ASSET VALUE AT THE BEGINNING OF THE PERIOD/VALEUR NETTE D'INVENTAIRE AU DÉBUT DE LAPÉRIODE
INCOME/REVENUS
1 912 386.19Interest on bonds, net/Intérêts sur obligations, nets (2)35 764.03Bank interest/Intérêts bancaires
266.46Securities Lending Income/Revenus sur prêt de titres (9)1 948 416.68
EXPENSES/DÉPENSES
225 100.88Management fees/Commission de gestion (3)4 899.67Distribution fees/Frais de distribution (3)
20 542.35Bank interest and other expenses/Intérêts bancaires débiteurs et autres frais65 790.71Fixed Rate of Operational Costs/Taux Fixe de Coûts Opérationnels (4)
582 320.36Interest on swaps, net/Intérêts sur contrats de swaps, nets898 653.97
1 049 762.71NET INVESTMENT INCOME/REVENU NET SUR INVESTISSEMENTS
(3 238 676.00)Net realised loss on sale of investments/Perte nette réalisée sur ventes d'investissements (2)134 650.38Net realised gain on options/Gain net réalisé sur options891 123.45Net realised gain on swaps/Gain net réalisé sur swaps (2)241 821.95Net realised gain on futures contracts/Gain net réalisé sur contrats futures
(268 923.96)Net realised loss on foreign exchange/Perte nette réalisée sur opérations de change(1 153 779.14)Net realised loss on forward foreign currency exchange contracts/Perte nette réalisée sur contrats de change à terme(2 344 020.61)NET REALISED LOSS/PERTE NETTE RÉALISÉE
2 539 385.09Change in net unrealised appreciation or depreciation on investments/Variation de la plus ou moins-value nette non réaliséesur investissements
(2)
(64 093.35)Change in net unrealised appreciation or depreciation on options/Variation de la plus ou moins-value non réalisée sur options108 070.78Change in net unrealised appreciation or depreciation on IRS/Variation de la plus ou moins-value nette non réalisée sur IRS (2)
(692 743.10)Change in net unrealised appreciation or depreciation on CDS/Variation de la plus ou moins-value nette non réalisée surCDS
(2)
(49 454.62)Change in net unrealised appreciation or depreciation on futures contracts/Variation de la plus ou moins-value nette nonréalisée sur contrats futures
(313 476.23)Change in net unrealised appreciation or depreciation on forward foreign currency exchange contracts/Variation de la plus oumoins-value nette non réalisée sur contrats de change à terme
(816 332.04)NET DECREASE IN NET ASSETS AS A RESULT OF OPERATIONS/DIMINUTION NETTE DE L'ACTIF NET RÉSULTANTDES OPÉRATIONS
(494 830.31)Dividend paid/Dividende payé(32 113 337.45)Net subscriptions/(redemptions) including equalisation/Souscriptions/(rachats) nets incluant la régularisation
38 614 165.41NET ASSET VALUE AT THE END OF THE PERIOD/VALEUR NETTE D'INVENTAIRE À LA FIN DE LA PÉRIODE

The accompanying notes form an integral part of these financial statements.Les notes annexées font partie intégrante de ces états financiers.
188 PrivilEdge - BlackRock Emerging Market Dynamic Bond · 31/03/2019
120 000.0000 0.0000 (80 000.0000) 40 000.0000P - USD - Capitalisation118 638.9580 0.0000 (50 000.0000) 68 638.9580P - CHF - Hedged - Capitalisation
42 963.4210 0.0000 (20 282.7510) 22 680.6700P - EUR - Hedged - Capitalisation5 000.0000 0.0000 0.0000 5 000.0000P - GBP - Hedged - Capitalisation
815 998.1720 0.0000 (815 998.1720) 0.0000I - USD - Capitalisation820 000.0000 0.0000 (20 000.0000) 800 000.0000I - USD - Distribution
10 000.0000 0.0000 0.0000 10 000.0000I - CHF - Hedged - Capitalisation450 000.0000 0.0000 (450 000.0000) 0.0000I - EUR - Hedged - Capitalisation
1 340 575.4690 100 989.6910 (701 180.7750) 740 384.3850M - USD - Capitalisation471 897.6000 0.0000 (30 000.0000) 441 897.6000M - USD - Distribution428 647.4660 0.0000 (114 732.0000) 313 915.4660M - CHF - Hedged - Capitalisation672 362.3130 16 532.0560 (150 938.0000) 537 956.3690M - EUR - Hedged - Capitalisation
50 249.5670 0.0000 0.0000 50 249.5670M - EUR - Hedged - Distribution106 588.0000 0.0000 (22 098.0000) 84 490.0000M - GBP - Hedged - Capitalisation855 000.0000 0.0000 (480 000.0000) 375 000.0000N - USD - Capitalisation120 000.0000 0.0000 0.0000 120 000.0000N - USD - Distribution522 425.0000 11 000.0000 (192 425.0000) 341 000.0000N - CHF - Hedged - Capitalisation408 575.0030 0.0000 (408 575.0030) 0.0000N - EUR - Hedged - Capitalisation100 000.0000 0.0000 0.0000 100 000.0000N - EUR - Hedged - Distribution
Statement of changes in the number of shares outstanding for the period from 01/10/2018 to 31/03/2019 / Étatdes variations du nombre d'actions pour la période du 01/10/2018 au 31/03/2019
Number of Shares01/10/2018/
Nombre d'actions01/10/2018
Number of Sharesissued/
Nombre d'actionsémises
Number of Sharesredeemed/
Nombre d'actionsrachetées
Number of Shares31/03/2019/
Nombre d'actions31/03/2019
30/09/201831/03/2019For the period ended/Pour la période clôturée au
Statistics / Statistiques
30/09/2017
P - USD - Capitalisation
379 706.069.4927
1 116 807.509.3067
2 333 362.1510.1451
Net Asset Value/Valeur Nette d'InventaireNet Asset Value per share/Valeur Nette d'Inventaire par action
USD USD USD
P - CHF - Hedged - Capitalisation
615 961.408.9739
1 063 064.908.9605
504 112.4810.0822
Net Asset Value/Valeur Nette d'InventaireNet Asset Value per share/Valeur Nette d'Inventaire par action
CHF CHF CHF
P - EUR - Hedged - Capitalisation
204 817.289.0305
386 690.989.0005
80 767.1510.0959
Net Asset Value/Valeur Nette d'InventaireNet Asset Value per share/Valeur Nette d'Inventaire par action
EUR EUR EUR

The accompanying notes form an integral part of these financial statements.Les notes annexées font partie intégrante de ces états financiers.
189PrivilEdge - BlackRock Emerging Market Dynamic Bond · 31/03/2019
30/09/201831/03/2019For the period ended/Pour la période clôturée au
Statistics / Statistiques
30/09/2017
P - GBP - Hedged - Capitalisation
46 024.959.2050
45 594.119.1188
50 584.7910.1170
Net Asset Value/Valeur Nette d'InventaireNet Asset Value per share/Valeur Nette d'Inventaire par action
GBP GBP GBP
I - USD - Capitalisation
0.000.0000
7 678 971.249.4105
8 334 234.9710.1765
Net Asset Value/Valeur Nette d'InventaireNet Asset Value per share/Valeur Nette d'Inventaire par action
USD USD USD
I - USD - Distribution
7 390 710.639.2384
0.32
7 670 691.999.3545
0.05
9 668 070.2810.1704
0.00
Net Asset Value/Valeur Nette d'InventaireNet Asset Value per share/Valeur Nette d'Inventaire par actionDividend per share paid to shareholders/Dividende par action payé aux actionnaires
USD USD USD
I - CHF - Hedged - Capitalisation
90 987.539.0988
90 490.639.0491
121 189.0210.1007
Net Asset Value/Valeur Nette d'InventaireNet Asset Value per share/Valeur Nette d'Inventaire par action
CHF CHF CHF
I - EUR - Hedged - Capitalisation
0.000.0000
4 082 908.559.0731
0.000.0000
Net Asset Value/Valeur Nette d'InventaireNet Asset Value per share/Valeur Nette d'Inventaire par action
EUR EUR EUR
M - USD - Capitalisation
7 092 875.539.5800
12 555 746.519.3659
21 943 204.5110.1610
Net Asset Value/Valeur Nette d'InventaireNet Asset Value per share/Valeur Nette d'Inventaire par action
USD USD USD
M - USD - Distribution
4 073 759.619.2188
0.34
4 420 172.659.3668
0.00
3 294 009.3310.1615
0.00
Net Asset Value/Valeur Nette d'InventaireNet Asset Value per share/Valeur Nette d'Inventaire par actionDividend per share paid to shareholders/Dividende par action payé aux actionnaires
USD USD USD
M - CHF - Hedged - Capitalisation
2 841 817.239.0528
3 863 754.789.0138
12 690 491.9510.0919
Net Asset Value/Valeur Nette d'InventaireNet Asset Value per share/Valeur Nette d'Inventaire par action
CHF CHF CHF

The accompanying notes form an integral part of these financial statements.Les notes annexées font partie intégrante de ces états financiers.
190 PrivilEdge - BlackRock Emerging Market Dynamic Bond · 31/03/2019
30/09/201831/03/2019For the period ended/Pour la période clôturée au
Statistics / Statistiques
30/09/2017
M - EUR - Hedged - Capitalisation
4 900 362.499.1092
6 087 169.169.0534
7 933 419.6510.1053
Net Asset Value/Valeur Nette d'InventaireNet Asset Value per share/Valeur Nette d'Inventaire par action
EUR EUR EUR
M - EUR - Hedged - Distribution
439 734.838.7510
0.29
452 295.709.0010
0.06
507 783.5610.1052
0.00
Net Asset Value/Valeur Nette d'InventaireNet Asset Value per share/Valeur Nette d'Inventaire par actionDividend per share paid to shareholders/Dividende par action payé aux actionnaires
EUR EUR EUR
M - GBP - Hedged - Capitalisation
784 312.529.2829
977 413.639.1700
1 509 747.7610.1274
Net Asset Value/Valeur Nette d'InventaireNet Asset Value per share/Valeur Nette d'Inventaire par action
GBP GBP GBP
N - USD - Capitalisation
3 603 284.039.6088
8 026 592.009.3878
18 274 223.0910.1665
Net Asset Value/Valeur Nette d'InventaireNet Asset Value per share/Valeur Nette d'Inventaire par action
USD USD USD
N - USD - Distribution
1 108 005.499.2334
0.31
1 121 248.909.3437
0.05
1 220 088.4110.1674
0.00
Net Asset Value/Valeur Nette d'InventaireNet Asset Value per share/Valeur Nette d'Inventaire par actionDividend per share paid to shareholders/Dividende par action payé aux actionnaires
USD USD USD
N - CHF - Hedged - Capitalisation
3 096 992.559.0821
4 721 144.409.0370
11 531 147.3510.0973
Net Asset Value/Valeur Nette d'InventaireNet Asset Value per share/Valeur Nette d'Inventaire par action
CHF CHF CHF
N - EUR - Hedged - Capitalisation
0.000.0000
3 709 184.539.0783
6 647 314.9110.1121
Net Asset Value/Valeur Nette d'InventaireNet Asset Value per share/Valeur Nette d'Inventaire par action
EUR EUR EUR
N - EUR - Hedged - Distribution
876 909.288.7691
0.31
903 399.909.0340
0.05
1 011 206.0710.1121
0.00
Net Asset Value/Valeur Nette d'InventaireNet Asset Value per share/Valeur Nette d'Inventaire par actionDividend per share paid to shareholders/Dividende par action payé aux actionnaires
EUR EUR EUR

The accompanying notes form an integral part of these financial statements.Les notes annexées font partie intégrante de ces états financiers.
191PrivilEdge - BlackRock Emerging Market Dynamic Bond · 31/03/2019
Investments in securities at market value/Portefeuille-titres à la valeur de marché 38 001 860.97 98.41
ANGOLA 9.375 18-48 09/05S1 622 000 1 756 836.86 4.55USD
Transferable securities admitted to an official stock exchange listing and/or dealt in on anotherregulated market/Valeurs mobilières admises à la cote officielle d'une bourse de valeurs et/ounégociées sur un autre marché réglementé
33 119 768.38 85.77
BONDS/OBLIGATIONS 31 960 216.54 82.77
ANGOLA/ANGOLA 2 030 016.86 5.26
ANGOLA (REP) REGS 9.50 15-25 12/11S240 000 273 180.00 0.71USD
ARGENTINA (REP OF) 6.875 18-48 11/01S261 000 192 150.81 0.50USD
ARGENTINA/ARGENTINE 1 318 155.09 3.41
PROVINCIA BUENOS AIRE 9.125 16-24 16/03S235 000 196 730.25 0.51USDPROVINCIA DE BUENO 6.5 17-23 15/02S271 000 221 534.37 0.57USDREPUBLIC OF ARGENT 6.25 17-47 09/11A247 000 200 292.26 0.52EURREPUBLIQUE ARGENTINE 7.125 17-117 28/06S257 000 189 935.85 0.49USDYPF REGS 6.95 17-27 21/07S105 000 93 049.95 0.24USDYPF REGS 8.125 15-25 28/07A230 000 224 461.60 0.58USD
BRASIL 10.00 18-29 05/01S689 188 633.47 0.49BRL
BRAZIL/BRÉSIL 188 633.47 0.49
COSTA RICA REGS 7.158 15-45 12/03S297 000 290 798.64 0.75USD
COSTA RICA/COSTA RICA 290 798.64 0.75
DOMINICAN REPUBLIC 6.5 18-48 15/12S177 000 183 970.26 0.48USD
DOMINICAN REPUBLIC/RÉPUBLIQUE DOMINICAINE 183 970.26 0.48
ECUADOR REG S 7.95 14-24 20/06S466 000 467 258.20 1.21USD
ECUADOR/EQUATEUR 467 258.20 1.21
EGYPTE 7.903 18-48 21/02S801 000 778 075.38 2.01USD
EGYPT/EGYPTE 1 885 430.54 4.88
EGYPTE 8.50 17-47 31/01S520 000 531 954.80 1.38USDEGYPTE 14.85 18-23 10/04S5 265 000 285 891.85 0.74EGPEGYPTE 14.95 18-21 20/03S5 189 000 289 508.51 0.75EGP
EL SALVADOR REGS 6.375 14-27 18/01S92 000 90 905.20 0.24USD
EL SALVADOR/SALVADOR 319 877.10 0.83
EL SALVADOR REP REGS 7.375 09-19 01/12S226 000 228 971.90 0.59USD
GABONESE REGS 6.375 13-24 12/12S461 518 443 394.19 1.15USD
GABON/GABON 1 392 073.39 3.61
GABONESE REPUBLIC 6.95 15-25 16/06S980 000 948 679.20 2.46USD
HONGRIE 0.5 18-21 21/04A105 950 000 368 578.82 0.95HUF
HUNGARY/HONGRIE 4 092 833.46 10.60
HONGRIE 3.00 16-27 27/10A250 280 000 910 491.14 2.36HUFHUNGARY 1.75 17-22 26/10A53 460 000 189 442.45 0.49HUFHUNGARY 2.50 16-21 27/10A176 750 000 645 409.77 1.67HUFHUNGARY 7.50 04-20 12/11A199 260 000 777 135.60 2.01HUFHUNGARY A 7.00 11-22 24/06A60 160 000 249 174.82 0.65HUFHUNGARY -A- 6.75 11-28 22/10A203 010 000 952 600.86 2.47HUF
INDO ASAHAN 5.71 18-23 15/11S542 000 586 053.76 1.51USD
INDONESIA/INDONÉSIE 799 979.20 2.07
INDONESIA GOVERNMENT 8.375 18-39 15/04S1 487 000 000 106 933.45 0.28IDRINDONESIE 8.25 18-29 27/09S1 458 000 000 106 991.99 0.28IDR
Schedule of investments as at 31/03/2019 / Inventaire du portefeuille au 31/03/2019
USD
Market ValueNumber of Shares orNominal Value
Investment % of Net AssetsQuotationCurrency
Valeur de marchéNombre d'actions ouvaleur nominale
Investissement % de l'actif netDevise decotation

The accompanying notes form an integral part of these financial statements.Les notes annexées font partie intégrante de ces états financiers.
192 PrivilEdge - BlackRock Emerging Market Dynamic Bond · 31/03/2019
KASAK TEMIR REGS 6.95 12-42 10/07S366 000 420 248.52 1.09USD
KAZAKHSTAN/KAZAKHSTAN 420 248.52 1.09
REPUBLICA ORIENT U 9.875 17-22 20/06S14 534 000 431 722.75 1.12UYU
LUXEMBOURG/LUXEMBOURG 1 542 556.01 3.99
ROMANIAN GOVERNMENT 4.625 19-49 03/04A954 000 1 110 833.26 2.87EUR
PETROLEOS MEXICANOS 6.5 18-27 13/03S361 000 364 202.07 0.94USD
MEXICO/MEXIQUE 761 218.92 1.97
UTD MEXICAN STATES 4.00 15-2115 15/03A374 000 397 016.85 1.03EUR
KAZMUNAYGAS NAT 4.7500 18-25 24/04S721 000 745 852.87 1.93USD
MICRONESIE (ILES)/MICRONESIE (ILES) 1 762 442.10 4.56
KAZMUNAYGAS NAT. 6.375 18-48 24/04S617 000 674 880.77 1.75USDKAZMUNAYGAS NATIONAL 5.75 17-47 19/04S327 000 341 708.46 0.88USD
MOZAMBIQUE REP DEF 10.50 16-23 18/01S224 000 195 769.28 0.51USD
MOZAMBIQUE/MOZAMBIQUE 195 769.28 0.51
NIGERIA 7.625 17-47 28/11S776 000 756 747.44 1.96USD
NIGERIA/NIGERIA 2 897 712.52 7.50
NIGERIA 7.875 17-32 16/02S242 000 252 113.18 0.65USDNIGERIA GOVERNMENT 14.50 16-21 15/07S159 110 000 444 604.35 1.15NGNNIGERIA GOVERNMENT 16.2884 17-27 17/0174 175 000 529 520.81 1.37NGNNIGERIA REGS 7.875 17-32 16/02S878 000 914 726.74 2.37USD
POLAND GOVT BOND 2.75 13-28 25/04A873 000 227 956.40 0.59PLN
POLAND/POLOGNE 227 956.40 0.59
ETAT DU QATAR 4.817 19-49 14/03S895 000 943 186.80 2.44USD
QATAR/QATAR 943 186.80 2.44
SAUDI INTERN BOND 5.00 18-49 17/04S277 000 287 628.49 0.74USD
SAUDI ARABIA/ARABIE SAOUDITE 1 613 486.09 4.18
SAUDI INTERNATIONAL 5.25 19-50 16/01S1 240 000 1 325 857.60 3.44USD
SOUTH AFRICA 4.30 16-28 12/10S246 000 230 194.50 0.60USD
SOUTH AFRICA/AFRIQUE DU SUD 956 948.73 2.48
SOUTH AFRICA (REP OF) 8.75 12-48 28/02S11 551 694 726 754.23 1.88ZAR
NORTHERN LIGHTS REGS 7.00 12-19 16/08Q297 000 298 663.20 0.77USD
THE NETHERLANDS/PAYS-BAS 1 560 223.08 4.04
PETROBRAS GLB FIN 6.85 15-XX 05/06S1 302 000 1 261 559.88 3.27USD
REPUBLIC OF TURKEY 4.625 19-25 31/03A860 000 940 428.19 2.44EUR
TURKEY/TURQUIE 940 428.19 2.44
MIN FIN UKRAINE 7.75 15-25 01/09S132 000 126 013.80 0.33USD
UKRAINE/UKRAINE 2 243 551.54 5.81
MIN FIN UKRAINE REGS 7.75 15-23 01/09S382 000 368 672.02 0.95USDMIN FIN UKRAINE REGS 7.75 15-27 01/09S200 000 186 946.00 0.48USDUKRAINE 9.75 18-28 01/11S558 000 576 653.94 1.49USDUKRAINE GOVT 7.375 17-32 25/09S1 103 000 985 265.78 2.56USD
BIZ FINANCE PLC 9.625 15-22 27/04S228 000 230 647.08 0.60USD
UNITED KINGDOM/ROYAUME-UNI 311 872.68 0.81
ST SAVINGS BK UA V 9.375 15-23 10/03S80 000 81 225.60 0.21USD
PETROL VENEZUELA DEF 8.50 16-20 27/10S774 500 701 658.28 1.82USD
VENEZUELA/VENEZUELA 2 132 125.17 5.52
PETROLEOS VEN(DEFAULT)9.75 12-35 17/05S4 080 105 1 167 032.43 3.02USD
Schedule of investments as at 31/03/2019 / Inventaire du portefeuille au 31/03/2019
USD
Market ValueNumber of Shares orNominal Value
Investment % of Net AssetsQuotationCurrency
Valeur de marchéNombre d'actions ouvaleur nominale
Investissement % de l'actif netDevise decotation

The accompanying notes form an integral part of these financial statements.Les notes annexées font partie intégrante de ces états financiers.
193PrivilEdge - BlackRock Emerging Market Dynamic Bond · 31/03/2019
VENEZUELA DEF 9.25 08-28 07/05S38 300 11 921.22 0.03USDVENEZUELA DEF 9.25 97-27 15/09S133 000 41 793.65 0.11USDVENEZUELA DEF 11.95 11-31 05/08S542 100 167 697.55 0.43USDVENEZUELA REGS DEF 11.75 11-26 21/10S135 100 42 022.04 0.11USD
ZAMBIA 8.50 14-24 14/04S200 000 147 492.00 0.38USD
ZAMBIA/ZAMBIE 481 464.30 1.25
ZAMBIA REGS 5.375 12-22 20/09S465 000 333 972.30 0.87USD
ARGENTINA POLITICA-DY-FL.R 17-20 21/06Q6 319 217 165 353.00 0.43ARS
FLOATING RATE NOTES/OBLIGATIONS À TAUX VARIABLE 1 159 551.84 3.00
ARGENTINA/ARGENTINE 612 446.96 1.58
PROVINCIA DE BU AIRE FL.R 18-25 12/04Q10 005 000 228 131.22 0.58ARSTARJETA NARANJA FL.R 17-22 11/04Q358 000 133 881.26 0.35USDYPF SOCIEDAD ANONI FL.R 16-20 07/07Q220 000 85 081.48 0.22USD
IRAQ FL.R 06-28 15/01S569 000 547 104.88 1.42USD
IRAQ/IRAK 547 104.88 1.42
REPUBLIC OF ECUADOR 10.75 19-29 31/01S440 000 488 109.60 1.26USD
Other transferable securities/Autres valeurs mobilières 2 966 390.13 7.68
BONDS/OBLIGATIONS 2 966 390.13 7.68
ECUADOR/EQUATEUR 488 109.60 1.26
ARAB REPUBLIC O 8.7002 19-49 01/03S235 000 244 877.05 0.63USD
EGYPT/EGYPTE 244 877.05 0.63
GHANA 16.5 18-20 17/02S386 045 72 232.40 0.19GHS
GHANA/GHANA 72 232.40 0.19
JASA MARGA REGS 7.50 17-20 11/12S1 040 000 000 70 258.26 0.18IDR
INDONESIA/INDONÉSIE 260 250.02 0.67
PT WIJAKA KARYA 7.7 18-21 31/01S2 840 000 000 189 991.76 0.49IDR
DEV.BK.OF KAZAK. 9.50 17-20 14/06S124 250 000 320 286.97 0.83KZT
KAZAKHSTAN/KAZAKHSTAN 589 955.70 1.53
DEVPT BK OF KAZAKHQ 8.95 18-23 04/05S103 250 000 269 668.73 0.70KZT
BENIN GOVERNMENT INTER5.75 19-26 26/03A340 000 379 363.85 0.98EUR
LUXEMBOURG/LUXEMBOURG 379 363.85 0.98
NIGERIA 13.98 18-28 23/02S129 462 000 352 627.92 0.92NGN
NIGERIA/NIGERIA 756 098.79 1.97
REPUBLIC OF NIGE 9.248 18-49 21/01S363 000 403 470.87 1.05USD
EUROPEAN BANK FOR REC 16.95 19-20 03/04U4 800 000 175 502.72 0.45UAH
UNITED KINGDOM/ROYAUME-UNI 175 502.72 0.45
ARGE TREA BILL ZCP 31-05-1915 380 000 354 962.88 0.92ARS
Money market instruments/Instruments du marché monétaire 1 915 702.46 4.96
BONDS/OBLIGATIONS 1 915 702.46 4.96
ARGENTINA/ARGENTINE 354 962.88 0.92
EGYP TREA BILL ZCP 13-08-193 675 000 198 632.91 0.51EGP
EGYPT/EGYPTE 1 560 739.58 4.04
EGYPT TREASURY BILLS ZCP 0204195 575 000 321 075.95 0.83EGPEGYPT TREASURY BILLS ZCP 07051912 775 000 722 944.60 1.88EGP
Schedule of investments as at 31/03/2019 / Inventaire du portefeuille au 31/03/2019
USD
Market ValueNumber of Shares orNominal Value
Investment % of Net AssetsQuotationCurrency
Valeur de marchéNombre d'actions ouvaleur nominale
Investissement % de l'actif netDevise decotation

The accompanying notes form an integral part of these financial statements.Les notes annexées font partie intégrante de ces états financiers.
194 PrivilEdge - BlackRock Emerging Market Dynamic Bond · 31/03/2019
EGYPT TREASURY BILLS ZCP 1607192 425 000 132 807.15 0.34EGPEGYPT TREASURY BILLS ZCP 210519925 000 51 974.82 0.13EGPEGYPT TREASURY BILLS ZCP 3007192 450 000 133 304.15 0.35EGP
Schedule of investments as at 31/03/2019 / Inventaire du portefeuille au 31/03/2019
USD
Market ValueNumber of Shares orNominal Value
Investment % of Net AssetsQuotationCurrency
Valeur de marchéNombre d'actions ouvaleur nominale
Investissement % de l'actif netDevise decotation
Net options at market value/Position nette en options à la valeur de marché 75 530.47 0.20
AUD(P)/JPY(C)OTC JUN 75.00 28.06.19 PUT2 725 000 14 091.18 0.04AUD
OTC options (Counterparties refer to Note 2) /Options OTC (Contreparties voir la note 2) 75 530.47 0.20
Purchased OTC options at market value/Positions longues en options OTC à la valeur de marché 75 530.47 0.20
AUD(P)/JPY(C)OTC JUN 75.10 28.06.19 PUT2 725 000 14 544.99 0.04AUDAUD(P)/JPY(C)OTC JUN 75.10 28.06.19 PUT2 725 000 14 544.99 0.04AUDEUR(P)/CHF(C)OTC MAY 1.100 31.05.19 PUT2 035 000 7 475.26 0.02EUREUR(P)/USD(C)OTC MAY 1.120 31.05.19 PUT2 035 000 14 715.44 0.04EURNZD(P)/JPY(C)OTC JUN 73.00 28.06.19 PUT1 400 000 9 311.18 0.02NZDUSD(P)/JPY (C) OTC MAR 107.5 22.03.19 PU3 612 500 0.04 0.00USDUSD(P)/MXN(C)OTC APR 18.75 08.04.19 PUT1 950 000 847.39 0.00USD

The accompanying notes form an integral part of these financial statements.Les notes annexées font partie intégrante de ces états financiers.
195PrivilEdge - BlackRock Emerging Market Dynamic Bond · 31/03/2019
ITRAXX XOVER S30 V2 MKT GOLDMAN SACHSINTERN.
(0.11)EUR (43 262.63)20/12/2023394 664.00 Buy/Achat (5%)/Quarterly
Credit Default Swaps (CDS)/Credit Default Swaps (CDS) (1.13)(434 554.89)
ITRAXX XOVER S30 V2 MKT GOLDMAN SACHSINTERN.
(0.29)EUR (112 482.87)20/12/20231 026 126.40 Buy/Achat (5%)/Quarterly
REP TURKEY USD SN CR M HSBC BANKLONDRES
0.09USD 35 546.7420/06/2024252 000.00 Buy/Achat (1%)/Quarterly
ITRAXX XOVER S31 V1 MKT JP MORGANSECURITIES LD
(0.05)EUR (19 887.92)20/06/2024162 000.00 Buy/Achat (5%)/Quarterly
ITRAXX XOVER S31 V1 MKT JP MORGANSECURITIES LD
(0.18)EUR (71 080.90)20/06/2024579 000.00 Buy/Achat (5%)/Quarterly
CDX NA IG S32 V1 MKT JP MORGANSECURITIES LD
(0.19)USD (71 550.40)20/06/20244 005 000.00 Buy/Achat (1%)/Quarterly
ITRAXX XOVER S31 V1 MKT JP MORGANSECURITIES LD
(0.29)EUR (110 488.44)20/06/2024900 000.00 Buy/Achat (5%)/Quarterly
ITRAXX XOVER S31 V1 MKT JP MORGANSECURITIES LD
(0.30)EUR (114 907.98)20/06/2024936 000.00 Buy/Achat (5%)/Quarterly
ITRAXX XOVER S31 V1 MKT JP MORGANSECURITIES LD
(0.31)EUR (114 907.98)20/06/2024936 000.00 Buy/Achat (5%)/Quarterly
REP TURKEY USD SN CR M MORGANSTANLEY AND COINTERN PLC
0.27USD 102 697.6220/06/2024728 050.00 Buy/Achat (1%)/Quarterly
REP TURKEY USD SN CR M MORGANSTANLEY AND COINTERN PLC
0.26USD 98 523.3120/06/2024698 457.00 Buy/Achat (1%)/Quarterly
CDX EM S31 V1 MKT MORGANSTANLEY AND COINTERN PLC
0.19USD 71 557.6920/06/20241 945 000.00 Buy/Achat (1%)/Quarterly
REP TURKEY USD SN CR M MORGANSTANLEY AND COINTERN PLC
0.14USD 54 058.0720/12/2023425 000.00 Buy/Achat (1%)/Quarterly
UTD MEXICAN STS USD SN CR M MORGANSTANLEY AND COINTERN PLC
0.06USD 24 945.7520/06/20242 540 000.00 Buy/Achat (1%)/Quarterly
FEDERATIVE REP B USD SN CR M MORGANSTANLEY AND COINTERN PLC
0.02USD 7 356.3620/06/2024206 844.00 Buy/Achat (1%)/Quarterly
REP COLOMBIA USD SN CR M MORGANSTANLEY AND COINTERN PLC
0.02USD 7 058.7520/06/20241 798 000.00 Buy/Achat (1%)/Quarterly
ITRAXX XOVER S30 V2 MKT MORGANSTANLEY AND COINTERN PLC
(0.18)EUR (69 573.47)20/12/2023634 684.83 Buy/Achat (5%)/Quarterly
ITRAXX XOVER S30 V2 MKT MORGANSTANLEY AND COINTERN PLC
(0.28)EUR (108 156.61)20/12/2023986 660.00 Buy/Achat (5%)/Quarterly
Schedule of investments as at 31/03/2019 / Inventaire du portefeuille au 31/03/2019
USD
Unrealised appreciation/(depreciation)
Description Counterparty % of NetAssets
Notional Maturity Currency Buy / SellProtection
Sub-FundReceives/(Pays)
Fixed RatePlus/(Moins) value non-
réaliséeDescription Contrepartie % de l'actif
netNominal Maturité Devise Achat /
VenteProtection
CompartimentReçoit/(Paie)
Taux Fixe

The accompanying notes form an integral part of these financial statements.Les notes annexées font partie intégrante de ces états financiers.
196 PrivilEdge - BlackRock Emerging Market Dynamic Bond · 31/03/2019
Schedule of investments as at 31/03/2019 / Inventaire du portefeuille au 31/03/2019
1 010 000.00 USD LIBOR 3 MONTHS 2 003.9426/03/2029 2.44%USD 0.01GOLDMAN SACHSINTERN.
1 100 000.00 USD LIBOR 3 MONTHS 10 568.4326/03/2029 2.52%USD 0.03MORGAN STANLEYAND CO INTERNPLC
2 400 000.00 ZAR JIBAR 3 MONTHS 2 628.9202/01/2029 8.20%ZAR 0.01MORGAN STANLEYAND CO INTERNPLC
2 920 000.00 ZAR JIBAR 3 MONTHS 3 501.3821/12/2028 8.22%ZAR 0.01HSBC BANKLONDRES
1 979 017.00 BRL MONEY MARKET CDI (2 215.27)02/01/2023 8.45%BRL (0.01)MORGAN STANLEYAND CO INTERNPLC
9 400 000.00 MXN TIIE 28D 30 905.4111/12/2028 8.96%MXN 0.08GOLDMAN SACHSINTERN.
2 096 829.26 BRL MONEY MARKET CDI 7 403.5802/01/2023 8.96%BRL 0.02MORGAN STANLEYAND CO INTERNPLC
1 899 890.38 BRL MONEY MARKET CDI 9 384.6802/01/2023 9.12%BRL 0.02MORGAN STANLEYAND CO INTERNPLC
12 652 840.00 MXN TIIE 28D 50 773.2603/11/2028 9.17%MXN 0.13MORGAN STANLEYAND CO INTERNPLC
Interest rate swap (IRS)/Interest rate swap (IRS) 114 954.33 0.30
Sub-Fund receivesNominal Unrealisedappreciation/
(depreciation)
Currency Maturity Sub-Fund pays % of netassets
Counterparty
Compartiment reçoitNominal Plus-value/(moins-
value) nonréalisée
Devise Maturité Compartiment paie % de l'actifnet
Contrepartie
USD
Futures Contracts/Contrats futures 0.013 969.56EURO BTP FUTURE -EUX Citibank (2 471 381.62) (0.04)EUR (16 416.07)30/06/2019(17)EURO BUND FUTURE Citibank (186 774.87) (0.01)EUR (3 806.46)30/06/2019(1)US ULTRA BD CBT 30YR Citibank 2 688 000.00 0.09USD 34 285.8430/06/201916US 10 YEARS NOTE Citibank 6 210 937.50 (0.03)USD (10 093.75)30/06/201950
USD USD
Unrealised appreciation/(depreciation)
Underlying Intermediary % of NetAssets
Maturity Currency CommitmentNumber ofcontracts
Plus/(Moins) value non-réalisée
Sous-jacent Intermédiaire % de l'actifnet
Maturité Devise EngagementNombre decontrats
Forward Foreign Currency Exchange Contracts/Contrats de change à terme (0.28)(110 016.45)EUR 1 009 275.66 0.00USD (168.57)898 625.00 03/04/2019Goldman SachsCOP 481 391.09 (0.03)USD (9 780.55)1 503 023 320.00 10/04/2019Hsbc BankEUR 3 091 174.52 (0.07)USD (26 500.66)2 727 514.00 10/04/2019Goldman SachsUSD 8 093 554.00 0.02ARS 7 727.75192 017.89 10/04/2019Hsbc BankUSD 467 614.00 0.01GBP 3 285.21612 869.73 10/04/2019Morgan StanleyUSD 7 441 220 493.00 0.00IDR (462.23)520 401.93 10/04/2019Hsbc BankUSD 36 166 480.00 0.02MXN 8 986.491 871 124.40 10/04/2019Morgan Stanley
USD
Unrealised appreciation/(depreciation)
Currency % of NetAssets
Amount bought Maturity Currency Amount soldCounterparty
Plus/(Moins) value non-réalisée
Devise % de l'actifnet
Montant acheté Maturité Devise Montant venduContrepartie

The accompanying notes form an integral part of these financial statements.Les notes annexées font partie intégrante de ces états financiers.
197PrivilEdge - BlackRock Emerging Market Dynamic Bond · 31/03/2019
Schedule of investments as at 31/03/2019 / Inventaire du portefeuille au 31/03/2019
USD 68 950 323.00 (0.02)PHP (7 933.31)1 301 967.84 10/04/2019Goldman SachsUSD 5 904 934.00 0.00THB (126.05)185 982.17 10/04/2019Morgan StanleyZAR 1 659 385.57 (0.02)USD (8 043.63)23 837 806.00 10/04/2019Hsbc BankINR 2 670 892.41 0.06USD 22 260.75186 933 027.00 10/04/2019Hsbc BankJPY 1 485 619.60 (0.02)USD (8 420.47)163 399 055.00 10/04/2019Morgan StanleyKRW 387 395.49 0.00USD (1 842.65)438 357 364.00 10/04/2019Hsbc BankMXN 2 531 164.53 (0.01)USD (4 446.51)49 073 643.00 10/04/2019Hsbc BankUSD 17 789 230.00 0.06BRL 21 974.874 590 559.20 10/04/2019Goldman SachsUSD 2 569 070.00 (0.01)CAD (5 186.58)1 918 281.43 10/04/2019Goldman SachsUSD 1 216 840 225.00 0.00COP 515.15382 328.34 10/04/2019Morgan StanleyUSD 597 436 926.00 0.01COP 2 973.65190 432.71 10/04/2019Hsbc BankUSD 1 204 301.00 0.03EUR 9 766.071 362 942.40 10/04/2019Morgan StanleyUSD 1 174 876 125.00 0.19HUF 74 041.054 178 206.59 10/04/2019Goldman SachsUSD 836 988 878.00 0.16HUF 61 944.222 985 782.19 10/04/2019Hsbc BankUSD 26 663 952.00 0.00INR 1 802.34385 947.46 10/04/2019Goldman SachsZAR 1 884 477.90 0.01USD 2 576.4027 240 411.51 10/04/2019Goldman SachsPLN 969 548.66 (0.02)USD (8 353.06)3 684 080.00 10/04/2019Hsbc BankUSD 2 612 011.00 (0.02)CAD (9 379.92)1 946 237.22 10/04/2019Hsbc BankUSD 261 974 380.00 0.00CLP 499.81385 494.54 10/04/2019Goldman SachsUSD 7 387 218.00 0.11EUR 40 741.158 341 151.72 10/04/2019Goldman SachsUSD 10 909 902 105.00 0.00IDR 1 038.50764 694.90 10/04/2019Goldman SachsUSD 53 630 976.00 0.01INR 4 440.51777 095.49 10/04/2019Hsbc BankUSD 1 956 148 707.00 0.02KRW 8 336.611 728 834.06 10/04/2019Morgan StanleyUSD 37 493 817.00 0.02RUB 6 244.12576 261.71 10/04/2019Morgan StanleyUSD 45 248 559.77 (0.05)ZAR (17 614.09)3 116 954.25 10/04/2019Goldman SachsUSD 9 551 672.23 0.01ZAR 2 830.41664 510.68 10/04/2019Morgan StanleyAUD 1 166 600.82 (0.01)USD (4 019.89)1 636 359.00 10/04/2019Morgan StanleyBRL 759 661.40 (0.02)USD (8 312.27)2 925 608.00 10/04/2019Hsbc BankCLP 193 296.05 (0.01)USD (3 889.50)128 884 010.00 10/04/2019Morgan StanleyCOP 1 160 427.02 (0.05)USD (18 501.62)3 639 317 512.00 10/04/2019Goldman SachsHUF 1 452 538.10 (0.08)USD (28 985.30)407 516 762.00 10/04/2019Goldman SachsNZD 2 333 168.23 (0.03)USD (11 239.02)3 404 029.30 10/04/2019Goldman SachsRON 10 439.90 0.00USD (79.64)44 111.00 10/04/2019Goldman SachsRUB 775 441.91 (0.04)USD (16 711.87)49 905 997.00 10/04/2019Goldman SachsUSD 381 833 573.00 0.08HUF 30 543.391 364 397.04 10/04/2019Morgan StanleyUSD 440 869 401.00 (0.03)JPY (12 394.04)3 973 249.99 10/04/2019Goldman SachsUSD 42 424 792.00 0.00JPY (282.43)383 256.05 10/04/2019Hsbc BankUSD 283 454.00 (0.01)NZD (1 970.54)191 376.52 10/04/2019Morgan StanleyAUD 478 480.53 0.01USD 3 725.56678 716.00 10/04/2019Goldman SachsGBP 1 060 907.24 (0.02)USD (9 154.81)806 804.00 10/04/2019Hsbc BankHUF 95 626.58 0.00USD 38.6227 385 828.00 10/04/2019Morgan StanleyJPY 3 009 742.32 0.00USD 1 423.27333 077 378.00 10/04/2019Goldman SachsMXN 906 463.75 (0.02)USD (5 909.54)17 490 466.00 10/04/2019Morgan StanleyNZD 940 295.93 0.00USD (1 090.00)1 376 908.70 10/04/2019Hsbc BankPLN 2 073 951.72 (0.04)USD (17 272.08)7 882 862.00 10/04/2019Goldman SachsRUB 516 448.27 (0.01)USD (3 592.52)33 733 443.63 10/04/2019Morgan StanleyUSD 1 567 537 598.00 0.02COP 9 001.71500 850.74 10/04/2019Goldman SachsUSD 70 000.00 0.00GBP 528.9291 781.39 10/04/2019Hsbc BankUSD 14 816 151.00 0.01MXN 2 189.59765 044.71 10/04/2019Goldman SachsUSD 2 390 989.13 0.02NZD 6 777.201 637 700.62 10/04/2019Goldman SachsUSD 36 671 694.00 (0.01)PHP (4 107.35)692 572.12 10/04/2019Hsbc BankUSD 4 386 926.00 0.02PLN 6 513.051 151 086.51 10/04/2019Goldman SachsUSD 730 030.00 0.00PLN 1 089.75191 558.65 10/04/2019Morgan StanleyUSD 5 021 160.00 0.06TRY 22 769.81899 734.55 10/04/2019Hsbc BankCAD 191 837.49 0.00USD 886.02257 410.00 10/04/2019Hsbc BankEUR 22 752.12 0.00USD (279.83)20 000.00 10/04/2019Hsbc BankHUF 1 839 659.13 (0.15)USD (59 169.10)509 696 259.00 10/04/2019Hsbc BankIDR 193 211.13 0.00USD (558.90)2 752 292 617.00 10/04/2019Goldman Sachs
USD
Unrealised appreciation/(depreciation)
Currency % of NetAssets
Amount bought Maturity Currency Amount soldCounterparty
Plus/(Moins) value non-réalisée
Devise % de l'actifnet
Montant acheté Maturité Devise Montant venduContrepartie

The accompanying notes form an integral part of these financial statements.Les notes annexées font partie intégrante de ces états financiers.
198 PrivilEdge - BlackRock Emerging Market Dynamic Bond · 31/03/2019
Schedule of investments as at 31/03/2019 / Inventaire du portefeuille au 31/03/2019
PEN 479 521.04 0.00USD (1 631.65)1 587 464.00 10/04/2019Goldman SachsPHP 192 335.84 0.00USD 1 576.4610 207 263.00 10/04/2019Hsbc BankTHB 189 752.51 0.00USD 687.816 042 384.00 10/04/2019Hsbc BankTRY 1 848 832.84 (0.17)USD (67 441.75)10 195 920.00 10/04/2019Hsbc BankUSD 3 424 654.00 (0.04)AUD (16 419.45)2 416 685.35 10/04/2019Hsbc BankUSD 394 158 494.00 0.00CLP 574.40579 825.47 10/04/2019Hsbc BankUSD 438 403 013.00 0.00KRW 364.21385 956.61 10/04/2019Hsbc BankZAR 1 182 846.20 0.00USD (1 718.69)17 050 065.49 10/04/2019Morgan StanleyAUD 1 240 859.33 0.01USD 5 440.331 754 195.00 10/04/2019Hsbc BankBRL 1 338 732.15 (0.09)USD (34 560.97)5 078 190.00 10/04/2019Goldman SachsBRL 1 027 094.01 (0.01)USD (3 234.40)3 986 711.00 10/04/2019Morgan StanleyCAD 2 225 060.29 (0.02)USD (7 369.78)2 962 045.00 10/04/2019Goldman SachsIDR 2 144 255.95 (0.03)USD (12 506.60)30 454 867 318.00 10/04/2019Hsbc BankMXN 1 986 391.05 (0.04)USD (15 408.30)38 280 213.00 10/04/2019Goldman SachsPHP 1 626 395.80 (0.02)USD (6 752.75)85 255 668.00 10/04/2019Goldman SachsUSD 2 921 774.00 0.00BRL (384.15)749 980.49 10/04/2019Morgan StanleyUSD 1 239 034.00 (0.03)CHF (10 487.83)1 234 583.86 10/04/2019Goldman SachsUSD 619 309.00 0.01EUR 2 752.68698 618.94 10/04/2019Hsbc BankUSD 25 926 439.00 0.04MXN 16 465.091 351 351.70 10/04/2019Hsbc BankUSD 20 735 766.00 0.00TWD (972.57)671 016.96 10/04/2019Goldman SachsUSD 21 375 284.00 (0.03)ZAR (11 913.64)1 468 850.56 10/04/2019Hsbc BankCZK 8 888.74 0.00USD (72.35)202 772.00 10/04/2019Hsbc BankEUR 3 185 591.86 (0.05)USD (17 815.14)2 819 274.00 10/04/2019Morgan StanleyINR 482 662.62 (0.01)USD (2 042.78)33 360 049.00 10/04/2019Goldman SachsRUB 1 685 963.81 0.02USD 6 727.25111 337 933.37 10/04/2019Hsbc BankTRY 384 468.16 (0.03)USD (13 192.32)2 125 024.00 10/04/2019Goldman SachsUSD 2 527 555.00 (0.01)AUD (4 199.67)1 791 546.91 10/04/2019Goldman SachsUSD 2 390 995.87 0.01NZD 4 136.341 635 063.96 10/04/2019Hsbc BankUSD 12 858 956.00 0.04PLN 16 137.253 371 109.83 10/04/2019Hsbc BankUSD 24 860 975.00 0.01RUB 5 109.77383 069.41 10/04/2019Goldman SachsUSD 11 198 150.00 0.11TRY 42 297.581 998 206.99 10/04/2019Goldman SachsUSD 15 576 046.00 0.00KZT 128.7340 882.01 12/04/2019Hsbc BankKZT 286 273.24 (0.01)USD (2 467.55)108 468 929.00 12/04/2019Hsbc BankKZT 99 758.04 0.00USD (1 486.30)37 558 903.00 12/04/2019Goldman SachsCHF 6 667 289.22 0.12USD 46 672.446 678 204.57 15/04/2019Caceis BankUSD 13 577.70 0.00CHF (42.42)13 607.91 15/04/2019Caceis BankUSD 29 853.85 0.00GBP 782.8339 710.58 15/04/2019Caceis BankUSD 44 930.00 0.00EUR 438.1650 943.79 15/04/2019Caceis BankGBP 1 146 819.96 (0.05)USD (18 085.25)865 642.64 15/04/2019Caceis BankEUR 7 319 317.96 (0.17)USD (63 911.84)6 454 493.31 15/04/2019Caceis BankKZT 189 124.44 0.00USD (445.65)72 487 129.00 14/05/2019Hsbc BankKZT 194 897.37 0.00USD (1 868.25)74 158 450.00 14/05/2019Morgan StanleyUSD 829 896.00 0.03EUR 12 138.68948 986.50 04/06/2019Morgan StanleyEUR 332 904.27 (0.01)USD (3 074.91)292 195.58 04/06/2019Goldman SachsUSD 510 000.00 0.03CHF 9 784.68524 980.31 04/06/2019Morgan StanleyUSD 49 438.00 0.00CHF 932.3150 873.86 04/06/2019Goldman SachsEUR 2 570 162.83 (0.17)USD (67 540.73)2 217 071.00 04/06/2019Morgan StanleyUSD 2 218 693.00 0.12EUR 47 156.622 551 858.86 04/06/2019Goldman SachsEUR 2 441 178.97 (0.16)USD (60 323.07)2 109 198.42 04/06/2019Hsbc BankUSD 2 574 483.00 0.19EUR 75 111.462 981 576.16 04/06/2019Hsbc BankCHF 575 897.14 (0.03)USD (10 823.42)559 438.00 04/06/2019Hsbc BankUAH 52 226.69 0.00USD 1 069.231 563 667.00 17/09/2019Morgan Stanley
USD
Unrealised appreciation/(depreciation)
Currency % of NetAssets
Amount bought Maturity Currency Amount soldCounterparty
Plus/(Moins) value non-réalisée
Devise % de l'actifnet
Montant acheté Maturité Devise Montant venduContrepartie

PrivilEdgeis an investment company
with variable capital ("SICAV")incorporated in Luxembourg
PrivilEdgeest une société d’investissement
à capital variable ("SICAV")enregistrée au Luxembourg RCS Luxembourg B0181207
PrivilEdge –JP Morgan Pan European Flexible Equity
Unaudited semi-annual report · Rapport semestriel non révisé
31.03.2019

The accompanying notes form an integral part of these financial statements.Les notes annexées font partie intégrante de ces états financiers.
200 PrivilEdge - JP Morgan Pan European Flexible Equity · 31/03/2019
ASSETS/ACTIF
207 091 781.41Investments in securities at market value/Portefeuille-titres à la valeur de marché (2):( EUR )197 699 413.55Acquisition cost/Coût d'acquisition
8 108 454.93Cash and term deposits/Liquidité et dépôts à terme253 064.77Receivable on investments sold/À recevoir sur vente de titres147 565.85Amounts receivable on subscriptions/Montants à recevoir sur souscriptions d'actions
1 148 093.15Interest and dividends receivable, net/Intérêt et dividendes nets à recevoir8 617.21Formation/reorganisation expenses/Frais de constitution/réorganisation (2)
81 030.00Unrealised appreciation on futures contracts/Plus-value non réalisée sur contrats futures (2)224.84Receivable on foreign exchange transactions, net/A recevoir sur opérations de change, net
55 114.73Unrealised appreciation on forward foreign currency exchange contracts/Plus-value non réalisée sur contrats de change àterme
(2)
21 125.50Other assets/Autres actifs216 915 072.39
LIABILITIES/PASSIF
131 634.85Payable on investments purchased/À payer sur achat de titres182 545.68Amounts payable on redemptions/Montants à payer sur rachats d'actions145 016.74Management and distribution fees payable/Commission de gestion et de distribution à payer (3)
44 126.06Taxes and expenses payable/Impôts et autres frais à payer503 323.33
216 411 749.06NET ASSET VALUE/VALEUR NETTE D'INVENTAIRE
Statement of net assets as at 31/03/2019 / État de l'actif net au 31/03/2019
NotesNotes EUR

The accompanying notes form an integral part of these financial statements.Les notes annexées font partie intégrante de ces états financiers.
201PrivilEdge - JP Morgan Pan European Flexible Equity · 31/03/2019
Statement of operations and changes in net assets for the period from 01/10/2018 to 31/03/2019 / État desopérations et des variations de l'actif net pour la période du 01/10/2018 au 31/03/2019
NotesNotes EUR
245 243 784.34NET ASSET VALUE AT THE BEGINNING OF THE PERIOD/VALEUR NETTE D'INVENTAIRE AU DÉBUT DE LAPÉRIODE
INCOME/REVENUS
2 910 254.25Dividends, net/Dividendes, nets (2)1 338.93Bank interest/Intérêts bancaires
25 422.78Securities Lending Income/Revenus sur prêt de titres (9)7 123.15Other income/Autres revenus
2 944 139.11EXPENSES/DÉPENSES
877 102.72Management fees/Commission de gestion (3)14 678.48Distribution fees/Frais de distribution (3)
5 140.70Bank interest and other expenses/Intérêts bancaires débiteurs et autres frais298 706.53Fixed Rate of Operational Costs/Taux Fixe de Coûts Opérationnels (4)
2 482.19Formation/Reorganisation expenses/Frais de constitution/réorganisation (2)1 198 110.621 746 028.49NET INVESTMENT INCOME/REVENU NET SUR INVESTISSEMENTS
(12 030 608.21)Net realised loss on sale of investments/Perte nette réalisée sur ventes d'investissements (2)(6 214.80)Net realised loss on futures contracts/Perte nette réalisée sur contrats futures
495 146.12Net realised gain on foreign exchange/Gain net réalisé sur opérations de change136 932.90Net realised gain on forward foreign currency exchange contracts/Gain net réalisé sur contrats de change à terme
(9 658 715.50)NET REALISED LOSS/PERTE NETTE RÉALISÉE
5 161 076.76Change in net unrealised appreciation or depreciation on investments/Variation de la plus ou moins-value nette non réaliséesur investissements
(2)
81 030.00Change in net unrealised appreciation or depreciation on futures contracts/Variation de la plus ou moins-value nette nonréalisée sur contrats futures
31 343.82Change in net unrealised appreciation or depreciation on forward foreign currency exchange contracts/Variation de la plus oumoins-value nette non réalisée sur contrats de change à terme
(4 385 264.92)NET DECREASE IN NET ASSETS AS A RESULT OF OPERATIONS/DIMINUTION NETTE DE L'ACTIF NET RÉSULTANTDES OPÉRATIONS
(814 648.28)Dividend paid/Dividende payé(23 632 122.08)Net subscriptions/(redemptions) including equalisation/Souscriptions/(rachats) nets incluant la régularisation216 411 749.06NET ASSET VALUE AT THE END OF THE PERIOD/VALEUR NETTE D'INVENTAIRE À LA FIN DE LA PÉRIODE

The accompanying notes form an integral part of these financial statements.Les notes annexées font partie intégrante de ces états financiers.
202 PrivilEdge - JP Morgan Pan European Flexible Equity · 31/03/2019
42 612.8780 24 543.4270 0.0000 67 156.3050P - USD - Hedged - Capitalisation425 662.4620 197 027.3220 (192 927.5530) 429 762.2310P - EUR - Capitalisation
0.0000 7 100.0000 0.0000 7 100.0000P - GBP - Hedged - Capitalisation722 809.5640 336 020.8170 (49 483.0000) 1 009 347.3810I - EUR - Capitalisation
1 050 000.0000 0.0000 (150 000.0000) 900 000.0000I - EUR - Distribution671 928.8190 75 286.2140 (278 668.2620) 468 546.7710M - USD - Hedged - Capitalisation
0.0000 3 972.3670 (3 972.3670) 0.0000M - USD - Hedged - Distribution200 276.5800 4 365.0970 (86 232.4140) 118 409.2630M - CHF - Hedged - Capitalisation
14 531 133.8900 1 791 597.1380 (2 737 533.2550) 13 585 197.7730M - EUR - Capitalisation2 960 348.1470 317 516.2760 (537 012.1410) 2 740 852.2820M - EUR - Distribution
37 000.0000 56 350.0000 (9 470.0000) 83 880.0000M - GBP - Hedged - Capitalisation3 419 476.2640 465 243.8000 (1 464 983.3440) 2 419 736.7200N - EUR - Capitalisation
508 820.6780 29 115.4160 (256 507.2010) 281 428.8930N - EUR - Distribution
Statement of changes in the number of shares outstanding for the period from 01/10/2018 to 31/03/2019 / Étatdes variations du nombre d'actions pour la période du 01/10/2018 au 31/03/2019
Number of Shares01/10/2018/
Nombre d'actions01/10/2018
Number of Sharesissued/
Nombre d'actionsémises
Number of Sharesredeemed/
Nombre d'actionsrachetées
Number of Shares31/03/2019/
Nombre d'actions31/03/2019
30/09/201831/03/2019For the period ended/Pour la période clôturée au
Statistics / Statistiques
P - USD - Hedged - Capitalisation
679 024.1810.1111
433 891.5510.1822
Net Asset Value/Valeur Nette d'InventaireNet Asset Value per share/Valeur Nette d'Inventaire par action
USD USD
P - EUR - Capitalisation
4 183 371.689.7342
4 236 003.979.9516
Net Asset Value/Valeur Nette d'InventaireNet Asset Value per share/Valeur Nette d'Inventaire par action
EUR EUR
P - GBP - Hedged - Capitalisation
70 893.939.9851
0.000.0000
Net Asset Value/Valeur Nette d'InventaireNet Asset Value per share/Valeur Nette d'Inventaire par action
GBP GBP
I - EUR - Capitalisation
9 972 425.329.8801
7 264 692.7410.0506
Net Asset Value/Valeur Nette d'InventaireNet Asset Value per share/Valeur Nette d'Inventaire par action
EUR EUR

The accompanying notes form an integral part of these financial statements.Les notes annexées font partie intégrante de ces états financiers.
203PrivilEdge - JP Morgan Pan European Flexible Equity · 31/03/2019
30/09/201831/03/2019For the period ended/Pour la période clôturée au
Statistics / Statistiques
I - EUR - Distribution
8 680 203.569.6447
0.22
10 553 036.5010.0505
0.00
Net Asset Value/Valeur Nette d'InventaireNet Asset Value per share/Valeur Nette d'Inventaire par actionDividend per share paid to shareholders/Dividende par action payé aux actionnaires
EUR EUR
M - USD - Hedged - Capitalisation
4 777 207.4810.1958
6 870 996.5610.2258
Net Asset Value/Valeur Nette d'InventaireNet Asset Value per share/Valeur Nette d'Inventaire par action
USD USD
M - USD - Hedged - Distribution
0.000.0000
0.00
0.000.0000
0.00
Net Asset Value/Valeur Nette d'InventaireNet Asset Value per share/Valeur Nette d'Inventaire par actionDividend per share paid to shareholders/Dividende par action payé aux actionnaires
USD USD
M - CHF - Hedged - Capitalisation
1 158 168.289.7811
1 999 075.869.9816
Net Asset Value/Valeur Nette d'InventaireNet Asset Value per share/Valeur Nette d'Inventaire par action
CHF CHF
M - EUR - Capitalisation
133 644 216.019.8375
145 619 172.5710.0212
Net Asset Value/Valeur Nette d'InventaireNet Asset Value per share/Valeur Nette d'Inventaire par action
EUR EUR
M - EUR - Distribution
26 406 025.379.6342
0.19
29 666 252.9510.0212
0.00
Net Asset Value/Valeur Nette d'InventaireNet Asset Value per share/Valeur Nette d'Inventaire par actionDividend per share paid to shareholders/Dividende par action payé aux actionnaires
EUR EUR
M - GBP - Hedged - Capitalisation
839 919.7010.0133
375 956.7910.1610
Net Asset Value/Valeur Nette d'InventaireNet Asset Value per share/Valeur Nette d'Inventaire par action
GBP GBP
N - EUR - Capitalisation
23 858 913.579.8601
34 324 111.2210.0378
Net Asset Value/Valeur Nette d'InventaireNet Asset Value per share/Valeur Nette d'Inventaire par action
EUR EUR
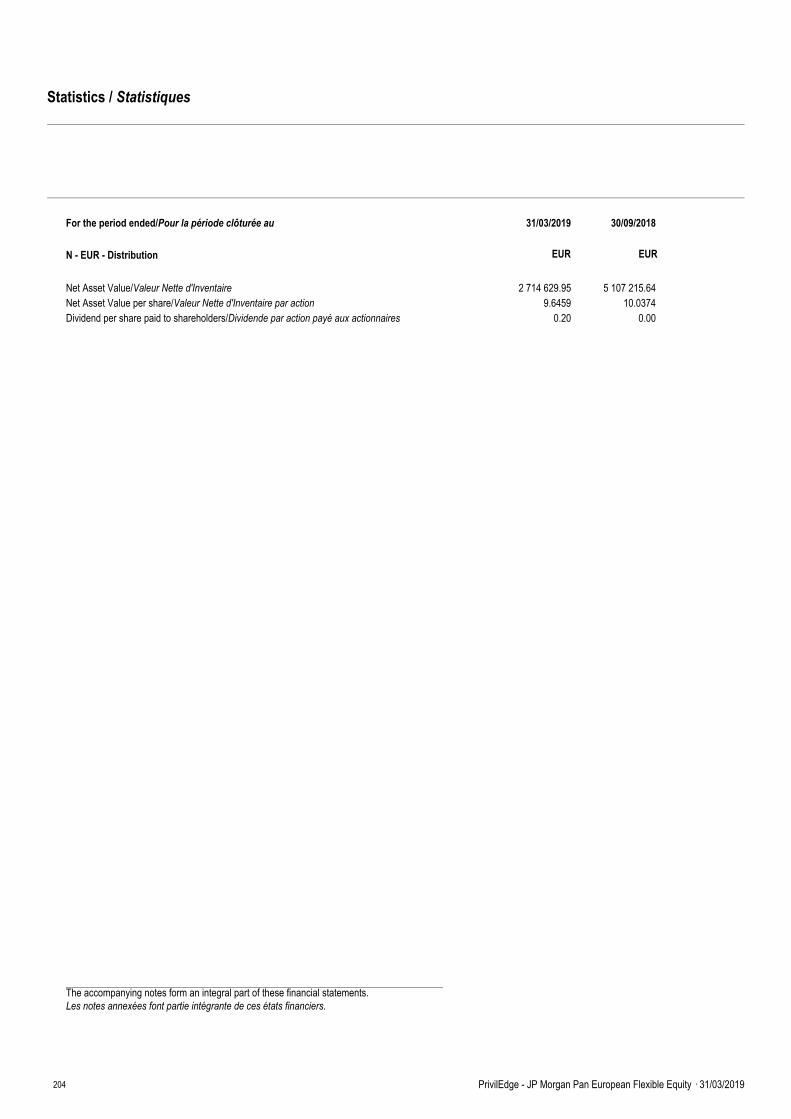
The accompanying notes form an integral part of these financial statements.Les notes annexées font partie intégrante de ces états financiers.
204 PrivilEdge - JP Morgan Pan European Flexible Equity · 31/03/2019
30/09/201831/03/2019For the period ended/Pour la période clôturée au
Statistics / Statistiques
N - EUR - Distribution
2 714 629.959.6459
0.20
5 107 215.6410.0374
0.00
Net Asset Value/Valeur Nette d'InventaireNet Asset Value per share/Valeur Nette d'Inventaire par actionDividend per share paid to shareholders/Dividende par action payé aux actionnaires
EUR EUR

The accompanying notes form an integral part of these financial statements.Les notes annexées font partie intégrante de ces états financiers.
205PrivilEdge - JP Morgan Pan European Flexible Equity · 31/03/2019
Investments in securities at market value/Portefeuille-titres à la valeur de marché 207 091 781.41 95.69
AT & S AUSTRIA TECH10 716 163 954.80 0.08EUR
Transferable securities admitted to an official stock exchange listing and/or dealt in on anotherregulated market/Valeurs mobilières admises à la cote officielle d'une bourse de valeurs et/ounégociées sur un autre marché réglementé
206 811 799.33 95.56
EQUITIES/ACTIONS 206 811 799.33 95.56
AUSTRIA/AUTRICHE 2 243 465.25 1.04
BAWAG GROUP6 703 263 696.02 0.12EURDO CO RESTAURANTS910 66 703.00 0.03EURERSTE GROUP BANK AG10 741 351 875.16 0.16EURIMMOFINANZ --- BEARER SHS6 751 149 467.14 0.07EUROMV AG11 086 536 229.82 0.25EURSPARKASSEN IMMOBILIEN3 291 59 962.02 0.03EURUNIQA VERSICHERUNG AG20 843 185 085.84 0.09EURVERBUND AG6 610 282 775.80 0.13EURWIENERBERGER AG9 705 183 715.65 0.08EUR
AGEAS NOM10 947 470 721.00 0.22EUR
BELGIUM/BELGIQUE 2 648 488.84 1.22
BARCO NV1 378 188 234.80 0.09EURCOLRUYT4 752 313 156.80 0.14EURD'IETEREN7 880 278 164.00 0.13EURFAGRON5 638 90 264.38 0.04EURKBC GROUPE SA11 607 722 883.96 0.32EURSOLVAY1 721 165 869.98 0.08EURTELENET GROUP HOLDING NV2 927 125 509.76 0.06EURUCB3 836 293 684.16 0.14EUR
GULF KEYSTONE44 876 132 279.26 0.06GBP
BERMUDA/BERMUDES 132 279.26 0.06
CARLSBERG AS -B-3 235 360 183.51 0.17DKK
DENMARK/DANEMARK 5 169 104.78 2.39
COLOPLAST -B-3 609 352 998.39 0.16DKKDFDS A/S4 433 163 533.10 0.08DKKDSV5 219 384 777.56 0.18DKKGN GREAT NORDIC5 409 223 882.15 0.10DKKMATA A/S23 528 207 374.29 0.10DKKNETCOMPANY GROUP A/S3 013 96 176.10 0.04DKKNOVO NORDISK41 052 1 915 827.82 0.88DKKPANDORA3 693 154 141.92 0.07DKKROYAL UNIBREW A/S2 914 191 652.75 0.09DKKSCANDI TOB GROUP AS20 715 230 306.95 0.11DKKSIMCORP A/S2 326 200 182.84 0.09DKKTOPDANMARK AS4 272 190 211.28 0.09DKKVESTAS WIND SYSTEMS AS6 637 497 856.12 0.23DKK
CRAMO - SHS13 471 236 146.63 0.11EUR
FINLAND/FINLANDE 3 571 768.19 1.65
METSA BOARD CORPORATION -B-28 341 154 883.57 0.07EURNESTE5 223 496 185.00 0.23EURNOKIAN TYRES PLC10 388 309 977.92 0.14EURORION CORPORATION (NEW) -B-6 611 220 939.62 0.10EURRAMIRENT OYJ29 683 162 811.26 0.08EURSAMPO OYJ -A-20 353 822 464.73 0.38EURSANOMA CORP24 891 217 422.89 0.10EUR
Schedule of investments as at 31/03/2019 / Inventaire du portefeuille au 31/03/2019
EUR
Market ValueNumber of Shares orNominal Value
Investment % of Net AssetsQuotationCurrency
Valeur de marchéNombre d'actions ouvaleur nominale
Investissement % de l'actif netDevise decotation

The accompanying notes form an integral part of these financial statements.Les notes annexées font partie intégrante de ces états financiers.
206 PrivilEdge - JP Morgan Pan European Flexible Equity · 31/03/2019
STORA ENSO -R-36 156 393 919.62 0.18EURTOKMANNI GROUP CORP13 945 115 882.95 0.05EURUPM KYMMENE CORP8 203 213 278.00 0.10EURVALMET CORPORATION10 100 227 856.00 0.11EUR
AIR FRANCE - KLM SA38 753 388 498.83 0.18EUR
FRANCE/FRANCE 32 841 464.36 15.18
AIR LIQUIDE SA9 799 1 110 716.65 0.51EURALD SA15 915 198 141.75 0.09EURALSTOM SA9 067 350 167.54 0.16EURALTEN SA1 056 100 742.40 0.05EURARKEMA SA3 241 275 031.26 0.13EURATOS2 648 227 728.00 0.11EURAXA SA87 275 1 957 578.25 0.90EURCAPGEMINI SE4 448 480 828.80 0.22EURCASINO GUICHARD PERRACHON SA12 664 489 463.60 0.23EURCNP ASSURANCES20 388 400 012.56 0.18EURCOFACE SA10 602 83 543.76 0.04EURCREDIT AGRICOLE SA61 366 660 911.82 0.31EURDANONE14 073 966 674.37 0.45EURDASSAULT SYSTEMES SA4 886 648 616.50 0.30EURDERICHEBOURG59 708 216 262.38 0.10EURDEVOTEAM1 765 174 558.50 0.08EUREDENRED SA9 131 370 444.67 0.17EUREIFFAGE3 245 277 966.70 0.13EURERAMET SA3 571 176 978.76 0.08EUREUROPCAR MOBILITY GROUP SA29 048 210 017.04 0.10EUREUTELSAT COMMUNICATIONS SA34 880 543 953.60 0.25EURFAURECIA8 300 311 084.00 0.14EURGAZTRANSPORT ET TECHNIGAZ SA4 084 331 212.40 0.15EURGECINA SA REG SHS3 186 419 914.80 0.19EURGROUPE FNAC4 192 278 977.60 0.13EURHERMES INTERNATIONAL SA1 052 618 786.40 0.29EURINTER PARFUMS4 012 194 381.40 0.09EURIPSEN1 534 187 454.80 0.09EURIPSOS SA4 875 108 810.00 0.05EURJC DECAUX SA4 296 116 507.52 0.05EURKAUFMAN ET BROAD8 963 326 432.46 0.15EURKERING2 355 1 203 876.00 0.56EURL'OREAL SA6 833 1 638 553.40 0.76EURLVMH6 872 2 253 328.80 1.03EURMANITOU BF SA2 892 72 010.80 0.03EURMICHELIN SA REG SHS8 574 903 699.60 0.42EURM6 METROPOLE TELEVISION SA9 277 152 513.88 0.07EURNEOPOST12 273 261 905.82 0.12EURORANGE86 194 1 249 813.00 0.58EURPERNOD RICARD SA4 808 769 280.00 0.36EURPEUGEOT SA37 433 813 793.42 0.38EURPUBLICIS GROUPE5 732 273 588.36 0.13EURREXEL SA22 890 230 158.95 0.11EURROTHSCHILD9 079 257 389.65 0.12EURSAFRAN6 750 825 187.50 0.38EURSARTORIUS STEDIM BIOTECH2 377 268 363.30 0.12EURSODEXHO SA3 769 369 965.04 0.17EURSOPRA STERIA GROUP1 829 189 301.50 0.09EURSPIE SA4 846 76 372.96 0.04EURTELEPERFORMANCE SA1 771 283 714.20 0.13EURTOTAL SA96 479 4 777 640.08 2.20EUR
Schedule of investments as at 31/03/2019 / Inventaire du portefeuille au 31/03/2019
EUR
Market ValueNumber of Shares orNominal Value
Investment % of Net AssetsQuotationCurrency
Valeur de marchéNombre d'actions ouvaleur nominale
Investissement % de l'actif netDevise decotation

The accompanying notes form an integral part of these financial statements.Les notes annexées font partie intégrante de ces états financiers.
207PrivilEdge - JP Morgan Pan European Flexible Equity · 31/03/2019
UBISOFT ENTERTAINMENT1 778 141 102.08 0.07EURVINCI SA21 764 1 887 374.08 0.87EURVIVENDI SA28 654 740 132.82 0.34EUR
AAREAL BANK AG6 095 167 490.60 0.08EUR
GERMANY/ALLEMAGNE 22 239 478.46 10.28
ADIDAS NAMEN AKT5 297 1 147 330.20 0.53EURADLER REAL ESTATE AG12 463 163 763.82 0.08EURALLIANZ SE REG SHS18 569 3 681 861.32 1.70EURAMADEUS FIRE AG1 516 155 844.80 0.07EURBECHTLE956 78 917.80 0.04EURBET-AT-HOME.COM AG2 100 121 800.00 0.06EURCARL ZEISS MEDITEC AG2 348 174 808.60 0.08EURCECONOMY AG35 098 166 364.52 0.08EURCOMPUGROUP HOLDING AKT4 718 247 695.00 0.11EURCOVESTRO AG6 150 301 473.00 0.14EURCTS EVENTIM AG & CO KGAA4 647 196 289.28 0.09EURDEUTSCHE BOERSE AG REG SHS5 639 644 537.70 0.30EURDEUTSCHE EUROSHOP AG REG SHS7 295 197 110.90 0.09EURDEUTSCHE LUFTHANSA AG REG SHS17 238 337 261.47 0.16EURDEUTSCHE TELEKOM AG REG SHS151 211 2 237 166.75 1.03EURDEUTSCHE WOHNEN AG9 626 416 131.98 0.19EURDUERR AG2 532 88 518.72 0.04EURDWS GROUP GMBH-BEARER SHS5 644 174 964.00 0.08EURECKERT & ZIEGLER STRAHLEN UND MEDIZINTEC1 649 126 643.20 0.06EURE.ON AG REG SHS82 708 819 801.70 0.38EUREVONIK INDUSTRIES AG13 467 326 978.76 0.15EUREVOTEC SE7 993 189 354.17 0.09EURFIELMANN AG3 160 194 340.00 0.09EURFREENET AG REG SHS8 417 161 227.64 0.07EURHANNOVER RUECKVERSICHERUNG AG REG SHS5 282 676 096.00 0.31EURHBV REAL ESTATE BK21 797 238 023.24 0.11EURHEIDELBERGCEMENT AG6 698 429 743.68 0.20EURHHLA NAMEN AKT4 558 92 892.04 0.04EURHOCHTIEF AG2 658 342 882.00 0.16EURJOST WERKE AG5 485 167 841.00 0.08EURKNORR-BREMSE - BEARER SHS998 88 352.94 0.04EURLEG IMMOBILIEN - NAMEN AKT829 90 734.05 0.04EURMERCK KGAA4 663 473 993.95 0.22EURMETRO WHOLESALE AND FOOD SPECIALIST AG36 167 534 909.93 0.25EURMTU AERO ENGINES HOLDING AG2 323 468 781.40 0.22EURMUENCHENER RUECKVERSICHERUNGS AG REG SHS6 403 1 351 033.00 0.62EURNEMETSCHEK756 114 912.00 0.05EURPATRIZIA IMMOBILIEN-NAMEN AKT-4 540 90 028.20 0.04EURPUMA AG361 186 637.00 0.09EURRWE AG30 279 723 668.10 0.33EURSARTORIUS VORZ.OHNE STIMMRECHT.1 449 221 552.10 0.10EURSIEMENS HEALTHINEERS5 765 214 169.75 0.10EURSILTRONIC AG2 422 190 466.08 0.09EURSOFTWARE5 153 155 362.95 0.07EURTAG IMMOBILIEN4 550 100 100.00 0.05EURTAKKT13 197 193 468.02 0.09EURTALANX AG NAM AKT6 093 209 355.48 0.10EURTLG IMMOB 144A/REGS7 404 198 723.36 0.09EURVARTA AG2 317 88 138.68 0.04EURVOLKSWAGEN VORZ.AKT10 571 1 483 322.72 0.69EURVONOVIA SE2 383 110 142.26 0.05EURWIRECARD AG2 342 261 601.40 0.12EUR
Schedule of investments as at 31/03/2019 / Inventaire du portefeuille au 31/03/2019
EUR
Market ValueNumber of Shares orNominal Value
Investment % of Net AssetsQuotationCurrency
Valeur de marchéNombre d'actions ouvaleur nominale
Investissement % de l'actif netDevise decotation

The accompanying notes form an integral part of these financial statements.Les notes annexées font partie intégrante de ces états financiers.
208 PrivilEdge - JP Morgan Pan European Flexible Equity · 31/03/2019
WUESTENROT-WUERTTEMBERGISCHE.NAMEN AKT13 135 224 871.20 0.10EUR
BURFORD CAPITAL LIMITED5 435 106 341.07 0.05GBP
GUERNSEY/ILE DE GUERNESEY 106 341.07 0.05
AIB GRP - REGISTERED54 114 216 564.23 0.10EUR
IRELAND/IRLANDE 573 806.56 0.27
GLANBIA PLC11 103 193 636.32 0.09EURSMURFIT KAPPA PLC6 545 163 606.01 0.08GBP
STRIX GRP-REGISTERED SHS31 622 57 981.62 0.03GBP
ISLE OF MAN/ILE DE MAN 57 981.62 0.03
ASSICURAZIONI GENERALI SPA53 585 884 152.50 0.41EUR
ITALY/ITALIE 9 412 110.11 4.35
ASTM11 815 286 513.75 0.13EURAZIMUT HOLDING SPA10 863 164 574.45 0.08EURA2A SPA109 460 178 036.69 0.08EURCAIRO COMMUNICATION-AZ.POST FRAZIONAMENT33 740 127 199.80 0.06EURCAMPARI33 855 296 231.25 0.14EURDOBANK S.P.A.4 030 48 158.50 0.02EURENAV SPA20 891 101 488.48 0.05EURENEL SPA365 620 2 085 496.48 0.95EURENI SPA116 243 1 831 292.22 0.85EURFALK RENEWABLES S.P.A37 535 121 425.73 0.06EURFAMAFACTORING41 442 224 822.85 0.10EURFIERA MILANO47 441 230 800.47 0.11EURFINECOBANK7 596 89 063.10 0.04EURINTERPUMP GROUP2 913 84 710.04 0.04EURIREN S.P.A.82 187 186 893.24 0.09EURMAIRE TECNIMONT68 292 231 919.63 0.11EURMEDIOBANCA SPA44 026 407 768.81 0.19EURMONCLER SPA9 515 341 778.80 0.16EURPOSTE ITALIANE SPA43 016 373 034.75 0.17EURRCS MEDIAGROUP42 000 53 508.00 0.02EURSIAS SPA11 714 180 864.16 0.08EURSNAM SPA47 393 217 012.55 0.10EURTECHNOGYM SPA (ITA)20 063 220 091.11 0.10EURTERNA SPA37 294 210 636.51 0.10EURUGF52 846 234 636.24 0.11EUR
GENEL ENERGY104 078 242 772.17 0.11GBP
JERSEY/JERSEY 2 716 139.05 1.26
GLENCORE PLC497 876 1 837 062.48 0.86GBPWPP 2012 PLC67 625 636 304.40 0.29GBP
ADO PROPERTIES1 856 94 006.40 0.04EUR
LUXEMBOURG/LUXEMBOURG 1 761 605.95 0.81
APERAM REG2 371 60 199.69 0.03EURARCELORMITTAL - REGISTERED34 604 624 879.03 0.28EURCORESTATE CAPITAL HOLDING S.A.5 020 176 955.00 0.08EURRTL GROUP6 265 305 105.50 0.14EURSOFTCAT PLC32 720 315 163.05 0.15GBPSOLUTIONS 30 --- SHS17 031 185 297.28 0.09EUR
KAMBI GROUP -B-3 096 47 206.59 0.02SEK
MALTA/MALTE 243 011.81 0.11
KINDRED GROUP SWEDISH DEP REC21 904 195 805.22 0.09SEK
Schedule of investments as at 31/03/2019 / Inventaire du portefeuille au 31/03/2019
EUR
Market ValueNumber of Shares orNominal Value
Investment % of Net AssetsQuotationCurrency
Valeur de marchéNombre d'actions ouvaleur nominale
Investissement % de l'actif netDevise decotation

The accompanying notes form an integral part of these financial statements.Les notes annexées font partie intégrante de ces états financiers.
209PrivilEdge - JP Morgan Pan European Flexible Equity · 31/03/2019
AUSTEVOLL SEAFOOD24 094 254 158.75 0.12NOK
NORWAY/NORVÈGE 4 420 826.24 2.04
DNB46 210 758 896.32 0.34NOKDNO INTERNATIONAL ASA -A-137 255 271 827.21 0.13NOKELKEM ASA59 347 187 563.40 0.09NOKEQUINOR53 937 1 053 415.63 0.48NOKEUROPRIS64 152 182 779.63 0.08NOKSALMAR4 381 187 482.06 0.09NOKSCHIBSTED -A-4 945 173 160.66 0.08NOKSPAREBANK 1 NORD NORGE PRIMARY CAP.CERT.9 824 64 717.80 0.03NOKSPAREBANK 1 SMN PRIMARY CAP.CERT.25 407 229 647.01 0.11NOKSPBK 1 SR-BANK21 555 221 579.92 0.10NOKSTOREBRAND28 079 194 966.03 0.09NOKTELENOR ASA31 052 554 597.49 0.26NOKTOMRA SYSTEMS ASA3 237 86 034.33 0.04NOK
ALTRI SGPS SA30 422 212 345.56 0.11EUR
PORTUGAL/PORTUGAL 643 356.17 0.30
NAVIGATOR COMP39 451 160 960.08 0.07EURREN37 051 94 183.64 0.04EURSONAE SGPS - REG SHS190 745 175 866.89 0.08EUR
ACCIONA SA1 954 194 032.20 0.09EUR
SPAIN/ESPAGNE 9 724 636.17 4.49
ACS21 087 825 766.92 0.38EURAENA1 973 316 666.50 0.15EURAMADEUS IT -A-8 942 638 458.80 0.30EURBANCO BILBAO VIZCAYA ARGENTARIA SA BBVA278 825 1 420 055.73 0.66EURCIE AUTOMOTIVE SA7 241 173 639.18 0.08EURDISTRIBUCION INTEGRAL HOLDINGS17 994 377 874.00 0.17EURENAGAS22 172 575 141.68 0.27EURENDESA3 879 88 208.46 0.04EURFERROVIAL SA19 076 398 306.88 0.18EURGAMESA CORPORACION TECNOLOGICA SA15 769 223 840.96 0.10EURGRUPO CATALANA OCCIDENTE SA5 013 159 413.40 0.07EURGRUPO EMPRESARIAL ENCE SA35 930 178 212.80 0.08EURINDRA SISTEMAS SA18 090 179 000.55 0.08EURINTL CONS AIRLINES GROUP77 585 460 234.22 0.21EURLAR ESPANA16 834 125 244.96 0.06EURMEDIASET ESPANA COM SA39 277 261 427.71 0.12EURMERLIN PROPERTIES SOCIMI S.A.13 563 158 212.40 0.07EURRED ELECTRICA9 877 187 663.00 0.09EURREPSOL SA70 137 1 070 290.62 0.49EURTALGO S.A.13 847 79 758.72 0.04EURTELEFONICA S A218 662 1 633 186.48 0.76EUR
ATLAS COPCO --- REGISTERED SHS -A-24 934 597 688.19 0.28SEK
SWEDEN/SUÈDE 8 161 080.79 3.77
AXFOOD AB11 516 191 292.93 0.09SEKBETSSON AB B51 143 346 346.84 0.16SEKBILIA -A- REGISTERED19 266 146 787.69 0.07SEKBIO GAIA BIOLOGICS2 375 103 873.11 0.05SEKBOLIDEN -REGISTERED SHS7 493 190 369.22 0.09SEKBRAVIDA HOLDING AB35 253 277 393.44 0.13SEKCELLAVISION3 950 105 816.27 0.05SEKDOMETIC GROUP AB35 216 247 008.21 0.11SEKFASTIGHETS BALDER -B3 623 103 665.86 0.05SEKGRANGES AB19 109 175 590.51 0.08SEK
Schedule of investments as at 31/03/2019 / Inventaire du portefeuille au 31/03/2019
EUR
Market ValueNumber of Shares orNominal Value
Investment % of Net AssetsQuotationCurrency
Valeur de marchéNombre d'actions ouvaleur nominale
Investissement % de l'actif netDevise decotation

The accompanying notes form an integral part of these financial statements.Les notes annexées font partie intégrante de ces états financiers.
210 PrivilEdge - JP Morgan Pan European Flexible Equity · 31/03/2019
ICA GRUPPEN AB5 543 198 520.27 0.09SEKKNOW IT4 653 88 907.27 0.04SEKLINDAB INTERNATIONAL AB19 589 159 123.30 0.07SEKMICRONIC LASER SYSTEMS13 925 177 158.60 0.08SEKMIPS AB25 000 322 619.36 0.15SEKNIBE INDUSTRIER -B-8 371 95 688.09 0.04SEKNOBIA34 867 182 457.72 0.08SEKNOBINA AB41 910 240 842.41 0.11SEKPEAB AB -B- FREE23 883 184 257.81 0.09SEKRESURS HOLDING AB34 884 192 930.07 0.09SEKSHB -A-73 788 695 033.76 0.32SEKSKANDINAVISKA ENSKILDA BANKEN -A-90 329 698 017.52 0.32SEKSKANSKA -B- FREE22 682 367 842.70 0.17SEKSKF AB -B-11 150 165 300.18 0.08SEKSKISTAR --- REGISTERED SHS -B-3 620 35 571.74 0.02SEKSWEDBANK -A-33 429 421 603.89 0.19SEKSWEDISH MATCH5 981 272 152.08 0.13SEKTELEFON AB L.M.ERICSSON86 009 705 431.12 0.32SEKTETHYS OIL -REGISTERED SHS19 460 141 595.22 0.07SEKVITROLIFE -REGISTERED SHS5 718 116 201.99 0.05SEKVOLVO AB -B-15 477 213 993.42 0.10SEK
ABB LTD REG SHS10 708 179 160.90 0.08CHF
SWITZERLAND/SUISSE 25 931 372.31 11.98
ADECCO REG.SHS9 931 471 750.25 0.22CHFALSO HOLDING REG.SHS1 287 148 236.62 0.07CHFBALOISE HOLDING REG.SHS3 448 507 217.53 0.23CHFBARRY CALLEBAUT - NAMEN-AKT189 303 887.32 0.14CHFBELIMO HOLDING AG16 71 182.65 0.03CHFDUFRY GROUP1 982 185 394.32 0.09CHFEMMI AG NAM.AKT130 101 837.69 0.05CHFGE MONEY BANK AG2 208 185 900.47 0.09CHFHUBER + SUHNER AG2 422 155 727.07 0.07CHFINTERROLL-HOLDING NOM.70 126 447.57 0.06CHFKARDEX NAM.AKT1 656 222 132.80 0.10CHFLAFARGEHOLCIM N NAMEN-AKT.24 082 1 059 328.04 0.49CHFLOGITECH NAMEN AKT3 371 117 657.17 0.05CHFLONZA GROUP (CHF)1 926 531 856.74 0.25CHFMOBILEZONE HLDG11 918 106 470.66 0.05CHFNESTLE SA REG SHS66 416 5 636 376.84 2.60CHFNOVARTIS AG REG SHS68 782 5 891 294.40 2.72CHFPARTNERS GROUP HLDG NAMEN AKT664 429 900.29 0.20CHFROCHE HOLDING GENUSSSCHEIN17 195 4 218 598.93 1.95CHFSONOVA HOLDING NAM-AKT2 298 404 834.34 0.19CHFSTRAUMANN HOLDING REG379 275 374.47 0.13CHFSUNRISE COMMUNICATIONS NAM.AKT2 200 144 207.47 0.07CHFSWISS LIFE HOLDING N-NAMEN REGISTERED2 127 834 061.70 0.39CHFSWISS RE NAMEN AKT14 047 1 221 991.65 0.56CHFTEMENOS AG NAM.AKT2 818 369 937.31 0.17CHFVETROPACK HOLDING SA16 31 048.51 0.01CHFZURICH INSURANCE GROUP NAMEN AKT6 784 1 999 558.60 0.92CHF
ABN AMRO GROUP DEP RECEIPT25 742 517 414.20 0.24EUR
THE NETHERLANDS/PAYS-BAS 13 892 012.68 6.42
ADYEN --- PARTS SOCIALES464 323 872.00 0.15EURAEGON NV104 087 445 908.71 0.21EURAIRBUS GROUP14 771 1 741 500.90 0.81EURASR15 871 588 814.10 0.27EUR
Schedule of investments as at 31/03/2019 / Inventaire du portefeuille au 31/03/2019
EUR
Market ValueNumber of Shares orNominal Value
Investment % of Net AssetsQuotationCurrency
Valeur de marchéNombre d'actions ouvaleur nominale
Investissement % de l'actif netDevise decotation

The accompanying notes form an integral part of these financial statements.Les notes annexées font partie intégrante de ces états financiers.
211PrivilEdge - JP Morgan Pan European Flexible Equity · 31/03/2019
BESI -REGISTERED SHS7 198 170 736.56 0.08EURCNH INDUSTRIAL NV31 012 281 092.77 0.13EURDSM KONINKLIJKE4 739 460 441.24 0.21EURFERRARI3 348 400 086.00 0.18EURFIAT CHRYSLER AUTOMOBILES -A-23 491 311 772.55 0.14EURFLOW TRADERS10 211 251 190.60 0.12EURHEIJMANS NV23 404 208 529.64 0.10EURING GROEP177 335 1 912 380.64 0.89EURINTERTRUST N.V.10 104 169 747.20 0.08EURKONINKLIJKE AHOLD NV48 550 1 151 848.75 0.53EURKONINKLIJKE BAM GROEP NV43 948 168 936.11 0.08EURKONINKLIJKE VOPAK3 080 131 392.80 0.06EURNIBC HOLDING NV29 626 241 866.66 0.11EURNN GROUP NV18 861 698 422.83 0.32EURRANDSTAD BR8 604 374 015.88 0.17EURRHI-MAG NV REG4 951 259 816.90 0.12GBPRHI-MAG NV REG1 660 86 818.00 0.04EURSIGNIFY -REGISTERED SHS7 693 183 478.05 0.08EURSLIGRO FOOD GROUP1 353 43 228.35 0.02EURTOMTOM NV6 827 51 147.88 0.02EURUNILEVER NV32 191 1 666 849.98 0.78EURVAN LANSCH KEMP - CERT. OF SHS4 490 90 698.00 0.04EURVASTNED2 732 94 390.60 0.04EURVOLKERWESS - REGISTERED10 976 201 738.88 0.09EURWOLTERS KLUWER10 937 663 875.90 0.31EUR
A G BARR PLC10 304 96 499.11 0.04GBP
UNITED KINGDOM/ROYAUME-UNI 60 321 469.66 27.86
ADMIRAL GROUP PLC8 889 223 849.72 0.10GBPAMIGO HOLDINGS PLC25 839 54 046.90 0.02GBPANGLO AMERICAN PLC60 307 1 437 164.04 0.66GBPASHTEAD GROUP15 730 338 166.71 0.16GBPASTRAZENECA PLC18 169 1 293 568.70 0.60GBPAUTO TRADER GROUP PLC53 106 321 458.63 0.15GBPAVEVA GROUP2 580 96 589.07 0.04GBPAVIVA PLC200 316 958 690.01 0.44GBPBABCOCK INTERNATIONAL GROUP PLC37 996 217 605.04 0.10GBPBARRATT DEVELOPMENTS PLC75 111 522 299.07 0.24GBPBELLWAY PLC5 781 204 283.92 0.09GBPBHP GROUP-REGISTERED SHS99 028 2 124 441.93 0.98GBPBK GEORGIA GRP -REGISTERED SHS6 128 117 553.49 0.05GBPBOVIS HOMES GROUP18 365 226 658.67 0.10GBPBP PLC509 034 3 299 239.75 1.52GBPBRITISH AMERICAN TOBACCO PLC94 763 3 512 510.41 1.62GBPBRITISH LAND CO PLC REIT33 759 230 753.75 0.11GBPBRITVIC PLC13 372 147 810.49 0.07GBPBT GROUP PLC389 476 1 007 701.91 0.47GBPBUNZL PLC11 009 323 485.99 0.15GBPBURBERRY GROUP PLC17 954 407 230.97 0.19GBPCARD FACTORY PLC59 000 123 450.16 0.06GBPCENTRICA PLC NEW323 441 428 652.22 0.20GBPCHARTER COURT FINANCAIL SERVICES GROUP69 757 268 763.19 0.12GBPCLOSE BROTHERS GROUP PLC10 105 170 625.22 0.08GBPCOCA COLA EUROPEAN PARTNERS PLC7 325 337 529.95 0.16USDCOMPASS GROUP46 639 976 674.90 0.45GBPCOMPUTACENTER14 889 191 101.71 0.09GBPCOUNTRYSIDE PROPERTIES PLC54 830 206 670.35 0.10GBPCRANEWARE --- REGISTERED SHS4 837 136 403.74 0.06GBP
Schedule of investments as at 31/03/2019 / Inventaire du portefeuille au 31/03/2019
EUR
Market ValueNumber of Shares orNominal Value
Investment % of Net AssetsQuotationCurrency
Valeur de marchéNombre d'actions ouvaleur nominale
Investissement % de l'actif netDevise decotation

The accompanying notes form an integral part of these financial statements.Les notes annexées font partie intégrante de ces états financiers.
212 PrivilEdge - JP Morgan Pan European Flexible Equity · 31/03/2019
DART GROUP PLC18 915 174 179.56 0.08GBPDERWENT LONDON PLC4 782 178 860.23 0.08GBPDEVELOPMENT SECURITIES PLC19 771 42 951.50 0.02GBPDIAGEO PLC60 490 2 202 827.20 1.02GBPDIALOG SEMICONDUCTOR12 285 333 414.90 0.15EURDIPLOMA13 846 234 274.90 0.11GBPDIRECT LINE INS GR PLC NI96 405 394 928.22 0.18GBPDIXONS CARPHONE PLC99 718 169 822.64 0.08GBPEMIS GROUP PLC3 000 36 555.65 0.02GBPENTERPRISE INNS138 871 343 269.39 0.16GBPEVRAZ PLC90 619 652 431.57 0.30GBPEXPERIAN GROUP24 735 596 774.57 0.28GBPFERREXPO84 173 241 861.84 0.11GBPFEVERTREE DRINK PLC2 683 93 999.97 0.04GBPFIRSTGROUP PLC224 697 237 161.33 0.11GBPFORTERRA PLC79 704 272 401.39 0.13GBPGAMES WORKSHOP GROUP PLC5 590 204 021.70 0.09GBPGAMMA COMMUNICATIONS PLC4 580 51 981.43 0.02GBPGLAXOSMITHKLINE PLC193 024 3 576 891.30 1.66GBPGREAT PORT EST REIT -REGISTERED SHS20 582 178 304.08 0.08GBPGREENE KING PLC31 360 242 160.19 0.11GBPGREGGS PLC11 872 253 366.69 0.12GBPGROUP 4 SECURICOR91 864 195 625.44 0.09GBPHALMA PLC4 188 81 261.88 0.04GBPHANSTEEN HOLDINGS77 360 87 441.85 0.04GBPHIKMA PHARMACEUTICALS PLC6 982 145 157.86 0.07GBPHOLLYWOOD BOWL GROUP PLC16 658 40 596.26 0.02GBPIMPERIAL BRANDS - REGISTERED45 545 1 387 174.81 0.64GBPINCHCAPE28 080 186 070.33 0.09GBPITV PLC253 898 374 497.34 0.17GBPJ SAINSBURY PLC109 185 298 652.72 0.14GBPJPJ GRP REGISTERED SHS29 028 235 808.29 0.11GBPLEGAL GENERAL GROUP PLC330 453 1 055 746.91 0.49GBPLLOYDS BANKING GROUP PLC3 113 251 2 245 066.93 1.04GBPMAN GROUP102 517 161 562.13 0.07GBPMARKS AND SPENCER GROUP PLC118 452 383 384.74 0.18GBPMICRO FOCUS INTL PLC22 979 532 407.73 0.25GBPMITCHELLS & BUTLERS PLC26 473 83 194.71 0.04GBPMORGAN SINDALL PLC8 979 130 668.05 0.06GBPNATIONAL EXPRESS GROUP PLC35 845 168 887.90 0.08GBPNEXT PLC7 803 505 288.85 0.23GBPONESAVINGS BANK64 057 285 160.32 0.13GBPPARAGON GROUP OF COMPAGNIES27 248 137 805.25 0.06GBPPEARSON PLC15 424 149 675.63 0.07GBPPERSIMMON PLC18 261 459 862.71 0.21GBPPOLYPIPE GROUP PLC37 479 175 281.85 0.08GBPPREMIER OIL PLC162 934 177 644.76 0.08GBPQINETIQ GROUP PLC26 826 93 768.03 0.04GBPREDROW PLC33 632 234 569.25 0.11GBPRELX PLC53 761 1 024 123.04 0.47GBPRELX PLC731 13 925.55 0.01EURRIGHTMOVE -REGISTERED SHS15 606 92 364.63 0.04GBPRIO TINTO PLC47 955 2 482 618.72 1.15GBPROYAL BANK OF SCOTLAND270 240 774 623.19 0.36GBPROYAL DUTCH SHELL PLC -B-290 164 8 175 910.32 3.79GBPSAGA127 693 164 784.29 0.08GBPSAGE GROUP34 394 279 877.83 0.13GBPSMITH AND NEPHEW PLC23 703 418 935.46 0.19GBP
Schedule of investments as at 31/03/2019 / Inventaire du portefeuille au 31/03/2019
EUR
Market ValueNumber of Shares orNominal Value
Investment % of Net AssetsQuotationCurrency
Valeur de marchéNombre d'actions ouvaleur nominale
Investissement % de l'actif netDevise decotation

The accompanying notes form an integral part of these financial statements.Les notes annexées font partie intégrante de ces états financiers.
213PrivilEdge - JP Morgan Pan European Flexible Equity · 31/03/2019
SPIRENT COMMUNICATIONS103 306 172 396.46 0.08GBPSSP GROUP -REGISTERED SHS27 719 222 697.74 0.10GBPSTAFFLINE GROUP PLC6 824 68 897.30 0.03GBPSTAGECOACH GROUP PLC87 161 155 366.48 0.07GBPST.MODWEN PROPERTIES PLC47 981 220 945.35 0.10GBPTAYLOR WIMPEY PLC226 309 460 785.82 0.21GBPTBC BANK GROUP PLC10 813 193 748.08 0.09GBPTHE BERKELEY GR13 382 572 893.10 0.26GBPTIPP 24 SE2 742 55 251.30 0.03EURTULLOW OIL PLC91 632 255 850.75 0.12GBPUNILEVER PLC30 271 1 543 936.93 0.71GBPVESUVIUS PLC25 048 172 519.30 0.08GBPVODAFONE GROUP1 197 853 1 943 366.01 0.90GBPWATKIN JONES PLC17 541 44 783.80 0.02GBP3I GROUP PLC7 410 84 685.71 0.04GBP
JPM LIQ EUR LIQ -X- DIS28 279 982.08 0.13EUR
Shares of UCITS/UCI/Parts d'organismes de placement collectif 279 982.08 0.13
UCITS/UCI/Organismes de placement collectif 279 982.08 0.13
LUXEMBOURG/LUXEMBOURG 279 982.08 0.13
Schedule of investments as at 31/03/2019 / Inventaire du portefeuille au 31/03/2019
EUR
Market ValueNumber of Shares orNominal Value
Investment % of Net AssetsQuotationCurrency
Valeur de marchéNombre d'actions ouvaleur nominale
Investissement % de l'actif netDevise decotation
Futures Contracts/Contrats futures 0.0481 030.00DJ EURO STOXX 50 Caceis Bank 4 024 560.00 0.03EUR 48 880.0030/06/2019123DJ EURO STOXX 50 Caceis Bank 2 650 320.00 0.01EUR 32 150.0030/06/201981
EUR EUR
Unrealised appreciation/(depreciation)
Underlying Intermediary % of NetAssets
Maturity Currency CommitmentNumber ofcontracts
Plus/(Moins) value non-réalisée
Sous-jacent Intermédiaire % de l'actifnet
Maturité Devise EngagementNombre decontrats
Forward Foreign Currency Exchange Contracts/Contrats de change à terme 0.0355 114.73EUR 37 607.60 0.00GBP (118.00)43 506.45 15/04/2019Caceis BankGBP 1 093 025.85 0.00EUR (7 798.48)935 549.86 15/04/2019Caceis BankEUR 28 840.57 0.00CHF (129.69)25 664.58 15/04/2019Caceis BankEUR 275 749.06 0.00USD (2 196.73)243 115.25 15/04/2019Caceis BankCHF 1 031 124.67 0.01EUR 16 286.981 171 110.50 15/04/2019Caceis BankUSD 4 986 217.95 0.01EUR 43 599.275 653 943.49 15/04/2019Caceis BankEUR 26 420 982.42 (0.02)SEK (31 302.77)2 505 204.34 17/04/2019Hsbc BankUSD 422 418.39 0.00EUR 3 455.62478 799.00 17/04/2019UBSDKK 428 540.17 0.00EUR (212.79)3 197 365.15 17/04/2019Hsbc BankEUR 868 793.40 (0.01)CHF (11 538.04)765 503.34 17/04/2019Société GénéraleEUR 19 292 535.00 0.00NOK (10 278.75)1 983 589.31 17/04/2019Société GénéraleEUR 544 171.31 0.00CHF (7 600.05)479 102.06 17/04/2019UBS
EUR
Unrealised appreciation/(depreciation)
Currency % of NetAssets
Amount bought Maturity Currency Amount soldCounterparty
Plus/(Moins) value non-réalisée
Devise % de l'actifnet
Montant acheté Maturité Devise Montant venduContrepartie

The accompanying notes form an integral part of these financial statements.Les notes annexées font partie intégrante de ces états financiers.
214 PrivilEdge - JP Morgan Pan European Flexible Equity · 31/03/2019
Schedule of investments as at 31/03/2019 / Inventaire du portefeuille au 31/03/2019
SEK 2 203 781.25 0.01EUR 16 730.4023 129 525.86 17/04/2019Hsbc BankEUR 2 342 221.60 0.00DKK 155.87313 926.00 17/04/2019Hsbc BankGBP 3 256 865.18 0.00EUR (9 452.34)2 799 712.82 17/04/2019UBSEUR 5 265 029.63 0.01GBP 46 377.256 153 309.56 17/04/2019Société GénéraleGBP 2 469 392.42 0.00EUR (7 428.20)2 122 548.97 17/04/2019Hsbc BankCHF 1 072 484.07 0.01EUR 13 668.671 214 401.38 17/04/2019Société GénéraleCHF 796 711.95 0.01EUR 12 995.28905 314.28 17/04/2019Hsbc BankGBP 1 151 194.18 0.00EUR (10 098.77)983 779.89 17/04/2019Société Générale
EUR
Unrealised appreciation/(depreciation)
Currency % of NetAssets
Amount bought Maturity Currency Amount soldCounterparty
Plus/(Moins) value non-réalisée
Devise % de l'actifnet
Montant acheté Maturité Devise Montant venduContrepartie

PrivilEdgeis an investment company
with variable capital ("SICAV")incorporated in Luxembourg
PrivilEdgeest une société d’investissement
à capital variable ("SICAV")enregistrée au Luxembourg RCS Luxembourg B0181207
PrivilEdge –Moneta Best of France
Unaudited semi-annual report · Rapport semestriel non révisé
31.03.2019

The accompanying notes form an integral part of these financial statements.Les notes annexées font partie intégrante de ces états financiers.
216 PrivilEdge - Moneta Best Of France · 31/03/2019
ASSETS/ACTIF
89 551 346.11Investments in securities at market value/Portefeuille-titres à la valeur de marché (2):( EUR )93 821 486.69Acquisition cost/Coût d'acquisition
2 025 029.84Cash and term deposits/Liquidité et dépôts à terme51 787.52Interest and dividends receivable, net/Intérêt et dividendes nets à recevoir11 625.99Formation/reorganisation expenses/Frais de constitution/réorganisation (2)
91 639 789.46LIABILITIES/PASSIF
12 991.83Bank overdrafts/Découverts bancaires115 205.53Management and distribution fees payable/Commission de gestion et de distribution à payer (3)
20 140.39Taxes and expenses payable/Impôts et autres frais à payer148 337.75
91 491 451.71NET ASSET VALUE/VALEUR NETTE D'INVENTAIRE
Statement of net assets as at 31/03/2019 / État de l'actif net au 31/03/2019
NotesNotes EUR

The accompanying notes form an integral part of these financial statements.Les notes annexées font partie intégrante de ces états financiers.
217PrivilEdge - Moneta Best Of France · 31/03/2019
Statement of operations and changes in net assets for the period from 01/10/2018 to 31/03/2019 / État desopérations et des variations de l'actif net pour la période du 01/10/2018 au 31/03/2019
NotesNotes EUR
103 503 983.23NET ASSET VALUE AT THE BEGINNING OF THE PERIOD/VALEUR NETTE D'INVENTAIRE AU DÉBUT DE LAPÉRIODE
INCOME/REVENUS
103 575.04Dividends, net/Dividendes, nets (2)103 575.04
EXPENSES/DÉPENSES
677 226.09Management fees/Commission de gestion (3)34 522.34Distribution fees/Frais de distribution (3)10 014.53Bank interest and other expenses/Intérêts bancaires débiteurs et autres frais
128 306.57Fixed Rate of Operational Costs/Taux Fixe de Coûts Opérationnels (4)2 482.21Formation/Reorganisation expenses/Frais de constitution/réorganisation (2)
852 551.74(748 976.70)NET INVESTMENT LOSS/PERTE NETTE SUR INVESTISSEMENTS
(6 080 677.74)Net realised loss on sale of investments/Perte nette réalisée sur ventes d'investissements (2)(225.28)Net realised loss on foreign exchange/Perte nette réalisée sur opérations de change
(6 829 879.72)NET REALISED LOSS/PERTE NETTE RÉALISÉE
(1 106 520.39)Change in net unrealised appreciation or depreciation on investments/Variation de la plus ou moins-value nette non réaliséesur investissements
(2)
(7 936 400.11)NET DECREASE IN NET ASSETS AS A RESULT OF OPERATIONS/DIMINUTION NETTE DE L'ACTIF NET RÉSULTANTDES OPÉRATIONS
(4 076 131.41)Net subscriptions/(redemptions) including equalisation/Souscriptions/(rachats) nets incluant la régularisation91 491 451.71NET ASSET VALUE AT THE END OF THE PERIOD/VALEUR NETTE D'INVENTAIRE À LA FIN DE LA PÉRIODE

The accompanying notes form an integral part of these financial statements.Les notes annexées font partie intégrante de ces états financiers.
218 PrivilEdge - Moneta Best Of France · 31/03/2019
2 008 293.9490 48 247.9720 (95 694.9990) 1 960 846.9220P - EUR - Capitalisation2 622 455.2400 0.0000 0.0000 2 622 455.2400I - EUR - Capitalisation2 612 403.0470 127 745.0000 (500 165.3760) 2 239 982.6710M - EUR - Capitalisation3 504 992.6910 0.0000 (45 000.0000) 3 459 992.6910N - EUR - Capitalisation
Statement of changes in the number of shares outstanding for the period from 01/10/2018 to 31/03/2019 / Étatdes variations du nombre d'actions pour la période du 01/10/2018 au 31/03/2019
Number of Shares01/10/2018/
Nombre d'actions01/10/2018
Number of Sharesissued/
Nombre d'actionsémises
Number of Sharesredeemed/
Nombre d'actionsrachetées
Number of Shares31/03/2019/
Nombre d'actions31/03/2019
30/09/201831/03/2019For the period ended/Pour la période clôturée au
Statistics / Statistiques
P - EUR - Capitalisation
17 366 307.088.8565
19 307 708.269.6140
Net Asset Value/Valeur Nette d'InventaireNet Asset Value per share/Valeur Nette d'Inventaire par action
EUR EUR
I - EUR - Capitalisation
23 372 917.038.9126
25 271 141.509.6364
Net Asset Value/Valeur Nette d'InventaireNet Asset Value per share/Valeur Nette d'Inventaire par action
EUR EUR
M - EUR - Capitalisation
19 938 985.528.9014
25 159 318.619.6307
Net Asset Value/Valeur Nette d'InventaireNet Asset Value per share/Valeur Nette d'Inventaire par action
EUR EUR
N - EUR - Capitalisation
30 813 242.088.9056
33 765 814.869.6336
Net Asset Value/Valeur Nette d'InventaireNet Asset Value per share/Valeur Nette d'Inventaire par action
EUR EUR

The accompanying notes form an integral part of these financial statements.Les notes annexées font partie intégrante de ces états financiers.
219PrivilEdge - Moneta Best Of France · 31/03/2019
Investments in securities at market value/Portefeuille-titres à la valeur de marché 89 551 346.11 97.88
AIR LIQUIDE SA40 000 4 534 000.00 4.96EUR
Transferable securities admitted to an official stock exchange listing and/or dealt in on anotherregulated market/Valeurs mobilières admises à la cote officielle d'une bourse de valeurs et/ounégociées sur un autre marché réglementé
87 552 890.22 95.70
EQUITIES/ACTIONS 87 552 890.22 95.70
FRANCE/FRANCE 76 406 850.22 83.51
ALSTOM SA60 000 2 317 200.00 2.53EURALTEN SA25 415 2 424 591.00 2.65EURAMUNDI SA35 000 1 963 500.00 2.15EURASSYSTEM67 535 2 194 887.50 2.40EURATOS27 500 2 365 000.00 2.58EURBNP PARIBAS SA50 000 2 130 500.00 2.33EURBOLLORE INVESTISSEMENT300 000 1 208 400.00 1.32EURCOFACE SA120 000 945 600.00 1.03EURCRCAM DU LANGUEDOC CERT COOP D'INVT4 100 311 477.00 0.34EURCRCAM MORBIHAN - CERT.COOP D'INVEST3 800 357 200.00 0.39EURCRCAM NORMANDIE CCI CERT.COOP.INVT.2 700 386 154.00 0.42EURCRCAM PARIS IDF - CERT.COOP.D'INVEST20 000 1 971 600.00 2.15EURCRCAM SRA - CERT COOP D'INVEST1 487 322 455.95 0.35EURCRCAM TOURAINE CERT.COOP.INVT.3 046 335 791.04 0.37EURCREDIT AGRICOLE SA200 000 2 154 000.00 2.35EURDASSAULT AVIATION SA1 700 2 235 500.00 2.44EURELECTRICITE DE STRASBOURG REG.SHS15 500 1 619 750.00 1.77EURENGIE200 000 2 656 000.00 2.90EURFINANCIERE DE L ODET SA2 762 2 309 032.00 2.52EURFONCIERE FINANCIERE PART. ACT NOM.40 000 3 752 000.00 4.10EURGROUPE FLO3 747 949 854 532.37 0.93EURIPSOS SA100 000 2 232 000.00 2.44EURJACQUET METAL220 000 3 269 200.00 3.57EURLAFUMA26 270 551 670.00 0.60EURNATIXIS SA250 000 1 192 750.00 1.30EURPUBLICIS GROUPE75 000 3 579 750.00 3.91EURRENAULT SA25 000 1 472 750.00 1.61EURSANOFI70 000 5 511 800.00 6.03EURSTE INTL DE PLANTATIONS D'HEVEAS - SIPH15 000 1 215 000.00 1.33EURTELEPERFORMANCE SA35 000 5 607 000.00 6.14EURTOTAL SA80 918 4 007 059.36 4.38EURVIRBAC SA7 500 1 096 500.00 1.20EURVIVENDI SA240 000 6 199 200.00 6.79EURWENDEL SA10 000 1 123 000.00 1.23EUR
CECONOMY AG230 000 1 090 200.00 1.19EUR
GERMANY/ALLEMAGNE 4 279 400.00 4.68
VONOVIA SE40 000 1 848 800.00 2.02EURWIRECARD AG12 000 1 340 400.00 1.47EUR
EDP RENOVAVEIS SA400 000 3 400 000.00 3.72EUR
SPAIN/ESPAGNE 3 400 000.00 3.72
GEMALTO NV68 000 3 466 640.00 3.79EUR
THE NETHERLANDS/PAYS-BAS 3 466 640.00 3.79
Schedule of investments as at 31/03/2019 / Inventaire du portefeuille au 31/03/2019
EUR
Market ValueNumber of Shares orNominal Value
Investment % of Net AssetsQuotationCurrency
Valeur de marchéNombre d'actions ouvaleur nominale
Investissement % de l'actif netDevise decotation

The accompanying notes form an integral part of these financial statements.Les notes annexées font partie intégrante de ces états financiers.
220 PrivilEdge - Moneta Best Of France · 31/03/2019
STATERE -IC-20 1 998 455.89 2.18EUR
Shares of UCITS/UCI/Parts d'organismes de placement collectif 1 998 455.89 2.18
UCITS/UCI/Organismes de placement collectif 1 998 455.89 2.18
FRANCE/FRANCE 1 998 455.89 2.18
Schedule of investments as at 31/03/2019 / Inventaire du portefeuille au 31/03/2019
EUR
Market ValueNumber of Shares orNominal Value
Investment % of Net AssetsQuotationCurrency
Valeur de marchéNombre d'actions ouvaleur nominale
Investissement % de l'actif netDevise decotation

PrivilEdgeis an investment company
with variable capital ("SICAV")incorporated in Luxembourg
PrivilEdgeest une société d’investissement
à capital variable ("SICAV")enregistrée au Luxembourg RCS Luxembourg B0181207
PrivilEdge –NN IP Euro Credit
Unaudited semi-annual report · Rapport semestriel non révisé
31.03.2019

The accompanying notes form an integral part of these financial statements.Les notes annexées font partie intégrante de ces états financiers.
222 PrivilEdge - NN IP Euro Credit · 31/03/2019
ASSETS/ACTIF
138 643 017.06Investments in securities at market value/Portefeuille-titres à la valeur de marché (2):( EUR )137 218 993.34Acquisition cost/Coût d'acquisition
1 673 139.51Cash and term deposits/Liquidité et dépôts à terme1 581 787.14Receivable on investments sold/À recevoir sur vente de titres1 030 895.60Interest and dividends receivable, net/Intérêt et dividendes nets à recevoir
17 106.15Interest on swaps receivable/Intérêt à recevoir sur swaps8 617.21Formation/reorganisation expenses/Frais de constitution/réorganisation (2)
128 599.51Unrealised appreciation on IRS/Plus-value non réalisée sur IRS (2)758.80Receivable on foreign exchange transactions, net/A recevoir sur opérations de change, net
220 839.30Unrealised appreciation on forward foreign currency exchange contracts/Plus-value non réalisée sur contrats de change àterme
(2)
208 693.27Other assets/Autres actifs143 513 453.55
LIABILITIES/PASSIF
3 285 017.49Payable on investments purchased/À payer sur achat de titres223 048.75Amounts payable on redemptions/Montants à payer sur rachats d'actions
63 406.95Management and distribution fees payable/Commission de gestion et de distribution à payer (3)21 906.96Taxes and expenses payable/Impôts et autres frais à payer
234 505.92Unrealised depreciation on CDS/Moins-value non réalisée sur CDS (2)3 580.72Interest on swaps payable/Intérêt à payer sur swaps7 134.51Unrealised depreciation on futures contracts/Moins-value non réalisée sur contrats futures (2)
3 838 601.30139 674 852.25NET ASSET VALUE/VALEUR NETTE D'INVENTAIRE
Statement of net assets as at 31/03/2019 / État de l'actif net au 31/03/2019
NotesNotes EUR

The accompanying notes form an integral part of these financial statements.Les notes annexées font partie intégrante de ces états financiers.
223PrivilEdge - NN IP Euro Credit · 31/03/2019
Statement of operations and changes in net assets for the period from 01/10/2018 to 31/03/2019 / État desopérations et des variations de l'actif net pour la période du 01/10/2018 au 31/03/2019
NotesNotes EUR
115 731 951.86NET ASSET VALUE AT THE BEGINNING OF THE PERIOD/VALEUR NETTE D'INVENTAIRE AU DÉBUT DE LAPÉRIODE
INCOME/REVENUS
1 065 161.51Interest on bonds, net/Intérêts sur obligations, nets (2)6 361.46Bank interest/Intérêts bancaires
30.28Securities Lending Income/Revenus sur prêt de titres (9)1 071 553.25
EXPENSES/DÉPENSES
337 912.68Management fees/Commission de gestion (3)1 036.42Distribution fees/Frais de distribution (3)
963.67Bank interest and other expenses/Intérêts bancaires débiteurs et autres frais123 650.50Fixed Rate of Operational Costs/Taux Fixe de Coûts Opérationnels (4)
10 993.20Interest on swaps, net/Intérêts sur contrats de swaps, nets2 482.19Formation/Reorganisation expenses/Frais de constitution/réorganisation (2)
477 038.66594 514.59NET INVESTMENT INCOME/REVENU NET SUR INVESTISSEMENTS
(329 616.24)Net realised loss on sale of investments/Perte nette réalisée sur ventes d'investissements (2)163 883.77Net realised gain on swaps/Gain net réalisé sur swaps (2)
(202 855.47)Net realised loss on futures contracts/Perte nette réalisée sur contrats futures(36 702.79)Net realised loss on foreign exchange/Perte nette réalisée sur opérations de change
(145 042.70)Net realised loss on forward foreign currency exchange contracts/Perte nette réalisée sur contrats de change à terme44 181.16NET REALISED GAIN/GAIN NET RÉALISÉ
2 863 300.75Change in net unrealised appreciation or depreciation on investments/Variation de la plus ou moins-value nette non réaliséesur investissements
(2)
157 099.28Change in net unrealised appreciation or depreciation on IRS/Variation de la plus ou moins-value nette non réalisée sur IRS (2)(147 971.14)Change in net unrealised appreciation or depreciation on CDS/Variation de la plus ou moins-value nette non réalisée sur
CDS(2)
(18 501.77)Change in net unrealised appreciation or depreciation on futures contracts/Variation de la plus ou moins-value nette nonréalisée sur contrats futures
340 809.11Change in net unrealised appreciation or depreciation on forward foreign currency exchange contracts/Variation de la plus oumoins-value nette non réalisée sur contrats de change à terme
3 238 917.39NET INCREASE IN NET ASSETS AS A RESULT OF OPERATIONS/AUGMENTATION NETTE DE L'ACTIF NETRÉSULTANT DES OPÉRATIONS
(173 684.85)Dividend paid/Dividende payé20 877 667.85Net subscriptions/(redemptions) including equalisation/Souscriptions/(rachats) nets incluant la régularisation
139 674 852.25NET ASSET VALUE AT THE END OF THE PERIOD/VALEUR NETTE D'INVENTAIRE À LA FIN DE LA PÉRIODE

The accompanying notes form an integral part of these financial statements.Les notes annexées font partie intégrante de ces états financiers.
224 PrivilEdge - NN IP Euro Credit · 31/03/2019
35 576.0000 109 807.4990 (4 450.0000) 140 933.4990P - EUR - Capitalisation843 687.0000 136 467.0000 (108 997.0000) 871 157.0000I - CHF - Hedged - Capitalisation
42 130.0000 11 523.0000 (11 523.0000) 42 130.0000I - EUR - Capitalisation4 400.0000 0.0000 0.0000 4 400.0000M - USD - Hedged - Distribution
33 750.0000 19 163.6840 (4 500.0000) 48 413.6840M - CHF - Hedged - Capitalisation6 557 438.9590 2 430 231.8850 (616 535.0460) 8 371 135.7980M - EUR - Capitalisation2 017 892.4720 344 018.0000 (128 777.9200) 2 233 132.5520M - EUR - Distribution
29 800.0000 0.0000 0.0000 29 800.0000M - GBP - Hedged - Capitalisation209 572.0000 0.0000 (47 750.0000) 161 822.0000M - GBP - Hedged - Distribution892 500.0000 0.0000 (197 500.0000) 695 000.0000N - CHF - Hedged - Capitalisation
1 047 377.7840 25 250.0000 (176 493.0000) 896 134.7840N - EUR - Capitalisation200 648.0000 305 868.0000 0.0000 506 516.0000N - EUR - Distribution
Statement of changes in the number of shares outstanding for the period from 01/10/2018 to 31/03/2019 / Étatdes variations du nombre d'actions pour la période du 01/10/2018 au 31/03/2019
Number of Shares01/10/2018/
Nombre d'actions01/10/2018
Number of Sharesissued/
Nombre d'actionsémises
Number of Sharesredeemed/
Nombre d'actionsrachetées
Number of Shares31/03/2019/
Nombre d'actions31/03/2019
30/09/201831/03/2019For the period ended/Pour la période clôturée au
Statistics / Statistiques
P - EUR - Capitalisation
1 414 659.0910.0378
349 704.449.8298
Net Asset Value/Valeur Nette d'InventaireNet Asset Value per share/Valeur Nette d'Inventaire par action
EUR EUR
I - CHF - Hedged - Capitalisation
8 765 526.3410.0619
8 306 858.469.8459
Net Asset Value/Valeur Nette d'InventaireNet Asset Value per share/Valeur Nette d'Inventaire par action
CHF CHF
I - EUR - Capitalisation
426 735.4310.1290
416 482.429.8856
Net Asset Value/Valeur Nette d'InventaireNet Asset Value per share/Valeur Nette d'Inventaire par action
EUR EUR
M - USD - Hedged - Distribution
45 717.2410.3903
0.07
44 338.6810.0770
0.00
Net Asset Value/Valeur Nette d'InventaireNet Asset Value per share/Valeur Nette d'Inventaire par actionDividend per share paid to shareholders/Dividende par action payé aux actionnaires
USD USD
M - CHF - Hedged - Capitalisation
485 404.1210.0262
331 524.569.8230
Net Asset Value/Valeur Nette d'InventaireNet Asset Value per share/Valeur Nette d'Inventaire par action
CHF CHF

The accompanying notes form an integral part of these financial statements.Les notes annexées font partie intégrante de ces états financiers.
225PrivilEdge - NN IP Euro Credit · 31/03/2019
30/09/201831/03/2019For the period ended/Pour la période clôturée au
Statistics / Statistiques
M - EUR - Capitalisation
84 490 303.1810.0931
64 673 435.979.8626
Net Asset Value/Valeur Nette d'InventaireNet Asset Value per share/Valeur Nette d'Inventaire par action
EUR EUR
M - EUR - Distribution
22 377 732.3510.0208
0.07
19 901 675.079.8626
0.00
Net Asset Value/Valeur Nette d'InventaireNet Asset Value per share/Valeur Nette d'Inventaire par actionDividend per share paid to shareholders/Dividende par action payé aux actionnaires
EUR EUR
M - GBP - Hedged - Capitalisation
304 953.9610.2334
296 313.429.9434
Net Asset Value/Valeur Nette d'InventaireNet Asset Value per share/Valeur Nette d'Inventaire par action
GBP GBP
M - GBP - Hedged - Distribution
1 644 260.6410.1609
0.07
2 083 870.429.9435
0.00
Net Asset Value/Valeur Nette d'InventaireNet Asset Value per share/Valeur Nette d'Inventaire par actionDividend per share paid to shareholders/Dividende par action payé aux actionnaires
GBP GBP
N - CHF - Hedged - Capitalisation
6 983 051.8110.0476
8 780 143.409.8377
Net Asset Value/Valeur Nette d'InventaireNet Asset Value per share/Valeur Nette d'Inventaire par action
CHF CHF
N - EUR - Capitalisation
9 063 990.2210.1145
10 345 379.339.8774
Net Asset Value/Valeur Nette d'InventaireNet Asset Value per share/Valeur Nette d'Inventaire par action
EUR EUR
N - EUR - Distribution
5 081 349.2010.0320
0.08
1 981 882.559.8774
0.00
Net Asset Value/Valeur Nette d'InventaireNet Asset Value per share/Valeur Nette d'Inventaire par actionDividend per share paid to shareholders/Dividende par action payé aux actionnaires
EUR EUR

The accompanying notes form an integral part of these financial statements.Les notes annexées font partie intégrante de ces états financiers.
226 PrivilEdge - NN IP Euro Credit · 31/03/2019
Investments in securities at market value/Portefeuille-titres à la valeur de marché 138 643 017.06 99.26
COMMONW BK AUSTRALIA 0.375 17-24 11/04A400 000 404 800.00 0.29EUR
Transferable securities admitted to an official stock exchange listing and/or dealt in on anotherregulated market/Valeurs mobilières admises à la cote officielle d'une bourse de valeurs et/ounégociées sur un autre marché réglementé
119 018 558.40 85.21
BONDS/OBLIGATIONS 97 033 330.05 69.47
AUSTRALIA/AUSTRALIE 3 834 101.30 2.75
NATIONAL AUSTRA 0.6250 18-23 30/08A255 000 258 921.90 0.19EUROPTUS FINANCE EMTN 3.50 10-20 15/09A300 000 315 216.00 0.23EURORIGIN ENERGY REGS 2.50 13-20 23/10A500 000 517 690.00 0.37EURORIGIN ENERGY 114AREGS3.50 13-21 04/10A500 000 538 005.00 0.39EURTRANSURBAN FINANCE 1.75 17-28 29/03A600 000 620 124.00 0.43EURTRANSURBAN FINANCE 1.875 14-24 16/09A500 000 530 870.00 0.38EURWESTPAC BANKING 0.25 17-22 06/04A400 000 403 816.00 0.29EURWESTPAC BANKING CORP 0.75 18-23 17/10A240 000 244 658.40 0.18EUR
RAIFFEISEN BANK SUB 6.00 13-23 16/10A100 000 116 705.00 0.08EUR
AUSTRIA/AUTRICHE 518 277.00 0.37
UNICREDIT EMTN 2.50 13-19 27/05A400 000 401 572.00 0.29EUR
ANHEUSER BUSCH INBEV 1.15 18-27 22/01A280 000 283 508.40 0.20EUR
BELGIUM/BELGIQUE 1 870 096.40 1.34
ANHEUSER-BUSCH INB 1.50 16-25 17/03A400 000 421 716.00 0.31EURANHEUSER-BUSCH INB 2.75 16-36 17/03A300 000 328 248.00 0.24EURBELFIUS BANK SA/NV 3.125 16-26 11/05200 000 215 986.00 0.15EURBELFIUS BANK SA/NV 1.00 17-24 26/10A200 000 200 310.00 0.14EURSOLVAY SA 1.625 15-22 02/12A400 000 420 328.00 0.30EUR
BACARDI 2.75 13-23 03/07A700 000 744 814.00 0.53EUR
BERMUDA/BERMUDES 744 814.00 0.53
BANK OF MONTREAL 0.25 18-21 17/11A180 000 181 337.40 0.13EUR
CANADA/CANADA 1 656 650.88 1.19
CANADIAN IMPERIAL BK 0.75 18-23 22/03A284 000 290 523.48 0.21EURFAIRFAX FINL HLDGS 2.75 18-28 29/03A200 000 210 436.00 0.15EURFED CAISSES DESJARDINS 0.25 18-21 27/09A350 000 352 142.00 0.25EURGREAT WEST LIFECO 1.75 16-26 07/12A400 000 417 884.00 0.30EURTORONTO-DOMINIO 0.6250 18-23 20/07A200 000 204 328.00 0.15EUR
CK HUTCHISON FINANCE 1.25 16-23 06/04A400 000 411 388.00 0.29EUR
CAYMAN ISLANDS/ILES CAÏMANS 411 388.00 0.29
OP CORPORATE BANK 0.375 18-23 29/08A300 000 302 397.00 0.21EUR
FINLAND/FINLANDE 602 928.00 0.43
SAMPO OYJ 1.125 16-19 24/05A300 000 300 531.00 0.22EUR
APRR SA 1.25 19-28 18/01A700 000 724 248.00 0.52EUR
FRANCE/FRANCE 13 305 527.45 9.53
ARRFP 1.875 14-25 15/01A400 000 433 856.00 0.31EURBANQUE FED CRED MU 2.375 16-26 24/03A200 000 211 000.00 0.15EURBFCM EMTN 0.75 18-25 17/07A700 000 707 749.00 0.51EURBFCM SUB 3.00 14-24 21/05A300 000 327 231.00 0.23EURBK FED CRED MUTUEL 0.5 18-22 16/11A500 000 505 505.00 0.36EURBNP PARIBAS 1.125 16-23 15/01A300 000 311 364.00 0.22EURBNP PARIBAS 3.75 10-20 25/11A400 000 425 964.00 0.30EURBNP PARIBAS 4.032 14-XX 25/11A100 000 106 127.00 0.08EURBNP PARIBAS 1.0000 18-24 17/04A400 000 405 620.00 0.29EUR
Schedule of investments as at 31/03/2019 / Inventaire du portefeuille au 31/03/2019
EUR
Market ValueNumber of Shares orNominal Value
Investment % of Net AssetsQuotationCurrency
Valeur de marchéNombre d'actions ouvaleur nominale
Investissement % de l'actif netDevise decotation

The accompanying notes form an integral part of these financial statements.Les notes annexées font partie intégrante de ces états financiers.
227PrivilEdge - NN IP Euro Credit · 31/03/2019
BNP PARIBAS SA 1.125 18-26 11/06A165 000 163 899.45 0.12EURBPCE 0.375 16-23 05/10A500 000 501 510.00 0.36EURCAPGEMINI S 1.0000 18-24 18/10A300 000 307 011.00 0.22EURCAPGEMINI SE 1.75 15-20 01/07A100 000 101 814.00 0.07EURCIE GENERALE MICHELIN 0.875 18-25 03/09A100 000 102 230.00 0.07EURCOENTR DE TR D'ELEC 0.875 17-24 29/09A300 000 307 371.00 0.22EURCREDIT AGRICOLE SA 1.75 19-29 05/03A500 000 510 760.00 0.37EURCREDIT MUTUEL ARKEA 3.375 19-31 11/03A100 000 102 985.00 0.07EURDANONE SA 0.709 16-24 03/11A500 000 511 765.00 0.37EURHOLDING INFRASTRUCTUR 0.625 17-23 27/03A400 000 395 252.00 0.28EURHSBC FRANCE 0.2000 18-21 04/09A400 000 402 352.00 0.29EURHSBC FRANCE 1.3750 18-28 04/09A200 000 210 638.00 0.15EURIMERYS SA 1.50 17-27 15/01A200 000 201 362.00 0.14EURINFRA PARK SAS 1.6250 18-28 19/04A300 000 304 893.00 0.22EURORANGE SA 1.375 18-28 20/03A600 000 620 040.00 0.44EURORANGE SA 1.875 18-30 12/09A600 000 638 202.00 0.46EURORANGE SA 1.1250 19-24 15/07A600 000 622 764.00 0.45EURRCI BANQUE EMTN 0.25 18-21 12/07A300 000 300 720.00 0.22EURRCI BANQUE EMTN 1.125 14-19 30/09A300 000 302 043.00 0.22EURRTE EDF TRANSPORT SA 1.875 17-37 23/10A400 000 430 788.00 0.31EURSANOFI 1.00 18-26 21/03A400 000 417 628.00 0.30EURSOCIETE GENERAL EMTN 2.25 13-20 23/01A400 000 408 040.00 0.29EURSOCIETE GENERALE SA 1.25 19-24 15/02A300 000 303 915.00 0.22EURSTE AUTOROUTES PARIS 1.625 17-32 13/01A400 000 418 604.00 0.30EURTOTAL CAPITAL INTL 2.50 14-26 25/03A400 000 459 868.00 0.33EURUBISOFT ENTERTAINMT 1.289 18-23 30/01A100 000 100 409.00 0.07EUR
ALLEMAGNE 176 0.00 17-22 07/10U1 000 000 1 020 540.00 0.73EUR
GERMANY/ALLEMAGNE 11 614 647.76 8.32
COMMERZBANK AG 4.00 16-26 23/03A190 000 202 806.00 0.15EURCOMMERZBK 1.5 18-28 28/08A156 000 159 318.12 0.11EURCRH FINANCE GERMANY 1.75 14-21 16/07A500 000 518 900.00 0.37EURDEUTSCHE BANK 1.50 17-22 20/01A500 000 503 210.00 0.36EURDEUTSCHE TELEKO 1.7500 19-31 25/03A139 000 142 012.13 0.10EUREUROGRID 1.875 15-25 10/06A200 000 214 136.00 0.15EUREUROGRID GMBH 1.50 16-28 18/04A1 100 000 1 135 134.00 0.82EURGERMANY -05- 4.00 05-37 04/01A400 000 657 956.00 0.47EURHANNOVER RUECK SE 1.125 18-28 18/04A200 000 207 142.00 0.15EURHEIDELBERG CEMENT 1.50 16-25 07/02A300 000 309 474.00 0.22EURHEIDELBERGCEMENT 2.25 16-23 30/03A350 000 372 589.00 0.27EURKRED.WIEDERAUFBAU 0.625 15-25 15/01A1 100 000 1 146 849.00 0.83EURLANXESS 1.125 18-25 16/05A150 000 154 387.50 0.11EURMAHLE GMBH 2.50 14-21 14/05A230 000 236 311.20 0.17EURMAHLE GMBH REGS 2.375 15-22 20/05A670 000 689 101.70 0.49EURMUNICH RE 6.25 12-42 26/05A200 000 235 114.00 0.17EURMUNICH RE 6.625 12-42 26/05A500 000 661 007.31 0.47GBPSYMRISE AG REGS 1.75 14-19 10/07A1 000 000 1 004 560.00 0.72EURTELEFONICA DEUTSCH FI 1.75% 18-25 05/07A100 000 102 520.00 0.07EURTHYSSENKRUPP AG 2.75 16-21 08/03A200 000 206 150.00 0.15EURVIER GAS TRANSPORT 2.00 13-20 12/06A200 000 205 136.00 0.15EURVOLKSWAGEN BANK 1.2500 18-24 10/06A700 000 694 974.00 0.50EURVOLKSWAGEN FIN SER 0.875 18-23 12/04A105 000 104 675.55 0.07EURVOLKSWAGEN FIN SERV 1.5 19-24 01/10A605 000 606 119.25 0.43EURVOLKSWAGEN LEASING 1.6250 18-25 15/08A125 000 124 525.00 0.09EUR
CREDIT SUISSE GR FDG 1.25 15-22 14/04A800 000 822 136.00 0.59EUR
GUERNSEY/ILE DE GUERNESEY 822 136.00 0.59
Schedule of investments as at 31/03/2019 / Inventaire du portefeuille au 31/03/2019
EUR
Market ValueNumber of Shares orNominal Value
Investment % of Net AssetsQuotationCurrency
Valeur de marchéNombre d'actions ouvaleur nominale
Investissement % de l'actif netDevise decotation

The accompanying notes form an integral part of these financial statements.Les notes annexées font partie intégrante de ces états financiers.
228 PrivilEdge - NN IP Euro Credit · 31/03/2019
ARION BANKI HF 1.625 16-21 01/12A500 000 507 620.00 0.36EUR
ICELAND/ISLANDE 1 197 897.00 0.86
LANDSBANKI HF 1.00 17-23 30/05A700 000 690 277.00 0.50EUR
AIB GROUP PLC 1.50 18-23 29/03A200 000 201 874.00 0.14EUR
IRELAND/IRLANDE 716 154.00 0.51
GE CAP EUR FD EMTN 2.25 13-20 20/07A500 000 514 280.00 0.37EUR
ASSICURAZ GENERALI 7.75 12-42 12/12A400 000 476 296.00 0.34EUR
ITALY/ITALIE 2 772 898.00 1.99
ATLANTIA SPA 1.875 17-27 13/07A200 000 190 026.00 0.14EURAUTOSTRADE 1.875 15-25 04/11A300 000 295 605.00 0.21EURENI SPA 0.625 16-24 19/09A200 000 202 122.00 0.14EURENI SPA 1.125 16-28 19/09A400 000 403 276.00 0.29EURINTESA SAN PAOLO 1.125 15-22 04/03A500 000 505 680.00 0.37EURINTESA SANPAOLO EMTN 1.125 15-20 14/01A200 000 201 844.00 0.14EURINTESA SANPAOLO SPA 1.75 18-28 20/03A100 000 96 641.00 0.07EURUNICREDIT 1.50 14-19 19/06A400 000 401 408.00 0.29EUR
TAKEDA PHARMACE 2.2500 18-26 21/11A1 855 000 1 992 214.35 1.43EUR
JAPAN/JAPON 1 992 214.35 1.43
AROUNDTOWN 2.0 18-26 02/05A100 000 101 415.00 0.07EUR
LUXEMBOURG/LUXEMBOURG 2 514 483.60 1.80
AROUNDTOWN SA 1.625 18-28 31/01A100 000 95 983.00 0.07EURATF NETHERLANDS B.V. 1.875 17-26 19/01A100 000 101 254.00 0.07EURCNH IND FIN 2.875 16-23 17/05S1 000 000 1 080 530.00 0.78EURCNH INDUSTRIAL 1.7500 19-27 25/03A515 000 516 565.60 0.37EURGRAND CITY PRO 1.50 18-27 22/02A100 000 98 983.00 0.07EURGRAND CITY PROPERTIES 1.375 17-26 03/08A100 000 99 273.00 0.07EURHARMAN FINANCE 2.00 15-22 27/05A400 000 420 480.00 0.30EUR
AMERICA MOVIL 4.125 11-19 25/10A1 000 000 1 023 700.00 0.73EUR
MEXICO/MEXIQUE 1 231 908.00 0.88
FOMENTO ECONOMICO 1.75 16-23 20/03A200 000 208 208.00 0.15EUR
BNZ INT FUNDING 0.50 18-23 13/05A200 000 200 728.00 0.14EUR
NEW ZEALAND/NOUVELLE ZELANDE 200 728.00 0.14
STATKRAFT 1.125 17-25 20/03A400 000 414 672.00 0.30EUR
NORWAY/NORVÈGE 414 672.00 0.30
BRISA CONC RODOVIARIA 2.375 17-27 10/05A500 000 543 515.00 0.39EUR
PORTUGAL/PORTUGAL 543 515.00 0.39
DBS GROUP HLDGS 1.5000 18-28 11/04A250 000 250 155.00 0.18EUR
SINGAPORE/SINGAPOUR 250 155.00 0.18
BANCO DE SABADELL SA 0.875 17-23 05/03A200 000 198 560.00 0.14EUR
SPAIN/ESPAGNE 5 910 185.00 4.23
BANKIA 1.125 15-22 05/08A300 000 311 637.00 0.22EURBANKIA SA 0.8750 19-24 25/03A100 000 100 583.00 0.07EURCAIXABANK S.A 18-23 24/10A700 000 712 516.00 0.51EURCAIXABANK SA 1.125 17-24 17/05A700 000 712 166.00 0.51EURCAIXABANK S.A. 1.125 19-26 27/03A300 000 300 417.00 0.22EURINMOB COLONIAL 2.50 17-29 28/11A100 000 102 298.00 0.07EURMETROVASECA EMTN 2.375 16-22 23/05A100 000 105 118.00 0.08EURPITCH1 5.125 07-22 20/07A400 000 465 020.00 0.33EURSANTANDER ISSUANCES 2.50 15-25 18/03A400 000 416 172.00 0.30EURTEEFONICA EMISIONES 1.069 19-24 05/02A1 000 000 1 023 640.00 0.74EUR
Schedule of investments as at 31/03/2019 / Inventaire du portefeuille au 31/03/2019
EUR
Market ValueNumber of Shares orNominal Value
Investment % of Net AssetsQuotationCurrency
Valeur de marchéNombre d'actions ouvaleur nominale
Investissement % de l'actif netDevise decotation

The accompanying notes form an integral part of these financial statements.Les notes annexées font partie intégrante de ces états financiers.
229PrivilEdge - NN IP Euro Credit · 31/03/2019
TELEFONICA EMIS 1.7880 19-29 12/03A600 000 614 733.00 0.44EURTELEFONICA EMIS REGS 2.932 14-29 17/10A100 000 114 199.00 0.08EURTELEFONICA EMISION 1.46 16-26 13/04A500 000 517 030.00 0.37EURTELEFONICA EMISION 2.318 17-28 17/10A200 000 216 096.00 0.15EUR
ATLAS COPCO AB 0.625 16-26 30/08A250 000 250 265.00 0.18EUR
SWEDEN/SUÈDE 617 152.20 0.44
SCA HYGIENE AB 1.125 17-24 27/03A100 000 103 411.00 0.07EURTELIA COMPANY AB 2.125 19-34 20/02A255 000 263 476.20 0.19EUR
GIVAUDAN AG 2 18-30 17/09A1 100 000 1 193 929.00 0.85EUR
SWITZERLAND/SUISSE 2 433 567.00 1.74
GIVAUDAN AG 1.125 18-25 17/09A700 000 725 123.00 0.52EURUBS GROUP FUNDING 1.50 16-24 30/11A500 000 514 515.00 0.37EUR
ABN AMRO 0.875 19-24 15/01A200 000 205 266.00 0.15EUR
THE NETHERLANDS/PAYS-BAS 14 842 264.01 10.62
ABN AMRO BANK N 0.5000 18-23 17/07A185 000 187 423.50 0.13EURBAYER CAPITAL CORP 1.5 18-26 26/06A600 000 607 680.00 0.44EURBMW FIN NV 0.125 16-20 15/04A50 000 50 176.50 0.04EURBMW FINANCE NV 1 18-24 14/11A960 000 983 644.80 0.70EURBMW FINANCE NV 1.0 18-25 29/08A40 000 40 651.60 0.03EURBMW FINANCE NV 0.5000 18-22 22/11A250 000 252 590.00 0.18EURBMW FINANCE NV 1.5000 19-29 06/02A1 405 000 1 430 571.00 1.02EURCNH INDUSTRIAL 1.8750 18-26 19/01A490 000 503 318.20 0.36EURDE VOLKSBANK NV 3.75 15-25 05/11A200 000 209 050.00 0.15EURDEUT TELEKOM INTL FIN 1.125 17-26 22/05A400 000 412 132.00 0.30EURDEUTSCHE TELEKOM I 0.875 17-24 30/01A800 000 821 384.00 0.59EUREDP FINANCE 1.875 18-25 12/10A529 000 556 978.81 0.40EUREDP FINANCE EMTN 2.625 14-22 18/01A250 000 267 730.00 0.19EUREDP FINANCE EMTN 4.125 13-21 20/01A200 000 215 200.00 0.15EURENEL FINANCE INTL 1.125 18-26 16/09A300 000 302 439.00 0.22EURGAS NAT FENOSA 0.875 17-25 15/05A600 000 607 422.00 0.43EURING 0.75 15-20 24/11A300 000 304 521.00 0.22EURING GROEP 2.0 18-28 20/09A100 000 105 092.00 0.08EURINGREGS 0.70 15-20 16/04A300 000 302 787.00 0.22EURINNOGY FINANCE 1.25 17-27 19/10A400 000 409 968.00 0.29EURINNOGY FINANCE BV 1.50 18-29 31/07A305 000 312 496.90 0.22EURNIBC BANK 1.50 17-22 31/01A100 000 101 792.00 0.07EURNIBC BANK NV 1.1250 18-23 19/04A100 000 99 451.00 0.07EURRABOBANK NEDERLAND 4.125 10-20 14/01A500 000 517 185.00 0.37EURRELX FINANCE BV 1.50 18-27 13/05A400 000 412 628.00 0.30EURREPSOL INTL FIN 2.625 13-20 28/05A300 000 309 516.00 0.22EURRWE AG EMTN 5.75 03-33 14/02A400 000 595 260.00 0.43EURSIEMENS FIN 0.30 19-24 28/02A925 000 933 214.00 0.67EURSIEMENS FIN. 0.9 19-28 28/02A115 000 116 874.50 0.08EURSIEMENS FINANCI 1.0000 18-27 06/09A180 000 186 352.20 0.13EURUNILEVER NV 0.50 16-24 29/04A300 000 305 874.00 0.22EURUNILEVER NV -EMTN- 0.375 17-23 14/02A700 000 711 361.00 0.51EURVOLKSWAGEN INTL FIN NV 3.25 18-30 18/11A400 000 422 028.00 0.30EURVONOVIA FINANCE 1.125 17-25 08/09A400 000 403 140.00 0.29EURVONOVIA FINANCE BV 1.5 18-28 14/01A100 000 101 891.00 0.07EURVONOVIA FINANCE BV 2.25 15-23 15/12A500 000 537 175.00 0.38EUR
ABBEY NAT TREAS.SERV 0.875 14-20 13/01A900 000 906 813.00 0.66EUR
UNITED KINGDOM/ROYAUME-UNI 10 331 090.22 7.40
ABBEY NATL 1.125 15-22 14/01A500 000 511 275.00 0.37EURABBEY NATL TREASURY 1.125 15-25 10/03A200 000 204 262.00 0.15EURANGLO AMER CAPITAL 1.625 19-26 06/03A215 000 216 623.25 0.16EUR
Schedule of investments as at 31/03/2019 / Inventaire du portefeuille au 31/03/2019
EUR
Market ValueNumber of Shares orNominal Value
Investment % of Net AssetsQuotationCurrency
Valeur de marchéNombre d'actions ouvaleur nominale
Investissement % de l'actif netDevise decotation

The accompanying notes form an integral part of these financial statements.Les notes annexées font partie intégrante de ces états financiers.
230 PrivilEdge - NN IP Euro Credit · 31/03/2019
ANZ NEW ZEALAND 1.125 18-25 20/03A400 000 410 904.00 0.29EURASB FINANCE 0.625 17-24 18/10A400 000 408 724.00 0.29EURBARCLAYS PLC 1.375 18-26 24/01A225 000 219 145.50 0.16EURBG ENERGY CAP REGS 2.25 14-29 21/11A200 000 228 000.00 0.16EURBP CAPITAL MARKETS 0.83 16-24 19/09A300 000 307 584.00 0.22EURBP CAPITAL MARKETS 5.56 16-24 25/01A200 000 208 134.00 0.15EURBP CAPITAL MARKETS 1.597 18-28 03/07A1 000 000 1 064 710.00 0.77EURBP CAPITAL PLC 1.953 16-25 03/03A800 000 871 216.00 0.62EURBRAMBLES FINANCE 1.500 17-27 04/10A100 000 102 000.00 0.07EURCREDIT AGRICOLE LDN 0.75 16-22 01/12A400 000 409 452.00 0.29EURCREDIT AGRICOLE LDN 1.375 18-25 13/03A400 000 411 800.00 0.29EURFCE BANK EMTN 1.134 15-22 10/02A125 000 123 412.50 0.09EURFCE BANK EMTN REGS 1.875 14-21 24/06A125 000 126 242.50 0.09EURFCE BANK PLC 1.66 16-21 11/02A100 000 100 714.00 0.07EURHSBC HOLDINGS PLC 1.5 18-24 04/12A205 000 211 598.95 0.15EURHSBC HOLDINGS PLC 3.00 15-25 30/06U300 000 333 108.00 0.24EURLLYODS BANK PLC 0.625 18-24 15/01A400 000 393 108.00 0.28EURMONDI FINANCE P 1.6250 18-26 27/04A422 000 434 820.36 0.31EURNGG FINANCE PLC 4.25 13-76 18/06A600 000 625 464.00 0.45EURTESCO 5.00 06-23 24/03A700 000 895 142.16 0.64GBPTESCO CORP 1.375 14-19 01/07A100 000 100 328.00 0.07EURTESCO CORPORATE 1.375 18-23 24/10A200 000 201 784.00 0.14EURUBS AG LONDON 1.125 15-20 30/06A300 000 304 725.00 0.22EUR
AT ET T 1.05 18-23 09/05A750 000 765 735.00 0.55EUR
UNITED STATES/ÉTATS-UNIS 15 683 879.88 11.22
AT&T INC 3.15 17-36 04/09A600 000 636 954.00 0.46EURAUTOLIV 0.75 18-23 26/06A530 000 530 445.20 0.38EURBANK OF AMERICA 2.375 14-24 19/06A400 000 437 508.00 0.31EURBERKSHIRE HATHAWAY 0.50 16-20 13/03A150 000 150 915.00 0.11EURBERKSHIRE HATHAWAY 0.75 15-23 16/03A350 000 358 529.50 0.26EURBERKSHIRE HATHAWAY 1.30 16-24 15/03A500 000 526 280.00 0.38EURBMW US CAPITAL 3.4000 18-21 13/08S450 000 406 536.93 0.29USDCELANESE CORP 3.25 14-19 15/10S300 000 305 181.00 0.22EURCELANESE US 1.25 17-25 11/025893 000 881 069.52 0.63EURCOCA COLA 1.875 14-26 22/09A200 000 219 072.00 0.16EURCOCA COLA 1.125 15-27 09/09A600 000 621 468.00 0.44EURCOCA-COLA CO/TH 0.7500 19-26 22/09A1 422 000 1 434 499.38 1.02EUREMERSON ELECTRIC CO 2.00 19-29 15/10A745 000 800 077.85 0.57EURENEXIS HOLDING NV 0.875 16-26 28/04A500 000 509 295.00 0.36EURENEXIS HOLDING NV 3.375 12-22 26/01A300 000 328 803.00 0.24EURGENERAL ELECTRIC CO 2.125 17-37 17/05A400 000 364 636.00 0.26EURGOLDMAN SACHS GROU 1.25 16-25 01/05A180 000 182 631.60 0.13EURGOLDMAN SACHS GROUP 1.375 17-24 15/05A400 000 408 784.00 0.29EURGOLDMAN SACHS GROUP 2.0 18-28 01/11A200 000 208 306.00 0.15EURIBM CORP 1.25 19-27 29/01A885 000 910 461.45 0.65EURIBM CORP 0.95 17-25 23/05A200 000 205 030.00 0.15EURINTL FLAVOR & F 1.8000 18-26 25/09A200 000 207 782.00 0.15EURJPM CHASE 0.625 16-24 25/01A200 000 201 996.00 0.14EURLIBERTY MUTUAL GROUP 2.75 16-26 04/05A100 000 108 800.00 0.08EURMC DONALD S REGD 2.375 12-24 27/11A400 000 439 524.00 0.31EURMET LIFE GLOBAL FDG 0.875 15-22 20/01A1 400 000 1 431 612.00 1.02EURMORGAN STANLEY 1.75 15-25 30/01A200 000 210 188.00 0.15EURMORGAN STANLEY 1.75 16-24 11/03A200 000 210 486.00 0.15EURPPG INDUSTRIES 0.00 16-19 03/11A400 000 400 228.00 0.29EURPPG INDUSTRIES INC 0.875 15-22 13/03A300 000 305 721.00 0.22EURPRAXAIR 1.625 14-25 01/12A505 000 547 162.45 0.39EURTIME WARNER 1.95 15-23 15/09A100 000 105 173.00 0.08EUR
Schedule of investments as at 31/03/2019 / Inventaire du portefeuille au 31/03/2019
EUR
Market ValueNumber of Shares orNominal Value
Investment % of Net AssetsQuotationCurrency
Valeur de marchéNombre d'actions ouvaleur nominale
Investissement % de l'actif netDevise decotation

The accompanying notes form an integral part of these financial statements.Les notes annexées font partie intégrante de ces états financiers.
231PrivilEdge - NN IP Euro Credit · 31/03/2019
WELLS FARGO CO 2.00 15-26 27/04A300 000 322 989.00 0.23EUR
ERSTE GROUP BANK AG FL.R 16-XX 15/10S400 000 456 916.00 0.33EUR
FLOATING RATE NOTES/OBLIGATIONS À TAUX VARIABLE 21 985 228.35 15.74
AUSTRIA/AUTRICHE 968 303.00 0.69
RAIFFEISEN BANK FL.R 14-25 21/02A400 000 411 464.00 0.29EURVOLKSBANK WIEN FL.R 17-27 06/10A100 000 99 923.00 0.07EUR
KBC GROUPE SA FL.R 19-99 31/12S400 000 401 176.00 0.29EUR
BELGIUM/BELGIQUE 616 068.00 0.44
SOLVAY SA FL.R 18-XX 04/03A200 000 214 892.00 0.15EUR
XLIT LTD FL.R 17-47 29/06A260 000 270 535.20 0.19EUR
BERMUDA/BERMUDES 270 535.20 0.19
BNP PARIBAS FL.R 14-26 20/03A1 300 000 1 354 002.00 0.98EUR
FRANCE/FRANCE 5 895 047.15 4.23
BNP PARIBAS FL.R 19-27 23/01A200 000 209 452.00 0.15EURBPCE FL.R 14-26 08/07A300 000 313 029.00 0.22EURCREDIT MUTUEL ARKEA FL.R 17-29 25/10A100 000 95 915.00 0.07EURORANGE EMTN FL.R 14-XX 01/10A100 000 107 550.00 0.08EURORANGE EMTN SUB REGS FL.R 14-XX 01/10A600 000 676 824.00 0.48EURORANGE SUB FL.R 14-XX 07/02A200 000 227 258.00 0.16EURTOTAL SA FL.R 15-XX 26/02A800 000 827 896.00 0.60EURTOTAL SA FL.R 15-XX 26/02A700 000 731 255.00 0.52EURTOTAL SA FL.R 16-XX 06/10A400 000 435 112.00 0.31EURTOTAL SA FL.R 16-49 18/05A100 000 108 832.00 0.08EURTOTAL SA FL.R 19-XX 04/04A805 000 807 922.15 0.58EUR
HANNOVER RE FL.R 14-XX 26/06A200 000 217 254.00 0.16EUR
GERMANY/ALLEMAGNE 843 774.00 0.60
MERCK KGAA SUB FL.R 14-74 12/12A600 000 626 520.00 0.44EUR
ISLANDSBANKI FL.R 18-24 19/01A225 000 221 868.00 0.16EUR
ICELAND/ISLANDE 221 868.00 0.16
CLOVERIE PLC SUB FL.R 09-39 24/07A400 000 409 284.00 0.29EUR
IRELAND/IRLANDE 409 284.00 0.29
HANNOVER FINANCE FL.R 10-40 14/09A200 000 215 390.00 0.15EUR
LUXEMBOURG/LUXEMBOURG 1 388 250.93 0.99
HANNOVER FINANCE FL.R 12-43 30/06A700 000 812 665.00 0.58EURSWISS RE FINANC -49 02/04S200 000 179 899.36 0.13USDSWISS RE FINANCE LUXEM FL.R 19-49 02/04S200 000 180 296.57 0.13USD
DNB BANK ASA FL.R 17-27 01/03A300 000 302 742.00 0.22EUR
NORWAY/NORVÈGE 302 742.00 0.22
BANCO BILBAO VI FL.R 19-29 22/02A200 000 202 954.00 0.15EUR
SPAIN/ESPAGNE 1 035 918.00 0.74
CAIXABANK SA FL.R 17-27 15/02A500 000 523 205.00 0.37EURCAIXABANK SA FL.R 17-28 14/07A100 000 101 503.00 0.07EURCAIXABANK SUB FL.R 17-XX 13/06A200 000 208 256.00 0.15EUR
SKANDINAVISKA ENSK FL.R 16-28 31/10A100 000 99 451.00 0.07EUR
SWEDEN/SUÈDE 99 451.00 0.07
CREDIT SUISSE GROU FL.R 17-25 17/07A300 000 303 744.00 0.22EUR
SWITZERLAND/SUISSE 1 438 584.00 1.03
UBS AG SUB FL.R 14-26 12/02A400 000 425 824.00 0.30EUR
Schedule of investments as at 31/03/2019 / Inventaire du portefeuille au 31/03/2019
EUR
Market ValueNumber of Shares orNominal Value
Investment % of Net AssetsQuotationCurrency
Valeur de marchéNombre d'actions ouvaleur nominale
Investissement % de l'actif netDevise decotation

The accompanying notes form an integral part of these financial statements.Les notes annexées font partie intégrante de ces états financiers.
232 PrivilEdge - NN IP Euro Credit · 31/03/2019
UBS GROUP FUNDI FL.R 18-25 17/04A700 000 709 016.00 0.51EUR
ABN AMRO BANK FL.R 17-28 27/03S200 000 179 804.96 0.13USD
THE NETHERLANDS/PAYS-BAS 4 903 214.77 3.52
ABN AMRO BANK NV FL.R 15-25 30/06A200 000 206 012.00 0.15EURAEGON NV 5.625 19-49 29/12S715 000 716 830.40 0.51EURARGENTUM NETHLD FL.R 15-50 15/08A810 000 755 377.21 0.54USDATRADIUS FIN SUB FL.R 14-44 23/09A620 000 667 653.20 0.48EURCOOP RABOBANK UA FL.R 16-49 26/04A200 000 218 160.00 0.16EURELM BV SUB FL.R 15-XX 01/09A280 000 291 261.60 0.21EUREVONIK FINANCE BV FL.R 16-21 08/03A300 000 300 624.00 0.22EURIBERDROLA INTL FL.R 17-XX 22/02A200 000 197 938.00 0.14EURRABOBANK NEDERLAND FL.R 15-XX 29/06S300 000 311 589.00 0.22EURSRLEV EMTN FL.R 11-41 15/04A405 000 460 598.40 0.33EURVOLKSWAGEN INTL FL.R 18-XX 27/06A200 000 197 554.00 0.14EURVW INTL FIN SUB FL.R 15-XX 20/03A400 000 399 812.00 0.29EUR
LLOYDS BANKING GROUP FL.R 18-28 07/09A200 000 197 066.00 0.14EUR
UNITED KINGDOM/ROYAUME-UNI 547 465.00 0.39
NATIONWIDE BLDG SO FL.R 18-26 08/03A350 000 350 399.00 0.25EUR
BANK OF AMERICA FL.R 17-22 07/02A700 000 708 239.00 0.51EUR
UNITED STATES/ÉTATS-UNIS 3 044 723.30 2.18
BANK OF AMERICA CO FL.R 17-25 07/02A400 000 414 164.00 0.30EURCITIGROUP INC FL.R 18-26 24/07A673 000 693 661.10 0.50EURJPMORGAN CHASE FL.R 19-27 11/03A310 000 312 765.20 0.22EURMORGAN STANLEY FL.R 17-26 23/10A900 000 915 894.00 0.65EUR
BANQUE FED CRED 0.7500 19-26 08/06A400 000 399 808.00 0.30EUR
Other transferable securities/Autres valeurs mobilières 12 409 974.44 8.88
BONDS/OBLIGATIONS 10 015 333.37 7.17
FRANCE/FRANCE 907 167.00 0.65
BFCM 1.75 19-29 15/03A100 000 103 058.00 0.07EURCAIXABANK SA 2.3750 19-24 01/02A100 000 104 384.00 0.07EURSOCIETE GENERAL 1.7500 19-29 22/03A100 000 100 047.00 0.07EURSOCIETE GENERALE 1.125 18-25 23/01A200 000 199 870.00 0.14EUR
VOLKSWAGEN BANK GMBH 1.25 19-22 01/08A500 000 507 920.00 0.36EUR
GERMANY/ALLEMAGNE 1 951 163.00 1.40
VOLKSWAGEN BANK GMBH 1.875 19-24 31/01A900 000 924 228.00 0.67EURVOLKSWAGEN BANK GMBH 2.50 19-26 31/07A500 000 519 015.00 0.37EUR
LANDSBANKINN 1.625 16-21 15/03A300 000 306 021.00 0.22EUR
ICELAND/ISLANDE 306 021.00 0.22
AIB 2.25 18-25 03/07A100 000 102 339.00 0.08EUR
IRELAND/IRLANDE 202 727.00 0.15
BK IRELAND 1.375 18-23 29/08A100 000 100 388.00 0.07EUR
INTESA SAN PAOLO 2.125 18-23 30/08A100 000 103 801.00 0.07EUR
ITALY/ITALIE 103 801.00 0.07
STATNETT SF 0.875 18-25 08/03A500 000 512 985.00 0.37EUR
NORWAY/NORVÈGE 512 985.00 0.37
ABERTIS INFRAES 2.3750 19-27 27/09A300 000 305 157.00 0.22EUR
SPAIN/ESPAGNE 2 237 379.00 1.59
ABERTIS INFRAES 3.0000 19-31 27/03A700 000 713 349.00 0.50EURCAIXABANK SA 0.75 18-23 18/04A300 000 302 835.00 0.22EUR
Schedule of investments as at 31/03/2019 / Inventaire du portefeuille au 31/03/2019
EUR
Market ValueNumber of Shares orNominal Value
Investment % of Net AssetsQuotationCurrency
Valeur de marchéNombre d'actions ouvaleur nominale
Investissement % de l'actif netDevise decotation

The accompanying notes form an integral part of these financial statements.Les notes annexées font partie intégrante de ces états financiers.
233PrivilEdge - NN IP Euro Credit · 31/03/2019
MERLIN PROPERTIES 1.875 16-26 02/11A100 000 101 118.00 0.07EURRED ELECT FINANCE 1.25 18-27 13/03A400 000 413 412.00 0.29EURSANTANDER CONSUMER 0.75 17-22 17/10A400 000 401 508.00 0.29EUR
FASTIGHETS AB BALD 1.875 17-26 23/01A100 000 99 019.00 0.07EUR
SWEDEN/SUÈDE 99 019.00 0.07
ENBW INTL FINAN 1.8750 18-33 31/10A415 000 444 871.70 0.32EUR
THE NETHERLANDS/PAYS-BAS 553 494.70 0.40
ING GROEP NV 2.5000 18-30 15/11A100 000 108 623.00 0.08EUR
ASB FINANCE LTD, LONDO 0.75 19-24 13/03A400 000 404 512.00 0.29EUR
UNITED KINGDOM/ROYAUME-UNI 1 460 637.11 1.05
DIAGEO FINANCE PLC 1 18-25 22/04A337 000 347 544.73 0.25EURUBS AG LONDON 0.25 18-22 10/01A500 000 502 645.00 0.36EURUBS LONDON 0.625 18-23 23/04A203 000 205 935.38 0.15EUR
EMERSON ELECTRIC 1.25 19-25 15/01A564 000 585 398.16 0.42EUR
UNITED STATES/ÉTATS-UNIS 1 680 939.56 1.20
PARKER HANNIFIN REGS 1.125 17-25 01/03A760 000 775 420.40 0.55EURTHERMO FISHER SCIEN 1.95 17-29 24/07A300 000 320 121.00 0.23EUR
MERCK KGAA FL.R 14-74 12/12A200 000 216 218.00 0.15EUR
FLOATING RATE NOTES/OBLIGATIONS À TAUX VARIABLE 2 394 641.07 1.71
GERMANY/ALLEMAGNE 216 218.00 0.15
CAIXABANK SA FL.R 18-30 17/04A300 000 288 633.00 0.21EUR
SPAIN/ESPAGNE 288 633.00 0.21
SHB 6.25 19-XX 01/03A200 000 179 145.92 0.13USD
SWEDEN/SUÈDE 179 145.92 0.13
ALLIANDER NV FL.R 18-49 31/12A335 000 335 150.75 0.24EUR
THE NETHERLANDS/PAYS-BAS 1 251 452.75 0.89
ING GROEP FL.R 17-29 26/09A200 000 196 296.00 0.14EURTENNET HOLDING BV FL.R 17-49 12/04A700 000 720 006.00 0.51EUR
NATIONWIDE BUILDING FL.R 17-29 25/07A100 000 98 560.00 0.07EUR
UNITED KINGDOM/ROYAUME-UNI 459 191.40 0.33
ROYAL BK SCOTLN FL.R 18-25 04/03A255 000 260 375.40 0.19EURROYAL BK SCOTLND FL.R 18-26 02/03A100 000 100 256.00 0.07EUR
ISLANDSBANKI 1.75 16-20 07/09A200 000 204 712.00 0.15EUR
Money market instruments/Instruments du marché monétaire 204 712.00 0.15
BONDS/OBLIGATIONS 204 712.00 0.15
ICELAND/ISLANDE 204 712.00 0.15
NN (L) LIQUID SICAV EUR Z7 002 7 009 772.22 5.02EUR
Shares of UCITS/UCI/Parts d'organismes de placement collectif 7 009 772.22 5.02
UCITS/UCI/Organismes de placement collectif 7 009 772.22 5.02
LUXEMBOURG/LUXEMBOURG 7 009 772.22 5.02
Schedule of investments as at 31/03/2019 / Inventaire du portefeuille au 31/03/2019
EUR
Market ValueNumber of Shares orNominal Value
Investment % of Net AssetsQuotationCurrency
Valeur de marchéNombre d'actions ouvaleur nominale
Investissement % de l'actif netDevise decotation

The accompanying notes form an integral part of these financial statements.Les notes annexées font partie intégrante de ces états financiers.
234 PrivilEdge - NN IP Euro Credit · 31/03/2019
ITRAXX XOVER S31 V1 MKT CITIBANKEUROPE PLC
(0.15)EUR (207 733.33)20/06/20241 900 000.00 Buy/Achat (1%)/Quarterly
Credit Default Swaps (CDS)/Credit Default Swaps (CDS) (0.17)(234 505.92)
GLENCORE INTL AG EUR SN MM M GOLDMAN SACHSINTERN.
0.06EUR 80 582.7820/06/2023500 000.00 Sell/Vente 5%/Quarterly
FORD MTR CR CO L USD SN XR M JP MORGANSECURITIES LD
(0.02)USD (21 062.15)20/12/2023200 000.00 Buy/Achat (5%)/Quarterly
ANGLO AMERN PLC EUR SN MM M MORGANSTANLEY AND COINTERN PLC
(0.06)EUR (86 293.22)20/06/2023500 000.00 Buy/Achat (5%)/Quarterly
Schedule of investments as at 31/03/2019 / Inventaire du portefeuille au 31/03/2019
EUR
Unrealised appreciation/(depreciation)
Description Counterparty % of NetAssets
Notional Maturity Currency Buy / SellProtection
Sub-FundReceives/(Pays)
Fixed RatePlus/(Moins) value non-
réaliséeDescription Contrepartie % de l'actif
netNominal Maturité Devise Achat /
VenteProtection
CompartimentReçoit/(Paie)
Taux Fixe
3 000 000.00 EUR EURIBOR 6 MONTHS 18 292.1712/12/2021 0.07%EUR 0.01GOLDMAN SACHSINTERN.
1 800 000.00 EUR EURIBOR 6 MONTHS 110 307.3423/08/2033 1.22%EUR 0.08GOLDMAN SACHSINTERN.
Interest rate swap (IRS)/Interest rate swap (IRS) 128 599.51 0.09
Sub-Fund receivesNominal Unrealisedappreciation/
(depreciation)
Currency Maturity Sub-Fund pays % of netassets
Counterparty
Compartiment reçoitNominal Plus-value/(moins-
value) nonréalisée
Devise Maturité Compartiment paie % de l'actifnet
Contrepartie
EUR
Futures Contracts/Contrats futures (0.01)(7 134.51)EURO BOBL FUTURE Caceis Bank (399 420.00) 0.00EUR (240.00)30/06/2019(3)EURO BUND FUTURE Caceis Bank (332 680.00) 0.00EUR 120.0030/06/2019(2)EURO SCHATZ FUTURE Caceis Bank 4 479 000.00 0.00EUR 8 800.0030/06/201940LONG GILT FUTURE-LIF Caceis Bank (300 266.91) 0.00GBP (5 593.59)30/06/2019(2)US 10 YEARS NOTE Caceis Bank (1 548 793.25) (0.01)USD (8 133.60)30/06/2019(14)US 5 YEARS NOTE-CBT Caceis Bank (206 310.95) 0.00USD (2 087.32)30/06/2019(2)
EUR EUR
Unrealised appreciation/(depreciation)
Underlying Intermediary % of NetAssets
Maturity Currency CommitmentNumber ofcontracts
Plus/(Moins) value non-réalisée
Sous-jacent Intermédiaire % de l'actifnet
Maturité Devise EngagementNombre decontrats

The accompanying notes form an integral part of these financial statements.Les notes annexées font partie intégrante de ces états financiers.
235PrivilEdge - NN IP Euro Credit · 31/03/2019
Schedule of investments as at 31/03/2019 / Inventaire du portefeuille au 31/03/2019
Forward Foreign Currency Exchange Contracts/Contrats de change à terme 0.16220 839.30EUR 189 433.68 0.00CHF (489.35)168 935.28 15/04/2019Caceis BankCHF 14 393 275.36 0.16EUR 223 019.4716 342 472.71 15/04/2019Caceis BankUSD 39 943.21 0.00EUR 346.5845 289.16 15/04/2019Caceis BankGBP 2 264 559.99 (0.01)EUR (16 264.06)1 938 204.86 15/04/2019Caceis BankEUR 1 412 161.00 0.01GBP 20 785.831 654 587.72 28/06/2019Morgan StanleyEUR 1 958 623.00 0.00USD (5 829.39)1 725 801.13 28/06/2019Morgan StanleyEUR 420 250.00 0.00USD (729.78)370 811.99 28/06/2019JP Morgan
EUR
Unrealised appreciation/(depreciation)
Currency % of NetAssets
Amount bought Maturity Currency Amount soldCounterparty
Plus/(Moins) value non-réalisée
Devise % de l'actifnet
Montant acheté Maturité Devise Montant venduContrepartie

236

PrivilEdgeis an investment company
with variable capital ("SICAV")incorporated in Luxembourg
PrivilEdgeest une société d’investissement
à capital variable ("SICAV")enregistrée au Luxembourg RCS Luxembourg B0181207
PrivilEdge –T. Rowe Price European High Yield Bond
Unaudited semi-annual report · Rapport semestriel non révisé
31.03.2019

The accompanying notes form an integral part of these financial statements.Les notes annexées font partie intégrante de ces états financiers.
238 PrivilEdge - T. Rowe Price European High Yield Bond · 31/03/2019
ASSETS/ACTIF
16 562 658.58Investments in securities at market value/Portefeuille-titres à la valeur de marché (2):( EUR )16 932 893.48Acquisition cost/Coût d'acquisition
428 483.06Cash and term deposits/Liquidité et dépôts à terme288 465.20Interest and dividends receivable, net/Intérêt et dividendes nets à recevoir
12.70Receivable on foreign exchange transactions, net/A recevoir sur opérations de change, net33 138.14Unrealised appreciation on forward foreign currency exchange contracts/Plus-value non réalisée sur contrats de change à
terme(2)
17 312 757.68LIABILITIES/PASSIF
330 000.00Payable on investments purchased/À payer sur achat de titres21 955.07Amounts payable on redemptions/Montants à payer sur rachats d'actions11 183.46Management and distribution fees payable/Commission de gestion et de distribution à payer (3)
3 490.25Taxes and expenses payable/Impôts et autres frais à payer366 628.78
16 946 128.90NET ASSET VALUE/VALEUR NETTE D'INVENTAIRE
Statement of net assets as at 31/03/2019 / État de l'actif net au 31/03/2019
NotesNotes EUR

The accompanying notes form an integral part of these financial statements.Les notes annexées font partie intégrante de ces états financiers.
239PrivilEdge - T. Rowe Price European High Yield Bond · 31/03/2019
Statement of operations and changes in net assets for the period from 01/10/2018 to 31/03/2019 / État desopérations et des variations de l'actif net pour la période du 01/10/2018 au 31/03/2019
NotesNotes EUR
118 010 343.33NET ASSET VALUE AT THE BEGINNING OF THE PERIOD/VALEUR NETTE D'INVENTAIRE AU DÉBUT DE LAPÉRIODE
INCOME/REVENUS
861 804.82Interest on bonds, net/Intérêts sur obligations, nets (2)1 487.81Bank interest/Intérêts bancaires
28 122.70Securities Lending Income/Revenus sur prêt de titres (9)891 415.33
EXPENSES/DÉPENSES
113 834.61Management fees/Commission de gestion (3)2 745.32Distribution fees/Frais de distribution (3)1 819.25Bank interest and other expenses/Intérêts bancaires débiteurs et autres frais
43 472.67Fixed Rate of Operational Costs/Taux Fixe de Coûts Opérationnels (4)161 871.85729 543.48NET INVESTMENT INCOME/REVENU NET SUR INVESTISSEMENTS
(6 365 819.83)Net realised loss on sale of investments/Perte nette réalisée sur ventes d'investissements (2)360 959.80Net realised gain on foreign exchange/Gain net réalisé sur opérations de change
(780 304.04)Net realised loss on forward foreign currency exchange contracts/Perte nette réalisée sur contrats de change à terme(6 055 620.59)NET REALISED LOSS/PERTE NETTE RÉALISÉE
5 118 422.10Change in net unrealised appreciation or depreciation on investments/Variation de la plus ou moins-value nette non réaliséesur investissements
(2)
397 259.25Change in net unrealised appreciation or depreciation on forward foreign currency exchange contracts/Variation de la plus oumoins-value nette non réalisée sur contrats de change à terme
(539 939.24)NET DECREASE IN NET ASSETS AS A RESULT OF OPERATIONS/DIMINUTION NETTE DE L'ACTIF NET RÉSULTANTDES OPÉRATIONS
(173 297.39)Dividend paid/Dividende payé(100 350 977.80)Net subscriptions/(redemptions) including equalisation/Souscriptions/(rachats) nets incluant la régularisation
16 946 128.90NET ASSET VALUE AT THE END OF THE PERIOD/VALEUR NETTE D'INVENTAIRE À LA FIN DE LA PÉRIODE

The accompanying notes form an integral part of these financial statements.Les notes annexées font partie intégrante de ces états financiers.
240 PrivilEdge - T. Rowe Price European High Yield Bond · 31/03/2019
77 594.1010 6 000.0000 0.0000 83 594.1010P - USD - Hedged - Capitalisation13 700.0000 4 000.0000 (5 000.0000) 12 700.0000P - CHF - Hedged - Capitalisation76 214.8360 0.0000 (56 837.8360) 19 377.0000P - EUR - Capitalisation
114 155.8760 0.0000 (107 955.8760) 6 200.0000I - CHF - Hedged - Capitalisation17 000.0000 0.0000 (17 000.0000) 0.0000I - EUR - Capitalisation
409 050.6530 0.0000 (96 007.7910) 313 042.8620M - USD - Hedged - Capitalisation1 801 705.3720 53 500.0000 (1 566 158.3720) 289 047.0000M - CHF - Hedged - Capitalisation
10 000.0000 0.0000 0.0000 10 000.0000M - CHF - Hedged - Distribution5 834 630.4965 52 111.0110 (5 243 697.9660) 643 043.5415M - EUR - Capitalisation1 132 795.0000 67 030.0000 (923 132.0800) 276 692.9200M - EUR - Distribution
40 350.0000 0.0000 (34 850.0000) 5 500.0000M - GBP - Hedged - Capitalisation408 973.1500 2 000.0000 (370 964.0000) 40 009.1500M - GBP - Hedged - Distribution704 040.9390 0.0000 (704 040.9390) 0.0000N - CHF - Hedged - Capitalisation
1 254 730.0000 0.0000 (1 254 730.0000) 0.0000N - EUR - Capitalisation527 010.0000 0.0000 (407 010.0000) 120 000.0000N - EUR - Distribution
Statement of changes in the number of shares outstanding for the period from 01/10/2018 to 31/03/2019 / Étatdes variations du nombre d'actions pour la période du 01/10/2018 au 31/03/2019
Number of Shares01/10/2018/
Nombre d'actions01/10/2018
Number of Sharesissued/
Nombre d'actionsémises
Number of Sharesredeemed/
Nombre d'actionsrachetées
Number of Shares31/03/2019/
Nombre d'actions31/03/2019
30/09/201831/03/2019For the period ended/Pour la période clôturée au
Statistics / Statistiques
P - USD - Hedged - Capitalisation
838 128.9910.0262
770 718.829.9327
Net Asset Value/Valeur Nette d'InventaireNet Asset Value per share/Valeur Nette d'Inventaire par action
USD USD
P - CHF - Hedged - Capitalisation
121 844.749.5941
132 470.679.6694
Net Asset Value/Valeur Nette d'InventaireNet Asset Value per share/Valeur Nette d'Inventaire par action
CHF CHF
P - EUR - Capitalisation
187 186.499.6602
740 214.219.7122
Net Asset Value/Valeur Nette d'InventaireNet Asset Value per share/Valeur Nette d'Inventaire par action
EUR EUR
I - CHF - Hedged - Capitalisation
60 117.899.6964
1 111 272.319.7347
Net Asset Value/Valeur Nette d'InventaireNet Asset Value per share/Valeur Nette d'Inventaire par action
CHF CHF

The accompanying notes form an integral part of these financial statements.Les notes annexées font partie intégrante de ces états financiers.
241PrivilEdge - T. Rowe Price European High Yield Bond · 31/03/2019
30/09/201831/03/2019For the period ended/Pour la période clôturée au
Statistics / Statistiques
I - EUR - Capitalisation
0.000.0000
166 215.279.7774
Net Asset Value/Valeur Nette d'InventaireNet Asset Value per share/Valeur Nette d'Inventaire par action
EUR EUR
M - USD - Hedged - Capitalisation
3 158 925.5410.0910
4 078 768.219.9713
Net Asset Value/Valeur Nette d'InventaireNet Asset Value per share/Valeur Nette d'Inventaire par action
USD USD
M - CHF - Hedged - Capitalisation
2 791 148.789.6564
17 489 500.759.7072
Net Asset Value/Valeur Nette d'InventaireNet Asset Value per share/Valeur Nette d'Inventaire par action
CHF CHF
M - CHF - Hedged - Distribution
92 703.999.2704
0.37
97 071.879.7072
0.00
Net Asset Value/Valeur Nette d'InventaireNet Asset Value per share/Valeur Nette d'Inventaire par actionDividend per share paid to shareholders/Dividende par action payé aux actionnaires
CHF CHF
M - EUR - Capitalisation
6 252 111.359.7227
56 887 166.779.7499
Net Asset Value/Valeur Nette d'InventaireNet Asset Value per share/Valeur Nette d'Inventaire par action
EUR EUR
M - EUR - Distribution
2 583 222.839.3361
0.37
11 044 656.339.7499
0.00
Net Asset Value/Valeur Nette d'InventaireNet Asset Value per share/Valeur Nette d'Inventaire par actionDividend per share paid to shareholders/Dividende par action payé aux actionnaires
EUR EUR
M - GBP - Hedged - Capitalisation
54 130.879.8420
396 529.829.8273
Net Asset Value/Valeur Nette d'InventaireNet Asset Value per share/Valeur Nette d'Inventaire par action
GBP GBP
M - GBP - Hedged - Distribution
377 837.159.4438
0.38
4 019 102.809.8273
0.00
Net Asset Value/Valeur Nette d'InventaireNet Asset Value per share/Valeur Nette d'Inventaire par actionDividend per share paid to shareholders/Dividende par action payé aux actionnaires
GBP GBP

The accompanying notes form an integral part of these financial statements.Les notes annexées font partie intégrante de ces états financiers.
242 PrivilEdge - T. Rowe Price European High Yield Bond · 31/03/2019
30/09/201831/03/2019For the period ended/Pour la période clôturée au
Statistics / Statistiques
N - CHF - Hedged - Capitalisation
0.000.0000
6 847 810.709.7264
Net Asset Value/Valeur Nette d'InventaireNet Asset Value per share/Valeur Nette d'Inventaire par action
CHF CHF
N - EUR - Capitalisation
0.000.0000
12 257 768.619.7692
Net Asset Value/Valeur Nette d'InventaireNet Asset Value per share/Valeur Nette d'Inventaire par action
EUR EUR
N - EUR - Distribution
1 120 951.409.3413
0.39
5 148 491.499.7692
0.00
Net Asset Value/Valeur Nette d'InventaireNet Asset Value per share/Valeur Nette d'Inventaire par actionDividend per share paid to shareholders/Dividende par action payé aux actionnaires
EUR EUR

The accompanying notes form an integral part of these financial statements.Les notes annexées font partie intégrante de ces états financiers.
243PrivilEdge - T. Rowe Price European High Yield Bond · 31/03/2019
Investments in securities at market value/Portefeuille-titres à la valeur de marché 16 562 658.58 97.74
VRX ESCROW 4.50 15-23 15/05S150 000 151 666.50 0.89EUR
Transferable securities admitted to an official stock exchange listing and/or dealt in on anotherregulated market/Valeurs mobilières admises à la cote officielle d'une bourse de valeurs et/ounégociées sur un autre marché réglementé
14 968 977.93 88.34
BONDS/OBLIGATIONS 13 645 922.31 80.53
CANADA/CANADA 151 666.50 0.89
EUROPCAR REGS 4.125 17-24 15/11S250 000 250 587.50 1.48EUR
FRANCE/FRANCE 737 813.50 4.35
LOUVRE BIDCO SAS 4.25 17-24 30/09S350 000 337 165.50 1.98EURNEWCO GB SAS PIK 8.00 17-22 15/12S145 000 150 060.50 0.89EUR
KIRK BEAUTY ONE REGS 8.75 15-23 15/07S300 000 206 793.00 1.22EUR
GERMANY/ALLEMAGNE 631 035.85 3.72
KME AG 6.75 18-23 01/02S200 000 188 124.00 1.11EURUNITYMEDIA GMBH 6.125 14-25 15/01S255 000 236 118.85 1.39USD
SMURFIT KAPPA ACQ 2.875 18-26 15/01S150 000 156 399.00 0.92EUR
IRELAND/IRLANDE 156 399.00 0.92
INTESA SAN PAOLO 3.928 14-26 15/09A150 000 157 705.50 0.93EUR
ITALY/ITALIE 710 396.50 4.19
N AND W GLOBAL VEND 7.00 16-23 15/10S425 000 450 857.00 2.66EURTELECOM ITALIA SPA 3.00 16-25 30/09A100 000 101 834.00 0.60EUR
AA BOND CO LTD 5.50 15-22 31/07S400 000 412 770.10 2.45GBP
JERSEY/JERSEY 1 335 354.60 7.88
AVIS BUDGET 4.75 18-26 04/10S100 000 102 336.00 0.60EURAVIS BUDGET FINANCE 4.50 17-25 15/05S250 000 259 720.00 1.53EURLHC THREE PLC 4.125 17-24 15/08S350 000 356 352.50 2.10EURLINCOLN FINANCE REGS 6.875 16-21 15/04S200 000 204 176.00 1.20EUR
ALTICE FINANCING 144A 7.50 16-26 15/05S200 000 176 835.73 1.04USD
LUXEMBOURG/LUXEMBOURG 2 594 771.16 15.32
ALTICE FINCO REGS 6.25 15-25 15/02S400 000 370 024.00 2.18EURCABOT FINANCIAL LU 7.50 16-23 01/10S450 000 513 570.27 3.04GBPCODERE FIN LUX 6.75 16-21 01/11S200 000 196 168.00 1.16EURDEA FINANCE REG S 7.50 16-22 15/10S150 000 156 390.00 0.92EURGARFUNKELUX REGS 8.50 15-22 01/11S150 000 157 767.21 0.93GBPINEOS GROUP HOLDIN 5.375 16-24 01/08S150 000 154 590.00 0.91EURINTRALOT CAP LU 6.75 16-21 15/09S200 000 150 330.00 0.89EURINTRALOT CAPITAL LUX 5.25 17-24 15/09S150 000 86 902.50 0.51EURLHMC FINCO SARL 6.2500 18-23 20/12S430 000 455 473.20 2.70EURLSF10 WOL INVEST 5.00 18-24 15/03S175 000 176 720.25 1.04EUR
ALTICE FRANCE S 5.8750 18-27 01/02S185 000 191 184.55 1.13EUR
THE NETHERLANDS/PAYS-BAS 2 285 728.93 13.50
CONSTELLIUM 4.25 17-26 15/02S425 000 434 116.25 2.57EURDARLING GLOBAL FIN 3.625 18-26 15/05S225 000 234 281.25 1.38EURDIGI COMM NV REG SHS 5.00 16-23 15/10S255 000 265 493.25 1.57EURPETROBRAS GLOBAL FIN 8.75 16-26 23/05S300 000 315 913.08 1.86USDPROMONTORIA HLDG 6.75 18-23 15/08S385 000 391 333.25 2.32EURSIGMA HOLDCO B.V 5.75 18-26 15/05S265 000 249 529.30 1.47EURSUNSHINE MID BV 6.5 18-26 15/05S200 000 203 878.00 1.20EUR
Schedule of investments as at 31/03/2019 / Inventaire du portefeuille au 31/03/2019
EUR
Market ValueNumber of Shares orNominal Value
Investment % of Net AssetsQuotationCurrency
Valeur de marchéNombre d'actions ouvaleur nominale
Investissement % de l'actif netDevise decotation

The accompanying notes form an integral part of these financial statements.Les notes annexées font partie intégrante de ces états financiers.
244 PrivilEdge - T. Rowe Price European High Yield Bond · 31/03/2019
ARQIVA 6.75 18-23 01/10S150 000 185 539.05 1.09GBP
UNITED KINGDOM/ROYAUME-UNI 1 852 939.47 10.93
DRAX FINCO PLC 4.25 17-22 01/05S275 000 320 834.40 1.89GBPHEATHROW FIN REGS 5.75 14-25 03/03S150 000 186 599.16 1.10GBPICELAND BONDCO 4.625 17-25 15/03S150 000 152 202.04 0.90GBPINTER GAME TECH 144A 6.50 15-25 15/02S200 000 185 796.86 1.10USDMILLER HOMES GRP HLDS 5.50 17-24 15/10S150 000 173 111.87 1.02GBPPINNACLE BIDCO PLC 6.375 18-25 15/02S235 000 281 274.57 1.66GBPVIRGIN MEDIA REGS 6.375 14-24 15/10S100 000 121 338.05 0.72GBPVIRGIN MEDIA SECURED 6.25 14-29 28/03S200 000 246 243.47 1.45GBP
ALLIANCE DATA SYST 5.25 15-23 15/11S200 000 208 138.00 1.23EUR
UNITED STATES/ÉTATS-UNIS 3 189 816.80 18.83
AMC ENTERT HLDG 6.375 17-24 15/11S250 000 283 477.43 1.67GBPAVANTOR INC 4.75 17-24 01/10S250 000 261 035.00 1.54EURCATALENT PHARMA 4.75 16-24 15/12S100 000 104 626.00 0.62EURCOLFAX CORP 3.25 17-25 15/05S200 000 204 996.00 1.21EURENERGIZER GAMMA 4.6250 18-26 15/07S235 000 242 301.45 1.43EURFEDERAL MOGUL REGS 5.00 17-24 15/07S200 000 209 954.00 1.24EURFINANCIAL 4.5 18-26 01/10S125 000 126 340.00 0.75EURKRATON POLYMERS 5.2500 18-26 15/05S300 000 305 139.00 1.81EURKRONOS INTL 3.75 17-25 15/09S100 000 95 384.00 0.56EURNETFLIX 3.625 17-27 05/02S200 000 207 292.00 1.22EURNETFLIX INC 4.625 18-29 15/05S200 000 213 784.00 1.26EURPVR CORP 3.125 17-27 15/12S100 000 101 935.00 0.60EURSCIENTIFIC GAMES INTL 3.375 18-26 15/02S100 000 96 880.00 0.57EURSILGAN HOLDING INC 3.25 17-25 15/03S200 000 207 100.00 1.22EURUGI INTERNATION 3.2500 18-25 01/11S150 000 155 935.50 0.92EURWMG ACQUISITION 4.125 16-24 01/11S157 500 165 499.42 0.98EUR
BANK OF IRELAND GR FL.R 17-27 19/09A100 000 111 664.15 0.66GBP
FLOATING RATE NOTES/OBLIGATIONS À TAUX VARIABLE 1 323 055.62 7.81
IRELAND/IRLANDE 111 664.15 0.66
UNICREDIT SPA FL.R 17-49 03/12S250 000 243 780.00 1.44EUR
ITALY/ITALIE 243 780.00 1.44
ARD FINANCE PIK FL.R 17-23 15/09S450 000 457 551.00 2.70EUR
LUXEMBOURG/LUXEMBOURG 457 551.00 2.70
BANCO COMERCIAL PORT FL.R 17-27 07/12A300 000 289 617.00 1.71EUR
PORTUGAL/PORTUGAL 289 617.00 1.71
CAIXABANK SA FL.R 17-28 14/07A100 000 101 503.00 0.60EUR
SPAIN/ESPAGNE 101 503.00 0.60
BARCLAYS BANK RCI SUB FL.R 08-XX 29/11A100 000 118 940.47 0.70GBP
UNITED KINGDOM/ROYAUME-UNI 118 940.47 0.70
RESIDOMO SRD 3.375 17-24 15/10S150 000 152 550.00 0.90EUR
Other transferable securities/Autres valeurs mobilières 1 593 680.65 9.40
BONDS/OBLIGATIONS 1 443 395.65 8.51
CZECH REPUBLIC/RÉPUBLIQUE TCHÈQUE 152 550.00 0.90
LOXAM SAS 6.00 17-25 15/04S300 000 316 311.00 1.86EUR
FRANCE/FRANCE 401 518.00 2.36
PAPREC 4.0 18-25 29/03S100 000 85 207.00 0.50EUR
Schedule of investments as at 31/03/2019 / Inventaire du portefeuille au 31/03/2019
EUR
Market ValueNumber of Shares orNominal Value
Investment % of Net AssetsQuotationCurrency
Valeur de marchéNombre d'actions ouvaleur nominale
Investissement % de l'actif netDevise decotation

The accompanying notes form an integral part of these financial statements.Les notes annexées font partie intégrante de ces états financiers.
245PrivilEdge - T. Rowe Price European High Yield Bond · 31/03/2019
JAMES HARDIE INTL FIN 3.625 18-26 01/10S175 000 178 886.75 1.06EUR
IRELAND/IRLANDE 178 886.75 1.06
PLAYTECH PLC 4.25 19-26 07/03S100 000 102 372.00 0.60EUR
ISLE OF MAN/ILE DE MAN 102 372.00 0.60
LINCOLN FINANCING S.A 3.625 19-24 01/04S140 000 141 496.60 0.83EUR
LUXEMBOURG/LUXEMBOURG 307 991.20 1.82
ODYSSEY EUR HLD 8 18-23 15/05S170 000 166 494.60 0.99EUR
INTERXION HOLDING 4.7500 18-27 15/06S100 000 106 291.00 0.63EUR
THE NETHERLANDS/PAYS-BAS 106 291.00 0.63
PANTHER BF AGGREGATOR 4.375 19-26 15/05S190 000 193 786.70 1.14EUR
UNITED STATES/ÉTATS-UNIS 193 786.70 1.14
FIRE BC FL.R 18-24 28/09Q150 000 150 285.00 0.89EUR
FLOATING RATE NOTES/OBLIGATIONS À TAUX VARIABLE 150 285.00 0.89
LUXEMBOURG/LUXEMBOURG 150 285.00 0.89
Schedule of investments as at 31/03/2019 / Inventaire du portefeuille au 31/03/2019
EUR
Market ValueNumber of Shares orNominal Value
Investment % of Net AssetsQuotationCurrency
Valeur de marchéNombre d'actions ouvaleur nominale
Investissement % de l'actif netDevise decotation
Forward Foreign Currency Exchange Contracts/Contrats de change à terme 0.2033 138.14CHF 2 688 841.37 0.25EUR 42 577.343 053 998.04 15/04/2019Caceis BankUSD 3 509 359.04 0.18EUR 30 581.873 979 195.47 15/04/2019Caceis BankEUR 205 779.80 0.01GBP 1 101.53239 803.28 15/04/2019Caceis BankGBP 743 749.67 (0.03)EUR (5 313.20)636 589.30 15/04/2019Caceis BankUSD 42 660.24 0.00EUR (12.56)48 000.00 30/04/2019Goldman SachsEUR 386 321.36 0.03GBP 4 536.85452 430.51 30/04/2019Deutsche BankEUR 1 137 000.00 (0.09)USD (14 772.55)995 478.76 30/04/2019Deutsche BankEUR 2 394 000.00 (0.15)GBP (25 561.14)2 750 048.19 30/04/2019JP Morgan
EUR
Unrealised appreciation/(depreciation)
Currency % of NetAssets
Amount bought Maturity Currency Amount soldCounterparty
Plus/(Moins) value non-réalisée
Devise % de l'actifnet
Montant acheté Maturité Devise Montant venduContrepartie

246

PrivilEdgeis an investment company
with variable capital ("SICAV")incorporated in Luxembourg
PrivilEdgeest une société d’investissement
à capital variable ("SICAV")enregistrée au Luxembourg RCS Luxembourg B0181207
PrivilEdge –Flossbach von Storch Global Convertible BondUnaudited semi-annual report · Rapport semestriel non révisé
31.03.2019

The accompanying notes form an integral part of these financial statements.Les notes annexées font partie intégrante de ces états financiers.
248 PrivilEdge - Flossbach von Storch Global Convertible Bond · 31/03/2019
ASSETS/ACTIF
29 610 837.13Investments in securities at market value/Portefeuille-titres à la valeur de marché (2):( EUR )29 757 386.82Acquisition cost/Coût d'acquisition
200 943.92Net options at market value/Position nette en options à la valeur de marché (2):( EUR )251 665.43Acquisition cost/Coût d'acquisition
2 497 638.96Cash and term deposits/Liquidité et dépôts à terme76 176.98Interest and dividends receivable, net/Intérêt et dividendes nets à recevoir
2 630.21Unrealised appreciation on forward foreign currency exchange contracts/Plus-value non réalisée sur contrats de change àterme
(2)
32 388 227.20LIABILITIES/PASSIF
44 213.20Amounts payable on redemptions/Montants à payer sur rachats d'actions19 468.58Management and distribution fees payable/Commission de gestion et de distribution à payer (3)
5 278.46Taxes and expenses payable/Impôts et autres frais à payer68 960.24
32 319 266.96NET ASSET VALUE/VALEUR NETTE D'INVENTAIRE
Statement of net assets as at 31/03/2019 / État de l'actif net au 31/03/2019
NotesNotes EUR

The accompanying notes form an integral part of these financial statements.Les notes annexées font partie intégrante de ces états financiers.
249PrivilEdge - Flossbach von Storch Global Convertible Bond · 31/03/2019
Statement of operations and changes in net assets for the period from 01/10/2018 to 31/03/2019 / État desopérations et des variations de l'actif net pour la période du 01/10/2018 au 31/03/2019
NotesNotes EUR
49 039 490.19NET ASSET VALUE AT THE BEGINNING OF THE PERIOD/VALEUR NETTE D'INVENTAIRE AU DÉBUT DE LAPÉRIODE
INCOME/REVENUS
17 960.46Dividends, net/Dividendes, nets (2)197 163.83Interest on bonds, net/Intérêts sur obligations, nets (2)
5 947.10Bank interest/Intérêts bancaires221 071.39
EXPENSES/DÉPENSES
131 049.08Management fees/Commission de gestion (3)305.95Distribution fees/Frais de distribution (3)
3 347.58Bank interest and other expenses/Intérêts bancaires débiteurs et autres frais43 231.06Fixed Rate of Operational Costs/Taux Fixe de Coûts Opérationnels (4)
177 933.6743 137.72NET INVESTMENT INCOME/REVENU NET SUR INVESTISSEMENTS
(204 416.84)Net realised loss on sale of investments/Perte nette réalisée sur ventes d'investissements (2)30 757.30Net realised gain on options/Gain net réalisé sur options
(390.57)Net realised loss on futures contracts/Perte nette réalisée sur contrats futures393 293.53Net realised gain on foreign exchange/Gain net réalisé sur opérations de change
(1 152 591.80)Net realised loss on forward foreign currency exchange contracts/Perte nette réalisée sur contrats de change à terme(890 210.66)NET REALISED LOSS/PERTE NETTE RÉALISÉE
398 908.25Change in net unrealised appreciation or depreciation on investments/Variation de la plus ou moins-value nette non réaliséesur investissements
(2)
(52 066.15)Change in net unrealised appreciation or depreciation on options/Variation de la plus ou moins-value non réalisée sur options144 538.81Change in net unrealised appreciation or depreciation on forward foreign currency exchange contracts/Variation de la plus ou
moins-value nette non réalisée sur contrats de change à terme(398 829.75)NET DECREASE IN NET ASSETS AS A RESULT OF OPERATIONS/DIMINUTION NETTE DE L'ACTIF NET RÉSULTANT
DES OPÉRATIONS(16 321 393.48)Net subscriptions/(redemptions) including equalisation/Souscriptions/(rachats) nets incluant la régularisation
32 319 266.96NET ASSET VALUE AT THE END OF THE PERIOD/VALEUR NETTE D'INVENTAIRE À LA FIN DE LA PÉRIODE

The accompanying notes form an integral part of these financial statements.Les notes annexées font partie intégrante de ces états financiers.
250 PrivilEdge - Flossbach von Storch Global Convertible Bond · 31/03/2019
300.0000 0.0000 0.0000 300.0000P - CHF - Hedged - Capitalisation14 000.0000 0.0000 0.0000 14 000.0000P - EUR - Distribution
439 663.2300 7 525.0850 (435 288.3150) 11 900.0000I - CHF - Hedged - Capitalisation426 398.0000 0.0000 0.0000 426 398.0000I - EUR - Capitalisation532 698.0000 26 900.0000 (144 838.0000) 414 760.0000M - USD - Hedged - Capitalisation
1 480 146.0000 111 550.0000 (1 400 036.0000) 191 660.0000M - CHF - Hedged - Capitalisation156 300.0000 0.0000 (1 700.0000) 154 600.0000M - CHF - Hedged - Distribution577 722.0000 330 920.0000 (135 961.0000) 772 681.0000M - EUR - Capitalisation421 762.0000 6 450.0000 (191 641.0000) 236 571.0000M - EUR - Distribution385 446.0000 5 300.0000 (120 536.0000) 270 210.0000M - GBP - Hedged - Distribution453 537.0000 183 342.0000 0.0000 636 879.0000N - CHF - Hedged - Capitalisation400 757.0000 138 195.0000 (265 457.0000) 273 495.0000N - EUR - Capitalisation
Statement of changes in the number of shares outstanding for the period from 01/10/2018 to 31/03/2019 / Étatdes variations du nombre d'actions pour la période du 01/10/2018 au 31/03/2019
Number of Shares01/10/2018/
Nombre d'actions01/10/2018
Number of Sharesissued/
Nombre d'actionsémises
Number of Sharesredeemed/
Nombre d'actionsrachetées
Number of Shares31/03/2019/
Nombre d'actions31/03/2019
30/09/201831/03/2019For the period ended/Pour la période clôturée au
Statistics / Statistiques
P - CHF - Hedged - Capitalisation
2 906.399.6880
2 952.379.8412
Net Asset Value/Valeur Nette d'InventaireNet Asset Value per share/Valeur Nette d'Inventaire par action
CHF CHF
P - EUR - Distribution
136 252.379.7323
0.00
138 042.639.8602
0.00
Net Asset Value/Valeur Nette d'InventaireNet Asset Value per share/Valeur Nette d'Inventaire par actionDividend per share paid to shareholders/Dividende par action payé aux actionnaires
EUR EUR
I - CHF - Hedged - Capitalisation
116 088.299.7553
4 338 617.579.8680
Net Asset Value/Valeur Nette d'InventaireNet Asset Value per share/Valeur Nette d'Inventaire par action
CHF CHF
I - EUR - Capitalisation
4 175 454.619.7924
4 213 943.319.8827
Net Asset Value/Valeur Nette d'InventaireNet Asset Value per share/Valeur Nette d'Inventaire par action
EUR EUR
M - USD - Hedged - Capitalisation
4 143 014.699.9889
5 297 428.889.9445
Net Asset Value/Valeur Nette d'InventaireNet Asset Value per share/Valeur Nette d'Inventaire par action
USD USD

The accompanying notes form an integral part of these financial statements.Les notes annexées font partie intégrante de ces états financiers.
251PrivilEdge - Flossbach von Storch Global Convertible Bond · 31/03/2019
30/09/201831/03/2019For the period ended/Pour la période clôturée au
Statistics / Statistiques
M - CHF - Hedged - Capitalisation
1 865 766.889.7348
14 592 097.659.8586
Net Asset Value/Valeur Nette d'InventaireNet Asset Value per share/Valeur Nette d'Inventaire par action
CHF CHF
M - CHF - Hedged - Distribution
1 504 996.219.7348
0.00
1 540 891.879.8586
0.00
Net Asset Value/Valeur Nette d'InventaireNet Asset Value per share/Valeur Nette d'Inventaire par actionDividend per share paid to shareholders/Dividende par action payé aux actionnaires
CHF CHF
M - EUR - Capitalisation
7 550 461.939.7718
5 703 932.879.8731
Net Asset Value/Valeur Nette d'InventaireNet Asset Value per share/Valeur Nette d'Inventaire par action
EUR EUR
M - EUR - Distribution
2 311 717.599.7718
0.00
4 164 117.199.8731
0.00
Net Asset Value/Valeur Nette d'InventaireNet Asset Value per share/Valeur Nette d'Inventaire par actionDividend per share paid to shareholders/Dividende par action payé aux actionnaires
EUR EUR
M - GBP - Hedged - Distribution
2 677 070.349.9074
0.00
3 837 977.159.9572
0.00
Net Asset Value/Valeur Nette d'InventaireNet Asset Value per share/Valeur Nette d'Inventaire par actionDividend per share paid to shareholders/Dividende par action payé aux actionnaires
GBP GBP
N - CHF - Hedged - Capitalisation
6 208 465.509.7483
4 474 219.429.8652
Net Asset Value/Valeur Nette d'InventaireNet Asset Value per share/Valeur Nette d'Inventaire par action
CHF CHF
N - EUR - Capitalisation
2 676 238.999.7853
3 959 394.609.8798
Net Asset Value/Valeur Nette d'InventaireNet Asset Value per share/Valeur Nette d'Inventaire par action
EUR EUR

The accompanying notes form an integral part of these financial statements.Les notes annexées font partie intégrante de ces états financiers.
252 PrivilEdge - Flossbach von Storch Global Convertible Bond · 31/03/2019
Investments in securities at market value/Portefeuille-titres à la valeur de marché 29 610 837.13 91.62
B.A. CV PREF 7.25 NON CUM PERP400 463 773.43 1.43USD
Transferable securities admitted to an official stock exchange listing and/or dealt in on anotherregulated market/Valeurs mobilières admises à la cote officielle d'une bourse de valeurs et/ounégociées sur un autre marché réglementé
26 492 946.08 81.97
EQUITIES/ACTIONS 1 041 888.36 3.22
UNITED STATES/ÉTATS-UNIS 1 041 888.36 3.22
WELLS FARGO PREF CV 7.50 NON CUM PERP500 578 114.93 1.79USD
NOKIA CORP 2.00 19-26 11/03A420 000 418 803.00 1.29EUR
BONDS/OBLIGATIONS 1 041 763.00 3.22
FINLAND/FINLANDE 418 803.00 1.29
EUROFINS SCIENTIFIC 2.125 17-24 25/07A200 000 196 798.00 0.61EUR
FRANCE/FRANCE 415 668.00 1.29
ORANO EMTN 4.875 09-24 23/09A200 000 218 870.00 0.68EUR
NETFLIX 3.625 17-27 05/02S200 000 207 292.00 0.64EUR
UNITED STATES/ÉTATS-UNIS 207 292.00 0.64
AMS AG CV 0.00 18-25 05/03U800 000 540 496.00 1.67EUR
CONVERTIBLE BONDS/OBLIGATIONS CONVERTIBLES 23 528 703.72 72.81
AUSTRIA/AUTRICHE 540 496.00 1.67
JAZZ INVST I CV 1.5 PCT 2017-24 15/08 S800 000 693 435.46 2.14USD
BERMUDA/BERMUDES 1 222 601.42 3.78
SHIP FINANCE CV 5.75 16-21 05/10Q600 000 529 165.96 1.64USD
HARVEST INTL CV 0.00 17-22 21/11U7 000 000 807 310.81 2.50HKD
CAYMAN ISLANDS/ILES CAÏMANS 807 310.81 2.50
CARREFOUR SA CV 0.00 17-23 14/06U600 000 472 460.26 1.46USD
FRANCE/FRANCE 2 108 689.49 6.52
MICHELIN CV 0.00 10.11.23U600 000 476 056.46 1.47USDTOTAL CV 0.50 15-22 02/12S400 000 376 844.64 1.17USDVINCI SA CONV 0.375 17-22 16/02S800 000 783 328.13 2.42USD
ADIDAS AG CV 0.05 18-23 12/09A600 000 643 374.00 1.99EUR
GERMANY/ALLEMAGNE 4 329 761.15 13.40
BASF CV 0.925 17-23 09/03S750 000 616 999.15 1.91USDBAYER AG CV 0.05 17-20 15/06A300 000 299 208.00 0.93EURDEUTSCHE POST AG CV 0.05 17-25 30/06A600 000 584 274.00 1.81EURFRESENIS REGS CV 0.00 14-19 24/09U600 000 639 360.00 1.98EURRAG-STIFTUNG 0.0 18-24 02/10U1 100 000 1 089 396.00 3.37EURSGL CARBON SE CV 3.0000 18-23 20/09S500 000 457 150.00 1.41EUR
PRYSMIAN SPA CV 0.00 17-22 17/01U500 000 477 985.00 1.48EUR
ITALY/ITALIE 477 985.00 1.48
MITSUBISHI CHEM CV 0.00 17-24 29/03U60 000 000 486 763.04 1.51JPY
JAPAN/JAPON 1 794 663.22 5.55
PARK24 CO LTD CV 0.0 18-25 29/10U70 000 000 555 454.04 1.72JPYSONY CORP CV 0.00 15-22 30/09U80 000 000 752 446.14 2.32JPY
REMGRO JERSEY REGS CV 2.625 16-21 22/03S400 000 454 599.05 1.41GBP
JERSEY/JERSEY 454 599.05 1.41
Schedule of investments as at 31/03/2019 / Inventaire du portefeuille au 31/03/2019
EUR
Market ValueNumber of Shares orNominal Value
Investment % of Net AssetsQuotationCurrency
Valeur de marchéNombre d'actions ouvaleur nominale
Investissement % de l'actif netDevise decotation

The accompanying notes form an integral part of these financial statements.Les notes annexées font partie intégrante de ces états financiers.
253PrivilEdge - Flossbach von Storch Global Convertible Bond · 31/03/2019
CO ECONOMICA DELTA 1.00 16-23 01/12S600 000 590 472.00 1.83EUR
SPAIN/ESPAGNE 590 472.00 1.83
SIKA 0.15 18-25 05/06A600 000 559 356.13 1.73CHF
SWITZERLAND/SUISSE 1 167 493.84 3.61
SWISS PRIME SITE AG 0.325 18-25 16/01A700 000 608 137.71 1.88CHF
BRENNTAG FINANCE CV 1.875 15-22 02/12S750 000 639 976.39 1.98USD
THE NETHERLANDS/PAYS-BAS 2 706 270.63 8.37
NXP SEMICONDUCTOR CV 1.00 14-19 01/12S400 000 367 026.76 1.14USDSIMENS FIN NV 1.65 15-19 16/08S1 250 000 1 146 424.27 3.54USDSTMICROELECTRONICS 0.25 17-24 03/07S600 000 552 843.21 1.71USD
DP WORLD PLC 1.75 14-24 19/06S1 200 000 1 035 472.24 3.20USD
UNITED ARAB EMIRATES/EMIRATES ARABES 1 035 472.24 3.20
POLYUS FINANCE PLC 1 18-21 26/01S600 000 535 124.02 1.66USD
UNITED KINGDOM/ROYAUME-UNI 535 124.02 1.66
GLENCORE FDING 0.00 18-25 20/03U600 000 487 988.60 1.51USD
UNITED STATES/ÉTATS-UNIS 5 757 764.85 17.83
LIBERTY MEDIA CORP 1.00 17-23 30/01S483 000 484 909.89 1.50USDLIBERTY MEDIA CV 2.125 18-48 31/03Q1 000 000 858 683.71 2.66USDLIBERTY MEDIA CV 2.25 16-46 30/09Q600 000 276 893.44 0.86USDNUANCE COMMUNICATIONS 1.00 16-35 15/12S700 000 581 577.59 1.80USDON SEMICONDUCTOR CV 1.625 17-23 15/10S500 000 548 875.63 1.70USDPALO ALTO NETWORKS CV 0.75 18-23 01/07S1 000 000 983 550.78 3.05USDPRICELINE.COM CV 0.35 13-20 15/06S600 000 724 910.72 2.24USDVISHAY CV 2.25 18-25 12/06S500 000 416 351.25 1.29USDWESTERN DIG CV CORP 1.5 18-24 01/02S500 000 394 023.24 1.22USD
RABOBANK STACK FL.R 13-XX 29/03Q500 000 584 260.00 1.80EUR
FLOATING RATE NOTES/OBLIGATIONS À TAUX VARIABLE 880 591.00 2.72
THE NETHERLANDS/PAYS-BAS 880 591.00 2.72
VOLKSWAGEN INTL FL.R 18-XX 27/06A300 000 296 331.00 0.92EUR
IMMOFINANZ AG CV 1.50 17-24 24/01S200 000 232 106.00 0.72EUR
Other transferable securities/Autres valeurs mobilières 3 117 891.05 9.65
CONVERTIBLE BONDS/OBLIGATIONS CONVERTIBLES 2 716 559.05 8.41
AUSTRIA/AUTRICHE 232 106.00 0.72
ABIGROVE LTD CV 0.00 17-22 16/02U200 000 193 879.86 0.60USD
CYPRUS/CHYPRE 193 879.86 0.60
KYUSHU ELECTRIC PO CV 0.00 17-22 31/03U30 000 000 251 670.69 0.78JPY
JAPAN/JAPON 251 670.69 0.78
NMC HEALTH CV 1.875 18-25 30/04S800 000 589 849.05 1.83USD
JERSEY/JERSEY 589 849.05 1.83
ENCE ENERGIA RCV 1.25 18-23 05/03S500 000 495 040.00 1.53EUR
SPAIN/ESPAGNE 495 040.00 1.53
HON HAI PRECISION IND 0.00 17-22 06/11U600 000 501 294.03 1.55USD
TAIWAN/TAÏWAN 501 294.03 1.55
AKAMAI TECHNO CV 0.125 18-25 21/05S300 000 265 397.87 0.82USD
UNITED STATES/ÉTATS-UNIS 452 719.42 1.40
Schedule of investments as at 31/03/2019 / Inventaire du portefeuille au 31/03/2019
EUR
Market ValueNumber of Shares orNominal Value
Investment % of Net AssetsQuotationCurrency
Valeur de marchéNombre d'actions ouvaleur nominale
Investissement % de l'actif netDevise decotation

The accompanying notes form an integral part of these financial statements.Les notes annexées font partie intégrante de ces états financiers.
254 PrivilEdge - Flossbach von Storch Global Convertible Bond · 31/03/2019
FORTIVE CORP CV 0.875 19-22 15/02S200 000 187 321.55 0.58USD
MEDTRONIC GBL FL.R 19-21 07/03Q400 000 401 332.00 1.24EUR
FLOATING RATE NOTES/OBLIGATIONS À TAUX VARIABLE 401 332.00 1.24
LUXEMBOURG/LUXEMBOURG 401 332.00 1.24
Schedule of investments as at 31/03/2019 / Inventaire du portefeuille au 31/03/2019
EUR
Market ValueNumber of Shares orNominal Value
Investment % of Net AssetsQuotationCurrency
Valeur de marchéNombre d'actions ouvaleur nominale
Investissement % de l'actif netDevise decotation
Net options at market value/Position nette en options à la valeur de marché 200 943.92 0.62
BARRICK GOLD JAN 15.00 17.01.20 CALL300 40 343.77 0.12USD
Options (Counterparties refer to Note 2)/Options (Contreparties voir la Note 2) 200 943.92 0.62
BRENNTAG SEP 50.00 23.09.19 CALL120 10 080.00 0.03EURCOVESTRO SEP 60.00 23.09.19 CALL30 2 280.00 0.01EURDEUTSCHE POST DEC 30.00 23.12.19 CALL300 31 800.00 0.10EURDEUTSCHE POST JUN 28.00 19.06.20 CALL150 34 650.00 0.11EURFRSENIUS DEC 58.00 20.12.19 CALL80 12 320.00 0.04EURFRSENIUS JUN 60.00 19.06.20 CALL70 13 580.00 0.04EURNEWMONT MINING JAN 42.00 17.01.20 CALL100 12 290.15 0.04USDROYAL DUTCH SHE DEC 30.00 23.12.19 CALL290 14 500.00 0.04EURTUI AG DEC 10.00 18.12.20 CALL300 29 100.00 0.09EUR
Forward Foreign Currency Exchange Contracts/Contrats de change à terme 0.012 630.21CHF 8 537 793.64 0.41EUR 135 313.089 697 396.74 15/04/2019Caceis BankUSD 3 663 561.85 0.10EUR 31 818.174 153 922.28 15/04/2019Caceis BankGBP 3 122 681.86 (0.07)EUR (22 448.29)2 672 640.95 15/04/2019Caceis BankEUR 29 965.50 0.00USD (20.66)26 637.02 15/04/2019Caceis BankEUR 7 300 000.00 (0.01)HKD (4 703.58)822 834.40 17/04/2019Caceis BankEUR 120 000 000.00 (0.01)JPY (3 692.43)961 881.03 17/04/2019Caceis BankEUR 680 000.00 (0.02)CHF (7 867.68)600 318.68 17/04/2019Caceis BankEUR 8 400 000.00 (0.18)USD (57 006.00)7 414 549.31 17/04/2019Caceis BankEUR 4 600 000.00 (0.04)USD (13 557.22)4 068 440.09 15/05/2019Caceis BankEUR 600 000.00 (0.02)CHF (7 224.10)529 561.63 15/05/2019Caceis BankEUR 134 000 000.00 (0.02)JPY (7 839.63)1 070 283.23 15/05/2019Caceis BankEUR 550 000.00 (0.01)GBP (2 884.45)634 453.65 15/05/2019Caceis BankEUR 6 000 000.00 (0.12)USD (37 257.00)5 274 725.27 12/06/2019Caceis Bank
EUR
Unrealised appreciation/(depreciation)
Currency % of NetAssets
Amount bought Maturity Currency Amount soldCounterparty
Plus/(Moins) value non-réalisée
Devise % de l'actifnet
Montant acheté Maturité Devise Montant venduContrepartie

PrivilEdgeis an investment company
with variable capital ("SICAV")incorporated in Luxembourg
PrivilEdgeest une société d’investissement
à capital variable ("SICAV")enregistrée au Luxembourg RCS Luxembourg B0181207
PrivilEdge –Payden Emerging Market Debt
Unaudited semi-annual report · Rapport semestriel non révisé
31.03.2019

The accompanying notes form an integral part of these financial statements.Les notes annexées font partie intégrante de ces états financiers.
256 PrivilEdge - Payden Emerging Market Debt · 31/03/2019
ASSETS/ACTIF
30 358 838.01Investments in securities at market value/Portefeuille-titres à la valeur de marché (2):( USD )29 935 300.04Acquisition cost/Coût d'acquisition
1 664 144.16Cash and term deposits/Liquidité et dépôts à terme458 993.10Interest and dividends receivable, net/Intérêt et dividendes nets à recevoir
32 481 975.27LIABILITIES/PASSIF
827 935.08Payable on investments purchased/À payer sur achat de titres17 028.71Management and distribution fees payable/Commission de gestion et de distribution à payer (3)
5 913.43Taxes and expenses payable/Impôts et autres frais à payer13 700.31Unrealised depreciation on forward foreign currency exchange contracts/Moins-value non réalisée sur contrats de change à
terme(2)
864 577.5331 617 397.74NET ASSET VALUE/VALEUR NETTE D'INVENTAIRE
Statement of net assets as at 31/03/2019 / État de l'actif net au 31/03/2019
NotesNotes USD

The accompanying notes form an integral part of these financial statements.Les notes annexées font partie intégrante de ces états financiers.
257PrivilEdge - Payden Emerging Market Debt · 31/03/2019
Statement of operations and changes in net assets for the period from 01/10/2018 to 31/03/2019 / État desopérations et des variations de l'actif net pour la période du 01/10/2018 au 31/03/2019
NotesNotes USD
29 459 696.24NET ASSET VALUE AT THE BEGINNING OF THE PERIOD/VALEUR NETTE D'INVENTAIRE AU DÉBUT DE LAPÉRIODE
INCOME/REVENUS
904 577.65Interest on bonds, net/Intérêts sur obligations, nets (2)7 317.07Bank interest/Intérêts bancaires
911 894.72EXPENSES/DÉPENSES
96 334.55Management fees/Commission de gestion (3)2 075.10Bank interest and other expenses/Intérêts bancaires débiteurs et autres frais
33 652.90Fixed Rate of Operational Costs/Taux Fixe de Coûts Opérationnels (4)132 062.55779 832.17NET INVESTMENT INCOME/REVENU NET SUR INVESTISSEMENTS
(139 247.86)Net realised loss on sale of investments/Perte nette réalisée sur ventes d'investissements (2)(17 797.40)Net realised loss on futures contracts/Perte nette réalisée sur contrats futures
(1 110.11)Net realised loss on foreign exchange/Perte nette réalisée sur opérations de change(1 190 870.99)Net realised loss on forward foreign currency exchange contracts/Perte nette réalisée sur contrats de change à terme
(569 194.19)NET REALISED LOSS/PERTE NETTE RÉALISÉE
677 175.36Change in net unrealised appreciation or depreciation on investments/Variation de la plus ou moins-value nette non réaliséesur investissements
(2)
(5 781.25)Change in net unrealised appreciation or depreciation on futures contracts/Variation de la plus ou moins-value nette nonréalisée sur contrats futures
196 184.26Change in net unrealised appreciation or depreciation on forward foreign currency exchange contracts/Variation de la plus oumoins-value nette non réalisée sur contrats de change à terme
298 384.18NET INCREASE IN NET ASSETS AS A RESULT OF OPERATIONS/AUGMENTATION NETTE DE L'ACTIF NETRÉSULTANT DES OPÉRATIONS
(6 727.35)Dividend paid/Dividende payé1 866 044.67Net subscriptions/(redemptions) including equalisation/Souscriptions/(rachats) nets incluant la régularisation
31 617 397.74NET ASSET VALUE AT THE END OF THE PERIOD/VALEUR NETTE D'INVENTAIRE À LA FIN DE LA PÉRIODE

The accompanying notes form an integral part of these financial statements.Les notes annexées font partie intégrante de ces états financiers.
258 PrivilEdge - Payden Emerging Market Debt · 31/03/2019
0.0000 222 274.0000 0.0000 222 274.0000I - CHF - Hedged - Capitalisation500 000.0000 17 817.0000 (58 402.0000) 459 415.0000I - EUR - Hedged - Capitalisation329 960.0000 0.0000 (5 260.0000) 324 700.0000M - USD - Capitalisation
9 500.0000 0.0000 0.0000 9 500.0000M - USD - Distribution117 693.0000 39 631.3280 (15 000.0000) 142 324.3280M - CHF - Hedged - Capitalisation
10 000.0000 0.0000 0.0000 10 000.0000M - CHF - Hedged - Distribution95 490.0000 67 354.0000 0.0000 162 844.0000M - EUR - Hedged - Capitalisation15 700.0000 0.0000 0.0000 15 700.0000M - EUR - Hedged - Distribution
6 000.0000 0.0000 0.0000 6 000.0000M - GBP - Hedged - Distribution296 000.0000 73 742.0000 (99 636.0000) 270 106.0000N - USD - Capitalisation
1 045 145.0000 105 164.0000 (115 915.0000) 1 034 394.0000N - CHF - Hedged - Capitalisation351 000.0000 0.0000 (51 462.0000) 299 538.0000N - EUR - Hedged - Capitalisation
Statement of changes in the number of shares outstanding for the period from 01/10/2018 to 31/03/2019 / Étatdes variations du nombre d'actions pour la période du 01/10/2018 au 31/03/2019
Number of Shares01/10/2018/
Nombre d'actions01/10/2018
Number of Sharesissued/
Nombre d'actionsémises
Number of Sharesredeemed/
Nombre d'actionsrachetées
Number of Shares31/03/2019/
Nombre d'actions31/03/2019
30/09/201831/03/2019For the period ended/Pour la période clôturée au
Statistics / Statistiques
I - CHF - Hedged - Capitalisation
2 268 113.9310.2041
0.000.0000
Net Asset Value/Valeur Nette d'InventaireNet Asset Value per share/Valeur Nette d'Inventaire par action
CHF CHF
I - EUR - Hedged - Capitalisation
4 704 931.7210.2411
4 966 836.779.9337
Net Asset Value/Valeur Nette d'InventaireNet Asset Value per share/Valeur Nette d'Inventaire par action
EUR EUR
M - USD - Capitalisation
3 403 307.3110.4814
3 305 854.9910.0190
Net Asset Value/Valeur Nette d'InventaireNet Asset Value per share/Valeur Nette d'Inventaire par action
USD USD
M - USD - Distribution
98 011.6210.3170
0.15
95 180.0210.0189
0.00
Net Asset Value/Valeur Nette d'InventaireNet Asset Value per share/Valeur Nette d'Inventaire par actionDividend per share paid to shareholders/Dividende par action payé aux actionnaires
USD USD
M - CHF - Hedged - Capitalisation
1 449 906.3310.1873
1 166 893.839.9147
Net Asset Value/Valeur Nette d'InventaireNet Asset Value per share/Valeur Nette d'Inventaire par action
CHF CHF

The accompanying notes form an integral part of these financial statements.Les notes annexées font partie intégrante de ces états financiers.
259PrivilEdge - Payden Emerging Market Debt · 31/03/2019
30/09/201831/03/2019For the period ended/Pour la période clôturée au
Statistics / Statistiques
M - CHF - Hedged - Distribution
100 250.0510.0250
0.15
99 147.269.9147
0.00
Net Asset Value/Valeur Nette d'InventaireNet Asset Value per share/Valeur Nette d'Inventaire par actionDividend per share paid to shareholders/Dividende par action payé aux actionnaires
CHF CHF
M - EUR - Hedged - Capitalisation
1 663 692.4710.2165
947 523.459.9228
Net Asset Value/Valeur Nette d'InventaireNet Asset Value per share/Valeur Nette d'Inventaire par action
EUR EUR
M - EUR - Hedged - Distribution
157 845.9510.0539
0.15
155 786.919.9227
0.00
Net Asset Value/Valeur Nette d'InventaireNet Asset Value per share/Valeur Nette d'Inventaire par actionDividend per share paid to shareholders/Dividende par action payé aux actionnaires
EUR EUR
M - GBP - Hedged - Distribution
61 824.9510.3042
0.15
60 657.0110.1095
0.00
Net Asset Value/Valeur Nette d'InventaireNet Asset Value per share/Valeur Nette d'Inventaire par actionDividend per share paid to shareholders/Dividende par action payé aux actionnaires
GBP GBP
N - USD - Capitalisation
2 835 281.3410.4969
2 967 886.0110.0266
Net Asset Value/Valeur Nette d'InventaireNet Asset Value per share/Valeur Nette d'Inventaire par action
USD USD
N - CHF - Hedged - Capitalisation
10 553 336.3410.2024
10 370 273.139.9223
Net Asset Value/Valeur Nette d'InventaireNet Asset Value per share/Valeur Nette d'Inventaire par action
CHF CHF
N - EUR - Hedged - Capitalisation
3 064 757.8510.2316
3 485 556.699.9304
Net Asset Value/Valeur Nette d'InventaireNet Asset Value per share/Valeur Nette d'Inventaire par action
EUR EUR

The accompanying notes form an integral part of these financial statements.Les notes annexées font partie intégrante de ces états financiers.
260 PrivilEdge - Payden Emerging Market Debt · 31/03/2019
Investments in securities at market value/Portefeuille-titres à la valeur de marché 30 358 838.01 96.02
ANGOLA 9.375 18-48 09/05S200 000 216 626.00 0.69USD
Transferable securities admitted to an official stock exchange listing and/or dealt in on anotherregulated market/Valeurs mobilières admises à la cote officielle d'une bourse de valeurs et/ounégociées sur un autre marché réglementé
28 599 297.71 90.45
BONDS/OBLIGATIONS 28 512 399.71 90.18
ANGOLA/ANGOLA 444 276.00 1.41
ANGOLA (REP) REGS 9.50 15-25 12/11S200 000 227 650.00 0.72USD
ARGENTINA 5.625 17-22 26/01S130 000 112 303.10 0.36USD
ARGENTINA/ARGENTINE 1 373 737.75 4.34
ARGENTINA REP 7.125 17-36 06/07S165 000 126 974.10 0.40USDARGENTINA REP 7.50 17-26 22/04S460 000 390 070.80 1.23USDARGENTINA (REP OF) 6.875 18-48 11/01S120 000 88 345.20 0.28USDARGENTINA REPU (IN DEFAULT) 05-33 31/12S483 703 402 958.55 1.27USDPROVINCIA DE BUENO 6.5 17-23 15/02S150 000 122 620.50 0.39USDPROVINCIA DE CO 7.1250 16-21 10/06S150 000 130 465.50 0.41USD
ARMENIA 6.00 13-20 30/09S200 000 205 020.00 0.65USD
ARMENIA/ARMENIE 683 992.70 2.16
ARMENIA 7.15 15-25 26/03S430 000 478 972.70 1.51USD
SOUTHERN GAS CORRIDOR 6.875 16-26 24/03S200 000 225 074.00 0.71USD
AZERBAIJAN/AZERBAIDJAN 225 074.00 0.71
BAHREIN 6.75 17-29 20/09S200 000 211 078.00 0.67USD
BAHRAIN/BAHREÏN 211 078.00 0.67
BELARUS (REP OF) 6.875 17-23 28/02S400 000 420 280.00 1.33USD
BELARUS/BIÉLORUSSIE 420 280.00 1.33
ARCOS DOR HDGS REGS 5.875 17-27 04/04S100 000 100 790.00 0.32USD
BRITISH VIRGIN ISLANDS/ILES VIERGES BRITANNIQUES 300 530.00 0.95
SINOPEC GRP OVER R 3.50 16-26 03/05S200 000 199 740.00 0.63USD
STONEWAY CAPITAL COR 10 17-27 01/03S138 826 134 767.87 0.43USD
CANADA/CANADA 134 767.87 0.43
BRASKEM FIN LTD 6.45 14-24 03/02S200 000 217 336.00 0.69USD
CAYMAN ISLANDS/ILES CAÏMANS 217 336.00 0.69
EMPRESA NACIONA 5.2500 18-29 06/11S200 000 215 118.00 0.68USD
CHILE/CHILI 215 118.00 0.68
COLOMBIA 5.00 15-45 15/06S200 000 210 036.00 0.67USD
COLOMBIA/COLOMBIE 823 800.00 2.61
COLOMBIA 6.125 09-41 18/01S100 000 118 096.00 0.37USDCOLOMBIA 7.375 06-37 18/09S160 000 209 508.80 0.67USDCOLOMBIA (REP OF) 3.875 17-27 25/04S200 000 203 308.00 0.64USDECOPETROL 5.875 14-45 28/05S80 000 82 851.20 0.26USD
DOMINICAN REP 6.875 16-26 29/01S100 000 110 420.00 0.35USD
DOMINICAN REPUBLIC/RÉPUBLIQUE DOMINICAINE 1 065 321.90 3.37
DOMINICAN REP.REG S 6.60 13-24 28/01S100 000 108 407.00 0.34USDDOMINICAN REPUBLIC 6.5 18-48 15/12S360 000 374 176.80 1.19USDDOMINICAN REPUBLIC 5.50 15-25 27/01S110 000 113 686.10 0.36USDREP DOMINICAINE 5.95 17-27 25/01S340 000 358 632.00 1.13USD
Schedule of investments as at 31/03/2019 / Inventaire du portefeuille au 31/03/2019
USD
Market ValueNumber of Shares orNominal Value
Investment % of Net AssetsQuotationCurrency
Valeur de marchéNombre d'actions ouvaleur nominale
Investissement % de l'actif netDevise decotation

The accompanying notes form an integral part of these financial statements.Les notes annexées font partie intégrante de ces états financiers.
261PrivilEdge - Payden Emerging Market Debt · 31/03/2019
ECUADOR REG S 7.95 14-24 20/06S260 000 260 702.00 0.82USD
ECUADOR/EQUATEUR 1 182 870.75 3.74
ECUADOR REGS 7.95 16-22 28/03S235 000 263 333.95 0.83USDECUADOR (REP OF) 9.65 16-26 13/12S200 000 210 436.00 0.67USDREPUBLIC OF ECUADOR 7.875 18-28 23/01S470 000 448 398.80 1.42USD
EGYPT REG-S 7.50 17-27 31/01S235 000 246 703.00 0.78USD
EGYPT/EGYPTE 678 798.20 2.15
EGYPTE 5.577 18-23 21/02S200 000 198 964.00 0.63USDEGYPTE 7.903 18-48 21/02S240 000 233 131.20 0.74USD
EL SALVADOR REGS 5.875 12-25 30/01S90 000 88 157.70 0.28USD
EL SALVADOR/SALVADOR 368 896.90 1.17
EL SALVADOR REGS 6.375 14-27 18/01S120 000 118 572.00 0.38USDEL SALVADOR REP REG-S 7.65 05-35 15/06S155 000 162 167.20 0.51USD
GEORG RAILWAY REGS 7.75 12-22 11/07S235 000 252 317.15 0.80USD
GEORGIA/GEORGIE 707 749.90 2.24
GEORGIA 6.875 11-21 12/04S235 000 248 876.75 0.79USDGEORGIAN OIL GAS REGS 6.75 16-21 26/04S200 000 206 556.00 0.65USD
GHANA REGS 7.875 13-23 07/08S200 000 209 344.00 0.66USD
GHANA/GHANA 746 519.65 2.36
REPUBLIC OF GHA 8.6270 18-49 16/06S275 000 268 804.25 0.85USDREPUBLIC OF GHANA 10.75 15-30 14/10S220 000 268 371.40 0.85USD
HONDURAS GOVT REGS 8.75 13-20 15/12S225 000 241 895.25 0.77USD
HONDURAS/HONDURAS 241 895.25 0.77
HONGRIE 3.00 16-27 27/10A41 600 000 151 336.23 0.48HUF
HUNGARY/HONGRIE 361 552.23 1.14
HUNGARY 5.75 13-23 22/11S190 000 210 216.00 0.66USD
POWER FINANCE C 6.1500 18-28 06/12S200 000 221 952.00 0.70USD
INDIA/INDE 221 952.00 0.70
INDO ASAHAN 5.71 18-23 15/11S200 000 216 256.00 0.68USD
INDONESIA/INDONÉSIE 1 792 548.25 5.68
INDONESIA 5.625 12-23 15/05S5 700 000 000 380 422.86 1.21IDRINDONESIA 8.25 16-36 15/05S1 000 000 000 71 474.70 0.23IDRINDONESIA FR0068 8.375 13-34 15/03S1 000 000 000 72 065.29 0.23IDRINDONESIA REGS 5.375 13-23 17/10S300 000 325 131.00 1.04USDPERTAMINA PERSE 6.5000 18-48 07/11S200 000 231 154.00 0.73USDPERTAMINA REGS 6.45 14-44 30/05S200 000 228 958.00 0.72USDPERUSAHAAN PER 6.15 18-48 21/05S240 000 267 086.40 0.84USD
IRAQ (REPUBLIC OF) 6.75 17-23 03/09S200 000 202 972.00 0.64USD
IRAQ/IRAK 202 972.00 0.64
C&W SENIOR FINANCING 6.875 19-27 15/09S200 000 199 644.00 0.63USD
IRELAND/IRLANDE 199 644.00 0.63
COTE D IVOIRE REGS 5.75 10-32 31/12S90 500 85 978.62 0.27USD
IVORY COAST/CÔTE D'IVOIRE 391 060.32 1.24
COTE D'IVOIRE 6.125 17-33 15/06S330 000 305 081.70 0.97USD
KAZAKHSTAN REGS 6.50 15-45 21/07S200 000 257 034.00 0.81USD
KAZAKHSTAN/KAZAKHSTAN 257 034.00 0.81
KENYA REGS 6.875 14-24 24/06S400 000 411 940.00 1.30USD
KENYA/KENYA 411 940.00 1.30
Schedule of investments as at 31/03/2019 / Inventaire du portefeuille au 31/03/2019
USD
Market ValueNumber of Shares orNominal Value
Investment % of Net AssetsQuotationCurrency
Valeur de marchéNombre d'actions ouvaleur nominale
Investissement % de l'actif netDevise decotation

The accompanying notes form an integral part of these financial statements.Les notes annexées font partie intégrante de ces états financiers.
262 PrivilEdge - Payden Emerging Market Debt · 31/03/2019
LEBANESE REPUBLIC 6.65 15-28 03/11S75 000 59 133.75 0.19USD
LEBANON/LIBAN 357 469.60 1.13
LEBANESE REPUBLIC 6.65 15-30 26/02S30 000 23 093.70 0.07USDLEBANESE REPUBLIC 6.75 12-27 29/11S80 000 63 866.40 0.20USDLEBANESE REPUBLIC 6.85 17-27 23/03S20 000 16 170.40 0.05USDLEBANESE REPUBLIC 7.00 17-32 23/03S85 000 66 418.15 0.21USDLEBANESE REPUBLIC 61 6.60 11-26 27/11S160 000 128 787.20 0.41USD
ADECOAGRO REGS 6.00 17-27 21/09S150 000 140 898.00 0.45USD
LUXEMBOURG/LUXEMBOURG 418 485.05 1.32
JBS USA LUX 6.75 18/28 15/02S65 000 67 455.05 0.21USDMILLICOM INTL C 6.6250 18-26 15/10S200 000 210 132.00 0.66USD
CEMEX REGS 5.70 14-25 11/01S200 000 205 474.00 0.65USD
MEXICO/MEXIQUE 1 616 485.34 5.12
COMETA ENERGIA 6.375 18-35 24/04S197 400 193 384.88 0.61USDFERMACA ENTERP REGS 6.375 14-38 30/03S225 447 228 544.31 0.72USDPEMEX 6.75 16-47 21/09S315 000 290 603.25 0.93USDPETROLEOS MEXICANOS 3.50 13-23 30/01S220 000 209 972.40 0.66USDPETROLEOS MEXICANOS 6.5 18-27 13/03S305 000 307 705.35 0.98USDPETROLEOS MEXICANOS 6.5 18-29 23/01S80 000 79 213.60 0.25USDPETROLEOS MEXICANOS 6.35 18-48 12/02S115 000 101 587.55 0.32USD
DEVT BANK OF MO 7.2500 18-23 23/10S200 000 208 146.00 0.66USD
MONGOLIA/MONGOLIE 684 367.25 2.16
MONGOLIA INTL BD REGS 8.75 17-24 09/03S245 000 275 833.25 0.87USDMONGOLIE EMTN REGS 2 5.125 12-22 05/12S200 000 200 388.00 0.63USD
NIGERIA REGS 7.875 17-32 16/02S200 000 208 366.00 0.66USD
NIGERIA/NIGERIA 499 038.80 1.58
REPUB.NIGERIA 7.143 18-30 23/02S290 000 290 672.80 0.92USD
OMAN GOV INTL 6.75 18-48 17/01S295 000 262 600.15 0.83USD
OMAN/OMAN 556 021.35 1.76
OMAN SOVEREIGN REGS 4.397 17-24 01/06S310 000 293 421.20 0.93USD
PANAMA (REP. OF) 6.70 06-36 26/01S160 000 209 038.40 0.66USD
PANAMA/PANAMA 391 652.15 1.24
PANAMA (REP.OF) 9.375 99-29 01/04S125 000 182 613.75 0.58USD
CORP FINANCIERA DE 4.75 15-25 15/07S200 000 210 204.00 0.66USD
PERU/PÉROU 1 172 792.87 3.71
HUNT OIL CO OF 6.3750 18-28 01/06S200 000 215 078.00 0.68USDPERU 6.15 17-32 12/08S500 000 158 337.25 0.50PENPERU LNG SRL 5.375 18-30 22/03S200 000 207 716.00 0.66USDPERU (REP. OF) 6.55 07-37 14/03S150 000 202 579.50 0.64USDREPUBLIQUE DU PEROU 6.95 08-31 12/08S530 000 178 878.12 0.57PEN
POLAND GOVT BOND 2.75 13-28 25/04A1 190 000 310 730.95 0.98PLN
POLAND/POLOGNE 310 730.95 0.98
STATE OF QATAR 5.1030 18-48 23/04S400 000 438 964.00 1.39USD
QATAR/QATAR 438 964.00 1.39
RUSSIA 6207 8.15 12-27 03/02S17 000 000 260 715.53 0.82RUB
RUSSIA/RUSSIE 893 021.53 2.82
RUSSIAN FEDERAT REGS 4.875 13-23 16/09A200 000 209 636.00 0.66USDRUSSIAN FEDERATION 4.75 16-26 27/05S200 000 205 826.00 0.65USDRUSSIE (FED OF) 5.625 12-42 04/04S200 000 216 844.00 0.69USD
Schedule of investments as at 31/03/2019 / Inventaire du portefeuille au 31/03/2019
USD
Market ValueNumber of Shares orNominal Value
Investment % of Net AssetsQuotationCurrency
Valeur de marchéNombre d'actions ouvaleur nominale
Investissement % de l'actif netDevise decotation

The accompanying notes form an integral part of these financial statements.Les notes annexées font partie intégrante de ces états financiers.
263PrivilEdge - Payden Emerging Market Debt · 31/03/2019
SAUDI INTERNATIONAL 5.25 19-50 16/01S200 000 213 848.00 0.68USD
SAUDI ARABIA/ARABIE SAOUDITE 213 848.00 0.68
SENEGAL 4.75 18-28 13/03A220 000 245 003.85 0.77EUR
SENEGAL/SENEGAL 437 383.85 1.38
SENEGAL REGS 6.25 17-33 23/05S200 000 192 380.00 0.61USD
AFRIQUE DU SUD 5.875 18-30 22/05S300 000 307 929.00 0.98USD
SOUTH AFRICA/AFRIQUE DU SUD 504 793.00 1.60
TRANSNET REG S EMTN 4.00 12-22 26/07S200 000 196 864.00 0.62USD
AI CANDELARIA S 7.5000 18-28 15/12S250 000 260 587.50 0.82USD
SPAIN/ESPAGNE 260 587.50 0.82
REP OF SRI LANKA 6.75 18-28 18/04S265 000 261 727.25 0.84USD
SRI LANKA/SRI LANKA 1 309 842.25 4.14
REPUBLIC OF SRI 7.8500 19-29 14/03S230 000 241 017.00 0.76USDSRI LANKA 5.875 12-22 25/07S200 000 200 166.00 0.63USDSRI LANKA REGS 6.25 11-21 27/07S200 000 203 384.00 0.64USDSRI LANKA REGS 6.825 16-26 18/07S200 000 200 548.00 0.63USDSRI LANKA REPU OF 6.25 10-20 04/10S200 000 203 000.00 0.64USD
REPUBLIC OF ANG 8.2500 18-28 09/05S200 000 209 136.00 0.66USD
SWITZERLAND/SUISSE 209 136.00 0.66
MINEJASA CAP REGS 5.625 17-37 10/08S200 000 199 068.00 0.63USD
THE NETHERLANDS/PAYS-BAS 942 986.05 2.98
PETROBRAS 5.999 18-28 27/07S250 000 253 207.50 0.80USDPETROBRAS GLOBAL FIN 8.75 16-26 23/05S165 000 195 097.65 0.62USDTEVA PHARMA 6.75 18-28 14/03S200 000 202 386.00 0.64USDTEVA PHARMA FIN 4.10 16-46 01/10S130 000 93 226.90 0.29USD
REPUBLIC OF TUR 7.2500 18-23 23/12S200 000 201 696.00 0.64USD
TURKEY/TURQUIE 1 142 471.40 3.61
TURK EXIMBANK 5.875 12-19 24/04S200 000 199 758.00 0.63USDTURKEY (REP OF) 5.625 10-21 30/03S290 000 286 873.80 0.90USDTURKEY (REP. OF) 7.375 05-25 05/02S270 000 271 749.60 0.86USDTURQUIE 6.125 18-28 24/10S200 000 182 394.00 0.58USD
MIN FIN UKRAINE 7.75 15-25 01/09S210 000 200 476.50 0.63USD
UKRAINE/UKRAINE 901 189.60 2.85
MIN FIN UKRAINE REGS 7.75 15-22 01/09S210 000 207 654.30 0.65USDMIN FIN UKRAINE REGS 7.75 15-23 01/09S100 000 97 625.00 0.31USDMIN FIN UKRAINE REGS 7.75 15-23 01/09S100 000 96 511.00 0.31USDMIN FIN UKRAINE REGS 7.75 15-27 01/09S100 000 93 473.00 0.30USDUKRAINE GOVT 7.375 17-32 25/09S230 000 205 449.80 0.65USD
KOSMOS ENERGY L 7.1250 19-26 04/04S200 000 198 702.00 0.62USD
UNITED STATES/ÉTATS-UNIS 459 666.16 1.45
LATAM AIR 2015-1 PTT A 4.20 16-27 15/11Q165 445 162 964.16 0.52USDTERRAFORM GLOBAL 6.1250 18-26 01/03S100 000 98 000.00 0.31USD
URUGUAY 4.975 18-55 20/04S144 000 150 835.68 0.48USD
URUGUAY/URUGUAY 380 477.18 1.20
URUGUAY 5.10 14-50 18/06S215 000 229 641.50 0.72USD
PETROLEO VEN DEF 9.00 11-21 17/11S235 000 64 516.90 0.21USD
VENEZUELA/VENEZUELA 325 551.46 1.03
PETROLEOS DE VENEZUEL 6.00 13-26 15/11S200 000 44 888.00 0.14USDPETROLEOS V(DEFAULT) 5.375 07-27 12/04S205 000 46 344.35 0.15USD
Schedule of investments as at 31/03/2019 / Inventaire du portefeuille au 31/03/2019
USD
Market ValueNumber of Shares orNominal Value
Investment % of Net AssetsQuotationCurrency
Valeur de marchéNombre d'actions ouvaleur nominale
Investissement % de l'actif netDevise decotation

The accompanying notes form an integral part of these financial statements.Les notes annexées font partie intégrante de ces états financiers.
264 PrivilEdge - Payden Emerging Market Debt · 31/03/2019
VENEZUELA DEF 7.00 07-38 31/03S60 000 19 297.50 0.06USDVENEZUELA DEF 7.65 05-25 21/04S195 000 61 440.80 0.19USDVENEZUELA DEF 9.25 97-27 15/09S195 000 61 276.41 0.19USDVENEZUELA REGS (DEFAULT) 09-19 13/10S95 000 27 787.50 0.09USD
ZAMBIA REGS 5.375 12-22 20/09S285 000 204 692.70 0.65USD
ZAMBIA/ZAMBIE 204 692.70 0.65
ARGENTIN.STEP-UP PAR FL.R 05-38 31/12S150 000 86 898.00 0.27USD
FLOATING RATE NOTES/OBLIGATIONS À TAUX VARIABLE 86 898.00 0.27
ARGENTINA/ARGENTINE 86 898.00 0.27
ARAB REPUBLIC O 8.7002 19-49 01/03S200 000 208 406.00 0.66USD
Other transferable securities/Autres valeurs mobilières 1 759 540.30 5.57
BONDS/OBLIGATIONS 1 759 540.30 5.57
EGYPT/EGYPTE 208 406.00 0.66
REPUBLIC OF GHA 7.8750 19-27 26/03S200 000 202 102.00 0.64USD
GHANA/GHANA 202 102.00 0.64
GUATEMALA REGS 4.50 16-26 03/05S290 000 285 496.30 0.91USD
GUATEMALA/GUATEMALA 285 496.30 0.91
PERUSAHAAN PENERBIT 4.15 17-27 29/03S200 000 202 544.00 0.64USD
INDONESIA/INDONÉSIE 202 544.00 0.64
MONGOLIA INTL BOND 5.625 17-23 01/05S200 000 202 150.00 0.64USD
MONGOLIA/MONGOLIE 202 150.00 0.64
REPUBLIC OF NIG 7.6250 18-25 21/11S230 000 245 778.00 0.78USD
NIGERIA/NIGERIA 245 778.00 0.78
ESKOM HOLDINGS SOC 6.35 18-28 10/08S200 000 206 216.00 0.65USD
SOUTH AFRICA/AFRIQUE DU SUD 206 216.00 0.65
ABU DHABI OIL 4.60 17-47 02/11S200 000 206 848.00 0.65USD
UNITED ARAB EMIRATES/EMIRATES ARABES 206 848.00 0.65
Schedule of investments as at 31/03/2019 / Inventaire du portefeuille au 31/03/2019
USD
Market ValueNumber of Shares orNominal Value
Investment % of Net AssetsQuotationCurrency
Valeur de marchéNombre d'actions ouvaleur nominale
Investissement % de l'actif netDevise decotation
Forward Foreign Currency Exchange Contracts/Contrats de change à terme (0.04)(13 700.31)USD 225 000.00 0.01EUR 3 825.95256 641.75 10/04/2019Hsbc BankGBP 82 130.13 0.00USD (1 295.01)61 993.60 15/04/2019Caceis BankCHF 14 397 265.88 0.28USD 87 727.9414 407 849.94 15/04/2019Caceis BankEUR 10 907 671.95 (0.31)USD (94 885.91)9 619 179.68 15/04/2019Caceis BankZAR 265 500.95 (0.01)USD (4 492.88)3 770 000.00 15/04/2019BNPUSD 79 572.15 0.00EUR 103.1489 549.14 15/04/2019Caceis BankUSD 1 860 000.00 0.02ZAR 4 944.78133 710.02 15/04/2019BNPPEN 269 184.65 0.00USD 806.81898 000.00 02/05/2019BNPUSD 5 130 000.00 0.01MXN 1 886.51265 079.29 02/05/2019Hsbc Bank
USD
Unrealised appreciation/(depreciation)
Currency % of NetAssets
Amount bought Maturity Currency Amount soldCounterparty
Plus/(Moins) value non-réalisée
Devise % de l'actifnet
Montant acheté Maturité Devise Montant venduContrepartie

The accompanying notes form an integral part of these financial statements.Les notes annexées font partie intégrante de ces états financiers.
265PrivilEdge - Payden Emerging Market Debt · 31/03/2019
Schedule of investments as at 31/03/2019 / Inventaire du portefeuille au 31/03/2019
CLP 203 487.93 (0.02)USD (7 142.10)133 600 000.00 13/05/2019BNPBRL 201 650.10 (0.02)USD (5 608.20)765 000.00 15/05/2019Hsbc BankTRY 149 665.31 (0.03)USD (8 670.38)836 000.00 21/05/2019BNPUSD 835 999.97 0.01TRY 2 399.11143 261.07 21/05/2019BNPUSD 43 830 000.00 0.01HUF 3 507.64157 346.67 12/06/2019BNPUSD 132 000.00 0.00EUR 433.77149 552.04 13/06/2019BNPINR 103 665.89 0.00USD 665.077 310 000.00 19/06/2019Hsbc BankUSD 1 223 000.00 0.01PLN 2 093.45321 900.50 21/06/2019BNP
USD
Unrealised appreciation/(depreciation)
Currency % of NetAssets
Amount bought Maturity Currency Amount soldCounterparty
Plus/(Moins) value non-réalisée
Devise % de l'actifnet
Montant acheté Maturité Devise Montant venduContrepartie

266

PrivilEdgeis an investment company
with variable capital ("SICAV")incorporated in Luxembourg
PrivilEdgeest une société d’investissement
à capital variable ("SICAV")enregistrée au Luxembourg RCS Luxembourg B0181207
PrivilEdge –PPM America US Corporate Bond
Unaudited semi-annual report · Rapport semestriel non révisé
31.03.2019

The accompanying notes form an integral part of these financial statements.Les notes annexées font partie intégrante de ces états financiers.
268 PrivilEdge - PPM America US Corporate Bond · 31/03/2019
ASSETS/ACTIF
69 601 117.92Investments in securities at market value/Portefeuille-titres à la valeur de marché (2):( USD )68 200 938.21Acquisition cost/Coût d'acquisition
2 814 254.48Cash and term deposits/Liquidité et dépôts à terme67 055.65Receivable on investments sold/À recevoir sur vente de titres
9 656 337.50Amounts receivable on subscriptions/Montants à recevoir sur souscriptions d'actions527 321.58Interest and dividends receivable, net/Intérêt et dividendes nets à recevoir
18 171.87Unrealised appreciation on futures contracts/Plus-value non réalisée sur contrats futures (2)82 684 259.00
LIABILITIES/PASSIF
10 692 516.82Payable on investments purchased/À payer sur achat de titres49 762.42Amounts payable on redemptions/Montants à payer sur rachats d'actions26 194.76Management and distribution fees payable/Commission de gestion et de distribution à payer (3)
9 407.64Taxes and expenses payable/Impôts et autres frais à payer16 455.58Unrealised depreciation on forward foreign currency exchange contracts/Moins-value non réalisée sur contrats de change à
terme(2)
10 794 337.2271 889 921.78NET ASSET VALUE/VALEUR NETTE D'INVENTAIRE
Statement of net assets as at 31/03/2019 / État de l'actif net au 31/03/2019
NotesNotes USD

The accompanying notes form an integral part of these financial statements.Les notes annexées font partie intégrante de ces états financiers.
269PrivilEdge - PPM America US Corporate Bond · 31/03/2019
Statement of operations and changes in net assets for the period from 01/10/2018 to 31/03/2019 / État desopérations et des variations de l'actif net pour la période du 01/10/2018 au 31/03/2019
NotesNotes USD
38 593 021.75NET ASSET VALUE AT THE BEGINNING OF THE PERIOD/VALEUR NETTE D'INVENTAIRE AU DÉBUT DE LAPÉRIODE
INCOME/REVENUS
801 281.53Interest on bonds, net/Intérêts sur obligations, nets (2)14 463.20Bank interest/Intérêts bancaires
815 744.73EXPENSES/DÉPENSES
113 718.40Management fees/Commission de gestion (3)15.62Bank interest and other expenses/Intérêts bancaires débiteurs et autres frais
42 746.40Fixed Rate of Operational Costs/Taux Fixe de Coûts Opérationnels (4)156 480.42659 264.31NET INVESTMENT INCOME/REVENU NET SUR INVESTISSEMENTS
(21 647.37)Net realised loss on sale of investments/Perte nette réalisée sur ventes d'investissements (2)(19 756.68)Net realised loss on futures contracts/Perte nette réalisée sur contrats futures
6 630.33Net realised gain on foreign exchange/Gain net réalisé sur opérations de change(110 956.34)Net realised loss on forward foreign currency exchange contracts/Perte nette réalisée sur contrats de change à terme
513 534.25NET REALISED GAIN/GAIN NET RÉALISÉ
1 606 343.32Change in net unrealised appreciation or depreciation on investments/Variation de la plus ou moins-value nette non réaliséesur investissements
(2)
19 500.00Change in net unrealised appreciation or depreciation on futures contracts/Variation de la plus ou moins-value nette nonréalisée sur contrats futures
151.35Change in net unrealised appreciation or depreciation on forward foreign currency exchange contracts/Variation de la plus oumoins-value nette non réalisée sur contrats de change à terme
2 139 528.92NET INCREASE IN NET ASSETS AS A RESULT OF OPERATIONS/AUGMENTATION NETTE DE L'ACTIF NETRÉSULTANT DES OPÉRATIONS
(55 196.74)Dividend paid/Dividende payé31 212 567.85Net subscriptions/(redemptions) including equalisation/Souscriptions/(rachats) nets incluant la régularisation71 889 921.78NET ASSET VALUE AT THE END OF THE PERIOD/VALEUR NETTE D'INVENTAIRE À LA FIN DE LA PÉRIODE

The accompanying notes form an integral part of these financial statements.Les notes annexées font partie intégrante de ces états financiers.
270 PrivilEdge - PPM America US Corporate Bond · 31/03/2019
1 300 000.0000 0.0000 0.0000 1 300 000.0000I - USD - Capitalisation1 536 058.8510 2 149 573.4710 (130 877.4000) 3 554 754.9220M - USD - Capitalisation
453 083.0000 251 917.0610 (46 140.0000) 658 860.0610M - USD - Distribution20 000.0000 0.0000 0.0000 20 000.0000M - CHF - Hedged - Distribution40 715.0000 0.0000 (23 140.0000) 17 575.0000M - EUR - Hedged - Capitalisation
3 200.0000 0.0000 0.0000 3 200.0000M - GBP - Hedged - Capitalisation115 637.8170 0.0000 (90 208.5000) 25 429.3170M - GBP - Hedged - Distribution225 000.0000 667 000.0000 0.0000 892 000.0000N - USD - Capitalisation
0.0000 274 000.0000 0.0000 274 000.0000N - USD - Distribution100 000.0000 0.0000 0.0000 100 000.0000N - EUR - Hedged - Distribution
Statement of changes in the number of shares outstanding for the period from 01/10/2018 to 31/03/2019 / Étatdes variations du nombre d'actions pour la période du 01/10/2018 au 31/03/2019
Number of Shares01/10/2018/
Nombre d'actions01/10/2018
Number of Sharesissued/
Nombre d'actionsémises
Number of Sharesredeemed/
Nombre d'actionsrachetées
Number of Shares31/03/2019/
Nombre d'actions31/03/2019
30/09/201831/03/2019For the period ended/Pour la période clôturée au
Statistics / Statistiques
I - USD - Capitalisation
13 648 144.3710.4986
13 036 550.4610.0281
Net Asset Value/Valeur Nette d'InventaireNet Asset Value per share/Valeur Nette d'Inventaire par action
USD USD
M - USD - Capitalisation
37 239 318.3810.4759
15 389 406.4710.0188
Net Asset Value/Valeur Nette d'InventaireNet Asset Value per share/Valeur Nette d'Inventaire par action
USD USD
M - USD - Distribution
6 846 030.5510.3907
0.08
4 539 329.8810.0188
0.00
Net Asset Value/Valeur Nette d'InventaireNet Asset Value per share/Valeur Nette d'Inventaire par actionDividend per share paid to shareholders/Dividende par action payé aux actionnaires
USD USD
M - CHF - Hedged - Distribution
203 549.4910.1775
0.08
199 813.089.9907
0.00
Net Asset Value/Valeur Nette d'InventaireNet Asset Value per share/Valeur Nette d'Inventaire par actionDividend per share paid to shareholders/Dividende par action payé aux actionnaires
CHF CHF
M - EUR - Hedged - Capitalisation
179 647.3310.2218
404 257.739.9290
Net Asset Value/Valeur Nette d'InventaireNet Asset Value per share/Valeur Nette d'Inventaire par action
EUR EUR

The accompanying notes form an integral part of these financial statements.Les notes annexées font partie intégrante de ces états financiers.
271PrivilEdge - PPM America US Corporate Bond · 31/03/2019
30/09/201831/03/2019For the period ended/Pour la période clôturée au
Statistics / Statistiques
M - GBP - Hedged - Capitalisation
33 031.4510.3223
31 885.209.9641
Net Asset Value/Valeur Nette d'InventaireNet Asset Value per share/Valeur Nette d'Inventaire par action
GBP GBP
M - GBP - Hedged - Distribution
260 343.0310.2379
0.08
1 152 242.109.9642
0.00
Net Asset Value/Valeur Nette d'InventaireNet Asset Value per share/Valeur Nette d'Inventaire par actionDividend per share paid to shareholders/Dividende par action payé aux actionnaires
GBP GBP
N - USD - Capitalisation
9 355 725.6010.4885
2 255 502.1510.0245
Net Asset Value/Valeur Nette d'InventaireNet Asset Value per share/Valeur Nette d'Inventaire par action
USD USD
N - USD - Distribution
2 873 839.3010.4885
0.00
0.000.0000
0.00
Net Asset Value/Valeur Nette d'InventaireNet Asset Value per share/Valeur Nette d'Inventaire par actionDividend per share paid to shareholders/Dividende par action payé aux actionnaires
USD USD
N - EUR - Hedged - Distribution
1 013 914.7110.1391
0.09
993 459.479.9346
0.00
Net Asset Value/Valeur Nette d'InventaireNet Asset Value per share/Valeur Nette d'Inventaire par actionDividend per share paid to shareholders/Dividende par action payé aux actionnaires
EUR EUR

The accompanying notes form an integral part of these financial statements.Les notes annexées font partie intégrante de ces états financiers.
272 PrivilEdge - PPM America US Corporate Bond · 31/03/2019
Investments in securities at market value/Portefeuille-titres à la valeur de marché 69 601 117.92 96.82
COMMONWEALTH BA 3.3500 19-24 04/06S300 000 304 551.00 0.42USD
Transferable securities admitted to an official stock exchange listing and/or dealt in on anotherregulated market/Valeurs mobilières admises à la cote officielle d'une bourse de valeurs et/ounégociées sur un autre marché réglementé
64 121 847.59 89.20
BONDS/OBLIGATIONS 54 786 358.95 76.22
AUSTRALIA/AUSTRALIE 2 114 545.09 2.94
CWTH BK 2.75 17-22 10/03S700 000 698 320.00 0.98USDWESTPAC BANKING 2.75 17-23 11/01S357 000 354 890.13 0.49USDWESTPAC BANKING CORP 3.3 19-24 26/02S300 000 303 531.00 0.42USDWOODSIDE FINANC 4.5000 19-29 04/03S444 000 453 252.96 0.63USD
BANK OF MONTREAL 3.3 19-24 05/02S250 000 252 470.00 0.35USD
CANADA/CANADA 2 232 745.15 3.11
CANADIAN IMPERIAL BANK 3.5 18-23 13/09S200 000 205 164.00 0.29USDCANADIAN NATL RAILWAY 4.5 18-49 20/01S100 000 113 344.00 0.16USDCPPIB CAPITAL I 2.3750 18-21 29/01S500 000 499 255.00 0.69USDNUTRIEN LTD 3.15 18-22 01/10S100 000 99 880.00 0.14USDNUTRIEN LTD 4.2000 19-29 01/04S119 000 122 518.83 0.17USDROYAL BANK OF CANADA 2.125 17-20 02/03S319 000 317 494.32 0.44USDROYAL BANK OF CANADA 3.70 18-23 05/10S500 000 516 370.00 0.72USDWASTE CONNECTIO 4.2500 18-28 01/12S100 000 106 249.00 0.15USD
BPCE S.A 5.95 18-49 01/04S100 000 104 788.00 0.15USD
FRANCE/FRANCE 104 788.00 0.15
AERCAP IRELAND 4.4500 18-25 01/10S50 000 50 354.50 0.07USD
IRELAND/IRLANDE 603 923.60 0.84
AERCAP IRELAND CAP 3.65 17-27 21/07S222 000 207 110.46 0.29USDGE CAPITAL INTL 4.418 16-35 15/11S374 000 346 458.64 0.48USD
ALLERGAN FUNDING 4.55 15-35 15/03S57 000 56 010.48 0.08USD
LUXEMBOURG/LUXEMBOURG 289 742.32 0.40
CATERPILLAR FIN 3.65 18-23 07/12S150 000 156 285.00 0.21USDUNITED AIR 2019-1 AA 4.15 19-31 25/08S75 000 77 446.84 0.11USD
ASB BANK LTD 3.75 18-23 14/06S315 000 321 627.60 0.45USD
NEW ZEALAND/NOUVELLE ZELANDE 321 627.60 0.45
TELEFONICA EMIS SA 7.045 06-36 20/06S64 000 78 273.92 0.11USD
SPAIN/ESPAGNE 78 273.92 0.11
CNH INDUSTRIAL NV 3.85 17-27 15/11S132 000 126 247.44 0.18USD
THE NETHERLANDS/PAYS-BAS 340 033.14 0.47
LYB INTL FIN 4.875 14-44 15/03S132 000 129 576.48 0.17USDSHELL INT FIN 4.00 16-46 10/05S81 000 84 209.22 0.12USD
ANGLO AMER CAP 144A 4.50 18-28 15/03S200 000 200 186.00 0.28USD
UNITED KINGDOM/ROYAUME-UNI 915 570.12 1.27
ANGLO AMER CAP 144A 4.875 15-25 14/05S125 000 130 308.75 0.18USDRECKITT 144A 2.75 17-24 26/06S366 000 359 939.04 0.50USDVODAFONE GROUP PLC 5.00 18-38 30/05S227 000 225 136.33 0.31USD
ABBOTT LABORATORIE 3.75 16-26 30/03M73 000 75 988.62 0.11USD
UNITED STATES/ÉTATS-UNIS 47 785 110.01 66.48
ABBVIE INC 4.45 16-46 14/05S61 000 56 627.52 0.08USDABBVIE INC 4.8750 18-48 14/11S103 000 101 440.58 0.14USDABBVIE INC 4.25 18-28 14/11S225 000 229 794.75 0.32USD
Schedule of investments as at 31/03/2019 / Inventaire du portefeuille au 31/03/2019
USD
Market ValueNumber of Shares orNominal Value
Investment % of Net AssetsQuotationCurrency
Valeur de marchéNombre d'actions ouvaleur nominale
Investissement % de l'actif netDevise decotation

The accompanying notes form an integral part of these financial statements.Les notes annexées font partie intégrante de ces états financiers.
273PrivilEdge - PPM America US Corporate Bond · 31/03/2019
ALEXANDRIA REAL 3.8000 19-26 15/04S34 000 34 466.82 0.05USDALLERGAN FINANCE LLC 3.25 12-22 01/10S106 000 105 950.18 0.15USDAMAZON 4.05 18-47 22/08S159 000 168 228.36 0.23USDAMEREN ILLINOIS 3.7 17-47 28/11S117 000 115 736.40 0.16USDAMERICAN EXPR. 3.7 18-23 03/08S100 000 102 617.00 0.14USDAMERICAN INTL G 4.7500 18-48 01/04S243 000 241 584.76 0.34USDAMERICAN TOWER 3.30 16-21 15/02S268 000 270 004.64 0.38USDAMERICAN WATER CAPITAL 4.20 18-48 01/09S150 000 156 276.23 0.22USDAMGEN INC 4.663 16-51 15/06S110 000 110 844.80 0.15USDANDEAVOR LOGIS LP 4.25 17-27 01/12S146 000 147 019.08 0.20USDANHEUSER BUSCH INBEV 5.45 19-39 23/03S125 000 135 555.00 0.19USDANHEUSER-BUSCH INBEV 4.75 19-29 23/01S100 000 106 760.00 0.15USDAPPLE 4.65 16-46 23/03S300 000 339 405.00 0.47USDASCENSION HEALTH 3.945 16-46 15/11S79 000 81 078.53 0.11USDASHTEAD CAPITAL 5.2500 18-26 01/08S171 000 175 061.25 0.24USDATHENE 3.0 17-22 03/07S137 000 136 654.08 0.19USDAT&T 4.35 19-29 01/03S390 000 399 079.20 0.56USDAT&T 4.50 16-48 09/03S105 000 98 876.40 0.14USDAT&T INC 4.50 15-35 15/05S375 000 369 742.50 0.51USDAT&T INC 4.8500 19-39 01/03S136 000 137 036.32 0.19USDAVIATION CAPITAL G 2.875 17-22 20/01S163 000 160 638.70 0.22USDBANK OF AMERICA 4.10 13-23 24/07S262 000 274 088.68 0.38USDBANK OF AMERICA SUB 3.95 15-25 21/04S177 000 180 246.18 0.25USDBAT CAPITAL CORP 4.39 18-37 15/08S115 000 103 529.90 0.14USDBAT CAPITAL CORP 4.54 18-47 15/08S217 000 190 554.21 0.27USDBAYER US FINANC 4.3750 18-28 15/12S20 000 19 888.20 0.03USDBAYER US FINANCE 4.25 18-25 15/12S130 000 131 696.50 0.18USDBERKSHIRE HATHAWAY 4.25 19-49 15/01S150 000 157 494.00 0.22USDBERKSHIRE HATHAWAY 4.2000 18-48 15/08S75 000 78 245.25 0.11USDBOSTON PROPERTIES 2.75 16-26 01/10S18 000 17 087.94 0.02USDBOSTON PROPERTIES 4.5 18-28 01/12S72 000 76 623.12 0.11USDBP CAP MARKETS 3.7960 18-25 21/09S250 000 259 970.00 0.36USDBP CAPITAL MARKETS 2.750 18-23 10/05S163 000 162 634.88 0.23USDBROADCOM CORP 3.875 18-27 15/01S271 000 258 899.85 0.36USDBROOKLYN UNION 3.8650 19-29 04/03S150 000 155 139.00 0.22USDBURLINGTN NORTH SA 4.05 18-48 15/06S128 000 132 253.44 0.18USDCAPITAL ONE FINANC 3.30 17-24 30/10S132 000 130 734.12 0.18USDCELGENE CORP 4.35 17-47 15/11S138 000 134 957.10 0.19USDCF INDUSTRIES 144A 4.50 16-26 01/12S132 000 133 836.12 0.19USDCHARTER COM 5.7500 18-48 01/04S237 000 247 537.02 0.34USDCIGNA CORPORATION 3.7500 18-23 15/07S37 000 37 940.91 0.05USDCIGNA CORPORATION 4.1250 18-25 15/11S150 000 155 481.00 0.22USDCIGNA CORPORATION 4.9000 18-48 15/12S100 000 103 501.00 0.14USDCIGNA CORPORATION 4.3750 18-28 15/10S125 000 129 941.25 0.18USDCINTAS CORPORATION 3.70 17-27 01/04S338 000 347 261.20 0.48USDCITIBANK 3.65 19-24 23/01S300 000 309 495.00 0.43USDCITIGROUP 4.45 15-27 29/09S280 000 287 669.20 0.40USDCITIGROUP INC 3.20 16-26 21/10S587 000 574 637.78 0.80USDCOLUMBIA PIPE 4.5 16-25 01/12S156 000 162 949.80 0.23USDCOMCAST 3.40 16-46 15/07S156 000 138 534.24 0.19USDCOMCAST CORP 3.4500 18-21 01/10S106 000 108 146.50 0.15USDCOMCAST CORP 4.2500 18-30 15/10S330 000 351 265.20 0.49USDCOMCAST CORP 4.6000 18-38 15/10S109 000 116 851.27 0.16USDCOMCAST CORP 4.7000 18-48 15/10S46 000 50 144.60 0.07USDCONCHO RESOURCES INC 4.875 17-47 01/10S62 000 65 706.98 0.09USDCONNECTICUT LIGHT 4.00 18-48 01/04S54 000 56 214.54 0.08USDCONS EDISON CO NY 4.45 14-44 15/03S166 000 175 911.86 0.24USDCORNING INC 5.85 18-68 15/11S151 000 164 488.67 0.23USD
Schedule of investments as at 31/03/2019 / Inventaire du portefeuille au 31/03/2019
USD
Market ValueNumber of Shares orNominal Value
Investment % of Net AssetsQuotationCurrency
Valeur de marchéNombre d'actions ouvaleur nominale
Investissement % de l'actif netDevise decotation

The accompanying notes form an integral part of these financial statements.Les notes annexées font partie intégrante de ces états financiers.
274 PrivilEdge - PPM America US Corporate Bond · 31/03/2019
CROWN CASTLE INTL 3.15 18-23 15/07S179 000 178 908.71 0.25USDCROWN CASTLE INTL 3.80 18-28 15/02S100 000 99 531.00 0.14USDCSX CORP 4.75 18-48 15/11S23 000 24 946.03 0.03USDCSX CORP 4.5000 19-49 15/03S400 000 419 088.00 0.58USDCVS CAREMARK 6.036 09-28 10/12M88 371 95 861.12 0.13USDCVS HEALTH CORP 4.30 18-28 25/03S50 000 50 811.50 0.07USDCVS HEALTH CORP 4.78 18-38 25/03S173 000 171 809.76 0.24USDCVS HEALTH CORP 5.05 18-48 25/03S376 000 379 414.08 0.53USDDAIMLER FINANCE 2.30 17-20 06/01S169 000 168 144.86 0.23USDDAIMLER FINANCE 3.7500 18-21 05/11S150 000 152 649.00 0.21USDDIAMOND 1 FIN 144A 5.45 16-23 15/06S100 000 106 632.00 0.15USDDIAMOND 1 FIN 144A 6.02 16-26 15/06S169 000 182 160.03 0.25USDDOLLAR TREE 3.7000 18-23 15/05S126 000 127 925.28 0.18USDDOLLAR TREE 4.2000 18-28 15/05S175 000 174 490.75 0.24USDDOWDUPONT INC 5.4190 18-48 15/11S90 000 101 895.30 0.14USDDTE ELECTRIC CO 4.05 18-48 15/05S205 000 213 999.50 0.30USDDUKE ENERGY PRO 3.4500 19-29 15/03S150 000 153 813.00 0.21USDDUKE ENERGY PROGRESS 4.10 13-43 15/03S125 000 130 163.75 0.18USDELI LILLY & CO 3.3750 19-29 15/03S400 000 410 956.00 0.57USDENERGY TRANSFER 4.75 15-26 15/01S323 000 337 870.92 0.47USDENERGY TRANSFER 5.2500 19-29 15/04S47 000 50 481.29 0.07USDENERGY TRANSFER 5.8000 18-38 15/06S48 000 51 052.80 0.07USDENERGY TRANSFER OPE 6.25 19-49 15/04S170 000 190 417.00 0.26USDENTERPRISE PROD 4.1500 18-28 16/10S200 000 210 620.00 0.29USDENTERPRISE PROD 4.8000 18-49 01/02S51 000 54 324.18 0.08USDENTERPRISE PRODUCTS 4.85 13-44 15/03S155 000 165 253.25 0.23USDEQM MIDSTREAM P 4.7500 18-23 15/07S350 000 357 248.50 0.50USDESSEX PORTFOLIO 4.0000 19-29 01/03S50 000 51 194.50 0.07USDEVERSOURCE ENERGY 3.8 18-23 01/12S125 000 129 616.25 0.18USDEXPRESS SCRIPTS HOL 3.05 17-22 30/11S138 000 138 135.65 0.19USDFISERV INC 3.8 18-23 01/10S211 000 216 707.55 0.30USDFIVE CORNERS FDG 4.419 13-23 15/11S243 000 256 354.91 0.36USDFLORIDA POWER & 3.9900 19-49 01/03S450 000 471 978.00 0.66USDFLORIDA POWER LIGHT 4.125 18-48 01/06S217 000 232 450.40 0.32USDFORD MOTOR 5.291 16-46 08/12S99 000 83 181.78 0.12USDFORD MOTOR CO 7.45 99-31 16/07S30 000 32 106.90 0.04USDFOX CORP 4.709 19-29 25/01S53 000 56 841.97 0.08USDFOX CORP 5.476 19-39 25/01S144 000 159 458.40 0.22USDGATX CORP 4.7000 19-29 01/04S71 000 74 029.57 0.10USDGENERAL MILLS 4.7000 18-48 17/04S132 000 131 937.96 0.18USDGENERAL MOTORS CO 5.95 18-28 12/09S45 000 43 667.10 0.06USDGENERAL MOTORS FIN 4.35 18-25 09/04S279 000 278 182.53 0.39USDGILEAD SCIENCES INC 4.80 14-44 01/04S191 000 201 438.15 0.28USDGLENCORE FUNDIN 4.8750 19-29 12/03S200 000 202 452.00 0.28USDGLENCORE FUNDING 3.875 17-27 27/10S236 000 226 694.52 0.32USDGLP CAPITAL LP 5.2500 18-25 01/06S200 000 210 084.00 0.29USDGOLDMAN SACHS GROU 3.50 16-26 16/11S55 000 54 138.15 0.08USDGOLDMAN SACHS GRP 3.85 14-24 08/07S140 000 143 010.00 0.20USDHALLIBURTON CO 5.00 15-45 15/11S59 000 63 114.66 0.09USDHEWLETT PACKARD 6.20 16-35 15/10S61 000 65 395.66 0.09USDHOLLYFRONTIER CORP 5.875 16-26 01/04S81 000 86 719.41 0.12USDHOME DEPOT 4.875 13-44 10/09S85 000 97 543.45 0.14USDINTERCONTINENTAL 4.25 18-48 13/08S39 000 41 002.26 0.06USDJERSEY CENTRAL 4.3000 15-26 15/01S50 000 52 094.50 0.07USDJP MORGAN CHASE 2.972 16-23 15/01S355 000 355 571.55 0.49USDJPMORGAN CHASE & C 2.95 16-26 01/10S253 000 247 082.33 0.34USDKEY BANK NA 3.3500 18-21 15/06S350 000 355 162.50 0.49USDKINDER MORGAN ENERGY 5.05 15-46 15/02S90 000 92 328.30 0.13USD
Schedule of investments as at 31/03/2019 / Inventaire du portefeuille au 31/03/2019
USD
Market ValueNumber of Shares orNominal Value
Investment % of Net AssetsQuotationCurrency
Valeur de marchéNombre d'actions ouvaleur nominale
Investissement % de l'actif netDevise decotation

The accompanying notes form an integral part of these financial statements.Les notes annexées font partie intégrante de ces états financiers.
275PrivilEdge - PPM America US Corporate Bond · 31/03/2019
KINDER MORGAN INC/D 5.55 14-45 01/06S46 000 50 433.94 0.07USDKKR GROUP 144A 5.125 14-44 01/06S93 000 95 432.04 0.13USDKRAFT HEINZ FOODS 5.20 16-45 15/07S95 000 91 872.60 0.13USDLAFARGE HOLCIM 4.75 16-46 22/09S200 000 186 670.00 0.26USDLAZARD GROUP LLC 4.5 18-28 19/09S150 000 154 873.50 0.22USDLIBERTY MUTUAL GROUP 4.85 14-44 01/08S172 000 177 242.90 0.25USDLINCOLN NATIONAL CORP 4.35 18-48 01/03S95 000 94 807.15 0.13USDLOCKHEED MARTIN 4.70 15-46 15/05S103 000 115 831.74 0.16USDMAPLE ESCROW SUBS 4.417 18-25 25/05S150 000 155 644.50 0.22USDMARATHON OIL 3.85 15-25 01/06S128 000 129 532.16 0.18USDMARS INC 3.8750 19-39 01/04S200 000 202 538.00 0.28USDMEAD JOHNSON NUTRI 3.00 15-20 15/11S400 000 401 248.00 0.56USDMERCK & CO INC 3.4000 19-29 07/03S300 000 308 028.00 0.43USDMETROPOLITAN LIFE 144A3.00 12 23 10/01S100 000 100 399.60 0.14USDMICROSOFT CORP 3.70 16-46 08/08S146 000 149 156.52 0.21USDMICROSOFT CORP 3.30 17-27 06/02S224 000 230 294.40 0.32USDMORGAN STANLEY 3.625 17-27 20/01S261 000 261 775.17 0.36USDMORGAN STANLEY 4.375 17-47 22/01S82 000 84 698.62 0.12USDMORGAN STANLEY -F- 2.50 16-21 21/04S177 000 175 929.15 0.24USDMORGAN STANLEY SUB F 4.35 14-26 08/09S174 000 178 671.90 0.25USDMPLX 4.875 16-24 01/12S121 000 129 355.05 0.18USDMPLX LP 5.20 17-47 01/03S61 000 62 180.35 0.09USDMPLX LP 4.8000 18-29 15/02S45 000 47 417.40 0.07USDMPLX LP 5.5000 18-49 15/02S94 000 100 439.94 0.14USDMYLAN INC 5.20 18-48 15/04S99 000 89 706.87 0.12USDNARRAGANSETT 3.919 18-28 27/07S154 000 159 457.76 0.22USDNBCUNIVERSAL ENT 5.25 13-XX 19/03Q108 000 109 890.00 0.15USDNEVADA POWER CO 3.7000 19-29 01/05S85 000 87 916.35 0.12USDNORTHERN NATURA 4.3000 18-49 15/01S100 000 102 477.00 0.14USDORACLE 2.65 16-26 15/07S135 000 130 982.40 0.18USDORACLE CORP 4.00 17-47 15/11S161 000 161 977.27 0.23USDPACIFICORP 4.1500 19-50 15/02S300 000 312 315.00 0.43USDPACIFICORP 4.125 18-49 15/01S200 000 207 372.00 0.29USDPATTERSON UTI EN. 3.95 18-28 01/08S17 000 16 158.51 0.02USDPFIZER INC 3.4500 19-29 15/03S250 000 256 757.50 0.36USDPFIZER INC 4.0000 19-49 15/03S250 000 258 905.00 0.36USDPHILIP MORRIS INTERN 4.125 13-43 04/03S101 000 95 690.43 0.13USDPPL ELECTRIC UT 4.1500 18-48 15/06S100 000 105 314.60 0.15USDPRUDENTIAL FINA 4.3500 19-50 25/02S250 000 259 012.50 0.36USDPSEG POWER LLC 3.8500 18-23 01/06S250 000 256 087.25 0.36USDPUGET SOUND ENE 4.2230 18-48 15/06S100 000 106 406.45 0.15USDREGENCY CENTERS 4.6500 19-49 15/03S110 000 114 752.00 0.16USDRELIANCE STAND LIFE 3.85 18-23 19/09S269 000 274 759.56 0.38USDREPUBLIC SERVICES 3.95 18-28 15/05S76 000 79 701.20 0.11USDRPM INTERNATION 4.5500 19-29 01/03S300 000 305 109.00 0.42USDSABINE PASS 5.75 14-24 15/05S355 000 391 298.75 0.54USDSABINE PASS LIQUEFAC 5.875 17-26 30/06S252 000 280 342.44 0.39USDSIMON PROPERTY 3.375 17-27 01/12S132 000 132 744.48 0.18USDSOUTHERN CAL ED 4.1250 18-48 01/03S46 000 44 071.22 0.06USDSOUTHERN CALIFORNIA 4.125 18-48 01/06S155 000 161 548.75 0.22USDSOUTHWESTERN PUBLIC 3.40 16-46 15/08S123 000 113 187.74 0.16USDTARGET CORP 3.90 17-47 15/11S200 000 199 078.00 0.28USDTYSON FOODS 5.1 18-48 28/09S127 000 129 288.54 0.18USDUNION PACIFIC CORP 5.70 17-47 15/04S130 000 128 182.60 0.18USDUNION PACIFIC CORP 4.30 19-49 01/03S100 000 103 427.00 0.14USDUNITED PARCEL SERVICE 4.25 19-49 15/03S150 000 155 613.00 0.22USDUNITED TECHNO 3.95 18-25 16/08S92 000 95 744.40 0.13USDUNITED TECHNO. 4.625 18-48 16/08S58 000 61 488.70 0.09USD
Schedule of investments as at 31/03/2019 / Inventaire du portefeuille au 31/03/2019
USD
Market ValueNumber of Shares orNominal Value
Investment % of Net AssetsQuotationCurrency
Valeur de marchéNombre d'actions ouvaleur nominale
Investissement % de l'actif netDevise decotation

The accompanying notes form an integral part of these financial statements.Les notes annexées font partie intégrante de ces états financiers.
276 PrivilEdge - PPM America US Corporate Bond · 31/03/2019
UNITEDHEALTH GROUP INC 4.45 18-48 15/12S37 000 40 154.99 0.06USDUS BANCORP 3.15 17-27 27/04S115 000 115 514.05 0.16USDUS BANCORP 3.375 19-24 05/02S400 000 409 172.00 0.57USDUS TREASURY N/B 2.3750 18-21 15/04S2 000 000 2 004 218.76 2.80USDUS TREASURY N/B 2.375 19-24 29/02S2 300 000 2 315 992.20 3.23USDUS TREASURY NOTE 1.375 17-19 31/07S500 000 498 242.19 0.69USDUSA T NOTES 1.50 15-20 31/05S3 400 000 3 365 468.75 4.69USDUSA T NOTES 1.625 16-26 15/02S3 000 000 2 867 578.14 4.00USDUSA T-NOTES 1.00 12-19 31/08S1 500 000 1 491 210.95 2.08USDUSA TREASURY BONDS 2.50 15-45 15/02S2 924 000 2 763 180.00 3.85USDVERISK ANALYTICS 5.50 15-45 15/06S70 000 78 079.68 0.11USDVERIZON COMM 4.40 14-34 01/11S303 000 315 822.96 0.44USDVERIZON COMMUNI 3.8750 19-29 08/02S78 000 80 106.00 0.11USDVISA INC 4.30 15-45 14/12S120 000 132 484.80 0.18USDWAL-MART INC 2.35 17-22 15/12S163 000 162 193.15 0.23USDWALMART INC 3.4000 18-23 26/06S348 000 358 864.56 0.50USDWALT DISNEY 4.75 19-44 15/09S76 000 87 435.11 0.12USDWEC ENERGY GROUP 3.3750 18-21 15/06S300 000 303 272.70 0.42USDWELL FARGO SUB 4.90 15-45 17/11S79 000 84 601.10 0.12USDWELLS FARGO & COPANY 3.75 19-24 24/01S502 000 516 944.54 0.72USDWELLS FARGO BAN 3.6250 18-21 22/10S400 000 407 708.00 0.57USDWELLS FARGO CO 4.15 19-29 24/01S150 000 156 946.50 0.22USDWESTERN GAS PARTNERS 3.95 15-25 01/06S125 000 123 248.63 0.17USDWESTLAKE CHEMIC 3.6000 17-26 15/08S90 000 87 267.60 0.12USD
TORONTO-DOMINION FL.R 18-20 17/09Q300 000 300 573.00 0.42USD
FLOATING RATE NOTES/OBLIGATIONS À TAUX VARIABLE 7 398 318.67 10.29
CANADA/CANADA 300 573.00 0.42
CREDIT SUISSE GROUP FL.R 18-24 12/06S587 000 601 328.67 0.84USD
SWITZERLAND/SUISSE 601 328.67 0.84
BARCLAYS PLC FL.R 18-29 16/05S124 000 128 235.84 0.18USD
UNITED KINGDOM/ROYAUME-UNI 1 289 196.22 1.79
HSBC HOLDINGS P FL.R 18-24 18/05S439 000 447 964.38 0.62USDHSBC HOLDINGS P FL.R 19-25 11/03S300 000 304 410.00 0.42USDROYAL BK SCOTLN FL.R 19-25 22/03S200 000 202 096.00 0.28USDSANTANDER UK FL.R 18-24 15/11S200 000 206 490.00 0.29USD
BANK OF AMERICA FL.R 18-24 23/07S200 000 205 470.00 0.29USD
UNITED STATES/ÉTATS-UNIS 5 207 220.78 7.24
BANK OF AMERICA FL.R 19-50 15/03S260 000 267 430.80 0.37USDBANK OF AMERICA CORP FL.R 17-28 24/04S162 000 162 962.28 0.23USDBANK OF AMERICA CORP FL.R 18-24 05/03S375 000 380 801.25 0.53USDBANK OF AMERICA CORP FL.R 18-26 23/01S179 000 179 039.38 0.25USDCITIGROUP INC FL.R 18-23 24/01S161 000 161 690.69 0.22USDGENERAL ELECTRIC CO FL.R 16-XX 15/06S115 000 107 664.15 0.15USDGOLDMAN SACHS G FL.R 18-29 01/05S222 000 226 970.58 0.32USDGOLDMAN SACHS GROU FL.R 18-39 23/04S264 000 264 345.84 0.37USDGOLDMAN SACHS GROU 3.691 17-28 05/06S341 000 337 647.97 0.47USDJPMORGAN CHASE FL.R 18-24 05/12S500 000 519 130.00 0.72USDJPMORGAN CHASE FL.R 19-23 01/04S650 000 654 036.50 0.90USDJPMORGAN CHASE FL.R 18-22 18/06Q400 000 399 808.00 0.56USDJPMORGAN CHASE FL.R 18-29 23/07S200 000 209 024.00 0.29USDJPMORGAN CHASE FL.R 18-49 23/01S270 000 261 621.90 0.36USDJPMORGAN CHASE & CO FL.R 17-28 01/02S133 000 135 665.32 0.19USDMORGAN STANLEY EMTN FL.R 17-22 22/07Q266 000 267 481.62 0.37USDMORGAN STANLEY MEDIIU FL.R 19-30 23/01S250 000 263 722.50 0.37USD
Schedule of investments as at 31/03/2019 / Inventaire du portefeuille au 31/03/2019
USD
Market ValueNumber of Shares orNominal Value
Investment % of Net AssetsQuotationCurrency
Valeur de marchéNombre d'actions ouvaleur nominale
Investissement % de l'actif netDevise decotation

The accompanying notes form an integral part of these financial statements.Les notes annexées font partie intégrante de ces états financiers.
277PrivilEdge - PPM America US Corporate Bond · 31/03/2019
SUNTRUST FL.R 18-22 26/07S200 000 202 708.00 0.28USD
ACER 2018-1A A2 2.92 18-20 10/12M795 739 795 937.84 1.10USD
MORTGAGE AND ASSET BACKED SECURITIES/Titres de créances hypothécaires et assimilés 1 937 169.97 2.69
UNITED STATES/ÉTATS-UNIS 1 937 169.97 2.69
BWSTA 2018-1 A3 FL.R 18-22 15/12M116 000 116 854.03 0.16USDDLL SECURITIZATION 3.14 18-20 20/10M400 000 400 495.52 0.56USDMSC 2015-UBS8 A4 3.809 15-25 15/11M600 000 623 882.58 0.87USD
CPPIB CAP 3.125 18-23 25/09S250 000 256 857.50 0.36USD
Other transferable securities/Autres valeurs mobilières 5 479 270.33 7.62
BONDS/OBLIGATIONS 2 390 898.85 3.33
CANADA/CANADA 256 857.50 0.36
CORP NAC DE CBR CHL 4.375 19-49 05/02S200 000 203 140.00 0.28USD
CHILE/CHILI 203 140.00 0.28
NXP B V 5.35 18-26 01/03S59 000 63 249.77 0.09USD
THE NETHERLANDS/PAYS-BAS 63 249.77 0.09
ALTRIA GP 5.8 19-39 14/02S91 000 96 399.03 0.13USD
UNITED STATES/ÉTATS-UNIS 1 867 651.58 2.60
ANHEUSER 4.9 18-46 13/11S512 000 514 560.00 0.73USDAPOLLO MANAGEMENT HO 4.872 19-29 15/02S200 000 206 286.00 0.29USDAVIATION CAPITAL 4.375 18-24 30/01S79 000 80 627.60 0.11USDFIFTH THIRD 3.65 19-24 25/01S219 000 224 387.40 0.32USDGENERAL MOTORS 5.1 19-24 17/01S24 000 24 977.04 0.03USDMAPLE ESCROW 4.985 18-38 25/05S100 000 102 447.00 0.14USDMARATHON PETROLEUM 4.50 18-48 01/04S85 000 81 520.10 0.11USDUNITEDHEALTH 3.875 18-28 17/12S41 000 43 006.54 0.06USDUNIVERSITY OF CALIFOR 3.349 19-29 01/07S150 000 153 461.25 0.21USDVOLKSWAGEN 4.75 18-28 13/11S150 000 151 248.00 0.21USD3M COMPANY 2.75 19-22 22/02S187 000 188 731.62 0.26USD
BANK OF AMERICA FL.R 19-30 07/02S250 000 255 447.50 0.36USD
FLOATING RATE NOTES/OBLIGATIONS À TAUX VARIABLE 255 447.50 0.36
UNITED STATES/ÉTATS-UNIS 255 447.50 0.36
GMALT 2.89 18-20 26/09M59 867 59 887.49 0.08USD
MORTGAGE AND ASSET BACKED SECURITIES/Titres de créances hypothécaires et assimilés 2 832 923.98 3.93
LUXEMBOURG/LUXEMBOURG 59 887.49 0.08
BAMLL 2015-200P B 3.49 15-33 14/04M422 000 427 898.08 0.60USD
UNITED STATES/ÉTATS-UNIS 2 773 036.49 3.85
BANK 2017 3.624 17-60 01/06M208 000 211 712.72 0.29USDBCC FUNDING XIV LLC 2.96 18-23 20/06M125 718 125 587.16 0.17USDBMW FLOORPLAN 2.22 18-23 15/05M172 000 173 704.04 0.24USDDLL SECURITIZATION TRU 3.46 18-22 20/01M95 000 95 676.06 0.13USDFORDF 2016-3 A1 1.55 16-21 15/07M500 000 498 023.75 0.70USDGLS AUTO 3.35 18-22 10-10M49 979 50 068.34 0.07USDGMF FLOORPLAN 2.22 17-22 18/01M500 000 497 665.40 0.69USDUNITED 2.89 18-21 08/08M28 014 28 012.64 0.04USDVERIZON OWNER 17-3 2.06 17-22 20/04M500 000 496 606.50 0.69USDWFCM 2017-C38 A5 3.453 17-50 15/07A165 000 168 081.80 0.23USD
Schedule of investments as at 31/03/2019 / Inventaire du portefeuille au 31/03/2019
USD
Market ValueNumber of Shares orNominal Value
Investment % of Net AssetsQuotationCurrency
Valeur de marchéNombre d'actions ouvaleur nominale
Investissement % de l'actif netDevise decotation

The accompanying notes form an integral part of these financial statements.Les notes annexées font partie intégrante de ces états financiers.
278 PrivilEdge - PPM America US Corporate Bond · 31/03/2019
Schedule of investments as at 31/03/2019 / Inventaire du portefeuille au 31/03/2019
Futures Contracts/Contrats futures 0.0318 171.87US ULTRA BD CBT 30YR Caceis Bank 504 000.00 0.03USD 17 601.5630/06/20193US 10 YEARS NOTE Caceis Bank 993 750.00 0.00USD 0.0030/06/20198US 2 YEARS NOTE- CBT Caceis Bank 2 344 031.25 0.00USD 570.3130/06/201911
USD USD
Unrealised appreciation/(depreciation)
Underlying Intermediary % of NetAssets
Maturity Currency CommitmentNumber ofcontracts
Plus/(Moins) value non-réalisée
Sous-jacent Intermédiaire % de l'actifnet
Maturité Devise EngagementNombre decontrats
Forward Foreign Currency Exchange Contracts/Contrats de change à terme (0.02)(16 455.58)GBP 389 208.06 (0.01)USD (6 081.55)293 825.14 15/04/2019Caceis BankEUR 1 349 591.29 (0.01)USD (11 764.44)1 190 146.26 15/04/2019Caceis BankCHF 202 511.93 0.00USD 1 390.41202 816.40 15/04/2019Caceis Bank
USD
Unrealised appreciation/(depreciation)
Currency % of NetAssets
Amount bought Maturity Currency Amount soldCounterparty
Plus/(Moins) value non-réalisée
Devise % de l'actifnet
Montant acheté Maturité Devise Montant venduContrepartie

PrivilEdgeis an investment company
with variable capital ("SICAV")incorporated in Luxembourg
PrivilEdgeest une société d’investissement
à capital variable ("SICAV")enregistrée au Luxembourg RCS Luxembourg B0181207
PrivilEdge –Amber Event Europe
Unaudited semi-annual report · Rapport semestriel non révisé
31.03.2019

The accompanying notes form an integral part of these financial statements.Les notes annexées font partie intégrante de ces états financiers.
280 PrivilEdge - Amber Event Europe · 31/03/2019
ASSETS/ACTIF
46 181 720.04Investments in securities at market value/Portefeuille-titres à la valeur de marché (2):( EUR )45 661 125.87Acquisition cost/Coût d'acquisition
4 125.00Net options at market value/Position nette en options à la valeur de marché (2):( EUR )26 000.00Acquisition cost/Coût d'acquisition
12 690 248.43Cash and term deposits/Liquidité et dépôts à terme4 622.05Interest and dividends receivable, net/Intérêt et dividendes nets à recevoir8 386.23Unrealised appreciation on CDS/Plus-value non réalisée sur CDS (2)
75 138.71Unrealised appreciation on forward foreign currency exchange contracts/Plus-value non réalisée sur contrats de change àterme
(2)
29 173.59Other assets/Autres actifs58 993 414.05
LIABILITIES/PASSIF
532 257.45Bank overdrafts/Découverts bancaires911 253.96Payable on investments purchased/À payer sur achat de titres
35 637.08Management and distribution fees payable/Commission de gestion et de distribution à payer (3)127 174.00Taxes and expenses payable/Impôts et autres frais à payer
1 111.11Interest on swaps payable/Intérêt à payer sur swaps78 180.00Unrealised depreciation on futures contracts/Moins-value non réalisée sur contrats futures (2)
1 685 613.6057 307 800.45NET ASSET VALUE/VALEUR NETTE D'INVENTAIRE
Statement of net assets as at 31/03/2019 / État de l'actif net au 31/03/2019
NotesNotes EUR

The accompanying notes form an integral part of these financial statements.Les notes annexées font partie intégrante de ces états financiers.
281PrivilEdge - Amber Event Europe · 31/03/2019
Statement of operations and changes in net assets for the period from 01/10/2018 to 31/03/2019 / État desopérations et des variations de l'actif net pour la période du 01/10/2018 au 31/03/2019
NotesNotes EUR
31 482 172.31NET ASSET VALUE AT THE BEGINNING OF THE PERIOD/VALEUR NETTE D'INVENTAIRE AU DÉBUT DE LAPÉRIODE
INCOME/REVENUS
41 580.65Dividends, net/Dividendes, nets (2)20 448.54Interest on bonds, net/Intérêts sur obligations, nets (2)
83.92Bank interest/Intérêts bancaires62 113.11
EXPENSES/DÉPENSES
160 664.48Management fees/Commission de gestion (3)2.08Distribution fees/Frais de distribution (3)6.93Performance fees/Commission de performance (3)
38 267.46Bank interest and other expenses/Intérêts bancaires débiteurs et autres frais54 980.42Fixed Rate of Operational Costs/Taux Fixe de Coûts Opérationnels (4)28 832.71Interest on swaps, net/Intérêts sur contrats de swaps, nets
282 754.08(220 640.97)NET INVESTMENT LOSS/PERTE NETTE SUR INVESTISSEMENTS
(143 282.51)Net realised loss on sale of investments/Perte nette réalisée sur ventes d'investissements (2)(48 076.94)Net realised loss on options/Perte nette réalisée sur options
(164 132.66)Net realised loss on swaps/Perte nette réalisée sur swaps (2)(59 495.29)Net realised loss on futures contracts/Perte nette réalisée sur contrats futures(83 575.19)Net realised loss on foreign exchange/Perte nette réalisée sur opérations de change754 222.39Net realised gain on forward foreign currency exchange contracts/Gain net réalisé sur contrats de change à terme
35 018.83NET REALISED GAIN/GAIN NET RÉALISÉ
566 700.11Change in net unrealised appreciation or depreciation on investments/Variation de la plus ou moins-value nette non réaliséesur investissements
(2)
24 147.00Change in net unrealised appreciation or depreciation on options/Variation de la plus ou moins-value non réalisée sur options(3 975.20)Change in net unrealised appreciation or depreciation on CDS/Variation de la plus ou moins-value nette non réalisée sur
CDS(2)
(101 996.74)Change in net unrealised appreciation or depreciation on futures contracts/Variation de la plus ou moins-value nette nonréalisée sur contrats futures
(10 266.76)Change in net unrealised appreciation or depreciation on forward foreign currency exchange contracts/Variation de la plus oumoins-value nette non réalisée sur contrats de change à terme
509 627.24NET INCREASE IN NET ASSETS AS A RESULT OF OPERATIONS/AUGMENTATION NETTE DE L'ACTIF NETRÉSULTANT DES OPÉRATIONS
25 316 000.90Net subscriptions/(redemptions) including equalisation/Souscriptions/(rachats) nets incluant la régularisation57 307 800.45NET ASSET VALUE AT THE END OF THE PERIOD/VALEUR NETTE D'INVENTAIRE À LA FIN DE LA PÉRIODE

The accompanying notes form an integral part of these financial statements.Les notes annexées font partie intégrante de ces états financiers.
282 PrivilEdge - Amber Event Europe · 31/03/2019
100.0000 0.0000 0.0000 100.0000P - EUR - Distribution900 000.0000 0.0000 0.0000 900 000.0000IM - EUR - Capitalisation
0.0000 540 000.0000 0.0000 540 000.0000S - EUR - Capitalisation26 203.6990 109 271.1890 0.0000 135 474.8880M Seeding - USD - Hedged - Capitalisation29 707.9710 48 009.4680 0.0000 77 717.4390M Seeding - CHF - Hedged - Capitalisation
3 012.0000 0.0000 0.0000 3 012.0000M Seeding - CHF - Hedged - Distribution356 108.0000 114 159.1270 (51 500.0000) 418 767.1270M Seeding - EUR - Capitalisation
16 000.0000 0.0000 0.0000 16 000.0000M Seeding - GBP - Hedged - Capitalisation4 349.0000 0.0000 0.0000 4 349.0000M Seeding - GBP - Hedged - Distribution
1 746 989.0080 0.0000 (1 196 989.0080) 550 000.0000N Seeding - USD - Hedged - Capitalisation0.0000 201 328.7700 0.0000 201 328.7700N Seeding - CHF - Hedged - Capitalisation
160 177.2090 1 184 124.1760 0.0000 1 344 301.3850N Seeding - EUR - Capitalisation0.0000 120 204.0000 0.0000 120 204.0000N Seeding - EUR - Capitalisation
99 250.0000 0.0000 0.0000 99 250.0000N Seeding - GBP - Hedged - Distribution0.0000 1 369 893.0000 0.0000 1 369 893.0000U Seeding - EUR - Capitalisation
Statement of changes in the number of shares outstanding for the period from 01/10/2018 to 31/03/2019 / Étatdes variations du nombre d'actions pour la période du 01/10/2018 au 31/03/2019
Number of Shares01/10/2018/
Nombre d'actions01/10/2018
Number of Sharesissued/
Nombre d'actionsémises
Number of Sharesredeemed/
Nombre d'actionsrachetées
Number of Shares31/03/2019/
Nombre d'actions31/03/2019
30/09/201831/03/2019For the period ended/Pour la période clôturée au
Statistics / Statistiques
P - EUR - Distribution
997.229.9722
0.00
1 007.7110.0771
0.00
Net Asset Value/Valeur Nette d'InventaireNet Asset Value per share/Valeur Nette d'Inventaire par actionDividend per share paid to shareholders/Dividende par action payé aux actionnaires
EUR EUR
IM - EUR - Capitalisation
9 110 274.7310.1225
9 133 738.6510.1486
Net Asset Value/Valeur Nette d'InventaireNet Asset Value per share/Valeur Nette d'Inventaire par action
EUR EUR
S - EUR - Capitalisation
5 430 766.2010.0570
0.000.0000
Net Asset Value/Valeur Nette d'InventaireNet Asset Value per share/Valeur Nette d'Inventaire par action
EUR EUR
M Seeding - USD - Hedged - Capitalisation
1 381 111.6910.1946
265 748.3510.1416
Net Asset Value/Valeur Nette d'InventaireNet Asset Value per share/Valeur Nette d'Inventaire par action
USD USD

The accompanying notes form an integral part of these financial statements.Les notes annexées font partie intégrante de ces états financiers.
283PrivilEdge - Amber Event Europe · 31/03/2019
30/09/201831/03/2019For the period ended/Pour la période clôturée au
Statistics / Statistiques
M Seeding - CHF - Hedged - Capitalisation
774 041.279.9597
299 359.0810.0767
Net Asset Value/Valeur Nette d'InventaireNet Asset Value per share/Valeur Nette d'Inventaire par action
CHF CHF
M Seeding - CHF - Hedged - Distribution
30 072.959.9844
0.00
30 363.8610.0810
0.00
Net Asset Value/Valeur Nette d'InventaireNet Asset Value per share/Valeur Nette d'Inventaire par actionDividend per share paid to shareholders/Dividende par action payé aux actionnaires
CHF CHF
M Seeding - EUR - Capitalisation
4 192 877.3710.0124
3 591 640.0210.0858
Net Asset Value/Valeur Nette d'InventaireNet Asset Value per share/Valeur Nette d'Inventaire par action
EUR EUR
M Seeding - GBP - Hedged - Capitalisation
161 365.1410.0853
161 799.1210.1124
Net Asset Value/Valeur Nette d'InventaireNet Asset Value per share/Valeur Nette d'Inventaire par action
GBP GBP
M Seeding - GBP - Hedged - Distribution
43 866.5910.0866
0.00
43 979.0810.1125
0.00
Net Asset Value/Valeur Nette d'InventaireNet Asset Value per share/Valeur Nette d'Inventaire par actionDividend per share paid to shareholders/Dividende par action payé aux actionnaires
GBP GBP
N Seeding - USD - Hedged - Capitalisation
5 621 549.6410.2210
17 726 009.0810.1466
Net Asset Value/Valeur Nette d'InventaireNet Asset Value per share/Valeur Nette d'Inventaire par action
USD USD
N Seeding - CHF - Hedged - Capitalisation
2 006 335.589.9655
0.000.0000
Net Asset Value/Valeur Nette d'InventaireNet Asset Value per share/Valeur Nette d'Inventaire par action
CHF CHF
N Seeding - EUR - Capitalisation
13 480 305.7510.0277
1 616 313.3710.0908
Net Asset Value/Valeur Nette d'InventaireNet Asset Value per share/Valeur Nette d'Inventaire par action
EUR EUR

The accompanying notes form an integral part of these financial statements.Les notes annexées font partie intégrante de ces états financiers.
284 PrivilEdge - Amber Event Europe · 31/03/2019
30/09/201831/03/2019For the period ended/Pour la période clôturée au
Statistics / Statistiques
N Seeding - EUR - Capitalisation
1 205 852.0910.0317
0.00
0.000.0000
0.00
Net Asset Value/Valeur Nette d'InventaireNet Asset Value per share/Valeur Nette d'Inventaire par actionDividend per share paid to shareholders/Dividende par action payé aux actionnaires
EUR EUR
N Seeding - GBP - Hedged - Distribution
1 003 328.9310.1091
0.00
1 004 389.9310.1198
0.00
Net Asset Value/Valeur Nette d'InventaireNet Asset Value per share/Valeur Nette d'Inventaire par actionDividend per share paid to shareholders/Dividende par action payé aux actionnaires
GBP GBP
U Seeding - EUR - Capitalisation
13 734 432.8010.0259
0.000.0000
Net Asset Value/Valeur Nette d'InventaireNet Asset Value per share/Valeur Nette d'Inventaire par action
EUR EUR

The accompanying notes form an integral part of these financial statements.Les notes annexées font partie intégrante de ces états financiers.
285PrivilEdge - Amber Event Europe · 31/03/2019
Investments in securities at market value/Portefeuille-titres à la valeur de marché 46 181 720.04 80.59
CRCAM ALPES PROVENCE259 29 743.56 0.05EUR
Transferable securities admitted to an official stock exchange listing and/or dealt in on anotherregulated market/Valeurs mobilières admises à la cote officielle d'une bourse de valeurs et/ounégociées sur un autre marché réglementé
46 181 720.04 80.59
EQUITIES/ACTIONS 27 360 505.81 47.75
FRANCE/FRANCE 10 235 271.82 17.86
CRCAM BRIE PICARDIE CERT COOP D'INVEST6 326 173 965.00 0.30EURCRCAM DU LANGUEDOC CERT COOP D'INVT767 58 268.99 0.10EURCRCAM HAUTE-LOIRE - CERT.COOP D'INVEST325 31 313.75 0.05EURCRCAM L'ILLE ET VILAINE - CERT COOP D'IN445 45 612.50 0.08EURCRCAM MORBIHAN - CERT.COOP D'INVEST594 55 836.00 0.10EURCRCAM NORD FRANCE CERT.COOP.INVT.6 704 160 225.60 0.28EURCRCAM NORMANDIE CCI CERT.COOP.INVT.227 32 465.54 0.06EURCRCAM PARIS IDF - CERT.COOP.D'INVEST465 45 839.70 0.08EURCRCAM SRA - CERT COOP D'INVEST146 31 660.10 0.06EURCRCAM TOULOUSE386 48 883.04 0.09EURCRCAM TOURAINE CERT.COOP.INVT.257 28 331.68 0.05EURCREDIT AGRICOLE MUTUEL ATLANTIQUE VENDEE422 59 797.40 0.10EURLAGARDERE GROUPE SCA NOM210 229 4 818 448.68 8.40EURNEXANS SA27 815 737 931.95 1.29EURSUEZ ACT.315 183 3 722 311.23 6.50EURWENDEL SA1 377 154 637.10 0.27EUR
HELLENIC TELECOMMUNICATIONS ORGANISATION70 511 841 901.34 1.47EUR
GREECE/GRÈCE 841 901.34 1.47
ASTM50 157 1 216 307.25 2.12EUR
ITALY/ITALIE 10 403 452.49 18.16
BANCA POPOLARE DI SONDRIO779 708 1 900 928.10 3.32EURBUZZI UNICEM -AZ.DI RISP.NON CONV.217 211 2 519 647.60 4.41EURCERVED GROUP S.P.A.95 341 844 721.26 1.47EURFILA SPA140 483 1 792 563.08 3.13EURTELECOM ITALIA SPA RISP NON CONV2 347 158 1 188 600.81 2.07EURUNICREDIT -REGISTERD SHARE82 314 940 684.39 1.64EUR
DISTRIBUCION INTEGRAL HOLDINGS68 436 1 437 156.00 2.51EUR
SPAIN/ESPAGNE 5 879 880.16 10.26
EDP RENOVAVEIS SA183 868 1 562 878.00 2.72EURINDRA SISTEMAS SA138 957 1 374 979.52 2.40EURUNICAJA BANCO1 570 842 1 504 866.64 2.63EUR
GERM TREA BILL ZCP 19-06-199 000 000 9 015 796.30 15.73EUR
BONDS/OBLIGATIONS 18 030 462.31 31.46
GERMANY/ALLEMAGNE 9 015 796.30 15.73
DUTCH TREASURY CERT ZCP 2706199 000 000 9 014 666.01 15.73EUR
THE NETHERLANDS/PAYS-BAS 9 014 666.01 15.73
INTESA SANPAOLO SP FL.R 15-49 17/03S470 000 397 644.65 0.69USD
FLOATING RATE NOTES/OBLIGATIONS À TAUX VARIABLE 790 751.92 1.38
ITALY/ITALIE 790 751.92 1.38
UNICREDIT REGS SUB FL.R 14-XX 03/06S470 000 393 107.27 0.69USD
Schedule of investments as at 31/03/2019 / Inventaire du portefeuille au 31/03/2019
EUR
Market ValueNumber of Shares orNominal Value
Investment % of Net AssetsQuotationCurrency
Valeur de marchéNombre d'actions ouvaleur nominale
Investissement % de l'actif netDevise decotation

The accompanying notes form an integral part of these financial statements.Les notes annexées font partie intégrante de ces états financiers.
286 PrivilEdge - Amber Event Europe · 31/03/2019
Net options at market value/Position nette en options à la valeur de marché 4 125.00 0.01
EURO STOXX 50 APR 3075.0 18.04.19 PUT125 4 125.00 0.01EUR
Options (Counterparties refer to Note 2)/Options (Contreparties voir la Note 2) 4 125.00 0.01
EUR
Market ValueNumber of Shares orNominal Value
Investment % of Net AssetsQuotationCurrency
Valeur de marchéNombre d'actions ouvaleur nominale
Investissement % de l'actif netDevise decotation
Schedule of investments as at 31/03/2019 / Inventaire du portefeuille au 31/03/2019

The accompanying notes form an integral part of these financial statements.Les notes annexées font partie intégrante de ces états financiers.
287PrivilEdge - Amber Event Europe · 31/03/2019
ITRAXX SUB FINANCIALS S30 V1 MKTGOLDMAN SACHSINTERN.
0.01EUR 8 386.2320/12/2023400 000.00 Buy/Achat (1%)/Quarterly
Credit Default Swaps (CDS)/Credit Default Swaps (CDS) 0.018 386.23
Schedule of investments as at 31/03/2019 / Inventaire du portefeuille au 31/03/2019
EUR
Unrealised appreciation/(depreciation)
Description Counterparty % of NetAssets
Notional Maturity Currency Buy / SellProtection
Sub-FundReceives/(Pays)
Fixed RatePlus/(Moins) value non-
réaliséeDescription Contrepartie % de l'actif
netNominal Maturité Devise Achat /
VenteProtection
CompartimentReçoit/(Paie)
Taux Fixe
Futures Contracts/Contrats futures (0.14)(78 180.00)DJ EURO STOXX UTI Caceis Bank (522 920.00) (0.02)EUR (11 445.00)30/06/2019(34)DJ.STOXX 600 UTI Caceis Bank (496 800.00) (0.01)EUR (3 740.00)30/06/2019(32)EURO BUND FUTURE Caceis Bank 4 491 180.00 0.16EUR 92 020.0030/06/201927EURO STOXX BANK IDX Caceis Bank (1 349 940.00) 0.02EUR 9 515.0030/06/2019(302)EURO-OAT-FUTURES-EUX Caceis Bank (4 880 100.00) (0.24)EUR (134 260.00)30/06/2019(30)FTSE MIB INDEX Caceis Bank (933 345.00) (0.05)EUR (30 270.00)30/06/2019(9)
EUR EUR
Unrealised appreciation/(depreciation)
Underlying Intermediary % of NetAssets
Maturity Currency CommitmentNumber ofcontracts
Plus/(Moins) value non-réalisée
Sous-jacent Intermédiaire % de l'actifnet
Maturité Devise EngagementNombre decontrats
Forward Foreign Currency Exchange Contracts/Contrats de change à terme 0.1375 138.71CHF 2 475 985.59 0.07EUR 39 241.202 812 273.95 15/04/2019Caceis BankUSD 6 166 969.86 0.09EUR 52 447.456 991 155.46 15/04/2019Caceis BankGBP 1 410 552.48 (0.02)EUR (10 140.15)1 207 263.66 15/04/2019Caceis BankEUR 34 839.75 0.00CHF (85.21)31 074.56 15/04/2019Caceis BankEUR 12 366.08 0.00GBP 128.7014 473.15 15/04/2019Caceis BankEUR 880 935.00 (0.01)USD (6 453.28)776 526.85 26/04/2019Caceis Bank
EUR
Unrealised appreciation/(depreciation)
Currency % of NetAssets
Amount bought Maturity Currency Amount soldCounterparty
Plus/(Moins) value non-réalisée
Devise % de l'actifnet
Montant acheté Maturité Devise Montant venduContrepartie


PrivilEdgeis an investment company
with variable capital ("SICAV")incorporated in Luxembourg
PrivilEdgeest une société d’investissement
à capital variable ("SICAV")enregistrée au Luxembourg RCS Luxembourg B0181207
PrivilEdgeNotes to the financial statements · Notes aux états financiers
31.03.2019

Notes to the financial statements/Notes aux états financiers
PrivilEdge · 31/03/2019 290
NOTE 1. The Company/La Société PrivilEdge (the “Company”) is organised as a “Société d’Investissement à Capital Variable” (“SICAV”) under the Law of 10 August 1915 of the Grand Duchy of Luxembourg, as amended, (the “1915 Law”). The Company is qualified under Part I of the Law of 17 December 2010 (the “Law”), as amended, relating to undertaking for collective investment in transferable securities (“UCITS”). The Company was incorporated on 22 October 2013 for an unlimited period under the name of PrivilEdge. The Articles of Incorporation of the Company (the “Articles”) were last amended on 10 December 2014 and published in the Mémorial, Recueil des Sociétés et Associations, on 27 January 2015. The minimum share capital of the Company is the equivalent of EUR 1 250 000. On 22 October 2013, the Company has appointed Lombard Odier Funds (Europe) S.A. as its Management Company subject to the overall supervision and control of the Directors. The Management Company is subject to Chapter 15 of the Law and is authorised as an Alternative Investment Fund Manager under Chapter 2 of the Law of 12 July 2013 on alternative investment funds managers. PrivilEdge (la « Société ») est une « Société d’Investissement à Capital Variable » (SICAV) soumise à la Loi modifiée du 10 août 1915 du Grand-Duché de Luxembourg (la « Loi de 1915 »). La Société est enregistrée sous la Partie I de la Loi du 17 décembre 2010 (la « Loi »), telle que modifiée, en tant qu’Organisme de Placement Collectif en Valeurs Mobilières (« OPCVM »). La Société a été constituée le 22 octobre 2013 pour une durée indéterminée sous la dénomination de PrivilEdge. Les Statuts de la Société (les « Statuts ») ont été modifiés en dernier lieu le 10 décembre 2014 et ont été publiés dans le Mémorial, Recueil des Sociétés et Associations, le 27 janvier 2015. Le capital minimum de la Société est l’équivalent de EUR 1 250 000. Le 22 octobre 2013, la Société a désigné Lombard Odier Funds (Europe) S.A. en tant que Société de Gestion, nomination soumise à la supervision et au contrôle des Administrateurs. La Société de Gestion est soumise au Chapitre 15 de la Loi et est autorisée en tant que Gestionnaire de Fonds d’Investissement Alternatifs sous le Chapitre 2 de la Loi du 12 juillet 2013 concernant les gestionnaires de fonds d’investissement alternatifs. As at 31 March 2019, the following Sub-Funds were active/Au 31 mars 2019, les Compartiments actifs étaient les suivants : William Blair Global Leaders Wellington Large Cap US Research Sands US Growth Delaware US Large Cap Value WellsCap US Selective Equity Income Partners RMB Debt SMAM Japan Small and Mid Cap Fidelity Technology Ashmore Emerging Market Local Currency Bond Baird US Aggregate Bond Baird US Short Duration Bond Columbia US Short Duration High Yield DPAM European Real Estate H2O High Conviction Bonds American Century Emerging Markets Equity (formerly named/anciennement Aberdeen Emerging Market All Cap, renamed on/renommé le 01/11/2018) AXA IM Short Duration Inflation Bond Franklin Flexible Euro Aggregate Bond William Blair US Small and Mid Cap BlackRock Emerging Market Dynamic Bond JP Morgan Pan European Flexible Equity Moneta Best of France NN IP Euro Credit T. Rowe Price European High Yield Bond Flossbach von Storch Global Convertible Bond Payden Emerging Market Debt PPM America US Corporate Bond Amber Event Europe During the period, the Henderson Pan European Equity Sub-Fund has been closed on/Au cours de la période, le Compartiment Henderson Pan European Equity a été fermé le :07/12/2018. The Company issues common Shares: - Classes P, I, U and N, in accumulating (A Class) or distributing form (D Class), subject to minimum holding restriction, available to all investors. - Class M, in accumulating (A Class) or distributing form (D Class), dedicated to:
(i) financial intermediaries who provide discretionary portfolio management or independent advisory services, (ii) financial intermediaries who provide other investment services which are subject to separate fee arrangements with their clients and who do not or are not eligible to
receive and retain fees or commissions from third parties in relation to those services, (iii) other investors determined by the Board or the Management Company in their discretion,
- For the Amber Event Europe Sub-Fund, Class IM, in accumulating (A Class) or distributing form (D Class), dedicated to financial intermediaries subscribing on behalf of employees of Amber Capital UK LLP and its group.

Notes to the financial statements/Notes aux états financiers
PrivilEdge · 31/03/2019
291
The Directors may at their discretion decide to issue S Shares dedicated to institutional investors or qualified institutional investors as defined in paragraph 2.2 of the Prospectus, on a selective basis. All Sub-Funds may issue categories of Shares in their Reference Currency or in an Alternative Currency (CNH, EUR, USD, CHF, GBP, SEK, NOK, CAD, AUD, JPY, HKD and SGD) with a different currency hedging policy: No hedging or Systematic Hedging (SH). Each Class of Shares can also be created in “seeding” form at the inception of a Sub-Fund in order to entice investors to invest in a newly created Sub-Fund. Shares in “seeding” form offer lower Management Fee and/or Distribution Fee. The Shares issued are more fully described in the section “Statistics” of the different Sub-Funds. La Société émet des Actions ordinaires : - les Classes P, I, U et N, sous forme de capitalisation (Classe A) ou de distribution (Classe D), sous réserve de restriction de détention minimum, accessibles à tous les
investisseurs, - la Classe M, sous forme de capitalisation (Classe A) ou de distribution (Classe D), réservée aux :
(i) intermédiaires financiers qui fournissent des services de gestion de portefeuilles discrétionnaire ou des services de conseil indépendants, (ii) intermédiaires financiers qui fournissent d’autres services d’investissement soumis à des accords distincts relatifs aux frais avec leurs clients et qui ne reçoivent et ne
conservent pas, ou ne sont pas éligibles pour recevoir et conserver, des frais de commissions de tierces parties en lien avec ces services, (iii) autres investisseurs tel que déterminé, à leur discrétion, par le Conseil d’Administration ou la Société de Gestion,
- pour le Compartiment Amber Event Europe, la Classe IM sous forme de capitalisation (Classe A) ou de distribution (Classe D), réservée aux intermédiaires financiers souscrivant pour le compte des employés de Amber Capital UK LLP et de son groupe.
Le Conseil d’Administration peut, à sa libre appréciation, émettre des Actions institutionnelles (Classe S) en faveur d'investisseurs institutionnels ou d’investisseurs institutionnels qualifiés tels que définis au paragraphe 2.2 du Prospectus, sur une base sélective. Tous les Compartiments peuvent émettre des catégories d’Actions dans leur devise de référence ou dans une Devise Alternative (CNH, EUR, USD, CHF, GBP, SEK, NOK, CAD, AUD, JPY, HKD et SGD) avec une politique de couverture de change différente : pas de couverture ou couverture systématique (SH). Chaque Classe d’Actions peut également être créée sous forme « Maître » lors du lancement d’un Compartiment dans le but d’inciter les investisseurs à investir dans un Compartiment nouvellement créé. Les Classes d’Actions « Maître » offrent des taux inférieurs de Commission de Gestion et/ou d’une Commission de Distribution. Les Actions émises sont décrites en détail à la section « Statistiques » des différents Compartiments. NOTE 2. Significant Accounting Policies/Principales règles comptables The following is a summary of the significant accounting policies followed by the Company/Les principales règles comptables appliquées par la Société sont les suivantes : Presentation of the financial statements/Présentation des états financiers The accompanying financial statements have been prepared in accordance with generally accepted accounting principles in the Grand Duchy of Luxembourg. The Net Asset Value at period-end was calculated on the basis of exchange rates and the last available closing prices dated 29 March 2019. The Net Asset Value disclosed in financial statements may differ from the last dealing Net Asset Value due to accruals. The net income and the net realised gain/loss as disclosed in the Statement of Operations and Changes in Net Assets have been determined by using the accounting practice known as equalisation. Les présents états financiers ont été établis conformément aux dispositions et principes comptables généralement admis au Grand-Duché de Luxembourg. La Valeur Nette d’Inventaire à la clôture de la période a été calculée sur la base des taux de change et des derniers cours de clôture disponibles du 29 mars 2019. La Valeur Nette d’Inventaire détaillée dans les états financiers peut différer de la dernière Valeur Nette d’Inventaire publiée en raison des provisions sur frais. Les revenus nets ainsi que les gains ou pertes nets réalisés figurant dans l’état des opérations et des variations de l’actif net ont été déterminés selon la méthode comptable dite de régularisation. Income Equalisation Arrangements/Processus de régularisation des revenus Equalisation – net income/Régularisation – Revenu net An equalisation account is operated in order to avoid fluctuations in the net undistributed income attributable to Shares issued or redeemed. The account is credited with the equalisation amount included in the subscription price of the Shares issued and debited with the equalisation amount paid on redemption. On payment of a dividend, the balance of the equalisation account is included in the amount available for distribution to the Shareholders of those Classes. Un compte de régularisation est tenu dans le but d’éviter les fluctuations des revenus nets non distribués attribuables aux Actions émises ou rachetées. Il est crédité du montant de régularisation inclus dans le prix de souscription des Actions émises et débité du montant de régularisation payé au rachat. Au paiement d’un dividende, le solde du compte de régularisation est inclus dans le montant disponible en vue de la distribution aux Actionnaires de ces Classes. Equalisation – realised gains and losses/Régularisation – Bénéfices et pertes réalisés An equalisation account is operated in order to avoid fluctuations in the realised gains and losses attributable to Shares issued or redeemed. Equalisation is calculated on realised gains and losses arising from the disposal of investments, options, swaps, contract for difference, futures, foreign exchange and forward foreign currency exchange contracts. The account is credited with the equalisation amount included in the subscription price of the Shares issued and debited with the equalisation amount paid on redemption. Un compte de régularisation est tenu dans le but d’éviter les fluctuations des bénéfices et pertes réalisés attribuables aux Actions émises ou rachetées. La régularisation est calculée en fonction des gains et pertes réalisés lors de la vente de placements, d'options, de swaps, de contrat financier de différence, de futures, d'opérations sur devises et de contrats de change à terme. Le compte est crédité du montant de régularisation inclus dans le prix de souscription des Actions émises et débité du montant de régularisation versé lors du remboursement. The equalisation amounts are included within the caption “Net subscriptions including equalisation/net redemptions including equalisation” of the “Statement of operations and changes in net assets” of the Sub-Funds. Les montants de régularisation sont inclus dans la rubrique « Souscriptions nettes incluant la régularisation/rachats nets incluant la régularisation » de « l’Etat des opérations et des variations de l’actif net » des Compartiments.

Notes to the financial statements/Notes aux états financiers
PrivilEdge · 31/03/2019 292
Investments/Evaluation des titres All securities listed on a Stock Exchange or traded on any other regulated market are valued at the last available closing price on such stock exchange or market. If a security is listed on several Stock Exchanges or markets, the last available price on the Stock Exchange or market which constitutes the main market for such security will be prevailing. The investments in underlying target funds are valued on the basis of the latest available official Net Asset Value of the target funds, as reported or provided by underlying target funds administrators, managers, market makers or other sources believed to be reliable. Securities not listed on any Stock Exchange or traded on any regulated market are valued at their last available market price. Securities for which no price quotation is available, or for which the price referred to in the preceding paragraphs is not representative of the fair market value are valued prudently and in good faith on the basis of their reasonably foreseeable sales prices. In this case, commercial papers, money market instruments and short term securities are valued on an amortised cost basis (the recorded fair-value may not represent the proceeds which would be realised upon sale in due course). La valeur de tous les titres admis à la cote officielle d’une bourse de valeurs ou traités sur tout autre marché réglementé est établie sur la base du dernier prix de clôture connu sur ladite bourse ou ledit marché. Si un titre est coté sur plusieurs bourses ou marchés, le dernier prix connu sur la bourse ou le marché considéré comme le principal marché sur lequel ledit titre est négocié est pris en considération. Les investissements dans les fonds sous-jacents sont évalués sur base du dernier prix officiel disponible par Part du fonds sous-jacent, ces prix sont renseignés par les Administrateurs des fonds sous-jacents, les Gérants, les teneurs de marché ou toutes autres sources dignes de confiance. Les titres qui ne sont pas admis à la cote officielle d'une bourse de valeurs ou qui sont négociés sur tout marché réglementé sont évalués à leur dernier prix connu. Les titres pour lesquels aucun prix n'est disponible, ou pour lesquels le prix mentionné dans les paragraphes précédents n'est pas représentatif de leur vraie valeur de marché, sont évalués sur la base des prix de vente raisonnablement prévisibles, établis avec prudence et bonne foi. Dans ce cas, les billets de trésorerie, les instruments du marché monétaire et les titres à court terme sont évalués selon la méthode du coût amorti (il est possible que la juste valeur comptabilisée ne reflète pas les produits qui seraient réalisés lors de la vente en temps opportun). Dividend and Interest Income/Dividendes et intérêts Dividends are recognised as income on the “ex-date”. Interest income is recorded on an accrual basis. Les dividendes sont reconnus comme réalisés à la date de paiement du coupon (dividende « ex-date »). Les intérêts sont comptabilisés pro rata temporis. Securities Lending Income/Rémunération du prêt de titres Securities lending income is recognised on a cash basis and recorded in the financial statements under the heading “Securities Lending income”. La rémunération allouée en paiement du prêt de titres est effectuée en espèces et apparaît dans les états financiers sous le titre « Revenus sur prêt de titres ». Net Realised Gain/Loss on Sales of Investments/Gains et pertes nets réalisés sur ventes d'investissements The net realised gain/loss on sales of investments is determined on the basis of the average cost of investments sold. Les gains et pertes nets réalisés sur les ventes d'investissements sont évalués sur la base du coût moyen des placements vendus. Translation of Foreign Currencies/Conversion des devises étrangères The combined financial statements are expressed in USD, the reference currency of the Company. In each Sub-Fund, any assets or liabilities expressed in currencies other than the reference currency are translated into the reference currency at the prevailing market rate at the time of valuation. Transactions expressed in foreign currencies are translated at the rates ruling when they arose. Les états financiers combinés sont exprimés en USD, monnaie de référence de la Société. Dans chaque Compartiment, tous les postes de l’actif et du passif libellés en devises autres que la devise de référence sont convertis dans la devise de référence au cours du marché en vigueur au moment de l’évaluation. Les transactions exprimées en devises étrangères sont converties au taux de change historique. The principal exchange rates used at period-end in the whole report and to obtain the combined financial statements are the following/Les principaux taux de change utilisés en fin de période dans l’ensemble du rapport et pour obtenir les états financiers combinés sont les suivants : EUR 1 = CHF 1 = GBP 1 = JPY 1 = CNH 1 =
USD 1.12285 1.00411 1.30306 0.00903 0.14879 Forward Foreign Currency Exchange Contracts/Contrats de change à terme Outstanding forward foreign currency exchange contracts are valued at the closing date by reference to the rate of exchange applicable to the outstanding life of the contract. The movement in unrealised appreciation or depreciation is shown in the Statement of Operations and Changes in Net Assets. The unrealised appreciation/depreciation is included in the Statement of Net Assets in “Unrealised appreciation on forward foreign currency exchange contracts” and “Unrealised depreciation on forward foreign currency exchange contracts” respectively. Les contrats de change à terme en cours sont évalués à la date de clôture par référence au taux de change applicable à la durée résiduelle du contrat. La variation des plus-values ou moins-values non réalisées apparaît dans l’état des opérations et des variations de l'actif net. Les plus-values et moins-values non réalisées sont indiquées dans l’état de l’actif net sous les rubriques « Plus-value non réalisée sur contrats de change à terme » et « Moins-value non réalisée sur contrats de change à terme », respectivement. Futures and Options/Futures et options Futures and Options are valued at their liquidating value based upon the settlement price on the exchange on which the particular future or option is traded. For OTC options, the Central Administration provides independent pricing, based on marked to market or models.

Notes to the financial statements/Notes aux états financiers
PrivilEdge · 31/03/2019
293
Les contrats à terme et options sont évalués à leur valeur de liquidation, sur la base du prix de compensation appliqué sur le marché sur lequel ledit contrat à terme ou ladite option est négocié(e). Les options sur le marché gré à gré sont évaluées de manière indépendante par l’administration centrale grâce à une évaluation permanente de la position sur la base de sa valeur observée sur le marché ou grâce à d’autres modèles d’évaluation. The following table shows the counterparties with which are transacted options/Le tableau suivant indique les contreparties avec lesquelles sont conclues les options :
Sub-Funds Compartiments
Counterparties Contreparties
Currency Devise
Market Value by Counterparty Valeur de marché par
Contrepartie
Commitment by Counterparty Engagement par Contrepartie
H2O High Conviction Bonds Société Générale EUR 363 843 39 962 027 Goldman Sachs EUR (1 319) 562 914 Caceis Bank EUR (216 800) 21 279 211 Franklin Flexible Euro Aggregate Bond Caceis Bank EUR (12 920) 3 389 256 BlackRock Emerging Market Dynamic Bond Goldman Sachs USD (35 727) 8 442 718 Morgan Stanley USD (34 092) 4 749 535 Flossbach von Storch Global Convertible Bond Caceis Bank EUR (50 722) 1 473 488 Amber Event Europe Caceis Bank EUR (21 875) 213 672
Swaps An Interest Rate Swap (“IRS”) is a bilateral agreement in which each of the parties agree to exchange a series of interest payments for another series of interest payments (usually fixed/floating) based on a notional amount that serves as a computation basis and that is usually not exchanged. IRS are valued based on models. The unrealised appreciation/depreciation is recorded under “Unrealised appreciation/depreciation on IRS” in the Statement of Net Assets. The movement in such amounts is recorded under “Change in net unrealised appreciation/(depreciation) on IRS” and the realised under “Net realised gain/(loss) on swaps” in the Statement of Operations and Changes in Net Assets. A Credit Default Swap (“CDS”) is a credit derivative bilateral agreement in which one counterparty (the protection buyer) pays a periodic fee to the other party (the protection seller) for the specified life of the contract in return for a contingent payment by the protection seller upon occurrence of a credit event on any referenced issuers. If such an event occurs, the protection seller will then make payment to the buyer and the swap will terminate. In certain cases, the protection seller may take possession of the underlying securities. CDS are marked to model daily based upon spread of the market makers and the change in value, if any, is recorded as “Change in net unrealised appreciation or depreciation on CDS” in the Statement of Operations and Changes in Net Assets. Any payment received or paid to initiate a contract is recorded as a liability or asset in the Statement of Net Assets. When the swap contract is terminated early, the Company records a realised gain or loss for any payments received or paid. Un Swap sur Taux d’Intérêt (« IRS ») est un contrat bilatéral dans lequel chacune des parties s’engage à échanger une série de paiements d’intérêts contre une autre série de paiements d’intérêts (en général fixes/variables) à partir d’un montant nominal servant de base de calcul, celui-ci n’étant en principe pas échangé. Les Swaps sur Taux d’Intérêt sont valorisés grâce à des modèles d’évaluation. L’appréciation/dépréciation non réalisée est saisie aux postes « plus-value/moins-value non réalisée sur IRS » dans l’état de l’actif net. Le mouvement de ces montants est saisi sous « Variation de la plus ou moins-value nette non réalisée sur IRS » et le montant réalisé sous « Bénéfice/(perte) net(te) réalisé(e) sur swaps » dans l’état des opérations et variations de l’actif net. Un Credit Default Swap (« CDS ») est un contrat bilatéral de crédit derivé selon lequel une contrepartie (l'acheteur de protection) verse une prime périodique à l’autre partie (le vendeur de protection) pendant la durée spécifique du contrat en échange d'un paiement de contingent par le vendeur de protection lors d'un événement de crédit touchant les émetteurs référencés. Si un tel événement se produit, le vendeur de protection sera tenu d’effectuer le paiement à l'acheteur et le contrat swap se terminera. Dans certains cas, le vendeur de protection peut prendre possession des titres sous-jacents. Les CDS sont évalués par des modèles journaliers en fonction de diffusion des teneurs de marché et de changement de la valeur, le cas échéant, est comptabilisé comme une « Variation de la plus ou moins-value nette non réalisée sur CDS » dans l’état des opérations et des Variations de l’actif net. Tout paiement reçu ou payé pour initier un contrat est comptabilisé en tant que passif ou actif dans l'état de l’actif net. Lorsque le contrat de swap se termine plus tôt, la Société enregistre un gain ou une perte réalisé(e) de tous les paiements reçus ou payés. Formation/Reorganisation Expenses/Frais de constitution/réorganisation Any formation/reorganisation expenses for the Sub-Funds are amortised over a three year period, except for the initial Sub-Funds where the amortisation period is over five years. Les frais de constitution/réorganisation sont amortis sur une période de 3 ans, à l'exception des Compartiments lancés initialement pour lesquels la période d'amortissement est de 5 ans. Abbreviations used in schedule of investments/Abréviations utilisées dans l’inventaire du portefeuille FRN, FL.R: Floating Rate Notes/Obligations à taux variable XX: Perpetual Bonds/Obligations perpétuelles U or ZCP: Zero Coupon Bond/Obligation à zéro coupon RCV: Reverse Convertible/Reverse Convertible CV: Convertible/Convertible FV: Fair Valued investment/Titres évalués à leur juste valeur Q: Quarterly/Trimestriel A: Annual/Annuel S: Semi-Annual/Semestriel M: Monthly/Mensuel Example of maturity date:17-27 15/09A = from 15 September 2017 to 15 September 2027 with an annual Coupon payment Exemple de date de maturité : 17-27 15/09A = du 15 septembre 2017 au 15 septembre 2027 avec un paiement annuel de Coupon

Notes to the financial statements/Notes aux états financiers
PrivilEdge · 31/03/2019 294
NOTE 3. Management, Distribution and Performance Fees/Commissions de Gestion, de Distribution et de Performance Management and Distribution Fees/Commissions de Gestion et de Distribution For the Sub-Funds available for subscription, the Management Company receives Management Fees as detailed below (effective rates at period-end). The Company has entered into a Management Company agreement with Lombard Odier Funds (Europe) S.A. (the “Management Company”). Under this agreement, the Management Company was entrusted with the day-to-day management of the Company and with the responsibility to perform, directly or by way of delegation, all functions relating to the Company's investment management, administration and marketing, as well as distribution of the Company's Shares. The Management Company pays the compensation of the Investment Managers out of these Fees. The compensation of Investment Adviser(s), if any, is paid by the Management Company or the Investment Manager making the appointment. No Management Fee is payable on the S and IM Share Classes. Investors willing to subscribe S Shares have to enter into a remuneration agreement with the Company, the Management Company or any other entity of the Lombard Odier Group. For the services provided in the promotion and distribution of the Company’s Shares, the Management Company is entitled to a Distribution Fee, as detailed below (effective rates at period-end), on Classes P and R. No Distribution Fee is payable on Classes I, IM, S, M, U and N. The Management Company is entitled to appoint and remunerate Distributors out of these Fees. Management and Distribution Fees are calculated and accrued daily on the Net Asset Value of each Sub-Fund and payable monthly in arrears. The combined Management Fees, including those of the underlying funds, fall within the limit of 3.50% set out in the Prospectus. Pour les Compartiments ouverts aux souscriptions, la Société de Gestion perçoit une Commission de Gestion détaillée ci-après (taux effectifs à la fin de la période). La Société a conclu un contrat de Société de Gestion avec Lombard Odier Funds (Europe) S.A. (la « Société de Gestion »). En vertu de ce contrat, la Société de Gestion a endossé la responsabilité de la gestion quotidienne de la Société, que ce soit directement ou par délégation, à savoir l’ensemble des fonctions liées à la gestion des investissements, à l’administration de la Société ainsi qu’à la commercialisation et à la distribution des Actions de la Société. La Société de Gestion rémunère les Gérants à l’aide de cette Commission. La rémunération des Conseillers en investissement, le cas échéant, est versée par la Société de Gestion ou par le Gérant qui les a désignés. Aucune Commission de Gestion n’est prélevée sur les Classes S et IM. Les investisseurs souhaitant acquérir des Actions de la Classe S doivent passer un accord de rémunération avec la Société, la Société de Gestion ou toute autre entité du Groupe Lombard Odier. Pour les services liés à la promotion et à la distribution des Actions de la Société, la Société de Gestion perçoit des frais de Distribution, tels que détaillés ci-dessous (taux effectifs à la fin de la période), pour les Classes P et R. Aucuns frais de Distribution ne sont perçus pour les Classes I, IM, S, M, U et N. La Société de Gestion nomme et rémunère les Distributeurs à l’aide de ces frais. Les Commissions de Gestion et de Distribution sont calculées et comptabilisées quotidiennement sur la Valeur Nette d’Inventaire de chaque Compartiment et sont payables mensuellement en arriérés. Les Commissions de Gestion consolidées, y compris celles des fonds sous-jacents, tombent dans la limite de 3.50% fixée dans le prospectus.
Sub-Funds Compartiments
Management Fees Commission de Gestion Share Classes/Classes
Distribution Fees Commission de Distribution
Share Classes/Classes P R I M U N P R % % % % % % % % William Blair Global Leaders 1.10 1.10 0.85 1.10 - 1.00 0.70 1.55 Wellington Large Cap US Research 0.751) 0.751) 0.502) 0.85 - 0.65 0.65 1.55 Sands US Growth 1.10 - - 1.10 - 1.00 0.70 - Delaware US Large Cap Value 0.85 - 0.60 0.85 0.45 0.75 0.65 - WellsCap US Selective Equity 1.20 - 1.00 1.20 - 1.10 0.75 - Income Partners RMB Debt 0.80 - - 0.80 - 0.70 0.45 - SMAM Japan Small and Mid Cap 1.10 - 0.85 1.10 0.70 1.00 0.70 - Fidelity Technology 1.10 1.10 - 1.10 - 1.00 0.70 1.55 Ashmore Emerging Market Local Currency Bond 1.00 - 0.80 1.00 - 0.90 0.50 - Baird US Aggregate Bond - - 0.40 0.60 - 0.50 - - Baird US Short Duration Bond 0.60 - 0.40 0.60 - 0.50 0.40 - Columbia US Short Duration High Yield 0.80 - - 0.80 - 0.70 0.45 - DPAM European Real Estate 1.00 - 0.80 1.00 - 0.90 0.50 - H2O High Conviction Bonds 0.80 - 0.60 0.80 - 0.70 0.45 - American Century Emerging Markets Equity 1.103) - 0.854) 1.103) - 1.005) 0.706) - AXA IM Short Duration Inflation Bond 0.60 - 0.40 0.50 - 0.45 0.40 - Franklin Flexible Euro Aggregate Bond 0.60 - 0.40 0.60 - 0.50 0.40 - Henderson Pan European Equity 0.85 - 0.60 0.85 - 0.75 0.65 - William Blair US Small and Mid Cap 1.10 - 0.85 1.10 - 1.00 0.70 - BlackRock Emerging Market Dynamic Bond 1.00 - 0.80 1.00 - 0.90 0.50 - JP Morgan Pan European Flexible Equity 0.85 - 0.60 0.85 - 0.75 0.65 - Moneta Best of France 1.65 - 1.35 1.45 - 1.45 0.40 - NN IP Euro Credit 0.60 - 0.40 0.60 - 0.50 0.40 -

Notes to the financial statements/Notes aux états financiers
PrivilEdge · 31/03/2019
295
Sub-Funds Compartiments
Management Fees Commission de Gestion Share Classes/Classes
Distribution Fees Commission de Distribution
Share Classes/Classes P R I M U N P R % % % % % % % % T. Rowe Price European High Yield Bond 0.80 - 0.60 0.80 - 0.70 0.45 - Flossbach von Storch Global Convertible Bond 0.80 - 0.60 0.80 - 0.70 0.45 - Payden Emerging Market Debt - - 0.60 0.80 - 0.70 - - PPM America US Corporate Bond - - 0.40 0.60 - 0.50 - - Amber Event Europe 1.50 - - 1.25 0.50 1.00 0.50 -
The following changes of rates were effective on/Les changements de taux suivants sont entrés en vigueur le 01/11/2018: 1) Change from/Changement de 0.85% to/à 0.75% 2) Change from/Changement de 0.60% to/à 0.50% 3) Change from/Changement de 1.30% to/à 1.10% 4) Change from/Changement de 1.00% to/à 0.85% 5) Change from/Changement de 1.20% to/à 1.00% 6) Change from/Changement de 0.75% to/à 0.70% Performance Fees/Commissions Performance For some Sub-Funds, the Management Company is entitled to a Performance Fee amounting to a percentage of their performance as per calculation detailed in the Prospectus, in the section of each Sub-Fund concerned. A Performance Fee was accrued for the following Sub-Funds during the period under review: H2O High Conviction Bonds, Henderson Pan European Equity and Amber Event Europe. Pour certains Compartiments, la Société de Gestion est en droit de percevoir une Commission de Performance s’élevant à un pourcentage de leur performance selon le calcul décrit dans le Prospectus, dans la section de chaque Compartiment concerné. Une Commission de Performance a été provisionnée pour les Compartiments suivants au cours de la période sous revue : H2O High Conviction Bonds, Henderson Pan European Equity et Amber Event Europe. NOTE 4. Fixed Rate of Operational Costs/Taux Fixe de Coûts Opérationnels The Company pays to the Management Company a Fixed Rate of Operational Costs (“FROC”) as an annual percentage of the Net Asset Value of the relevant Share Classes of each Sub-Fund to cover all operating expenses except Transaction Fees, Stock Lending charges, Interest on Bank Overdraft and any Extraordinary expenses. The FROC is set per Class of Share according to criteria including but not limited to type of assets, size, distribution and publication requirements, type of investors, etc. and thus may vary from one Class to another. La Société paie à la Société de Gestion un Taux Fixe de Coûts Opérationnels (« FROC ») conçu comme un pourcentage annuel de la valeur liquidative de la catégorie d’Actions pour chaque Compartiment, afin de couvrir les frais opérationnels à l’exception des frais de Transaction, des frais générés par les prêts de titres, les intérêts débiteurs et toutes autres dépenses exceptionnelles. Le FROC est établi par Classe d'Action selon des critères incluant notamment, mais pas exclusivement, les actifs du Compartiment, la taille de la Classe, les obligations liées à la distribution et la publication, au type d'investisseurs, etc. ce qui peut, par conséquent, générer des variations de taux de FROC d'une Classe à l'autre. The effective rates (the “Effective FROC”) used are the following (the maximum fixed rates are set in the Prospectus): Les taux effectifs du FROC (« FROC Effectif ») appliqués sont les suivants (les taux fixes maximum sont détaillés dans le Prospectus) :
Sub-Funds Compartiments
Effective FROC/FROC effectif Share Classes/Classes
P R I IM S M U N % % % % % % % % William Blair Global Leaders 0.35 0.45 0.20 - - 0.251) - 0.252) Wellington Large Cap US Research 0.35 0.45 0.20 - - 0.251) - 0.252) Sands US Growth 0.35 - - - - 0.251) - 0.252) Delaware US Large Cap Value 0.35 - 0.20 - - 0.251) 0.14 0.252) WellsCap US Selective Equity 0.35 - 0.20 - - 0.251) - 0.252) Income Partners RMB Debt 0.45 - - - - 0.253) - 0.25 SMAM Japan Small and Mid Cap 0.45 - 0.25 - - 0.304) 0.14 0.305) Fidelity Technology 0.35 0.45 - - - 0.251) - 0.252) Ashmore Emerging Market Local Currency Bond 0.35 - 0.25 - - 0.251) - 0.25 Baird US Aggregate Bond - - 0.17 - - 0.206) - 0.207) Baird US Short Duration Bond 0.25 - - - - 0.206) - 0.207) Columbia US Short Duration High Yield 0.35 - 0.22 - - 0.208) - 0.209) DPAM European Real Estate 0.35 - 0.25 - - 0.251) - 0.25 H2O High Conviction Bonds 0.35 - 0.22 - - 0.251) - 0.2510)

Notes to the financial statements/Notes aux états financiers
PrivilEdge · 31/03/2019 296
Sub-Funds Compartiments
Effective FROC/FROC effectif Share Classes/Classes
P R I IM S M U N % % % % % % % % American Century Emerging Markets Equity 0.40 - 0.30 - - 0.3011) - 0.30 AXA IM Short Duration Inflation Bond 0.175 - 0.125 - - 0.2012) - 0.2013) Franklin Flexible Euro Aggregate Bond 0.25 - 0.17 - - 0.206) - 0.207) Henderson Pan European Equity 0.35 - 0.25 - - 0.251) - 0.25 William Blair US Small and Mid Cap 0.35 - 0.25 - 0.10 0.251) - 0.25 BlackRock Emerging Market Dynamic Bond 0.35 - 0.25 - - 0.251) - 0.25 JP Morgan Pan European Flexible Equity 0.35 - 0.25 - - 0.251) - 0.25 NN IP Euro Credit 0.25 - 0.17 - - 0.206) - 0.207) Moneta Best of France 0.35 - 0.25 - - 0.251) - 0.25 T. Rowe Price European High Yield Bond 0.35 - 0.22 - - 0.251) - 0.2510) Flossbach von Storch Global Convertible Bond 0.35 - 0.22 - - 0.208) - 0.209) Payden Emerging Market Debt - - 0.22 - - 0.251) - 0.2510) PPM America US Corporate Bond - - 0.17 - - 0.206) - 0.207) Amber Event Europe 0.35 - - 0.25 0.10 0.3014) - 0.305)
The following changes of rates were effective on 01/12/2018, except for the Wellington Large Cap US Research Sub-Fund, effective on 01/11/2018: Les changements de taux suivants sont entrés en vigueur le 01/12/2018, excepté pour le Compartiment Wellington Large Cap US Research, en vigueur le 01/11/2018 : 1) Change from/Changement de 0.35% to/à 0.25% 8) Change from/Changement de 0.35% to/à 0.20% 2) Change from/Changement de 0.20% to/à 0.25% 9) Change from/Changement de 0.22% to/à 0.20% 3) Change from/Changement de 0.45% to/à 0.25% 10) Change from/Changement de 0.22% to/à 0.25% 4) Change from/Changement de 0.45% to/à 0.30% 11) Change from/Changement de 0.40% to/à 0.30% 5) Change from/Changement de 0.25% to/à 0.30% 12) Change from/Changement de 0.175% to/à 0.20% 6) Change from/Changement de 0.25% to/à 0.20% 13) Change from/Changement de 0.125% to/à 0.20% 7) Change from/Changement de 0.17% to/à 0.20% 14) Change from/Changement de 0.35% to/à 0.30% The Operational Costs include mainly: - Depositary and Administration Fees, - Taxe d'abonnement, - Domiciliary Fees, - Transfer Agent Fees, - Auditing and Professional Fees (including but not limited to Registration Fees, Legal Fees, Directors Fees,...), - Publication, Marketing and Printing Expenses, - Other Expenses. Les Coûts Opérationnels comprennent principalement : - Les Commissions du Dépositaire et de l’Agent d’Administration Centrale, - La Taxe d’abonnement, - Les Commissions domiciliataires, - Les Commissions de l’Agent de Transfert, - Les frais de Révision et les frais Professionnels (incluant, entre autre, les frais d'enregistrement, les frais juridiques, les frais d'Administrateurs,...), - Les frais de Publication, Commercialisation et Impression, - Les Autres frais. If the total actual Operational Costs incurred by each Sub-Fund exceeds the Effective FROC, the Management Company will bear the difference. Conversely, if the total actual Operational Costs incurred by each Sub-Fund is lower than the Effective FROC, the difference is retained by the Management Company. Si les Coûts Opérationnels totaux supportés par chaque Compartiment sont supérieurs au FROC Effectif, la Société de Gestion prend la différence en charge. À l’inverse, si les Coûts Opérationnels totaux supportés par chaque Compartiment sont inférieurs aux FROC Effectif, la Société de Gestion conserve la différence. The amounts of Depositary and Administration Fees which are included in the Operational Costs are the following/Les montants de Commissions du Dépositaire et de l'Agent d'Administration Centrale inclus dans les Coûts Opérationnels sont les suivants :
Sub-Funds Compartiments
Currency Devise
Depositary and Administration Agent Fees Commissions du Dépositaire et de l’Agent
d’Administration William Blair Global Leaders USD 26 062 Wellington Large Cap US Research USD 101 549 Sands US Growth USD 94 781 Delaware US Large Cap Value USD 137 455 WellsCap US Selective Equity USD 19 167 Income Partners RMB Debt USD 9 843 SMAM Japan Small and Mid Cap JPY 7 177 704 Fidelity Technology USD 67 420 Ashmore Emerging Market Local Currency Bond USD 81 752

Notes to the financial statements/Notes aux états financiers
PrivilEdge · 31/03/2019
297
Sub-Funds Compartiments
Currency Devise
Depositary and Administration Agent Fees Commissions du Dépositaire et de l’Agent
d’Administration Baird US Aggregate Bond USD 10 018 Baird US Short Duration Bond USD 9 917 Columbia US Short Duration High Yield USD 9 764 DPAM European Real Estate EUR 22 400 H2O High Conviction Bonds EUR 46 206 American Century Emerging Markets Equity USD 53 721 AXA IM Short Duration Inflation Bond USD 9 911 Franklin Flexible Euro Aggregate Bond EUR 17 732 Henderson Pan European Equity EUR 5 912 William Blair US Small and Mid Cap USD 84 505 BlackRock Emerging Market Dynamic Bond USD 14 126 JP Morgan Pan European Flexible Equity EUR 57 907 Moneta Best of France EUR 24 919 NN IP Euro Credit EUR 18 324 T. Rowe Price European High Yield Bond EUR 9 274 Flossbach von Storch Global Convertible Bond EUR 7 710 Payden Emerging Market Debt USD 7 911 PPM America US Corporate Bond USD 8 713 Amber Event Europe EUR 13 103
NOTE 5. Total Expense Ratio The Total Expense Ratio (“TER”) expresses, as a percentage of the average net assets, the sum of all operating expenses (excluding brokerage Fees, securities transaction charges and bank interest) charged to the Sub-Funds during the respective twelve-month period. The TER are disclosed in accordance with the Swiss Funds & Asset Management Association (SFAMA) requirements. Le Total Expense Ratio ("TER") exprime, en pourcentage de la moyenne des actifs nets, l’ensemble des charges d’exploitation (sans les frais de courtage, dépenses de transactions et les intérêts) imputées sur la fortune des Compartiments au cours de la période de 12 mois concernée. Les TER sont publiés conformément aux exigences de la Swiss Funds & Asset Management Association (SFAMA). ISIN Code Sub-Funds
Compartiments Share Class Classe
Fund TER TER du Fonds
Fund TER TER du Fonds
31/03/20191) 30/09/20182) % % LU0990502683 William Blair Global Leaders P A USD 2.15 2.15 LU0990501792 William Blair Global Leaders P A EUR 2.15 2.15 LU0990502840 William Blair Global Leaders R A USD 3.10 3.10 LU0990501958 William Blair Global Leaders R A EUR 3.10 3.10 LU1599527030 William Blair Global Leaders I A USD 1.05 - LU1599527113 William Blair Global Leaders I D USD 1.05 1.05 LU0990502410 William Blair Global Leaders M A USD 1.42 1.45 LU0990502501 William Blair Global Leaders M D USD 1.39 1.45 LU0990501446 William Blair Global Leaders M A EUR 1.42 1.45 LU0990502253 William Blair Global Leaders N A USD 1.22 1.20 LU0990502337 William Blair Global Leaders N D USD 1.23 1.20 LU0990501289 William Blair Global Leaders N A EUR 1.22 1.20 LU0990494303 Wellington Large Cap US Research P A USD 1.81 1.85 LU0990494485 Wellington Large Cap US Research P D USD 1.81 1.85 LU1014866054 Wellington Large Cap US Research P A EUR SH 1.81 1.85 LU0990494568 Wellington Large Cap US Research R A USD 2.81 2.85 LU1599523476 Wellington Large Cap US Research I A USD 0.76 0.80 LU1599523716 Wellington Large Cap US Research I D USD 0.76 0.80 LU0990494139 Wellington Large Cap US Research M A USD 1.11 1.20 LU0990494212 Wellington Large Cap US Research M D USD 1.11 1.20 LU1014865833 Wellington Large Cap US Research M A EUR SH 1.11 1.20 LU1014865916 Wellington Large Cap US Research M D EUR SH 1.01 - LU0990493917 Wellington Large Cap US Research N A USD 0.93 0.95

Notes to the financial statements/Notes aux états financiers
PrivilEdge · 31/03/2019 298
ISIN Code Sub-Funds
Compartiments Share Class Classe
Fund TER TER du Fonds
Fund TER TER du Fonds
31/03/20191) 30/09/20182) % % LU0990495458 Sands US Growth P A USD 2.16 2.16 LU0990499526 Sands US Growth P A EUR SH 2.16 2.16 LU0990495292 Sands US Growth M A USD 1.42 1.46 LU0990495375 Sands US Growth M D USD 1.42 1.46 LU0990499369 Sands US Growth M A EUR SH 1.41 1.45 LU0990499443 Sands US Growth M D EUR SH 1.41 1.45 LU0990500638 Sands US Growth M D GBP SH 1.37 - LU0990494998 Sands US Growth N A USD 1.22 1.21 LU0990495029 Sands US Growth N D USD 1.22 1.21 LU0990495961 Sands US Growth N A EUR 1.22 1.21 LU0990497074 Sands US Growth N A GBP 1.22 1.21 LU0990497157 Sands US Growth N D GBP 1.22 1.21 LU0990500398 Sands US Growth N D GBP SH 1.22 1.21 LU1075107455 Delaware US Large Cap Value P A USD 1.85 1.85 LU1075108347 Delaware US Large Cap Value P A EUR SH 1.85 1.85 LU1599507271 Delaware US Large Cap Value I A USD 0.80 0.80 LU1075107299 Delaware US Large Cap Value M A USD 1.16 1.20 LU1075107372 Delaware US Large Cap Value M D USD 1.16 1.20 LU1075108180 Delaware US Large Cap Value M A EUR SH 1.16 1.20 LU1075108263 Delaware US Large Cap Value M D EUR SH 1.16 1.20 LU1075230737 Delaware US Large Cap Value M D GBP 1.16 1.20 LU1599507438 Delaware US Large Cap Value U A USD 0.59 0.59 LU1739598008 Delaware US Large Cap Value U A EUR 0.59 0.59 LU1075106994 Delaware US Large Cap Value N A USD 0.96 0.95 LU1075230497 Delaware US Large Cap Value N D GBP 0.96 0.95 LU1138725863 WellsCap US Selective Equity P A USD 2.30 2.30 LU1599526149 WellsCap US Selective Equity I A USD 1.20 1.20 LU1138725434 WellsCap US Selective Equity M A USD 1.51 1.55 LU1138725608 WellsCap US Selective Equity M D USD 1.51 1.55 LU1138727307 WellsCap US Selective Equity M A EUR SH 1.51 1.55 LU1138724973 WellsCap US Selective Equity N A USD 1.31 1.30 LU1138725277 WellsCap US Selective Equity N D USD 1.31 1.30 LU1075801230 Income Partners RMB Debt P A USD 1.70 1.70 LU1075808672 Income Partners RMB Debt P A CHF SH 1.70 1.70 LU1075800422 Income Partners RMB Debt M A USD 1.18 1.25 LU1075807781 Income Partners RMB Debt M A CHF SH 1.18 1.25 LU1075804259 Income Partners RMB Debt M A EUR SH 1.18 1.25 LU1075816691 Income Partners RMB Debt M A CNH 1.18 1.25 LU1075799665 Income Partners RMB Debt N A USD 0.95 0.95 LU1075816188 Income Partners RMB Debt N A CNH 0.95 0.95 LU1370679786 SMAM Japan Small and Mid Cap P A USD SH 2.25 2.25 LU1370680875 SMAM Japan Small and Mid Cap P A EUR SH 2.25 2.25 LU1370678622 SMAM Japan Small and Mid Cap P A JPY 2.25 2.25 LU1599514723 SMAM Japan Small and Mid Cap I A CHF SH 1.10 1.10 LU1599517825 SMAM Japan Small and Mid Cap I A JPY 1.10 1.10 LU1370679513 SMAM Japan Small and Mid Cap M A USD SH 1.50 1.55 LU1370679604 SMAM Japan Small and Mid Cap M D USD SH 1.50 1.55 LU1370681501 SMAM Japan Small and Mid Cap M A CHF SH 1.50 1.55 LU1370680529 SMAM Japan Small and Mid Cap M A EUR SH 1.50 1.55 LU1370680792 SMAM Japan Small and Mid Cap M D EUR SH 1.50 1.55 LU1370678465 SMAM Japan Small and Mid Cap M A JPY 1.50 1.55 LU1370678549 SMAM Japan Small and Mid Cap M D JPY 1.50 1.55

Notes to the financial statements/Notes aux états financiers
PrivilEdge · 31/03/2019
299
ISIN Code Sub-Funds
Compartiments Share Class Classe
Fund TER TER du Fonds
Fund TER TER du Fonds
31/03/20191) 30/09/20182) % % LU1599516181 SMAM Japan Small and Mid Cap U A EUR SH 0.84 0.84 LU1599518633 SMAM Japan Small and Mid Cap U A JPY 0.84 0.84 LU1370679356 SMAM Japan Small and Mid Cap N A USD SH 1.26 1.25 LU1370680289 SMAM Japan Small and Mid Cap N A EUR SH 1.26 1.25 LU1370678200 SMAM Japan Small and Mid Cap N A JPY 1.26 1.25 LU1370678382 SMAM Japan Small and Mid Cap N D JPY 1.27 1.25 LU1390458310 Fidelity Technology P A USD 2.15 2.15 LU1390458401 Fidelity Technology P D USD 2.15 2.15 LU1390459391 Fidelity Technology P A EUR SH 2.15 2.15 LU1390458583 Fidelity Technology R A USD 3.10 3.10 LU1390459557 Fidelity Technology R A EUR SH 3.10 3.10 LU1390458153 Fidelity Technology M A USD 1.41 1.45 LU1390458237 Fidelity Technology M D USD 1.41 1.45 LU1390459045 Fidelity Technology M A EUR SH 1.41 1.45 LU1390459128 Fidelity Technology M D EUR SH 1.41 1.45 LU1390457932 Fidelity Technology N A USD 1.21 1.20 LU1390458070 Fidelity Technology N D USD 1.21 1.20 LU1390458740 Fidelity Technology N A EUR SH 1.21 1.20 LU1390461298 Fidelity Technology N D GBP SH 1.21 1.20 LU1517942626 Ashmore Emerging Market Local Currency Bond P A USD 1.85 1.85 LU1517945488 Ashmore Emerging Market Local Currency Bond P A CHF SH 1.85 1.85 LU1517944168 Ashmore Emerging Market Local Currency Bond P A EUR SH 1.85 1.85 LU1517944242 Ashmore Emerging Market Local Currency Bond P D EUR SH 1.85 1.85 LU1517942030 Ashmore Emerging Market Local Currency Bond I A USD 1.05 1.05 LU1517942113 Ashmore Emerging Market Local Currency Bond I D USD 1.05 1.05 LU1517944754 Ashmore Emerging Market Local Currency Bond I A CHF SH 1.05 1.05 LU1517942204 Ashmore Emerging Market Local Currency Bond M A USD 1.32 1.35 LU1517942386 Ashmore Emerging Market Local Currency Bond M D USD 1.32 1.35 LU1517945058 Ashmore Emerging Market Local Currency Bond M A CHF SH 1.32 1.35 LU1517945132 Ashmore Emerging Market Local Currency Bond M D CHF SH 1.31 1.35 LU1517943608 Ashmore Emerging Market Local Currency Bond M A EUR SH 1.32 1.35 LU1517943780 Ashmore Emerging Market Local Currency Bond M D EUR SH 1.32 1.35 LU1538865715 Ashmore Emerging Market Local Currency Bond M D GBP 1.32 1.35 LU1517946379 Ashmore Emerging Market Local Currency Bond M A GBP SH 1.32 1.35 LU1517946452 Ashmore Emerging Market Local Currency Bond M D GBP SH 1.32 1.35 LU1885490398 Ashmore Emerging Market Local Currency Bond M A JPY SH -3) - LU1517942469 Ashmore Emerging Market Local Currency Bond N A USD 1.15 1.15 LU1517942543 Ashmore Emerging Market Local Currency Bond N D USD 1.15 1.15 LU1517945215 Ashmore Emerging Market Local Currency Bond N A CHF SH 1.15 1.15 LU1517943947 Ashmore Emerging Market Local Currency Bond N A EUR SH 1.15 1.15 LU1517944085 Ashmore Emerging Market Local Currency Bond N D EUR SH 1.15 1.15 LU1517946536 Ashmore Emerging Market Local Currency Bond N A GBP SH 1.15 1.15 LU1511582857 Baird US Aggregate Bond I A USD 0.58 0.58 LU1511583079 Baird US Aggregate Bond M A USD 0.85 0.86 LU1511583152 Baird US Aggregate Bond M D USD 0.85 0.86 LU1511585520 Baird US Aggregate Bond M A CHF SH 0.85 0.86 LU1511584473 Baird US Aggregate Bond M A EUR SH 0.85 0.86 LU1511586767 Baird US Aggregate Bond M A GBP SH 0.85 0.86 LU1511586841 Baird US Aggregate Bond M D GBP SH 0.85 0.86 LU1511583236 Baird US Aggregate Bond N A USD 0.69 0.68

Notes to the financial statements/Notes aux états financiers
PrivilEdge · 31/03/2019 300
ISIN Code Sub-Funds
Compartiments Share Class Classe
Fund TER TER du Fonds
Fund TER TER du Fonds
31/03/20191) 30/09/20182) % % LU1511578582 Baird US Short Duration Bond P A USD 1.27 1.26 LU1511578152 Baird US Short Duration Bond M A USD 0.85 0.86 LU1511578236 Baird US Short Duration Bond M D USD 0.85 0.86 LU1511580562 Baird US Short Duration Bond M A CHF SH 0.85 0.86 LU1511579473 Baird US Short Duration Bond M A EUR SH 0.85 0.86 LU1511581883 Baird US Short Duration Bond M A GBP SH 0.85 0.86 LU1511578319 Baird US Short Duration Bond N A USD 0.69 0.68 LU1511578400 Baird US Short Duration Bond N D USD 0.70 0.68 LU1511579630 Baird US Short Duration Bond N A EUR SH 0.70 0.69 LU1515321955 Columbia US Short Duration High Yield P A USD 1.61 1.61 LU1515324546 Columbia US Short Duration High Yield P A CHF SH 1.61 1.61 LU1515323068 Columbia US Short Duration High Yield P A EUR SH 1.61 1.61 LU1515321286 Columbia US Short Duration High Yield I A USD 0.83 0.83 LU1515321369 Columbia US Short Duration High Yield I D USD -3) 0.83 LU1515321443 Columbia US Short Duration High Yield M A USD 1.11 1.16 LU1515321526 Columbia US Short Duration High Yield M D USD 1.11 1.16 LU1515324116 Columbia US Short Duration High Yield M A CHF SH 1.11 1.16 LU1515322680 Columbia US Short Duration High Yield M A EUR SH 1.11 1.16 LU1515325436 Columbia US Short Duration High Yield M A GBP SH 1.11 1.16 LU1515321799 Columbia US Short Duration High Yield N A USD 0.92 0.93 LU1515321872 Columbia US Short Duration High Yield N D USD 0.92 0.93 LU1515324389 Columbia US Short Duration High Yield N A CHF SH 0.92 0.93 LU1515324462 Columbia US Short Duration High Yield N D CHF SH 0.92 0.93 LU1515322847 Columbia US Short Duration High Yield N A EUR SH 0.92 0.93 LU1515329776 DPAM European Real Estate P D USD SH 1.85 1.85 LU1515327135 DPAM European Real Estate P A EUR 1.85 1.85 LU1515330600 DPAM European Real Estate I A CHF SH 1.05 1.05 LU1515326590 DPAM European Real Estate I A EUR 1.05 - LU1515326673 DPAM European Real Estate I D EUR 1.05 1.05 LU1515328455 DPAM European Real Estate M A USD SH 1.32 1.35 LU1515331087 DPAM European Real Estate M A CHF SH 1.32 1.35 LU1515331327 DPAM European Real Estate M D CHF SH 1.32 1.35 LU1515326756 DPAM European Real Estate M A EUR 1.32 1.35 LU1515326830 DPAM European Real Estate M D EUR 1.32 1.35 LU1515333885 DPAM European Real Estate M D GBP SH 1.32 1.35 LU1515331673 DPAM European Real Estate N A CHF SH 1.15 1.15 LU1515326913 DPAM European Real Estate N A EUR 1.15 1.15 LU1605735031 American Century Emerging Markets Equity P A USD 2.34 2.45 LU1605737672 American Century Emerging Markets Equity P A CHF SH 2.34 2.45 LU1605736435 American Century Emerging Markets Equity P A EUR SH 2.34 2.45 LU1605734497 American Century Emerging Markets Equity I A USD 1.23 1.30 LU1605734570 American Century Emerging Markets Equity I D USD 1.23 1.30 LU1605736948 American Century Emerging Markets Equity I A CHF SH 1.23 1.30 LU1605734653 American Century Emerging Markets Equity M A USD 1.57 1.70 LU1605734737 American Century Emerging Markets Equity M D USD 1.57 1.70 LU1605737169 American Century Emerging Markets Equity M A CHF SH 1.57 1.70 LU1605735890 American Century Emerging Markets Equity M A EUR SH 1.57 1.70 LU1605735973 American Century Emerging Markets Equity M D EUR SH 1.57 1.70 LU1605734810 American Century Emerging Markets Equity N A USD 1.41 1.50 LU1605737326 American Century Emerging Markets Equity N A CHF SH 1.41 1.50

Notes to the financial statements/Notes aux états financiers
PrivilEdge · 31/03/2019
301
ISIN Code Sub-Funds
Compartiments Share Class Classe
Fund TER TER du Fonds
Fund TER TER du Fonds
31/03/20191) 30/09/20182) % % LU1605730156 AXA IM Short Duration Inflation Bond P A USD 1.19 - LU1605732525 AXA IM Short Duration Inflation Bond P A CHF SH -3) 1.19 LU1605729570 AXA IM Short Duration Inflation Bond I A USD 0.54 0.54 LU1605731980 AXA IM Short Duration Inflation Bond I A CHF SH 0.54 0.54 LU1605730669 AXA IM Short Duration Inflation Bond I A EUR SH 0.54 0.54 LU1605729737 AXA IM Short Duration Inflation Bond M A USD 0.70 0.69 LU1605732103 AXA IM Short Duration Inflation Bond M A CHF SH 0.70 0.69 LU1605730826 AXA IM Short Duration Inflation Bond M A EUR SH 0.70 0.69 LU1605731048 AXA IM Short Duration Inflation Bond M D EUR SH 0.70 0.69 LU1605733507 AXA IM Short Duration Inflation Bond M D GBP SH 0.70 0.69 LU1605729901 AXA IM Short Duration Inflation Bond N A USD -3) - LU1605730073 AXA IM Short Duration Inflation Bond N D USD 0.64 - LU1605732368 AXA IM Short Duration Inflation Bond N A CHF SH 0.61 0.59 LU1605731121 AXA IM Short Duration Inflation Bond N A EUR SH 0.61 0.59 LU1605720355 Franklin Flexible Euro Aggregate Bond P A EUR 1.25 1.25 LU1605722054 Franklin Flexible Euro Aggregate Bond I A CHF SH 0.57 0.57 LU1605719696 Franklin Flexible Euro Aggregate Bond I A EUR 0.57 0.57 LU1605721080 Franklin Flexible Euro Aggregate Bond M A USD SH 0.84 0.85 LU1605722211 Franklin Flexible Euro Aggregate Bond M A CHF SH 0.84 0.85 LU1605722302 Franklin Flexible Euro Aggregate Bond M D CHF SH 0.84 0.85 LU1605719852 Franklin Flexible Euro Aggregate Bond M A EUR 0.84 0.85 LU1605719936 Franklin Flexible Euro Aggregate Bond M D EUR 0.84 0.85 LU1605721247 Franklin Flexible Euro Aggregate Bond N A USD SH 0.68 0.67 LU1605722484 Franklin Flexible Euro Aggregate Bond N A CHF SH 0.68 0.67 LU1605720199 Franklin Flexible Euro Aggregate Bond N A EUR 0.68 0.67 LU1605720272 Franklin Flexible Euro Aggregate Bond N D EUR 0.68 0.67 LU1605740031 William Blair US Small and Mid Cap P A USD 2.15 2.15 LU1605741351 William Blair US Small and Mid Cap P A EUR SH 2.15 2.15 LU1605739454 William Blair US Small and Mid Cap I A USD 1.10 1.10 LU1605739538 William Blair US Small and Mid Cap I D USD 1.10 1.10 LU1605741864 William Blair US Small and Mid Cap I A CHF SH 1.10 1.10 LU1605741518 William Blair US Small and Mid Cap S A EUR SH 0.10 0.10 LU1605739611 William Blair US Small and Mid Cap M A USD 1.42 1.45 LU1605739702 William Blair US Small and Mid Cap M D USD 1.42 1.45 LU1605740890 William Blair US Small and Mid Cap M A EUR SH 1.42 1.45 LU1605740973 William Blair US Small and Mid Cap M D EUR SH 1.42 1.45 LU1605739884 William Blair US Small and Mid Cap N A USD 1.25 1.25 LU1605739967 William Blair US Small and Mid Cap N D USD 1.25 1.25 LU1605742243 William Blair US Small and Mid Cap N A CHF SH -3) 1.25 LU1605741195 William Blair US Small and Mid Cap N A EUR SH 1.25 1.25 LU1605741278 William Blair US Small and Mid Cap N D EUR SH 1.25 - LU1711565306 NN IP Euro Credit P A EUR 1.25 1.26 LU1711567260 NN IP Euro Credit I A CHF SH 0.57 0.58 LU1711564754 NN IP Euro Credit I A EUR 0.57 0.57 LU1711566379 NN IP Euro Credit M D USD SH 0.83 0.86 LU1711567427 NN IP Euro Credit M A CHF SH 0.84 0.86 LU1711564911 NN IP Euro Credit M A EUR 0.84 0.86 LU1711565058 NN IP Euro Credit M D EUR 0.84 0.85 LU1711568748 NN IP Euro Credit M A GBP SH 0.84 0.86 LU1711568821 NN IP Euro Credit M D GBP SH 0.84 0.86

Notes to the financial statements/Notes aux états financiers
PrivilEdge · 31/03/2019 302
ISIN Code Sub-Funds
Compartiments Share Class Classe
Fund TER TER du Fonds
Fund TER TER du Fonds
31/03/20191) 30/09/20182) % % LU1711567773 NN IP Euro Credit N A CHF SH 0.68 0.68 LU1711565132 NN IP Euro Credit N A EUR 0.68 0.68 LU1711565215 NN IP Euro Credit N D EUR 0.68 0.68 LU1711577574 T. Rowe Price European High Yield Bond P A USD SH 1.60 1.61 LU1711578622 T. Rowe Price European High Yield Bond P A CHF SH 1.60 1.61 LU1711576337 T. Rowe Price European High Yield Bond P A EUR 1.60 1.61 LU1711578036 T. Rowe Price European High Yield Bond I A CHF SH 0.82 0.82 LU1711575529 T. Rowe Price European High Yield Bond I A EUR -3) 0.83 LU1711577061 T. Rowe Price European High Yield Bond M A USD SH 1.11 1.16 LU1711578200 T. Rowe Price European High Yield Bond M A CHF SH 1.11 1.16 LU1711578382 T. Rowe Price European High Yield Bond M D CHF SH 1.11 1.17 LU1711575958 T. Rowe Price European High Yield Bond M A EUR 1.11 1.16 LU1711576097 T. Rowe Price European High Yield Bond M D EUR 1.11 1.16 LU1711579604 T. Rowe Price European High Yield Bond M A GBP SH 1.11 1.16 LU1711579786 T. Rowe Price European High Yield Bond M D GBP SH 1.11 1.16 LU1711578465 T. Rowe Price European High Yield Bond N A CHF SH -3) 0.93 LU1711576170 T. Rowe Price European High Yield Bond N A EUR -3) 0.93 LU1711576253 T. Rowe Price European High Yield Bond N D EUR 0.93 0.93 LU1823393852 Flossbach von Storch Global Convertible Bond P A CHF SH 1.60 1.60 LU1823391211 Flossbach von Storch Global Convertible Bond P D EUR 1.60 1.60 LU1823393001 Flossbach von Storch Global Convertible Bond I A CHF SH 0.82 0.82 LU1823390320 Flossbach von Storch Global Convertible Bond I A EUR 0.82 0.82 LU1823391997 Flossbach von Storch Global Convertible Bond M A USD SH 1.09 1.15 LU1823393266 Flossbach von Storch Global Convertible Bond M A CHF SH 1.09 1.15 LU1823393340 Flossbach von Storch Global Convertible Bond M D CHF SH 1.09 1.15 LU1823390759 Flossbach von Storch Global Convertible Bond M A EUR 1.09 1.15 LU1823390833 Flossbach von Storch Global Convertible Bond M D EUR 1.09 1.15 LU1823394827 Flossbach von Storch Global Convertible Bond M D GBP SH 1.08 1.15 LU1823393423 Flossbach von Storch Global Convertible Bond N A CHF SH 0.91 0.92 LU1823390916 Flossbach von Storch Global Convertible Bond N A EUR 0.91 0.92 LU1823378978 Payden Emerging Market Debt I A CHF SH 0.82 - LU1823377731 Payden Emerging Market Debt I A EUR SH 0.82 0.82 LU1823376766 Payden Emerging Market Debt M A USD 1.11 1.15 LU1823376840 Payden Emerging Market Debt M D USD 1.11 1.15 LU1823379273 Payden Emerging Market Debt M A CHF SH 1.11 1.15 LU1823379356 Payden Emerging Market Debt M D CHF SH 1.11 1.15 LU1823377905 Payden Emerging Market Debt M A EUR SH 1.11 1.15 LU1823378036 Payden Emerging Market Debt M D EUR SH 1.11 1.15 LU1823380446 Payden Emerging Market Debt M D GBP SH 1.11 1.15 LU1823376923 Payden Emerging Market Debt N A USD 0.93 0.92 LU1823379430 Payden Emerging Market Debt N A CHF SH 0.93 0.92 LU1823378119 Payden Emerging Market Debt N A EUR SH 0.93 0.92 LU1823397762 PPM America US Corporate Bond I A USD 0.57 0.57 LU1823397929 PPM America US Corporate Bond M A USD 0.83 0.85 LU1823398067 PPM America US Corporate Bond M D USD 0.83 0.85 LU1823400574 PPM America US Corporate Bond M D CHF SH 0.83 0.85 LU1823399115 PPM America US Corporate Bond M A EUR SH 0.83 0.85 LU1823401549 PPM America US Corporate Bond M A GBP SH 0.83 0.85 LU1823401622 PPM America US Corporate Bond M D GBP SH 0.83 0.85 LU1823398141 PPM America US Corporate Bond N A USD 0.68 0.67 LU1823398224 PPM America US Corporate Bond N D USD 0.70 - LU1823399461 PPM America US Corporate Bond N D EUR SH 0.68 0.67

Notes to the financial statements/Notes aux états financiers
PrivilEdge · 31/03/2019
303
TER with Performance Fee/TER avec Commission de Performance ISIN Code Sub-Funds Share Class Fund TER TER with
Performance Fee4)
Share of Performance
Fee
Fund TER TER with Performance
Fee4)
Share of Performance
Fee
Compartiments Classe TER du Fonds
TER avec Comm. de
Performance4)
Quote part de la Comm. de Performance
TER du Fonds
TER avec Comm. de
Performance4)
Quote part de la Comm.
de Performance
31/03/20191) 31/03/20191) 31/03/20191) 30/09/20182) 30/09/20182) 30/09/20182)
% % % % % % LU1525842701 H2O High Conviction Bonds P A USD SH 1.60 5.13 3.53 1.60 2.68 1.08
LU1525843931 H2O High Conviction Bonds P A CHF SH 1.60 6.41 4.81 1.60 3.95 2.35
LU1525841489 H2O High Conviction Bonds P A EUR 1.60 4.50 2.90 1.60 4.46 2.86
LU1525845472 H2O High Conviction Bonds P A GBP SH 1.60 6.27 4.67 1.60 1.60 -
LU1525840754 H2O High Conviction Bonds I A EUR 0.82 4.55 3.73 0.82 3.58 2.76
LU1525842370 H2O High Conviction Bonds M A USD SH 1.12 5.44 4.32 1.15 4.14 2.99
LU1525842453 H2O High Conviction Bonds M D USD SH 1.12 4.60 3.48 1.15 3.27 2.12
LU1525843428 H2O High Conviction Bonds M A CHF SH 1.12 5.66 4.54 1.15 4.33 3.18
LU1525843691 H2O High Conviction Bonds M D CHF SH 1.12 6.92 5.80 1.15 3.71 2.56
LU1525840911 H2O High Conviction Bonds M A EUR 1.12 5.00 3.88 1.15 3.68 2.53
LU1525841133 H2O High Conviction Bonds M D EUR 1.12 4.83 3.71 1.15 3.21 2.06
LU1525844749 H2O High Conviction Bonds M A GBP SH 1.12 4.59 3.47 1.15 4.11 2.96
LU1525844822 H2O High Conviction Bonds M D GBP SH 1.12 5.58 4.46 1.15 5.92 4.77
LU1942749802 H2O High Conviction Bonds M A JPY SH 1.05 1.05 - - - -
LU1525842537 H2O High Conviction Bonds N A USD SH 0.93 4.86 3.93 0.92 1.82 0.90
LU1525842610 H2O High Conviction Bonds N D USD SH 0.93 3.08 2.15 0.92 0.92 -
LU1525843774 H2O High Conviction Bonds N A CHF SH 0.93 4.53 3.60 0.92 1.06 0.14
LU1525843857 H2O High Conviction Bonds N D CHF SH 0.95 0.95 - - - -
LU1525841216 H2O High Conviction Bonds N A EUR 0.93 4.49 3.56 0.92 3.58 2.66
LU1525841307 H2O High Conviction Bonds N D EUR 0.93 2.53 1.60 0.92 0.92 -
LU1605726394 Henderson Pan European Equity P A USD SH -3) -3) -3) 1.87 1.87 -
LU1605725230 Henderson Pan European Equity P A EUR -3) -3) -3) 1.86 1.86 -
LU1605724696 Henderson Pan European Equity I A EUR -3) -3) -3) 0.86 0.86 -
LU1605725743 Henderson Pan European Equity M A USD SH -3) -3) -3) 1.21 1.21 -
LU1605725826 Henderson Pan European Equity M D USD SH -3) -3) -3) 1.21 1.21 -
LU1605727285 Henderson Pan European Equity M A CHF SH -3) -3) -3) 1.22 1.22 -
LU1605724852 Henderson Pan European Equity M A EUR -3) -3) -3) 1.21 1.21 -
LU1605724936 Henderson Pan European Equity M D EUR -3) -3) -3) 1.21 1.21 -
LU1605725073 Henderson Pan European Equity N A EUR -3) -3) -3) 1.01 1.01 -
LU1605725156 Henderson Pan European Equity N D EUR -3) -3) -3) 1.01 1.01 -
LU1624319270 BlackRock Emerging Market Dynamic Bond
P A USD 1.85 1.85 - 1.85 1.89 0.04
LU1624321508 BlackRock Emerging Market Dynamic Bond
P A CHF SH 1.85 1.85 - 1.85 1.85 -
LU1624320369 BlackRock Emerging Market Dynamic Bond
P A EUR SH 1.85 1.85 - 1.85 1.85 -
LU1624322738 BlackRock Emerging Market Dynamic Bond
P A GBP SH 1.85 1.85 - 1.85 1.85 -
LU1624318462 BlackRock Emerging Market Dynamic Bond
I A USD -3) -3) -3) 1.05 1.06 0.01
LU1624318546 BlackRock Emerging Market Dynamic Bond
I D USD 1.05 1.05 - 1.05 1.11 0.06
LU1624320955 BlackRock Emerging Market Dynamic Bond
I A CHF SH 1.05 1.05 - 1.05 1.05 -
LU1624319783 BlackRock Emerging Market Dynamic Bond
I A EUR SH -3) -3) -3) 1.05 1.05 -
LU1624318629 BlackRock Emerging Market Dynamic Bond
M A USD 1.31 1.31 - 1.35 1.37 0.02
LU1624318892 BlackRock Emerging Market Dynamic Bond
M D USD 1.31 1.31 - 1.35 1.36 0.01
LU1624321177 BlackRock Emerging Market Dynamic Bond
M A CHF SH 1.31 1.31 - 1.35 1.35 -

Notes to the financial statements/Notes aux états financiers
PrivilEdge · 31/03/2019 304
ISIN Code Sub-Funds Share Class Fund TER TER with
Performance Fee4)
Share of Performance
Fee
Fund TER TER with Performance
Fee4)
Share of Performance
Fee Compartiments Classe TER du
Fonds TER avec Comm. de
Performance4)
Quote part de la Comm. de Performance
TER du Fonds
TER avec Comm. de
Performance4)
Quote part de la Comm.
de Performance
31/03/20191) 31/03/20191) 31/03/20191) 30/09/20182) 30/09/20182) 30/09/20182) % % % % % % LU1624319940 BlackRock Emerging Market
Dynamic Bond M A EUR SH 1.31 1.31 - 1.35 1.35 -
LU1624320013 BlackRock Emerging Market Dynamic Bond
M D EUR SH 1.31 1.31 - 1.35 1.45 0.10
LU1624322225 BlackRock Emerging Market Dynamic Bond
M A GBP SH 1.31 1.31 - 1.35 1.35 -
LU1624318975 BlackRock Emerging Market Dynamic Bond
N A USD 1.15 1.15 - 1.15 1.19 0.04
LU1624319197 BlackRock Emerging Market Dynamic Bond
N D USD 1.15 1.15 - 1.15 1.19 0.04
LU1624321334 BlackRock Emerging Market Dynamic Bond
N A CHF SH 1.15 1.15 - 1.15 1.15 -
LU1624320104 BlackRock Emerging Market Dynamic Bond
N A EUR SH -3) -3) -3) 1.15 1.15 -
LU1624320286 BlackRock Emerging Market Dynamic Bond
N D EUR SH 1.15 1.15 - 1.15 1.15 -
LU1711572005 JP Morgan Pan European Flexible Equity
P A USD SH 1.85 1.85 - 1.85 1.91 0.06
LU1711570645 JP Morgan Pan European Flexible Equity
P A EUR 1.85 1.85 - 1.85 1.91 0.06
LU1711574803 JP Morgan Pan European Flexible Equity
P A GBP SH 1.85 1.89 0.04 - - -
LU1711570058 JP Morgan Pan European Flexible Equity
I A EUR 0.85 0.85 - 0.85 0.85 -
LU1711570132 JP Morgan Pan European Flexible Equity
I D EUR 0.85 0.85 - 0.85 0.85 -
LU1711571619 JP Morgan Pan European Flexible Equity
M A USD SH 1.17 1.17 - 1.20 1.21 0.01
LU1711571700 JP Morgan Pan European Flexible Equity
M D USD SH -3) -3) -3) - - -
LU1711572856 JP Morgan Pan European Flexible Equity
M A CHF SH 1.17 1.17 - 1.20 1.20 -
LU1711570215 JP Morgan Pan European Flexible Equity
M A EUR 1.17 1.17 - 1.20 1.20 -
LU1711570306 JP Morgan Pan European Flexible Equity
M D EUR 1.17 1.17 - 1.20 1.20 -
LU1711574472 JP Morgan Pan European Flexible Equity
M A GBP SH 1.17 1.17 - 1.20 1.25 0.05
LU1711570488 JP Morgan Pan European Flexible Equity
N A EUR 1.00 1.00 - 1.00 1.00 -
LU1711570561 JP Morgan Pan European Flexible Equity
N D EUR 1.00 1.00 - 1.00 1.01 0.01
LU1725402363 Moneta Best of France P A EUR 2.40 2.40 - 2.40 2.40 - LU1725401712 Moneta Best of France I A EUR 1.60 1.60 - 1.60 1.60 - LU1725401985 Moneta Best of France M A EUR 1.76 1.76 - 1.80 1.80 - LU1725402108 Moneta Best of France N A EUR 1.70 1.70 - 1.70 1.70 - LU1840469388 Amber Event Europe P D EUR 2.35 2.35 - 2.35 2.35 - LU1840468570 Amber Event Europe IM A EUR 0.25 0.25 - 0.25 0.25 - LU1840471442 Amber Event Europe M A USD SH
Seeding 1.58 1.60 0.02 1.60 1.60 -
LU1840473067 Amber Event Europe M A CHF SH Seeding
1.57 1.57 - 1.60 1.60 -
LU1840473141 Amber Event Europe M D CHF SH Seeding
1.58 1.58 - 1.60 1.60 -
LU1840469891 Amber Event Europe M A EUR Seeding 1.58 1.59 0.01 1.60 1.60 - LU1840474628 Amber Event Europe M A GBP SH
Seeding 1.58 1.58 - 1.60 1.60 -
LU1840474891 Amber Event Europe M D GBP SH Seeding
1.58 1.63 0.05 1.60 1.60 -

Notes to the financial statements/Notes aux états financiers
PrivilEdge · 31/03/2019
305
ISIN Code Sub-Funds Share Class Fund TER TER with
Performance Fee4)
Share of Performance
Fee
Fund TER TER with Performance
Fee4)
Share of Performance
Fee
Compartiments Classe TER du Fonds
TER avec Comm. de
Performance4)
Quote part de la Comm. de Performance
TER du Fonds
TER avec Comm. de
Performance4)
Quote part de la Comm.
de Performance
31/03/20191) 31/03/20191) 31/03/20191) 30/09/20182) 30/09/20182) 30/09/20182)
% % % % % % LU1840469461 Amber Event Europe S A EUR 0.10 0.10 - - - -
LU1840469545 Amber Event Europe U A EUR Seeding 0.64 0.64 - - - -
LU1840471798 Amber Event Europe N A USD SH Seeding
1.27 1.66 0.39 1.25 1.25 -
LU1840473224 Amber Event Europe N A CHF SH Seeding
1.29 1.29 - - - -
LU1840470048 Amber Event Europe N A EUR Seeding 1.27 1.27 - 1.25 1.25 -
LU1840470121 Amber Event Europe N D EUR Seeding 1.43 1.43 - - - -
LU1840475195 Amber Event Europe N D GBP SH Seeding
1.27 1.36 0.09 1.25 1.25 -
1) Calculated over twelve months from 01/04/2018 (or from date of first subscription) to 31/03/2019/Calculé sur douze mois depuis le 01/04/2018 (ou depuis la date de la première
souscription) jusqu’au 31/03/2019 2) Calculated over twelve months from 01/10/2017 (or from date of first subscription) to 30/09/2018/Calculé sur douze mois depuis le 01/10/2017 (ou depuis la date de la première
souscription) jusqu’au 30/09/2018 3) No TER calculation due to the closing of the Class during the period under review/Aucun TER n'a été calculé du fait de la clôture de la Classe durant la période sous revue
4) The TER with Performance Fees has been calculated by taking into account the Performance Fees paid at the end of the Performance Period and the crystallization amounts paid during the period under review/Le TER avec Commissions de Performance a été calculé en tenant compte des Commissions de Performance payées à la fin de la Période de Performance et des montants cristallisés payés au cours de la période sous revue
NOTE 6. Investment Managers/Gérants During the period, the allocation of Sub-Funds to Investment Managers was as follows/Durant la période, l’affectation des Compartiments aux Gérants a été la suivante : Sub-Funds Compartiments
Investment Managers Gérants
William Blair Global Leaders William Blair Investment Management, LLC
Wellington Large Cap US Research Wellington Management Company LLP
Sands US Growth Sands Capital Management L.L.C.
Delaware US Large Cap Value Macquarie Investment Management Advisers, a series of Macquarie Investment Management Business Trust
WellsCap Us Selective Equity Wells Capital Management, Incorporated
Income Partners RMB Debt Income Partners Asset Management (HK) Limited
SMAM Japan Small and Mid Cap Sumitomo Mitsui Asset Management Company, Limited (renamed/renommé Sumitomo Mitsui DS Asset Management Company, Limited as from/dès le 01/04/2019)
Fidelity Technology FIL Pensions Management and/et FIL Investments International as Sub-Investment Manager/comme Sous-Gérant
Ashmore Emerging Market Local Currency Bond Ashmore Investment Management Limited
Baird US Aggregate Bond Robert W. Baird & Co. Incorporated
Baird US Short Duration Bond Robert W. Baird & Co. Incorporated
Columbia US Short Duration High Yield Columbia Management Advisers, LLC
DPAM European Real Estate Degroof Petercam Asset Management SA
H2O High Conviction Bonds H2O (Monaco) S.A.M.
American Century Emerging Markets Equity Aberdeen Asset Managers Limited and/et Aberdeen Asset Management Asia Limited as Sub-Investment Manager for Asian assets/comme Sous-Gérant pour les actifs asiatiques (up to/jusqu’au 31/10/2018) American Century Investment Management, Inc. (as from/dès le 01/11/2018)
AXA IM Short Duration Inflation Bond AXA Investment Managers Paris
Franklin Flexible Euro Aggregate Bond Franklin Templeton Investment Management Limited
Henderson Pan European Equity Henderson Global Investors Limited (up to/jusqu’au 07/12/2018)
William Blair US Small and Mid Cap William Blair Investment Management, LLC
BlackRock Emerging Market Dynamic Bond BlackRock Investment Management (UK) Limited
JP Morgan Pan European Flexible Equity JP Morgan Asset Management (UK) Limited
Moneta Best of France Moneta Asset Management
NN IP Euro Credit NN Investment Partners B.V.
T. Rowe Price European High Yield Bond T. Rowe Price International Ltd
Flossbach von Storch Global Convertible Bond Flossbach von Storch AG
Payden Emerging Market Debt Payden & Rygel
PPM America US Corporate Bond PPM America, Inc.
Amber Event Europe Amber Capital UK LLP

Notes to the financial statements/Notes aux états financiers
PrivilEdge · 31/03/2019 306
NOTE 7. Transaction Costs/Frais de Transaction Transaction Costs incurred by the Company relating to purchase or sale of transferable securities, Money Market instruments, derivatives or other eligible assets are mainly composed of Depositary Transaction Fees, Sub-Depositary Transaction Fees and Broker Fees. For the period ended 31 March 2019, these Transaction Costs which are included in the cost of investment or in Net realised gain/loss on sale of investments, options, futures contracts and forward foreign currency exchange contracts amount to: Les Frais de Transaction supportés par la Société, liés aux achats et ventes de valeurs mobilières, d’instruments du marché monétaire, de produits dérivés ou autres actifs sont principalement composés de Frais de Transaction du Dépositaire et Sous-Dépositaire, ainsi que de Frais de courtage. Pour la période clôturant au 31 mars 2019, les montants des Frais de Transaction qui sont inclus dans le coût d’investissement ou en gain/perte net(te) réalisé(e) sur ventes d’investissements, options, contrats futures et contrats de change à terme sont les suivants :
Sub-Funds Compartiments
Currency Devise
Transaction Costs Frais de Transaction
William Blair Global Leaders USD 96 283 Wellington Large Cap US Research USD 121 266 Sands US Growth USD 54 111 Delaware US Large Cap Value USD 162 364 WellsCap Us Selective Equity USD 89 857 Income Partners RMB Debt USD 1 156 SMAM Japan Small and Mid Cap JPY 24 517 689 Fidelity Technology USD 150 173 Ashmore Emerging Market Local Currency Bond USD 50 274 Baird US Aggregate Bond USD 1 428 Baird US Short Duration Bond USD 2 072 Columbia US Short Duration High Yield USD 5 277 DPAM European Real Estate EUR 49 997 H2O High Conviction Bonds EUR 109 229 American Century Emerging Markets Equity USD 718 121 AXA IM Short Duration Inflation Bond USD 7 080 Franklin Flexible Euro Aggregate Bond EUR 4 651 Henderson Pan European Equity EUR 15 198 William Blair US Small and Mid Cap USD 148 718 BlackRock Emerging Market Dynamic Bond USD 103 203 JP Morgan Pan European Flexible Equity EUR 620 001 Moneta Best of France EUR 181 182 NN IP Euro Credit EUR 11 516 T. Rowe Price European High Yield Bond EUR 4 001 Flossbach von Storch Global Convertible Bond EUR 6 157 Payden Emerging Market Debt USD 4 640 PPM America US Corporate Bond USD 14 242 Amber Event Europe EUR 111 098
NOTE 8. Taxes Taxe d'abonnement For the period ended 31 March 2019, the Company was subject to the tax on Luxembourg UCITS, at a rate of 0.01% per annum on S Shares (restricted to institutional investors within the meaning of the Law) and at a rate of 0.05% per annum on P, R, I, IM, M, U and N Shares. The “taxe d'abonnement” is waived for that part of the Company invested in Shares of other undertakings for collective investment that have already paid “taxe d'abonnement" in accordance with the statutory provisions of the Law. These taxes are included in the Fixed Rate of Operational Costs and are disclosed below: Pour la période clôturant au 31 mars 2019, la Société a été soumise à une taxe sur les SICAV luxembourgeoises dont le taux est fixé à 0.01% par an sur les Actions de la Classe S (réservée aux investisseurs institutionnels au sens de la Loi) et à 0.05% par an sur les Actions des Classes P, R, I, IM, M, U et N. La taxe d'abonnement n'est pas due pour la partie de la Société investie dans des Parts d'autres organismes de placements collectifs qui ont déjà versé cette taxe conformément aux dispositions statutaires de la Loi.

Notes to the financial statements/Notes aux états financiers
PrivilEdge · 31/03/2019
307
Ces taxes sont incluses dans le Taux Fixe de Coûts Opérationnels et sont détaillées ci-dessous :
Sub-Funds Compartiments
Currency Devise
Taxe d’abonnement
William Blair Global Leaders USD 46 910 Wellington Large Cap US Research USD 182 653 Sands US Growth USD 170 693 Delaware US Large Cap Value USD 239 311 WellsCap Us Selective Equity USD 33 475 Income Partners RMB Debt USD 17 352 SMAM Japan Small and Mid Cap JPY 13 767 895 Fidelity Technology USD 128 247 Ashmore Emerging Market Local Currency Bond USD 253 644 Baird US Aggregate Bond USD 18 819 Baird US Short Duration Bond USD 17 502 Columbia US Short Duration High Yield USD 15 135 DPAM European Real Estate EUR 61 283 H2O High Conviction Bonds EUR 150 044 American Century Emerging Markets Equity USD 100 401 AXA IM Short Duration Inflation Bond USD 17 624 Franklin Flexible Euro Aggregate Bond EUR 48 156 Henderson Pan European Equity EUR 1 136 William Blair US Small and Mid Cap USD 150 185 BlackRock Emerging Market Dynamic Bond USD 21 885 JP Morgan Pan European Flexible Equity EUR 105 107 Moneta Best of France EUR 46 740 NN IP Euro Credit EUR 51 649 T. Rowe Price European High Yield Bond EUR 9 078 Flossbach von Storch Global Convertible Bond EUR 13 568 Payden Emerging Market Debt USD 14 098 PPM America US Corporate Bond USD 21 163 Amber Event Europe EUR 24 085
Other Taxes/Autres taxes et impôts Under applicable foreign tax Laws, withholding taxes may be deducted from interest and dividends and capital gains taxes may be payable at various rates. Selon les législations fiscales étrangères en vigueur, certains impôts à la source pourront être déduits des intérêts et dividendes et des taxes sur gains de capitaux peuvent être payées à différents taux. NOTE 9. Securities Lending/Prêt de titres As at 31 March 2019, the Company had entered through the Bank Lombard Odier & Co Ltd, its Securities Lending Agent (which is affiliated to the Management Company), into fully collateralised securities lending agreements with first-class financial institutions as follows: Au 31 mars 2019, la Société a conclu avec la Banque Lombard Odier & Cie SA, son agent de prêts de titres (qui est affiliée à la Société de Gestion), les accords de prêts de titres entièrement garantis suivants avec des instituts financiers de premier ordre :
Sub-Funds Compartiments
Currency Devise
Market Value of Securities Lent Prêts de titres Valeur de marché
% of Investments % du portefeuille-titres
Collateral Securities Garanties en Titres
William Blair Global Leaders USD 479 017 0.47 644 598 SMAM Japan Small and Mid Cap JPY 103 552 400 0.54 105 764 784 Fidelity Technology USD 1 331 476 0.51 1 400 723 DPAM European Real Estate EUR 2 132 816 1.59 2 232 797 H2O High Conviction Bonds EUR 1 001 930 0.33 1 081 619 American Century Emerging Markets Equity USD 1 246 200 0.65 1 272 850 JP Morgan Pan European Flexible Equity EUR 8 076 889 3.90 12 132 800
Net income on Securities Lending is disclosed in the caption “Securities Lending income” and is received on a cash basis; a Sub-Fund may have income on Securities Lending in the “Statement of operations and changes in net assets” even without securities lent at period-end. Les revenus nets sur prêt de titres sont détaillés dans la section « Revenus sur prêt de titres » et sont reçus en espèces ; un Compartiment pourrait avoir des revenus sur prêt de titres dans la section « Etats des opérations et des variations de l’actif net » même sans titres prêtés en fin de période.

Notes to the financial statements/Notes aux états financiers
PrivilEdge · 31/03/2019 308
For the period ended 31 March 2019, the Securities Lending income generated by the Fund is as follows: Pour la période clôturant au 31 mars 2019, les revenus sur prêt de titres générés par le Fonds sont les suivants :
Sub-Funds Currency Total gross amount of Securities Lending Income
Direct-indirect costs and Fees deducted from gross
Securities Lending Income
Total net amount of Securities
Lending Income Compartiments Devise Montant brut total des
revenus sur prêt de titres Charges directes-indirectes déduites du montant brut
des revenus sur prêt de titres
Montant net total des revenus
sur prêt de titres William Blair Global Leaders USD 278 83 194 Sands US Growth USD 4 180 1 254 2 926 Income Partners RMB Deb USD 66 20 46 SMAM Japan Small and Mid Cap JPY 2 340 260 702 078 1 638 182 Fidelity Technology USD 4 920 1 476 3 444 DPAM European Real Estate EUR 9 127 2 738 6 389 American Century Emerging Markets Equity USD 5 497 1 649 3 848 Franklin Flexible Euro Aggregate Bond EUR 1 594 478 1 116 Henderson Pan European Equity EUR 90 27 63 Blackrock Emerging Market Dynamic Bond USD 381 114 266 JP Morgan Pan European Flexible Equity EUR 36 318 10 895 25 423 NN IP Euro Credit EUR 43 13 30 T. Rowe Price European High Yield Bond EUR 40 175 12 053 28 123
NOTE 10. Collateral/Garanties The following table reports the collateral held or paid to manage the counterparty exposure on OTC derivatives/Le tableau suivant indique les montants de garantie détenus et versés afin de gérer le risque de contrepartie sur les produits dérivés OTC :
Sub-Funds Counterparty Currency Collateral Cash Paid by the Fund in favour of the
Counterparty
Collateral Cash held by the Counterparty in favour of the
Fund Compartiments Contrepartie Devise Garanties versées en Cash
par le Fonds en faveur de la Contrepartie
Garanties détenues en Cash par la Contrepartie en faveur
du Fonds Wellington Large Cap US Research CACEIS Bank, Luxembourg Branch USD 120 000 - Delaware US Large Cap US Research CACEIS Bank, Luxembourg Branch USD 110 000 - SMAM Japan Small and Mid Cap CACEIS Bank, Luxembourg Branch JPY 30 000 000 - Fidelity Technology CACEIS Bank, Luxembourg Branch USD 400 000 - Ashmore Emerging Market Local Currency Bond CACEIS Bank, Luxembourg Branch USD 11 310 - Ashmore Emerging Market Local Currency Bond Goldman Sachs USD 710 015 - Ashmore Emerging Market Local Currency Bond JP Morgan London USD 180 000 - Ashmore Emerging Market Local Currency Bond BNP Paribas USD 2 500 000 - Ashmore Emerging Market Local Currency Bond Citibank New York USD 740 000 - Ashmore Emerging Market Local Currency Bond Morgan Stanley London USD - 358 931 Ashmore Emerging Market Local Currency Bond Deutsche Bank USD - 691 044 DPAM European Real Estate CACEIS Bank, Luxembourg Branch EUR 250 000 - H2O High Conviction Bonds Société Générale EUR 2 470 000 - H2O High Conviction Bonds Goldman Sachs EUR - 5 310 000 H2O High Conviction Bonds JP Morgan London EUR - 830 000 H2O High Conviction Bonds Deutsche Bank EUR - 2 620 000 William Blair US Small and Mid Cap CACEIS Bank, Luxembourg Branch USD 361 - BlackRock Emerging Market Dynamic Bond JP Morgan London USD 220 000 - BlackRock Emerging Market Dynamic Bond Morgan Stanley London USD 990 000 - JP Morgan Pan European Flexible Equity CACEIS Bank, Luxembourg Branch EUR 110 000 - NN IP Euro Credit CACEIS Bank, Luxembourg Branch EUR 1 410 600 - Amber Event Europe CACEIS Bank, Luxembourg Branch EUR 5 000 000 - Amber Event Europe Goldman Sachs EUR 350 050 -

Notes to the financial statements/Notes aux états financiers
PrivilEdge · 31/03/2019
309
NOTE 11. Research Commissions and Charges/Frais et Commissions de Recherche Subject to compliance with applicable Laws and Regulations, the Company has authorized Investment Managers to receive investment research from brokers, dealers and other third parties in connection with the management of a Sub-Fund which may be funded from either (i) transaction commissions ultimately borne by a Sub-Fund pursuant to soft commission, commission sharing and/or research charge collection arrangements with brokers, dealers and other third parties; or (ii) periodic charges made to a Sub-Fund by the Investment Manager at rates to be agreed by the Company and charged as other Fees to the relevant Sub-Fund. Where permitted by and subject to applicable Laws and Regulations, Investment Managers outside the European Union may receive research that is bundled with the trade execution services provided by a particular broker or dealer. Sous réserve du respect des Lois et Réglementations applicables, la Société a autorisé les Gérants à recevoir de la part de courtiers, d’opérateurs et d’autres tiers des analyses financières financées par soit (i) des commissions de transaction supportées finalement par un Compartiment en vertu d’accords de soft commission, de partage de commission et/ou de collecte des charges d’analyse financière conclus avec ces courtiers, opérateurs et autres tiers; soit (ii) des charges périodiques imputées à un Compartiment par le Gérant à des taux devant être validés par la Société et facturées comme autres commissions au Compartiment concerné. Dans la mesure autorisée par les Lois et Réglementations applicables et sous réserve de ces Lois et Réglementations, les Gérants situés hors de l’Union Européenne peuvent recevoir des analyses financières incluses dans les services d’exécution de négoce fournis par un courtier ou opérateur particulier. NOTE 12. Amendments to the Prospectus/Modifications du Prospectus A Prospectus dated 1st November 2018 was issued in order the reflect the following main changes: - new denomination of Sub-Fund; - change of Investment Manager; - change to investment policy. Un Prospectus daté du 1er novembre 2018 a été émis afin de refléter les principaux changements suivants : - nouvelle denomination de Compartiment ; - modification de Gérant ; - modification des politique d’investissement. NOTE 13. Event occurred during the period/Événement survenu durant la période On 7 December 2018, the PrivilEdge – Henderson Pan European Equity Sub-Fund was closed and its respective net assets were contributed into the PrivilEdge – JP Morgan Pan European Flexible Equity Sub-Fund. Le 7 décembre 2018, le Compartiment PrivilEdge – Henderson Pan European Equity a été fermé et les actifs nets respectifs ont été transférés dans le Compartiment PrivilEdge – JP Morgan Pan European Flexible Equity. NOTE 14. Subsequent Events/Événements postérieurs à la fin de la période A new Prospectus will be issued in order to introduce, inter alia, the following changes: - changes to investment policies; - regulatory updates. The Articles will be also amended to include regulatory updates. Un nouveau Prospectus sera émis afin d’inclure, notamment, les changements suivants : - modifications de politiques d’investissement ; - mises à jour réglementaires. Les Statuts seront également modifiés afin d'inclure des mises à jour réglementaires. In the event the United Kingdom (the "UK") leaves the European Union (the "EU") without a deal on a given date (the "Brexit Date"), JP Morgan Asset Management (UK) Limited, the Investment Manager of PrivilEdge – JP Morgan Pan European Flexible Equity (the “Sub-Fund”), deems that it is in the best interest of the Shareholders of the Sub-Fund to continue investing in equity securities issued by companies incorporated or exercising a prominent part of their business activities in the UK, notwithstanding the fact that the UK will not form part of the European Economic Area anymore. Therefore, the Board of Directors has decided that, in the event of the UK leaving the EU without a deal, the Sub-Fund shall cease to be managed according to the French Plans d’Épargne en Actions (“PEA”) rules with effect on the Brexit Date. Dans l’éventualité où le Royaume-Uni (le « R.-U. ») quitterait l’Union Européenne (l’« UE ») sans accord à une date donnée (la « Date de Brexit »), JP Morgan Asset Management (UK) Limited, le Gérant de PrivilEdge – JP Morgan Pan European Flexible Equity (le « Compartiment »), estime qu’il serait dans le meilleur intérêt des Actionnaires du Compartiment de continuer à investir dans des actions émises par des sociétés qui ont leur siège ou exercent une partie prépondérante de leurs activités au R.-U., quand bien même le R.-U. ne ferait alors plus partie de l’Espace Économique Européen. Par conséquent, le Conseil d’Administration a décidé que, si le R.-U. quitte l’UE sans accord, le Compartiment cessera d’être géré selon les règles Plans d’Épargne en Actions français (« PEA ») avec effet à la Date de Brexit.


PrivilEdgeis an investment company
with variable capital ("SICAV")incorporated in Luxembourg
PrivilEdgeest une société d’investissement
à capital variable ("SICAV")enregistrée au Luxembourg RCS Luxembourg B0181207
PrivilEdgeUnaudited Supplementary Information ·
Informations supplémentaires non révisées
31.03.2019

Unaudited supplementary information/Informations supplémentaires non révisées
312 PrivilEdge · 31/03/2019
TAX INFORMATION/INFORMATION FISCALE UK Reporting Fund Regime The “UK Reporting Fund Status” (UK RFS) is an advance certification and investors will be taxed on reported income and not only on cash distribution. The Company has obtained UK Reporting Fund status for certain Share Classes of the Sub-Funds. Details of all Share Classes holding Reporting Fund Status, together with the relevant reporting information, can be found on Lombard Odier's website (http://www.loim.com) and on the official website of the HM Revenue & Customs (https://www.gov.uk/government/organisations/hm-revenue-customs). The Directors will endeavour to maintain the UK RFS in the future. Le « Statut de Fonds déclarants » (UK RFS) est une certification anticipée et les investisseurs seront taxés sur l'ensemble des revenus rapportés et pas seulement sur les revenus issus de distribution. La Société a reçu le Status UK RFS pour certaines Parts des Compartiments. Les détails de ces Parts enregistrées sous le Régime UK, ainsi que les rapports y relatifs, peuvent être consultés sur le site Web de Lombard Odier (http://www.loim.com) ainsi que sur le site Web de HM Revenue & Customs (https://www.gov.uk/government/ organisations/hm-revenue-customs). Les Administrateurs s’efforceront de maintenir le « Statut de Fonds déclarants » (UK RFS). German Tax/Fiscalité allemande The Company fulfills the tax reporting requirements specified under the German Investment Tax Act (“InvTA”) for certain Share Classes of the Sub-Funds. Details of these Share Classes can be found on Lombard Odier's website (http://www.loim.com) and on the Bundesanzeiger website (https://www.bundesanzeiger.de). La Société satisfait aux exigences de reporting fiscal tel que définies par la Loi allemande sur la fiscalité des investissements (« InvStG ») pour certaines Actions des Compartiments. Les détails de ces Actions peuvent être consultées sur le site Web de Lombard Odier (http://www.loim.com) ainsi que sur le site Web du Bundesanzeiger (https://www.bundesanzeiger.de). Austrian Tax/Fiscalité autrichienne The Company has obtained the Austrian Declared Fund Status (“Meldefonds”) for certain Share Classes of the Sub-Funds. Details of the Share Classes holding the “Meldefonds” Status can be found on Lombard Odier's website (http://www.loim.com) and on the Oesterreichische Kontrollbank website (https://www.profitweb.at). La Société a obtenu le Statut autrichien « Meldefonds » pour certaines Actions des Compartiments. Les détails des Actions enregistrées sous le Statut « Meldefonds » peuvent être consultées sur le site Web de Lombard Odier (http://www.loim.com) ainsi que sur le site Web de l'Oesterreichische Kontrollbank (https://www.profitweb.at). French Tax/Fiscalité française The Sub-Funds listed hereafter invest more than 75% of their assets in corporate Shares as well as rights concerning such Shares and Units in accordance with Article 150-0 D of French tax code. These Sub-Funds have been fully and continuously compliant with this threshold from 1 January 2014 until 31 March 2019. Therefore, these Sub-Funds are eligible to the taper relief for holding period provided by Article 150-0 D of French Tax Code for the above mentioned period. Les Compartiments listés ci-dessous investissent plus de 75% de leurs actifs en Actions et Parts de Société, ainsi qu’en droits portant sur ces Actions et Parts au sens de l’Article 150-0 D du Code Général des Impôts. Ce quota a été respecté de manière continue depuis le 1 janvier 2014 jusqu’au 31 mars 2019. Par conséquent, ces Compartiments sont éligibles à l’abattement pour une durée de détention visé à l’Article 150-0 D du Code Général des Impôts pour la période mentionnée ci-dessus. William Blair Global Leaders Fidelity Technology Wellington Large Cap US Research American Century Emerging Markets Equity Sands US Growth William Blair US Small and Mid Cap Delaware US Large Cap Value JP Morgan Pan European Flexible Equity WellsCap US Selective Equity Moneta Best of France SMAM Japan Small and Mid Cap Eligibility for french Share Savings Schemes/Éligibilité aux Plans d’Épargne en Actions français (« PEA ») Owing to its eligibility for PEA, the JP Morgan Pan European Flexible Equity Sub-Fund (as from 30 November 2017) and the Moneta Best of France Sub-Fund (as from 15 June 2018) invest at least 75% of their net assets in Shares and rights that are eligible for the PEA and are issued by companies with their registered office in a jurisdiction of the European Economic Area (“EEA”) and which are subject to corporation tax or an equivalent regime. In the event the United Kingdom (the "UK") leaves the European Union (the "EU") without a deal on a given date (the "Brexit Date"), JP Morgan Asset Management (UK) Limited, the Investment Manager of PrivilEdge – JP Morgan Pan European Flexible Equity (the “Sub-Fund”), deems that it is in the best interest of the Shareholders of the Sub-Fund to continue investing in equity securities issued by companies incorporated or exercising a prominent part of their business activities in the UK, notwithstanding the fact that the UK will not form part of the EEA anymore. Therefore, the Board of Directors has decided that, in the event of the UK leaving the EU without a deal, the Sub-Fund shall cease to be managed according to the PEA rules with effect on the Brexit Date. Du fait de son éligibilité au PEA français, les Compartiments JP Morgan Pan European Flexible Equity (dès le 30 novembre 2017) et Moneta Best of France (dès le 15 juin 2018) investissent en permanence au moins 75% de leurs actifs nets en titres et droits éligibles au PEA émis par des sociétés ayant leur siège social dans une juridiction de l’Espace Économique Européen (« EEE ») et soumises à l’impôt sur les sociétés ou à un régime équivalent. Dans l’éventualité où le Royaume-Uni (le « R.-U. ») quitterait l’Union Européenne (l’« UE ») sans accord à une date donnée (la « Date de Brexit »), JP Morgan Asset Management (UK) Limited, le Gérant de PrivilEdge – JP Morgan Pan European Flexible Equity (le « Compartiment »), estime qu’il serait dans le meilleur intérêt des Actionnaires du Compartiment de continuer à investir dans des actions émises par des sociétés qui ont leur siège ou exercent une partie prépondérante de leurs activités au R.-U., quand bien même le R.-U. ne ferait alors plus partie de l’EEE. Par conséquent, le Conseil d’Administration a décidé que, si le R.-U. quitte l’UE sans accord, le Compartiment cessera d’être géré selon les règles PEA avec effet à la Date de Brexit.

Unaudited supplementary information/Informations supplémentaires non révisées
PrivilEdge · 31/03/2019
313
FATCA In compliance with the Foreign Account Tax Compliance Act (“FATCA”) and the Model 1 intergovernmental agreement entered between the United States of America and the Grand Duchy of Luxembourg (the “IGA”), the Board of Directors has elected to adopt the FATCA status of “Non-Reporting Financial Institution-deemed compliant” of “Collective Investment Vehicles” (“CIV”) as per annex II art. IV letter D of the IGA. Conformément au Foreign Account Tax Compliance Act (« FATCA ») et au Modèle 1 de l'accord intergouvernemental entré en vigueur entre les Etats-Unis d'Amérique et le Grand-Duché de Luxembourg (le « IGA »), le Conseil d'Administration a décidé d'appliquer le Statut FATCA en tant que « Non-Reporting Financial Institution-deemed compliant » pour les « Organismes de Placement Collectifs » (« OPC ») selon l'annexe II art. IV lettre D de l'IGA. Common Reporting Standard (“CRS”)/Norme Commune de Déclaration (« NCD ») In compliance with the OECD Common Reporting Standard (CRS) for Automatic Exchange of Financial Account Information in tax matters, the Board of Directors has elected to adopt the CRS status of Reporting Financial Institution. Conformément à la Norme Commune de Déclaration (NCD) de l'OCDE pour l'Échange Automatique de Renseignements en matière fiscale et ses commentaires connexes, le Conseil d'Administration a décidé d'opter pour le NCD statut d'Institution Financière Déclarante.

Unaudited supplementary information/Informations supplémentaires non révisées
314 PrivilEdge · 31/03/2019
GLOBAL EXPOSURE METHOD/METHODE D'EVALUATION DES RISQUES The commitment approach/Approche par les engagements All Sub-Funds use the commitment approach in order to monitor and measure the global exposure except the following Sub-Funds: H2O High Conviction Bonds, BlackRock Emerging Market Dynamic Bond, NN IP Euro Credit and Amber Event Europe. Tous les Compartiments utilisent l’approche par les engagements pour contrôler et mesurer le risque global excepté les Compartiments : H2O High Conviction Bonds, BlackRock Emerging Market Dynamic Bond, NN IP Euro Credit et Amber Event Europe. The Relative/Absolute VaR approach/Approche par la VaR Relative/Absolue The following Sub-Funds use the Relative/Absolute Value at Risk (VaR) approach in order to monitor and measure the global exposure. Les Compartiments suivants utilisent la méthode d’évaluation VaR (Value at Risk) Relative/Absolue afin de contrôler et mesurer le risque global. The use of the VaR limits for the period from 1 October 2018 to 31 March 2019 was as follows: L’utilisation des limites de la VaR pour la période du 1 octobre 2018 au 31 mars 2019 est la suivante :
Sub-Funds Benchmark Global exposure approach
VaR model Regulatory limit Lowest use level of VAR
Highest use level of VAR
Average level of
VAR
Confi-dence
interval
Holding period
Level of average leverage
during the period*
Compartiments Indice de référence Méthode de détermination du risque global
Modèle VaR Limite réglementaire
Plus faible niveau d’utili-
sation de la VaR
Plus haut niveau d’utili-
sation de la VaR
Niveau moyen de
la VaR
Intervalle de con-fiance
Période de détention
Niveau moyen de l’effet de levier au
cours de la période*
H2O High Conviction Bonds No Benchmark Absolute VaR Parametric 20% 41% 54% 49% 99% 20-Day 1145% BlackRock Emerging Market Dynamic Bond
No Benchmark Absolute VaR Parametric 20% 8% 33% 24% 99% 20-Day 519%
NN IP Euro Credit Bloomberg Barclays Euro Aggregate Corporate TR USD Hedged
Relative VaR Parametric 2x VaR of the benchmark
43% 49% 46% 99% 20-Day 18%
Amber Event Europe No Benchmark Absolute VaR Parametric 20% 11% 27% 19% 99% 20-Day 69%
* The expected leverage is expressed as the sum of the Absolute value of the Notionals of the financial derivative instruments held in each Sub-Fund’s portfolio (excluding the
investment portfolio) divided by its total net assets.
L'effet de levier prévu est exprimé comme la somme des valeurs absolues des montants notionnels des instruments financiers dérivés détenus dans le portefeuille de chaque Compartiment (à l’exception du portefeuille-titres) divisée par le total de l'actif net de celui-ci.
The observation period for all Sub-Funds starts from 01/10/2018 to 31/03/2019/La période d’observation pour tous les Compartiments se déroule du 01/10/2018 au 31/03/2019.

Unaudited supplementary information/Informations supplémentaires non révisées
PrivilEdge · 31/03/2019
315
SECURITIES FINANCING TRANSACTION REGULATION/REGLEMENT RELATIF AUX OPERATIONS DE FINANCEMENT SUR TITRES (“SFTR”) During the period, the Company carried out securities financing transactions subject to SFTR regulation as follows/Au cours de la période, la Société a effectué des opérations de financement sur titres soumis à la règlementation SFTR comme suit : SFT = Securities Financing Transactions/Opérations de financement sur titres Securities Lending Prêt de titres
William Blair Global LeadersUSD
SMAM JapanSmall and Mid Cap – JPY
Fidelity Technology USD
DPAM European Real EstateEUR
Global data/Information générales Amount of securities and commodities on loan as a proportion of total lendable assets defined as excluding cash and cash equivalents Montant des titres et matières premières prêtés en proportion du total des actifs pouvant être prêtés définis comme excluant la trésorerie et les équivalents de trésorerie % of lendable assets % des actifs pouvant être prêtés
0.47 0.54 0.51 1.59
Amount of assets engaged in each SFT expressed as an absolute amount (in the Sub-Fund currency) and as a proportion of the Sub-Fund' Assets under Management Montant des actifs engagés dans chaque type de SFT exprimés en valeur absolue (dans la monnaie du Compartiment) et en proportion des Actifs sous gestion du Compartiment Absolute value/Valeur absolue 479 017 103 552 400 1 331 476 2 132 816% of Assets under Management % des Actifs sous gestion
0.46 0.52 0.51 1.53
Concentration data/Données sur la concentration The 10 largest collateral issuers across all SFT (break down of volumes of the collateral securities and commodities received per issuer’s name) Les 10 plus gros émetteurs de garanties pour tous les types de SFT (ventilation des volumes de garanties et de matières premières reçus par noms d’émetteurs) Name/Nom Amount/Montant
France Government476 444
France Government79 533 190
France Governement 1 051 144
Republic of Austria539 872
Name/Nom Amount/Montant
Airbus SE33 631
Germany Government26 231 593
Germany Governement 305 432
Finnish Governement302 943
Name/Nom Amount/Montant
Engie SA33 631
--
Germany Bonds 35 303
Germany Governement172 275
Name/Nom Amount/Montant
Total SA33 631
--
Airbus SE 8 829
Netherlands Governement95 000
Name/Nom Amount/Montant
Vivedi SA33 631
--
Engie SA 8 829
Vivendi SA54 291
Name/Nom Amount/Montant
Safran SA33 630
--
Safran SA 8 829
Total SA54 291
Name/Nom Amount/Montant
--
--
Total SA 8 829
AXA SA54 291
Name/Nom Amount/Montant
--
--
Vivendi SA 8 829
Danone SA54 291
Name/Nom Amount/Montant
--
--
- -
EssilorLuxottica SA54 291
Name/Nom Amount/Montant
--
--
- -
Sanofi54 291
Top 10 counterparties of each type of SFT separately (name of counterparty and gross volume of outstanding transactions) Les 10 principales contreparties pour chaque type de SFT séparément (nom de la contrepartie et volume brut des opérations en cours) Name/Nom Amount/Montant
Morgan Stanley International479 017
JP Morgan Securities PLC103 552 400
JP Morgan Securities PLC 1 205 716
Natixis996 300
Name/Nom Amount/Montant
--
--
Morgan Stanley International 125 759
Credit Suisse (Europe) LTD920 025
Name/Nom Amount/Montant
--
--
- -
JP Morgan Securities PLC216 491
Aggregate transaction data for each type of SFT separately to be broken down according to the below categories Données d’opération agrégées pour chaque type de SFT séparément à ventiler en fonction des catégories suivantes Type and quality of collateral/Type et qualité des garanties Securities/Titres 100% 100% 100% 100%Rating Collaterals received by the Sub-Fund in respect of securities lending at the reporting date are in the form of debt securities having investment grade credit
rating/Les garanties reçues sur prêt de titres par le Compartiment en date du rapport sont sous forme de titres de créance ayant une notation investment grade
Maturity of the collateral/Echéance de la garantie More than 1 year/Plus de 1 an 476 444 105 764 784 1 356 576 1 362 247Open maturity/Ouverte 164 154 - 44 147 870 550Currency of the collateral/Devise de la garantie EUR 644 598 105 764 784 1 400 723 2 184 046GBP - - - 48 751Maturity of SFT/Echéance des SFT Less than 1 day/Moins de 1 jour 479 017 103 552 400 1 331 476 2 132 816Country in which the counterparties are established/Pays où sont établies les contreparties France - - - 996 300United Kingdom/Royaume-Uni 479 017 103 552 400 1 331 476 1 136 516Settlement and clearing/Règlement et compensation Tri-party 644 598 105 764 784 1 400 723 2 232 797Safekeeping of collateral received by the Sub-Fund as part of SFT/Conservation des garanties reçues par le Compartiment dans le cadre des SFT CACEIS and its Sub-Custodian network CACEIS et son réseau de Sous-Dépositaires
644 598 105 764 784 1 400 723 2 232 797
Data on income and costs for each type of SFT/Données sur les revenus et les coûts de chaque type de SFT The total income earned from securities lending transactions is split between the Sub-Fund and the Securities Lending Agent of the Company (see details in Note 9 to the financial statements) Le revenu total généré par les operations de prêt de titres est réparti entre le Compartiment et l’agent de prêt de titres de la Société (voir détails dans la Note 9 des états financiers)

Unaudited supplementary information/Informations supplémentaires non révisées
316 PrivilEdge · 31/03/2019
Securities Lending Prêt de titres
H2O High Conviction BondsEUR
American CenturyEmerging Markets Equity – USD
JP Morgan Pan European Flexible Equity – EUR
Global data/Information générales Amount of securities and commodities on loan as a proportion of total lendable assets defined as excluding cash and cash equivalents Montant des titres et matières premières prêtés en proportion du total des actifs pouvant être prêtés définis comme excluant la trésorerie et les équivalents de trésorerie % of lendable assets % des actifs pouvant être prêtés
0.33 0.65 3.90
Amount of assets engaged in each SFT expressed as an absolute amount (in the Sub-Fund currency) and as a proportion of the Sub-Fund' Assets under Management Montant des actifs engagés dans chaque type de SFT exprimés en valeur absolue (dans la monnaie du Compartiment) et en proportion des Actifs sous gestion du Compartiment Absolute value/Valeur absolue 1 001 930 1 246 200 8 076 889 % of Assets under Management % des Actifs sous gestion
0.27 0.65 3.73
Concentration data/Données sur la concentration The 10 largest collateral issuers across all SFT (break down of volumes of the collateral securities and commodities received per issuer’s name) Les 10 plus gros émetteurs de garanties pour tous les types de SFT (ventilation des volumes de garanties et de matières premières reçus par noms d’émetteurs) Name/Nom Amount/Montant
Norwegian Government488 386
France Government957 161
Netherlands Government 5 039 358
Name/Nom Amount/Montant
Germany Government193 211
Germany Government315 689
Germany Governement 2 375 130
Name/Nom Amount/Montant
France Government123 283
--
France Government 1 531 959
Name/Nom Amount/Montant
United Kingdom75 887
--
Koninklijke Philips NV 226 288
Name/Nom Amount/Montant
Euro Stability Mechanism55 481
--
RWE AG 226 287
Name/Nom Amount/Montant
Australian Governement45 020
--
EssilorLuxottica SA 226 286
Name/Nom Amount/Montant
Medtronics Global Holdings39 499
--
Anheuser-Busch InBev SA/NV 226 286
Name/Nom Amount/Montant
Gecina19 786
--
Fresenius SE & Co KGaA 226 286
Name/Nom Amount/Montant
Sanofi11 776
--
Fresenius Medical Care AG & Co 226 285
Name/Nom Amount/Montant
Finnish Government8 514
--
BASF SE 226 285
Top 10 counterparties of each type of SFT separately (name of counterparty and gross volume of outstanding transactions) Les 10 principales contreparties pour chaque type de SFT séparément (nom de la contrepartie et volume brut des opérations en cours) Name/Nom Amount/Montant
Barclays Bank PLC1 001 930
JP Morgan Securities PLC1 246 200
BNP Paribas Arbitrage SNC 4 717 406
Name/Nom Amount/Montant
--
--
ABN Amro Bank NV 3 143 643
Name/Nom Amount/Montant
--
--
Morgan Stanley International 2 362 644
Aggregate transaction data for each type of SFT separately to be broken down according to the below categories Données d’opération agrégées pour chaque type de SFT séparément à ventiler en fonction des catégories suivantes Type and quality of collateral/Type et qualité des garanties Securities/Titres 100% 100% 100% Rating Collaterals received by the Sub-Fund in respect of securities lending at the reporting date are in the form of debt securities having investment grade credit
rating/Les garanties reçues sur prêt de titres par le Compartiment en date du rapport sont sous forme de titres de créance ayant une notation investment grade
Maturity of the collateral/Echéance de la garantie More than 1 year/Plus de 1 an 1 081 619 1 272 850 8 946 447 Open maturity/Ouverte - - 3 186 353 Currency of the collateral/Devise de la garantie NOK 488 386 - - EUR 466 081 1 272 850 12 132 800 GBP 76 759 - - AUD 45 020 - - SEK 4 837 - - DKK 535 - - Maturity of SFT/Echéance des SFT Less than 1 day/Moins de 1 jour 1 001 930 1 246 200 10 223 693 Country in which the counterparties are established/Pays où sont établies les contreparties France - - 4 717 406 United Kingdom/Royaume-Uni 1 001 930 1 246 200 2 362 644 The Netherlands/Pays-Bas - - 3 143 643 Settlement and clearing/Règlement et compensation Tri-party 1 081 619 1 272 850 12 132 800 Safekeeping of collateral received by the Sub-Fund as part of SFT/Conservation des garanties reçues par le Compartiment dans le cadre des SFT CACEIS and its Sub-Custodian network CACEIS et son réseau de Sous-Dépositaires
1 081 619 1 272 850 12 132 800
Data on income and costs for each type of SFT/Données sur les revenus et les coûts de chaque type de SFT The total income earned from securities lending transactions is split between the Sub-Fund and the Securities Lending Agent of the Company (see details in Note 9 to the financial statements) Le revenu total généré par les operations de prêt de titres est réparti entre le Compartiment et l’agent de prêt de titres de la Société (voir détails dans la Note 9 des états financiers)

Unaudited supplementary information/Informations supplémentaires non révisées
PrivilEdge · 31/03/2019
317
SPECIFIC INFORMATION FOR SUBSCRIBERS IN FOREIGN COUNTRIES/INFORMATIONS SPECIFIQUES CONCERNANT LES SOUSCRIPTEURS DANS LES PAYS ETRANGERS Switzerland/Suisse Performances The performances are disclosed in accordance with the Swiss Funds & Asset Management Association (SFAMA) requirements. Les performances sont publiées conformément aux exigences de la Swiss Funds & Asset Management Association (SFAMA).
Sub-Funds Compartiments
Share Class Classe
Currency Devise
30/09/2018- 31/03/20191)
%
31/12/2017-31/12/20182)
%
31/12/2015-31/12/20183)
%
31/12/2013-31/12/20183)
% William Blair Global Leaders P USD (4.31) (9.42) 5.18 4.17 William Blair Global Leaders P EUR (1.01) (4.86) 3.41 8.13 William Blair Global Leaders R USD (4.76) (10.28) 4.21 3.22 William Blair Global Leaders R EUR (1.49) (5.76) 2.46 7.15 William Blair Global Leaders I USD (3.78) (16.56) - - William Blair Global Leaders M USD (3.94) (8.78) 5.89 4.87 William Blair Global Leaders M EUR (0.63) (4.18) 4.11 8.86 William Blair Global Leaders N USD (3.87) (8.56) 6.15 5.13 William Blair Global Leaders N EUR (0.56) (3.95) 4.37 3.37 Wellington Large Cap US Research P USD (3.26) (7.76) 5.89 4.53 Wellington Large Cap US Research P SH EUR (4.89) (10.36) (8.98) - Wellington Large Cap US Research R USD (3.74) (8.68) 4.89 3.56 Wellington Large Cap US Research I USD (2.75) (6.78) 2.48 - Wellington Large Cap US Research M USD (2.90) (7.14) 6.60 5.23 Wellington Large Cap US Research M SH EUR (4.53) (9.76) (4.95) - Wellington Large Cap US Research N USD (2.84) (6.93) 6.84 5.47 Sands US Growth P USD (0.17) 4.61 8.17 5.69 Sands US Growth P SH EUR (1.94) 1.60 6.02 4.40 Sands US Growth M USD 0.21 5.36 8.90 6.39 Sands US Growth M SH EUR (1.56) (16.53) - - Sands US Growth M SH GBP 13.03 (6.77) - - Sands US Growth N USD 0.29 5.61 9.17 6.65 Sands US Growth N EUR 3.74 10.94 7.34 10.71 Sands US Growth N GBP 0.37 12.17 14.60 13.41 Sands US Growth N SH GBP (0.92) 3.49 7.63 6.04 Delaware US Large Cap Value P USD (2.99) (4.68) 6.29 4.60 Delaware US Large Cap Value P SH EUR (4.54) (7.49) (0.89) - Delaware US Large Cap Value I USD (2.47) (3.67) 3.87 - Delaware US Large Cap Value M USD (2.63) (4.05) 6.85 5.09 Delaware US Large Cap Value M SH EUR (4.20) (6.88) 0.43 - Delaware US Large Cap Value M GBP (2.56) 1.91 12.16 11.89 Delaware US Large Cap Value U USD (2.37) (3.47) 3.81 - Delaware US Large Cap Value U EUR 0.99 (8.72) - - Delaware US Large Cap Value N USD (2.56) (3.82) 7.11 5.34 Delaware US Large Cap Value N GBP (2.48) 2.15 11.92 - WellsCap US Selective Equity P USD (9.75) (11.83) 4.65 0.79 WellsCap US Selective Equity I USD (9.25) (10.86) (0.42) - WellsCap US Selective Equity M USD (9.38) (11.16) 5.39 1.49 WellsCap US Selective Equity M SH EUR (10.93) (13.86) 3.17 (0.12) WellsCap US Selective Equity N USD (9.31) (10.95) 5.65 1.74 Income Partners RMB Debt P USD 5.94 (3.58) 0.97 0.07 Income Partners RMB Debt P SH CHF 4.05 (6.74) (1.63) (2.03) Income Partners RMB Debt M USD 6.25 (3.13) 1.37 0.42 Income Partners RMB Debt M SH CHF 4.35 (6.30) (1.24) (1.67) Income Partners RMB Debt M SH EUR 4.55 (6.01) (0.84) (1.20) Income Partners RMB Debt M CNH 3.86 2.20 2.89 2.61 Income Partners RMB Debt N USD 6.34 (2.85) 1.99 0.92 Income Partners RMB Debt N CNH 3.95 2.49 3.19 2.90

Unaudited supplementary information/Informations supplémentaires non révisées
318 PrivilEdge · 31/03/2019
Sub-Funds Compartiments
Share Class Classe
Currency Devise
30/09/2018- 31/03/20191)
%
31/12/2017-31/12/20182)
%
31/12/2015-31/12/20183)
%
31/12/2013-31/12/20183)
% SMAM Japan Small and Mid Cap P SH USD (9.01) (14.63) 12.50 - SMAM Japan Small and Mid Cap P SH EUR (10.40) (10.00) - - SMAM Japan Small and Mid Cap P JPY (10.14) (16.32) 12.42 - SMAM Japan Small and Mid Cap I SH CHF (10.04) (26.28) 3.69 - SMAM Japan Small and Mid Cap I JPY (9.62) (15.34) 6.77 - SMAM Japan Small and Mid Cap M SH USD (8.64) (14.04) 12.78 - SMAM Japan Small and Mid Cap M SH CHF (10.20) (16.65) 10.00 - SMAM Japan Small and Mid Cap M SH EUR (10.04) (16.26) 10.46 - SMAM Japan Small and Mid Cap M JPY (9.78) (15.72) 11.34 - SMAM Japan Small and Mid Cap U SH EUR (9.76) (15.95) - - SMAM Japan Small and Mid Cap U JPY (9.50) (19.08) - - SMAM Japan Small and Mid Cap N SH USD (8.57) (13.80) 15.85 - SMAM Japan Small and Mid Cap N SH EUR (9.96) (16.02) 10.78 - SMAM Japan Small and Mid Cap N JPY (9.71) (15.48) 11.67 - Fidelity Technology P USD 3.13 (4.28) 17.51 - Fidelity Technology P SH EUR 1.37 (7.12) 14.83 - Fidelity Technology R USD 2.64 (5.07) 16.95 - Fidelity Technology R SH EUR 0.89 (8.00) 13.86 - Fidelity Technology M USD 3.53 (3.59) 18.41 - Fidelity Technology M SH EUR 1.76 (6.46) 15.71 - Fidelity Technology N USD 3.61 (3.36) 18.70 - Fidelity Technology N SH EUR 1.84 (6.24) 16.00 - Fidelity Technology N SH GBP 2.41 (5.31) 17.05 - Ashmore Emerging Market Local Currency Bond P USD 4.66 (8.14) 3.83 - Ashmore Emerging Market Local Currency Bond P SH CHF 2.71 (11.21) (2.72) - Ashmore Emerging Market Local Currency Bond P SH EUR 2.86 (11.01 1.05 - Ashmore Emerging Market Local Currency Bond I USD 5.08 (7.40) 4.66 - Ashmore Emerging Market Local Currency Bond I SH CHF 3.12 (10.49) (1.52) - Ashmore Emerging Market Local Currency Bond M USD 4.96 (7.67) 4.35 - Ashmore Emerging Market Local Currency Bond M SH CHF 3.00 (10.76) 1.20 - Ashmore Emerging Market Local Currency Bond M SH EUR 3.16 (10.55) 1.56 - Ashmore Emerging Market Local Currency Bond M GBP 5.04 (1.93) 1.15 - Ashmore Emerging Market Local Currency Bond M SH GBP 3.82 (9.45) 2.62 - Ashmore Emerging Market Local Currency Bond N USD 5.03 (7.49) 4.55 - Ashmore Emerging Market Local Currency Bond N SH CHF 3.07 (10.58) (6.49) - Ashmore Emerging Market Local Currency Bond N SH EUR 3.23 (10.58) 1.76 - Ashmore Emerging Market Local Currency Bond N SH GBP 3.89 (9.27) (6.84) - Baird US Aggregate Bond I USD 4.72 (0.66) 0.34 - Barclays US Aggregate Bond Index 4.63 0.01 0.57 -
Baird US Aggregate Bond M USD 4.59 (0.93) 0.06 - Barclays US Aggregate Bond Index 4.63 0.01 0.57 -
Baird US Aggregate Bond M SH CHF 2.73 (4.08) (2.74) - Barclays US Aggregate Bond Index 2.75 (3.22) (2.27) -
Baird US Aggregate Bond M SH EUR 2.95 (3.69) (2.30) - Barclays US Aggregate Bond Index 2.99 (2.76) (1.79) -
Baird US Aggregate Bond M SH GBP 3.63 (2.54) (1.34) - Barclays US Aggregate Bond Index 3.66 (1.64) (0.74) -
Baird US Aggregate Bond N USD 4.66 (0.76) 0.24 - Barclays US Aggregate Bond Index 4.63 0.01 0.57 -
Baird US Short Duration Bond P USD 1.94 0.56 0.16 - Barclays USA Government Credit 1-3y 2.40 1.60 0.96 -
Baird US Short Duration Bond M USD 2.16 0.96 0.56 - Barclays USA Government Credit 1-3y 2.40 1.60 0.96 -
Baird US Short Duration Bond M SH CHF 0.35 (2.29) (2.12) - Baird US Short Duration Bond M SH EUR 0.57 (1.85) (1.79) - Baird US Short Duration Bond M SH GBP 1.20 (0.70) (0.81) -
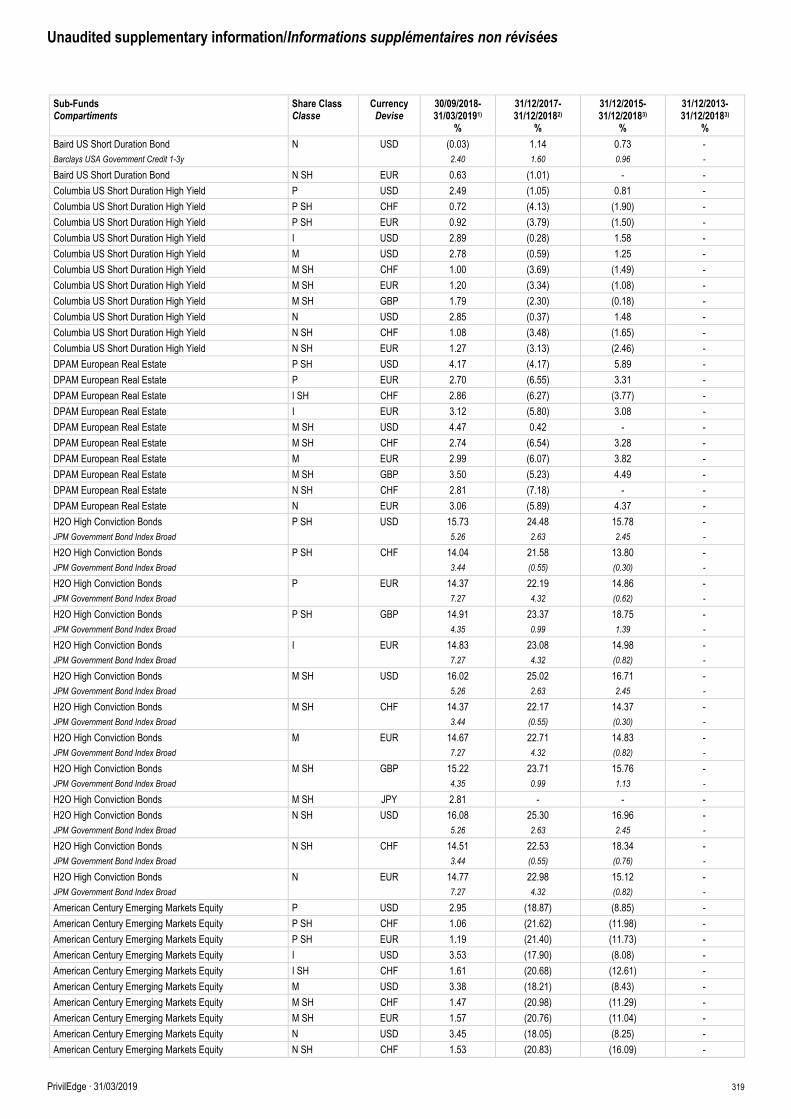
Unaudited supplementary information/Informations supplémentaires non révisées
PrivilEdge · 31/03/2019
319
Sub-Funds Compartiments
Share Class Classe
Currency Devise
30/09/2018- 31/03/20191)
%
31/12/2017-31/12/20182)
%
31/12/2015-31/12/20183)
%
31/12/2013-31/12/20183)
% Baird US Short Duration Bond N USD (0.03) 1.14 0.73 - Barclays USA Government Credit 1-3y 2.40 1.60 0.96 -
Baird US Short Duration Bond N SH EUR 0.63 (1.01) - - Columbia US Short Duration High Yield P USD 2.49 (1.05) 0.81 - Columbia US Short Duration High Yield P SH CHF 0.72 (4.13) (1.90) - Columbia US Short Duration High Yield P SH EUR 0.92 (3.79) (1.50) - Columbia US Short Duration High Yield I USD 2.89 (0.28) 1.58 - Columbia US Short Duration High Yield M USD 2.78 (0.59) 1.25 - Columbia US Short Duration High Yield M SH CHF 1.00 (3.69) (1.49) - Columbia US Short Duration High Yield M SH EUR 1.20 (3.34) (1.08) - Columbia US Short Duration High Yield M SH GBP 1.79 (2.30) (0.18) - Columbia US Short Duration High Yield N USD 2.85 (0.37) 1.48 - Columbia US Short Duration High Yield N SH CHF 1.08 (3.48) (1.65) - Columbia US Short Duration High Yield N SH EUR 1.27 (3.13) (2.46) - DPAM European Real Estate P SH USD 4.17 (4.17) 5.89 - DPAM European Real Estate P EUR 2.70 (6.55) 3.31 - DPAM European Real Estate I SH CHF 2.86 (6.27) (3.77) - DPAM European Real Estate I EUR 3.12 (5.80) 3.08 - DPAM European Real Estate M SH USD 4.47 0.42 - - DPAM European Real Estate M SH CHF 2.74 (6.54) 3.28 - DPAM European Real Estate M EUR 2.99 (6.07) 3.82 - DPAM European Real Estate M SH GBP 3.50 (5.23) 4.49 - DPAM European Real Estate N SH CHF 2.81 (7.18) - - DPAM European Real Estate N EUR 3.06 (5.89) 4.37 - H2O High Conviction Bonds P SH USD 15.73 24.48 15.78 - JPM Government Bond Index Broad 5.26 2.63 2.45 -
H2O High Conviction Bonds P SH CHF 14.04 21.58 13.80 - JPM Government Bond Index Broad 3.44 (0.55) (0.30) -
H2O High Conviction Bonds P EUR 14.37 22.19 14.86 - JPM Government Bond Index Broad 7.27 4.32 (0.62) -
H2O High Conviction Bonds P SH GBP 14.91 23.37 18.75 - JPM Government Bond Index Broad 4.35 0.99 1.39 -
H2O High Conviction Bonds I EUR 14.83 23.08 14.98 - JPM Government Bond Index Broad 7.27 4.32 (0.82) -
H2O High Conviction Bonds M SH USD 16.02 25.02 16.71 - JPM Government Bond Index Broad 5.26 2.63 2.45 -
H2O High Conviction Bonds M SH CHF 14.37 22.17 14.37 - JPM Government Bond Index Broad 3.44 (0.55) (0.30) -
H2O High Conviction Bonds M EUR 14.67 22.71 14.83 - JPM Government Bond Index Broad 7.27 4.32 (0.82) -
H2O High Conviction Bonds M SH GBP 15.22 23.71 15.76 - JPM Government Bond Index Broad 4.35 0.99 1.13 -
H2O High Conviction Bonds M SH JPY 2.81 - - - H2O High Conviction Bonds N SH USD 16.08 25.30 16.96 - JPM Government Bond Index Broad 5.26 2.63 2.45 -
H2O High Conviction Bonds N SH CHF 14.51 22.53 18.34 - JPM Government Bond Index Broad 3.44 (0.55) (0.76) -
H2O High Conviction Bonds N EUR 14.77 22.98 15.12 - JPM Government Bond Index Broad 7.27 4.32 (0.82) -
American Century Emerging Markets Equity P USD 2.95 (18.87) (8.85) - American Century Emerging Markets Equity P SH CHF 1.06 (21.62) (11.98) - American Century Emerging Markets Equity P SH EUR 1.19 (21.40) (11.73) - American Century Emerging Markets Equity I USD 3.53 (17.90) (8.08) - American Century Emerging Markets Equity I SH CHF 1.61 (20.68) (12.61) - American Century Emerging Markets Equity M USD 3.38 (18.21) (8.43) - American Century Emerging Markets Equity M SH CHF 1.47 (20.98) (11.29) - American Century Emerging Markets Equity M SH EUR 1.57 (20.76) (11.04) - American Century Emerging Markets Equity N USD 3.45 (18.05) (8.25) - American Century Emerging Markets Equity N SH CHF 1.53 (20.83) (16.09) -

Unaudited supplementary information/Informations supplémentaires non révisées
320 PrivilEdge · 31/03/2019
Sub-Funds Compartiments
Share Class Classe
Currency Devise
30/09/2018- 31/03/20191)
%
31/12/2017-31/12/20182)
%
31/12/2015-31/12/20183)
%
31/12/2013-31/12/20183)
% AXA IM Short Duration Inflation Bond P USD 1.10 0.00 - - AXA IM Short Duration Inflation Bond I USD 1.05 0.19 0.23 - AXA IM Short Duration Inflation Bond I SH CHF (0.75) (2.94) (2.71) - AXA IM Short Duration Inflation Bond I SH EUR (0.54) (2.61) (2.68) - AXA IM Short Duration Inflation Bond M USD 0.96 0.04 0.08 - AXA IM Short Duration Inflation Bond M SH CHF (0.83) (3.09) (2.85) - AXA IM Short Duration Inflation Bond M SH EUR (0.62) (2.76) (2.46) - AXA IM Short Duration Inflation Bond M SH GBP 0.00 (1.59) (1.12) - AXA IM Short Duration Inflation Bond N USD 1.50 0.16 - - AXA IM Short Duration Inflation Bond N SH CHF (0.80) (3.00) (2.76) - AXA IM Short Duration Inflation Bond N SH EUR (0.59) (2.67) (2.36) - Franklin Flexible Euro Aggregate Bond P EUR 0.81 (1.68) (1.21) - Barclays Euro Aggregate Index 3.40 0.41 1.10 -
Franklin Flexible Euro Aggregate Bond I SH CHF 0.91 (1.45) (1.09) - Franklin Flexible Euro Aggregate Bond I EUR 1.16 (1.01) (1.03) - Barclays Euro Aggregate Index 3.40 0.41 (0.51) -
Franklin Flexible Euro Aggregate Bond M SH USD 2.53 1.38 1.64 - Franklin Flexible Euro Aggregate Bond M SH CHF 0.79 (1.72) (1.27) - Franklin Flexible Euro Aggregate Bond M EUR 1.03 (1.28) (0.82) - Barclays Euro Aggregate Index 3.40 0.41 1.10 -
Franklin Flexible Euro Aggregate Bond N SH USD 2.59 1.56 1.82 - Franklin Flexible Euro Aggregate Bond N SH CHF 0.85 (1.55) (1.10) - Franklin Flexible Euro Aggregate Bond N EUR 1.10 (1.11) (0.64) - Barclays Euro Aggregate Index 3.40 0.41 1.10 -
William Blair US Small and Mid Cap P USD (5.35) (8.80) 0.67 - William Blair US Small and Mid Cap P SH EUR (6.94) (11.47) (9.87) - William Blair US Small and Mid Cap I USD (4.85) (7.83) 1.73 - William Blair US Small and Mid Cap I SH CHF (6.59) (12.20) - - William Blair US Small and Mid Cap S SH EUR (5.98) (9.63) (0.31) - William Blair US Small and Mid Cap M USD (4.99) (8.15) 1.38 - William Blair US Small and Mid Cap M SH EUR (6.58) (10.84) (2.32) - William Blair US Small and Mid Cap N USD (4.92) (7.97) 1.58 - William Blair US Small and Mid Cap N SH EUR (6.52) (10.67) (2.54) - BlackRock Emerging Market Dynamic Bond P USD 2.03 (12.61) (6.11) - BlackRock Emerging Market Dynamic Bond P SH CHF 0.18 (15.49) (8.93) - BlackRock Emerging Market Dynamic Bond P SH EUR 0.36 (15.25) (8.62) - BlackRock Emerging Market Dynamic Bond P SH GBP 0.97 (14.24) (7.64) - BlackRock Emerging Market Dynamic Bond I USD 2.44 (11.90) (5.33) - BlackRock Emerging Market Dynamic Bond I SH CHF 0.58 (14.81) (8.12) - BlackRock Emerging Market Dynamic Bond M USD 2.32 (12.16) (5.62) - BlackRock Emerging Market Dynamic Bond M SH CHF 0.46 (15.06) (8.48) - BlackRock Emerging Market Dynamic Bond M SH EUR 0.65 (14.82) (8.18) - BlackRock Emerging Market Dynamic Bond M SH GBP 1.26 (13.79) (7.21) - BlackRock Emerging Market Dynamic Bond N USD 2.39 (11.99) (5.46) - BlackRock Emerging Market Dynamic Bond N SH CHF 0.53 (14.89) (8.31) - BlackRock Emerging Market Dynamic Bond N SH EUR 0.72 (14.65) (7.99) - JP Morgan Pan European Flexible Equity P SH USD (0.71) (11.25) (10.94) - MSCI Europe Index (Total Return Net) 0.53 (8.20) (8.15) -
JP Morgan Pan European Flexible Equity P EUR (2.19) (13.58) (11.57) - MSCI Europe Index (Total Return Net) 0.07 (10.57) (9.29) -
JP Morgan Pan European Flexible Equity P SH GBP 6.50 (5.35) - - MSCI Europe Index (Total Return Net) 5.28 (5.66) - -
JP Morgan Pan European Flexible Equity I EUR (1.70) (12.67) (11.24) - MSCI Europe Index (Total Return Net) 0.07 (10.57) (9.10) -
JP Morgan Pan European Flexible Equity M SH USD (0.30) (10.72) (9.20) - MSCI Europe Index (Total Return Net) 0.53 (8.20) 6.57 -

Unaudited supplementary information/Informations supplémentaires non révisées
PrivilEdge · 31/03/2019
321
Sub-Funds Compartiments
Share Class Classe
Currency Devise
30/09/2018- 31/03/20191)
%
31/12/2017-31/12/20182)
%
31/12/2015-31/12/20183)
%
31/12/2013-31/12/20183)
% JP Morgan Pan European Flexible Equity M SH CHF (2.01) (13.31) (11.94) - MSCI Europe Index (Total Return Net) (1.30) (11.18) (9.61) -
JP Morgan Pan European Flexible Equity M EUR (1.84) (12.97) (11.55) - MSCI Europe Index (Total Return Net) 0.07 (10.57) (9.10) -
JP Morgan Pan European Flexible Equity M SH GBP (1.46) (12.35) (10.40) - MSCI Europe Index (Total Return Net) (0.71) (9.87) (8.33) -
JP Morgan Pan European Flexible Equity N EUR (1.78) (12.80) (11.38) - MSCI Europe Index (Total Return Net) 0.07 (10.57) (9.10) -
Moneta Best of France P EUR (7.89) (16.73) - - Moneta Best of France I EUR (7.52) (16.37) - - Moneta Best of France M EUR (7.58) (16.46) - - Moneta Best of France N EUR (7.57) (16.42) - - NN IP Euro Credit P EUR 2.12 (1.93) (2.20) - Bloomberg Barclays Euro Aggregate Credit – Corporate 2.56 (1.25) (1.41) -
NN IP Euro Credit I SH CHF 2.20 (1.73) (2.03) - Bloomberg Barclays Euro Aggregate Credit – Corporate 2.34 (1.67) (1.85) -
NN IP Euro Credit I EUR 2.47 (1.26) (1.54) - Bloomberg Barclays Euro Aggregate Credit – Corporate 2.56 (1.25) (1.41) -
NN IP Euro Credit M SH USD 3.84 1.06 0.84 - Bloomberg Barclays Euro Aggregate Credit – Corporate 4.16 1.55 1.36 -
NN IP Euro Credit M SH CHF 2.07 (2.00) (2.29) - Bloomberg Barclays Euro Aggregate Credit – Corporate 2.34 (1.67) (1.85) -
NN IP Euro Credit M EUR 2.34 (1.53) (1.81) - Bloomberg Barclays Euro Aggregate Credit – Corporate 2.56 (1.25) (1.41) -
NN IP Euro Credit M SH GBP 2.92 (0.52) (0.80) - Bloomberg Barclays Euro Aggregate Credit – Corporate 3.18 (0.12) (0.30) -
NN IP Euro Credit N SH CHF 2.14 (1.83) (2.13) - Bloomberg Barclays Euro Aggregate Credit – Corporate 2.34 (1.67) (1.85) -
NN IP Euro Credit N EUR 2.41 (1.36) (1.64) - Bloomberg Barclays Euro Aggregate Credit – Corporate 2.56 (1.25) (1.41) -
T. Rowe Price European High Yield Bond P SH USD 0.96 (6.25) (5.46) - T. Rowe Price European High Yield Bond P SH CHF (0.76) (9.13) (8.43) - T. Rowe Price European High Yield Bond P EUR (0.51) (8.68) (7.95) - T. Rowe Price European High Yield Bond I SH CHF (0.37) (8.41) (7.63) - T. Rowe Price European High Yield Bond M SH USD 1.23 (5.81) (5.02) - T. Rowe Price European High Yield Bond M SH CHF (0.50) (8.71) (8.01) - T. Rowe Price European High Yield Bond M EUR (0.25) (8.26) (7.53) - T. Rowe Price European High Yield Bond M SH GBP 0.18 (7.44) (6.70) - T. Rowe Price European High Yield Bond N EUR (0.18) (8.05) (7.33) - Flossbach von Storch Global Convertible Bond P SH CHF (1.56) (7.27) - - Flossbach von Storch Global Convertible Bond P EUR (1.30) (6.94) - - Flossbach von Storch Global Convertible Bond I SH CHF (1.14) (6.80) - - Flossbach von Storch Global Convertible Bond I EUR (0.91) (6.55) - - Flossbach von Storch Global Convertible Bond M SH USD 0.45 (5.33) - - Flossbach von Storch Global Convertible Bond M SH CHF (1.25) (6.96) - - Flossbach von Storch Global Convertible Bond M EUR (1.03) (6.71) - - Flossbach von Storch Global Convertible Bond M SH GBP (0.50) (5.65) - - Flossbach von Storch Global Convertible Bond N SH CHF (1.18) (6.85) - - Flossbach von Storch Global Convertible Bond N EUR (0.95) (6.60) - - Payden Emerging Market Debt I SH CHF 1.69 - - - Payden Emerging Market Debt I SH EUR 3.12 (4.67) - - Payden Emerging Market Debt M USD 4.64 (3.14) - - Payden Emerging Market Debt M SH CHF 2.77 (5.01) - - Payden Emerging Market Debt M SH EUR 2.98 (4.84) - - Payden Emerging Market Debt M SH GBP 3.56 (2.75) - -

Unaudited supplementary information/Informations supplémentaires non révisées
322 PrivilEdge · 31/03/2019
Sub-Funds Compartiments
Share Class Classe
Currency Devise
30/09/2018- 31/03/20191)
%
31/12/2017-31/12/20182)
%
31/12/2015-31/12/20183)
%
31/12/2013-31/12/20183)
% Payden Emerging Market Debt N USD 4.72 (3.02) - - Payden Emerging Market Debt N SH CHF 2.85 (4.90) - - Payden Emerging Market Debt N SH EUR 3.06 (4.72) - - PPM America US Corporate Bond I USD 4.71 (0.10) - - PPM America US Corporate Bond M USD 4.58 (0.26) - - PPM America US Corporate Bond M SH CHF 2.73 (1.45) - - PPM America US Corporate Bond M SH EUR 2.97 (1.93) - - PPM America US Corporate Bond M SH GBP 3.61 (0.55) - - PPM America US Corporate Bond N USD 4.65 0.59 - - PPM America US Corporate Bond N SH EUR 3.03 (1.08) - - Amber Event Europe P EUR (1.06) (0.50) - - Amber Event Europe IM EUR (0.27) 0.38 - - Amber Event Europe S EUR 2.13 - - - Amber Event Europe M SH Seeding USD 0.51 0.88 - - Amber Event Europe M SH Seeding CHF (1.18) (1.78) - - Amber Event Europe M Seeding EUR (0.74) (0.36) - - Amber Event Europe M SH Seeding GBP (0.28) (0.18) - - Amber Event Europe U Seeding EUR (0.79) (1.61) - - Amber Event Europe N SH Seeding USD 0.72 1.00 - - Amber Event Europe N SH Seeding CHF 0.40 (0.10) - - Amber Event Europe N Seeding EUR (0.64) (0.07) - - Amber Event Europe N SH Seeding GBP (0.12) 0.35 - -
1) Performance of the period under review (or since date of launch until period-end)/Performance de la période sous revue (ou depuis la date de lancement jusqu’à la fin de la
période) 2) Performance since 1 January or since date of launch if later than 1 January/Performance depuis le 1er janvier ou depuis la date de lancement si celle-ci est plus récente 3) Annualised on 3 years, 5 years or since launch date/Annualisé sur 3 ans, 5 ans ou depuis la date de lancement Past Performance is no indication of current or future Performance. This Performance data does not take account of any Commissions or costs incurred on the issue and redemption of Shares. La performance historique ne représente pas un indicateur de performance courante ou future. Les données de performance ne tiennent pas compte des Commissions et frais perçus lors de l’émission et du rachat des Actions. Germany/Allemagne Information available in Germany/Information disponible en Allemagne The Paying and Information Agent of the Company in the Federal Republic of Germany is DekaBank Deutsche Girozentrale, Mainzer Landstr. 16, 60325 Frankfurt am Main (“German Paying and Information Agent”). Redemption and conversion applications for Shares may be submitted to the German Paying and Information Agent. The redemption proceeds, any distributions and other payments are paid out to Shareholders on their request through the German Paying and Information Agent. The Prospectus, the Key Investor Information Documents, the Articles of Association, the annual and semi-annual reports of the Company, each in hard copy form, as well as the issue, redemption and any conversion prices, the statement of changes in the composition of the investment portfolio and notices to Shareholders, may be obtained free of charge from the German Paying and Information Agent. The issue, redemption and conversion prices of Shares will be published on www.fundinfo.com. Notices to Shareholders will be sent to the registered Shareholders in Germany by post. Le Service de paiement et d’information de la Société en République Fédérale d’Allemagne est DekaBank Deutsche Girozentrale, Mainzer Landstr. 16, 60325 Frankfurt (Service de paiement et d’information allemand). Les rachats et conversions d’Actions peuvent être déposés auprès du Service de paiement et d’information allemand. Les rachats, toutes distributions et autres paiements sont payés aux Actionnaires à leur demande auprés du Service de paiement et d’information allemand. Le Prospectus, le Key Investor Information Document, les Statuts, les rapports annuels et semestriels de la Société, chacun de ces documents en version papier, ainsi que l’actif net par Action et tout prix d’émission, de rachat ou de conversion, les informations sur les modifications apportées aux portefeuilles de titres et les autres informations sur les Fonds, peuvent être obtenus gratuitement auprès du Service de paiement et d’information allemand. L’émission et le rachat seront communiqués sur www.fundinfo.com. Les notifications seront envoyées aux Actionnaires enregistrés en Allemagne par courrier postal. Liechtenstein Total Expense Ratio The Total Expense Ratio is disclosed on page 297 in Note 5. Le Total Expense Ratio est détaillé à la page 297 dans la Note 5.

RS_03.2019_LU_en-fr_05.2019

www.lombardodier.com