private sector house condition survey 2013 report of survey · private sector house condition...
TRANSCRIPT

Private Sector House Condition Survey 2013
Report of Survey
Prepared by David Adamson & Partners Ltd.
E2305
January 2014

David Adamson & Partners Ltd. Page | 1
PRIVATE SECTOR HOUSE CONDITION SURVEY 2013
TABLE OF CONTENTS
SUMMARY OF MAIN FINDINGS
ACKNOWLEDGEMENTS
1.0 SURVEY BACKGROUND AND METHODOLOGY ............................................................ 13
Chapter 1 : Introduction and Background to the Study ................................................... 14
Chapter 2 : Survey Method and Response .................................................................... 15
Chapter 3 : The Measurement of Housing Conditions.................................................... 18
Chapter 4 : Survey Analysis and Reporting Framework ................................................. 20
2.0 A PROFILE OF THE PRIVATE HOUSING SECTOR......................................................... 21
Chapter 5 : The Characteristics and Distribution of Private Sector Housing ................... 22
Chapter 6 : The Characteristics and Distribution of Private Sector Households .............. 29
3.0 PRIVATE SECTOR HOUSING CONDITIONS - AN OVERVIEW ....................................... 39
Chapter 7 : Housing Conditions 2013 - An Overview ..................................................... 40
Chapter 8 : Housing Conditions 2013 - National Context ............................................... 42
Chapter 9 : Changes in Housing Conditions 2006 - 2013 .............................................. 43
4.0 PRIVATE SECTOR HOUSING CONDITIONS 2013 .......................................................... 46
Chapter 10 : HHSRS - Category 1 Hazards..................................................................... 47
Chapter 11 : Housing Disrepair ....................................................................................... 53
Chapter 12 : Housing Amenities and Facilities ................................................................ 60
Chapter 13 : Home Energy Efficiency.............................................................................. 64
Chapter 14 : Decent Homes Overall Performance ........................................................... 71
Chapter 15 : Non-Decent Homes - Investment Needs ..................................................... 74
Chapter 16 : Decent Places - Environment Conditions .................................................... 76
5.0 HOUSING CONDITIONS AND HOUSEHOLD CIRCUMSTANCES ................................... 80
Chapter 17 : Housing Conditions and Household Circumstances .................................... 81
Chapter 18 : Fuel Poverty .............................................................................................. 86
Chapter 19 : Housing and Health .................................................................................... 93
Chapter 20 : Household Attitudes to Housing and Local Areas ...................................... 101
6.0 SECTORAL REVIEW ..................................................................................................... 107
Chapter 21 : Comparative Conditions - Owner Occupied and Private Rented
Sectors ..................................................................................................... 108
Chapter 22 : Owner-occupiers in Non-Decent Homes ................................................... 111

David Adamson & Partners Ltd. Page | 2
PRIVATE SECTOR HOUSE CONDITION SURVEY 2013
Chapter 23 : The Private-Rented Sector........................................................................ 118
7.0 CONCLUSIONS ............................................................................................................. 125
Chapter 24 : Conclusions .............................................................................................. 126
LIST OF TABLES
LIST OF FIGURES
APPENDICES Appendix A : The Interpretation of Statistical Data ................................................................. 135
Appendix B : Sampling Errors ............................................................................................... 136
Appendix C : Survey Questionnaire ....................................................................................... 139
Appendix D : The Decent Homes Standard ........................................................................... 140
Appendix E : Glossary of Terms ............................................................................................ 124

David Adamson & Partners Ltd. Page | 3
PRIVATE SECTOR HOUSE CONDITION SURVEY 2013
SUMMARY OF MAIN FINDINGS
1.0 BACKGROUND
1.1 David Adamson & Partners Ltd. was commissioned by Reading Borough Council to
complete a review of housing and household conditions across the private housing sector.
The study updates a previous survey completed in 2006. Information from the current study
permits an analysis of recent changes in housing conditions throughout the borough. The
study also provides a benchmark for private sector housing locally against national housing
conditions and provides a base of information for the review and further development of
private sector housing strategies.
1.2 The 2013 study has involved a comprehensive survey programme across a sample of 1,000
dwellings representing 2% of all private dwellings in the Borough. Survey investigation has
included physical housing conditions (HHSRS and Decent Homes), energy efficiency
(RdSAP) and the circumstances and attitudes of occupying households. Sample addresses
were selected and provided by the Building Research Establishment (BRE) and targeted
towards areas of suspected poor condition. Household response to and cooperation with
the survey programme was high with fewer than 3% of private sector households refusing to
take part.
1.3 The size and structure of the sample were designed to provide a hierarchy of reporting
across the Borough with detailed reporting available Borough-wide and for the main tenure
groups and key condition indicators available at Electoral Ward level.
2.0 KEY FINDINGS : HOUSING STOCK AND HOUSEHOLDS
2.1 Reading Borough Council Area contains a private sector housing stock 52,236 dwellings
occupied by 59,121 households and a population of 143,462 persons.
2.2 Private sector housing in Reading varies from the national profile by age and tenure. The
Borough has higher concentrations of both older (pre-1919) and more modern housing
(post-1980) and has significantly higher rates of private-rental. In Reading, 14,704 dwellings
(28.1%) were constructed pre-1919 compared to 23.7% of private housing nationally;
13,969 dwellings (26.7%) were constructed post-1980 compared to 21.8% of private
housing nationally. The proportion of flats in Reading is also above the national average,
whilst 27% of private sector dwellings in Reading are flats the equivalent figure for England
is 15%.

David Adamson & Partners Ltd. Page | 4
PRIVATE SECTOR HOUSE CONDITION SURVEY 2013
2.3 Owner-occupation represents the predominant form of private sector tenure - 36,795 dwgs
(70.4%) but rates of private-rental have increased significantly since 2006 in line with
national trends. In 2013, 14,863 dwellings in Reading are privately rented representing
28.5% of private sector housing stock and this has increased from 24.2% since 2006.
READING 2013 ENGLAND 2011-12
HOUSING TENURE dwgs % %
Owner-occupied 36795 70.4 78.6
Private-rented 14863 28.5 21.4
Unobtainable1
577 1.1 -
2.4 Using current national classifications, 5,241 dwellings (10% of private sector dwellings) fall
within the definition of a house in multiple occupation2, nationally 2.3% of all private sector
dwellings are HMOs. 3,038 dwellings in Reading were classified as flats in converted
buildings, 681 dwellings as bedsits and 1,522 dwellings as shared houses or flats. A
minimum of 1,001 HMO’s in Reading are estimated to fall within mandatory licensing
requirements (1.9% of all private sector dwellings), and this is above the national estimate
for the number of verifiable HMOs (0.44% of private sector dwellings are verifiable HMOs)
(HSSA,2011).
2.5 Highest rates of private-rental (in excess of 50% of ward housing stock) are associated with
Katesgrove, Abbey, Redlands and Park wards. HMO housing stock is again highest in
Redlands and Park wards but also in the wards of Church and Battle.
2.6 Household demographic and social characteristics vary by tenure reflecting a younger, more
mobile private-rented sector and an older, residentially established owner-occupied sector.
51% of private-rented households are headed by a person aged under 25 years, 32% of
owner-occupied households are headed by a person aged 65 years and over. Household
type distributions reflect the demographic differences between tenures. 76% of private-
rented households comprise a single person aged under 60 years; 31% of owner-occupied
households are elderly in composition.
2.7 38,801 heads of household (66%) are in full or part-time employment, 1,459 heads of
household (2.5%) are unemployed and 11,392 heads of household (19.3%) are
economically retired. Average household income is estimated at £31,675 compared to a
current UK average of £33,000.
1 Unobtainable refers to those dwellings that were vacant at the time of survey with no obvious indication of tenure, for example
for sale or to let sign outside. 2 A HMO is a house, or a flat, that is:
Occupied by 3 or more tenants forming 2 or more households who share (or the building lacks) a basic amenity such as
cooking facilities, bathroom or toilet;
Occupied by more than 1 household and is a converted building but is not entirely self-contained flats;
Converted into self-contained flats, but does not meet the requirements of the 1991 Building Regulations and at least 1/3 of the
flats are occupied under short tenancies.

David Adamson & Partners Ltd. Page | 5
PRIVATE SECTOR HOUSE CONDITION SURVEY 2013
2.8 14,184 households (24.0%) are in receipt of means-tested or disability related benefits and
are economically vulnerable; 4,782 households (8.1%) are on low incomes. There is a
significant degree of overlap between these groups, such that 2,700 households are both
classified as economically vulnerable and also as on low income.
2.9 Household economic circumstances are significantly worse in the private-rented sector:
3.0 KEY FINDINGS - CHANGE IN HOUSING CONDITION : 2006 - 2013
3.1 Private sector housing conditions in Reading have improved substantially in the seven year
period from 2006 as evidenced by a reduction in the number of non-Decent homes from
20,500 dwellings in 2006 to 12,200 dwellings in 2013: a reduction of 8,300 non-Decent
homes or 40%. Over the same period rates of non-Decency in the private housing sector
have declined from 40.2% to 23.4%. Within the Decent Homes Standard the area of
greatest improvement is thermal comfort linked to energy efficiency of domestic dwellings.
The number of dwellings non-compliant on Decent Homes thermal comfort declined by
6,969 dwellings or 61% between 2006 - 2013. Over the same period the average SAP
Rating for private dwellings has increased from 51 to 66 - an increase just under 30%.
3.2 One factor that has not improved over the period 2006 – 2013 is the level of Category 1
hazards in Reading; this has remained static at around 10% of private sector dwellings.
KEY FACTS:
4.6% of heads of household in the private-rented sector are unemployed
compared to 1.2% of owner-occupied households;
20.4% of heads of household in the private-rented sector are students compared
to 0.2% of owner-occupied households;
Average household income within the private-rented sector is estimated at
£28,563 compared to £33,526 in the owner-occupied sector;
17.1% of private-rented households are on low incomes compared to 2.7% of
owner-occupied households.
David Adamson & Partners Ltd. Page | 6
PRIVATE SECTOR HOUSE CONDITION SURVEY 2013
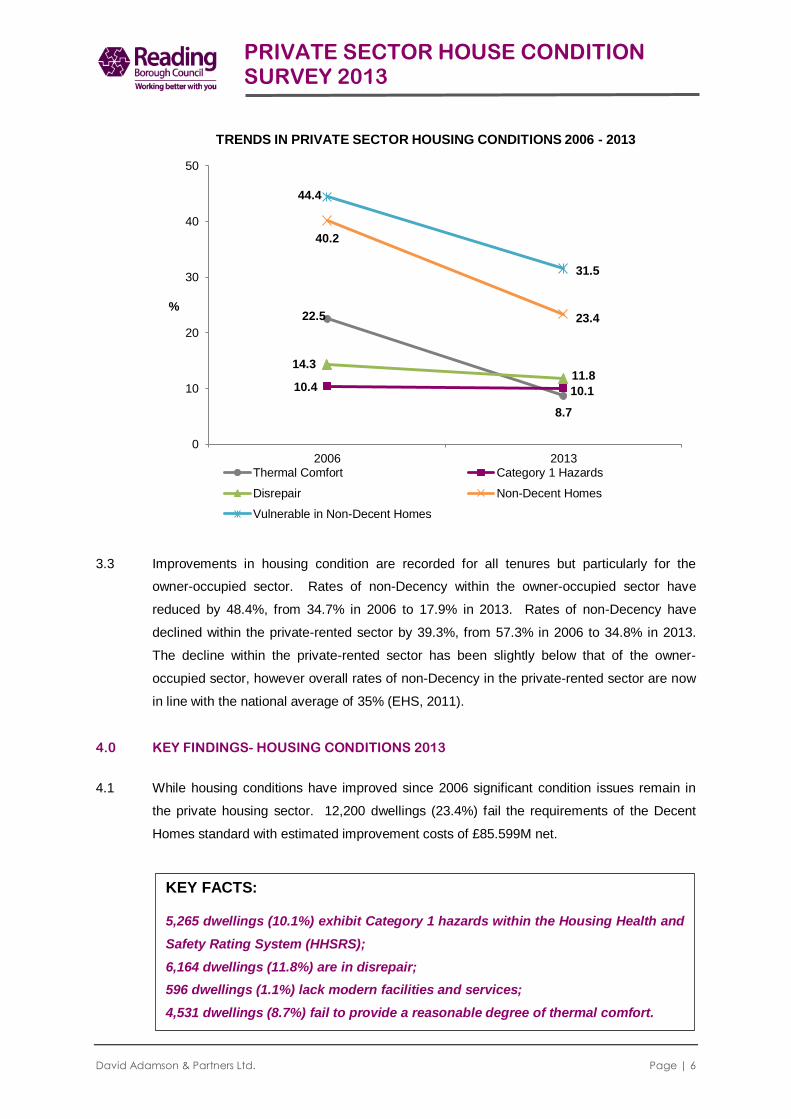
3.3 Improvements in housing condition are recorded for all tenures but particularly for the
owner-occupied sector. Rates of non-Decency within the owner-occupied sector have
reduced by 48.4%, from 34.7% in 2006 to 17.9% in 2013. Rates of non-Decency have
declined within the private-rented sector by 39.3%, from 57.3% in 2006 to 34.8% in 2013.
The decline within the private-rented sector has been slightly below that of the owner-
occupied sector, however overall rates of non-Decency in the private-rented sector are now
in line with the national average of 35% (EHS, 2011).
4.0 KEY FINDINGS- HOUSING CONDITIONS 2013
4.1 While housing conditions have improved since 2006 significant condition issues remain in
the private housing sector. 12,200 dwellings (23.4%) fail the requirements of the Decent
Homes standard with estimated improvement costs of £85.599M net.
22.5
8.7
10.4 10.1
14.3 11.8
40.2
23.4
44.4
31.5
0
10
20
30
40
50
2006 2013
%
TRENDS IN PRIVATE SECTOR HOUSING CONDITIONS 2006 - 2013
Thermal Comfort Category 1 Hazards
Disrepair Non-Decent Homes
Vulnerable in Non-Decent Homes
KEY FACTS:
5,265 dwellings (10.1%) exhibit Category 1 hazards within the Housing Health and
Safety Rating System (HHSRS);
6,164 dwellings (11.8%) are in disrepair;
596 dwellings (1.1%) lack modern facilities and services;
4,531 dwellings (8.7%) fail to provide a reasonable degree of thermal comfort.

David Adamson & Partners Ltd. Page | 7
PRIVATE SECTOR HOUSE CONDITION SURVEY 2013
4.2 A range of Category 1 hazards are present although the overall profile is strongly influenced
by ‘excess cold’ and the risk of ‘falls on steps/stairs.’ Of the 5,265 dwellings with a Category
1 hazard, 3,672 dwellings (69.7%) fail on excess cold; 1,026 dwellings (19.5%) fail on risk of
falls on steps/stairs.
4.3 Housing conditions vary sectorally across the housing stock providing initial targets for
intervention. These targets include: The private-rented sector, HMO’s, Flats in converted
buildings and dwellings constructed pre-1919. Housing conditions are particularly poor
within the private-rented and HMO housing sectors.
4.4 Geographically, the distribution of poor condition housing is strongly related to the location
of the private rented and HMO housing sectors. Conditions are significantly worse in the
wards of Abbey, Battle, Park and Redlands. Conversely, as the percentage of owner-
occupation increases the prevalence of poor condition housing decreases.
10.8
2.3
17
18.2
7.9
0.7
8.7
7
0 2 4 6 8 10 12 14 16 18 20
Thermal Comfort
Amenities
Disrepair
Category 1 Hazard
% Non-Compliant
Owner-Occupied
Private Rented

David Adamson & Partners Ltd. Page | 8
PRIVATE SECTOR HOUSE CONDITION SURVEY 2013
5. KEY FINDINGS - HOUSING AND HOUSEHOLD ISSUES
5.1 Poor housing conditions are compounded by the socio-economic characteristics of private
sector households. As such, poor housing conditions are over-represented in economically
.0
5.0
10.0
15.0
20.0
25.0
30.0
35.0
.0
10.0
20.0
30.0
40.0
50.0
60.0
70.0
80.0
% P
oor
Conditio
n
% P
rivate
Rente
d
RELATIONSHIP BETWEEN PREVALENCE OF PRIVATE RENTED DWELLINGS AND POOR CONDITION
% Private Rented % with Category 1 Hazard % in Disrepair
.0
5.0
10.0
15.0
20.0
25.0
30.0
35.0
.0
20.0
40.0
60.0
80.0
100.0
120.0
% P
oor
Conditio
n
% H
MO
Dw
ellin
gs
RELATIONSHIP BETWEEN PREVALENCE OF OWNER OCCUPIED DWELLINGS AND POOR CONDITION
% Owner Occupied % with Category 1 Hazard % in Disrepair

David Adamson & Partners Ltd. Page | 9
PRIVATE SECTOR HOUSE CONDITION SURVEY 2013
and socially disadvantaged households including younger single person households, lone
parent families, the elderly, the economically vulnerable and those on low incomes.
5.2 3,844 households containing children occupy non-Decent dwellings; 54.8% of these live in a
property with a Category 1 hazard, primarily related to the risk of excess cold, but also
overcrowding and lack of space. Just under two fifths of family households in non-Decent
properties experience significant disrepair to their home and 30% live in properties that fail
the thermal comfort requirements of the Decent Homes Standard.
5.3 The private housing sector contains 14,184 vulnerable households
3. Currently 9,712
vulnerable households (68.5%) live in Decent homes. This figure remains below the
Government’s previous PSA Target 7 guidelines for 2011 (70%) and 2021 (75%). Key
sectors remaining below these targets include pre-1919 housing in general and converted
flats in particular; the private-rented sector and HMO’s in particular.
5.4 While energy efficiency levels have improved since 2006 fuel poverty has increased in the
Borough related to increases in energy tariffs and the economic circumstances of
households affected. 10,573 households in Reading (17.9%) spend in excess of 10% of
annual income on domestic fuel and are in fuel poverty. Levels of fuel poverty have
increased from 5,600 households or 11% as reported by the 2006 survey.4
5.5 The relationship between fuel poverty and household economic circumstances is both
obvious and well documented. Demographically, fuel poverty in Reading impacts most
strongly on both younger and older households. Within Reading, rates of fuel poverty are
above the Borough average for households living in the private-rented sector, in multiple
occupation and in pre-1919 terraced housing. Geographically the highest rates of fuel
poverty are recorded in Church, Katesgrove, Park and Redlands Wards.
5.6 6,171 households in Reading (10.4%) indicated that at least one household member was
affected by a long-term illness or disability. The most common complaints were related to
mobility impairment or physical disability, respiratory illness and heart/circulatory problems.
3 Vulnerable households are those in receipt of one of the means tested or disability related benefits.
4 Private Sector House Condition Survey 2006 (Reading Borough Council in partnership with PPS plc).
KEY FACTS: Converted flats where 34.7% of vulnerable households live in decent homes;
Houses in Multiple Occupation where 44.5% of vulnerable households live in
Decent Homes;
Private-rented dwellings where 62.7% of vulnerable households live in decent
homes;
Pre-1919 housing where 63.7% of vulnerable households live in decent homes.
.
David Adamson & Partners Ltd. Page | 10
PRIVATE SECTOR HOUSE CONDITION SURVEY 2013
5.7 Long-term illnesses and disability place significant pressure on local Health Service
resources. 87% of affected households had made health service contact in the past year
with predominant contact through GP and hospital outpatient services. Statistically
significant correlations were identified in the survey between housing conditions, household
health and health service contacts.
5.8 1,740 households (2.9%) thought that their current housing conditions impacted negatively
on their family’s health. Among those perceiving a negative effect 1,428 households
(82.1%) live in non-Decent homes. Overall 9 per cent of households living in non-Decent
homes perceive a negative impact on family health. This compares with just 0.7% of
households living in Decent homes.
5.9 Linking national data on savings to the NHS from removing Category 1 hazards5 with local
data on the costs of removing the hazards provides an estimate of the annual NHS savings
through one-off intervention to address Category 1 hazards of £0.458M.
5.10 While housing conditions are significantly worse for households living in the private-rented
sector owner-occupiers are not unaffected. 8,121 owner-occupied households (21.9%) live
in homes which are non-Decent with total outstanding improvements of £59.145M. 2,297
households within this sector are economically vulnerable, 3,082 households while not
economically vulnerable are elderly.
5.11 Economic factors will influence the ability of owner-occupiers to improve their homes but
other factors will also impact. 98% of owner-occupiers in non-Decent housing are satisfied
with their current home; only 2% expressed direct dissatisfaction. Against this background,
5,802 owner occupiers in non-Decent homes (71%) have completed no major
repairs/improvements in the last 5 years; 6,174 households (76%) have no intentions to
carry out future repairs/improvements in the next 5 years.
5.12 Almost 50% of owner-occupied households have no existing mortgage/financial
commitments against their home. Taking into account existing mortgage holdings and local
property values equity potential of £6.019 billion exists within the owner-occupied sector.
The central issue locally is not the existence of owner-occupied equity but the release of this
equity for home improvement/repair. Among owner-occupiers in non-Decent housing 9.5%
of households stated that they would re-mortgage for home improvements, 17.4% are
interested in Council interest free loans.
5.13 Tenant attitudes to private-rented accommodation are on balance positive with limited
difference between the HMO and non-HMO sectors. Attitudes are however less positive
5 ‘Quantifying the economic cost of unhealthy housing – a case study from England’, 2011, S. Nichol et al. For full explanation
see section 19.11 of full report.

David Adamson & Partners Ltd. Page | 11
PRIVATE SECTOR HOUSE CONDITION SURVEY 2013
than for owner-occupiers. 1,806 private-rented tenants (8.2%) were dissatisfied with their
current accommodation compared to under 1% of owner-occupiers. 1,594 private-rented
tenants (7.2%) were dissatisfied with their local areas. This compares to 2.6% of owner-
occupiers.
6. KEY FINDINGS - STRATEGY DIRECTIONS
6.1 The 2013 survey provides a comprehensive base of housing and household information to
review the effectiveness of existing housing strategies and to determine future strategy
directions. Key directions identified include:
Continued intervention in the private-rented and HMO sector, which should
include consideration of a broader use of powers such as discretionary licensing.
Continued support for vulnerable households in non-Decent homes across all
tenure sectors.
Encouragement of owner-occupied home improvement through increased
awareness of condition issues and possible use of loan support.
Landlord encouragement for home improvement particularly energy efficiency and
exploitation of energy funding streams including Green Deal and ECO funding
within a comprehensive fuel poverty strategy.
More detailed examination of health service partnerships for housing intervention
against initial evidence of relationships between house condition, household
health and health service use.

David Adamson & Partners Ltd. Page | 12
PRIVATE SECTOR HOUSE CONDITION SURVEY 2013
ACKNOWLEDGEMENTS
David Adamson & Partners Ltd. wishes to thank the residents of Reading Borough Council Area
without whose cooperation this survey would not have been possible. We would also like to thank
Reading Borough Council staff for their support and assistance throughout the project and in
particular Mr. James Crosbie and Mr. Kevin Crocker.
David Adamson & Partners Ltd. Page | 13
SECTION 1 :
SURVEY BACKGROUND AND METHODOLOGY
Chapter 1 : Introduction and Background to the Study
Chapter 2 : Survey Method and Response
Chapter 3 : The Measurement of Housing Conditions
Chapter 4 : Survey Analysis and Reporting Framework
This section of the report reviews the background to the study together with its underlying
methodology and reporting formats.

David Adamson & Partners Ltd. Page | 14
SURVEY BACKGROUND AND METHODOLOGY
1.0 INTRODUCTION AND BACKGROUND TO THE STUDY
1.1 This report presents findings through a comprehensive survey of housing conditions across
the private housing sector in Reading Borough Council Area. The survey has been
completed by David Adamson & Partners Ltd. on behalf of Reading Borough Council.
1.2 The 2013 survey provides an update on changes in housing conditions since the last major
survey in 2006. The survey also creates an important new benchmark for the refinement
and further development of private sector housing strategies.
1.3 This report provides a detailed overview of survey findings. In seven main sections the
report examines:
Section 1 : Survey Background and Methodology;
Section 2 : A Profile of the Private Housing Sector;
Section 3 : Private Sector Housing Conditions - An Overview;
Section 4 : Private Sector Housing Conditions 2013;
Section 5 : Housing Conditions and Household Circumstances;
Section 6 : Sectoral Review; and
Section 7 : Conclusions.
Survey analyses are supported by appendices, survey questionnaires, advice on sampling
error, guidance on the interpretation of statistical data and key survey definitions/housing
standards. Data from the survey programme has also been provided electronically for
further use by the Council.
1.4 The views expressed in this report are those of the consultants and do not necessarily
reflect the official views of Reading Borough Council.

David Adamson & Partners Ltd. Page | 15
SURVEY BACKGROUND AND METHODOLOGY
2.0 SURVEY METHOD AND RESPONSE
2.1 The Government requires that private sector housing conditions are known, understood and
duly acted upon on an ongoing basis. The Housing Act 2004 states that ‘a local authority
must keep the housing conditions in their area under review with a view to identifying any
action that may need to be taken by them.’ Good practice dictates that private sector house
condition surveys are conducted every five years and no longer than every seven years.
2.2 The last survey of private sector housing was conducted by Reading Borough Council in
2006. The Council is aware that there has been substantial change in the condition and use
of the private sector housing stock since then. As a result the Council requires up-to-date
information to develop private sector housing strategies and to prioritise housing support
and investment to areas/individuals in greatest need.
2.3 The objectives for the house condition survey were clearly defined by Reading Borough
Council. Information from the survey should:
a) Improve knowledge on the general condition of the private sector housing stock
in the Borough to inform housing policy, including the Council’s Housing
Strategy and the Housing Investment Programme submission to DCLG. The
research will also play a role in providing background data to inform the Local
Development Framework.
b) Identify the number, location and distribution of non-decent homes in the
Borough, particularly providing information for assessing progress with the
Government target for the number of vulnerable households occupying decent
homes.
c) To assess the extent to which the Council may need to exercise its powers in
relation to private sector renewal to address non-decent homes, houses in
multiple occupation, area improvement and group repair in relation to both the
private rented and privately owned tenures.
d) To provide information on the energy efficiency rating of dwellings in the
Borough using the Government’s Standard Assessment Procedure (SAP). Also,
to enable the Council to develop its energy conservation strategy and to satisfy
the Council’s obligations under the Energy Act 2011, the Home Energy
Conservation Act 1995 and associated guidance.
e) To provide information to enable the Council to make more informed decisions
about the targeting of housing resources specifically to determine spending
priorities. This will include assessing the extent to which households may be

David Adamson & Partners Ltd. Page | 16
SURVEY BACKGROUND AND METHODOLOGY
able to afford to undertake the necessary renovation themselves, in line with the
test of resources measure.
f) To provide information on the type of hazards present in dwellings within HHSRS
hazard Bands A - D together with the social, economic and health characteristics
of occupants. This will enable cross-referencing with other datasets to support
strategic planning between the Council and partners on areas such as public
health and community safety.
The findings of the survey should be set in the context of national or regional data where
possible.
2.4 The 2013 study has involved a comprehensive survey programme across a sample of 1,000
dwellings representing 2% of all private dwellings in the Borough. Survey investigation has
included physical housing conditions (Decent Homes, HHSRS), energy efficiency (RdSAP)
and the circumstances and attitudes of occupying households. The sample of dwellings for
the survey was selected and provided by the Building Research Establishment (BRE) using
a stratified sample design based on anticipated distributions of poor condition and housing
tenure. To maximise the efficiency of the sample; sample sizes were increased in known
areas of poor condition and private-rented housing. In particular the electoral wards of
Abbey, Battle, Katesgrove, Park and Redlands.
FIGURE 1 : SAMPLE TARGETING -
THE DISTRIBUTION OF UNFIT DWELLINGS BY CENSUS OUTPUT AREA Source: BRE

David Adamson & Partners Ltd. Page | 17
SURVEY BACKGROUND AND METHODOLOGY
2.5 To achieve the target sample of 1,000 surveys a sample of 2,000 addresses was issued
representing an expected access rate of 50%. From the issued sample of 2,000 addresses
refusals were received from only 54 households representing a refusal rate of 2.7%. The
completed sample of 1,000 surveys permits analysis across the main private sector tenure
groups i.e. owner-occupied and private-rented. Also the sample allows an analysis of key
survey indicators at electoral ward level.
2.6 Sample data has been grossed-upwards statistically to represent total private sector
housing stock. Grossing also adjusts for the disproportionate sample sizes across the ward
framework and for differential access and response rates. Issues on the interpretation of
grossed statistical data are outlined in Appendix A (page135) while sampling errors
associated with survey data are presented in Appendix B (page 136).
2.7 The survey generates a wide range of information on the condition of housing and on the
circumstances and attitudes of its residents. Copies of the survey questionnaire are
attached at Appendix C (page 139). The physical survey inspection has included general
housing condition/repair, the Decent Homes Standard, housing health and safety rating
system and energy efficiency. Household interviews have included information on;
the socio economic circumstances of households;
housing support needs with regard to illness/disability;
household attitudes to housing and local community issues; and
owner-occupied interest in equity release and improvement loan support.
David Adamson & Partners Ltd. Page | 18
SURVEY BACKGROUND AND METHODOLOGY
3. THE MEASUREMENT OF HOUSING CONDITIONS
3.1 The measurement of housing conditions has been conducted within the decent homes
framework. The Government’s housing objective is to ensure that everyone has the
opportunity of a decent home and so promote social cohesion, wellbeing and self-
dependence. A decent home is one that satisfies all of the following four criteria:
It meets the current statutory minimum standard for housing;
It is in a reasonable state of repair;
It has reasonably modern facilities and services; and
It provides a reasonable degree of thermal comfort.
A full definition of this standard is attached in Appendix D (page 140).
3.2 MINIMUM STATUTORY STANDARDS. The Housing Act 2004 (Chapter 34) introduced a
system for assessing housing conditions and enforcing housing standards. The assessment
aids the identification to the existence of category 1 or category 2 hazards in residential
premises as assessed within the Housing Health and Safety Rating System (HHSRS –
Version 2). The system replaced the former test of fitness for human habitation (Section 604,
Housing Act 1985). For the purposes of the current survey the presence of category 1
hazards has been assumed to represent statutory failure. These are hazards falling within
HHSRS bands A, B or C and accruing hazard scores of 1,000 points or more.
3.3 DISREPAIR. Many homes while not exhibiting category 1 hazards may present evidence of
disrepair which can threaten the structural integrity of the building and weatherproofing which
results in the health and safety of occupants being affected. Identification of such homes
provides an important indicator of housing stock ‘at risk’ of future physical deterioration.
Definitions of disrepair have varied nationally over time. For the purposes of this survey,
homes in disrepair are defined as those failing to meet decent homes repair criteria. A home
is in disrepair under this definition if:
One or more key building components are old and because of their condition
need replacement or major repair.
Two or more secondary building components are old, and because of their
condition need replacement or major repair.
A full definition of building components, life expectancies and condition defects under the
decent homes standard is included in Appendix D (page 140).

David Adamson & Partners Ltd. Page | 19
SURVEY BACKGROUND AND METHODOLOGY
3.4 ENERGY EFFICIENCY. Information on home energy efficiency was collected against the
thermal comfort requirements of the decent homes standard and also subjected to an energy
efficiency audit within the RDSAP3 system. Decent homes thermal comfort requirements are
outlined fully in Appendix D (page 140). Key indicators used from the energy efficiency audit
include:
SAP rating (Standard Assessment Procedure).
Carbon dioxide emissions (CO2).
Energy costs.
Energy efficiency rating (EER).
A full definition of these indicators is included in Appendix E (page146) - glossary of terms.
3.5 REPAIR AND IMPROVEMENT COSTS. Automated schedules of rates have been applied to
condition data generated by the survey to assess potential investment needs within the
private sector. Key cost outputs include:
a) Patch Repair : Cost to address visible disrepair. Costs are based
on a patch and mend approach, using like-for-like
materials and with no guarantee of medium to long-
term building integrity.
b) Comprehensive Repair: Patch repair costs together with any additional
works required to ensure building integrity and
sound condition over a 10 year period.
c) Thirty Year Life Cycle: Patch repair costs together with full building life
cycle replacement costs over a typical 30 year
planning period.
d) Category 1 hazards: Costs to address Category 1 hazards within the
HHSRS.
e) Decent Homes: Costs to improve non-Decent homes.
Survey costs are at first quarter 2013 and are presented net of fees, preliminaries,
contingencies and VAT.
3 SAP is the acronym for Standard Assessment Procedure which is the Government approved system for assessing the energy
efficiency and environmental impact of a new-build dwelling. RdSAP is a cut-down version of the procedure specifically for the energy assessment of existing dwellings.

David Adamson & Partners Ltd. Page | 20
SURVEY BACKGROUND AND METHODOLOGY
4. SURVEY ANALYSIS AND REPORTING FRAMEWORK
4.1 The sample size of 1,000 completed surveys provides a hierarchy of reporting across the
Borough including:
a) Detailed survey reporting Borough-wide.
b) Detailed survey reporting within each of the main private sector tenure groups:
owner-occupied/private-rented.
c) Key indicator reporting at Electoral Ward level.
4.2 Private sector housing stock distributions are illustrated in Figure 2, across the electoral
ward framework.
FIGURE 2 : PRIVATE SECTOR HOUSING STOCK BY ELECTORAL WARD
Total Private Sector Housing - 52,236 dwgs

David Adamson & Partners Ltd. Page | 21
SECTION 2 :
A PROFILE OF THE PRIVATE HOUSING SECTOR
Chapter 5 : The Characteristics and Distribution of Private Sector Housing
Chapter 6 : The Characteristics and Distribution of Private Sector Households
This section of the report examines the distribution and characteristics of private sector housing in the
Borough and the characteristics and circumstances of the households who occupy it. The housing
stock forms the physical framework for strategy development and implementation; the characteristics
and circumstances of private sector households will impact on the direction and need for Council
intervention and support.

David Adamson & Partners Ltd. Page | 22
A PROFILE OF THE PRIVATE HOUSING SECTOR
5. THE CHARACTERISTICS AND DISTRIBUTION OF PRIVATE SECTOR HOUSING
HOUSING OCCUPANCY
5.1 Reading Borough Council area contains a private sector housing stock of 52,236 dwellings.
At the time of survey, 50,187 dwellings were occupied (96.1%), the remaining 2,049
dwellings (3.9%) were vacant. Within the vacant housing stock, 1,513 dwellings (2.9%)
have been vacant for under six months and are expected to return to occupancy in the
short-term. The remaining 536 vacant dwellings (1.0%) have been vacant over 6 months.
HOUSING AGE
5.2 Housing age distributions in Reading vary from the national profile for private housing,
showing higher concentrations of both older (pre-1919) and more modern (post-1980)
housing. 14,704 dwellings (28.1%) were constructed pre-1919 with a further 6,177
dwellings (11.8%) constructed 1919-1944. 31,355 dwellings (60.1%) were constructed post
Second World War. Of these dwellings, 13,969 dwellings (26.7%) were constructed post-
1980. The proportion of pre-1919 housing in Reading of 28.1% compares to 23.7% of
private housing nationally. The proportion of post-1980 housing in Reading of 26.6%
compares to 21.8% of private housing nationally.
Occupied: 50,187 dwellings,
(96.1%)
Vacant: 2,049 dwellings, (3.9%)
FIGURE 3 : HOUSING OCCUPANCY
VACANCY STATUS
Vacant-For Sale/Rent - 1,077 dwellings, 52.6%
Vacant - Modernisation - 436 dwellings, 21.3%
Vacant - Closed/Derelict - 123 dwellings, 6.0%
Vacant - Other Long Term - 413 dwellings, 20.1%

David Adamson & Partners Ltd. Page | 23
A PROFILE OF THE PRIVATE HOUSING SECTOR
HOUSING TENURE
5.3 Owner-occupation is the predominant form of private sector tenure accounting for 36,795
dwellings or 70.4%. 14,863 dwellings (28.5%) are rented privately, while tenure was
unobtainable in 578 dwellings (1.1%) due to vacancy. Rates of private-rental in Reading of
28.5% are significantly above the national average (21.4% of private dwellings nationally in
2011-12).
13,969 dwgs,
26.7%
13,086 dwgs, 25.2%
4,300 dwgs, 8.2%
6,177 dwgs, 11.8%
14,704 dwgs, 28.1%
21.8%
19.3%
17.5%
17.5%
23.7%
0 5 10 15 20 25 30
Post-1980
1965-1980
1945-1964
1919-1944
Pre-1919
FIGURE 4 : HOUSING AGE DISTRIBUTIONS
England
Reading
HOUSING TENURE
READING ENGLAND
dwgs % %
Owner-occupied 36795 70.4 78.6
Private-rented 14863 28.5 21.4
Unobtainable 577 1.1 - 70.4%
28.5%
1.1%
FIGURE 5 : HOUSING TENURE DISTRIBUTIONS
Owner-occupied
Private-rented
Unobtainable

David Adamson & Partners Ltd. Page | 24
A PROFILE OF THE PRIVATE HOUSING SECTOR
5.4 In line with the national trends, rates of private-rental in Reading have increased in recent
years with a consequent reduction in the proportion of owner-occupied homes. Rates of
private-rental have increased in Reading from 24.2% of private sector dwellings in 2006 to
28.5% in 2013. Conversely owner-occupation has fallen from 75.8% in 2006 to just over
70% in 2013.
BUILDING/DWELLING TYPE
5.5 Houses and bungalows comprise 38,143 dwellings (73.0%) with the remaining 14,093
dwellings (27.0%) in flats. Houses and bungalows offer a range of terraced, semi-detached
and detached configurations; flats are both purpose-built and located in converted buildings.
Purpose-built flats account for 10,821 dwellings (20.7%), flats in converted buildings account
for 3,065 dwellings (5.9%). The proportion of flats in Reading is significantly above the
national average- estimated at 15.0% in 2011 - 2012.
75.8
70.4
24.2
28.5
0
10
20
30
40
50
60
70
80
2006 2013
% o
f p
rivate
secto
r d
well
ing
s
FIGURE 6 : TENURE TRENDS 2006 - 2013
Owner Occupied
Private Rented

David Adamson & Partners Ltd. Page | 25
A PROFILE OF THE PRIVATE HOUSING SECTOR
MULTIPLE OCCUPATION
5.6 Using current classifications, 5,241 dwellings (10.0%) fall within the definition of a house in
multiple occupation (HMO). A HMO is a house, or a flat, that is:
Occupied by 3 or more tenants forming 2 or more households who share (or the
building lacks) a basic amenity such as cooking facilities, bathroom or toilet;
Occupied by more than 1 household and is a converted building but is not entirely
self-contained flats;
Converted into self-contained flats, but does not meet the requirements of the 1991
Building Regulations and at least 1/3 of the flats are occupied under short
tenancies.
5.7 The Housing Act 2004 introduced three different types of licensing, two of which specifically
relate to HMOs:
Mandatory HMO licensing;
Additional HMO licensing; and
Selective licensing of all privately rented housing in specific areas (further criteria
apply).
Not all of the dwellings classified as a HMO will be subject to mandatory licensing under the
Housing Act 2004. Mandatory HMO licensing applies to all privately rented HMO’s of three
or more storeys and occupied by five or more people who form more than one household.
Local councils have discretion to introduce additional licensing of other types of HMOs
which are not subject to mandatory licensing, including poorly converted self-contained flats
(also known as Section 257 HMOs after the section in the Act which defines them).
BUILDING TYPES
READING ENGLAND
2011-12
dwgs % %
Terraced House 21962 42.0 28.6
Semi-Det House 12002 23.0 27.9
Detached House 3756 7.2 20.1
Bungalow 424 0.8 8.5
Purpose Built Flat 10821 20.7 10.6
Converted Flat 3065 5.9 4.4
Mixed-use Flat 206 0.4 -
70.4%
28.5%
1.1%
0.8%
20.7%
5.9% 0.4%
FIGURE 7 : BUILDING TYPES
Terraced House Semi-Det House
Detached House Bungalow
Purpose Built Flat Converted Flat
Mixed Use Flat

David Adamson & Partners Ltd. Page | 26
A PROFILE OF THE PRIVATE HOUSING SECTOR
Whilst exact information on Section 257 could not be determined as part of the survey
programme, 3,038 dwellings were classified as flats in converted buildings, 681 dwellings
as bedsits and 1,522 dwellings as shared houses or flats.
5.8 Using Housing Act 2004 definitions a minimum of 1,001 HMO’s fall within Mandatory
Licensing requirements. This figure excludes possible S257 HMO’s where licensing
requirements are unknown.
FIGURE 8 : HOUSES IN MULTIPLE OCCUPATION
TENURE VARIATIONS
5.9 Significant differences exist in the housing characteristics of the main tenure groups
reflecting a much more varied owner-occupied sector against an older private-rented sector
concentrated in the terraced and flatted housing markets. 7,873 private-rented dwellings
(53.0%) were constructed pre-1919 compared to 17.5% of owner-occupied dwellings; 2,849
private-rented dwellings (19.2%) are in converted or mixed-use flats compared to 0.9% of
owner-occupied dwellings. A significant factor common to both sectors is more recent
development in the purpose-built flat market (post-1980). The private sector contains
10,821 purpose built flats of which 6,771 dwellings (62.6%) were constructed post-1980.
The private-rented sector contains 5,557 purpose built flats of which 3,568 dwellings
(64.2%) were constructed post-1980. This pattern is indicative of buy-to-let activity in
Reading.
HMO CLASSIFICATION dwgs
%
Not HMO 46994 90.0
Flat in Converted Building 3+ storeys 1234 2.4
Flat in Converted Building 2 storey 1804 3.5
Bedsit 681 1.3
Shared House/Flat 1522 2.9
19.1%
6.4%
74.5%
LICENSABLE
Yes - 1001 dwgs No - 338 dwgs
Don't Know - 3902 dwgs

David Adamson & Partners Ltd. Page | 27
A PROFILE OF THE PRIVATE HOUSING SECTOR
TABLE 1: HOUSING CHARACTERISTICS BY TENURE
TENURE1
Owner Occupied Private Rented All Dwellings
dwgs % dwgs % dwgs %
DATE OF CONSTRUCTION
Pre-1919 6441 17.5 7873 53.0 14704 28.1
1919-1944 5632 15.3 499 3.4 6177 11.8
1945-1964 3638 9.9 662 4.5 4300 8.2
1965-1974 8373 22.8 1115 7.5 9503 18.2
1975-1980 2665 7.2 903 6.1 3583 6.9
Post-1980 10047 27.3 3812 25.6 13969 26.7
MAIN HOUSE TYPE
Terraced House/Bungalow 16428 44.6 5663 38.1 22386 42.9
Semi-Detached House/Bungalow 11342 30.8 625 4.2 12002 23.0
Detached House/Bungalow 3587 9.7 168 1.1 3755 .2
Purpose Built Flat 5118 13.9 5558 37.4 10820 20.7
Converted/Mixed Use Flat 320 0.9 2849 19.2 3271 6.3
HMO CLASSIFICATION
Not HMO 36173 98.3 10347 69.6 46994 90.0
Flat in Converted Building 3+ Storeys 199 0.5 1023 6.9 1234 2.4
Flat in Converted Building 2 Storeys 120 0.3 1593 10.7 1803 3.5
Bedsit 21 0.1 660 4.4 681 1.3
Shared House/Flat 282 0.8 1240 8.3 1522 2.9
ALL DWELLINGS 36795 100.0 14863 100.0 52236 100.0
1Excluding 576 dwellings where tenure unknown.
DISTRIBUTION OF PRIVATE-RENTED DWELLINGS AND HMO’S
5.10 The private-rented sector and HMO housing stock show a marked concentration within the
Borough. Highest rates of private-rental are associated with Katesgrove, Abbey, Redlands
and Park Wards (in excess of 50% of ward housing stock). HMO housing stock again
exhibits its highest concentration in Redlands and Park wards but also in the electoral wards
of Church and Battle (in excess of 15% of ward housing stock). Ward distributions are
mapped in Figures 8 and 9 using quartile distributions2. Four categories are mapped
comprising:
1. Low
2. Below Average
3. Above Average
4. High
2 Individual Ward estimates for Church, Kentwood, Mapledurham, Peppard, Southcote, Thames, Tilehurst and Whitely should
be treated as indicative as they are based on small sample sizes as a result of the sampling stratification process.

David Adamson & Partners Ltd. Page | 28
A PROFILE OF THE PRIVATE HOUSING SECTOR
FIGURE 9 : THE DISTRIBUTION OF PRIVATE-RENTED HOUSING
FIGURE 10 : HMO DISTRIBUTION
Low : 0 - 4.1%
Below Average : 4.2% - 28.4%
Above Average : 28.5% - 54.9%
High : 55.0+
Borough Average: 28.5%
Low : 0%
Below Average : 0.1% - 9.9%
Above Average : 10.0% - 15.3%
High : 15.4+
Borough Average: 10.0%

David Adamson & Partners Ltd. Page | 29
A PROFILE OF THE PRIVATE HOUSING SECTOR
6. THE CHARACTERISTICS AND DISTRIBUTION OF PRIVATE SECTOR HOUSEHOLDS
HOUSEHOLDS AND POPULATION
6.1 The occupied housing stock contains 59,121 households and a household population of
143,462 persons. 51,368 households (86.9%) are comprised of a single household; the
remaining 7,752 households (13.1%) live in multiple occupation. Private sector households
are predominantly small in size. 16,264 households (27.5%) are single person in size; an
additional 20,170 households (34.1%) contain two persons. Average household size is
estimated at 2.43 persons.
HOUSEHOLD DEMOGRAPHICS
6.2 Private sector households exhibit a broad demographic profile. 12,289 households (20.8%)
are headed by a person aged 65 years and over; 19,930 households (34.7%) are headed by
a person aged under 35 years. Household type distributions are also mixed - 12,239
households (20.7%) are elderly in type; 10,347 households (17.5%) comprise a single
person aged under 60 years. Married or cohabiting couples with or without children
comprise 25,047 households (42.3%).
1.5
6.4
14.6
15.9
34.1
27.5
0 10 20 30 40
Six+ Persons - 880 households
Five Persons - 3,771 households
Four Persons - 8,615 households
Three Persons - 9,422 households
Two Persons - 20,170 households
One Person - 16,264 households
%
FIGURE 11 : HOUSEHOLD SIZE

David Adamson & Partners Ltd. Page | 30
A PROFILE OF THE PRIVATE HOUSING SECTOR
TABLE 2 : PRIVATE SECTOR HOUSEHOLDS BY AGE OF HEAD OF HOUSEHOLD AND HOUSEHOLD TYPE
AGE OF HEAD OF HOUSEHOLD
HHOLDS % HOUSEHOLD TYPE HHOLDS %
Under 25 years 5203 8.85 Couple no Children 11666 19.7
25-34 years 14727 24.9 Couple with Children 13381 22.6
35-44 years 11902 20.1 Lone Parent Family 1908 3.2
45-54 years 7334 12.4 Other Multi-Person 9580 16.2
55-64 years 7666 13.0 Single Person Under 60 years 10347 17.5
65 years and over 12289 20.8 Single Person 60+ years 5876 9.9
Two+ Persons 60+ years 6363 10.8
ETHNICITY
6.3 42,889 households (72.5%) are of White British or Irish origin with a further 4,842
households (8.2%) of other White origin. The Borough contains a large Black and Minority
Ethnic population estimated at 10,300 households (17.4%). The largest groupings are of
Asian origin - 7,332 households (12.4%). Differences in demographic characteristics are
apparent by ethnic origin typified by larger household sizes within the BME population.
Average household size for households of Asian origin is 3.26 persons compared to 2.28
persons for households of White British/Irish origin. Households of Asian origin comprise
12.4% of all private sector households yet account for 16.7% of private sector population.
1.7
3.3
12.4
1.8
8.2
72.5
0 20 40 60 80
Other - 989 households
Black - 1,978 households
Asian - 7,332 households
Mixed-Race - 1,091 households
White Other - 4,842 households
White British/Irish - 42,889 households
%
FIGURE 12 : ETHNIC ORIGIN

David Adamson & Partners Ltd. Page | 31
A PROFILE OF THE PRIVATE HOUSING SECTOR
TABLE 3 : ETHNIC ORIGIN
ETHNICITY HOUSEHOLDS
AVERAGE HOUSEHOLD
SIZE PERSONS
Hholds % Persons Persons %
White British/Irish 42889 72.5 2.28 97670 68.1
White Other 4842 8.2 2.39 11577 8.1
Mixed Race 1091 1.8 2.13 2323 1.6
Asian 7332 12.4 3.26 23926 16.7
Black 1978 3.3 2.94 5820 4.0
Other 989 1.7 2.17 2145 1.5
ALL HOUSEHOLDS 59121 100.0 2.43 143462 100.0
HOUSEHOLD OCCUPANCY
6.4 There are two standards in Part X of the 1985 Housing Act (which have remained
unchanged since 1935) that are used to assess whether a home is ‘statutorily overcrowded’,
namely the room standard and the space standard. However, the statutory overcrowding
standard is not generous, thus relatively few households ‘pass the test’ – a point which was
recognised in research published by the Office of the Deputy Prime Minister (ODPM) in May
2004:
“Households that are statutorily overcrowded are so rare that a reliable estimate of
numbers cannot be produced at a national (England) level even using data from the Survey
of English Housing and the 2001 English House Condition Survey, which are relatively large
surveys”.3
The English Housing Survey now estimates levels of overcrowding based on the number of
households living in properties that are one or more bedrooms below the ‘bedroom
standard.’ This standard, which differs considerably from the statutory room/space
standards, has been used to measure overcrowding nationally since the 1960s.
6.5 Linking dwelling size (number of bedrooms) to household demographics through the
bedroom standard provides indicators of household occupancy. 4,370 private sector
households (7.4%) in Reading have insufficient bedrooms to meet family needs and are
overcrowded; 14,664 households (24.8%) have bedrooms equal to their needs; 40,087
households (67.8%) have bedrooms available above their family needs and are in under-
occupation. The three year national average (2009-10 to 2011-12) rate of crowding is
estimated to be 2.2% of private sector households4. Locally, levels of over-crowding show
limited variation by tenure. They are above average, however, within the single occupied
3 ODPM, Overcrowding in England – The national and regional picture, May 2004, para 7.
4 English Housing Survey, Headline Report 2011-2012.

David Adamson & Partners Ltd. Page | 32
A PROFILE OF THE PRIVATE HOUSING SECTOR
housing stock, for couples with children and other multi-person households, and for
households of Asian or Black origin.
RESIDENTIAL MOBILITY
6.6 Patterns of residential mobility within the Borough reflect a distinction between a volatile and
highly mobile private-rented sector and a stable and established owner-occupied sector.
22,336 owner-occupied households (60.3%) have been resident in their current dwelling
over 10 years compared to 936 private-rented households (4.2%). In contrast, 15,137
private-rented households (68.6%) have been resident in their current dwelling under 2
years. Only 1,235 owner-occupied households (3.3%) intend to move within the next 12
months compared to 3,369 private rented households (15.3%).
TABLE 4 : RESIDENTIAL MOBILITY
LENGTH OF RESIDENCE Hholds % INTENTION TO MOVE Hholds %
Under 1 year 10941 18.5 No 43663 73.9
1 - 2 years 8365 14.1 Don’t Know 7637 12.9
3 - 5 years 8514 14.4 Yes - Possibly 3217 5.4
6 - 10 years 8029 13.6 Yes - Definitely 4604 7.8
11 - 20 years 9765 16.5
Over 20 years 13507 22.8
7.4%
24.8%
37.4%
30.4%
FIGURE 13 : HOUSEHOLD OCCUPANCY
Overcrowded - 4,370 households
Bedrooms Equal Needs - 14,664 households
Under-occupied 1 bedroom - 22,139 households
Under-occupied 2+ bedrooms - 17,948 households

David Adamson & Partners Ltd. Page | 33
A PROFILE OF THE PRIVATE HOUSING SECTOR
Relationships between residential mobility and tenure give rise to a concentrated pattern of
recent movement within the Borough focussed primarily on areas of high private-rental. The
distribution of households resident under 2 years by electoral ward is illustrated in Figure 14.
FIGURE 14 : HOUSEHOLDS RESIDENT UNDER 2 YEARS
SOCIO-DEMOGRAPHIC VARIATIONS BY TENURE AND OCCUPANCY
6.7 Demographic and social characteristics vary by tenure reflecting a younger, more mobile
private-rented sector against an older owner-occupied sector. In 51% of private-rented
households the head of household is aged under 25 years; 32% of owner occupied
households have a head of household aged 65 years and over. Household type
distributions reflect the demographic differences between tenures. 76% of private rented
households are single person households aged under 60 years; 31% of owner-occupied
households are elderly in composition. The private-rented sector exhibits a higher
concentration of BME households - 45% compared to 17% in the owner-occupied sector.
The private-rented sector is also highly mobile - 42% of private rented households have
Low : Up to 13%
Below Average : 13.1% - 32.5%
Above Average : 32.6% - 56%
High : 56.1%+
Borough Average: 32.6%

David Adamson & Partners Ltd. Page | 34
A PROFILE OF THE PRIVATE HOUSING SECTOR
been resident in their current dwelling under 1 year; 15.3% definitely intend to move within
the next year. In contrast, 60.3% of owner-occupiers have been resident in their current
dwelling over 10 years; only 3.3% intend to move within the next year.
6.8 The characteristics of private-rented sector households are mirrored and exacerbated within
the HMO housing stock.
HOUSEHOLD ECONOMIC CHARACTERISTICS
6.9 38,801 heads of household (65.6%) are in full or part-time employment, 1,459 heads of
household (2.5%) are unemployed and 11,392 heads of household (19.3%) are
economically retired. The Borough also houses a large student population estimated at
4,576 households (7.7%).
17.8
1.6
65.9
35
7.9
1.6
3
76.3
1.6
51.1
15.3
4.2
42.1
44.8
23.1
6.1
2.8
35.6
2.3
22.3
3.3
60.3
4.4
17.1
22.4
1.5
31.3
6.7
31.8
0.7
0 20 40 60 80
Intend to Move in Next Year
Resident Over 10 years
Resident Under 1 year
BME Households
Family Household with Children
Lone Parent Household
Elderly Household
Single Person Household agedunder 60 years
Head of Household Aged 65 yearsand over
Head of Household Aged under 25years
%
FIGURE 15 : SOCIO-DEMOGRAPHIC VARIATIONS BY TENURE AND OCCUPANCY
Owner-Occupied
Private-Rented
HMO

David Adamson & Partners Ltd. Page | 35
A PROFILE OF THE PRIVATE HOUSING SECTOR
6.10 14,184 households (24.0%) are in receipt of means-tested or disability related benefits and
are economically vulnerable; 4,782 households (8.1%) are on low incomes according to
national definitions. Average household income in the private sector is estimated at £31,675
compared to a current UK average of £33,000. Economic circumstances vary significantly
between the owner-occupied and private-rented sectors. Although rates of head of
household employment are similar, private-rented sector households exhibit higher levels of
economic disadvantage:
Average household income within the private-rented sector is estimated at £28,563
compared to £33,526 in the owner-occupied sector. Economic conditions within the HMO
0.4
7.7
19.3
3.1
1.4
2.5
65.6
0 20 40 60 80
Unobtainable: 243 households
Student: 4,576 households
Wholly Retired: 11,392 households
Looking After Home: 1,827 households
Permanently Sick/Disabled: 822 households
Registered Unemployed: 1,459 households
Full or Part-time Work: 38,801 households
%
FIGURE 16 : ECONOMIC STATUS OF HEAD OF HOUSEHOLD
KEY FACTS: 4.6% of heads of household in the private-rented sector are unemployed
compared to 1.2% of owner-occupied households;
20.4% of heads of household in the private-rented sector are students compared
to 0.2% of owner-occupied households;
26.4% of private-rented households are economically vulnerable compared to
22.5% of owner-occupied households;
17.1% of private-rented households are on low incomes compared to 2.7% of
owner-occupied households.

David Adamson & Partners Ltd. Page | 36
A PROFILE OF THE PRIVATE HOUSING SECTOR
sector are strongly influenced by a large student population resulting in low incomes but also
low levels of economic vulnerability due to low benefit accessibility.
6.11 The distribution of economically vulnerable and low income households across the Borough,
while in part influenced by the distribution of private-rented and HMO housing, is impacted
on by household type where the elderly, families with children, lone parent families and
single person households are particularly affected.
25.9
7.6
51.2
2.5
2.5
42.6
17.1
26.4
20.4
2.7
4.6
65
2.7
22.5
0.2
29.2
1.2
66
0 10 20 30 40 50 60 70
Low Income
Economically Vulnerable
Student Head of Household
Retired Head of Household
Unemployed Head ofHousehold
Employed Head ofHousehold
%
FIGURE 17 : ECONOMIC VARIATIONS BY TENURE AND OCCUPANCY
Owner-Occupied
Private-Rented
HMO

David Adamson & Partners Ltd. Page | 37
A PROFILE OF THE PRIVATE HOUSING SECTOR
6.12 The highest concentrations of economically vulnerable households are found in Thames,
Kentwood, Battle and Southcote Wards. Low income households are over represented in
Abbey, Redlands and Katesgrove Wards.
12.1
5.4
22.2
88.1
56.5
6.6
2
19.7
5.8
20.5
7.9
4.2
0 20 40 60 80 100
Elderly
Single Person Aged Under 60 years
Other Multi-Person Household
Lone Parent Family
Married/Co-habiting Couple with Children
Married/Co-habiting Couple with NoChildren
%
FIGURE 18 : ECONOMICALLY VULNERABLE AND LOW INCOME HOUSEHOLDS BY HOUSEHOLD TYPE
Low Income
Vulnerable

David Adamson & Partners Ltd. Page | 38
A PROFILE OF THE PRIVATE HOUSING SECTOR
FIGURE 19 : THE DISTRIBUTION OF ECONOMICALLY VULNERABLE HOUSEHOLDS
FIGURE 20 : THE DISTRIBUTION OF LOW INCOME HOUSEHOLDS
Low : 0 -15%
Below Average : 15.1% - 23.9%
Above Average : 24.0% - 34.0%
High : 34.1%+
Borough Average: 24.0%
Low : 0%
Below Average : 0.1% - 8.0%
Above Average : 8.1% - 11.5%
High : 11.6%+
Borough Average: 8.1%

David Adamson & Partners Ltd. Page | 39
SECTION 3 :
PRIVATE SECTOR HOUSING CONDITIONS -
AN OVERVIEW AND NATIONAL PERSPECTIVE
Chapter 7 : Housing Conditions 2013 - An Overview
Chapter 8 : Housing Conditions 2013 - National Context
Chapter 9 : Changes in Housing Conditions 2006 - 2013
This section of the report provides an overview of the current housing conditions across Reading
within the private housing sector. These current estimates are subsequently set within a national
context and measured against previous estimates from 2006.

David Adamson & Partners Ltd. Page | 40
PRIVATE SECTOR HOUSING CONDITIONS - AN OVERVIEW AND NATIONAL PERSPECTIVE
7. HOUSING CONDITIONS 2013 - AN OVERVIEW
7.1 Housing conditions within the private housing sector have been measured against the
Decent Homes Standard. A Decent Home is defined as one that satisfies all of the following
four criteria:
It meets the current minimum standard for housing in England (HHSRS);
It is in a reasonable state of repair;
It has reasonably modern facilities and services; and
It provides a reasonable degree of thermal comfort.
7.2 40,035 dwellings (76.6%) meet the requirements of the Decent Homes Standard and can be
regarded as satisfactory. The remaining 12,200 dwellings (23.4%) fail the requirements of
the Decent Homes Standard and are non-Decent. Within the Decent Homes Standard itself
the following pattern of failure emerges:
The majority of non-Decent homes fail on one item of the standard (9,223 dwellings -
75.6%); the remaining 2,977 non-Decent Homes exhibit multiple failures (24.4%).
7.3 Costs to achieve Decent Homes within the private-housing sector are estimated at
£85.599M averaging £7,016 per non-Decent home.
KEY FACTS: 5,265 dwellings (10.1%) exhibit Category 1 hazards within the Housing Health and
Safety Rating System (HHSRS);
6,164 dwellings (11.8%) are in disrepair;
596 dwellings (1.1%) lack modern facilities and services;
4,531 dwellings (8.7%) fail to provide a reasonable degree of thermal comfort.

David Adamson & Partners Ltd. Page | 41
PRIVATE SECTOR HOUSING CONDITIONS - AN OVERVIEW AND NATIONAL PERSPECTIVE
FIGURE 21 : DWELLING PERFORMANCE
AGAINST THE DECENT HOMES STANDARD
70.4%
28.5%
OVERALL PERFORMANCE
Compliant
Non-Compliant
23.4
8.7
1.1
11.8
10.1
0 10 20 30
OVERALL NON-DECENT: 12,200dwellings
Thermal Comfort: 4,531 dwellings
Modern Facilities: 596 dwellings
Disrepair: 6,164 dwellings
Category 1 Hazard: 5,265 dwellings
%
CATEGORY PERFORMANCE

David Adamson & Partners Ltd. Page | 42
PRIVATE SECTOR HOUSING CONDITIONS - AN OVERVIEW AND NATIONAL PERSPECTIVE
8. HOUSING CONDITIONS 2013 - NATIONAL CONTEXT
8.1 Information available from the English Housing Survey 2011/12 enables housing conditions
in Reading to be placed in a national context. Housing conditions locally with regard to the
Decent Homes Standard are slightly better than the national average. Locally, 23.4% of
private sector housing fails the Decent Homes Standard compared to 25.0% of private
sector housing nationally (2011/12). Conditions locally with regard to modern facilities and
thermal comfort mirror the national average. Local performance with regard to category 1
hazards is better than the national average while failures on disrepair are above the national
average.
FIGURE 22 : LOCAL CONDITIONS IN A NATIONAL CONTEXT
23.4 25
0
5
10
15
20
25
30
READING ENGLAND
% N
on
-Decen
t
NON DECENT HOMES : READING 2013, ENGLAND 2011/12
23.4
8.7
1.1
11.8
10.1
25
9.3
1.5
5.5
16.4
0 10 20 30
OVERALL
Thermal Comfort
Modern Facilities
Disrepair
Category 1 Hazard
% Non-Compliant
DECENT HOMES CRITERIA
England
Reading

David Adamson & Partners Ltd. Page | 43
PRIVATE SECTOR HOUSING CONDITIONS - AN OVERVIEW AND NATIONAL PERSPECTIVE
9. CHANGES IN HOUSING CONDITIONS 2006-2013
9.1 A previous house condition survey programme was completed in Reading in 2006.
Information from this study permits an analysis of changes in housing conditions in Reading
between 2006 and 2013. The extent of analysis is however restricted by the availability of
information from the 2006 study which is largely presented at a Borough-wide scale.
9.2 Changes in private sector housing conditions are summarised in Table 5 and Figure 23.
TABLE 5 : CHANGES IN PRIVATE SECTOR HOUSING CONDITIONS 2006 - 2013
CONDITION INDICATOR 2006 2013
CHANGES 2006 - 2013
DWGS % DWGS % DWGS %
Category 1 Hazards 5300 10.4 5265 10.1 -35 -0.7
Disrepair 7300 14.3 6164 11.8 -1136 -15.6
Modern Facilities 1700 3.3 596 1.1 -1104 -64.9
Thermal Comfort 11500 22.5 4531 8.7 -6969 -60.6
NON-DECENT 20500 40.2 122200 23.4 -8300 -40.5
Vulnerable Households5 in non-Decent
Homes 3460 44.4 4472 31.5 +1012 +29.2
Average SAP Rating 51 66 +29.4%
Private sector housing conditions in Reading have improved substantially over the seven
year period 2006 – 2013, as evidenced by a reduction in the number of non-Decent homes
from 20,500 dwellings in 2006 to 12,200 dwellings in 2013: a reduction of 8,300 non-Decent
homes or 40.5%. Over the same period rates of non-Decency in the private housing sector
have declined from 40.2% to 23.4%. Levels of Category 1 Hazard failure have remained
static at round 10% but all other areas of the Decent Homes Standard register improvement.
The areas of greatest improvement are modern facilities and thermal comfort. While
modern facilities failures represent a small proportion of overall housing stock improvements
since 2006, they may well reflect the positive impact of mandatory licensing within the HMO
sector. Improvements in thermal comfort are substantiated by an increase in the average
SAP rating of private dwellings from 51 in 2006 to 66 in 2013 - an increase of just under
30%. Although the proportion of vulnerable households living in non-Decent homes has
decreased since 2006, the absolute number of vulnerable households living in non-Decent
housing has actually increased.
5 Vulnerable households are those in receipt of at least one of the means tested or disability related benefits.

David Adamson & Partners Ltd. Page | 44
PRIVATE SECTOR HOUSING CONDITIONS - AN OVERVIEW AND NATIONAL PERSPECTIVE
9.3 Tenure differentiated data on housing conditions is limited within the 2006 Survey. Overall
performance on the Decent Homes Standard by tenure is however available. Decent
Homes compliance within both main private sector tenure groups has improved since 2006
with the strongest improvements recorded for the owner-occupied sector. The number of
owner-occupied non-Decent homes has declined by approximately 50% from 13,429 non-
Decent homes in 2006 to 6593 non-Decent Homes in 2013. Rates of non-Decency within
the owner-occupied sector have reduced from 34.7% in 2006 to 17.9% in 2013. Positive
improvements have also been recorded in the private-rented sector where the number of
non-Decent homes has declined by 27% from 7,105 non-Decent homes in 2006 to 5,179
non-Decent homes in 2013. Rates of non-Decency in the private-rented sector have also
reduced from 57.3% in 2006 to 34.8% in 2013.
22.5
8.7
10.4 10.1
14.3 11.8
40.2
23.4
44.4
31.5
0
10
20
30
40
50
2006 2013
%
FIGURE 23 : TRENDS IN PRIVATE SECTOR HOUSING CONDITIONS 2006 - 2013
Thermal Comfort Category 1 Hazards
Disrepair Non-Decent Homes
Vulnerable in Non-Decent Homes

David Adamson & Partners Ltd. Page | 45
PRIVATE SECTOR HOUSING CONDITIONS - AN OVERVIEW AND NATIONAL PERSPECTIVE
34.7
17.9
40.2
23.4
57.3
34.8
0
10
20
30
40
50
60
70
2006 2013
%
FIGURE 24 : TRENDS IN DECENT HOMES NON-COMPLIANCE 2006 - 2013 BY TENURE
Owner-Occupied Sector All Tenures Private-Rented Sector

David Adamson & Partners Ltd. Page | 46
SECTION 4 :
PRIVATE SECTOR HOUSING CONDITIONS 2013
Chapter 10 : HHSRS Category 1 Hazards
Chapter 11 : Housing Disrepair
Chapter 12 : Housing Amenities and Facilities
Chapter 13 : Home Energy Efficiency
Chapter 14 : Decent Homes Overall Performance
Chapter 15 : Non-Decent Homes - Investment Needs
Chapter 16 : Decent Places - Environmental Conditions
This section of the report examines in detail the individual attributes of the Decent Homes Standard.
Based upon this examination an overall performance profile is established along with the required
level of investment to rectify non-decency. This section concludes with the surveyors’ assessment of
the local environment.

David Adamson & Partners Ltd. Page | 47
PRIVATE SECTOR HOUSING CONDITIONS 2013
10. HHSRS - CATEGORY 1 HAZARDS
HOUSING HEALTH AND SAFETY RATING SYSTEM
10.1 The Housing Health and Safety Rating System (HHSRS) is the current approach to the
evaluation of the potential risks to health and safety from any deficiencies identified in
homes. The HHSRS, although not in itself a statutory standard, was introduced as a
replacement for the Housing Fitness Standard (Housing Act 1985, Section 604 as
amended).
10.2 Assessment of hazards is a two-stage process, addressing first the likelihood of an
occurrence and secondly the range of probable harm outcomes. These two factors are
combined using a standard prescribed method to give a score in respect of each hazard.
There are 29 hazards, arranged in four main groups reflecting the basic health
requirements. These are illustrated in Table 6 and include:
Physiological requirements including hygro-thermal conditions and pollutants;
Psychological requirements including space, security, light and noise;
Protection against infection including hygiene, sanitation and water supply; and
Protection against accidents including falls, electric shocks, burns/scalds and
collision.
TABLE 6 : HHSRS - HAZARD GROUPINGS
HAZARD CATEGORY SUB-GROUPING NATURE OF HAZARD
PHYSIOLOGICAL REQUIREMENTS
HYGROTHERMAL
CONDITIONS
1. Dampness and Mould
2. Excess Cold
3. Excess Heat
POLLUTANTS
4. Asbestos
5. Biocides
6. CO2/Fuel Consumption
7. Lead
8. Radiation
9. Un-combusted Fuel Gas
10. Volatile Organic Compounds
PSYCHOLOGICAL
REQUIREMENTS
SPACE, SECURITY, LIGHT
AND NOISE
11. Crowding and Space
12. Entry by Intruders
13. Lighting
14. Noise
PROTECTION AGAINST
INFECTION
HYGIENE, SANITATION AND
WATER SUPPLY
15. Hygiene, pests, refuse
16. Food Safety
17. Personal Hygiene, Sanitation, Drainage
18. Water Supply
PROTECTION AGAINST ACCIDENTS
FALLS
19. Baths
20. Level Surfaces
21. Stairs
22. Between Levels

David Adamson & Partners Ltd. Page | 48
PRIVATE SECTOR HOUSING CONDITIONS 2013
TABLE 6 : HHSRS - HAZARD GROUPINGS
HAZARD CATEGORY SUB-GROUPING NATURE OF HAZARD
SHOCKS, FIRES, BURNS,
SCALDS
23. Electrical Hazards
24. Fire
25. Flames, Hot Surfaces
COLLISIONS, CUTS AND STRAINS
26. Collision, Entrapment
27. Explosions
28. Position of Amenities
29. Structural Collapse
10.3 Hazard scores are banded to reflect the relative severity of hazards and their potential
outcomes. There are ten hazard bands ranging from Band ‘J’ (9 points or less) the safest,
to Band ‘A’ (5,000 points or more) the most dangerous. Hazards can be grouped within
these bandings as Category 1 and Category 2. A Category 1 hazard will fall within Bands
‘A’, ‘B’ or ‘C’ i.e. 1,000 points or more.
TABLE 7 : HAZARD BANDINGS AND HAZARD CATEGORISATION
HAZARD SCORE RANGE
Points…. HAZARD BAND HAZARD CATEGORY
5000 or more A
CATEGORY 1 2000 - 4999 B
1000 - 1999 C
500 - 999 D
CATEGORY 2
200 - 499 E
100 - 199 F
50 - 99 G
20 - 49 H
10 - 19 I
9 or less J
10.4 The Housing Act 2004 puts local authorities under a general duty to take appropriate action
in relation to a Category 1 hazard. Such action can include:
Improvement Notice (Section 11, Housing Act 2004);
Prohibition Order (Section 20, Housing Act 2004);
Hazard Awareness Notice (Section 28, Housing Act 2004);
Emergency Remedial Action (Section 40, Housing Act 2004);
Emergency Prohibition Order (Section 43, Housing Act 2004);
Demolition Order (Section 265, Housing Act 1985); and
Clearance Area Declaration (Section 289, Housing Act 1985).
Similar powers exist to deal with category 2 hazards but at the discretion of the local
authority. Emergency measures cannot however be used, nor can clearance area or

David Adamson & Partners Ltd. Page | 49
PRIVATE SECTOR HOUSING CONDITIONS 2013
demolition powers. The presence of category 1 hazards is integrated within the decent
homes standard and forms the main focus for our analyses.
CATEGORY 1 HAZARDS
10.5 5,265 dwellings (10.1%) experience Category 1 hazards within the HHSRS and as a result
fail the requirements of the Decent Homes Standard. Rates of category 1 hazard failure are
below the national average (16.4%) and have remained static in the Borough since 2006.
10.6 A range of Category 1 hazards are present although the overall profile is strongly influenced
by ‘excess cold’ and the risk of ‘falls on steps/stairs’. 3,672 dwellings (69.7%) experiencing
a Category 1 hazard fail on excess cold; 1,026 dwellings (19.5%) experiencing a Category 1
hazard fail on risk of falls on steps/stairs.
89.9%
10.1%
FIGURE 25 : CATEGORY 1 HAZARD FAILURE
No Category 1 Hazards: 46,970 dwellings
Category 1 Hazards Present: 5,265 dwellings
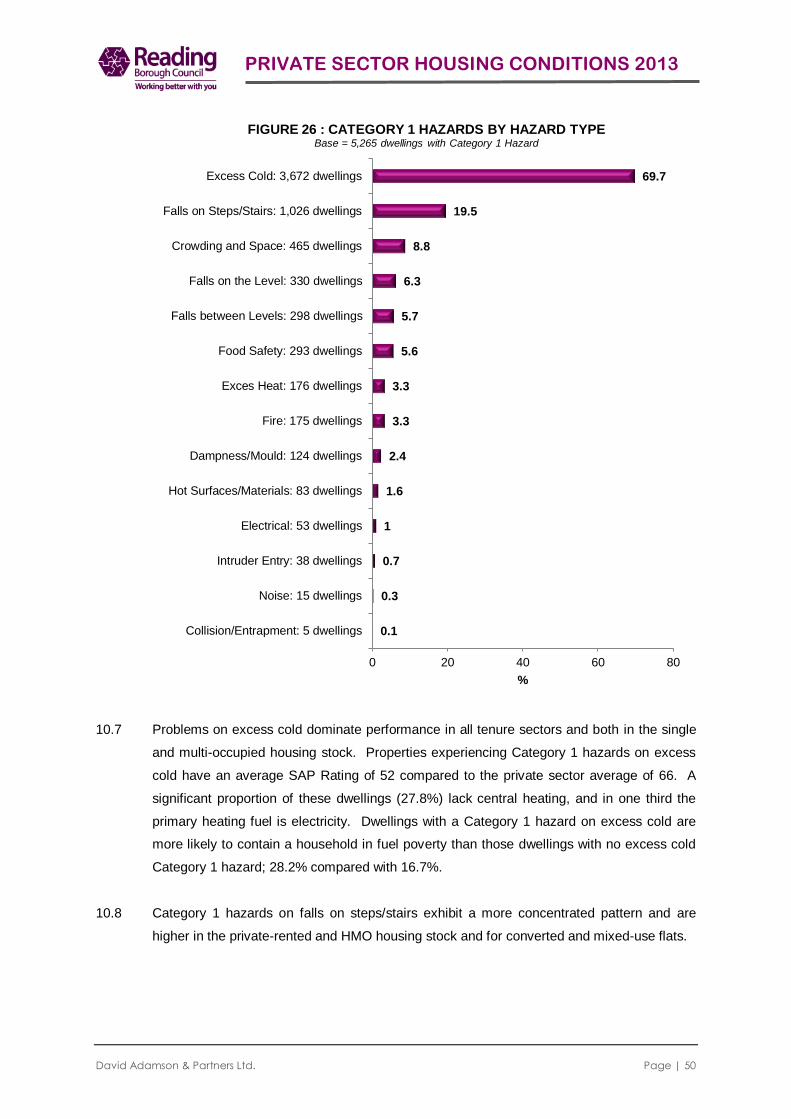
David Adamson & Partners Ltd. Page | 50
PRIVATE SECTOR HOUSING CONDITIONS 2013
10.7 Problems on excess cold dominate performance in all tenure sectors and both in the single
and multi-occupied housing stock. Properties experiencing Category 1 hazards on excess
cold have an average SAP Rating of 52 compared to the private sector average of 66. A
significant proportion of these dwellings (27.8%) lack central heating, and in one third the
primary heating fuel is electricity. Dwellings with a Category 1 hazard on excess cold are
more likely to contain a household in fuel poverty than those dwellings with no excess cold
Category 1 hazard; 28.2% compared with 16.7%.
10.8 Category 1 hazards on falls on steps/stairs exhibit a more concentrated pattern and are
higher in the private-rented and HMO housing stock and for converted and mixed-use flats.
0.1
0.3
0.7
1
1.6
2.4
3.3
3.3
5.6
5.7
6.3
8.8
19.5
69.7
0 20 40 60 80
Collision/Entrapment: 5 dwellings
Noise: 15 dwellings
Intruder Entry: 38 dwellings
Electrical: 53 dwellings
Hot Surfaces/Materials: 83 dwellings
Dampness/Mould: 124 dwellings
Fire: 175 dwellings
Exces Heat: 176 dwellings
Food Safety: 293 dwellings
Falls between Levels: 298 dwellings
Falls on the Level: 330 dwellings
Crowding and Space: 465 dwellings
Falls on Steps/Stairs: 1,026 dwellings
Excess Cold: 3,672 dwellings
%
FIGURE 26 : CATEGORY 1 HAZARDS BY HAZARD TYPE Base = 5,265 dwellings with Category 1 Hazard

David Adamson & Partners Ltd. Page | 51
PRIVATE SECTOR HOUSING CONDITIONS 2013
HAZARD DISTRIBUTIONS
10.9 Rates of Category 1 Hazard failure are significantly higher within the private-rented and
HMO housing sectors, for flats in converted and mixed-use buildings and for properties
constructed pre-1919.
10.10 Geographically across the Borough high rates of Category 1 Hazard failure are associated
with high concentrations of private-rented and HMO housing stock. The wards of Abbey,
Park, Redlands and Church are particularly affected.
34
9.5
5.7
10
5.9
8
19.9
8.2
26.6
7
18.2
0 10 20 30 40
Converted/Mixed Use Flat
Purpose Built Flat
Det/Semi House/Bungalow
Terraced House/Bungalow
Post-1944
1919-1944
Pre-1919
Non-HMO
HMO
Owner-Occupied
Private Rented
% Category 1 Hazard
FIGURE 27 : CATEGORY 1 HAZARD FAILURE BY TENURE, OCCUPANCY, BUILDING TYPE AND DATE OF CONSTRUCTION
TENURE
OCCUPATION
DATE OF CONSTRUCTION
BUILDING TYPE

David Adamson & Partners Ltd. Page | 52
PRIVATE SECTOR HOUSING CONDITIONS 2013
FIGURE 28 : THE DISTRIBUTION OF CATEGORY 1 HAZARDS
CATEGORY 1 HAZARD IMPROVEMENT COSTS
10.11 Costs to address Category 1 hazards within the defective housing stock are estimated at
£42.750m net averaging £8,120 per defective dwelling. Individual costs range from £2,500
to £27,600 per dwelling. Costs are net of VAT, fees and preliminaries but in addition to
HHSRS improvements allow for the completion of outstanding repairs to dwellings
experiencing Category 1 hazards. Of the total required expenditure of £42.750M, £22.568M
(53%) is required within the private-rented sector; £9.963M (23%) is required within the
HMO sector.
Low : Under 1%
Below Average : 1 – 10.0%
Above Average : 10.1 - 20%
High : 20.1%+
Borough Average 10.1%

David Adamson & Partners Ltd. Page | 53
PRIVATE SECTOR HOUSING CONDITIONS 2013
11. HOUSING DISREPAIR
DECENT HOMES REPAIR STANDARD
11.1 To meet the decent homes standard, dwellings are required to be in a reasonable state of
repair. Dwellings which fail to meet this criterion are those where either:
One or more of the key building components are old and because of their
condition, need replacing or major repair;
Two or more of the other building components are old and, because of their
condition need replacing or major repair.
Key building components are those which are essential to the future integrity of the home
and its continued occupancy. These include:
External walls;
Roof structure and covering;
Windows and doors;
Chimneys;
Central heating boilers;
Gas fires;
Storage heaters; and
Electrics.
Full details of the standard of repair required within the Decent Homes Standard are
attached as Appendix D (page 140).
DECENT HOMES REPAIR COMPLIANCE
11.2 Overall, 6,164 dwellings (11.8%) fail the repair requirements of the decent homes standard.
Repair failures are recorded against both primary and secondary building elements. Rates
of repair failure are above the national average, although improving since 2006.

David Adamson & Partners Ltd. Page | 54
PRIVATE SECTOR HOUSING CONDITIONS 2013
11.3 Elemental repair defects in those dwellings failing the repair requirements of the Decent
Homes Standard are illustrated in Tables 8 and 9 with regard to primary and secondary
building elements. External repairs are dominated by works to roofs and associated
elements and windows and doors. Internally repair needs are dominated by works to
kitchens and electrics.
TABLE 8 : DWELLINGS DEFECTIVE ON DECENT HOMES REPAIR - PRIMARY BUILDING ELEMENT
PERFORMANCE
PRIMARY BUILDING ELEMENT
DECENT HOMES CONDITION ALL
DWELLINGS
DEFECTIVE ON REPAIR
COMPLIANT NON-
COMPLIANT
dwgs % dwgs % dwgs
Roof Structure 5356 86.9 808 13.1 6164
Roof Cover 4480 72.7 1684 27.3 6164
Chimney Stacks 5516 89.5 648 10.5 6164
External Wall Finish 6006 97.4 158 2.6 6164
External Pointing 5812 94.3 352 5.7 6164
Lintels 6053 98.2 111 1.8 6164
External Wall Structure 6073 98.5 91 1.5 6164
Windows 5355 86.9 809 13.1 6164
Doors 5373 87.2 791 12.8 6164
Electrics 4855 78.8 1309 21.2 6164
Heating 5923 96.1 241 3.9 6164
88.2%
11.8%
FIGURE 29 : DECENT HOMES REPAIR PERFORMANCE
Compliant: 46,071 dwellings Non-Compliant: 6,164 dwellings

David Adamson & Partners Ltd. Page | 55
PRIVATE SECTOR HOUSING CONDITIONS 2013
TABLE 9 : DWELLINGS DEFECTIVE ON DECENT HOMES REPAIR - SECONDARY BUILDING ELEMENT PERFORMANCE
SECONDARY BUILDING ELEMENT
DECENT HOMES CONDITION ALL
DWELLINGS DEFECTIVE ON
REPAIR COMPLIANT
NON-COMPLIANT
dwgs % dwgs % dwgs
Flashings 5275 85.6 889 14.4 6164
Rainwear 5566 90.3 598 9.7 6164
Underground Drainage 6112 99.2 52 0.8 6164
Internal Floor Structure 6126 99.4 38 0.6 6164
Internal Floor Finishes 6078 98.6 85 1.4 6164
Internal Wall Structure 6102 99.0 62 1.0 6164
Internal Wall Finishes 6033 97.9 131 2.1 6164
Internal Ceiling Finishes 6022 97.7 142 2.3 6164
Internal Doors 6035 97.9 129 2.1 6164
Fireplaces/Flues 5576 90.5 587 9.5 6164
Internal Balustrades 5824 94.5 340 5.5 6164
Plumbing 5978 97.0 186 3.0 6164
Kitchens 5490 89.1 674 10.9 6164
Bathrooms 5983 97.1 181 2.9 6164
DISREPAIR BY SECTOR
11.4 As might be expected, disrepair is strongly related to dwelling age with rates of disrepair
significantly higher within the pre-1919 housing stock. This age bias translates across the
main house types and tenure groups resulting in higher rates of disrepair within the private-
rented and HMO sectors and for flats in converted and mixed use buildings.

David Adamson & Partners Ltd. Page | 56
PRIVATE SECTOR HOUSING CONDITIONS 2013
11.5 Patterns of Decent Homes repair failure at Ward level mirror the distribution of private-
rented and HMO housing across the Borough with the highest rates of failure recorded in
Battle, Caversham, Katesgrove and Park Wards.
26.2
5.2
12.3
1.4
17.5
16.8
27.1
21
10.8
17
8.7
0 10 20 30
Converted/Mixed Use Flat
Purpose Built Flat
Det/Semi House Bungalow
Terraced House Bungalow
Post-1944
1919-1944
Pre-1919
HMO
Single Occupancy
Private Rented
Owner Occupied
% non-compliant
FIGURE 30 : DECENT HOMES REPAIR PERFORMANCE BY TENURE, DWELLING AGE, DWELLING TYPE AND OCCUPANCY
TENURE
OCCUPATION
DATE OF CONSTRUCTION
BUILDING TYPE

David Adamson & Partners Ltd. Page | 57
PRIVATE SECTOR HOUSING CONDITIONS 2013
FIGURE 31 : DECENT HOMES REPAIR NON-COMPLIANCE BY WARD
HOUSE CONDITION FRAMEWORK
11.6 Poor physical housing conditions have been described with regard to Category 1 hazards
and disrepair. These indicators can be combined into an intervention framework as
described in Figure 32.
Low : 0 - 3.9%
Below Average : 4.0 - 11.9%
Above Average : 12.0 - 16.8%
High : 16.9%+
Borough Average: 11.8%
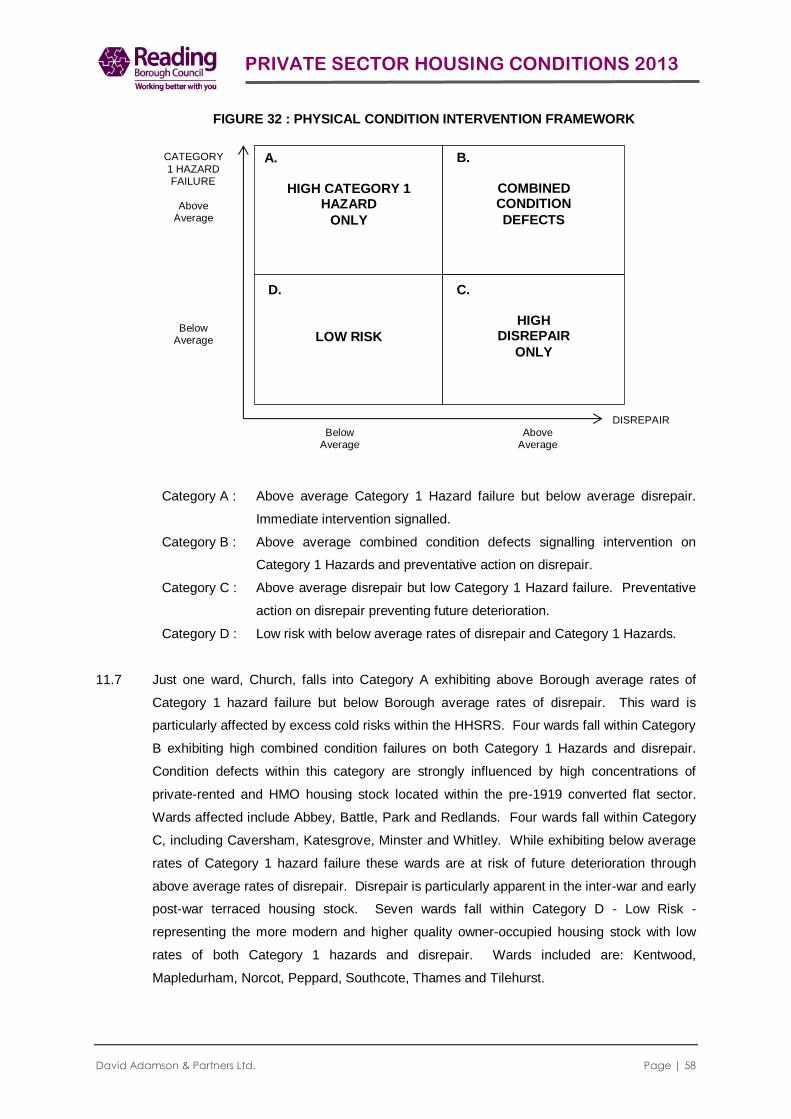
David Adamson & Partners Ltd. Page | 58
PRIVATE SECTOR HOUSING CONDITIONS 2013
FIGURE 32 : PHYSICAL CONDITION INTERVENTION FRAMEWORK
Category A : Above average Category 1 Hazard failure but below average disrepair.
Immediate intervention signalled.
Category B : Above average combined condition defects signalling intervention on
Category 1 Hazards and preventative action on disrepair.
Category C : Above average disrepair but low Category 1 Hazard failure. Preventative
action on disrepair preventing future deterioration.
Category D : Low risk with below average rates of disrepair and Category 1 Hazards.
11.7 Just one ward, Church, falls into Category A exhibiting above Borough average rates of
Category 1 hazard failure but below Borough average rates of disrepair. This ward is
particularly affected by excess cold risks within the HHSRS. Four wards fall within Category
B exhibiting high combined condition failures on both Category 1 Hazards and disrepair.
Condition defects within this category are strongly influenced by high concentrations of
private-rented and HMO housing stock located within the pre-1919 converted flat sector.
Wards affected include Abbey, Battle, Park and Redlands. Four wards fall within Category
C, including Caversham, Katesgrove, Minster and Whitley. While exhibiting below average
rates of Category 1 hazard failure these wards are at risk of future deterioration through
above average rates of disrepair. Disrepair is particularly apparent in the inter-war and early
post-war terraced housing stock. Seven wards fall within Category D - Low Risk -
representing the more modern and higher quality owner-occupied housing stock with low
rates of both Category 1 hazards and disrepair. Wards included are: Kentwood,
Mapledurham, Norcot, Peppard, Southcote, Thames and Tilehurst.
A.
HIGH CATEGORY 1 HAZARD
ONLY
B.
COMBINED CONDITION
DEFECTS
D.
LOW RISK
C.
HIGH DISREPAIR
ONLY
CATEGORY
1 HAZARD FAILURE
Above Average
Below
Average
DISREPAIR
Below Above Average Average

David Adamson & Partners Ltd. Page | 59
PRIVATE SECTOR HOUSING CONDITIONS 2013
FIGURE 33 : SECTORAL CLASSIFICATION OF INTERVENTION POTENTIAL
A.
Church
B.
Abbey Private-Rented Battle HMO
Park Converted Flats Redlands Pre-1919 Housing
D.
Kentwood Mapledurham Owner-Occupier
Norcot Single Occupation Peppard Semi-Det/Det Housing Southcote Purpose Built Flats
Thames Post-1964 Housing
Tilehurst
C.
Caversham Terraced Housing
Katesgrove Inter-War & Early Minster Post War Whitley Housing
CATEGORY 1 HAZARD
FAILURE
Above
Average
Below Average
DISREPAIR Below Above
Average Average

David Adamson & Partners Ltd. Page | 60
PRIVATE SECTOR HOUSING CONDITIONS 2013
12. HOUSING AMENITIES AND FACILITIES
AMENITIES & FACILITIES
12.1 The survey has examined the amenities and facilities offered by private sector housing in
Reading. Three areas have been examined, including:
a) The amenity/modern facilities requirements of the Decent Homes Standard;
b) Home security arrangements; and
c) Dwelling adaptation.
DECENT HOMES
12.2 For a dwelling to comply with the Decent Homes Standard it must possess reasonably
modern amenities. A dwelling is considered not to meet this criterion if it lacks three or more
of the following facilities:
A kitchen which is 20 years old or less;
A kitchen with adequate space and layout;
A bathroom which is 30 years old or less;
An appropriately located bathroom and WC;
Adequate sound insulation; and
Adequate size and layout of common entrance areas for flats.
12.3 Kitchen and bathroom amenities exhibit a modern age profile within the private housing
sector. 46,593 dwellings (89.2%) offer kitchens under 20 years old, 46,343 dwellings
(88.7%) offer bathrooms under 30 years old. Linked to this modern age profile, additional
amenity defects are recorded in under 2% of the housing stock:
In addition to amenities, no defects were recorded on noise or on the size and layout of
common access areas in flats. To fail the Decent Homes Standard a dwelling must be
deficient on three or more amenity requirements. This results in a limited pattern of failure
within the standard. Only 596 dwellings (1.1%) fail the Decent Homes amenity criteria.
KEY FACTS: 499 dwellings (1.0%) offer inadequate space and layout in the kitchen; 507 dwellings (1.0%) offer an unsatisfactory bathroom location;
471 dwellings (0.9%) offer an unsatisfactory WC location.

David Adamson & Partners Ltd. Page | 61
PRIVATE SECTOR HOUSING CONDITIONS 2013
HOME SECURITY
12.4 Rising public awareness of and exposure to crime have placed an increasing emphasis on
home security. Core security measures within the home can be assumed to include secure
access door locking and window locking to ground floor windows and to upper floor windows
where appropriate. Core security measures are present in 47,946 dwellings (91.8%) but
absent in 4,290 dwellings (8.2%).
88.2%
11.8%
FIGURE 34 : DECENT HOMES AMENITY PERFORMANCE
Compliant: 51,640 dwellings Non-Compliant: 596 dwellings
91.8%
8.2%
FIGURE 35 : CORE HOME SECURITY MEASURES
Core Measures Present: 47,946 dwellings
Core Measures Absent: 4,290 dwellings

David Adamson & Partners Ltd. Page | 62
PRIVATE SECTOR HOUSING CONDITIONS 2013
Variations in security provision exist across the Borough reflecting lower levels of adequate
security in the private-rented and HMO sectors and converted flats.
12.5 47,529 dwellings (91.0%) have internal smoke alarms fitted; 4,707 dwellings (9.0%) have no
internal smoke alarm provision. Levels of provision are again below average in the private-
rented and HMO sectors and in converted flats.
DWELLING ADAPTATION
12.6 Levels of adaptation for special needs within the housing stock are low - 833 adapted
dwellings (1.6%). Where adaptations are present the most common relate to adapted
bathroom/WC amenities, wheelchair accessibility and ground floor amenity provision.
Relationships between dwelling adaptation, household illness and special needs are
examined in Chapter 19 in this report.
91.0%
9.0%
FIGURE 36 : SMOKE ALARM PROVISION
Smoke Alarms Present: 47,529 dwellings
No Smoke Alarms: 4,707 dwellings
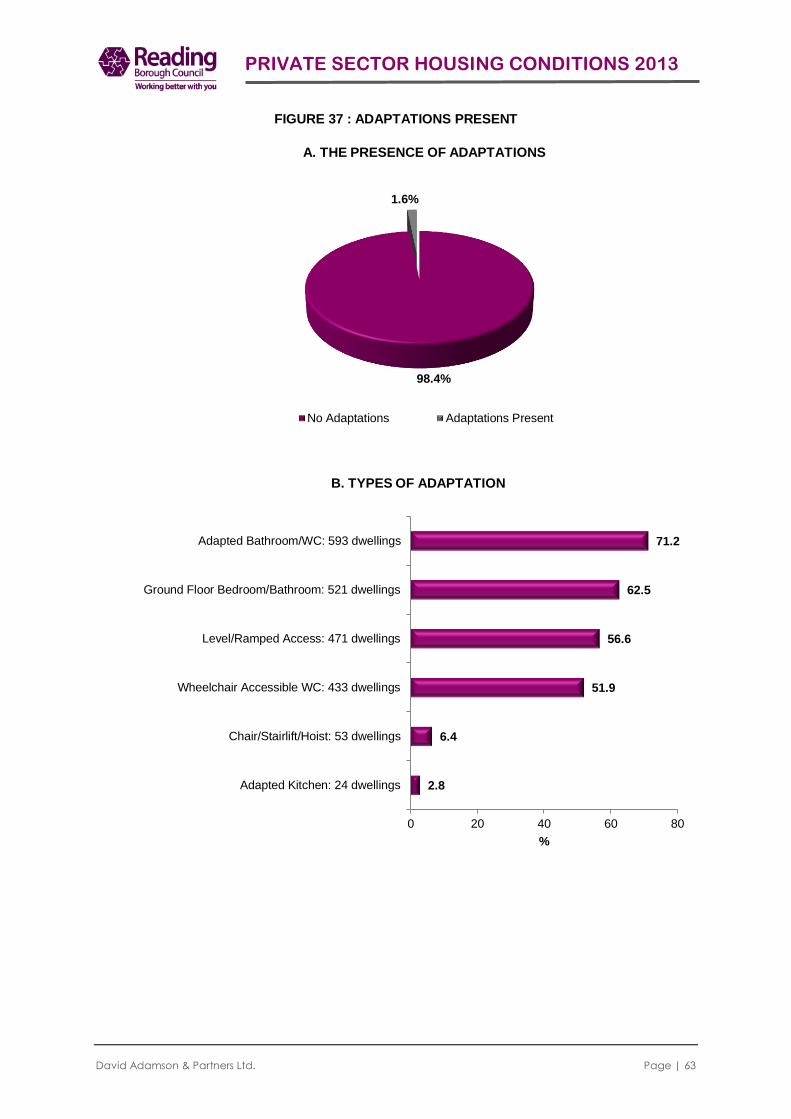
David Adamson & Partners Ltd. Page | 63
PRIVATE SECTOR HOUSING CONDITIONS 2013
FIGURE 37 : ADAPTATIONS PRESENT
98.4%
1.6%
A. THE PRESENCE OF ADAPTATIONS
No Adaptations Adaptations Present
2.8
6.4
51.9
56.6
62.5
71.2
0 20 40 60 80
Adapted Kitchen: 24 dwellings
Chair/Stairlift/Hoist: 53 dwellings
Wheelchair Accessible WC: 433 dwellings
Level/Ramped Access: 471 dwellings
Ground Floor Bedroom/Bathroom: 521 dwellings
Adapted Bathroom/WC: 593 dwellings
%
B. TYPES OF ADAPTATION

David Adamson & Partners Ltd. Page | 64
PRIVATE SECTOR HOUSING CONDITIONS 2013
13. HOME ENERGY EFFICIENCY
HOME ENERGY INFORMATION
13.1 Information on home energy efficiency was collected within the RdSAP framework in
addition to the assessment of thermal comfort performance within the Decent Homes
Standard.
13.2 Key indicators used from the energy efficiency audit include:
SAP Rating (Standard Assessment Procedure);
Carbon Dioxide Emissions (CO2);
Energy Costs; and
Energy Efficiency Rating (EER).
The SAP Rating is based on each dwelling’s energy costs per square metre and is
calculated using a simplified form of the Standard Assessment Procedure. The energy
costs take into account the costs of space and water heating, ventilation and lighting, less
any cost savings from energy generation technologies. The rating is expressed on a scale
of 1 - 100 where a dwelling with a rating of 1 has poor energy efficiency (high costs) and a
dwelling with a rating of 100 represents a completely energy efficient dwelling (zero net
energy costs per year).
Carbon Dioxide (CO2) emissions are derived from space heating, water heating, ventilation,
lighting, less any emissions saved by energy generation and are measured in tonnes per
year.
Energy costs represent the total energy cost from space heating, water heating, ventilation
and lighting, less the costs saved by energy generation as derived from SAP calculations
and assumptions. Costs are expressed in £’s per year using constant prices based on
average fuel prices. Energy costs for each dwelling are based on a standard occupancy
and a standard heating regime.
The Energy Efficiency Rating (EER) is presented in bands from A - G for an Energy
Performance Certificate, where a band A rating represents low energy costs (the most
efficient band) and a band G rating represents high energy costs (the least efficient band).
The break points in SAP used for the EER bands are:
Band A : 92-100
Band B : 81-91

David Adamson & Partners Ltd. Page | 65
PRIVATE SECTOR HOUSING CONDITIONS 2013
Band C : 69-80
Band D : 55-68
Band E : 39-54
Band F : 21-38
Band G : 1-20
ENERGY EFFICIENCY PERFORMANCE
13.3 The current SAP rating for private sector housing in Reading is measured at 66, significantly
above the national average of 55 for all private housing in England. Average CO2
emissions total 3.64 tonnes per annum again significantly better than the national average of
7.1 tonnes for all private housing in England. Average annual energy costs are estimated
at £688 per annum giving a total household energy bill for Reading of £35.926M per annum.
The lower quartile SAP rating for private housing in Reading is 60; 1,020 private dwellings
(1.9%) have a SAP Rating of under 35.
13.4 1,792 private dwellings (3.4%) in Reading fall within the highest EER bands (A and B)
compared to under 1% of private housing nationally. Conversely the proportion of private
dwellings in the lowest EER bands (E to G) is significantly below the national average. 10.7%
of private dwellings in Reading (5,569 dwellings) fall within EER bands E, F and G compared
to 40.3% of private dwellings nationally.
287 118 363 1171
2330
9800
17327
19047
1792
0 0
2000
4000
6000
8000
10000
12000
14000
16000
18000
20000
10 20 30 40 50 60 70 80 90 100
Dw
ell
ing
s
FIGURE 38 : SAP RATING DISTRIBUTION

David Adamson & Partners Ltd. Page | 66
PRIVATE SECTOR HOUSING CONDITIONS 2013
TABLE 10 : ENERGY EFFICIENCY RATINGS (EER) READING AND ENGLAND
EER BANDING READING 2013 ENGLAND 2011
dwgs % %
Band A (SAP 92 - 100) 0 0.0 0.0
Band B (SAP 81 - 91) 1792 3.4 0.0
Band C (SAP 69 - 80) 23152 44.3 11.3
Band D (SAP 55 - 68) 21722 41.6 48.3
Band E (SAP 39 - 54) 4270 8.2 31.4
Band F (SAP 21 - 38) 894 1.7 6.9
Band G (SAP 1 - 20) 405 0.8 2.0
13.5 Sectoral variations in EER’s are limited although the proportion of dwellings in the lower
bandings (E, F and G) is above average in the HMO sector and generally for pre-1919
housing. Geographically the highest concentrations of low rated dwellings are located in
Caversham, Redlands, Church and Park Wards.
FIGURE 39 : DWELLINGS IN EER BANDS ‘E’, ‘F’ and ‘G’
Low : 0%
Below Average : 0.1 – 10.6%
Above Average : 10.7% - 21.0%
High : 21.1%+
Borough Average: 10.7%

David Adamson & Partners Ltd. Page | 67
PRIVATE SECTOR HOUSING CONDITIONS 2013
ENERGY EFFICIENCY ATTRIBUTES
13.6 Underlying the energy efficiency of private sector housing the following attributes apply:
440 dwellings (0.8%) lack any form of appropriate loft insulation, an additional
3,060 dwellings (5.8%) contain loft insulation levels below 100mm. 4,326
dwellings (8.3%) offer loft insulation to 100mm, 7,603 dwellings (14.6%) to 150mm,
and 27,042 dwellings (51.8%) to 200mm or above. In 9,765 dwellings (18.7%) loft
insulation is not appropriate due to other uses over. Loft insulation provision in
Reading is better than the national average. Nationally, 29.7% of private sector
housing has loft insulation of 200mm or above. Locally, 51.8% of private housing
meets this target.
Excluding dwellings of solid wall construction, 18,522 dwellings exhibit evidence
of cavity wall insulation. This includes cavity insulation as built in more modern
dwellings and insulation added since built in older dwellings. This represents
53.4% of dwellings with cavities and is above the national average for private
housing in England of 43.4% (dwellings with cavities - 2011).
51.8
14.6
8.3
4.3
1.5
0.8
18.7
29.7
11.8
24.8
16.8
2.8
4.7
9.4
0 10 20 30 40 50 60
200mm or above
150mm - 199mm
100mm - 149mm
50mm - 99mm
Less than 50mm
No Insulation
No Loft
%
FIGURE 40 : LOFT INSULATION PROVISION - READING 2013, ENGLAND 2011
England 2011
Reading 2013

David Adamson & Partners Ltd. Page | 68
PRIVATE SECTOR HOUSING CONDITIONS 2013
48,827 dwellings (93.5%) offer some form of double glazing, the majority of which
is whole house. Levels of double glazing in Reading are in line with the national
average for private housing in England (93.1% - 2011).
46,869 dwellings (89.7%) offer full central heating with an additional 621 dwellings
(1.2%) offering partial heating systems. 4,744 dwellings (9.1%) lack central
heating. Levels of central heating locally at 89.7% are in line with the national
average for private housing (90.5% - 2011).
89.6
2.6
1.3
6.5
73.9
13.6
5.6
6.8
0 20 40 60 80 100
Whole House
More Than Half
Less Than Half
None
%
FIGURE 41 : DOUBLE GLAZING PROVISION - READING 2013, ENGLAND 2011
England 2011
Reading 2013
89.7%
1.2% 9.1%
FIGURE 42 : CENTRAL HEATING PROVISION
Full CH: 46,869 dwellings Partial CH: 621 dwellings
No CH: 4,744 dwellings

David Adamson & Partners Ltd. Page | 69
PRIVATE SECTOR HOUSING CONDITIONS 2013
Mains gas represents the primary heating fuel in 45,227 dwellings (86.6%) with
electricity representing the next most common fuel (6,869 dwgs - 13.1%).
DECENT HOMES THERMAL COMFORT
13.7 To meet the requirements of the Decent Homes Standard dwellings must offer efficient
heating and effective insulation. 4,531 dwellings (8.7%) fail to meet the requirements.
Limited sectoral variations in thermal comfort performance are evident although flats in
general offer below average compliance.
13.8 Geographically, patterns of thermal comfort failure mirror the distribution of properties in
EER bands E, F, G with higher levels of failure in Caversham and Redlands wards in
particular. Properties failing Decent Homes thermal comfort requirements have an average
SAP rating of 53 compared to 67 for dwellings compliant with the standard. 50.4% of non-
compliant dwellings are in EER bands E, F, G compared to 6.9% of compliant dwellings.
Non-compliant dwellings offer significantly lower levels of central heating, a higher
dependency on electricity as a primary heating fuel, and lower levels of insulation.
91.3%
8.7%
FIGURE 43 : DECENT HOMES THERMAL COMFORT PERFORMANCE
Compliant: 47,705 dwellings Non-Compliant: 4,531 dwellings
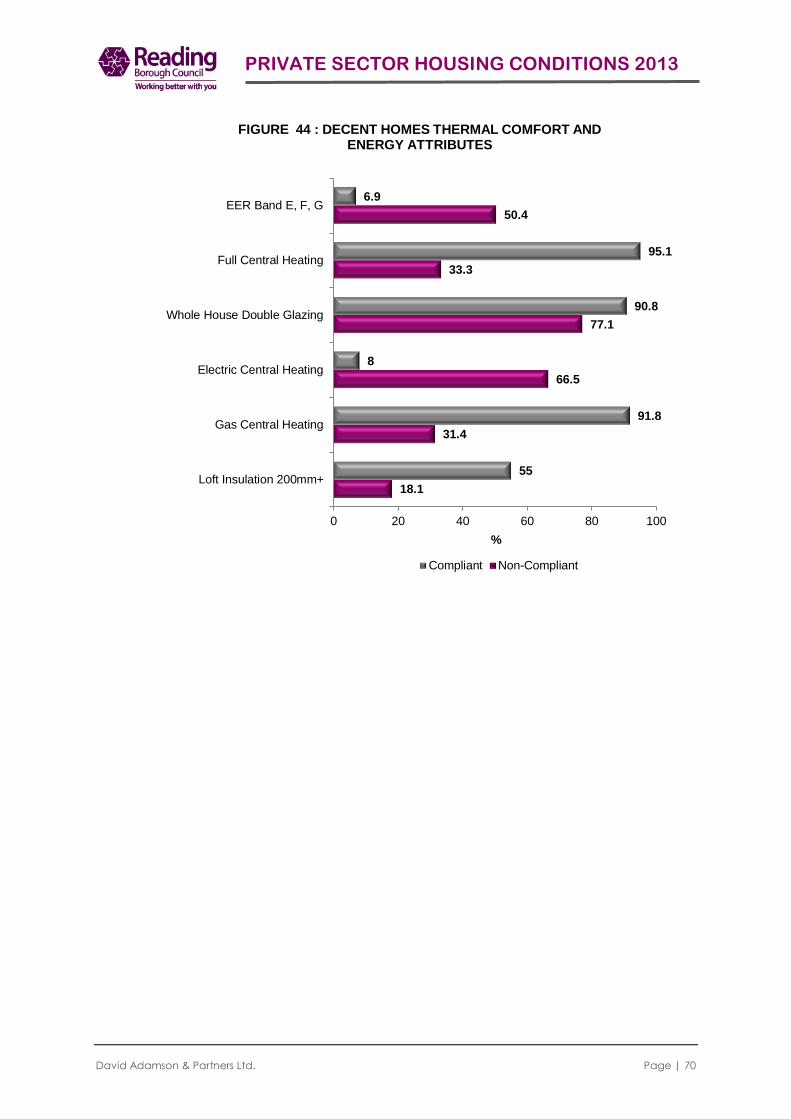
David Adamson & Partners Ltd. Page | 70
PRIVATE SECTOR HOUSING CONDITIONS 2013
18.1
31.4
66.5
77.1
33.3
50.4
55
91.8
8
90.8
95.1
6.9
0 20 40 60 80 100
Loft Insulation 200mm+
Gas Central Heating
Electric Central Heating
Whole House Double Glazing
Full Central Heating
EER Band E, F, G
%
FIGURE 44 : DECENT HOMES THERMAL COMFORT AND ENERGY ATTRIBUTES
Compliant Non-Compliant
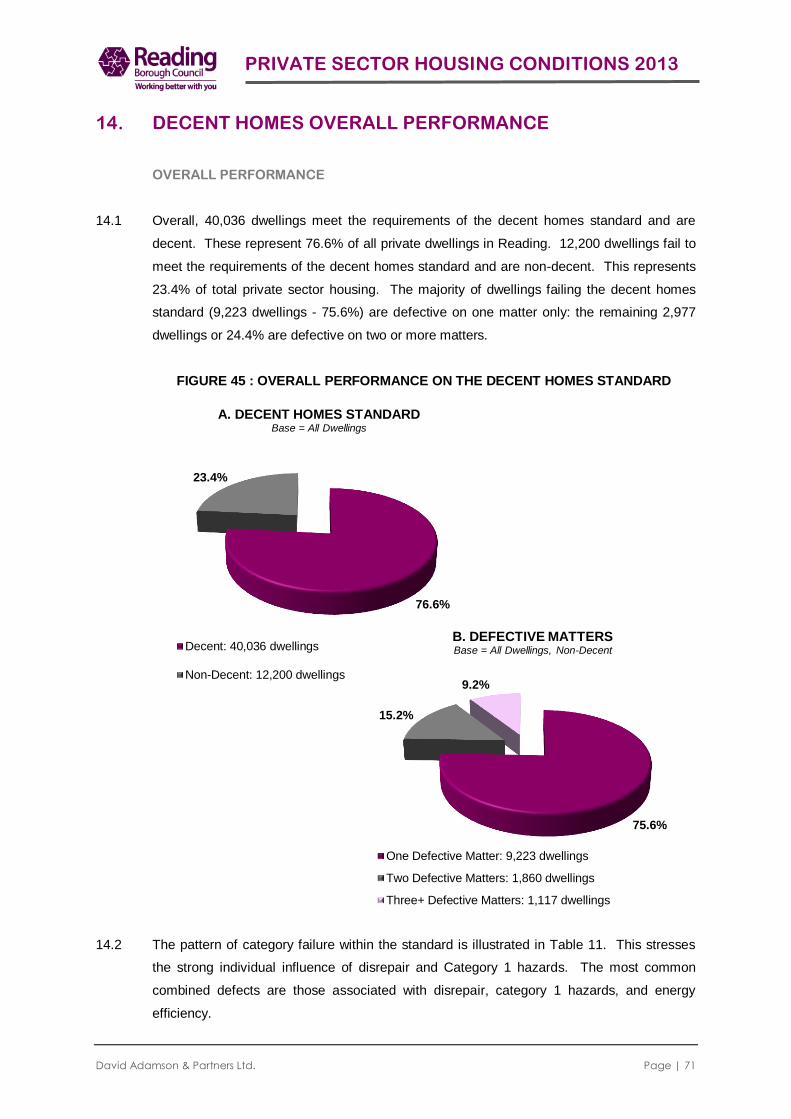
David Adamson & Partners Ltd. Page | 71
PRIVATE SECTOR HOUSING CONDITIONS 2013
14. DECENT HOMES OVERALL PERFORMANCE
OVERALL PERFORMANCE
14.1 Overall, 40,036 dwellings meet the requirements of the decent homes standard and are
decent. These represent 76.6% of all private dwellings in Reading. 12,200 dwellings fail to
meet the requirements of the decent homes standard and are non-decent. This represents
23.4% of total private sector housing. The majority of dwellings failing the decent homes
standard (9,223 dwellings - 75.6%) are defective on one matter only: the remaining 2,977
dwellings or 24.4% are defective on two or more matters.
FIGURE 45 : OVERALL PERFORMANCE ON THE DECENT HOMES STANDARD
14.2 The pattern of category failure within the standard is illustrated in Table 11. This stresses
the strong individual influence of disrepair and Category 1 hazards. The most common
combined defects are those associated with disrepair, category 1 hazards, and energy
efficiency.
76.6%
23.4%
A. DECENT HOMES STANDARD Base = All Dwellings
Decent: 40,036 dwellings
Non-Decent: 12,200 dwellings
75.6%
15.2%
9.2%
B. DEFECTIVE MATTERS Base = All Dwellings, Non-Decent
One Defective Matter: 9,223 dwellings
Two Defective Matters: 1,860 dwellings
Three+ Defective Matters: 1,117 dwellings

David Adamson & Partners Ltd. Page | 72
PRIVATE SECTOR HOUSING CONDITIONS 2013
TABLE 11: NON DECENT DWELLINGS - DEFECT CLASSIFICATION
DECENT HOMES DEFECT
CLASSIFICATION
dwellings %
HHSRS only 2838 23.3
Disrepair only 4106 33.7
Amenities only 71 0.6
Energy only 2209 18.1
HHSRS and disrepair 391 3.2
HHSRS and amenities 102 0.8
HHSRS and energy 817 6.7
Disrepair and amenity 126 1.0
Disrepair and energy 424 3.5
HHSRS, disrepair and amenity 36 0.3
HHSRS , disrepair and energy 820 6.7
HHSRS, disrepair, amenity and energy 261 2.1
ALL DWELLINGS NON DECENT 12200 100.0
SECTORAL VARIATIONS
14.3 Variations in Decent Homes performance reflect significantly higher rates of failure for:
Geographically, highest rates of Decent Homes failure are recorded for the wards of Battle,
Park, Caversham and Redlands. Failure rates in these wards exceed one-third of ward
housing stock.
KEY FACTS: LEVEL OF FAILURE The private-rented sector: 5,179 dwellings, 34.8%;
HMO’s: 2,275 dwellings, 43.4%;
Flats in converted buildings: 1,176 dwellings, 54.3%;
Dwellings constructed pre-1919: 6,339 dwellings, 43.1%.

David Adamson & Partners Ltd. Page | 73
PRIVATE SECTOR HOUSING CONDITIONS 2013
FIGURE 46 : RATES OF DECENT HOMES NON-COMPLIANCE BY WARD
Low : 0 - 7.6%
Below Average : 7.7 - 23.3%
Above Average : 23.4 - 33.4%
High : 33.5%+
Borough Average: 23.4%

David Adamson & Partners Ltd. Page | 74
PRIVATE SECTOR HOUSING CONDITIONS 2013
15. NON DECENT HOMES INVESTMENT NEEDS
COSTS TO ACHIEVE DECENCY
15.1 Costs to address non decency are estimated at £85.599M averaging £7,016 per dwelling
across all non-decent dwellings. Individual costs range from £1,200 linked to energy
improvement measures to £31,200 linked to comprehensive failure across the standard.
85% of outstanding costs are associated with category 1 hazards and disrepair - estimated
at £72.781M. Costs are at first quarter 2013 and are net of fees, preliminaries,
contingencies and VAT.
TABLE 12 : NON DECENT DWELLINGS - COST TO ACHIEVE DECENCY
COST TO ACHIEVE
DECENCY
Average
Cost (£)
Total Cost
(£M)
DECENT HOMES DEFECT CLASSIFICATION
HHSRS Only 7,144 20.272
Disrepair Only 6,457 26.512
Amenities Only 2,500 0.177
Energy Only 2,500 5.523
HHSRS And Disrepair 8,350 3.264
HHSRS And Amenities 11,405 1.165
HHSRS And Energy 9,876 8.065
Disrepair And Amenity 12,388 1.558
Disrepair And Energy 7,863 3.335
HHSRS, Disrepair And Amenity 19,884 0.716
HHSRS , Disrepair And Energy 13,609 11.164
HHSRS, Disrepair, Amenity And Energy 14,731 3.848
Total 7,016 85.599
13.3%
35.1%
1.7%
49.9%
FIGURE 47 : COSTS TO ADDRESS DECENT HOMES
Energy : £11.328M Disrepair : £30.031M
Amenities : £1.490M HHSRS : £42.750M

David Adamson & Partners Ltd. Page | 75
PRIVATE SECTOR HOUSING CONDITIONS 2013
COST DISTRIBUTION BY SECTOR
15.2 Costs to achieve decency by housing sector are illustrated in Table 13. Adjusting for
variations in sector size outstanding costs are weighted towards the private-rented and
HMO housing sectors.
TABLE 13 : COSTS TO ACHIEVE DECENCY BY HOUSING SECTOR
Dwellings Cost to Achieve Decency
dwgs % Average Total %
£ £M %
TENURE(1)
Owner-occupied 36795 70.4 6887 45.412 53.0
Private-rented 14863 28.5 7379 38.216 44.6
OCCUPANCY
Single Occupancy 46994 90.0 7059 70.074 81.9
Multiple Occupancy 5241 10.0 6825 15.525 18.1
HOUSE TYPE
Terraced House/Bungalow 22385 42.9 8119 42.605 49.8
Semi-Det. House/Bungalow 12002 23.0 7887 16.221 18.9
Detached House/Bungalow 3756 7.2 6039 0.578 0.7
Purpose-Built Flat 10821 20.7 5367 16.3233 19.0
Converted Flat 3271 6.3 5608 9.961 11.6
DATE OF CONSTRUCTION
Pre-1919 14704 28.1 7518 47.660 55.7
1919-1944 6177 11.8 8959 12.666 14.8
1945-1964 4300 8.2 7355 6.962 8.1
1965-1980 13086 25.1 5538 13.530 15.8
Post-1980 13969 26.7 4517 4.780 5.6
ALL SECTORS 52236 100.0 7016 85.599 100.0 (1)
Excludes Vacant Dwellings.
David Adamson & Partners Ltd. Page | 76
PRIVATE SECTOR HOUSING CONDITIONS 2013
16. DECENT PLACES - ENVIRONMENTAL CONDITIONS
DECENT PLACES AND LIVEABILITY
16.1 Environmental conditions and liveability problems were based on the professional
assessment by surveyors of problems in the immediate vicinity of the home. In all, 16
environmental issues were assessed individually but also grouped together into 3 categories
related to:
UPKEEP - The upkeep, management or misuse of private and public space and
buildings. Specifically, the presence of: scruffy or neglected
buildings, poor condition housing, graffiti, overgrown/unkempt
gardens or landscaping; rubbish or dumping, vandalism, dog or other
excrement and the nuisance from street parking (i.e. use by non-
residents of available street parking).
UTILISATION - Abandonment or non-residential use of property. Specifically: vacant
sites, vacant or boarded-up buildings and intrusive industry.
TRAFFIC - Road traffic and other forms of transport. Specifically the presence
of: intrusive main roads and motorways, railway or aircraft noise,
heavy traffic and poor ambient air quality.
ENVIRONMENTAL ISSUES
16.2 Environmental issues are apparent but are generally of minor impact. Major impact
problems were identified against only 4 indicators; and are predominantly related to traffic
and parking:
KEY FACTS: Nuisance from Street Parking: 6,732 dwellings (12.9%);
Heavy Traffic: 3,016 dwellings (5.8%);
Dog Fouling: 1,561 dwellings (3.0%);
Litter and Rubbish: 521 dwellings (1.0%).
3,097 non-Decent homes are located in areas affected by environmental problems
(25.4%). Only 15.3% of Decent homes are similarly affected.

David Adamson & Partners Ltd. Page | 77
PRIVATE SECTOR HOUSING CONDITIONS 2013
LIVEABILITY
16.3 Overall, 9,203 dwellings (17.6%) are located in residential environments experiencing
liveability problems. Problems with upkeep affect 7,672 dwellings (14.7%), traffic problems
affect 3,267 dwellings (6.3%) and utilisation issues affect 283 dwellings (0.5%).
97
98
98
97
98
89
82
88
74
84
81
86
95
95
76
75
3
2
2
3
2
11
12
12
13
16
16
14
5
5
24
24
6
13
3
1
0% 20% 40% 60% 80% 100%
Vacant/Boarded-upBuildings
Non-Conforming Uses
Intrusive Industry
Vacant Sites
Intrusion fromMotorways
Railway/Aircraft Noise
Heavy Traffic
Ambient Air Quality
Nuisance From StreetParking
Condition of Dwellings
Dog Fouling
Scruffy/NeglectedBuildings
Vandalism
Graffiti
Overgrown/UnkemptGardens
Litter & Rubbish
% affected
FIGURE 48 : ENVIRONMENTAL ISSUES
Not a Problem Minor Problem Major Problem

David Adamson & Partners Ltd. Page | 78
PRIVATE SECTOR HOUSING CONDITIONS 2013
16.4 Environmental problems are more noted in areas of older terraced housing and converted
flats and in areas of private-rental and multiple occupation. A relationship would also
appear to exist between environmental conditions and housing conditions such that 15.3%
of Decent homes are located in areas of environmental problems compared with 25.4% of
non-Decent homes.
16.5 Environmental problems are highest in Battle, Park and Katesgrove wards but also above
average in Abbey, Redlands and Whitley wards. Poor housing and environmental
conditions combine strongly in five wards including Abbey, Battle, Katesgrove, Park and
Redlands.
0.5
6.3
14.7
17.6
0 5 10 15 20
Utilisation
Traffic
Upkeep
Overall Liveability
%
FIGURE 49 : LIVEABILITY PROBLEMS
33,930 - 84.7%
9,103 - 74.6%
6,106 - 15.3%
3,097 - 25.4%
0
5000
10000
15000
20000
25000
30000
35000
40000
45000
Decent Non-Decent
dw
ell
ing
s
FIGURE 50 : ENVIRONMENTAL CONDITIONS AND HOUSING CONDITIONS
Environmental Problems
No Environmental Problems
40,036 dwellings
12,200 dwellings

David Adamson & Partners Ltd. Page | 79
PRIVATE SECTOR HOUSING CONDITIONS 2013
FIGURE 51 : ENVIRONMENTAL AND HOUSING CONDITIONS
FIGURE 52 : THE PRESENCE OF ENVIRONMENTAL ISSUES BY WARD
WHITLEY
ABBEY BATTLE KATESGROVE PARK
REDLANDS
KENTWOOD MAPLEDURHAM NORCOT PEPPARD SOUTHCOTE THAMES
TILEHURST
CAVERSHAM CHURCH MINSTER
POOR
ENVIRONMENTAL CONDITIONS
Above Average
Below Average
NON-DECENT
Below Above HOMES Average Average
Low : 0 - 1.0%
Below Average : 1.1 – 17.5%
Above Average : 17.6 - 31.8%
High : 31.9%+
Borough Average 17.6%

David Adamson & Partners Ltd. Page | 80
SECTION 5 :
HOUSING CONDITIONS AND HOUSEHOLD CIRCUMSTANCES
Chapter 17 : Housing Conditions and Household Circumstances
Chapter 18 : Fuel Poverty
Chapter 19 : Housing and Health
Chapter 20 : Household Attitudes to Housing and Local Areas
This section considers the type of households that are more likely to occupy dwellings in poor
condition. Chapter 18 links information on household income with recorded energy costs in order to
profile fuel poverty in Reading. The distribution of fuel poor households is examined together with
underlying factors impacting on fuel poverty. Relationships between housing and health are also
considered in this section as are household attitudes to both their accommodation and local
environment.
David Adamson & Partners Ltd. Page | 81
HOUSING CONDITIONS AND HOUSEHOLD CIRCUMSTANCES
17. HOUSING CONDITIONS AND HOUSEHOLD CIRCUMSTANCES
HOUSING AND HOUSEHOLD CONDITIONS
17.1 Relationships between housing conditions and household circumstances are summarised in
Tables 14 and 15 with regard to household social and economic characteristics. Poor
housing conditions are over-represented in economically and socially disadvantaged
households including younger single person households, single parent families, elderly
households, the economically vulnerable and those on low incomes. Thus:
17.2 No significant difference exits in housing conditions between households of different ethnic
backgrounds.
KEY FACTS: Single person non-pensioner households comprise 17.5% of all private sector
households yet account for 20.5% all households in non-decent dwellings;
Elderly households comprise 20.7% of all private sector households yet account
for 26.8% of all households in non-decent dwellings;
Households where the head of household is economically retired comprise 19.3%
of all private households yet account for 25.0% of all households in non-decent
dwellings;
Economically vulnerable households comprise 24.0% of all private households yet
account for 28.2% of all households in non-decent dwellings;
Low income households comprise 8.1% of all private sector households yet
account for 15.1% of all households in non-Decent dwellings. Generally the
income of households living in poor condition dwellings is consistently below that
of households living in dwellings in good condition. Thus households living in
non-Decent homes have average annual incomes of £25,371 compared to an
average of £33,985 for households living in Decent homes.
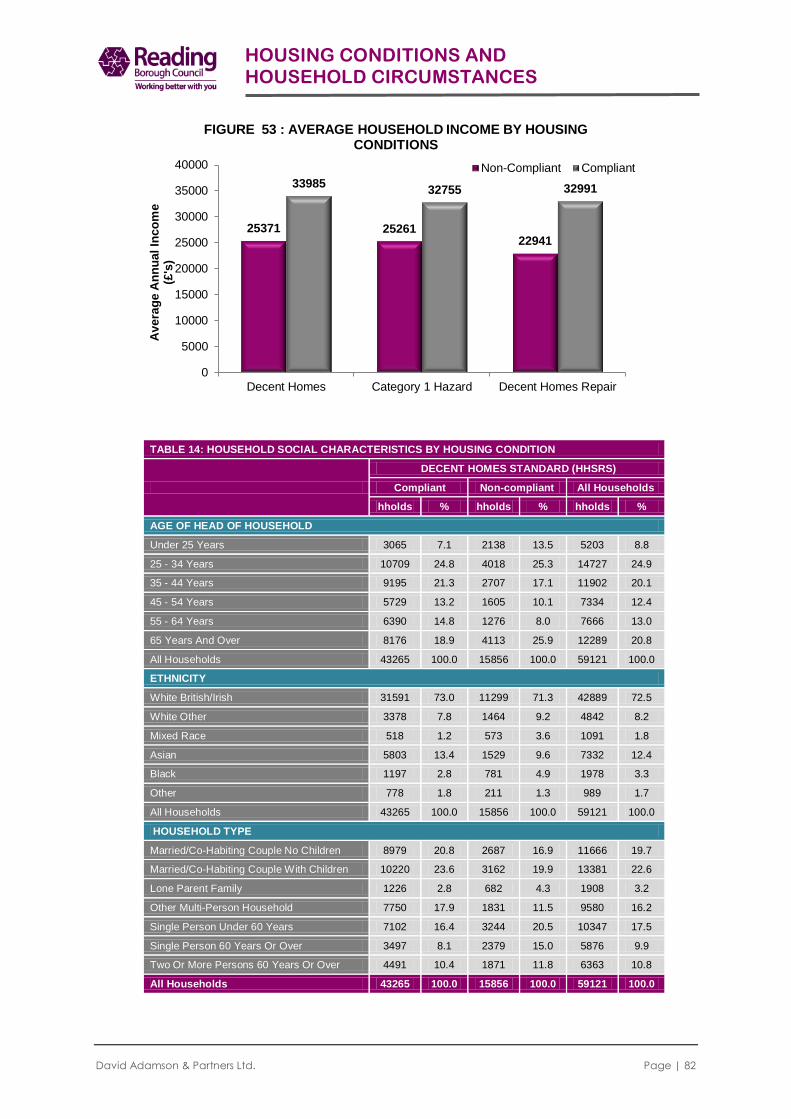
David Adamson & Partners Ltd. Page | 82
HOUSING CONDITIONS AND HOUSEHOLD CIRCUMSTANCES
TABLE 14: HOUSEHOLD SOCIAL CHARACTERISTICS BY HOUSING CONDITION
DECENT HOMES STANDARD (HHSRS)
Compliant Non-compliant All Households
hholds % hholds % hholds %
AGE OF HEAD OF HOUSEHOLD
Under 25 Years 3065 7.1 2138 13.5 5203 8.8
25 - 34 Years 10709 24.8 4018 25.3 14727 24.9
35 - 44 Years 9195 21.3 2707 17.1 11902 20.1
45 - 54 Years 5729 13.2 1605 10.1 7334 12.4
55 - 64 Years 6390 14.8 1276 8.0 7666 13.0
65 Years And Over 8176 18.9 4113 25.9 12289 20.8
All Households 43265 100.0 15856 100.0 59121 100.0
ETHNICITY
White British/Irish 31591 73.0 11299 71.3 42889 72.5
White Other 3378 7.8 1464 9.2 4842 8.2
Mixed Race 518 1.2 573 3.6 1091 1.8
Asian 5803 13.4 1529 9.6 7332 12.4
Black 1197 2.8 781 4.9 1978 3.3
Other 778 1.8 211 1.3 989 1.7
All Households 43265 100.0 15856 100.0 59121 100.0
HOUSEHOLD TYPE
Married/Co-Habiting Couple No Children 8979 20.8 2687 16.9 11666 19.7
Married/Co-Habiting Couple With Children 10220 23.6 3162 19.9 13381 22.6
Lone Parent Family 1226 2.8 682 4.3 1908 3.2
Other Multi-Person Household 7750 17.9 1831 11.5 9580 16.2
Single Person Under 60 Years 7102 16.4 3244 20.5 10347 17.5
Single Person 60 Years Or Over 3497 8.1 2379 15.0 5876 9.9
Two Or More Persons 60 Years Or Over 4491 10.4 1871 11.8 6363 10.8
All Households 43265 100.0 15856 100.0 59121 100.0
25371 25261 22941
33985 32755 32991
0
5000
10000
15000
20000
25000
30000
35000
40000
Decent Homes Category 1 Hazard Decent Homes Repair
Avera
ge A
nn
ual In
co
me
(£
's)
FIGURE 53 : AVERAGE HOUSEHOLD INCOME BY HOUSING CONDITIONS
Non-Compliant Compliant

David Adamson & Partners Ltd. Page | 83
HOUSING CONDITIONS AND HOUSEHOLD CIRCUMSTANCES
TABLE 15: HOUSEHOLD ECONOMIC CHARACTERISTICS BY HOUSING CONDITION
DECENT HOMES STANDARD (HHSRS)
Compliant Non-compliant All Households
hholds % hholds % hholds %
ECONOMIC STATUS HOH
Full-Time Work 26401 61.0 6583 41.5 32983 55.8
Part-Time Work 4116 9.5 1703 10.7 5818 9.8
Unemployed-Registered 735 1.7 724 4.6 1459 2.5
Permanently Sick/Disabled 351 .8 471 3.0 822 1.4
Looking After Home 1295 3.0 532 3.4 1827 3.1
Wholly Retired 7427 17.2 3965 25.0 11392 19.3
Student 2823 6.5 1753 11.1 4576 7.7
Not Applicable 0 .0 0 .0 0 .0
Unobtainable 116 .3 126 .8 243 .4
All Households 43265 100.0 15856 100.0 59121 100.0
LOW INCOME HOUSEHOLDS
Not On Low Income 40874 94.5 13465 84.9 54339 91.9
Low Income Household 2391 5.5 2391 15.1 4782 8.1
All Households 43265 100.0 15856 100.0 59121 100.0
VULNERABLE HOUSEHOLDS
Not Economically Vulnerable 33552 77.6 11385 71.8 44937 76.0
Economically Vulnerable 9712 22.4 4472 28.2 14184 24.0
All Households 43265 100.0 15856 100.0 59121 100.0
DECENT HOMES AND VULNERABLE HOUSEHOLDS
17.3 The previous Public Service Agreement (PSA) Target 7 - Decent Homes implied that 65% of
vulnerable households6 would live in decent homes by 2007, rising to 70% by 2011 and
75% by 2021. While the national target has been removed these previous thresholds can
still provide a local yardstick for private sector renewal strategy within the borough.
17.4 The survey estimates 14,184 private sector households in Reading are vulnerable; this
equates to 24.0% of all private sector households. Levels of vulnerability have increased in
the borough since 2006, when 15.3% of private sector households were vulnerable.
Currently 9,712 vulnerable households (68.5%) live in decent homes. This figure remains
below previous PSA Target 7 requirements for 2011.
6 A vulnerable household is one in receipt of a means tested or disability related benefit.

David Adamson & Partners Ltd. Page | 84
HOUSING CONDITIONS AND HOUSEHOLD CIRCUMSTANCES
17.5 Variations in progress towards decent homes for vulnerable households exist both
geographically and by housing sector. Key sectors remaining below the previous 2011
target threshold of 70% include:
TABLE 16: VULNERABLE HOUSEHOLDS - DECENT HOMES BY TENURE, TYPE, AGE AND OCCUPANCY
DECENT HOMES STANDARD (HHSRS)
Compliant Non-Compliant All Households
hholds % hholds % hholds %
TENURE
Owner Occupied 6059 72.5 2297 27.5 8357 100.0
Private Rented 3653 62.7 2174 37.3 5827 100.0
All Households 9712 68.5 4472 31.5 14184 100.0
MULTIPLE OCCUPATION
No 9448 69.5 4143 30.5 13591 100.0
Yes 264 44.5 329 55.5 593 100.0
All Households 9712 68.5 4472 31.5 14184 100.0
DATE OF CONSTRUCTION
Pre-1919 3872 63.7 2206 36.3 6078 100.0
33,552 - 74.7%
9,712 - 71.8%
11,385 - 33.2%
4,472 - 28.2%
0
5,000
10,000
15,000
20,000
25,000
30,000
35,000
40,000
45,000
50,000
Non Vulnerable Households Vulnerable Households
ho
useh
old
s
FIGURE 54 : DECENT HOMES AND VULNERABILITY
Non-Decent Home
Decent Home
44,937 households
14,184 households
KEY FACTS: Converted flats where 34.7% of vulnerable households live in decent homes;
Houses in Multiple Occupation where 44.5% of vulnerable households live in
Decent Homes;
Private-rented dwellings where 62.7% of vulnerable households live in decent
homes;
Pre-1919 housing where 63.7% of vulnerable households live in decent homes.
.

David Adamson & Partners Ltd. Page | 85
HOUSING CONDITIONS AND HOUSEHOLD CIRCUMSTANCES
TABLE 16: VULNERABLE HOUSEHOLDS - DECENT HOMES BY TENURE, TYPE, AGE AND OCCUPANCY
DECENT HOMES STANDARD (HHSRS)
Compliant Non-Compliant All Households
hholds % hholds % hholds %
1919-1944 1261 86.0 206 14.0 1467 100.0
1945-1964 1945 70.1 830 29.9 2775 100.0
1965-1974 1667 63.4 962 36.6 2629 100.0
1975-1981 82 41.0 118 59.0 200 100.0
Post-1981 886 85.6 150 14.4 1036 100.0
All Households 9712 68.5 4472 31.5 14184 100.0
MAIN HOUSE TYPE
Terraced House/Bungalow 6401 71.7 2521 28.3 8922 100.0
Semi-Detached House/Bungalow 2222 69.3 985 30.7 3207 100.0
Detached House/Bungalow 266 100.0 0 .0 266 100.0
Purpose Built Flat 631 51.1 603 48.9 1234 100.0
Converted/Mixed Use Flat 192 34.7 363 65.3 555 100.0
All Households 9712 68.5 4472 31.5 14184 100.0
17.6 Geographically the lowest proportions of vulnerable households in Decent Homes are found
in Abbey, Park, Minster and Church wards.
FIGURE 55 : VULNERABLE HOUSEHOLDS IN NON-DECENT HOMES BY WARD
Low : 0 - 22.2%
Below Average : 22.3 – 31.5%
Above Average : 31.6 – 49.9%
High : 50%+
Borough Average: 31.5%

David Adamson & Partners Ltd. Page | 86
HOUSING CONDITIONS AND HOUSEHOLD CIRCUMSTANCES
18. FUEL POVERTY
FUEL POVERTY CALCULATION
18.1 Fuel poverty is dependent upon, and calculated using two factors:
a) Household circumstances (income) and ability to pay for domestic fuel; and
b) The cost of domestic energy as reflected in underlying fuel tariffs and the energy
efficiency of individual properties.
Using these factors, fuel poverty calculation within this report has been based on current
definitions within the UK, although these definitions are currently under review. Households
are regarded as being in fuel poverty if they spend in excess of 10% of annual income on
fuel. A ‘full income’ approach has been adopted whereby related benefits are deducted
from household income prior to fuel poverty calculation. Income data has been derived
directly from households together with information on benefit receipt. Annual fuel costs
have also been household derived.
FUEL POVERTY LEVELS
18.2 Average annual fuel costs for households in Reading are estimated at £1,132 based on
information provided by households themselves. 10,573 households in Reading (17.9%)
spend in excess of 10% of annual income in meeting these costs and are in fuel poverty.
Levels of fuel poverty in Reading, in line with reported national trends, have increased since
2006 when the previous house condition survey reported 5,600 households or 11% in fuel
poverty. This increase reflects to a large extent the increase in fuel prices since 2006. The
Department of Energy and Climate Change7 calculate that in 2013 equivalent prices, the
average annual domestic gas bill increased from £589 in 2006 to £890 in 2013, during the
same period the average annual domestic electricity bill rose from £424 to £534.
7 Department of Energy and Climate Change, Quarterly Energy Prices.

David Adamson & Partners Ltd. Page | 87
HOUSING CONDITIONS AND HOUSEHOLD CIRCUMSTANCES
HOUSEHOLDS AFFECTED
18.3 Demographically, fuel poverty impacts most strongly on younger and older households.
3,304 households headed by a person aged under 25 years are in fuel poverty representing
63.5% of all younger households and 31.2% of all households in fuel poverty. 2,999 elderly
households are in fuel poverty representing 24.5% of all elderly households and 28.3% of all
households in fuel poverty.
18.4 4,862 economically vulnerable households are in fuel poverty representing 34.3% of
vulnerable households and 46.0% of all households in fuel poverty. 4,553 low income
households are in fuel poverty representing 95.2% of all low income households and 43.0%
of all households in fuel poverty. Average annual income for households in fuel poverty is
estimated at £8,502 compared to £36,722 for households not in fuel poverty.
SECTORS AND AREAS AFFECTED
18.5 Locally, rates of fuel poverty are above the borough average of 17.9% for households living
in the private-rented sector (30.0%), in multiple occupation (48.0%) and in pre-1919 terraced
housing (28.6%). Geographically the highest rates of fuel poverty are concentrated in
Church, Katesgrove, Park and Redlands wards.
5,600 households
(11%)
10,573 households
(17.9%)
0
2
4
6
8
10
12
14
16
18
20
2006 2013
% F
UE
L P
OO
R
FIGURE 56 : RECENT TRENDS IN FUEL POVERTY
Increase of 4,973 hholds -
89%

David Adamson & Partners Ltd. Page | 88
HOUSING CONDITIONS AND HOUSEHOLD CIRCUMSTANCES
3.7
47
36
6.8
72.9
9.8
4.2
23.1
7.1
13.6
7.9
13.3
63.5
0 20 40 60 80
Two or More Persons 60 years plus
Single Person 60 years plus
Single Person Under 60 years
Other Multi-Person Household
Lone Parent Family
Married/Co-habiting with Children
Married/Co-habiting no Children
65 years and over
55 - 64 years
45 - 54 years
35 - 44 years
25 - 34 years
Under 25 years
% in fuel poverty
FIGURE 57 : RATES OF FUEL POVERTY BY AGE OF HEAD OF HOUSEHOLD AND HOUSEHOLD TYPE
11.1
95.2
12.7
34.3
0 20 40 60 80 100
Not on Low Income
On Low Income
Not EconomicallyVulnerable
Economically Vulnerable
% in fuel poverty
FIGURE 58 : FUEL POVERTY BY LOW INCOME AND ECONOMICAL VULNERABILITY
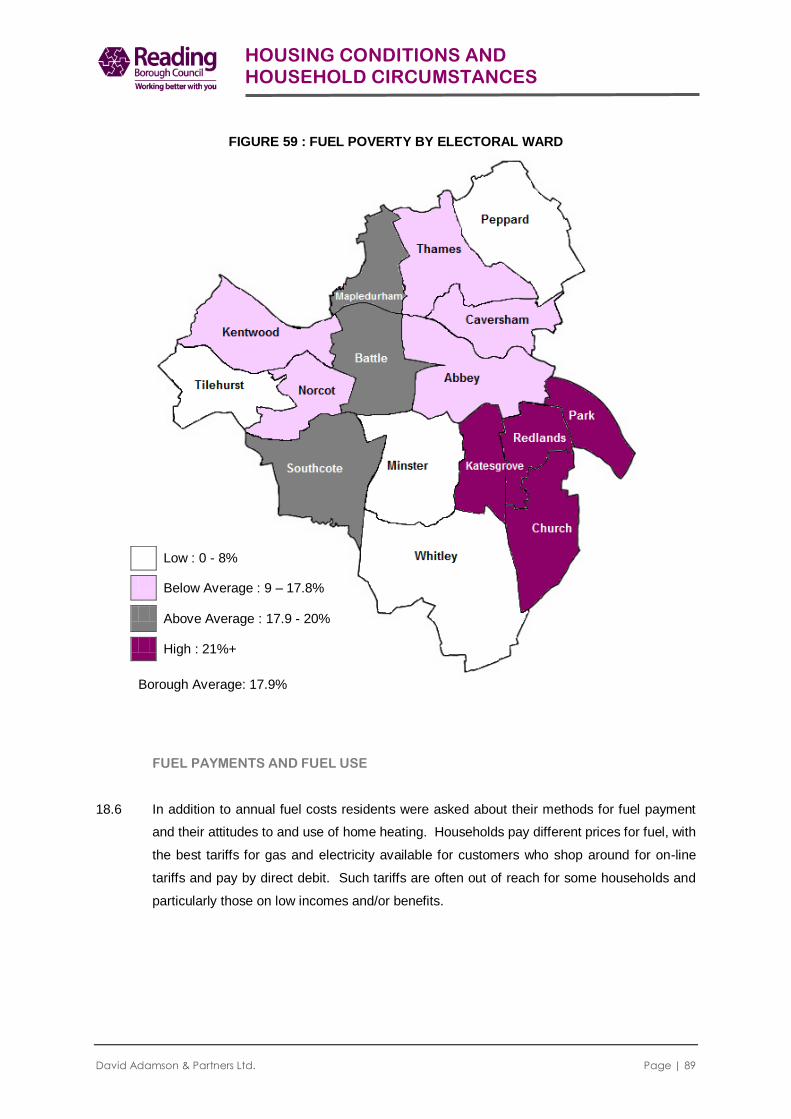
David Adamson & Partners Ltd. Page | 89
HOUSING CONDITIONS AND HOUSEHOLD CIRCUMSTANCES
FIGURE 59 : FUEL POVERTY BY ELECTORAL WARD
FUEL PAYMENTS AND FUEL USE
18.6 In addition to annual fuel costs residents were asked about their methods for fuel payment
and their attitudes to and use of home heating. Households pay different prices for fuel, with
the best tariffs for gas and electricity available for customers who shop around for on-line
tariffs and pay by direct debit. Such tariffs are often out of reach for some households and
particularly those on low incomes and/or benefits.
Low : 0 - 8%
Below Average : 9 – 17.8%
Above Average : 17.9 - 20%
High : 21%+
Borough Average: 17.9%
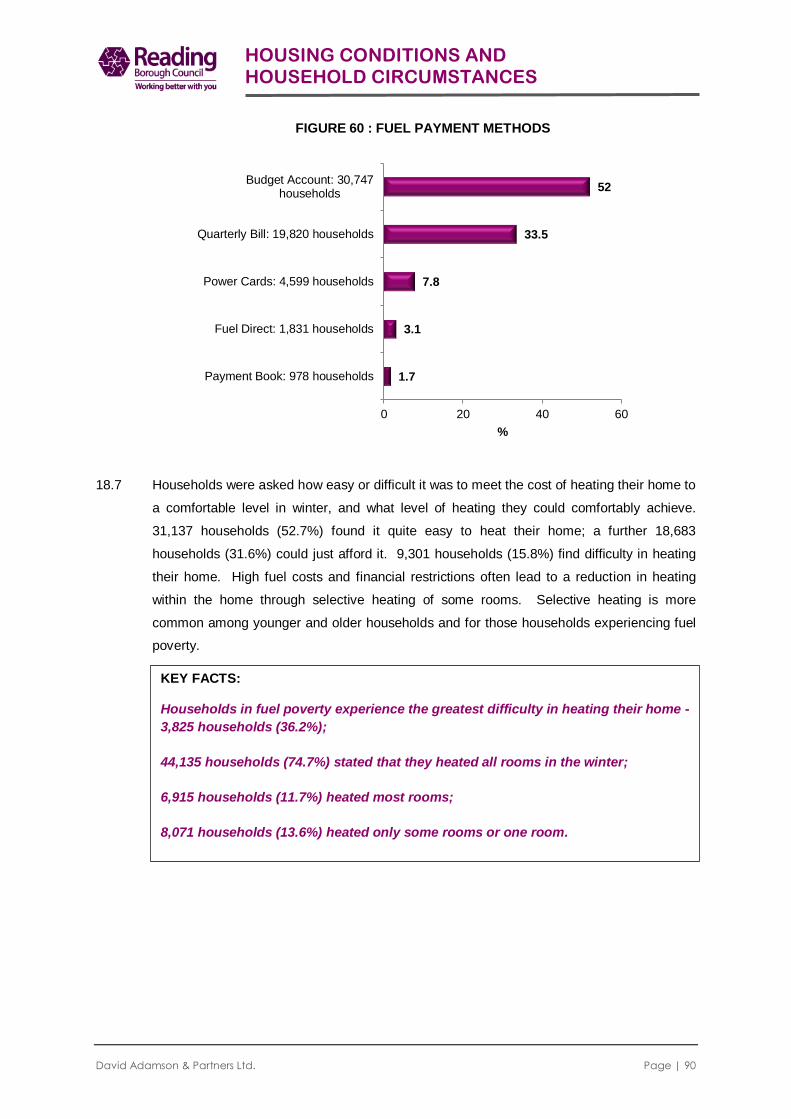
David Adamson & Partners Ltd. Page | 90
HOUSING CONDITIONS AND HOUSEHOLD CIRCUMSTANCES
18.7 Households were asked how easy or difficult it was to meet the cost of heating their home to
a comfortable level in winter, and what level of heating they could comfortably achieve.
31,137 households (52.7%) found it quite easy to heat their home; a further 18,683
households (31.6%) could just afford it. 9,301 households (15.8%) find difficulty in heating
their home. High fuel costs and financial restrictions often lead to a reduction in heating
within the home through selective heating of some rooms. Selective heating is more
common among younger and older households and for those households experiencing fuel
poverty.
1.7
3.1
7.8
33.5
52
0 20 40 60
Payment Book: 978 households
Fuel Direct: 1,831 households
Power Cards: 4,599 households
Quarterly Bill: 19,820 households
Budget Account: 30,747households
%
FIGURE 60 : FUEL PAYMENT METHODS
KEY FACTS: Households in fuel poverty experience the greatest difficulty in heating their home -
3,825 households (36.2%);
44,135 households (74.7%) stated that they heated all rooms in the winter;
6,915 households (11.7%) heated most rooms;
8,071 households (13.6%) heated only some rooms or one room.

David Adamson & Partners Ltd. Page | 91
HOUSING CONDITIONS AND HOUSEHOLD CIRCUMSTANCES
FIGURE 61 : HEATING AFFORDABILITY AND HEATING USE
FUEL POVERTY FACTORS
18.8 While energy efficiency variations exist for dwellings occupied by households in fuel poverty
and those not in fuel poverty, the differences are quite small. Dwellings occupied by
households in fuel poverty have an average SAP Rating of 60 compared to 64 for
households not in fuel poverty. While energy efficiency improvements will impact positively
on energy costs the principal drivers of fuel poverty in Reading are household income and
energy prices. The average annual fuel cost for households in fuel poverty is £230 greater
than for those not in fuel poverty. Households not in fuel poverty have an average annual
income of £36,722 - the average annual income for households in fuel poverty is only
£8,502.
52.6%
31.6%
11.3% 4.5%
WINTER AFFORDABILITY
Easy to Heat Can Just Afford it
Some Difficulty Great Difficulty
74.6%
11.7%
11.9% 1.8%
WINTER HEATING USE
Heat All Rooms Heat Most Rooms
Heat Some Rooms Heat One Room
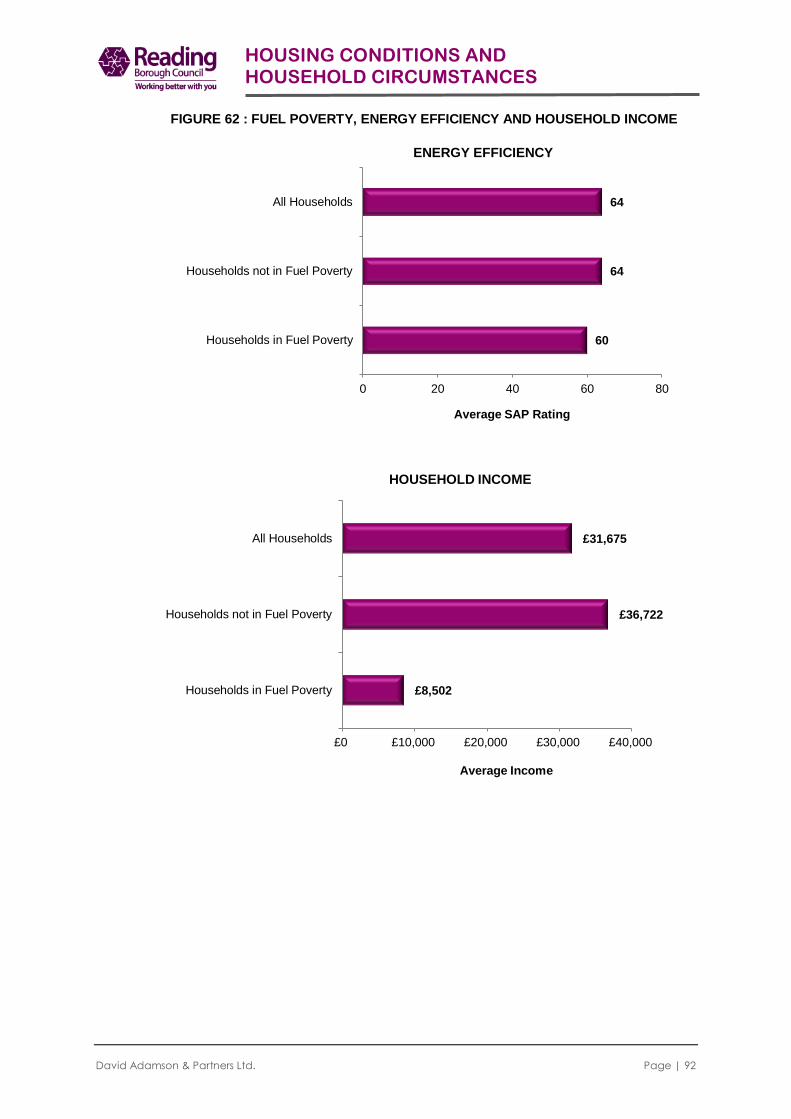
David Adamson & Partners Ltd. Page | 92
HOUSING CONDITIONS AND HOUSEHOLD CIRCUMSTANCES
FIGURE 62 : FUEL POVERTY, ENERGY EFFICIENCY AND HOUSEHOLD INCOME
60
64
64
0 20 40 60 80
Households in Fuel Poverty
Households not in Fuel Poverty
All Households
Average SAP Rating
ENERGY EFFICIENCY
£8,502
£36,722
£31,675
£0 £10,000 £20,000 £30,000 £40,000
Households in Fuel Poverty
Households not in Fuel Poverty
All Households
Average Income
HOUSEHOLD INCOME

David Adamson & Partners Ltd. Page | 93
HOUSING CONDITIONS AND HOUSEHOLD CIRCUMSTANCES
19. HOUSING AND HEALTH
19.1 The relationship between housing conditions and health is well researched. The cost/benefit
of interventions to improve housing conditions and health is the subject of growing national
concern8. The current survey, in addition to assessing housing conditions, has examined a
range of related household health issues. These have included:
The presence of long-term illness/disability, its impact on normal dwelling
occupation and its impact on health service resources.
The incidence of accidents within the home and their impact on health service
resources.
Using national case study data recently published for England9 we have also attempted to
quantify the economic cost of unhealthy housing in Reading, both in terms of savings to the
NHS and also society in general.
LONG-TERM ILLNESS AND DISABILITY
19.2 6,171 households in Reading (10.4%) indicated that at least one member was affected by a
long-term illness or disability.
8 Linking Housing Conditions and Health, (2010) Warwick Law School with Building Research Establishment.
9 Quantifying the economic cost of unhealthy housing - a case study from England 2011. Simon Nicol, Mike Roys, Maggie
Davidson, David Ormandy, Peter Ambrose.
10.4%
89.6%
FIGURE 63 : HOUSEHOLD ILLNESS/DISABILITY
Illness/Disability Present: 6,171 households
No Illness/Disability: 52,950 households

David Adamson & Partners Ltd. Page | 94
HOUSING CONDITIONS AND HOUSEHOLD CIRCUMSTANCES
Illness/disability is strongly age-related. 3,196 households affected by illness/disability
(51.8%) have a head of household aged 65 years and over, a further 792 households
affected (12.8%) have a head of household aged 55 - 64 years.
19.3 Households affected by a long-term illness/disability were asked for the nature of that
illness/disability. The most common complaints relate to:
6.8
1.9
4.2
14.4
10.3
26
0
5
10
15
20
25
30
% h
ou
seh
old
s w
ith
Ill
ness/ D
isab
ilit
y
Age of Head of Household
FIGURE 64 : LONG-TERM ILLNESS/DISABILITY AND AGE OF HEAD OF HOUSEHOLD
KEY FACTS: Heart/Circulatory Problems: 2,101 households - 34.0%; Other Physical disability: 1,904 households – 30.9%; Respiratory Illness: 1,785 households - 28.9%; Mobility impairment: 1,371 households – 22.2%.

David Adamson & Partners Ltd. Page | 95
HOUSING CONDITIONS AND HOUSEHOLD CIRCUMSTANCES
19.4 Households experiencing illness/disability were asked if this had resulted in the use of
health service resources during the past year and additionally if the illness/disability affected
their normal use of the dwelling signifying a potential need for adaptation. Health service
contact in the past year is significant among households experiencing illness/disability.
TABLE 17: HOUSEHOLDS WITH ILLNESS/DISABILITY - HEALTH SERVICE ACTION WITHIN PAST YEAR
Yes No
All Households with Illness/
Disability
hholds % hholds % hholds %
Consult GP Through Surgery Visit 4651 75.4 1520 24.6 6171 100.0
Consult GP Through Home Visit 1009 16.3 5163 83.7 6171 100.0
Consult NHS Direct 220 3.6 5951 96.4 6171 100.0
Attend Hospital Accident/Emergency 458 7.4 5713 92.6 6171 100.0
Attend Hospital As Outpatient 3229 52.3 2942 47.7 6171 100.0
Attend Hospital As Inpatient 602 9.8 5569 90.2 6171 100.0
4,651 households with an illness/disability (75.4%) have made a surgery visit to their GP, a
further 1,009 households (16.3%) have arranged a home visit from their GP, and 3,229
households (52.3%) have attended hospital as an outpatient.
2.2
4
6.3
8.4
22.2
25.2
28.9
30.9
34
0 10 20 30 40
Learning Difficulty: 137 households
Speech Impairment: 247 households
Visual Impairment: 387 households
Hearing Impairment: 518 households
Mobility Impairment: 1,371 households
Mental Health Problem: 1,553 households
Respiratory Illness: 1,785 households
Other Physical Disability: 1,904households
Heart/Circulatory Problem: 2,101households
%
FIGURE 65 : HOUSEHOLDS WITH LONG-TERM ILLNESS/DISABILITY - ILLNESS/DISABILITY TYPE

David Adamson & Partners Ltd. Page | 96
HOUSING CONDITIONS AND HOUSEHOLD CIRCUMSTANCES
HOUSING AND HEALTH
19.5 While the presence of illness/disability has resulted in a high level of contact with the health
service this is not necessarily a direct result of poor housing conditions10
. To examine the
presence or otherwise of a relationship between household health, health service contact
and housing conditions in Reading a correlation analysis has been completed. This
confirms a statistically significant correlation between housing conditions, household health
and health service contact. Consequently, households who occupy dwellings in poor
condition are more likely than households in good condition dwellings to suffer from
illness/disability and have contact with the health service.
TABLE 18 : CORRELATION MATRIX - HOUSING CONDITIONS, HOUSEHOLD HEALTH AND HEALTH SERVICE CONTACT
ILLNESS/
DISABILITY
HEALTH SERVICE
CONTACT
CATEGORY 1 HAZARD
DECENT HOMES
REPAIR
DECENT HOMES
THERMAL
DECENT HOMES
OVERALL
Illness/Disability 1.00 0.903** 0.059** 0.180** 0.123** 0.109**
Health Service Contact 1.00 0.062** 0.205** 0.133** 0.131**
Category 1 Hazard 1.00 0.258** 0.348** 0.678**
Decent Homes Repair 1.00 0.302** 0.641**
Decent Homes Thermal 1.00 0.545**
Decent Homes Overall 1.00
**Significant at 0.01 level (2-tailed11
)
10
A useful summary of the key issues surrounding health and housing in the UK can be found in “Housing and Health, Postnote, Number 371 January 2011” published by Parliamentary Office of Science & Technology
11 When using a two-tailed test, regardless of the direction of the relationship you hypothesize (in this case that housing
conditions impacts on health), you are testing for the possibility of the relationship in both directions (i.e. either positively or negatively).
3.6
7.4
9.8
16.3
52.3
75.4
86.6
0 20 40 60 80 100
NHS Direct
HospitalAccident/Emergency
Hospital Inpatient
GP Home Visit
Hospital Outpatient
GP Surgery Visit
Any Contact
%
FIGURE 66 : HOUSEHOLDS WITH ILNESS/DISABILITY - HEALTH SERVICE CONTACT WITHIN PAST YEAR

David Adamson & Partners Ltd. Page | 97
HOUSING CONDITIONS AND HOUSEHOLD CIRCUMSTANCES
The correlation coefficient between two variables measures the degree of association
between the two; it does not indicate a causal effect by itself. The stronger the degree of
positive association the closer to one the measured correlation coefficient is. The strongest
association is found between the presence of illness/disability within a household and health
service contact (0.903). In this instance there is clearly a causal effect. Whilst still
statistically significant, weaker correlations are found between illness/disability and poor
condition dwellings.
MOBILITY AND ADAPTATION
19.6 Of the 6,171 households affected by a long-term illness or disability, 2,350 households
(38.1%) stated that they had a mobility problem within their dwelling. Normal use and
occupation of the dwelling was unaffected for the remaining 3,822 households (61.9%).
Among households where mobility is affected the most common problems relate to using
bathroom amenities and climbing stairs.
38.1%
61.9%
FIGURE 67 : HOUSEHOLDS WITH ILLESS/DISABILITY - MOBILITY PROBLEMS
No Mobility Problems: 3,822 households
Mobility Problems Present: 2,350 households
17.6
17.9
19.7
20
24.1
25.2
25.9
81.8
85
0 20 40 60 80 100
Access to Ground Floor Rooms: 413households
Turning Taps On/Off: 420 households
Access to Front/Rear Gardens: 464households
Using WC: 469 households
Washing/Drying Clothes: 566 households
Access to/from the Home: 592 households
Cooking/Preparing Food: 609 households
Climbing Steps/Stairs: 1,922 households
Getting in/out of the Bath: 1,998 households
%
FIGURE 68 : MOBILITY PROBLEMS Base = All households with long-term illness/disability and mobility problems (2,350
households)

David Adamson & Partners Ltd. Page | 98
HOUSING CONDITIONS AND HOUSEHOLD CIRCUMSTANCES
19.7 Dwelling adaptation has been previously discussed in Chapter 12 with regard to the housing
stock in general. Only 391 households with a mobility problem (16.6%) live in an adapted
dwelling. For the remaining 1,959 households with a mobility problem (83.4%) no
adaptations have been made to their existing dwellings. These households represent the
core short-term future demand for Disabled Facilities Grant support from Reading Borough
Council.
ACCIDENTS IN THE HOME/MINOR AILMENTS
19.8 Additional health related issues were examined for all households within the survey. Issues
covered include:
a) Minor ailments/symptoms resulting in a GP or hospital consultation within the
past year.
b) Accidents within the home.
7,564 households (12.8%) stated that they had consulted their GP or visited hospital due to
minor ailments/symptoms during the past year. The most common symptoms quoted were
aches and pains (7.3%), breathlessness/wheeziness (4.3%), headaches and fever (3.7%)
and backache (2.5%).
Households most affected by minor ailments/symptoms include the elderly and households
with children. In the past year 8,597 households (14.5%) had children absent from school
0.1
1.1
1.3
1.6
2.1
2.5
3.7
4.3
7.3
12.8
0 5 10 15
Fainting: 76 households
Vomiting: 675 households
Diarrhoea: 751 households
Blocked Nose: 954 households
Nerves/Stress: 1,231 households
Backache: 1,475 households
Headaches/Fever: 2,168 households
Breathlessness/Wheeziness: 2,539 houseolds
Aches and Pains: 4,302 households
Any Symptom: 7,564 households
% of households
FIGURE 69 : HOUSEHOLDS AFFECTED BY MINOR AILMENT/SYMPTOM RESULTING IN GP CONSULTATION OR HOSPITAL VISIT IN LAST YEAR

David Adamson & Partners Ltd. Page | 99
HOUSING CONDITIONS AND HOUSEHOLD CIRCUMSTANCES
due to minor illnesses. The association between minor ailments and house condition (non-
Decent Housing) as measured by a correlation coefficient of 0.110 is significant at the 99%
confidence level, once again implying households occupying poor condition dwellings are
more likely to experience minor ailments than those in good condition dwellings.
19.9 The risk of accidents in the home, including falls/shocks, burns, fires, scalds and
collisions/cuts/strains, is measured within the HHSRS and has been reported previously in
Chapter 10 of the report. Households were asked if any member had an accident in the
home during the past year. Only 303 households (0.5%) stated that a household member
had been affected. Sample sizes, due to the low occurrence of accidents, are insufficient to
support further analysis.
HOUSEHOLD VIEWS ON HOUSING AND HEALTH
19.10 Households were asked for their views on whether the design/condition of their home
affected the health and well-being of their family. 49,937 households (84.5%) perceived no
effect through condition with a further 2,168 households (3.7%) perceiving a positive effect
through good quality/condition housing. 1,740 households (2.9%) thought that their current
housing conditions impacted negatively on their family’s health. Among those perceiving a
negative effect 1,428 households (82.1%) live in non-Decent homes. Overall 9 per cent of
households living in non-Decent homes perceive a negative impact on family health. This
compares with just 0.7% of households living in Decent homes.
THE ECONOMICS OF HOUSING INTERVENTION
19.11 Recent research in England has examined and quantified the costs, and benefits to the NHS
of reducing HHSRS Category 1 hazards to an acceptable level12
. Using conclusions from
this research at a national level and data from the house condition survey enables a local
analysis to be completed. Column 1 of Table 19 illustrates the number of Category 1
hazards by type within Reading. Costs to address Category 1 hazards as a one-off
programme are provided in column 2. Columns 3 and 4 of the table have applied national
averages to determine the likely savings as a result of addressing Category 1 hazards.
Savings fall into two groups: (a) direct savings to the NHS, and (b) overall savings to
society. The national research indicates that the annual cost to the NHS of treating health
outcomes attributable to Category 1 HHSRS hazards in English housing accounts for a
maximum of 40% of the total cost to society. Columns 5 and 6 indicate the payback periods
to the NHS and society in general through addressing Category 1 hazards.
12
See footnote 9, page 93.

David Adamson & Partners Ltd. Page | 100
HOUSING CONDITIONS AND HOUSEHOLD CIRCUMSTANCES
19.12 One-off costs to address the primary Category 1 hazards in Reading are estimated at
£41.539M. These costs are estimated to attract NHS savings locally of £0.857M per annum
giving a payback period of 48 years. Total savings to society are estimated at £2.143M per
annum reducing the payback payment period to 19 years.
TABLE 19 : THE COSTS AND BENEFITS TO THE NHS OF HOUSING INTERVENTION
HHSRS HAZARD
NUMBER OF
CATEGORY 1 HAZARDS
COST TO ADDRESS
CATEGORY 1 HAZARD
ANNUAL
SAVINGS TO NHS
TOTAL
SOCIETY SAVINGS
PAYBACK PERIOD
NHS SAVINGS
TOTAL SAVINGS
dwgs £’s £’s £’s years years
Noise 15 68609 2118 5295 32 13
Hot Surfaces/Materials 83 489526 7595 18988 64 26
Electrical 53 580957 8000 20000 73 29
Dampness 124 1220337 11015 27538 111 44
Fire 175 756389 21160 52900 36 14
Falls between Levels 298 1393275 32367 80918 43 17
Excess Cold 3672 25688898 33048 82620 777 311
Food Safety 293 2436385 39329 98323 62 25
Crowding and Space 465 2483897 441053 1102634 6 2
Falls on the Level 330 1665255 46290 115725 36 14
Falls on Steps/Stairs 1026 4755456 216921 542303 22 9
ANY OF THE ABOVE 41538984 857172 2142930 48 19
19.13 These payback periods are similar to those estimated nationally where the costs of
addressing all Category 1 hazards are recouped in NHS savings after 29 years and in total
society savings after 12 years. The national estimate for savings to the NHS were
calculated as if any improvement to Category 1 hazards resulted in the property being
brought into line with the national average for that type and age of dwelling. Most
improvement schemes would hope to improve homes to much better standards than the
national average and therefore there would be a significant improvement to the NHS cost
savings.

David Adamson & Partners Ltd. Page | 101
HOUSING CONDITIONS AND HOUSEHOLD CIRCUMSTANCES
20. HOUSEHOLD ATTITUDES TO HOUSING AND LOCAL AREAS
20.1 Household views were assessed with regard to:
Satisfaction with housing circumstances.
Satisfaction with the local area.
Attitudes to area trends.
Problems within their local area, including perceptions of local safety.
HOUSING SATISFACTION
20.2 Housing satisfaction levels are good. 44,631 households (75.5%) are very satisfied with
their current accommodation, 12,241 households (20.7%) are quite satisfied. Only, 2,089
households (3.5%) expressed direct dissatisfaction with their home.
20.3 Variations in housing dissatisfaction are evident between housing sectors and
geographically across the Borough. Dissatisfaction with current housing is above average in
the private-rented and HMO housing sectors and for households resident in
converted/mixed use flats. Nationally, 96% of owner-occupiers and 83% of private-tenants
are satisfied with their accommodation (English Housing Survey, Households 2011-12).
20.4 While the majority of households living in non-Decent homes remain satisfied with their
current accommodation, levels of dissatisfaction are higher than for households living in
Decent homes:
75.5%
20.7%
3.5% 0.3%
FIGURE 70 : HOUSEHOLD SATISFACTION WITH CURRENT HOUSING
Very Satisfied Quite Satisfied Dissatisfied Don't Know

David Adamson & Partners Ltd. Page | 102
HOUSING CONDITIONS AND HOUSEHOLD CIRCUMSTANCES
20.5 Geographically, highest rates of housing dissatisfaction are recorded in Abbey, Katesgrove,
Park and Redlands wards.
FIGURE 71 : DISSATISFACTION WITH CURRENT ACCOMMODATION
Low : 0%
Below Average : 0.1 – 3.4%
Above Average : 3.5 - 5.9%
High : 6.0%+
Borough Average: 3.5%
KEY FACTS: 1,806 households living in private-rented accommodation are dissatisfied with
their current accommodation representing 8.2% of all households renting
privately. This compares with 0.8% of owner-occupied households dissatisfied;
707 households living in multiple occupation are dissatisfied with their current
accommodation representing 9.2% of all households in multiple occupation. This
compares with 2.7% of households living in single occupation dissatisfied;
606 households living in converted/mixed-use flats are dissatisfied with their
current accommodation representing 19.9% of all households living in
converted/mixed use flats. This compares with 3.5% of all private sector
households dissatisfied.

David Adamson & Partners Ltd. Page | 103
HOUSING CONDITIONS AND HOUSEHOLD CIRCUMSTANCES
AREA SATISFACTION AND AREA TRENDS
20.6 Household satisfaction with their local areas is also high. 42,849 households (72.5%) are
very satisfied with where they live; 13,565 households (22.9%) are quite satisfied. 2,588
households are dissatisfied with the area in which they live (4.4%). The majority of
households (54,519 households - 92.2%) regard their local area as largely unchanging over
the last 5 years; 1,697 households (2.9%) perceive their area as improving while 2,905
households (4.5%) perceive a decline in their local area.
FIGURE 72 : ATTITUDES TO LOCAL AREA AND AREA TRENDS
20.7 Again dissatisfaction levels are stronger again for households living in the private-rented
sector and in multiple occupation, and as a consequence within the converted flat market.
Perceptions of area decline are however more strongly held by owner-occupiers. Attitudes
to area change will be influenced by the highly transitional nature of the private-rented
sector compared to more established and stable owner-occupied areas. At a national level
a higher proportion of owner-occupiers (90%) are satisfied with their local area than private
renters (86%) (English Housing Survey, Households 2011-12).
20.8 Rates of area dissatisfaction geographically mirror the patterns for housing dissatisfaction
and are above average again in Abbey, Park, Redlands and Katesgrove wards.
72.5%
22.9%
4.4% 0.2%
ATTITUDES TO LOCAL AREA
Very Satisfied Quite Satisfied
Dissatisfied Don't Know
92.2%
2.9% 4.9%
AREA TRENDS
Remained the Same Improving Declining

David Adamson & Partners Ltd. Page | 104
HOUSING CONDITIONS AND HOUSEHOLD CIRCUMSTANCES
Perceptions of recent area decline are highest in Church, Katesgrove, Mapledurham, Park
and Redlands wards.
20.9 Relationships would appear to exist between the surveyor’s assessments of environmental
condition and household attitudes to their area. Thus:
8.3% of households living in areas with environmental problems are dissatisfied
with their local area. This compares with 3.2% of households living in areas with
no environmental problems.
11.1% of households living in areas with environmental problems perceive their
area to be declining. This compares with 6.8% of households living in areas with
no environmental problems.
AREA PROBLEMS
20.10 In addition to general area attitudes, households were prompted to comment on a range of
issues which might represent problems within their areas. Key issues emerging as
important include anti-social behaviour, youth annoyance, car and property crime, dog
fouling and litter/fly tipping.
0.7
0.7
2.3
2.5
5.9
6.8
7.1
8.7
10.8
11.3
12.4
13.5
13.6
0 5 10 15
Empty Properties
Racial Harrassment
Graffiti
Personal Asault/Theft
Traffic Noise
Drug Abuse/Dealing
Public Drinking
Litter/Fly Tipping
Car Crime
Dog Fouling
Anti-Social Behaviour
Youth Annoyance
Property Crime
% perceiving a problem
FIGURE 73: HOUSEHOLD PERCEPTION OF LOCAL PROBLEMS

David Adamson & Partners Ltd. Page | 105
HOUSING CONDITIONS AND HOUSEHOLD CIRCUMSTANCES
CRIME
20.11 Households were asked their views on personal safety and personal exposure to crime
within the past year. The majority of private sector households feel safe in their home at
night (55,214 households - 93.4%) and feel safe walking alone in daylight hours within their
residential area, to local shops and to the town centre. Feelings of un-safety do however
increase for movement around local areas after dark:
20.11 Households most likely to feel unsafe at night both in a residential area and walking to local
shops are those in Park, Whitley, Redlands and Battle where around a quarter of
households indicated they felt unsafe. Private-renters are also more likely to feel unsafe
than owner-occupiers. There was little difference in the proportions by age of head of
household who felt unsafe, although this result is difficult to interpret as almost half of those
aged 65 or over answered ‘don’t know’ compared with less than 10% of other age groups.
2.6
9.8
10.2
10.2
0 5 10 15
Unsafe in home at night
Unsafe walking alone to localshops after dark
Unsafe walking alone in towncentre after dark
Unsafe walking alone in residentialarea after dark
%
FIGURE 74: HOME AND LOCAL AREA SAFETY
KEY FACTS: 6,025 households (10.2%) feel unsafe walking alone in their residential area after
dark;
5,801 households (9.8%) feel unsafe walking alone to local shops after dark; 6,047 households (10.2%) feel unsafe walking alone in the town centre after dark.

David Adamson & Partners Ltd. Page | 106
HOUSING CONDITIONS AND HOUSEHOLD CIRCUMSTANCES
20.12 2,841 households (4.8%) stated that they had been a victim of crime within the past year.
The most common crimes relate to home burglary, anti-social behaviour, and the theft of
items from a car.
FIGURE 75 : EXPOSURE TO CRIME (Past Year)
95.2%
4.8%
EXPOSURE TO CRIME
No Yes
1.6
2.3
3.1
3.7
3.8
4.3
6.9
10.8
13.6
33.9
55.2
0 20 40 60
Violent Assualt
Domestic Violence
Sexual/Indecent Assault
Sexual/Indecent Assault
Fraud
Violent Assualt
Mugging/Robbery
Burglary
Car Theft
Anti-Social Behaviour
Theft of Items in Car
%
TYPE OF CRIME Base = 2,841 households victimised by crime
David Adamson & Partners Ltd. Page | 107
SECTION 6 :
SECTORAL REVIEW
Chapter 21 : Comparative Conditions - Owner-Occupied and
Private Rented Sectors
Chapter 22 : Owner-occupiers in Non-Decent Homes
Chapter 23 : The Private Rented Sector
Within this section a comparison of physical housing conditions and main household indicators
between the two main private sector tenures is provided. Each sector is then considered separately
with particular attention in the owner-occupied sector paid to improvement interventions and levels of
equity available. The final chapter considers just dwellings and households within the private rented
sector but looks at differences between those that are classified as HMOs and those that are not.

David Adamson & Partners Ltd. Page | 108
SECTORAL REVIEW
21. COMPARATIVE CONDITIONS - OWNER OCCUPIED AND PRIVATE RENTED SECTORS
21.1 Comparisons between the main private sector tenures have been made throughout this
report but are summarised for ease of reference in Figures 76 and 77 with regard to both
physical condition and household indicators.
PHYSICAL HOUSING CONDITIONS
21.2 Housing conditions are consistently worse for private-rented housing in Reading on all main
indicators of housing condition. Overall, 5,179 private-rented dwellings fail the Decent
Homes Standard representing 34.8% of all private rented dwellings. In comparison, 17.9%
of owner-occupied homes fail the Decent Homes Standard. The private rented sector
accounts for 28.5% of all private dwellings in Reading yet accounts for 42.4% of all
dwellings non-Decent and 44.6% of outstanding costs to meet Decency.
34.8
10.8
2.3
17
18.2
17.9
7.9
0.7
8.7
7
0 5 10 15 20 25 30 35 40
DECENT HOMES
Thermal Comfort
Amenities
Disrepair
Category 1 Hazard
% Non-Compliant
FIGURE 76 : HOUSING CONDITIONS IN THE OWNER-OCCUPIED AND PRIVATE RENTED SECTORS
Owner-Occupied
Private Rented

David Adamson & Partners Ltd. Page | 109
SECTORAL REVIEW
HOUSEHOLD CONDITIONS
21.3 Socio-economic differences between the sectors are equally marked demonstrating in
particular an older more established and stable owner-occupied sector against a younger,
mobile and disadvantaged private-rented sector. In addition to demographic differences the
private-rented sector exhibits higher levels of economic disadvantage as illustrated by
higher proportions of non-economically active population, low incomes and economic
vulnerability.
HOUSEHOLD ATTITUDES
21.4 Household attitudes to housing and local areas are less positive within the private-rented
sector. Private-rented dwellings are also more likely to be located in areas exhibiting
environmental problems.
15.3
68.6
26.4
17.1
20.4
2.7
4.6
44.8
2.8
35.6
6.1
3.3
11.2
22.5
2.7
0.2
29.2
1.2
17.1
31.3
6.7
1.5
0 10 20 30 40 50 60 70 80
Intending to move
Resident Under 3 years
Economically Vulnerable
Low Income
Student
Retired
Unemployed
BME
Elderly Household
Single Person Aged Under 60
Lone Parent Family
%
FIGURE 77 : HOUSEHOLD CIRCUMSTANCES IN THE OWNER-OCCUPIED AND PRIVATE-RENTED SECTORS
Owner-Occupier
Private-Rented

David Adamson & Partners Ltd. Page | 110
SECTORAL REVIEW
7.2
8.2
39.7
2.6
0.8
12.3
0 10 20 30 40 50
Dissatisfied with Local Area
Dissatisfied with Home
Environmental Problems
%
FIGURE 78 : HOUSEHOLDS ATTITUDES IN THE OWNER-OCCUPIED AND PRIVATE-RENTED SECTORS
Owner-Occupied
Private-Rented
David Adamson & Partners Ltd. Page | 111
SECTORAL REVIEW
22. OWNER-OCCUPIERS IN NON DECENT HOMES 22.1 Owner-occupied households were the focus of additional analyses during the house condition
survey. Areas of special interest have included:
a) Relationships between house condition and economic/social circumstances
guiding intervention and support strategies within the sector.
b) Past improvement histories and improvement intentions.
c) Attitudes to the funding of repairs/improvements including methods of payment
and interest in council loans or equity release. A desktop valuation of private
sector housing has also been completed providing indications of equity potential
when linked with information on mortgage holdings.
INTERVENTION FRAMEWORK
22.2 A potential framework for intervention within the owner-occupied sector is illustrated in Figure
79. Three main targets for support have been identified within this framework including:
Economically Vulnerable households;
Elderly households; non Economically Vulnerable; and
Families with Children; non Economically Vulnerable.
22.3 8,121 owner-occupied households (21.9%) live in homes which are non-decent with total
outstanding expenditure on decent homes improvements of £41.378M. 2,297 households
within this sector are economically vulnerable representing 28.3% of the total. Estimated
improvement expenditure for these households is £9.939M.

David Adamson & Partners Ltd. Page | 112
SECTORAL REVIEW
FIGURE 79 : OWNER-OCCUPIED INTERVENTION FRAMEWORK Base = Owner-occupied households in non-decent homes
OWNER-OCCUPIED
HOUSEHOLDS
CATEGORY 1 : ECONOMICALLY
VULNERABLE
CATEGORY 2 : ELDERLY - NON ECONOMICALLY
VULNERABLE
CATEGORY 3 : HOUSEHOLDS WITH
CHILDREN - NON ECONOMICALLY
VULNERABLE
CATEGORY 4 : REMAINING OWNER
OCCUPIED HOUSEHOLDS
NON DECENT
INVESTMENT
REQUIRED
: 8,121 h/holds (100.0%)
: £41.378M
(100.0%)
: 2,297 h/holds (28.3%)
: £9.939M (24.0%)
: 3,082 h/holds (37.9%)
: £17.652M (42.7%)
: 968 h/holds (11.9%)
: £6.265M
(15.1%)
: 1,775 h/holds
(26.5%)
: £7.521M (18.2%)
NON DECENT
INVESTMENT
REQUIRED
NON DECENT
INVESTMENT
REQUIRED
NON DECENT
INVESTMENT
REQUIRED
NON DECENT
INVESTMENT
REQUIRED

David Adamson & Partners Ltd. Page | 113
SECTORAL REVIEW
Among owner-occupied households living in non-decent conditions; 3,082 households (37.9%)
are elderly in composition but not economically vulnerable and 968 households (11.9%)
contain children. These households are not economically vulnerable by definition but may be
under pressure financially to improve and maintain their homes. Outstanding expenditure
against these groups to achieve the decent homes standard is estimated at £23.917M. All
target groups exhibit an over concentration in the pre-1919 terraced housing sector and in the
early post-war semi-detached housing market. At an area level the target groups show above
average concentrations in:
Economically Vulnerable: Kentwood, Southcote and Thames;
Elderly Non-Vulnerable: Caversham, Minster and Thames; and
Family Non-Vulnerable: Battle, Church, Park and Whitley.
OWNER-OCCUPIED ATTITUDES AND BEHAVIOUR
22.4 While economic factors will influence the ability of owner-occupiers to improve and repair their
homes, other factors will also impact. Housing satisfaction levels have been reported as high
and these are retained among owner-occupiers in non-Decent housing. 6,452 owner-
occupiers living in non-Decent housing (79.4%) are very satisfied with their current home, an
additional 1,495 households (18.4%) are quite satisfied. Only 175 owner-occupiers in non-
Decent homes (2.1%) expressed direct dissatisfaction with their current accommodation.
22.5 Against these attitudes to housing, previous and projected home improvement activity levels
among owner-occupiers remain mixed. 5,802 owner-occupiers in non-decent homes
(71.4%) have completed no major repairs/improvements in the last 5 years, 6,174
households (76.0%) have no intentions to carry out major repairs/improvements, within the
next 5 years.

David Adamson & Partners Ltd. Page | 114
SECTORAL REVIEW
FIGURE 80 : OWNER-OCCUPIED REPAIR ACTIVITY :
OWNER OCCUPIED HOUSEHOLDS IN NON-DECENT HOMES
22.6 Equity release remains a Government recommendation to achieve an increase in owner-
occupied funding for home improvement. The availability of equity and its use by owner-
occupiers is dependent upon three key factors:
a) The value of owner-occupied housing assets;
b) Existing owner-occupied mortgage holdings; and
c) Owner-occupied attitudes to the use of available equity for home improvement
purposes.
22.7 During the survey owner-occupiers were asked for information on their current mortgage
position. In support of this information a desktop valuation of private occupied homes was
completed from land registry sources. Property values less existing mortgage holdings
provide an indicator of equity potential.
22.8 19,074 owner-occupied households (51.5%) have existing mortgage or financial commitments
against their home. The remaining 17,988 households (48.5%) have no mortgage or financial
commitments. Among households with a mortgage, the average size of this mortgage is
estimated at £72,500 per household giving total mortgage holdings of £1.383 billion.
28.6%
71.4%
A. PREVIOUS REPAIRS/IMPROVEMENTS
Repairs/Improvements Completed
No Repairs/Improvements24.0%
76.0%
B. REPAIRS/IMPROVEMENTS INTENDED
Repairs/Improvements Intended
No Repairs/Improvements Intended

David Adamson & Partners Ltd. Page | 115
SECTORAL REVIEW
TABLE 20 : OWNER-OCCUPIED MORTGAGE HOLDINGS
OUTSTANDING MORTGAGE HOUSEHOLDS %
£’s…
No Mortgage Commitment 17988 48.5
5000 1933 5.2
10000 2264 6.1
22500 1994 5.4
37500 1334 3.6
52500 3377 9.1
67500 922 2.5
82500 923 2.5
105000 1046 2.8
130000 1422 3.8
155000 3121 8.4
185000 18 0.1
212500 578 1.6
250000 142 0.4
ALL HOUSEHOLDS 37062 100.0
22.9 Average owner-occupied property prices have been estimated from Land Registry sources
producing a valuation of owner-occupied housing of £7.402 billion. Compared with mortgage
holdings this provides an equity potential of £6.019 billion.
48.5%
51.5%
FIGURE 81 : OWNER OCCUPIED MORTGAGE STATUS
No Mortgage Holdings : 17,988 hholds
Mortgage Held : 19,074 hholds

David Adamson & Partners Ltd. Page | 116
SECTORAL REVIEW
Given the significant difference between property values and mortgage holdings, equity
potential exists across all areas and sub-sectors of the owner-occupied housing market. Of
importance within the equity equation owner-occupied households living in non-decent
housing hold an equity potential of £1.310 billion.
22.10 Equity potential exhibits a strong relationship to household age and household type. In this
respect equity levels increase significantly with age and are higher for elderly households as
opposed to younger single person and family households.
7.402
1.383
6.019
0
1
2
3
4
5
6
7
8
Property Valuation Mortgage Holdings Equity Potential
£'s
Bil
lio
n
FIGURE 82 : MORTGAGE, VALUATION AND EQUITY
135499
65016
120204
181557
203317 197847
0
50000
100000
150000
200000
250000
Under 25Years
25-34 Years 35-44 Years 45-54 Years 55-64 Years 65+ Years
Avera
ge E
qu
ity (
£'s
)
AGE OF HEAD OF HOUSEHOLD
FIGURE 83 : RELATIONSHIPS BETWEEN HEAD OF HOUSEHOLD AGE AND HOUSING EQUITY

David Adamson & Partners Ltd. Page | 117
SECTORAL REVIEW
22.11 A central issue locally is not the undoubted existence of owner-occupied property equity but
the release of this equity for home improvement/repair activity. Households were questioned
on their attitudes to such release. 2,565 households (6.9%) stated that they would re-
mortgage their dwelling for home improvements. A larger number of households - 3,145
households (8.5%) - were interested in repayable interest free loans provided by the Council.
Among owner-occupied households living in non-Decent homes 9.5% stated that they would
re-mortgage for home improvements, 17.4% are interested in Council interest free loans.
FIGURE 84 : OWNER-OCCUPIED INTEREST IN EQUITY
RELEASE AND COUNCIL LOAN
6.9%
93.1%
A. RE-MORTGAGE FOR HOME IMPROVEMENTS
Yes No
8.5%
91.5%
B. INTERESTED IN COUNCIL INTEREST FREE LOANS
Yes No

David Adamson & Partners Ltd. Page | 118
SECTORAL REVIEW
23. THE PRIVATE RENTED SECTOR 23.1 Excluding vacant dwellings, where tenure was unobtainable, the private rented sector in
Reading is estimated to contain 14,864 dwellings or 28.4% of all private sector housing.
Rates of private rental within the Borough have been growing in recent years and are
significantly above the national average.
HOUSING DISTRIBUTIONS
23.2 The private-rented sector exhibits a three-fold concentration within the Reading housing
market represented by:
a) Pre-1919 terraced housing, occupied both in single and multiple occupation.
b) Pre-1919 converted/mixed-use flats, largely in multiple occupation.
c) Post-war purpose built flats, largely in single occupation and constructed post-
1981.
5,007 private-rented dwellings (33.7%) are pre-1919 houses/bungalows; 2,536 private-
rented dwellings (17.1%) are in flats in converted/mixed use buildings and 5,447 private-
rented dwellings (36.6%) are post-war purpose built flats.
23.3 Geographically, the private-rented sector exhibits a concentrated distribution centred on the
five wards of Abbey, Battle, Katesgrove, Park, Redlands. Within this distribution post-war
purpose built flats show a particular concentration in Abbey Ward, pre-1919
converted/mixed-use flats are particularly concentrated in Park, Abbey and Battle wards.

David Adamson & Partners Ltd. Page | 119
SECTORAL REVIEW
TABLE 21 : PRIVATE RENTED SECTOR HOUSING ARCHETYPE DISTRIBUTION
HOUSING ARCHETYPE
PRIVATE RENTED ALL PRIVATE
RENTED NON HMO HMO
dwgs % dwgs % dwgs %
1. Pre-1919 Terraced House/Bungalow 3569 34.5 1438 31.8 5007 33.7
2. Inter-War Terraced House/Bungalow 111 1.1 24 0.5 135 0.9
3. Post-War Terraced House/Bungalow 521 5.0 0 0.0 521 3.5
4. Pre-1919 S.Det/Det House/Bungalow 389 3.8 404 8.9 793 5.3
5. Inter-War S.Det/Det House/Bungalow 0 0.0 0 0.0 0 0.0
6. Post-War S.Det/Det House/Bungalow 0 0.0 0 0.0 0 0.0
7. Pre-1919 Purpose Built Flat 38 0.4 0 0.0 38 0.3
8. Inter-War Purpose Built Flat 73 0.7 0 0.0 73 0.5
9. Post-War Purpose Built Flat 5447 52.6 0 0.0 5447 36.6
10. Pre-1919 Converted/Mixed Use Flat 172 1.7 2364 52.3 2536 17.1
11. Inter-War Converted/Mixed Use Flat 0 0.0 75 1.7 75 0.5
12. Post-War Converted/Mixed Use Flat 27 0.3 212 4.7 239 1.6
ALL ARCHETYPES 10347 100.0 4517 100.0 14864 100.0
HOUSEHOLDS
23.4 The private-rented sector contains 22,059 households. Differences in household
composition within the private-rented sector in general reflect a younger household structure
but with internal variations also apparent within the sector between post-war purpose built
flats in single occupation and pre-1919 converted/mixed-use flats in multiple occupation.
Households living in private-rented HMO accommodation are typically young single person
households. 78% of such households are single person in size, 51% have a head of
household aged under 25 years. This profile broadens for households living in single
occupation where 75% have a head of households aged 25-44 years and 58% contain two
or three persons. Private-rented households in single occupation exhibit higher levels of
employment (77%) but also low incomes and economic vulnerability.
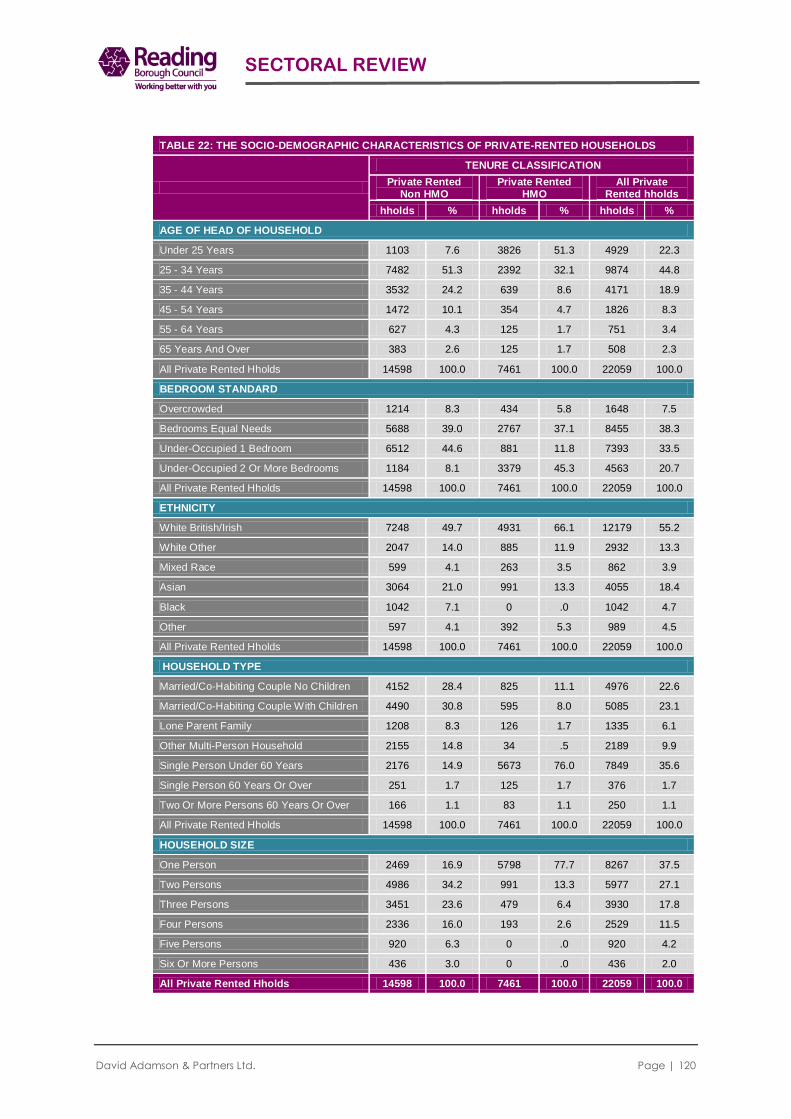
David Adamson & Partners Ltd. Page | 120
SECTORAL REVIEW
TABLE 22: THE SOCIO-DEMOGRAPHIC CHARACTERISTICS OF PRIVATE-RENTED HOUSEHOLDS
TENURE CLASSIFICATION
Private Rented Non HMO
Private Rented HMO
All Private Rented hholds
hholds % hholds % hholds %
AGE OF HEAD OF HOUSEHOLD
Under 25 Years 1103 7.6 3826 51.3 4929 22.3
25 - 34 Years 7482 51.3 2392 32.1 9874 44.8
35 - 44 Years 3532 24.2 639 8.6 4171 18.9
45 - 54 Years 1472 10.1 354 4.7 1826 8.3
55 - 64 Years 627 4.3 125 1.7 751 3.4
65 Years And Over 383 2.6 125 1.7 508 2.3
All Private Rented Hholds 14598 100.0 7461 100.0 22059 100.0
BEDROOM STANDARD
Overcrowded 1214 8.3 434 5.8 1648 7.5
Bedrooms Equal Needs 5688 39.0 2767 37.1 8455 38.3
Under-Occupied 1 Bedroom 6512 44.6 881 11.8 7393 33.5
Under-Occupied 2 Or More Bedrooms 1184 8.1 3379 45.3 4563 20.7
All Private Rented Hholds 14598 100.0 7461 100.0 22059 100.0
ETHNICITY
White British/Irish 7248 49.7 4931 66.1 12179 55.2
White Other 2047 14.0 885 11.9 2932 13.3
Mixed Race 599 4.1 263 3.5 862 3.9
Asian 3064 21.0 991 13.3 4055 18.4
Black 1042 7.1 0 .0 1042 4.7
Other 597 4.1 392 5.3 989 4.5
All Private Rented Hholds 14598 100.0 7461 100.0 22059 100.0
HOUSEHOLD TYPE
Married/Co-Habiting Couple No Children 4152 28.4 825 11.1 4976 22.6
Married/Co-Habiting Couple With Children 4490 30.8 595 8.0 5085 23.1
Lone Parent Family 1208 8.3 126 1.7 1335 6.1
Other Multi-Person Household 2155 14.8 34 .5 2189 9.9
Single Person Under 60 Years 2176 14.9 5673 76.0 7849 35.6
Single Person 60 Years Or Over 251 1.7 125 1.7 376 1.7
Two Or More Persons 60 Years Or Over 166 1.1 83 1.1 250 1.1
All Private Rented Hholds 14598 100.0 7461 100.0 22059 100.0
HOUSEHOLD SIZE
One Person 2469 16.9 5798 77.7 8267 37.5
Two Persons 4986 34.2 991 13.3 5977 27.1
Three Persons 3451 23.6 479 6.4 3930 17.8
Four Persons 2336 16.0 193 2.6 2529 11.5
Five Persons 920 6.3 0 .0 920 4.2
Six Or More Persons 436 3.0 0 .0 436 2.0
All Private Rented Hholds 14598 100.0 7461 100.0 22059 100.0

David Adamson & Partners Ltd. Page | 121
SECTORAL REVIEW
TABLE 23: THE ECONOMIC CHARACTERISTICS OF PRIVATE-RENTED HOUSEHOLDS
tenure classification
Private Rented Non HMO
Private Rented HMO
All Private rented hholds
hholds % hholds % hholds %
ECONOMIC STATUS HOH
Full-Time Work 10076 69.0 2945 39.5 13021 59.0
Part-Time Work 1190 8.2 125 1.7 1315 6.0
Unemployed-Registered 833 5.7 192 2.6 1025 4.6
Permanently Sick/Disabled 153 1.0 90 1.2 243 1.1
Looking After Home 1192 8.2 0 .0 1192 5.4
Wholly Retired 419 2.9 166 2.2 585 2.7
Student 567 3.9 3942 52.8 4509 20.4
Not Applicable 0 .0 0 .0 0 .0
Unobtainable 168 1.2 0 .0 168 .8
All Private Rented Hholds 14598 100.0 7461 100.0 22059 100.0
LOW INCOME HOUSEHOLDS
Not On Low Income 12828 87.9 5452 73.1 18280 82.9
Low Income Household 1770 12.1 2009 26.9 3779 17.1
All Private Rented Hholds 14598 100.0 7461 100.0 22059 100.0
VULNERABLE HOUSEHOLDS
Not Economically Vulnerable 9306 63.8 6925 92.8 16232 73.6
Economically Vulnerable 5292 36.2 536 7.2 5827 26.4
All Private Rented Hholds 14598 100.0 7461 100.0 22059 100.0
HOUSING CONDITIONS
23.5 Housing conditions within the private-rented sector are worse on all main indicators.
Overall, rates of non-decency within the sector at 34.8% are significantly higher than the
Borough-wide private-sector average of 23.4% and an average of 17.9% for owner-occupied
dwellings. Poor housing conditions are compounded within the private-rented HMO sector.

David Adamson & Partners Ltd. Page | 122
SECTORAL REVIEW
HOUSEHOLD CONDITIONS
23.6 5,827 private rented sector households are economically vulnerable representing 26.4% of
all households in the sector. Currently 3,653 economically vulnerable households in the
private rented sector live in decent homes representing (62.7%) of all vulnerable
households. 2,174 vulnerable households (37.3%) live in homes which are non-decent.
Costs to address non-decent homes occupied by vulnerable households in the private-
rented sector are estimated at £15.639M averaging £7,192 per vulnerable household.
Overall costs to address non-decency within the private-rented sector are estimated at
£38.216M.
23.7 Higher levels of socio-economic disadvantage in the private-rented sector contribute
towards higher levels of fuel poverty even though variations in energy efficiency between
tenures are marginal. 6,627 private rented households are in fuel poverty representing
30.0% of all households in the private-rented sector. This compares with 10.6% of owner-
occupied households in fuel poverty. Income levels within the private-rented sector
contribute to fuel poverty. In this respect an average income of £28,564 for private rented
households compares with £33,528 for owner-occupied households. Average income for
private-rented tenants in multiple occupation drops to just over £20,000 - fuel poverty rates
increase to 49.9%.
42.9
3.4
8.1
21.4
26.4
31.4
1.9
12
15.1
14.6
17.9
0.7
7.9
8.7
7
0 10 20 30 40 50
Overall Decent Homes
Decent Homes Amenity
Decent Homes Thermal Comfort
Decent Homes Repair
Category 1 Hazards
%
FIGURE 85 : COMPARATIVE CONDITIONS IN THE PRIVATE RENTED SECTOR
Owner-Occupied
Private-Rented Non HMO
Private Rented-HMO

David Adamson & Partners Ltd. Page | 123
SECTORAL REVIEW
TENANT ATTITUDES - HOME AND AREA
23.8 Tenant attitudes to private-rented accommodation are on balance positive with limited
difference between the HMO and non-HMO sectors. Attitudes are however less positive
than for owner-occupiers. 1,806 private-rented tenants (8.2%) were dissatisfied with their
current accommodation compared to under 1% of owner-occupiers. 1,594 private-rented
tenants (7.2%) were dissatisfied with their local areas. This compares to 2.6% of owner-
occupiers.
10.6
17.9
19.9
30
49.9
0 10 20 30 40 50 60
Owner-Occupied
All Tenures
Private-Rented Non-HMO
All Private-Rented
Private-Rented HMO
% fuel poor
FIGURE 86 : FUEL POVERTY BY TENURE
0.8
2.6
8.2
7.2
0 2 4 6 8 10
Dissatisfied with current home
Dissatisfied with local area
%
FIGURE 87 : ATTITUDES TO HOME AND LOCAL AREA
Private-Rented
Owner-occupied

David Adamson & Partners Ltd. Page | 124
SECTORAL REVIEW
REPAIR CONDITION
23.9 Private-rented tenants were additionally asked their views on the repair condition of their
current home. 18,190 tenants (82.5%) regard conditions as good; 2,126 tenants (9.6%)
regard conditions as poor while 1,744 tenants (7.9%) were unsure. Perceptions of poor
condition are significantly higher in the pre-1919 terraced housing and converted flat
sectors.
23.10 Irrespective of current condition 6,001 private-rented tenants (27.2%) have informed their
landlord or agent about outstanding repair issues. In 60% of cases (3,580 households)
these issues had been or were being addressed. For the remaining 40% of tenants (2,421
households) issues remain unaddressed.
FIGURE 89 : LANDLORD CONTACT AND RESPONSE
82.5%
9.6%
7.9%
FIGURE 88 : PRIVATE-RENTED TENANTS - ATTITUDES TO HOUSE CONDITION
Good Condition Poor Condition Don't Know
27.2%
64.8%
8.0%
A. LANDLORD CONTACT FOR REPAIR ISSUES
Contact Made: 6,001 households
No Contact with Landlord: 14,288 households
Don't Know: 1,770 households
60.0%
40.0%
B. LANDLORD RESPONSE Base = 6,001 contacting hosueholds
Issues Addressed
Issues Not Addressed

David Adamson & Partners Ltd. Page | 125
SECTION 7 :
CONCLUSIONS
Chapter 24: Conclusions

David Adamson & Partners Ltd. Page | 126
CONCLUSIONS
24. CONCLUSIONS
24.1 This report has presented the findings of a comprehensive survey of housing and household
conditions in the Borough of Reading. The survey provides an update on changes in
housing conditions since the last major survey in 2006 and creates an important new
benchmark for the refinement and further development of private sector housing strategies.
24.2 The survey has been conducted across a private sector housing stock of 52,236 dwellings
containing 59,121 households and a household population of 143,462 persons. Private
sector housing stock has witnessed significant changes in composition since 2006. These
changes in particular have seen a growth in private-rental and multiple occupation at the
expense of the owner-occupied sector. Private-rented dwellings now comprise 28% of the
Borough’s private sector housing stock; 5,241 dwellings (10%) fall within the definition of a
house in multiple occupation.
24.3 Housing conditions in Reading have improved since 2006 and are better than the national
average for private housing in England. The number of non-Decent homes has declined
from 20,500 dwellings in 2006 to 12,200 dwellings in 2013 : a reduction of 8,300 non-Decent
homes or 40%. Over the same period rates of non-Decency have declined from 40.2% to
23.4% of private sector housing. Levels of Category 1 Hazard failure have remained static
but all other areas of the Decent Homes Standard register improvement. The most
significant impact on Decent Homes improvement is thermal comfort which has seen an
increase in the average SAP rating of private dwellings from 51 in 2006 to 66 in 2013 - an
increase of just under 30%. All main tenure sectors have benefited from improvements in
housing conditions although the most significant improvements have been in the owner-
occupied sector where rates of non-Decency have reduced from 35% in 2006 to 18% in
2013.
24.4 In spite of improvements in housing conditions significant issues remain to be addressed in
the private housing sector. 12,200 dwellings (23.4%) fail the requirements of the Decent
Homes Standard with estimated improvement costs of £85.599M net. Within the Decent
Homes Standard:
5,265 dwellings (10.1%) exhibit Category 1 hazards within the Housing Health and
Rating System (HHSRS);
6,164 dwellings (11.8%) are in disrepair and at risk of future deterioration; and
4,531 dwellings (8.7%) fail to provide a reasonable degree of thermal comfort.

David Adamson & Partners Ltd. Page | 127
CONCLUSIONS
24.5 Poor housing conditions vary across the housing stock and also geographically across the
Borough indicating an initial intervention framework:
The private-rented sector - 5,179 dwellings non-Decent (34.8%);
HMO’s - 2,275 dwellings non-Decent (43.4%);
Flats in converted buildings - 1,176 dwellings non-Decent (54.3%); and
Dwellings constructed pre-1919 - 6,339 dwellings non-Decent (43.1%).
Geographically, highest rates of Decent Homes failure are recorded for the wards of Battle,
Park, Caversham and Redlands. The most serious condition problems related to combined
above average Category 1 Hazard failure and disrepair are found in Abbey, Battle, Park and
Redlands wards. Poor environmental conditions are also apparent within these areas.
24.6 Physical housing conditions are compounded by the social and economic circumstances of
private sector households. Poor housing conditions are over-represented in economically
and socially disadvantaged households including younger single person households, single
parent families, elderly households, the economically vulnerable and those on low incomes.
14,184 private sector households are economically vulnerable representing 24% of all
private sector households. 9,712 economically vulnerable households (68.5%) live in
Decent homes - a figure below previous PSA Target 7 requirements for 2011 and 2021.
Key sectors remaining below target include the private-rented HMO sector largely located
within the pre-1919 converted flat market.
24.7 In spite of significant improvements in energy efficiency since 2006 levels of fuel poverty
within the Borough have increased largely in response to increasing energy tariffs and the
underlying economic circumstances of households in fuel poverty. 10,573 households in
Reading (17.9%) spend in excess of 10% of annual income in meeting fuel costs and are in
fuel poverty. This figure has increased from 11% of private sector households fuel poor in
2006. Fuel poverty impacts most strongly on younger and older households, on the private-
rented and HMO sectors and geographically on Church, Katesgrove, Park and Redlands
wards.
24.8 10% of private sector households in Reading (10.4%) have at least one household member
affected by a long-term illness or disability with the most common complaints related to a
physical disability or mobility impairment, respiratory illness and heart/circulatory problems.
The impact of illness/disability on local health resources is considerable - 4,651 households
with an illness/disability (75.4%) have made a surgery visit to their GP, a further 1,009
households (16.3%) have arranged a home visit from their GP and 3,229 households
(52.3%) have attended hospital as an outpatient. Using the HHSRS as a condition indicator

David Adamson & Partners Ltd. Page | 128
CONCLUSIONS
statistically significant correlations exist between housing conditions, household health and
health service contact. Furthermore, 9% of households living in non-Decent Homes regard
housing conditions as impacting negatively on family health. Using evidence from national
research, one-off intervention to address Category 1 Hazards will attract annual NHS
savings of £0.458M and annual total savings to society of £0.688M.
24.9 In spite of improvements in owner-occupied housing conditions 8,121 owner-occupied
households (21.9%) still live in homes which are non-Decent. 2,297 households within this
sector are economically vulnerable representing 28.3% of the total. 71% of owner-occupiers
in non-Decent homes have completed no major repairs/improvements in the last 5 years
and 76% have no intention to carry out future major repairs/improvements within the next 5
years. Almost 50% of owner-occupiers have no mortgage or financial commitments against
their homes and equity levels are high across the sector. 9% of owner-occupiers living in
non-Decent homes would re-mortgage for home improvements, 17% are interested in
Council interest-free loans.
24.10 Conditions within the private-rented sector remain the most problematic and in particular in
the HMO component of this sector. Survey data supports the need for a continuation of the
Council’s mandatory licensing scheme and possible extensions to this scheme against the
increasing size and spread of the HMO sector.

David Adamson & Partners Ltd. Page | 129
LIST OF TABLES AND FIGURES

David Adamson & Partners Ltd. Page | 130
LIST OF TABLES AND FIGURES
LIST OF TABLES
Table 1 : Housing Characteristics by Tenure .......................................................................... 27
Table 2 : Private Sector Households by Age of Head of Household and Household Type....... 30
Table 3 : Ethnic Origin ........................................................................................................... 31
Table 4 : Residential Mobility ................................................................................................. 32
Table 5 : Changes in Private Sector Housing Conditions 2006 - 2013 .................................... 43
Table 6 : HHSRS - Hazard Groupings.................................................................................... 47
Table 7 : Hazard Bandings and Hazard Categorisation .......................................................... 48
Table 8 : Dwellings Defective on Decent Homes Repair - Primary Building Element
Performance ........................................................................................................... 54
Table 9 : Dwellings Defective on Decent Homes Repair - Secondary Building Element
Performance ........................................................................................................... 55
Table 10 : Energy Efficiency Ratings (EER) Reading and England ........................................... 66
Table 11 : Non-Decent Dwellings - Defect Classification .......................................................... 72
Table 12 : Non-Decent Dwellings - Costs to Achieve Decency ................................................. 74
Table 13 : Costs to Achieve Decency by Housing Sector ......................................................... 75
Table 14 : Household Social Characteristics by Housing Condition .......................................... 82
Table 15 : Household Economic Characteristics by Housing Condition .................................... 83
Table 16 : Vulnerable Households - Decent Homes by Tenure, Type, Age and
Occupancy .............................................................................................................. 84
Table 17 : Households with Illness/Disability - Health Service Action within Past Year ............. 95
Table 18 : Correlation Matrix - Housing Conditions, Household Health and Health
Service Contact ...................................................................................................... 96
Table 19 : The Costs and Benefits to the NHS of Housing Intervention .................................. 100
Table 20 : Owner-Occupied Mortgage Holdings ..................................................................... 115
Table 21 : Private Rented Sector Housing Archetype Distribution .......................................... 119
Table 22 : The Socio-Demographic Characteristics of Private-Rented Households ................ 120
Table 23 : The Economic Characteristics of Private-Rented Households................................ 121

David Adamson & Partners Ltd. Page | 131
LIST OF TABLES AND FIGURES
LIST OF FIGURES
Figure 1 : Sample Targeting.................................................................................................... 16
Figure 2 : Private Sector Housing by Electoral Ward ............................................................... 20
Figure 3 : Housing Occupancy ................................................................................................ 22
Figure 4 : Housing Age Distributions ....................................................................................... 23
Figure 5 : Housing Tenure Distributions .................................................................................. 23
Figure 6 : Tenure Trends 2006 - 2013 ..................................................................................... 24
Figure 7 : Building Types ........................................................................................................ 25
Figure 8 : Houses in Multiple Occupation ................................................................................ 26
Figure 9 : The Distribution of Private-Rented Housing ............................................................. 28
Figure 10 : HMO Distribution..................................................................................................... 28
Figure 11 : Household Size ....................................................................................................... 29
Figure 12 : Ethnic Origin ........................................................................................................... 30
Figure 13 : Household Occupancy ............................................................................................ 31
Figure 14 : Households Resident Under 2 Years ....................................................................... 33
Figure 15 : Socio-Demographic Variations by Tenure and Occupancy ...................................... 34
Figure 16 : Economic Status of Head of Household .................................................................. 35
Figure 17 : Economic Variations by Tenure and Occupancy ...................................................... 36
Figure 18 : Economically Vulnerable and Low Income Households by Household Type ............ 37
Figure 19 : The Distribution of Economically Vulnerable Households ........................................ 38
Figure 20 : The Distribution of Low Income Households ............................................................ 38
Figure 21 : Dwelling Performance Against the Decent Homes Standard .................................... 41
Figure 22 : Local Conditions in a National Context .................................................................... 42
Figure 23 : Trends in Private Sector Housing Conditions ........................................................... 44
Figure 24 : Trends in Decent Homes Non-Compliance 2006 - 2013 by Tenure .......................... 45
Figure 25 : Category 1 Hazard Failure ...................................................................................... 49
Figure 26 : Category 1 Hazards by Hazard Type ....................................................................... 50
Figure 27 : Category 1 Hazard Failure by Tenure, Occupancy, Building Type and Date of
Construction ........................................................................................................... 51
Figure 28 : The Distribution of Category 1 Hazards ................................................................... 52
Figure 29 : Decent Homes Repair Performance ........................................................................ 54
Figure 30 : Decent Homes Repair Performance by Tenure, Occupancy, Building Type and Date
of Construction ........................................................................................................ 56
Figure 31 : Decent Homes Repair Non-Compliance by Ward .................................................... 57
Figure 32 : Physical Condition Intervention Framework ............................................................. 58
Figure 33 : Sectoral Classification of Intervention Potential ....................................................... 59
Figure 34 : Decent Homes Amenity Performance ...................................................................... 61
Figure 35 : Core Home Security Measures ............................................................................... 61
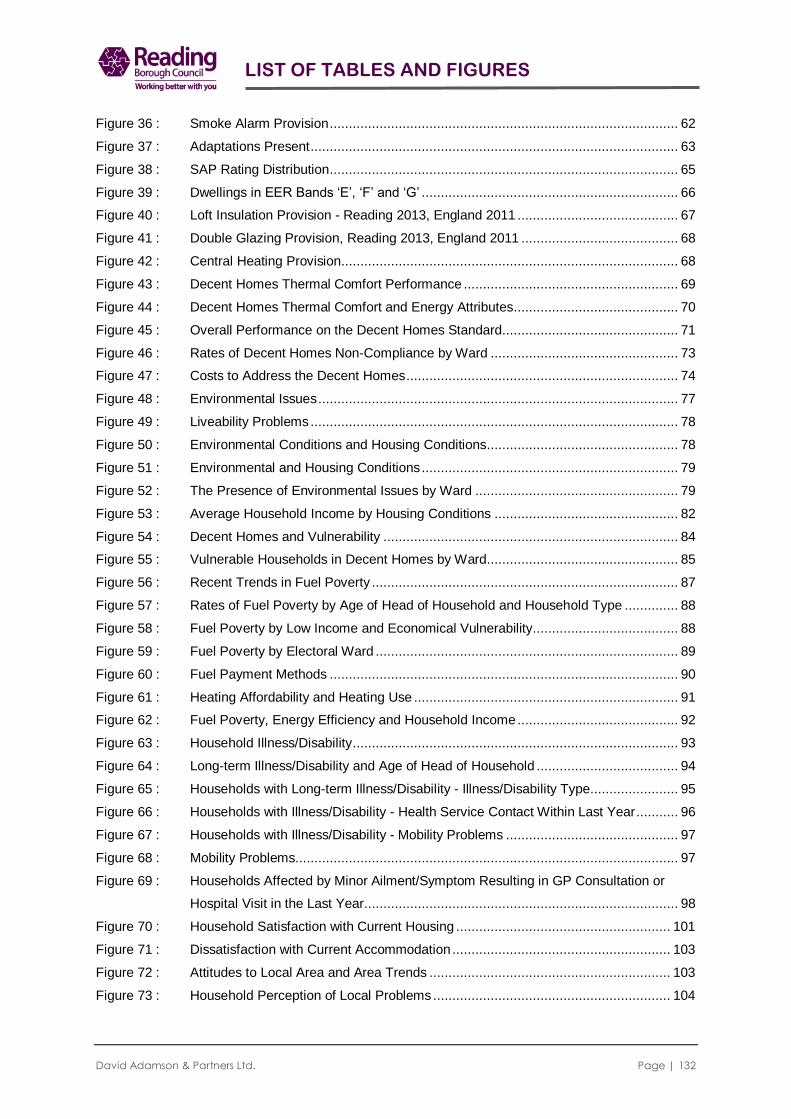
David Adamson & Partners Ltd. Page | 132
LIST OF TABLES AND FIGURES
Figure 36 : Smoke Alarm Provision ........................................................................................... 62
Figure 37 : Adaptations Present ................................................................................................ 63
Figure 38 : SAP Rating Distribution ........................................................................................... 65
Figure 39 : Dwellings in EER Bands ‘E’, ‘F’ and ‘G’ ................................................................... 66
Figure 40 : Loft Insulation Provision - Reading 2013, England 2011 .......................................... 67
Figure 41 : Double Glazing Provision, Reading 2013, England 2011 ......................................... 68
Figure 42 : Central Heating Provision ........................................................................................ 68
Figure 43 : Decent Homes Thermal Comfort Performance ........................................................ 69
Figure 44 : Decent Homes Thermal Comfort and Energy Attributes ........................................... 70
Figure 45 : Overall Performance on the Decent Homes Standard.............................................. 71
Figure 46 : Rates of Decent Homes Non-Compliance by Ward ................................................. 73
Figure 47 : Costs to Address the Decent Homes ....................................................................... 74
Figure 48 : Environmental Issues .............................................................................................. 77
Figure 49 : Liveability Problems ................................................................................................ 78
Figure 50 : Environmental Conditions and Housing Conditions.................................................. 78
Figure 51 : Environmental and Housing Conditions ................................................................... 79
Figure 52 : The Presence of Environmental Issues by Ward ..................................................... 79
Figure 53 : Average Household Income by Housing Conditions ................................................ 82
Figure 54 : Decent Homes and Vulnerability ............................................................................. 84
Figure 55 : Vulnerable Households in Decent Homes by Ward.................................................. 85
Figure 56 : Recent Trends in Fuel Poverty ................................................................................ 87
Figure 57 : Rates of Fuel Poverty by Age of Head of Household and Household Type .............. 88
Figure 58 : Fuel Poverty by Low Income and Economical Vulnerability ...................................... 88
Figure 59 : Fuel Poverty by Electoral Ward ............................................................................... 89
Figure 60 : Fuel Payment Methods ........................................................................................... 90
Figure 61 : Heating Affordability and Heating Use ..................................................................... 91
Figure 62 : Fuel Poverty, Energy Efficiency and Household Income .......................................... 92
Figure 63 : Household Illness/Disability ..................................................................................... 93
Figure 64 : Long-term Illness/Disability and Age of Head of Household ..................................... 94
Figure 65 : Households with Long-term Illness/Disability - Illness/Disability Type....................... 95
Figure 66 : Households with Illness/Disability - Health Service Contact Within Last Year ........... 96
Figure 67 : Households with Illness/Disability - Mobility Problems ............................................. 97
Figure 68 : Mobility Problems.................................................................................................... 97
Figure 69 : Households Affected by Minor Ailment/Symptom Resulting in GP Consultation or
Hospital Visit in the Last Year .................................................................................. 98
Figure 70 : Household Satisfaction with Current Housing ........................................................ 101
Figure 71 : Dissatisfaction with Current Accommodation ......................................................... 103
Figure 72 : Attitudes to Local Area and Area Trends ............................................................... 103
Figure 73 : Household Perception of Local Problems .............................................................. 104

David Adamson & Partners Ltd. Page | 133
LIST OF TABLES AND FIGURES
Figure 74 : Home and Local Area Safety................................................................................. 105
Figure 75 : Exposure to Crime (Last Year) .............................................................................. 106
Figure 76 : Housing Conditions in the Owner-Occupied and Private-Rented Sectors ............... 108
Figure 77 : Household Circumstances in the Owner-Occupied and Private-Rented Sectors .... 109
Figure 78 : Household Attitudes in the Owner-Occupied and Private-Rented Sectors .............. 110
Figure 79 : Owner-Occupied Intervention Framework ............................................................. 112
Figure 80 : Owner-Occupied Repair Activity : Owner-Occupied Households in Non-Decent
Homes .................................................................................................................. 114
Figure 81 : Owner-Occupied Mortgage Status ........................................................................ 115
Figure 82 : Mortgage, Valuation and Equity............................................................................. 116
Figure 83 : Relationship Between Head of Household Age and Housing Equity ...................... 116
Figure 84 : Owner-Occupied Interest in Equity Release and Council Loan .............................. 117
Figure 85 : Comparative Conditions in the Private Rented Sector............................................ 122
Figure 86 : Fuel Poverty by Tenure ......................................................................................... 123
Figure 87 : Attitudes to Home and Local Area ......................................................................... 123
Figure 88 : Private-Rented Tenants - Attitudes to House Condition ......................................... 124
Figure 89 : Landlord Contact and Response ........................................................................... 124

David Adamson & Partners Ltd. Page | 134
APPENDICES
APPENDICES
Appendix A : The Interpretation of Statistical Data
Appendix B : Sampling Errors
Appendix C : Survey Questionnaire
Appendix D : The Decent Homes Standard
Appendix E : Glossary of Terms

David Adamson & Partners Ltd. Page | 135
APPENDICES
APPENDIX A : THE INTERPRETATION OF STATISTICAL DATA
Survey data is based on sample survey investigation and the application of statistical grossing
procedures to replicate housing stock totals. Interpretation of survey data must be conducted against
this background and particularly with regard to the following constraints:
a) Data estimates are mid point estimates within a range of sampling error. Sampling
errors are discussed in Appendix B but are dependent on two factors - the sample size
employed and the number or percentage of dwellings exhibiting the attribute in
question.
b) Data estimates are subject to rounding errors associated with statistical grossing.
Table totals will therefore not necessarily remain consistent throughout the report but
will normally vary by under 1%.
c) Survey returns from large-scale sample surveys invariably contain elements of missing
data. These may be due to surveyor error, differential access within dwellings or
individual elements which are not present in all dwellings. Consistently across the
survey, missing data has been kept to a minimum and represents under 2% of returns.
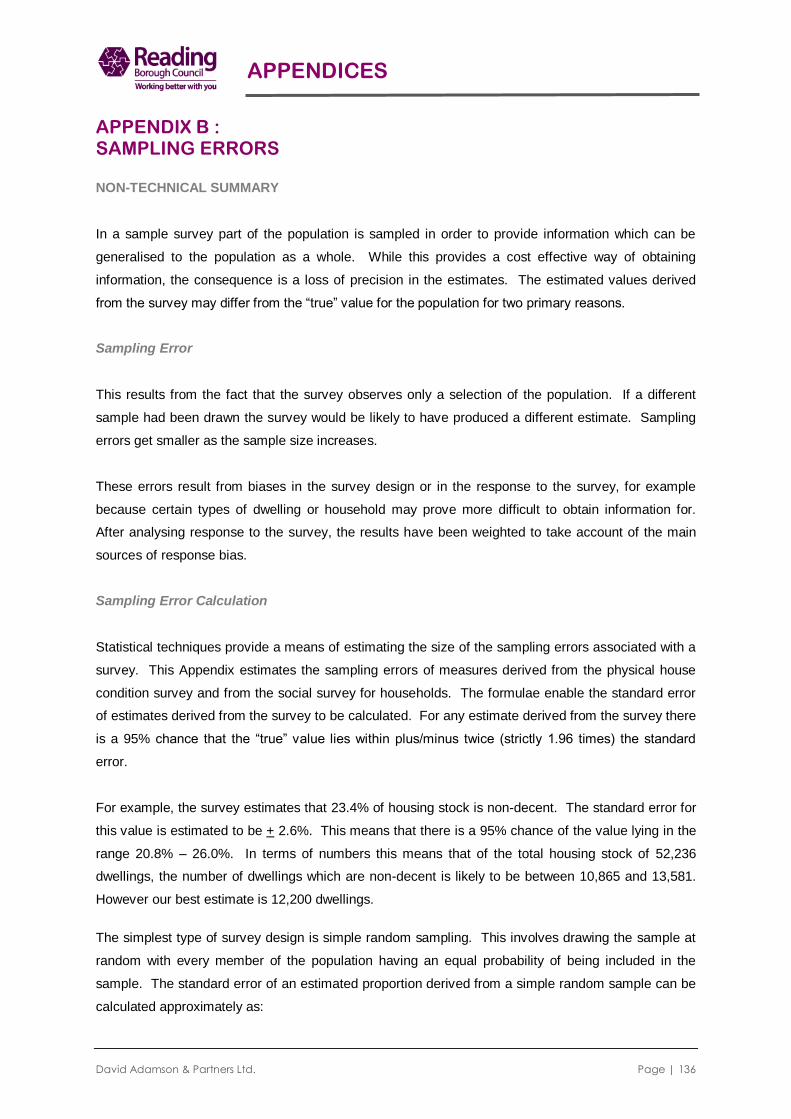
David Adamson & Partners Ltd. Page | 136
APPENDICES
APPENDIX B : SAMPLING ERRORS
NON-TECHNICAL SUMMARY
In a sample survey part of the population is sampled in order to provide information which can be
generalised to the population as a whole. While this provides a cost effective way of obtaining
information, the consequence is a loss of precision in the estimates. The estimated values derived
from the survey may differ from the “true” value for the population for two primary reasons.
Sampling Error
This results from the fact that the survey observes only a selection of the population. If a different
sample had been drawn the survey would be likely to have produced a different estimate. Sampling
errors get smaller as the sample size increases.
These errors result from biases in the survey design or in the response to the survey, for example
because certain types of dwelling or household may prove more difficult to obtain information for.
After analysing response to the survey, the results have been weighted to take account of the main
sources of response bias.
Sampling Error Calculation
Statistical techniques provide a means of estimating the size of the sampling errors associated with a
survey. This Appendix estimates the sampling errors of measures derived from the physical house
condition survey and from the social survey for households. The formulae enable the standard error
of estimates derived from the survey to be calculated. For any estimate derived from the survey there
is a 95% chance that the “true” value lies within plus/minus twice (strictly 1.96 times) the standard
error.
For example, the survey estimates that 23.4% of housing stock is non-decent. The standard error for
this value is estimated to be + 2.6%. This means that there is a 95% chance of the value lying in the
range 20.8% – 26.0%. In terms of numbers this means that of the total housing stock of 52,236
dwellings, the number of dwellings which are non-decent is likely to be between 10,865 and 13,581.
However our best estimate is 12,200 dwellings.
The simplest type of survey design is simple random sampling. This involves drawing the sample at
random with every member of the population having an equal probability of being included in the
sample. The standard error of an estimated proportion derived from a simple random sample can be
calculated approximately as:

David Adamson & Partners Ltd. Page | 137
APPENDICES
Where: p = the estimated proportion
n = the sample size on which the proportion is based
The actual survey design used a sample based upon disproportionate stratification whereby sample
sizes were varied across the area framework. To estimate the sampling error in a complex design
such as this, the basic method is to estimate the extent to which the design increases or decreases
the sampling error relative to a sample of the same size drawn using simple random sampling. This is
measured using the design effect (deff), which is calculated as:
As approximate estimate of the standard error of a proportion based on the complex design can then
be obtained by multiplying the standard error assuming simple random sampling had been used
(equation i above) by the square root of the design effect.
The formula for calculating the standard error for proportions of dwellings or households from the
survey is given below:
Where: pi = the estimated proportion with the characteristics in stratum i
ni = the number of households/dwellings sampled in stratum i
Ni = the total number of households/dwellings existing in stratum i
N = the total number of households in the City
The impact of the survey design on the sampling errors of estimates is generally fairly small.
To avoid the complex calculation of the design effect in every case, it is suggested that in most cases
a multiplier of 1.05 be applied to the standard error calculated assuming simple random sampling (see
equation i). The following table provides an overview of the sampling errors associated with a range
of survey outcomes.
A Summary of sampling errors across the main survey reporting cells is provided in Table B1.
deff(p) =
Estimated variance (S.E.2) of p with complex design
Estimated variance of p based on simple random sample
p (I – p)
n
S.E. (p) srs =
(equation i)
(equation ii) S.E. (p) =
1
N2
N2
(ni – I)
P i (1 - pi )
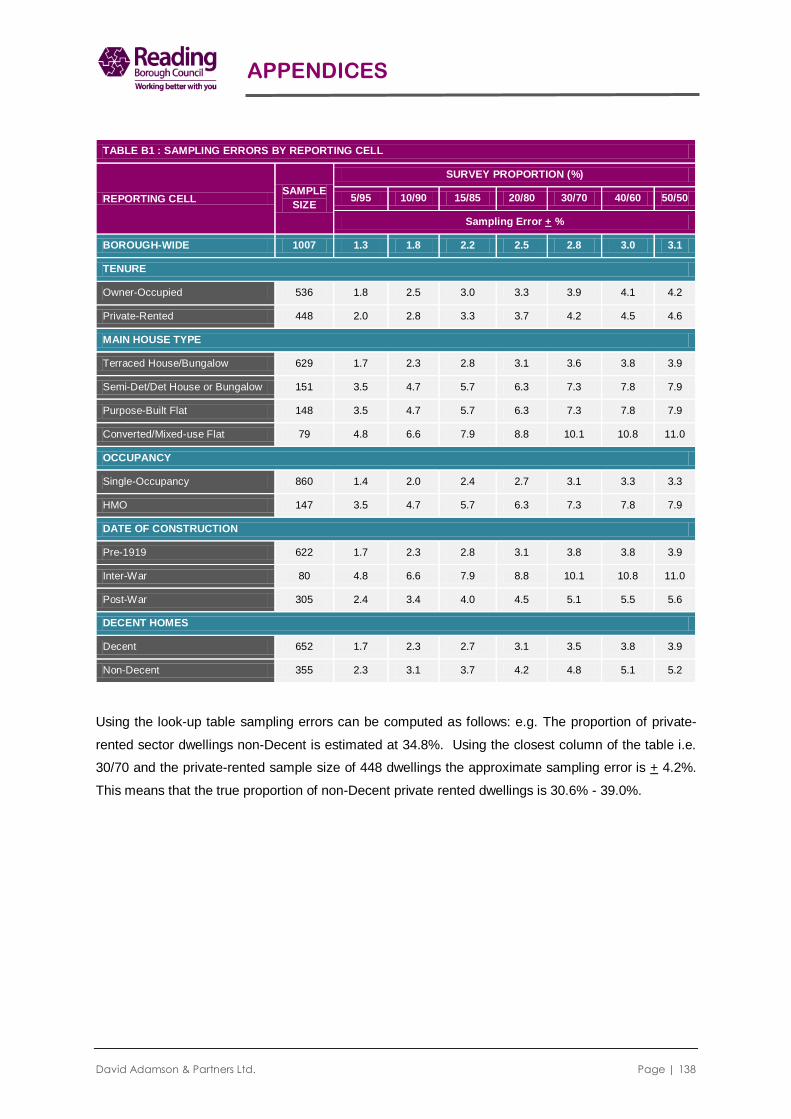
David Adamson & Partners Ltd. Page | 138
APPENDICES
TABLE B1 : SAMPLING ERRORS BY REPORTING CELL
REPORTING CELL SAMPLE
SIZE
SURVEY PROPORTION (%)
5/95 10/90 15/85 20/80 30/70 40/60 50/50
Sampling Error + %
BOROUGH-WIDE 1007 1.3 1.8 2.2 2.5 2.8 3.0 3.1
TENURE
Owner-Occupied 536 1.8 2.5 3.0 3.3 3.9 4.1 4.2
Private-Rented 448 2.0 2.8 3.3 3.7 4.2 4.5 4.6
MAIN HOUSE TYPE
Terraced House/Bungalow 629 1.7 2.3 2.8 3.1 3.6 3.8 3.9
Semi-Det/Det House or Bungalow 151 3.5 4.7 5.7 6.3 7.3 7.8 7.9
Purpose-Built Flat 148 3.5 4.7 5.7 6.3 7.3 7.8 7.9
Converted/Mixed-use Flat 79 4.8 6.6 7.9 8.8 10.1 10.8 11.0
OCCUPANCY
Single-Occupancy 860 1.4 2.0 2.4 2.7 3.1 3.3 3.3
HMO 147 3.5 4.7 5.7 6.3 7.3 7.8 7.9
DATE OF CONSTRUCTION
Pre-1919 622 1.7 2.3 2.8 3.1 3.8 3.8 3.9
Inter-War 80 4.8 6.6 7.9 8.8 10.1 10.8 11.0
Post-War 305 2.4 3.4 4.0 4.5 5.1 5.5 5.6
DECENT HOMES
Decent 652 1.7 2.3 2.7 3.1 3.5 3.8 3.9
Non-Decent 355 2.3 3.1 3.7 4.2 4.8 5.1 5.2
Using the look-up table sampling errors can be computed as follows: e.g. The proportion of private-
rented sector dwellings non-Decent is estimated at 34.8%. Using the closest column of the table i.e.
30/70 and the private-rented sample size of 448 dwellings the approximate sampling error is + 4.2%.
This means that the true proportion of non-Decent private rented dwellings is 30.6% - 39.0%.

David Adamson & Partners Ltd. Page | 139
APPENDICES
APPENDIX C : SURVEY QUESTIONNAIRE

David Adamson & Partners Ltd. Page | 140
APPENDICES
APPENDIX D : THE DECENT HOMES STANDARD
D.1 This appendix gives a detailed definition of the decent homes standard and explains the four
criteria that a decent home is required to meet. These are:
it meets the current statutory minimum standard for housing;
it is in a reasonable state of repair;
it has reasonably modern facilities and services;
it provides a reasonable degree of thermal comfort.
D.2 The decent home definition provides a minimum standard. Landlords and owners doing work
on their properties may well find it appropriate to take the dwellings above this minimum
standard.
Criterion A: the dwelling meets the current statutory minimum standard for housing
D.3 MINIMUM STATUTORY STANDARDS : The Housing Act 2004 (Chapter 34) introduces a
new system for assessing housing conditions and enforcing housing standards. The new
system which replaces the former test of fitness for human habitation (Section 604, Housing
Act 1985) operates by reference to the existence of Category 1 or Category 2 hazards on
residential premises as assessed within the Housing Health and Safety Rating System
(HHSRS - Version 2). For the purposes of the current survey the presence of Category 1
hazards has been assumed to represent statutory failure. These are hazards falling within
HHSRS Bands A, B or C and accruing hazard scores in excess of 1000 points.
Criterion B: the dwelling is in a reasonable state of repair
D.4 A dwelling satisfies this criterion unless:
one or more key building components are old and, because of their condition,
need replacing or major repair; or
two or more other building components are old and, because of their
condition, need replacement or major repair.
BUILDING COMPONENTS D.5 Building components are the structural parts of a dwelling (eg wall structure, roof structure),
other external elements (eg roof covering, chimneys) and internal services and amenities (eg
kitchens, heating systems).
D.6 Key building components are those which, if in poor condition, could have an immediate
impact on the integrity of the building and cause further deterioration in other components.

David Adamson & Partners Ltd. Page | 141
APPENDICES
They are the external components plus internal components that have potential safety
implications and include:
External Walls
Roof structure and covering
Windows/doors
Chimneys
Central heating boilers
Gas fires
Storage Heaters
Electrics
D.7 If any of these components are old and need replacing, or require immediate major repair,
then the dwelling is not in a reasonable state of repair and remedial action is required.
D.8 Other building components are those that have a less immediate impact on the integrity of the
dwelling. Their combined effect is therefore considered, with a dwelling not in a reasonable
state of repair if two or more are old and need replacing or require immediate major repair.
‘OLD’ AND IN ‘POOR CONDITION’
D.9 A component is defined as ‘old’ if it is older than its expected or standard lifetime. The
component lifetimes used are consistent with those used for resource allocation to local
authorities and are listed at the end of this appendix.
D.10 Components are in ‘poor condition’ if they need major work, either full replacement or major
repair. The definitions used for different components are at listed at the end of this appendix.
D.11 One or more key components, or two or more other components, must be both old and in
poor condition to render the dwelling non-decent on grounds of disrepair. Components that
are old but in good condition or in poor condition but not old would not, in themselves, cause
the dwelling to fail the standard. Thus for example a bathroom with facilities which are old but
still in good condition would not trigger failure on this criterion.
D.12 Where the disrepair is of a component affecting a block of flats, the flats that are classed as
non-decent are those directly affected by the disrepair.
Criterion C: The dwelling has reasonably modern facilities and services
D.13 A dwelling is considered not to meet this criterion if it lacks three or more of the following
facilities:

David Adamson & Partners Ltd. Page | 142
APPENDICES
a kitchen which is 20 years old or less;
a kitchen with adequate space and layout;
a bathroom which is 30 years old or less;
an appropriately located bathroom and WC;
adequate sound insulation;
adequate size and layout of common entrance areas for blocks of flats.
D.14 The ages used to define the ‘modern’ kitchen and bathroom are less than those for the
disrepair criterion. This is to take account of the modernity of kitchens and bathrooms, as well
as their functionality and condition.
D.15 There is some flexibility inherent in this criterion, in that a dwelling has to fail on three criteria
before failure of the decent homes standard itself. Such a dwelling does not have to be fully
modernised for this criterion to be passed: it would be sufficient in many cases to deal with
only one or two of the facilities that are contributing to the failure.
D.16 These standards are used to calculate the national standard and have been measured in the
English House Condition Survey (EHCS) for many years. For example, in the EHCS:
a kitchen failing on adequate space and layout would be one that was too
small to contain all the required items (sink, cupboards, cooker space,
worktops etc) appropriate to the size of the dwelling;
an inappropriately located bathroom or WC is one where the main bathroom
or WC is located in a bedroom or accessed through a bedroom (unless the
bedroom is not used or the dwelling is for a single person). A dwelling would
also fail if the main WC is external or located on a different floor to the
nearest wash hand basin, or if a WC without a wash hand basin opens on to
a kitchen in an inappropriate area, for example next to the food preparation
area;
Decent homes – definition : inadequate insulation from external airborne noise would occur
where there are problems with, for example, traffic (rail, road or aeroplanes) or factory noise.
Reasonable insulation from these problems should be ensured through installation of double
glazing; inadequate size and layout of common entrance areas for blocks of flats would occur
where there is insufficient room to manoeuvre easily, for example where there are narrow
access ways with awkward corners and turnings, steep staircases, inadequate landings,
absence of handrails, low headroom etc.

David Adamson & Partners Ltd. Page | 143
APPENDICES
Criterion D: the dwelling provides a reasonable degree of thermal comfort
D.17 The definition requires a dwelling to have both:
efficient heating; and
effective insulation.
D.18 Under this standard, efficient heating is defined as any gas or oil programmable central heating
or electric storage heaters/programmable solid fuel or LPG central heating or similarly efficient
heating systems. Heating sources which provide less energy efficient options fail the decent
home standard.
D.19 Because of the differences in efficiency between gas/oil heating systems and the other heating
systems listed, the level of insulation that is appropriate also differs:
For dwellings with gas/oil programmable heating, cavity wall insulation (if
there are cavity walls that can be insulated effectively) or at least 50mm loft
insulation (if there is loft space) is an effective package of insulation under
the minimum standard set by the Department of Health;
For dwellings heated by electric storage heaters/programmable solid fuel or
LPG central heating a higher specification of insulation is required to meet
the same standard: at least 200mm of loft insulation (if there is a loft) and
cavity wall insulation (if there are cavity walls that can be insulated
effectively).
Component lifetimes and definition of ‘in poor condition’ used in the national measurement of the
disrepair criterion
COMPONENT LIFETIMES
D.20 Table D.1 shows the predicted lifetimes of various key building components within the
disrepair criterion to assess whether the building components are ‘old’. These are used to
construct the national estimates of the number of dwellings that are decent and those that fail.

David Adamson & Partners Ltd. Page | 144
APPENDICES
Table D1: Component lifetimes used in the disrepair criterion
Building Components
(key components marked *)
Houses
and
Bungalows
All flats in
blocks of
below 6
storeys
All flats in
blocks of 6 or
more storeys
LIFE EXPECTANCY
Wall structure* 80 80 80
Lintels* 60 60 60
Brickwork (spalling)* 30 30 30
Wall finish* 60 60 30
Roof structure* 50 30 30
Chimney 50 50 N/A
Windows* 40 30 30
External doors* 40 30 30
Kitchen 30 30 30
Bathrooms 40 40 40
Heating – central heating gas boiler* 15 15 15
Heating – central heating distribution
system
40 40 40
Heating – other* 30 30 30
Electrical systems* 30 30 30
IN POOR CONDITION
D.21 Table D.2 sets out the definitions used within the disrepair criterion to identify whether building
components are ‘in poor condition’. These are consistent with EHCS definitions and will be the
standard used to monitor progress nationally through the EHCS. The general line used in the
EHCS is that, where a component requires some work, repair should be prescribed rather than
replacement unless:
the component is sufficiently damaged that it is impossible to repair;
the component is unsuitable, and would be even it were repaired, either
because the material has deteriorated or because the component was never
suitable; (for external components) even if the component were repaired now,
it would still need to be replaced within 5 years.

David Adamson & Partners Ltd. Page | 145
APPENDICES
Table D.2: Component Condition used in the disrepair criterion
Building Components
(key components
marked *)
Houses and Bungalows
Wall structure Replace 10% or more or repair 30% or more
Wall finish Replace/repoint/renew 50% or more
Chimneys 1 chimney needs partial rebuilding or more
Roof Structure Replace 10% or more to strengthen 30% or more
Roof Covering Replace or isolated repairs to 50% or more
Windows Replace at least one window or repair/replace sash or member to
at least two (excluding easing sashes, reglazing painting)
External doors Replace at least one
Kitchen Major repair or replace 3 or more items out of the 6 (cold water
drinking supply, hot water, sink, cooking provision, cupboards)
Bathroom Major repair or replace 2 or more items (bath, wash hand basin)
Electrical System Replace or major repair to system
Central Heating Boiler Replace or major repair
Central Heating
Distribution
Replace or major repair
Storage Heating Replace or major repair

David Adamson & Partners Ltd. Page | 146
APPENDICES
APPENDIX E :
GLOSSARY OF TERMS
AGE/CONSTRUCTION DATE OF DWELLING
The age of the dwelling refers to the date of construction of the oldest part of the building.
ADAPTATION
The installation of an aid or alternation to building design or amenity to assist normal dwelling use by
physically or mentally impaired persons.
BASIC AMENITIES
Dwellings lack basic amenities where they do not have all of the following:
kitchen sink;
bath or shower in a bathroom;
a wash hand basin;
hot and cold water to the above;
inside WC.
BEDROOM STANDARD
The bedroom standard is the same as that used by the General Household Survey, and is calculated
as follows:
a separate bedroom is allocated to each co-habiting couple, any other person
aged 21 or over,
each pair of young persons aged 10-20 of the same sex,
and each pair of children under 10 (regardless of sex);
unpaired young persons aged 10-20 are paired with a child under 10 of the
same sex or, if possible, allocated a separate bedroom;
any remaining unpaired children under 10 are also allocated a separate
bedroom.
The calculated standard for the household is then compared with the actual number of bedrooms
available for its sole use to indicate deficiencies or excesses. Bedrooms include bed-sitters, box
rooms and bedrooms which are identified as such by informants even though they may not be in use
as such.
CATEGORY 1 HAZARD
A hazard rating score within the HHSRS accruing in excess of 1000 points and falling into Hazard
Bands A, B or C.

David Adamson & Partners Ltd. Page | 147
APPENDICES
DECENT HOMES
A decent home is one that satisfies all of the following four criteria:
it meets the current statutory minimum standard for housing.
it is in a reasonable state of repair;
it has reasonably modern facilities and services;
it provides a reasonable degree of thermal comfort.
See Appendix E for further details.
DOUBLE GLAZING
This covers factory made sealed window units only. It does not include windows with secondary
glazing or external doors with double or secondary glazing (other than double glazed patio doors
which count as 2 windows).
DWELLING
A dwelling is a self contained unit of accommodation where all rooms and facilities available for the
use of the occupants are behind a front door. For the most part a dwelling will contain one household,
but may contain none (vacant dwelling), or may contain more than one (HMO).
TYPE OF DWELLING
Dwellings are classified, on the basis of the surveyors’ inspection, into the following categories:
terraced house: a house forming part of a block where at least one house is attached to two or more
other houses;
semi-detached house: a house that is attached to one other house;
detached house: a house where none of the habitable structure is joined to another building (other
than garages, outhouses etc.);
bungalow: a house with all of the habitable accommodation is on one floor. This excludes chalet
bungalows and bungalows with habitable loft conversions, which are treated as houses;
purpose built flat, low rise: a flat in a purpose built block less than 6 storeys high. Includes cases
where there is only one flat with independent access in a building which is also used for non-domestic
purposes;
converted flat: a flat resulting from the conversion of a house or former non-residential building.
Includes buildings converted into a flat plus commercial premises (typically corner shops).
EMPLOYMENT STATUS OF HOH
full time employment: working at least 30 hours per week as an employee or as self-employed. It
includes those on government-supported training schemes but excludes any unpaid work;
David Adamson & Partners Ltd. Page | 148
APPENDICES
part-time employment: working less than 30 hours per week as an employee or as self-employed. It
excludes any unpaid work;
retired: fully retired from work i.e. no longer working, even part time. Includes those who have retired
early;
unemployed: includes those registered unemployed and those who are not registered but seeking
work;
other inactive: includes people who have a long term illness or disability and those looking after
family/home;
employed full or part time: as above.
HHSRS
The Housing Health and Safety Rating System (HHSRS) is the Government’s new approach to the
evaluation of the potential risks to health and safety from any deficiencies identified in dwellings. The
HHSRS, although not in itself a standard, has been introduced as a replacement for the Housing
Fitness Standard (Housing Act 1985, Section 604, as amended). Hazard scores are banded to reflect
the relative severity of hazards and their potential outcomes. There are ten hazard bands ranging
from Band J (9 points or less) the safest, to Band A (5000 points or more) the most dangerous. Using
the above bands hazards can be grouped as Category 1 or Category 2. A Category 1 hazard will fall
within Bands A, B and C (1000 points or more); a Category 2 hazard will fall within Bands D or higher
(under 1000 points).
HMO
As defined in Section 254 Housing Act 2004, which relates predominantly to bedsits and shared
housing where there is some sharing of facilities by more than one household.
HOUSEHOLD
One person living alone or a group of people who have the address as their only or main residence
and who either share one meal a day or share a living room.
HOUSEHOLD TYPES
The classification is based on the primary family unit within the household only. This means that
households in the first 4 categories (couple based and lone parents) may include other people in
other family units. For example, a couple with dependent children who also have an elderly parent or
a grown up non-dependant child living with them are still classed as a couple with dependent children.
The types are:
Single Person: Single person aged below pensionable age;
Single Parent: Single person aged below pensionable age together with one or more persons aged
under 16 years;
Small Adult: Two persons aged below pensionable age;

David Adamson & Partners Ltd. Page | 149
APPENDICES
Small Family: Two persons aged below pensionable age together with one or two persons aged
under 16 years;
Large Family: Two persons aged below pensionable age together with three or more persons aged
under 16 years;
Large Adult: Three of more persons aged below pensionable age;
Elderly: One or more persons aged over pensionable age
LONG TERM ILLNESS OR DISABILITY
Whether anybody in the household has a long-tern illness or disability. The respondent assesses this
and long-term is defined as anything that has troubled the person, or is likely to affect them, over a
period of time.
MEANS TESTED BENEFITS (IN RECEIPT OF)
Households where the HOH or partner receives Income Support, income-based Job Seekers
Allowance, Working Families Tax Credit, Disabled Persons Tax Credit or Housing Benefit. Note that
Council Tax Benefit is excluded from this definition.
SAP
The main measure of energy efficiency used in the report is the energy cost rating as determined by
the Government’s Standard Assessment Procedure (SAP). This is an index based on calculated
annual space and water heating costs for a standard heating regime and is expressed on a scale of 1
(highly energy inefficient) to 120 (highly energy efficient).
SECURE WINDOWS AND DOORS
Homes with secure windows and doors have both of the following:
main entrance door is solid or double glazed; the frame is strong; it has an
auto deadlock or standard Yale lock plus mortise lock;
all accessible windows (ground floor windows or upper floor windows in reach
of flat roofs) are double glazed, either with or without key locks.
TENURE
Three categories are used for most reporting purposes:
owner-occupied: includes all households who own their own homes outright or buying them with a
mortgage/loan. Includes intermediate ownership models;
private rented or private tenants: includes all households living in privately owned property which they
do not own. Includes households living rent free, or in tied homes. Includes un-registered housing
associations tenants;
registered social landlord (RSL): includes all households living in the property of registered housing
associations.
David Adamson & Partners Ltd. Page | 150
APPENDICES
VACANT DWELLINGS
The assessment of whether or not a dwelling was vacant was made at the time of the interviewer’s
visit. Clarification of vacancy was sought from neighbours. Two types of vacant property are used:
transitional vacancies: are those which, under normal market conditions, might be expected to
experience a relatively short period of vacancy before being bought or re-let;
problematic vacancies: are those which remain vacant for long periods or need work before they can
be re-occupied.
Dwellings vacant for up to 1 month are classified as transitional vacancies and those unoccupied for
at least 6 months are treated as problematic vacancies. Dwellings vacant for between 1 and 6 months
can be problematic or transitional depending on whether they are unfit for human habitation and
therefore require repair work prior to being re-occupied.
VULNERABLE HOUSEHOLDS
Households who are in receipt of the following benefits: Income Support; Income-based Job Seeker’s
Allowance; Housing Benefit; Council Tax Benefit; Working Families Tax Credit; Disabled Person’s Tax
Credit; Disability Living Allowance: Industrial Injuries Disablement Benefit; War Disablement Pension,
Attendance Allowance, Child Tax Credit, Working Tax Credit, Pension Credit.