private equity, public loss? - csfi · debenhams case study (1) ... private equity, public loss? by...
TRANSCRIPT
CSFICentre for the Study ofFinancial Innovation
Private equity,public loss?
By Peter Morris


CSFI E-mail: [email protected] Web: www.csfi.org.uk
C S F I
The Centre for the Study of Financial Innovation is a non-profit think-tank, established in 1993 to look at future developments in the international financial field – particularly from the point of view of practitioners. Its goals include identifying new areas of business, flagging areas of danger and provoking a debate about key financial issues. The Centre has no ideological brief, beyond a belief in open markets.
Published byCentre for the Study of Financial Innovation (CSFI)
Email: [email protected]: www.csfi.org.uk
ISBN: 978-0-9563888-3-4
Printed in the United Kingdom by Heron, Dawson & Sawyer
TrusteesMinos Zombanakis (Chairman)David LascellesSir David BellRobin Monro-DaviesSir Brian Pearse
StaffDirector – Andrew HiltonCo-Director – Jane FullerSenior Fellow – David LascellesProgramme Coordinator – Lisa Moyle
Governing CouncilSir Brian Pearse (Chairman)Sir David BellGeoffrey BellRobert BenchRudi BogniPhilip BrownPeter CookeBill DaltonSir David DaviesProf Charles GoodhartJohn HeimannJohn HitchinsRene KarsentiHenry KaufmanAngela KnightSir Andrew LargeDavid LascellesRobin Monro-DaviesRick MurrayJohn PlenderDavid PotterMark RobsonDavid RuleSir Brian WilliamsonPeter Wilson-SmithMinos Zombanakis
CSFI publications can be purchased through our website www.bookstore.csfi.org.uk or by calling the Centre on +44 (0) 207 493 0173

Contents
Preface ................................................................................................................... 1
Foreword ............................................................................................................... 2
Acknowledgements ............................................................................................... 2
Chapter 1: “Barbarians” reach the Fortune 500. ................................................... 3
Chapter 2: The official story ............................................................................... 10
Debenhams case study (1) .......................................................................... 16
Chapter 3: What is the real story on returns? ...................................................... 19
Valuation and measures of investment return ............................................. 19
What makes an “attractive” investment? .................................................... 22
Fees ............................................................................................................. 27
Debenhams case study (2) .......................................................................... 28
Chapter 4: Conflicts of interest and other issues ................................................. 31
Chapter 5: Conclusions and recommendations ................................................... 39
Sources ................................................................................................................ 48
CSFI E-mail: [email protected] Web: www.csfi.org.uk
C S F I
C S F I
CSFI 5 DERBY STREET, LONDON W1J 7AB Tel: 020-7493 0173 Fax: 020-7493 0190 E-mail: [email protected] Web: www.csfi.org.uk 1
PrefaceWhen Peter Morris proposed writing a myth-busting report on private equity, it did not take long for the CSFI to agree to publish it. This is a sector that has long had either a good press for want of serious analysis, or a bad press for the wrong reasons. Peter promised a report that took apart claims about “super” returns and the perfect alignment of interests between investors and managers. He has delivered – and in a very readable way. In the process, the basis for PE’s high fees has been called into question.
The calculations that break down returns into those derived from high leverage, stock market moves and PE managers’ skills are easy to follow. This begs the question of why “sophisticated investors” were not doing them. Peter answers it in a way that confirms scepticism about the way our money is managed by other people. The analysis is illuminated by the Debenhams case study and by other research that has formed oases in a desert created by the lack of a long run of granular data.
Lest you think this is a diatribe, it is not. PE is given credit where it is due. Some of the (political) criticisms of it are plainly wide of the mark from an investor’s point of view. The industry itself has taken strides towards greater transparency and has come out of the shadows to defend itself against political attack. The report ends with a range of constructive suggestions as to how this evolutionary process can be improved and speeded up.
The lessons about rigorous analysis of investment returns and about the inevitable interplay of vested interests go far wider than private equity. Anyone who has any money in a pension fund or other “managed” savings vehicle will find this fascinating reading. It should also be compulsory for journalists and others who may be tempted to repeat the easy lines without looking behind the numbers and asking the important questions.
Jane FullerCo-director, CSFI
CSFI mission statement“The CSFI is a forum for new thinking about the financial system, and about the public and private institutions and markets that operate within that system. It is not a lobby group for any particular point of view; nor does it have any ideological or political agenda. Its goal is to foster a lively debate about the future of finance, in its retail, corporate and national manifestations, and to identify the threats and opportunities that will help determine that future.”
C S F INUMBER NINETY SIX JULY 2010
Private equity, public loss?
By Peter Morris

C S F I
2 CSFI 5 DERBY STREET, LONDON W1J 7AB Tel: 020-7493 0173 Fax: 020-7493 0190 E-mail: [email protected] Web: www.csfi.org.uk
ForewordBy Peter Morris
Private equity benefited from the financial crisis: it disappeared from the headlines. Why write about it now?
Some investors have genuinely done well over the years out of private equity (ie out of buyouts). Correctly structured, private equity can play a useful role in the economy. But while self-serving private equity myths built up over the last generation contain some truth, they fail to tell the whole story. This report draws on recent research that has begun to confirm some common-sense intuitions about private equity. High debt levels are the biggest component of private equity returns – and buyouts inflict collateral damage on broader markets due to perverse incentives. There are conflicts of interest between a private equity firm and its investors, not direct alignment. Fees are too high. Most importantly, returns are simply not as good as advertised.
But the story of private equity also contains a vital broader lesson. It shows the dangers that lurk in the notion of the so-called “sophisticated investor”.
Most of the cash for private equity and other so-called “alternative investments” has come from large institutions. Regulators treat them as “sophisticated investors”. Yet in at least one of these “alternative investments” – private equity – the overall returns over thirty years have been disappointing. One key study calls it a “puzzle” that investors continue to favour private equity despite the fees and returns.
Until quite recently, regulators thought banks were highly sophisticated and treated them accordingly. The crisis has shown that banks cannot be relied on to behave wisely, and the costs are high. Why should regulators still assume that they can rely on “sophisticated investors” as a group? As a matter of urgency, policymakers need to address the issue of the “sophisticated investor”. Thirty years of private equity help to show why.
AcknowledgementsThanks to the following for their time and other assistance. It goes without saying that readers should not assume that any of them agrees with the views expressed in this report. Responsibility for those views, and for any errors, lies with the author.
Viral Acharya, Ann-Kristin Achleitner, David Atterbury, Gregory Barbes, Stephen Breban, Peter Cornelius, Francesca Cornelli, Rob Davies, Matthew Fann, Philip Gawith, Chris Higson, Ann Iveson, Tim Jenkinson, Michael Johnson, Conor Kehoe, Heino Meerkatt, Harry Nicholson, Jennie Overnell, Ludovic Phalippou, Michael Queen, Michael Ridpath, Tom Rotherham, Miriam Schmitter, Eli Talmor, Simon Walker, Karel Williams. And, of course, the team at the CSFI.
PM
C S F I
CSFI 5 DERBY STREET, LONDON W1J 7AB Tel: 020-7493 0173 Fax: 020-7493 0190 E-mail: [email protected] Web: www.csfi.org.uk 3
Chapter 1: “Barbarians” reach the Fortune 500.Thirty years ago, no one much cared about private equity. It was an obscure and faintly grubby investment activity on the fringes of the US financial world. In 1990, the catchy title of a best-selling book about one big private equity deal – “Barbarians at the Gate” – signalled that its operators were still on the outside, but getting closer. Today, leading private equity firms are fully paid-up members of the establishment. They are global in scope and they control corporate empires that rival the biggest quoted companies. One leading US-based firm, Blackstone, proclaimed on its website that it would have ranked number 13 in the 2009 Fortune 500. Another one, KKR, would have ranked number 5. A UK-based private equity firm, CVC, has a global portfolio of 53 companies with more than 400,000 employees and revenues of more than €80bn, both about seven times more than Marks & Spencer. Another UK-based private equity firm, Permira, claims to invest on behalf of 30 million pensioners. Companies controlled by private equity employ 6% of the UK’s private sector workforce.
Yet private equity is still allowed to operate in the shadows. Marks & Spencer, as a quoted company, publishes quarterly financial statements and a detailed annual report. Permira has published an annual review for the last three years, but this is little more than a marketing brochure compared with the M&S report. Blackstone boasts about its size compared with the Fortune 500, but its financial disclosure makes a mockery of what Fortune 500 companies publish. CVC does not even publish an annual review.
Private equity has been a huge success in terms of size, growth and profitability for its operators and for many intermediaries. It is less clear whether private equity has been a universal boon for its investors or for financial markets generally. Now is a good time to take a dispassionate look for several reasons. The financial crisis has prompted a more sober analysis of what private equity is and does. Headlines have already appeared (and there will be more) about individual investments defaulting on their debt, and about private equity operators going out of business. Early signs of improved transparency from the sector in the UK following November 2007’s Walker Report make it timely to consider what this shows and whether it should go further.1 And the last two or three years have seen some important new work looking at private equity’s investment returns.
Some definitions are necessary, starting with the term “private equity” itself. Borrowing lots of money to buy a company is hardly a new concept. The reason this report is being written is that 30 years ago the activity began to take on an
1. “Guidelines for Disclosure and Transparency in Private Equity”, 20 November 2007. Available at http://walker-gmg.co.uk/sites/10051/files/wwg_report_final.pdf.
Not clear that private equity has been a boon for investors

C S F I
4 CSFI 5 DERBY STREET, LONDON W1J 7AB Tel: 020-7493 0173 Fax: 020-7493 0190 E-mail: [email protected] Web: www.csfi.org.uk
institutional life of its own. Knowing what to call it is a problem, though. The activity used to go by names such as “buyout”, “management buyout”, “leveraged buyout” or “LBO fund”. In 1989, Michael Jensen, a leading academic supporter, coined the term “LBO Association” in his seminal article “Eclipse of the Public Corporation” – but the name never caught on. Although these names were not precise, some did at least capture the activity’s distinguishing characteristic: its use of debt. The most accurate name belonged to two funds raised in the mid-1980s, the Morgan Stanley Leveraged Equity Funds I (1985) and II (1987). “Leveraged equity” says it all, or at least two thirds of it: buying shares with lots of debt. Modern usage has quietly dropped the older terms. Certainly they are inelegant, and they may have become unpopular because they are too accurate. Today’s names for the activity in question, e.g. “private equity” or “alternative asset management”, are vaguer, more neutral and less informative. Most of all, they do not mention debt.
“Private equity” refers to the process by which investors, such as pension funds, invest their cash in unquoted entities. It describes legal form rather than investment substance. Equity in this case is “private” because both the investment vehicles (funds) and what they buy are unquoted. What private equity funds actually invest in covers a wide range: from venture capital – new technologies and the creation of new businesses – to buying distressed companies with the aim of turning them round.
This report addresses only one dish from the private equity menu. It will use the generic term “private equity”, or “buyouts”, to refer to what used to be more accurately called “leveraged equity”. This is the business of using other people’s money to buy and then sell existing companies, usually with higher than average levels of debt.
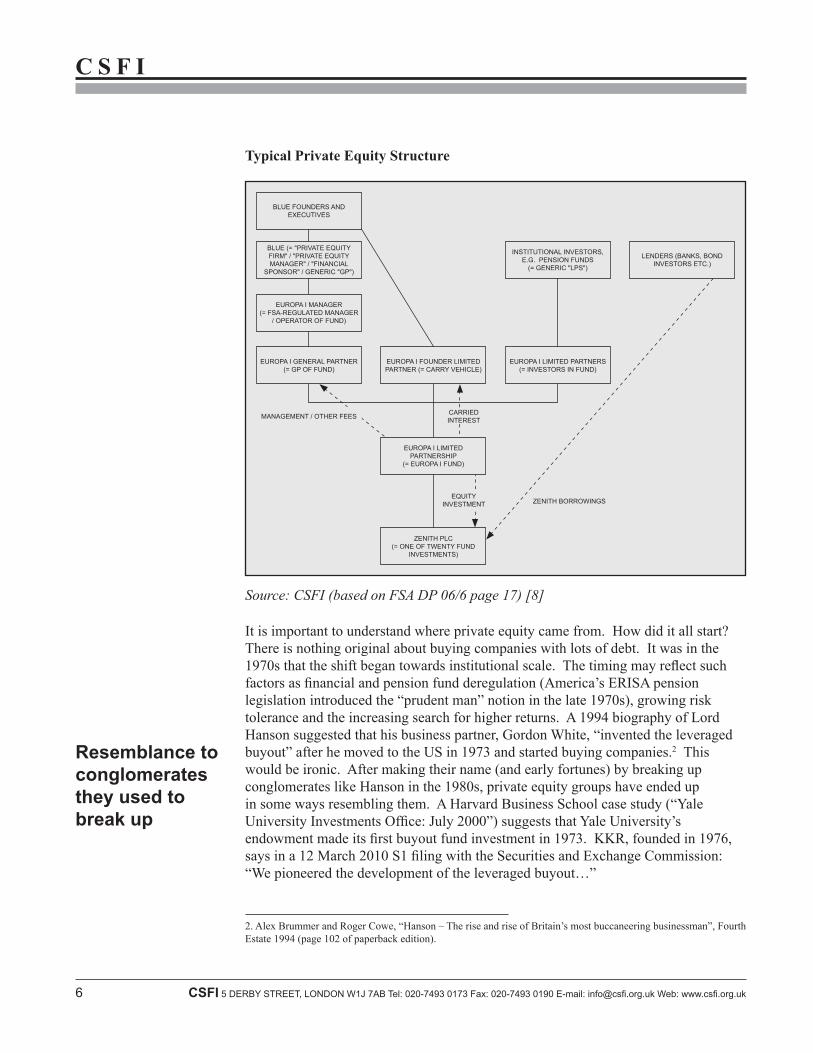
After defining private equity, the next challenge is terminology. Private equity terminology and mechanics are about as intuitive as the rules of cricket. Here is the simple version. Private equity fund managers can more or less interchangeably be called “private equity firms”, “private equity managers”, “(financial) sponsors” or “GPs (General Partners)”. Investors are often called “LPs (Limited Partners)”. For more detail, see the accompanying box and chart:
Use of debt is the distinguishing characteristic

C S F I
CSFI 5 DERBY STREET, LONDON W1J 7AB Tel: 020-7493 0173 Fax: 020-7493 0190 E-mail: [email protected] Web: www.csfi.org.uk 5
Private equity involves the same two actors as any other form of investment: investors who have capital and managers who are paid to look after it. The investment managers are referred to by various names, including “private equity firms”, “private equity managers”, “(financial) sponsors” and “General Partners (GPs)”. Until recently, most of these entities belonged solely to their founders and executives; some banks are also private equity investors on their own behalf. Investors in private equity are typically referred to as “Limited Partners (LPs)”. They tend to be large institutions: the biggest single investor group is North American public pension funds.
Most private equity firms use a legal structure called a limited partnership for each fund that they raise and manage. A limited partnership must have one general partner – in effect, the fund manager – while its limited partners provide most of the fund’s capital. A typical private equity firm has more than one fund (limited partnership) on the go at any one time. Imagine a hypothetical private equity firm called Blue. Blue is a private company owned by its founders and other executives. Currently, it is running three separate private equity funds. Strictly, “GP” should refer only to the specific general partner of one of the funds. In practice, people will also use “GP” more loosely as a shorthand way to refer generally to Blue. Likewise, “LP” is often used as a convenient way of referring generically to private equity investors. Each individual fund typically has a finite life of ten years. Investors (LPs) commit at the beginning to invest their cash when the fund’s GP finds a company to buy. Imagine that Blue’s Europa I fund (limited partnership) starts out with total commitments of £1bn. Blue (the fund’s generic GP/manager) might aim to spend the first five years of the fund’s life investing this in 20 separate companies, and the second five in selling them.
The first company it identifies is called Zenith plc. After negotiating a purchase price of £150m for Zenith, Blue executives working for Europa I’s general partner ask Europa I’s LPs to send cash in proportion to their commitment to the fund’s overall £1bn. They also arrange for Zenith to borrow £100m, secured on its own assets. Together, this allows Europa I to write a cheque for £150m to buy Zenith. Repeated 20 times, this process would see Europa I investing £1bn and controlling 20 companies with a total value of £3bn (including debt).
Blue is responsible for managing as well as buying all the fund’s investments. In legal terms, it does this through Europa I’s specific general partner. By the end of Europa I’s tenth year, Blue should have sold all the companies Europa I bought, returning the proceeds to the LPs along the way.
As set out in the limited partnership agreement, Europa I’s LPs pay various forms of compensation to Europa I’s general partner for doing all this. Europa I’s general partner belongs to Blue, so this compensation flows directly to Blue. The “management fee” typically begins at 2% per annum of an LP’s commitment to Europa I. “Carried interest”, effectively a share of profits, typically amounts to 20% of Europa I’s profits once they exceed 8% per annum. Europa I’s GP will often charge additional fees to the LPs for “monitoring” the companies Europa I owns and other services, such as arranging finance. The GP usually shares some of these fees with the LPs.
Suppose Europa I’s general partner, on Blue’s instructions, eventually sells all Europa I’s investments for £3bn. Europa I originally invested £1 billion. Europa I’s GP will have received (and passed on to its parent, Blue) £20m per annum in annual management fees; about £170m in “carried interest”, or profit share; and various other fees.
Box 1: Definitions and how it works
C S F I
6 CSFI 5 DERBY STREET, LONDON W1J 7AB Tel: 020-7493 0173 Fax: 020-7493 0190 E-mail: [email protected] Web: www.csfi.org.uk
It is important to understand where private equity came from. How did it all start? There is nothing original about buying companies with lots of debt. It was in the 1970s that the shift began towards institutional scale. The timing may reflect such factors as financial and pension fund deregulation (America’s ERISA pension legislation introduced the “prudent man” notion in the late 1970s), growing risk tolerance and the increasing search for higher returns. A 1994 biography of Lord Hanson suggested that his business partner, Gordon White, “invented the leveraged buyout” after he moved to the US in 1973 and started buying companies.2 This would be ironic. After making their name (and early fortunes) by breaking up conglomerates like Hanson in the 1980s, private equity groups have ended up in some ways resembling them. A Harvard Business School case study (“Yale University Investments Office: July 2000”) suggests that Yale University’s endowment made its first buyout fund investment in 1973. KKR, founded in 1976, says in a 12 March 2010 S1 filing with the Securities and Exchange Commission: “We pioneered the development of the leveraged buyout…”
2. Alex Brummer and Roger Cowe, “Hanson – The rise and rise of Britain’s most buccaneering businessman”, Fourth Estate 1994 (page 102 of paperback edition).
Resemblance to conglomerates they used to break up
BLUE FOUNDERS AND executives
EUROPA I FOUNDER LIMITED PARTNER (= CARRY VEHICLE)
INSTITUTIONAL INVESTORS, E.G. PENSION FUNDS
(= GENERIC "LPS")
LENDERS (BANKS, BOND INVESTORS ETC.)
EUROPA I LIMITED PARTNERS(= INVESTORS IN FUND)
EUROPA I LIMITED PARTNERSHIP
(= EUROPA I FUND)
ZENITH PLC(= ONE OF TWENTY FUND
INVESTMENTS)
BLUE (= "PRIVATE EQUITYFIRM" / "PRIVATE EQUITY MANAGER" / "FINANCIAL
SPONSOR" / GENERIC "GP")
EUROPA I MANAGER(= FSA-REGULATED MANAGER
/ OPERATOR OF FUND)
EUROPA I GENERAL PARTNER(= GP OF FUND)
MANAGEMENT / OTHER FEES CARRIEDinterest
ZENITH BORROWINGSEQUITY
INVESTMENT
Typical Private Equity Structure
Source: CSFI (based on FSA DP 06/6 page 17) [8]
C S F I
CSFI 5 DERBY STREET, LONDON W1J 7AB Tel: 020-7493 0173 Fax: 020-7493 0190 E-mail: [email protected] Web: www.csfi.org.uk 7
3. Steven Kaplan, “A summary of sources of value in management buyouts”, Salomon Brothers Center for the Study of Financial Institutions, May 1988.
4. Moody’s Investors Service, “Historical Default Rates of Corporate Bond Issuers, 1920-1999”, January 2000.
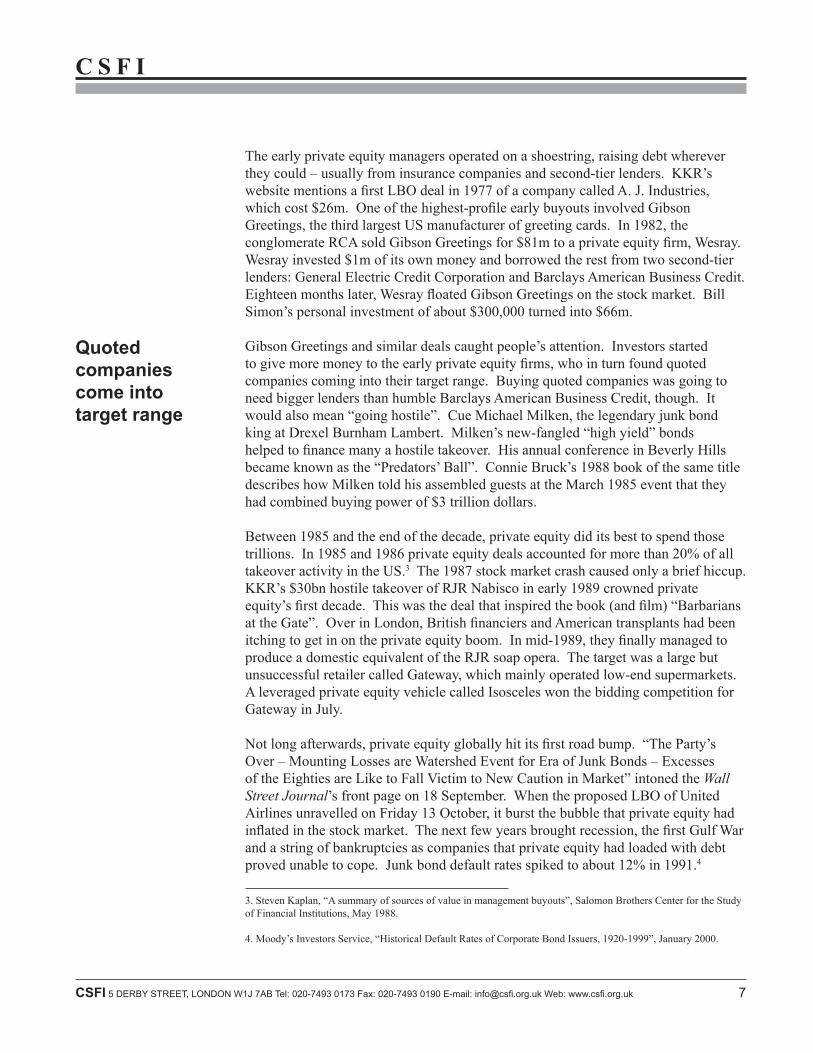
The early private equity managers operated on a shoestring, raising debt wherever they could – usually from insurance companies and second-tier lenders. KKR’s website mentions a first LBO deal in 1977 of a company called A. J. Industries, which cost $26m. One of the highest-profile early buyouts involved Gibson Greetings, the third largest US manufacturer of greeting cards. In 1982, the conglomerate RCA sold Gibson Greetings for $81m to a private equity firm, Wesray. Wesray invested $1m of its own money and borrowed the rest from two second-tier lenders: General Electric Credit Corporation and Barclays American Business Credit. Eighteen months later, Wesray floated Gibson Greetings on the stock market. Bill Simon’s personal investment of about $300,000 turned into $66m.
Gibson Greetings and similar deals caught people’s attention. Investors started to give more money to the early private equity firms, who in turn found quoted companies coming into their target range. Buying quoted companies was going to need bigger lenders than humble Barclays American Business Credit, though. It would also mean “going hostile”. Cue Michael Milken, the legendary junk bond king at Drexel Burnham Lambert. Milken’s new-fangled “high yield” bonds helped to finance many a hostile takeover. His annual conference in Beverly Hills became known as the “Predators’ Ball”. Connie Bruck’s 1988 book of the same title describes how Milken told his assembled guests at the March 1985 event that they had combined buying power of $3 trillion dollars.
Between 1985 and the end of the decade, private equity did its best to spend those trillions. In 1985 and 1986 private equity deals accounted for more than 20% of all takeover activity in the US.3 The 1987 stock market crash caused only a brief hiccup. KKR’s $30bn hostile takeover of RJR Nabisco in early 1989 crowned private equity’s first decade. This was the deal that inspired the book (and film) “Barbarians at the Gate”. Over in London, British financiers and American transplants had been itching to get in on the private equity boom. In mid-1989, they finally managed to produce a domestic equivalent of the RJR soap opera. The target was a large but unsuccessful retailer called Gateway, which mainly operated low-end supermarkets. A leveraged private equity vehicle called Isosceles won the bidding competition for Gateway in July.
Not long afterwards, private equity globally hit its first road bump. “The Party’s Over – Mounting Losses are Watershed Event for Era of Junk Bonds – Excesses of the Eighties are Like to Fall Victim to New Caution in Market” intoned the Wall Street Journal’s front page on 18 September. When the proposed LBO of United Airlines unravelled on Friday 13 October, it burst the bubble that private equity had inflated in the stock market. The next few years brought recession, the first Gulf War and a string of bankruptcies as companies that private equity had loaded with debt proved unable to cope. Junk bond default rates spiked to about 12% in 1991.4
Quoted companies come into target range
C S F I
8 CSFI 5 DERBY STREET, LONDON W1J 7AB Tel: 020-7493 0173 Fax: 020-7493 0190 E-mail: [email protected] Web: www.csfi.org.uk
5. European Central Bank, “Large Banks and Private Equity-Sponsored Leveraged Buyouts in the EU”, April 2007.
6. The Private Equity Council’s members are (May 2010): Apax, Apollo, Bain, Blackstone, Carlyle, Hellman & Friedman, KKR, Madison Dearborn, Permira, Providence, Silver Lake, TPG.
In retrospect, private equity’s near-death experience in the early 1990s was a brief hiatus. The period’s corporate and financial carnage threw up opportunities for the private equity firms that survived. It even helped create one of today’s biggest firms, Apollo, which was founded in 1990 by a group of former senior Drexel Burnham bankers. Today, private equity veterans talk nostalgically about the investment opportunities that became available. “Apollo’s most successful private equity funds (in terms of net IRR)…were initiated during economic downturns”, says a 22 March 2010 S1 filing with the SEC by Apollo Global Management LLC.
In the mid-1990s private equity began investing seriously again, and after the turn of the millennium the trajectory curved upwards. Funds, deals, borrowing and hyperbole (both for and against) all accelerated. In 2004, German politician Franz Muntefering made his (in)famous comment about private equity firms: “We support those companies, who act in interest of their future and in interest of their employees against irresponsible locust swarms, who measure success in quarterly intervals, suck off substance and let companies die once they have eaten them away.” In November of the same year, The Economist published a survey of private equity called “The new kings of capitalism”.
Two years later the locusts or kings, depending on your point of view, accounted for more than a third of all takeovers in the EU, according to a European Central Bank report in April 2007.5 Martin Halusa, chief executive of Apax Partners, told the London Times on 26 January 2006 that he “could imagine the creation of the world’s first $100bn private equity fund within ten years”. On 2 April 2007, Morgan Stanley’s head of European M&A told Bloomberg that a single deal worth $100bn “isn’t outside the realm of possibility”. Blackstone became the first major private equity firm to float on the stock market in June. Two other major firms, Carlyle and Apollo, privately sold minority stakes to institutional investors.
Private equity’s growth brought unprecedented public and political scrutiny. Leading firms in the US set up their first dedicated lobbying group, the Private Equity Council, in February 2007.6 In the UK, private equity firms already belonged to an umbrella organisation called the BVCA (which stands for British Private Equity and Venture Capital Association). One British household name, the Boots retail chain, was part of the Alliance Boots group bought by KKR in April 2007 and another, J. Sainsbury, was pursued by private equity – without success. Parliament’s Treasury Select Committee scheduled hearings into private equity for June/July. In anticipation, leading firms operating in the UK volunteered to introduce a new disclosure code, later known by the name of its author, Sir David Walker.
Near-death experience in early 1990s
Growth leads to public and political scrutiny
C S F I
CSFI 5 DERBY STREET, LONDON W1J 7AB Tel: 020-7493 0173 Fax: 020-7493 0190 E-mail: [email protected] Web: www.csfi.org.uk 9
7. On 1 October 2009, KKR floated a 30% interest on the Euronext Amsterdam stock exchange; Press reports from 2008 to 2010 suggest that a small number of institutions have collectively bought a 10% stake in Apax. Apollo Global Management has announced its intention to list on the New York Stock Exchange.
The end of the hearings coincided with the onset of the global financial crisis. On 13 September, the UK experienced its first bank run since 1866, when Northern Rock customers queued to withdraw their savings. The crisis quickly brought most new private equity activity to a halt, although Guardian Media Group (parent of The Guardian newspaper) boldly pressed ahead with Apax in a March 2008 LBO of the media company Emap. Meanwhile, subprime mortgages and the financial alphabet soup of toxic assets replaced private equity in the headlines and in public consciousness. A few individual troubled deals, such as EMI, still generate headlines. But private equity firms have been mainly left alone to wrestle with over-indebted investments; in a few cases, to bring in outside investors (KKR, Apax, Apollo)7; and to work behind the scenes at bolstering their political support.
Like most parts of the financial services industry, buyout private equity is a global activity. Its biggest GPs and (especially) LPs still originate from North America. Regulation and some practices remain more local. But the fundamental economic principles are universal, and investment is increasingly global. This report will address buyouts generally, while paying particular attention to developments in the UK.
Left to wrestle with over-indebted investments
C S F I
10 CSFI 5 DERBY STREET, LONDON W1J 7AB Tel: 020-7493 0173 Fax: 020-7493 0190 E-mail: [email protected] Web: www.csfi.org.uk
8. “The Global Economic Impact of Private Equity Report 2009”, both figures in 2008 dollars.
9. Ernst & Young, “2010 global private equity watch”, April 2010.
10. Private Equity News, 8 February 2010.
Chapter 2: The official storyIn 1990, the total value of LBO deals done around the world was $29bn. By the peak in 2007, the figure had risen to $917bn – a compound growth rate of 23%.8 Between 2007 and 2009, the value of new deals fell by 85%.9 Even so, in July 2009 Boston Consulting Group estimated that buyout firms had undrawn commitments (cash they could invest) of $550bn. Assuming a standard 2:1 debt:equity ratio, and assuming that all of the commitments remained in place, this means they could potentially buy companies with a total value of around $1.5 trillion – the equivalent of about 100 Marks & Spencers.
Private equity managers’ own explanation for this startling growth is beguilingly simple: results. Here is a stylised version of the story. It has been quite consistent, although the emphasis undergoes subtle shifts in line with the political climate. Recently the emphasis has favoured “governance” (running companies better) over high returns:
- We run companies better. Stock market shareholders tend to own a small percentage of lots of different quoted companies, often not for very long. They behave like absentee landlords. By contrast, we are completely focused on a small number of companies that we own fully and for longer periods. Because we understand our companies better than the absentee landlords, we can judge the risks better and this allows us to borrow more money than the companies we buy would normally do. Not only is this tax-efficient, the discipline of debt also encourages greater efficiency in managers.
- The result is that we have historically generated high returns for our investors. Writing in February 2010, Simon Walker, chief executive of the BVCA, referred to “the superior returns [private equity] has long delivered relative to other asset classes”.10 “Between 1980 and 2005”, according to the Washington-based Private Equity Council (PEC), “top-quartile private equity firms delivered average annualized net returns of 39%, significantly beating the S&P 500 and other public market indices. Those superior returns helped strengthen several major public pension funds and defined benefit programs.” Moreover, as a form of “alternative investment” we provide our investors with valuable diversification.
- Although our fees may appear high, they are set in a competitive marketplace. We only do well if our investors do. If our investors thought we were doing a poor job, or were charging too much, they
'We only do well if our investors do'
C S F I
CSFI 5 DERBY STREET, LONDON W1J 7AB Tel: 020-7493 0173 Fax: 020-7493 0190 E-mail: [email protected] Web: www.csfi.org.uk 11
11. “TSC” stands for “Treasury Select Committee” and refers to the House of Commons Treasury Committee report “Private Equity”, published July-August 2007. Volume II of the report (pages Ev 1 – Ev 80) contains the oral evidence the committee heard, presented as a numerical sequence of questions and answers. “Q247” is the notation that the publication uses to refer to question number 247.
could choose to go elsewhere. Our investors are very sophisticated and we are fully accountable to them. They receive more information from us than the absentee landlord shareholders receive from quoted companies. There is no reason why we, or our individual companies, should have to provide more information than any other private company to anyone except our investors. We give them all the information they need and they continue to invest in our funds.
- Thanks to their support, we have grown to the point where we are now part of the corporate mainstream. “The underlying arguments for private equity as a force for good in business and the economy and hence society at large remain as convincing as ever,” Simon Walker told University of Chicago business school students in September 2009.
Control is a key part of the story. Classically, a private equity fund buys 100% of a company it invests in. If a company was previously quoted, this means taking it private. Control then allows private equity to do what it thinks it does best: align the interests of a company’s owners and managers. The PEC, on its website under “how private equity works”, says:
Without the pressures from outside public shareholders looking for short-term gains, private equity owners and the managers of their portfolio companies can focus in a laser-like way on what is required to improve long-term performance. This structure also makes it far easier to align the interests of owners with those of managers who also have a direct stake in the success of the company.
Closer alignment of owners and managers leads to “change” and “transformation”, two more key words in the private equity narrative. Robert Easton, of the Carlyle Group, said in evidence to the Treasury Select Committee (TSC, Q247)11: “I am a firm believer that we go in and transform companies and make a big difference to them.”
Easton is referring to the operational side of a business: management, strategy and so on. Private equity sponsors like to downplay the changes they make on the other side of the balance sheet, where they usually increase the amount of debt a company has. Abandoning the names “LBO Fund” and “leveraged equity” in favour of the more neutral “private equity” was one way of doing this. During the first private equity boom in the 1980s, sponsors were able to buy companies with only a 5% equity contribution (downpayment) – sometimes less, as in the case of Gibson Greetings. Lenders seemed to learn a lesson in the bust of the early 1990s and made private equity increase its downpayments. But standards were slipping again by the end of the recent boom. According to KKR’s Dominic Murphy, “if we look at leveraged
Control allows PE to do what it does best
C S F I
12 CSFI 5 DERBY STREET, LONDON W1J 7AB Tel: 020-7493 0173 Fax: 020-7493 0190 E-mail: [email protected] Web: www.csfi.org.uk
12. See for example Axelson, U., Jenkinson, T., Stromberg, P., Weisbach, M., “Leverage and Pricing in Buyouts: An Empirical Analysis”, SSRN preliminary draft August 24 2007, page 3.
13. E.g. Kaplan, Steven N., and Stromberg, Per, “Leveraged Buyouts and Private Equity”, Draft June 2008, SSRN.
[sic] levels in the 1980s we used to borrow 90% debt and put in 10% equity. The fact is that we are now putting in 30% equity. It is 70/30 and there is nothing wrong with it” (TSC Q288-89). This is roughly the mirror image of the capital structure of the average quoted company, where the ratio of debt to market capitalisation is more like 30/70.12 Some research suggests that buyouts used less debt in the most recent boom than they did in the 1980s.13 This is plausible, but debt still remains high compared with the average quoted company.
Private equity managers claim the high leverage they use is less risky than it seems because they understand each company better than absentee landlords. Dominic Murphy again: “From the KKR perspective, we are looking at businesses from the industrial standpoint. We do an incredible amount of due diligence and work both externally and internally with a broad team of advisers to assess the fundamental growth prospects of the industry, where that business sits within the industry and what unexploited potential that business has. We then design a capital structure around it with sufficient flexibility to ensure that it can withstand a full economic cycle.” (TSC Q282).
So private equity managers take full control; they run companies better; and they use more debt. They say the result is that they deliver impressive investment returns. These are usually expressed in one of two ways: either as a simple multiple of the cash invested or as an Internal Rate of Return (IRR) (see box on page 21.) The IRR provides an annualised percentage that seems easy to compare with other investments such as quoted equity markets. We have already seen the PEC claiming a 39% net return from top quartile managers over the period 1980-2005. Private equity managers generally focus on net returns, after fees have been deducted. One good reason for doing this is that the net return is what investors actually receive. But it also avoids drawing attention to the fee levels. And there is rarely any attempt to look beyond the headline return figure, either net or gross, to how the return was generated.
The most obvious question to ask is: how much of private equity’s headline return comes from the high debt levels? The PEC implies that it is less than it used to be: “Some suggest that private equity delivers its substantial returns mainly as a result of financial engineering and does little to create real-world value. In its early years, private equity firms could simply change a firm’s capital structure and make considerable profits. But that is no longer the case.” (See the website). But it provides no figures to back this up.
Several private equity representatives at the UK parliamentary hearings claimed that debt was not a big contributor to their returns. For example, Robert Easton,
Better understanding than absentee landlords
Rare to look beyond headline returns
C S F I
CSFI 5 DERBY STREET, LONDON W1J 7AB Tel: 020-7493 0173 Fax: 020-7493 0190 E-mail: [email protected] Web: www.csfi.org.uk 13
Carlyle: “…the reality is that studies show that a minor fraction of the returns that we generate for pensioners – we have a lot of pensioners who depend upon us – is from the use of leverage” (TSC Q249). Philip Yea, of 3i: “…the suggestion that it is all about leverage is one that worries me” (TSC Q252). No one seems to have asked them for evidence to back up these assertions.
High expected returns are not the only reason to choose an investment. Diversification – putting your eggs in more than one basket – provides an additional, or alternative, reason for investing in private equity. Since diversification means little to the public it does not appear in any headlines on the PEC website. No one seems to have mentioned it at the parliamentary hearings. But institutions do list diversification as a reason for investing in private equity. The UK National Association of Pension Funds’ booklet “Private equity made simple” (June 2008) says: “Another main attraction for institutional investors is the opportunity to diversify their portfolio by adding this asset class.”
Diversification may not mean much to the public, but it does to pension funds. So the PEC’s website is brimming with related numbers (“Private Equity: Fact and Fiction”). Managers at the UK parliamentary hearings also eagerly stressed their pension fund credentials. Damon Buffini, of Permira: “We have 30 million pensioners in our pension funds and millions of them are in the UK. For instance, we have at least one million local government employees, past and present, who invest in our funds, and we have produced world-class returns for them in an era when pension fund deficits are a big issue. I believe that is a big positive for the country.” (TSC Q244)
Pension funds are not just private equity’s biggest investors. According to private equity managers, they are also large and sophisticated. Damon Buffini again: “Our pension fund investors are some of the largest and most sophisticated in the world. They spend a huge amount of time doing due diligence on our funds and an inordinate amount of time looking at the alignment of interest between us and them.” (TSC Q427) Philip Yea refers to “very sophisticated investors” (TSC Q428). Since they are so large and so sophisticated, these investors can presumably look after themselves when it comes to negotiating fees: “[Fees are] negotiated between consenting adults based on a review of performance,” according to Robert Easton; “…the people whose money we are managing are getting good value overall and they are happy with it” (TSC Q368). Jon Moulton, then of Alchemy, now of Better Capital, is more equivocal: “It is a market; it is what the institutions are willing to pay.” (TSC Q643)
Because private equity investors are so sophisticated, there is apparently no need to worry about disclosure or transparency. Private equity sponsors say they provide lots of information to their investors. Sir David Walker told the TSC that “limited partners are generally very well satisfied with the flow of information, the disclosure and transparency to them. One or two of them have said they have more information than they can cope with.” (TSC Q492)
Managers stress pension fund credentials
C S F I
14 CSFI 5 DERBY STREET, LONDON W1J 7AB Tel: 020-7493 0173 Fax: 020-7493 0190 E-mail: [email protected] Web: www.csfi.org.uk
So much for the official private equity story. As already noted, the emphasis has shifted recently towards governance and away from returns, or away from “financial engineering” and towards “operational engineering”. The story has many influential supporters. Private equity firms rank among the most important clients for most big financial intermediaries: banks, lawyers, accountants, management consultants. The FSA’s November 2006 report on private equity mentioned one (unnamed) bank that earned almost €900m from its private equity-related activities in the year ending June 2006 ; “…Another bank was shown to generate over 50% of its income from private equity.” (Section 4.61)
Equally impressive figures applied in the case of other intermediaries. According to a BVCA press release dated 1 March 2007, the private equity industry “generates over £3.3 billion of revenue for professional services firms”. (Presumably the figure is lower today but everyone concerned will be hoping for a return to previous levels.) On 26 April 2007, Jonathan Guthrie described in the Financial Times how he had been unable to find an accountancy firm willing to discuss private equity and tax. "Our members don't want to discuss this,” an unnamed source at an accountancy body told Guthrie. “They are making lots of money advising on private equity deals. They fear a change to the rules.” Realistically, these kinds of intermediaries are not in a position to express a truly independent view about private equity.
Finance academics, too, have generally supported private equity. Trained to believe in free and efficient markets, they are naturally well disposed towards any mechanism that seems to promote that. Private equity claims to do so by aligning the interests of owners and managers. This gave private equity automatic appeal in the brave new free market world of the 1980s. The fact that it also challenged convention made it even more alluring. Michael Jensen’s famous article, “Eclipse of the Public Corporation” (Harvard Business Review, September-October 1989), set the tone for the debate.
In Britain alone, at least four universities now boast their own “private equity institute”, or equivalent: Nottingham University, London Business School, Oxford University’s Said Business School and Cass Business School in London. But when the Treasury Select Committee asked Sir David Walker about research generally, even this supporter of private equity was unusually blunt: “The BVCA, the trade association, and some very good work done at Nottingham University has cast quite a lot of light in this space but, frankly, it is partial and there is not independent verification of the data [emphasis added]….” (sic) (TSC Q495). As political scrutiny has grown over the last few years, several academics have responded by producing surveys that defend private equity’s impact on employment, investment, innovation and governance.14 These surveys often lack analysis of private equity’s returns for
14. Examples include: Kaplan, Steven N., and Stromberg, Per, “Leveraged Buyouts and Private Equity”, Draft June 2008, SSRN; Stromberg, P., “The Economic and Social Impact of Private Equity in Europe: Summary of Research Findings”, September 2009, SIFR; World Economic Forum, “The Global Economic Impact of Private Equity Report January 2008”; Jenkinson, T., “Private Equity”, part of the 2009 European Economic Advisory Group Report on the European Economy, February 2009 (www.cesifo.org).
PE firms rank among most important clients
Academic surveys defend impact on employment etc
C S F I
CSFI 5 DERBY STREET, LONDON W1J 7AB Tel: 020-7493 0173 Fax: 020-7493 0190 E-mail: [email protected] Web: www.csfi.org.uk 15
its investors. One reason for this is that it has been hard to obtain the necessary data from the firms. Starting in 2005, however, research has belatedly begun to shed some light on this issue.
Pre-crisis, British politicians mainly supported private equity. This was hardly surprising since the Labour government was proud of Britain’s leading role in financial services. In early 2007, the furore surrounding Boots and Sainsbury’s demanded a response. Ed Balls, then Economic Secretary to the Treasury, made a speech on 8 March that included some pointed references to private equity’s weak disclosure practices. “There has also been a lack of clear, consistent and complete information on the valuation and performance of private equity investments, and a consequent gap in the ability of institutional investors in handling the governance, monitoring and engagement issues raised by this new investment opportunity. This is not good either for the industry itself or for investors.” Three months later, the Treasury Select Committee hearings probed exactly this point. Private equity’s representatives and Sir David Walker all denied what Balls had said. They maintained that private equity’s investors receive all the information they need. In the end, however, Balls concluded: “…the evidence does not suggest that Government has any intrinsic reason either to ‘favour’ private equity or to do the opposite.”
Government’s laissez-faire attitude to private equity was bound to influence a fourth key group: regulators. But financial regulators have limited jurisdiction over private equity. A typical private equity fund in the UK is set up as an unregulated Collective Investment Scheme. Establishing and operating the fund, however, is a regulated activity. Most private equity managers own an FSA-registered entity which provides advice to a fund’s General Partner. But neither the GP, nor the LPs, nor the fund itself, nor any of its individual investments are regulated by the FSA.15
The FSA’s remit (pre-changes to the UK’s regulatory structure) gives it two main objectives vis à vis private equity. It wants to ensure that GPs live up to their contractual obligations towards their LPs. But it does not get involved in what those obligations should be on the grounds that LPs can look after themselves. The FSA also wants to be sure that private equity activity does not threaten the stability or efficient operation of financial markets. Both the FSA and the European Central Bank issued lengthy reports on this subject towards the end of the boom, concluding that private equity per se did not constitute a “systemic risk”.16
Complexity and the lack of public information make it hard for the media to cover private equity. Some of the coverage inclines towards sensationalism: huge deals/profits/bankruptcies! But even at the serious end of the media spectrum, private equity is not always accurately portrayed. In November 2004, The Economist published a reasonably balanced survey of private equity called “The new kings of capitalism”. But the 18 March 2010 issue included a short article about the difficult
15. FSA Discussion Paper 06/6, November 2006, page 17.
16. FSA Discussion Paper 06/6, November 2006; European Central Bank, “Large Banks and Private Equity-sponsored Leveraged Buyouts in the EU”, April 2007.
References to weak disclosure practices
Some media coverage inclined to sensationalise
C S F I
16 CSFI 5 DERBY STREET, LONDON W1J 7AB Tel: 020-7493 0173 Fax: 020-7493 0190 E-mail: [email protected] Web: www.csfi.org.uk
outlook for private equity. Its first 10 paragraphs dealt exclusively with buyout private equity. A final, eleventh, paragraph noted that European private equity could do with more examples like Google. Bracketing leveraged buyouts with Google (a venture capital start-up success) is like comparing a gas-guzzling sports utility vehicle with environmentally friendly car battery technology. For political purposes, however, it suits the buyout managers to “share the halo” of venture capital.
After looking at the official story, the time has come to consider some alternative points of view: first on private equity’s returns.
Debenhams case study (1)
In 2003, a consortium of private equity investors led by Texas Pacific Group (TPG) and CVC Capital Partners (CVC) took Debenhams private in an LBO. (Funds controlled by TPG and CVC together held about 60% of the shares in Debenhams just before the eventual flotation in May 2006.17 For convenience, “TPG/CVC” will refer collectively to all of the private equity investors.) This deal provides a useful example of how private equity works. Unusually, it also left a trail of publicly available information that allows its economics to be recreated in detail. And since Debenhams was bought and sold directly from and to the stock market, it is impossible to deny the influence of the stock market on the deal’s economics.
Debenhams was a very successful transaction for its private equity investors from 2003 until they re-floated the company in 2006. That is the period that this analysis uses to illustrate how private equity works. Since the re-flotation in 2006, Debenhams has not done so well. From 4 May 2006 to 31 May 2010, its share price underperformed Marks & Spencer’s by 47% and the FTSE 350 General Retailers index by 54%.
TPG/CVC paid about £1.9bn in December 2003 to take Debenhams private after a competitive auction. The purchase price represented about 7.8 times Debenhams’ 2003 earnings before interest, tax, depreciation and amortisation (ebitda) of £245m. Since this was early in the decade, leverage was relatively modest. TPG/CVC put in £608m (a down-payment of 32%) and borrowed £1.3bn, which represented leverage (net debt/ebitda) of about 5.3 times.
Like many retail chains, Debenhams really consisted of two separate companies: a retailing business (“Opco”), which sold merchandise to the public; and a property business (“Propco”), which in Debenhams’ case owned about 25 out of its portfolio of 100 stores. Debenhams rented the rest of its stores. The debt that TPG/CVC borrowed to buy Debenhams mirrored this split: £915m was secured on the retailing business, the balance on the properties that Debenhams owned. The new owners
17. Debenhams “IPO Pricing Information” – no date given, but identified as “supplemental to the preliminary document dated 24 April 2006”.
Purchase price of7.8 times ebitda
C S F I
CSFI 5 DERBY STREET, LONDON W1J 7AB Tel: 020-7493 0173 Fax: 020-7493 0190 E-mail: [email protected] Web: www.csfi.org.uk 17
immediately set about selling Propco. In February 2005, British Land bought the stores for £490m and rented them back to Debenhams. Debenhams received about £120m in cash from this transaction (the other £370m consisted of property debt that British Land took over). The property sale was just one of a series of transactions in 2004-05: a high yield (or “junk”) bond in May 2004, the property deal in February 2005 and another debt financing in May 2005. This last one, a £1.8bn bank loan, was the biggest. Debenhams used the cash to pay off the high yield bonds from the previous year, repay existing bank loans and then distribute £1bn in what was effectively a dividend to the private equity shareholders. By itself the £1bn that they received out of this £1.8bn loan gave the private equity investors a 66% return on their original £600m investment. Who was the generous lender? Most of the £1.8bn loan was provided by Royal Bank of Scotland, HBOS, Lloyds and Barclays.
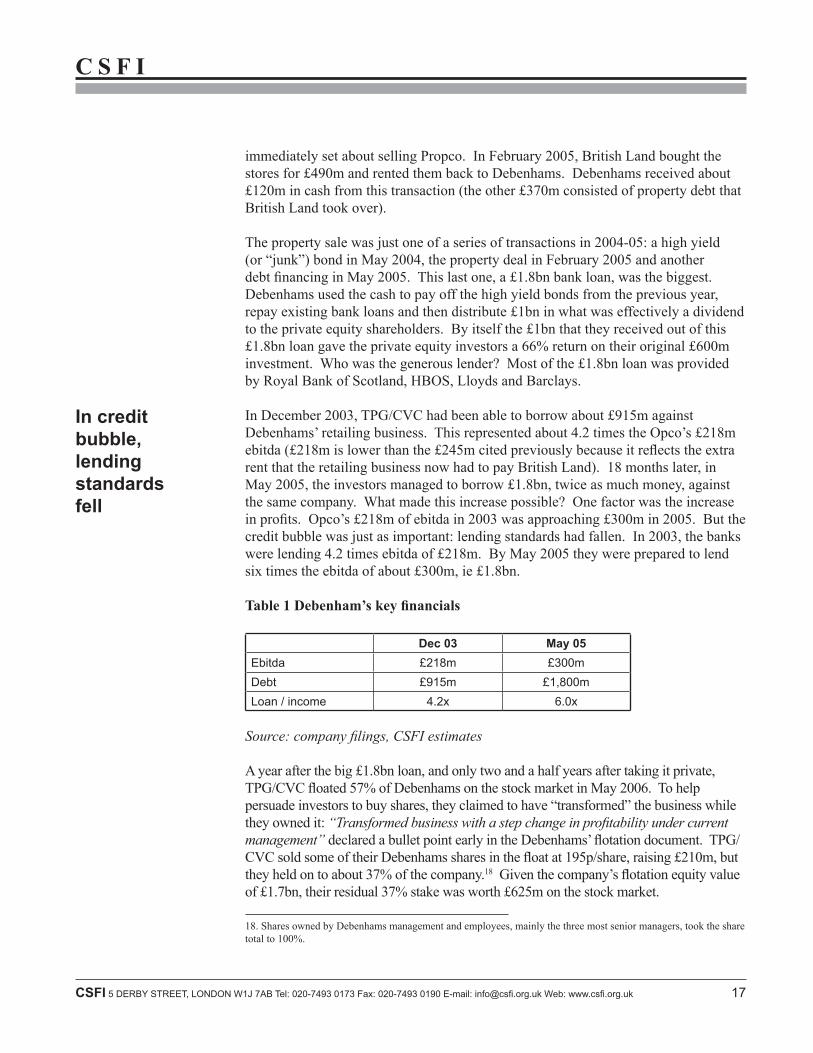
In December 2003, TPG/CVC had been able to borrow about £915m against Debenhams’ retailing business. This represented about 4.2 times the Opco’s £218m ebitda (£218m is lower than the £245m cited previously because it reflects the extra rent that the retailing business now had to pay British Land). 18 months later, in May 2005, the investors managed to borrow £1.8bn, twice as much money, against the same company. What made this increase possible? One factor was the increase in profits. Opco’s £218m of ebitda in 2003 was approaching £300m in 2005. But the credit bubble was just as important: lending standards had fallen. In 2003, the banks were lending 4.2 times ebitda of £218m. By May 2005 they were prepared to lend six times the ebitda of about £300m, ie £1.8bn.
Table 1 Debenham’s key financials
Dec 03 May 05Ebitda £218m £300mDebt £915m £1,800mLoan / income 4.2x 6.0x
Source: company filings, CSFI estimates
A year after the big £1.8bn loan, and only two and a half years after taking it private, TPG/CVC floated 57% of Debenhams on the stock market in May 2006. To help persuade investors to buy shares, they claimed to have “transformed” the business while they owned it: “Transformed business with a step change in profitability under current management” declared a bullet point early in the Debenhams’ flotation document. TPG/CVC sold some of their Debenhams shares in the float at 195p/share, raising £210m, but they held on to about 37% of the company.18 Given the company’s flotation equity value of £1.7bn, their residual 37% stake was worth £625m on the stock market.
18. Shares owned by Debenhams management and employees, mainly the three most senior managers, took the share total to 100%.
In credit bubble, lending standards fell
C S F I
18 CSFI 5 DERBY STREET, LONDON W1J 7AB Tel: 020-7493 0173 Fax: 020-7493 0190 E-mail: [email protected] Web: www.csfi.org.uk
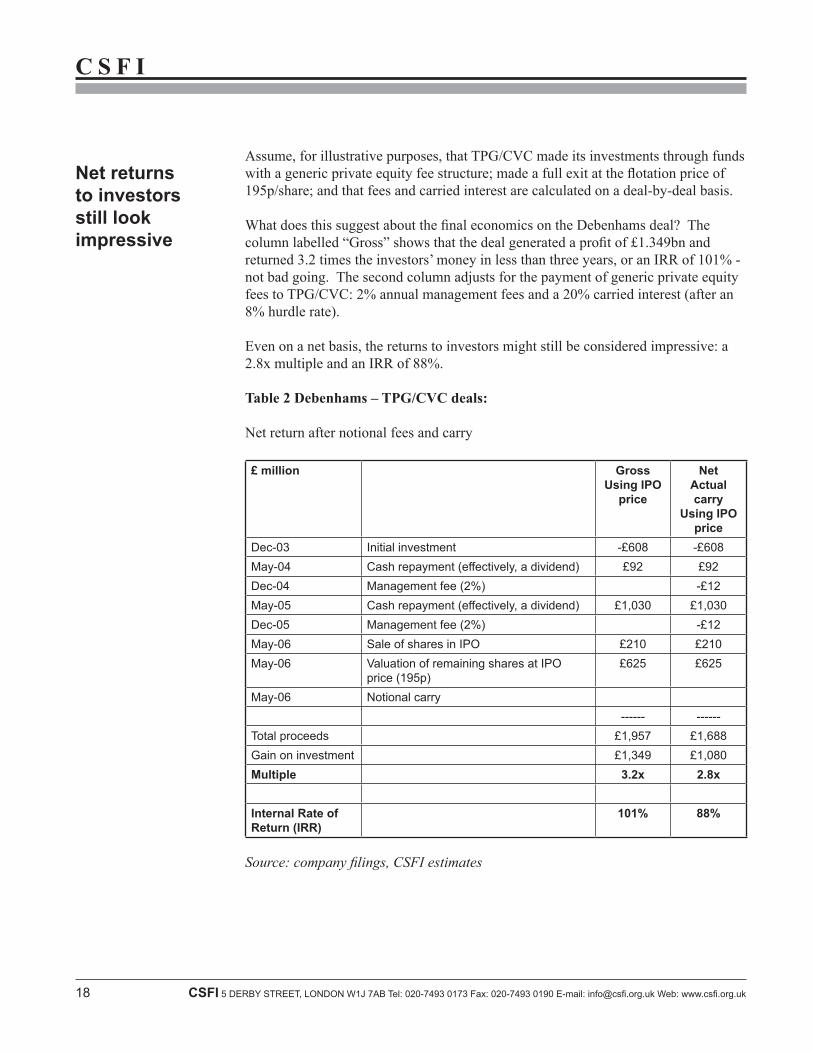
Assume, for illustrative purposes, that TPG/CVC made its investments through funds with a generic private equity fee structure; made a full exit at the flotation price of 195p/share; and that fees and carried interest are calculated on a deal-by-deal basis.
What does this suggest about the final economics on the Debenhams deal? The column labelled “Gross” shows that the deal generated a profit of £1.349bn and returned 3.2 times the investors’ money in less than three years, or an IRR of 101% - not bad going. The second column adjusts for the payment of generic private equity fees to TPG/CVC: 2% annual management fees and a 20% carried interest (after an 8% hurdle rate).
Even on a net basis, the returns to investors might still be considered impressive: a 2.8x multiple and an IRR of 88%.
Table 2 Debenhams – TPG/CVC deals:
Net return after notional fees and carry
£ million GrossUsing IPO
price
NetActual carry
Using IPO price
Dec-03 Initial investment -£608 -£608May-04 Cash repayment (effectively, a dividend) £92 £92Dec-04 Management fee (2%) -£12May-05 Cash repayment (effectively, a dividend) £1,030 £1,030Dec-05 Management fee (2%) -£12May-06 Sale of shares in IPO £210 £210May-06 Valuation of remaining shares at IPO
price (195p)£625 £625
May-06 Notional carry------ ------
Total proceeds £1,957 £1,688Gain on investment £1,349 £1,080Multiple 3.2x 2.8x
Internal Rate of Return (IRR)
101% 88%
Source: company filings, CSFI estimates
Net returns to investors still look impressive
C S F I
CSFI 5 DERBY STREET, LONDON W1J 7AB Tel: 020-7493 0173 Fax: 020-7493 0190 E-mail: [email protected] Web: www.csfi.org.uk 19
Chapter 3: What is the real story on returns?The first test private equity has to pass is: does it generate attractive returns for investors? Many discussions of private equity in the past have focused on emotive, headline-grabbing issues such as employment, bankruptcy or tax.19 More recently, supporters have emphasised that private equity runs companies better – “governance”. While these are important issues, relative to the basic question of returns they are second order.
Private equity’s returns are not as impressive as is widely believed – especially after fees. According to Oliver Gottschalg and Ludovic Phalippou, writing in 2009: “Performance of private equity funds reported by industry associations and previous research is overstated.”20 Simply establishing what past returns have been is harder than you might expect. What was the return on the FTSE 100 stock market index over the last 1/5/10 years? A few clicks on the internet will give you uniform data from multiple sources, consistently calculated and audited. What was the return on private equity over the last 1/5/10 years? Not quite so straightforward.
A legitimate reason for this is that private equity is inherently complicated. Investors’ cash is invested and then returned at unpredictable intervals over periods of up to 10 years. This makes private equity a genuinely different animal from a quoted stock market investment. It also raises issues involving valuation and the measurement of returns.
Valuation and measures of investment return
Valuation of unrealised investments. Private equity generally invests in unquoted shares. Without a stock market quotation, valuing these shares before they are sold is necessarily subjective. But these subjective valuations are used to calculate an investor’s return. So the more unsold investments there are in a fund, the more subjective (and open to manipulation) the return is. In practice, this means that returns for older funds, which have sold more of their investments and returned more cash to investors, are more reliable than returns for younger funds, which may still contain a lot of unsold investments.
Here is how private equity firm Apollo describes the quarterly valuations of its private equity investments: “We are responsible for determining the fair value of our private 19. eg Service Employees International Union, “Behind the Buyouts”, April 2007; and Poul Nyrup Rasmussen, “Taming the Private Equity ‘Locusts’”, April 4 2008, available at http://www.project-syndicate.org/commentary/rasmussenp1/English (accessed 20 February 2010).
20. Gottschalg, O., and Phalippou, L., “The Performance of Private Equity Funds”, Review of Financial Studies, Vol. 22, Number 4, 2009.
Returns are not as impressive as believed
C S F I
20 CSFI 5 DERBY STREET, LONDON W1J 7AB Tel: 020-7493 0173 Fax: 020-7493 0190 E-mail: [email protected] Web: www.csfi.org.uk
equity fund portfolio investments on a quarterly basis in good faith, subject to the approval of the advisory board for the relevant private equity fund. We have retained independent valuation firms to provide third-party valuation consulting services to the company which consist of certain limited procedures that the company identifies and requests them to perform. Upon completion of the limited procedures, the independent valuation firms generally assess whether the fair value of those investments subjected to the limited procedures do not appear to be unreasonable. The limited procedures do not involve an audit, review, compilation or any other form of examination or attestation under generally accepted auditing standards” [emphasis added].21 The equivocal term, “do not appear to be unreasonable”, is almost identical to filings by KKR.22
Which measure of return? Private equity managers and investors mainly use two measures of investment return: the multiple and the internal rate of return (IRR). Each has significant advantages and disadvantages. But even in combination, they fail to give a truly accurate picture of the annual return. The IRR generally overstates the returns that investors actually earn. A third measure, the modified internal rate of return (MIRR), compensates for this shortcoming, but is rarely used.
The multiple simply describes how much someone’s investment has risen in value, for example a 4.0x multiple would mean that a £100 investment has grown to £400. The £400 may include both cash that the investor has received after investments are sold (the “realised” return) and the value of investments that have not been sold (the “unrealised” return). If a fund has sold all of its investments, the multiple has the advantage of being both objective (cash is cash) and intuitive (how much cash did I get back compared with how much I put in?) But the multiple has one major disadvantage: it ignores time. Four times your money after 10 years is not as good as four times after five years. And it is difficult to compare the multiple with returns on other asset classes, such as the stock market, which are usually expressed as an annual percentage rate.
To capture time, private equity participants use the internal rate of return. Since it is expressed as an annual percentage rate, the IRR seems easy to compare with returns on more conventional investments. Assume that two funds (A and B) each invest £100 in 2010 in just one company. Fund A returns £400 in 2015. Fund B’s investors have to wait until 2020 for their £400. The simple multiple would not distinguish between A and B, since they both delivered 4.0x the initial investment. This is where the IRR comes to the rescue: Fund A has an IRR of 32% while Fund B’s is 15%.
On the face of it, the industry’s standard combination of multiple and IRR covers all the bases. Assuming all or most of a fund’s investments have been sold, the multiple is a clean, no-nonsense measure of cash return. “You can’t eat an IRR”, is a proverbial pension fund trustee observation. Meanwhile the IRR gives due credit to time.
21. Apollo Global Management LLC, S-1 Amendment No. 4, page 209, filed with the SEC on 22 March 2010.
22. KKR & Co LP, S-1, page 114, filed with the SEC on 12 March 2010. In previous filings, both Apollo (23 November 2009) and KKR (31 October 2008) used similar language and named Duff & Phelps as a valuation advisor.
Equivocal: 'do not appear to be unreasonable'
The IRR gives due credit to time
C S F I
CSFI 5 DERBY STREET, LONDON W1J 7AB Tel: 020-7493 0173 Fax: 020-7493 0190 E-mail: [email protected] Web: www.csfi.org.uk 21
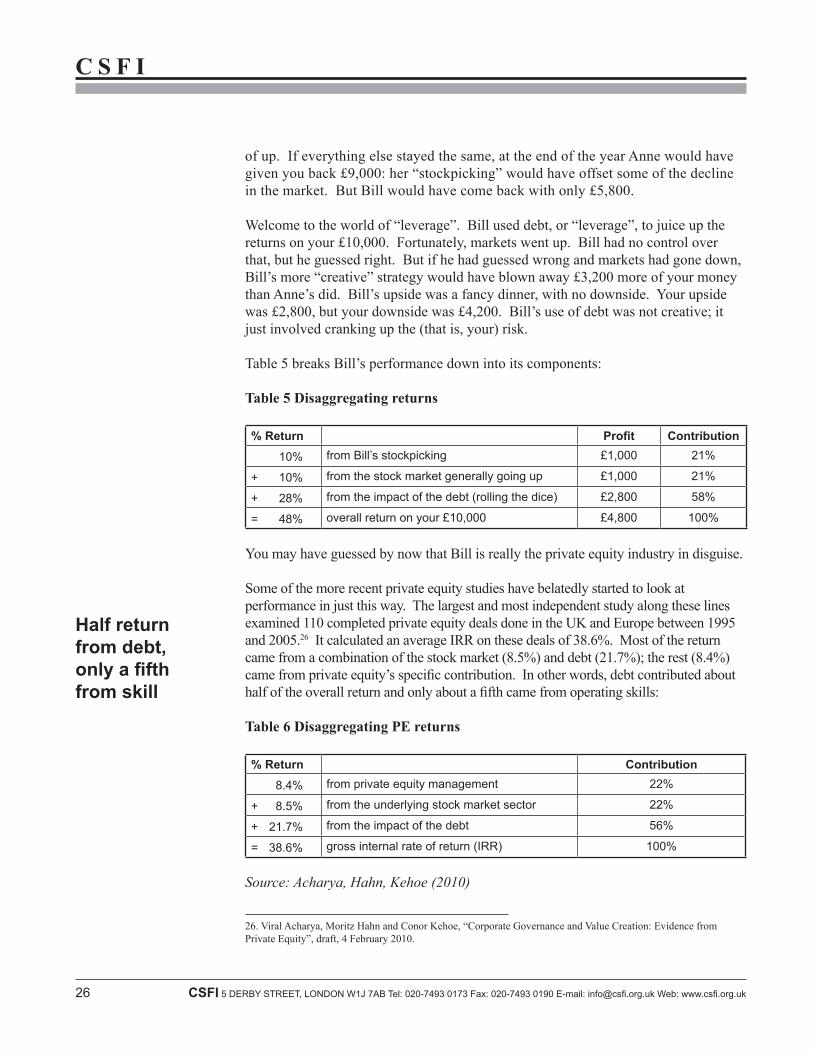
Unfortunately, the IRR has an important drawback: it cannot usually be compared with the percentage returns on other investments.23 This is because the calculation makes one often unrealistic assumption: that all of an investor’s cash is invested at the same compound rate throughout the whole life of a fund. Take Fund A. In that very simple example, with just one investment, the IRR was 32%. Its investors also actually earned 32% each year on all of their investment because it stayed invested in that one company the whole five years. Now imagine a Fund C that invested £100 in two companies. One company was sold for £150 in 2012; the other, for £56 in 2015. Fund C’s IRR is the same as Fund A’s: 32%. But the investors who got £150 back in 2012 would probably not have been able to reinvest their £150 at 32%. Assume that when Fund C’s investors receive £150 in 2012, they only manage to reinvest the cash at 12% per annum. That would bring down the annual return they actually earned on their investment from 32% to 22%. This calculation is called the modified internal rate of return (MIRR).
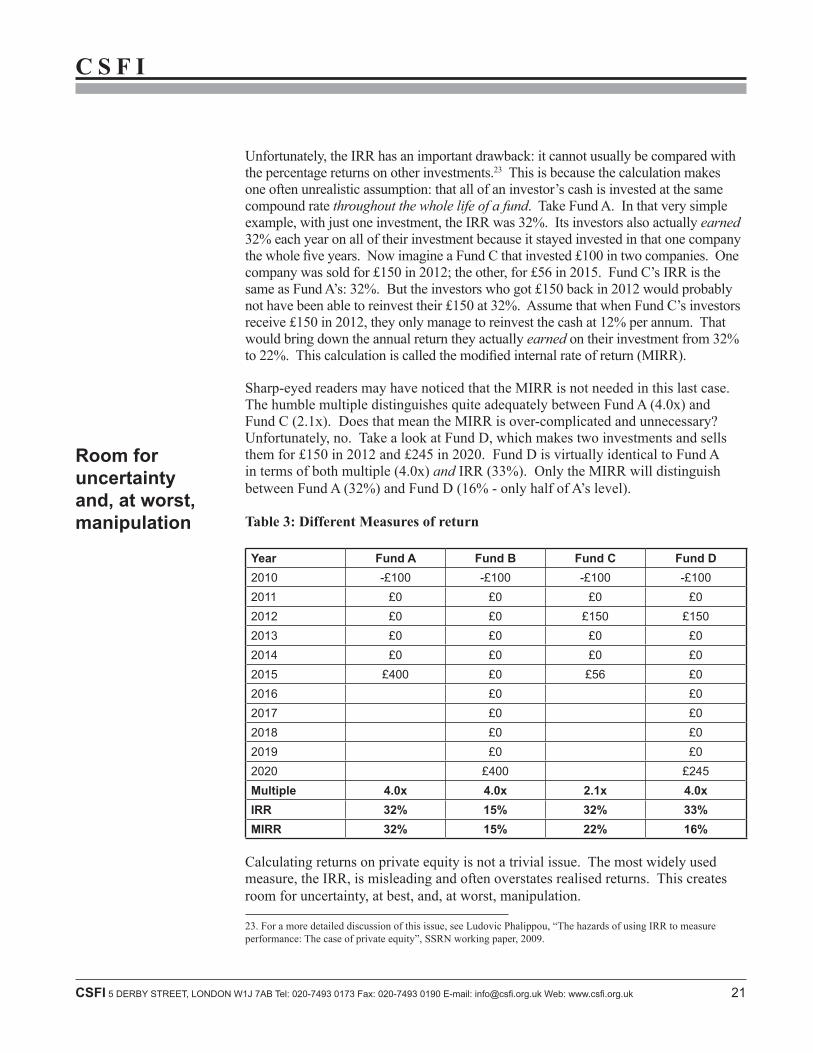
Sharp-eyed readers may have noticed that the MIRR is not needed in this last case. The humble multiple distinguishes quite adequately between Fund A (4.0x) and Fund C (2.1x). Does that mean the MIRR is over-complicated and unnecessary? Unfortunately, no. Take a look at Fund D, which makes two investments and sells them for £150 in 2012 and £245 in 2020. Fund D is virtually identical to Fund A in terms of both multiple (4.0x) and IRR (33%). Only the MIRR will distinguish between Fund A (32%) and Fund D (16% - only half of A’s level).
Table 3: Different Measures of return
Year Fund A Fund B Fund C Fund D2010 -£100 -£100 -£100 -£1002011 £0 £0 £0 £02012 £0 £0 £150 £1502013 £0 £0 £0 £02014 £0 £0 £0 £02015 £400 £0 £56 £02016 £0 £02017 £0 £02018 £0 £02019 £0 £02020 £400 £245Multiple 4.0x 4.0x 2.1x 4.0xIRR 32% 15% 32% 33%MIRR 32% 15% 22% 16%
Calculating returns on private equity is not a trivial issue. The most widely used measure, the IRR, is misleading and often overstates realised returns. This creates room for uncertainty, at best, and, at worst, manipulation.
23. For a more detailed discussion of this issue, see Ludovic Phalippou, “The hazards of using IRR to measure performance: The case of private equity”, SSRN working paper, 2009.
Room for uncertainty and, at worst, manipulation
C S F I
22 CSFI 5 DERBY STREET, LONDON W1J 7AB Tel: 020-7493 0173 Fax: 020-7493 0190 E-mail: [email protected] Web: www.csfi.org.uk
A less legitimate reason for the obscurity of private equity returns is the private equity industry’s history of secrecy. Complexity and secrecy have together allowed private equity managers to engage in some artful obfuscation. To quote the FSA’s 2006 Discussion Paper:
In fact, the methodology for the reporting of performance to investors is not standardised and comparable performance data across the asset class as a whole is not available. Indeed, we have identified a strong reluctance to providing such information. Some believe that this is allowing poor performance to be masked. [Emphasis added.]
The problem with not having agreed standards on performance reporting is that performance is reported in a variety of ways. Internal rates of return can be calculated on a variety of assumptions but the assumptions made make a material difference to the results. It is rare for two firms to calculate IRR (the Internal Rate of Return) in exactly the same way. There are also potential confusions about reporting on the performance of the fund as opposed to investment performance.
Off the record, some academics will admit that even today, after 30 years of growth in private equity investing, they still do not have enough data to make a comprehensive assessment of its track record. The UK’s 2007 Walker Report takes some steps in the right direction on this issue, without going far enough.
What makes an “attractive” investment?
Before turning to such return data as is available, we should first be clear about what exactly would make the investment return “attractive”. Imagine an investor making a commitment to a private equity fund. The investor assumes the private equity firm will use its cash and a lot of debt to buy companies (ie shares), run them for a few years and then sell them. In principle, the investor could borrow to buy shares itself in the stock market. As Lord Myners put it in a speech to the BVCA summit in October 2009, “simply applying debt leverage produces outcomes not dissimilar to leveraging a public equity portfolio, which the end investor can do without the intervention of expensive general partners”. The only reason for investing with a private equity firm is if the private equity firm can produce an extra layer of return, over and above the stock market and the extra debt.
To be “attractive”, therefore, private equity’s investment return must:
• outperform the quoted stock market;• excluding the impact of extra risk (ie debt, as well as low liquidity); and• after fees.
Engaging in some artful obfuscation
Return must outperform net of extra risk and fees
C S F I
CSFI 5 DERBY STREET, LONDON W1J 7AB Tel: 020-7493 0173 Fax: 020-7493 0190 E-mail: [email protected] Web: www.csfi.org.uk 23
An influential piece of academic research into private equity returns appeared in 2005.24 Steven Kaplan and Antoinette Schoar found that, net of fees, the average buyout fund underperformed the stock market (S&P 500). The median buyout fund delivered 83% of the S&P 500 return; the mean 93%. Kaplan and Schoar’s findings suggest that an investor in the average buyout fund would have done better to invest in the S&P 500 between 1980 and 2001. This is even before making any adjustments for the extra risk. But another of Kaplan and Schoar’s findings was good news for the private equity community. Even though the average fund underperformed the stock market, some did outperform. Most remarkably, this appeared to be predictable. “General Partners (GPs) whose funds outperform the industry in one fund are likely to outperform the industry in the next and vice versa.” As Kaplan and Schoar point out, “These findings are markedly different from the results for mutual funds…” Think of the mandatory small print that appears at the bottom of every regulated investment product: “Past performance can be no guide to future performance.” Kaplan and Schoar’s report seemed to suggest this does not apply to private equity.
The buyout community greeted this finding with predictable relief. Its key elements – “persistence” (ie consistent performance) and “top-quartile” – rapidly became part of the standard narrative. Every private equity manager could either claim to be top-quartile or on its way there. Intermediaries such as funds of funds suddenly became more attractive because of the importance of identifying top-quartile firms. Every investor (LP) could claim to have invested, or to be about to invest, with top-quartile firms. The Private Equity Council singles out (but does not name) “top-quartile” firms on its website.
Meanwhile, a few basic points seem to have got lost. To state the most obvious, not everyone can be top-quartile. Private equity investment is not Garrison Keillor’s fictional Lake Wobegon, where “all the children are above average”. Kaplan and Schoar’s report suggests that private equity as a whole destroys value for investors. The same is true of conventional fund management as well. But the structure of private equity (in particular, its fees) means the relative value destruction (and its counterpart, rent extraction) in private equity is likely to be bigger. Second, Kaplan and Schoar made no attempt to break down the overall return into different components. We have no way of telling whether the return that their “top-quartile” performers generated came from the stock market, from the extra debt, or from something else such as better governance.
At least in public, private equity firms rarely provide any breakdown of their returns. (In private, it is likely that they provide breakdowns that are detailed, but conveniently ignore the stock market. This allows private equity firms to take credit for everything that happens to a company they buy, even what would have taken place if they had not been in charge.) The most common language for discussing returns is the IRR.
24. Kaplan, Steven N., and Schoar, Antoinette, 2005, “Private equity returns: Persistence and capital flows”, Journal of Finance 60, 1791-1823. The authors’ sample consisted of 746 funds over the period 1980-2001. (169 of them were buyout funds, the remainder venture capital.)
Average buyout fund underperformed the market
Not everyone can be top-quartile
C S F I
24 CSFI 5 DERBY STREET, LONDON W1J 7AB Tel: 020-7493 0173 Fax: 020-7493 0190 E-mail: [email protected] Web: www.csfi.org.uk
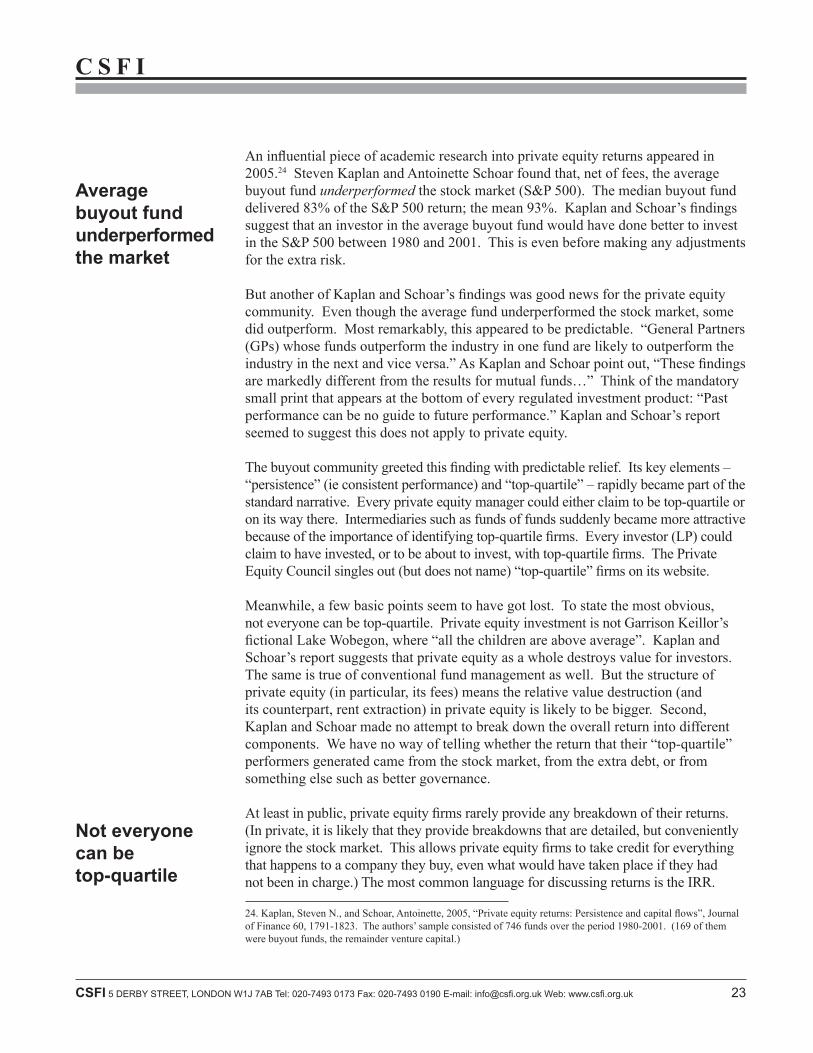
The Private Equity Council says that top-quartile managers have earned net returns (presumably it means IRR, though it does not specify) of 39% from 1980-2005. At least three major global firms have filed documents with the Securities and Exchange Commission in which they use IRR to express their long-term private equity returns:
Table 4 SEC filings for major PE groups
Apollo Blackstone KKRPrivate Equity Assets under Management
$34 billion (12/09) $24.8 billion (12/09) $38.8 billion (12/09)
Document reference S1 Amendment 4, 23 March 2010
S1 Amendment 9, 21 June 2007
S1, 12 March 2010
Return period From inception through December 31 2009
From inception (1987) through March 2007)
Through December 31 2009
Measure of return irr irr irrGross return 39% p.a. 30.7% p.a. 25.8% p.a.Net return 26% p.a. 22.6% p.a. 19.2% p.a.Implied all-in annual cost
13% p.a. 8.1% p.a. 6.6% p.a.
Equity market comparable
na na S&P 500 11.5% p.a.
Source: companies, SEC filings
Annualised percentage returns in the mid-twenties or higher sound spectacular. They are an order of magnitude better than what investors have received from the stock market over comparable periods. On the face of it, they make it easy to understand why investors have rushed into private equity.
Unfortunately, an IRR cannot be simply compared with a return on the stock market for the reasons set out above. For what it means in practical terms, we can turn to work done by Oliver Gottschalg and Ludovic Phalippou. The Harvard Business Review published a summary of their findings in December 2007.25 This showed that, for the period 1980-2004, the best (top 25%) managers generated a conventional IRR of 35%. This is similar to the Private Equity Council’s claim of 39% and the three managers’ results shown in Table 4. Using a Modified IRR, however, the same data produce a top-quartile return of only 19%.
This is a staggering difference: 19% per annum is better than the stock market, certainly. But it remains mortal rather than superhuman – and we do not know how much of the 19% comes from using extra debt. Perhaps the details of how an investment return is calculated, and even the number itself, seem arcane. But they could hardly be more important. An investment’s return is the reason to buy it in
25. Gottschalg, O., and Phalippou, L., “The Truth About Private Equity Performance”, Harvard Business Review, December 2007. The authors’ sample included 1,184 private equity funds covering the period 1980-2004.
Easy to understand why investors rushed in
C S F I
CSFI 5 DERBY STREET, LONDON W1J 7AB Tel: 020-7493 0173 Fax: 020-7493 0190 E-mail: [email protected] Web: www.csfi.org.uk 25
the first place. In private equity’s case, the high returns it advertises have been the cornerstone of its phenomenal success over the last 30 years. Both implicitly and explicitly, private equity managers have been routinely comparing their IRRs to stock market returns. At least some investors have probably been doing the same.
But the comparison is not really valid. It is like selling a car based on a fuel consumption rate of 40 miles to the gallon, even though that rate only applies if the car is driven at a constant 30 miles an hour, with no braking, on a road with no gradients. In urban traffic, the fuel consumption may be 20 miles per gallon. The car’s advertised consumption rate of 40 miles per gallon is, therefore, true – but it is a misleading half-truth.
Even if you take the industry’s claims about its historic returns at face value, private equity comes up short. Accept for a moment the headline figures that the top performers claim: from the mid-twenties upwards. Should investors be excited about these returns? Yes and no. Time and reinvestment are not the only factors you have to think about. Another important one is risk. It turns out that less than half of private equity returns come from the superior governance that its managers tout. The biggest single contributor is high debt.
To see how this works, imagine that an elderly aunt leaves you £20,000 in her will. As a financial novice, you ask two more worldly friends to invest £10,000 each on your behalf in the stock market. As you expected, Anne diligently reads the financial pages and picks the best companies she can find. At the end of the year, she comes back with £12,000 – an increase of 20%. The FTSE 100 index rose by only 10% during this particular year, so if you had just bought an index-tracking fund your money would now be worth £11,000. Anne has made you £1,000 better off; you buy her a nice bottle of wine to say thank you.
Your other friend, Bill, turns out to be more imaginative than Anne. When Bill comes back at the end of the year, he has turned your £10,000 into £14,800: a full £2,800 more than Anne managed. Over dinner (on you) at the finest local restaurant, you ask Bill how he did it.
Bill explains that he started out pretty confident the market would go up this year. So he took your £10,000 to the bank and asked the bank manager to lend him another £20,000 to invest in the stock market. The manager agreed to do it in return for a 6% interest rate, and for taking security over your portfolio. Now Bill had £30,000 to invest. Like Anne, Bill used the money to buy the shares he thought would do best. At the end of the year Bill’s pile had grown at exactly the same rate as Anne’s portfolio. But a 20% return had taken Bill’s expanded portfolio from £30,000 to £36,000. Bill sold enough shares to repay the bank loan and its interest charge, leaving the £14,800 that he returned to you.
Who did better: Anne or Bill? On the face of it, Bill did. He made a return of +48%, compared with Anne’s modest +20%; he made you £2,800 better off than Anne did. But Bill took a lot more risk with your money in the process: he rolled the dice. Suppose the stock market had gone down by 20% during the year instead
Less than half returns come from better governance
'Bill' tooka lot more risk withyour money
C S F I
26 CSFI 5 DERBY STREET, LONDON W1J 7AB Tel: 020-7493 0173 Fax: 020-7493 0190 E-mail: [email protected] Web: www.csfi.org.uk
of up. If everything else stayed the same, at the end of the year Anne would have given you back £9,000: her “stockpicking” would have offset some of the decline in the market. But Bill would have come back with only £5,800.
Welcome to the world of “leverage”. Bill used debt, or “leverage”, to juice up the returns on your £10,000. Fortunately, markets went up. Bill had no control over that, but he guessed right. But if he had guessed wrong and markets had gone down, Bill’s more “creative” strategy would have blown away £3,200 more of your money than Anne’s did. Bill’s upside was a fancy dinner, with no downside. Your upside was £2,800, but your downside was £4,200. Bill’s use of debt was not creative; it just involved cranking up the (that is, your) risk.
Table 5 breaks Bill’s performance down into its components:
Table 5 Disaggregating returns
% Return Profit Contribution
10% from Bill’s stockpicking £1,000 21%
+ 10% from the stock market generally going up £1,000 21%
+ 28% from the impact of the debt (rolling the dice) £2,800 58%
= 48% overall return on your £10,000 £4,800 100%
You may have guessed by now that Bill is really the private equity industry in disguise.
Some of the more recent private equity studies have belatedly started to look at performance in just this way. The largest and most independent study along these lines examined 110 completed private equity deals done in the UK and Europe between 1995 and 2005.26 It calculated an average IRR on these deals of 38.6%. Most of the return came from a combination of the stock market (8.5%) and debt (21.7%); the rest (8.4%) came from private equity’s specific contribution. In other words, debt contributed about half of the overall return and only about a fifth came from operating skills:
Table 6 Disaggregating PE returns
% Return Contribution
8.4% from private equity management 22%
+ 8.5% from the underlying stock market sector 22%
+ 21.7% from the impact of the debt 56%
= 38.6% gross internal rate of return (IRR) 100%
Source: Acharya, Hahn, Kehoe (2010)
26. Viral Acharya, Moritz Hahn and Conor Kehoe, “Corporate Governance and Value Creation: Evidence from Private Equity”, draft, 4 February 2010.
Half return from debt, only a fifth from skill
C S F I
CSFI 5 DERBY STREET, LONDON W1J 7AB Tel: 020-7493 0173 Fax: 020-7493 0190 E-mail: [email protected] Web: www.csfi.org.uk 27
A similar study of three groups of deals came up with similar conclusions: debt was the biggest contributor, on average providing nearly half the overall return.27
Historically, the buyout community has tended to claim that leverage is not an important part of buyout returns, and that its returns are unrelated to the stock market. This allows managers to claim they deserve a different (ie higher) compensation scheme than regular fund managers. Not only is the former incorrect, but the latter has been exposed as a myth by at least one recent piece of research: “Contrary to common arguments by private equity fund managers, results show a close connection between public and private equity.”28
Where debt is concerned, there is a common-sense way to tell that LBO returns are mainly about leverage. Ignore what private equity firms say, and pay attention to what they do. Historically, they have invested significantly less when debt financing dried up – as in 2008 and 2009, for example. They often claim this is because valuations are too high. In reality, they stop investing because they are rational, self-interested investors. They know that most of their carried interest comes from using high levels of debt. They should wait until debt financing becomes available again. If buyouts were really just about running companies better, private equity firms would be indifferent to the amount of debt financing they can raise. They might even invest more when debt markets were depressed.
Why does debt matter? Private equity managers point to debt’s advantages, such as tax-deductibility and the way it helps to discipline company management teams. This cleverly sidesteps the point. Whatever other advantages it may have, using debt basically means adding risk. The risk is all taken by the investors (you, in the case of the legacy you entrusted to Bill) – and, beyond them, by the taxpayers who underwrite the world’s financial system. But a disproportionate share of the upside goes to the managers, in the form of fees and profit share.
Fees
This seems an appropriate point to turn to fees. Like so many other aspects of private equity, its fees are complex. Since some of them depend on performance, they are also unknowable in advance. But some information is available, both actual and estimated. Securities and Exchange Commission filings by Apollo, Blackstone and KKR, for instance, indicate actual all-in costs over long periods (20 years or more) ranging from 6.6% per annum to 13% (see Table 4). These actual figures are similar to estimates published by David Swensen, who runs Yale University’s endowment
27. Ernst &Young, BVCA Walker portfolio companies report 2008, available at http://www.walker-gmg.co.uk.
28. Gottschalg, O., Phalippou, L., and Lopez-de-Silanes, F., “Giants at the gate: Diseconomies of scale in private equity”, SSRN, 3rd draft Dec 25 2009.
A myth that returns not related to stock market
Disproportionate share of upside goes to managers
C S F I
28 CSFI 5 DERBY STREET, LONDON W1J 7AB Tel: 020-7493 0173 Fax: 020-7493 0190 E-mail: [email protected] Web: www.csfi.org.uk
(12% per annum), and Ludovic Phalippou (7%).29 We can use a conservative 8% per annum for the cost of investing in a successful buyout fund.
To put this in context, the management fee on a typical stock market unit trust is around 1% per annum. Private equity managers would obviously contend that they provide a much greater service than the unit trust manager – after all, they actually control and run the companies they invest in – and the returns they generate are much higher.
But we have just seen that most of private equity’s returns come from a combination of the stock market (more or less what a unit trust manager does) and from debt (rolling the dice with investors’ money). The study by Acharya et al suggested that, by itself, private equity managers’ operational skills contributed about 8% per annum of annual return. Combine that with our fee estimate of 8% per annum: it looks as though private equity managers may take out in fees all of the return that their vaunted operating skills contribute. The investors might as well have borrowed money themselves to invest in the stock market. As Acharya et al remark (in their footnote 2), “…it could simply be that PE funds keep the value they create through fees. The puzzle…is thus more about why their investors (the limited partners) choose to invest in this asset class as a whole…” And this is in a benign economic scenario (Acharya et al’s study covered the period 1995-2005). If things go less well in future, the private equity managers will still get paid a 2% management fee, and the investors may see their capital sink under the debt the managers took on. “Negative equity” is not unique to the housing market.
Private equity firms say they generate high returns by running companies better. Some of them do run some companies better. But the returns are not as good as advertised, and they come mostly from high debt and stock picking. Fees (which will be considered further in the next chapter) are high. In simple terms, private equity fails to do what it says on the tin.
Debenhams case study (2)
Here is an alternative way of thinking about the Debenhams deal from 2003 to 2006. The £1.349bn gross gain that the investors enjoyed consists of three elements:
(1) Extra leverage (debt): The TPG/CVC investors put £608m cash into the deal. A “normal” level of debt might have allowed them to buy a retailer worth £860m. Instead, by using an LBO capital structure, they were able to buy a retailing business worth £1.4bn. This would give them a bigger profit if Debenhams went up in value. But the same is also true in reverse: the
29. David Swensen, “Pioneering Portfolio Management”, Free Press, 2000, page 232. Ludovic Phalippou, “Beware of Venturing into Private Equity”, Journal of Economic Perspectives, forthcoming.
Investors might as well have borrowed themselves

C S F I
CSFI 5 DERBY STREET, LONDON W1J 7AB Tel: 020-7493 0173 Fax: 020-7493 0190 E-mail: [email protected] Web: www.csfi.org.uk 29
investors’ increased profit came at the risk of a potentially higher loss if things had gone wrong. “Heads they win, tails you lose” has become a less popular arrangement in the last couple of years, especially among taxpayers. Since the investors here are the ones who bear the risk created by higher leverage, the sponsors should not be paid carry for this portion of the gain, which is £511m (38% of the total).
(2) Movements in the stock market: TPG/CVC bought the quoted Debenhams in 2003 and floated it back on to the stock market in 2006. The market went up over that period. This implies that Debenhams would have increased in value even without the special skills of private equity and its management team – so they should not be paid carry for this portion of the gain, either. It is impossible to say exactly how much Debenhams’ value would have increased. The two quoted companies most similar to Debenhams are Marks & Spencer and Next (Debenhams specifically compared itself to Marks & Spencer in its flotation prospectus). Their share prices rose on average by 86% over that period. The FTSE 350 General Retailers index rose by 32%. The average of all three was 68%. Applying this average to the £608m investment suggests that £413m out of £1.349bn (31% of the total) came from the notional impact of the stock market and had nothing to do with private equity skill in running companies better.
(3) Residual: That leaves £425m, or 32%, of the £1.349bn gain. It is impossible to say how much of this can be directly attributed to private equity’s management skills. All we can say is that it is not attributable to the first two factors.
A standard calculation of carried interest, as in box 1, suggested a payment to the Debenhams private equity managers of £245m. Compare this with item (3) above. £245m may be only 20% of the total profit, but it represents more than half of what the private equity managers themselves might have contributed to that profit. In some deals, or even on average for the sector, standard carried interest payments could be extracting all of private equity managers’ contributions (see page 29).
What about a different approach? Let us assume that all of (3) should be attributed to the skills of the private equity managers. But we will also assume that the private equity investors had negotiated a more appropriate carried interest arrangement. Under this new structure, the investors will still pay the private equity managers a 20% profit share – but only out of what the managers specifically contributed to the overall profit. On this basis, the private equity managers’ carried interest in the Debenhams example would fall from £245m to £61m. Conversely, the private equity investors would now receive 3.1 times their money back rather than 2.8 times:
Debenhams would have increased in value without PE skill
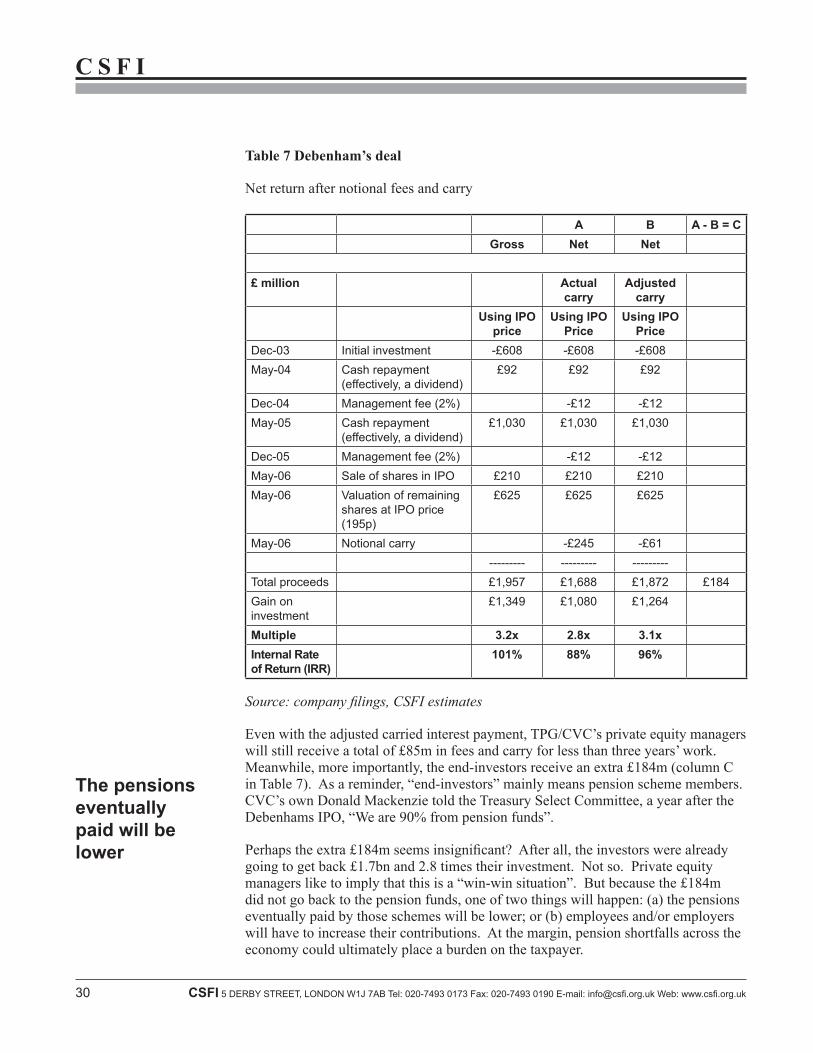
C S F I
30 CSFI 5 DERBY STREET, LONDON W1J 7AB Tel: 020-7493 0173 Fax: 020-7493 0190 E-mail: [email protected] Web: www.csfi.org.uk
Table 7 Debenham’s deal
Net return after notional fees and carry
A B A - B = CGross Net Net
£ million Actual carry
Adjusted carry
Using IPO price
Using IPO Price
Using IPO Price
Dec-03 Initial investment -£608 -£608 -£608May-04 Cash repayment
(effectively, a dividend)£92 £92 £92
Dec-04 Management fee (2%) -£12 -£12May-05 Cash repayment
(effectively, a dividend)£1,030 £1,030 £1,030
Dec-05 Management fee (2%) -£12 -£12May-06 Sale of shares in IPO £210 £210 £210May-06 Valuation of remaining
shares at IPO price (195p)
£625 £625 £625
May-06 Notional carry -£245 -£61--------- --------- ---------
Total proceeds £1,957 £1,688 £1,872 £184Gain on investment
£1,349 £1,080 £1,264
Multiple 3.2x 2.8x 3.1xInternal Rate of Return (IRR)
101% 88% 96%
Source: company filings, CSFI estimates
Even with the adjusted carried interest payment, TPG/CVC’s private equity managers will still receive a total of £85m in fees and carry for less than three years’ work. Meanwhile, more importantly, the end-investors receive an extra £184m (column C in Table 7). As a reminder, “end-investors” mainly means pension scheme members. CVC’s own Donald Mackenzie told the Treasury Select Committee, a year after the Debenhams IPO, “We are 90% from pension funds”.
Perhaps the extra £184m seems insignificant? After all, the investors were already going to get back £1.7bn and 2.8 times their investment. Not so. Private equity managers like to imply that this is a “win-win situation”. But because the £184m did not go back to the pension funds, one of two things will happen: (a) the pensions eventually paid by those schemes will be lower; or (b) employees and/or employers will have to increase their contributions. At the margin, pension shortfalls across the economy could ultimately place a burden on the taxpayer.
The pensions eventually paid will be lower
C S F I
CSFI 5 DERBY STREET, LONDON W1J 7AB Tel: 020-7493 0173 Fax: 020-7493 0190 E-mail: [email protected] Web: www.csfi.org.uk 31
Chapter 4: Conflicts of interest and other issuesAs we have suggested, returns turned out to be more complicated than the official private equity story might suggest. The same goes for other parts of the story. Here we have space to consider only a few.
“Alignment of interests” is a good place to start. Private equity’s oldest and proudest boast is the way it eliminates the conflict of interest – the principal-agent problem – between a company’s owners and managers. Michael Jensen invoked this powerfully in his 1989 article, “Eclipse of the Public Corporation”: “New organizations [which he called ‘LBO Associations’] resolve the central weakness of the public corporation: the struggle between owners and managers.” The official rhetoric has continued to suggest that private equity is a “win-win” situation. Managers run companies better because interests are aligned and everyone benefits – end of story. This is an easy message to sell because it would be so nice if it were true. It is true – but it is not the whole story.
First, “alignment of interest” is not a binary, “either/or” issue. It is relative. Interests can be more or less well-aligned. Second, principal-agent problems and conflicts of interest run through every aspect of economic life. The private equity mechanism may offer a solution to one particular conflict: between today’s owners and today’s managers of a company. But it sets up a principal-agent problem of its own: the one between GPs (managers) and LPs (investors).
Not that you would guess this from what the buyout community says. Damon Buffini, of Permira, referred to some of the world’s “largest and most sophisticated pension funds” spending an “inordinate amount of time” on alignment of interest (Chapter 2). According to BVCA chief executive Simon Walker, “The private equity industry – unlike banks – has structures that directly align the interests of owners and managers”.30 The media generally repeat this line. “In the case of private equity funds”, wrote The Economist on 19 November 2009, comparing them with hedge funds, “managers typically only earn their performance fee, or carry, when the investment is realised, so there is no conflict of interest [emphasis added]”.
When a publication like The Economist writes in this vein, it shows how deceptive these ideas can be. Interests between private equity GPs and LPs may be better aligned than those between a bank’s managers and shareholders. That does not mean they are “directly” aligned. Private equity managers’ interests are better aligned with their investors’ than Bernard Madoff’s interests were with his investors’. This is because they get their big paydays only after returning real cash to investors. But that does not mean there is no conflict of interest. Institutions pay private equity managers to buy and run companies, just as they pay executives to run quoted
30. “Response to Proposed Remuneration Restrictions”, BVCA website, accessed 9 April 2010.
PE sets up principal-agent problem of its own
C S F I
32 CSFI 5 DERBY STREET, LONDON W1J 7AB Tel: 020-7493 0173 Fax: 020-7493 0190 E-mail: [email protected] Web: www.csfi.org.uk
companies. Private equity managers are no more altruistic than corporate executives. They will naturally try to structure the best possible deal for themselves.
The GP-LP conflict shows up most obviously in the way GPs get paid. If interests were perfectly aligned, GPs would only do well if their investors did. Fixed annual management fees would cover GPs’ costs, but only variable carried interest payments would make them rich. In practice, fee percentages have failed to adjust to the increasing absolute size of private equity funds. The result is that large private equity managers can do extremely well, by any normal standards, even if their investors are not making very good returns on their investment.
A study by Andrew Metrick and Ayako Yasuda addresses this issue.31 They found that “about two-thirds of expected revenue comes from fixed-revenue components that are not sensitive to performance”. In other words, only one third of private equity managers’ compensation depends on performance. They receive the other two thirds regardless of how they perform.
Metrick and Yasuda also find that “monitoring” and “transaction” fees are common for buyout firms but not for venture capital managers. “It is not clear exactly what these transaction fees are paying for, since GPs should already be receiving their fixed costs from management fees…It is difficult to find reliable information about the frequency and size of these fees…As with transaction fees, we think of monitoring fees as just another way for BO funds to earn a revenue stream.”
The level and structure of fees is an obvious place for a conflict of interest between GPs and LPs to appear. Institutional investors in private equity have belatedly begun to address this through the Institutional Limited Partners Association (ILPA), which has published a set of “Private Equity Principles”.32 Under “Alignment of Interest”, comes the principle: “Management fees should cover normal operating costs for the firm and its principals and should not be excessive.”
A subtler example of the GP-LP conflict of interest takes us back to the level of debt that buyout managers use. Remember what Bill did with your hypothetical legacy in Chapter 3. The carried interest that private equity managers can earn is based on the whole of the profit that they generate. Better operational management, a rising stock market or higher debt levels…it makes no difference where the profit comes from – the GP will get 20% of it. All other things being equal, this gives the GP an incentive to go out and borrow as much money (take as much risk) as possible. Indeed, according to a 2007 study, “a partner of a buyout firm will often say that they borrow as much as the banks will lend them”.33 Any practitioner used to dealing with buyout firms would recognise
31. “The Economics of Private Equity Funds”. Sourced from SSRN. As of 1 July 2009, forthcoming in the Review of Financial Studies. The authors’ sample consists of 238 funds raised between 1993 and 2006.
32. Available at www.ilpa.org.
33. Axelson, U., Jenkinson, T., Stromberg, P., Weisbach, M., “Leverage and Pricing in Buyouts: An Empirical Analysis”, SSRN preliminary draft August 24 2007, page 19.
Large managers do well even if returns not good
Incentive to borrow as much as possible
C S F I
CSFI 5 DERBY STREET, LONDON W1J 7AB Tel: 020-7493 0173 Fax: 020-7493 0190 E-mail: [email protected] Web: www.csfi.org.uk 33
that comment. Extra risk for the investors gives the GP more upside (via carried interest) but no downside. Meanwhile the LPs get only 80% of the upside in return for accepting 100% of the downside (and continuing to pay the fixed annual management fee).
A return profile that is so asymmetrical creates another conflict between GPs and LPs. The same 2007 study says: “Another, more sinister, story is that the relationship [between debt and pricing] in buyouts is driven by an agency problem in the private equity market. General partners in a buyout fund have an incentive to lever up each deal as much as possible, since they hold an option-like stake in the fund.”
David Swensen wrote much the same thing as long ago as 2000 in “Pioneering Portfolio Management”: “Poor incentive schemes cause buyout fund managers to benefit by placing limited partner assets at risk, creating an extraordinarily valuable option for the general partner that comes at the expense of the providers of funds.” This is also one of the issues identified by the European Commission in its alternative investment fund managers directive (AIFM) (see page 42).
In other words, this becomes just another variation on the theme of “Heads they win, tails you lose”. At the margin, it gives buyout managers an incentive to pay more for companies than might otherwise be rational. This potentially has serious consequences that reach beyond the narrow relationship between private equity GPs and LPs.
At the peak of the cycle in 2006, private equity accounted for a third of all mergers and acquisitions in the EU. If buyout managers have an incentive to overpay using high debt levels, it is possible that their activity distorted the public market for corporate valuations. Take Debenhams. Frothy debt markets allowed the private equity firms to increase the company’s leverage from 4.2 times to 6.0 times. Arguably, about £800m of the total £1.349bn profit on that deal came simply from the credit bubble.
There is no question that private equity activity affects the way quoted companies behave. Alan Jones, vice chairman of Morgan Stanley, certainly thought so in mid-2006: “The enormous growth in private equity raises questions that the managements and boards of public companies may soon find themselves addressing if they have not already: is our company leaving value on the table in the form of excess cash and unused debt capacity? Is it possible that we would operate more efficiently, and be more valuable, in the hands of a private equity firm? And if we decide that we’re more valuable as a public company, should we consider taking a page out of the private equity playbook…?”34
As for valuation, here is a view from The Economist: “One reason for the stock market rally this year is the sense that companies’ equity values should more fully reflect their takeover value. Remove the junk-bond market, and you have lost a useful source of takeover financing. So which market is wrong?” The Economist was suggesting that the junk-bond market that lent money to private equity buyers was actually driving the stock market.
34. Journal of Applied Corporate Finance, Summer 2006.
PE activity affects quoted companies' behaviour
C S F I
34 CSFI 5 DERBY STREET, LONDON W1J 7AB Tel: 020-7493 0173 Fax: 020-7493 0190 E-mail: [email protected] Web: www.csfi.org.uk
But this quotation comes from the issue of 2 September 1989 – more than 20 years ago, at the peak of a previous boom. Buyouts accounted for 20% of merger and acquisition activity in the US in 1985-86. It is hardly surprising that The Economist found a link between buyouts, debt levels and the stock market at the top of that market cycle. Twenty years later, with buyouts accounting for a third of EU takeovers in 2006, it was inevitable that history would repeat itself.
Market fundamentalists would reject the idea that buyouts can distort corporate valuations, as opposed to simply affecting them. They would invoke the notion of market discipline. Lenders acting in their own self-interest would surely never allow buyout companies to become systematically over-indebted. Some companies might go bankrupt, but that is part of a normal, healthy economy. More likely, on this view, aggressive but rational buyout managers and lenders would be serving a useful purpose. In Alan Jones’s words, they would be helping to prevent a company from “leaving value on the table in the form of excess cash and unused debt capacity”. Alan Greenspan would presumably have subscribed to this view.
Today, even Alan Greenspan knows how dangerous it is to assume that lenders will behave rationally. His notion of market discipline certainly failed when it came to other varieties of risky loan. One result was the US housing bubble. It seems plausible that similar failures of market discipline in buyout lending decisions could have distorted the valuation of quoted companies.
Banks and other lenders have shown how they behave when they think taxpayers will bail them out. The burden of proof must, therefore, lie with buyout managers, their lenders and regulators to show that lending to buyouts has been economically positive for lenders, collectively and across cycles. Opaque bank accounting and the tactics of “extend and pretend” (“extending” the maturity of a loan to “pretend” that it has not gone bad) will delay recognition of the final economics of this last cycle. The 2007 paper by Axelson et al correctly identifies this issue as “an important topic for future research”.
To date, the buyout community’s main comments on this subject involve repeating regulators’ findings that buyout lending does not constitute a “systemic risk” (Private Equity Council: “Private equity and systemic risk”), or showing that “it is not only buyouts and PE-backed buyouts in particular that are highly leveraged” (BVCA: “Private Equity and Insolvency”, April 2010). These are further examples of using a half-truth to deflect the question. Buyout lending was undoubtedly less damaging during this cycle than structured finance. The same was true the last time around: real estate lending was the main killer of the US Savings and Loan industry in the 1980s, not junk bonds and LBOs. But the fact that it was less damaging is not saying much; and it certainly does not show that lending to buyouts was positive for lenders, collectively and across the cycle.
Taxpayers might be justified in suspecting that they unwittingly subsidise buyout managers by underwriting mispriced loans. This would be an example of buyout managers indirectly exploiting the conflicts of interest that exist between (a) taxpayers and (b) the owners and managers of organisations that provide loans. It would also
Inevitable that history would repeat itself
Lending to buyouts less damaging than structured finance
C S F I
CSFI 5 DERBY STREET, LONDON W1J 7AB Tel: 020-7493 0173 Fax: 020-7493 0190 E-mail: [email protected] Web: www.csfi.org.uk 35
represent a transfer of wealth from taxpayers to buyout LPs and (especially) GPs. And it raises the possibility that company valuations generally are distorted. The negative consequences for markets and the economy as a whole should concern policymakers.
Disclosure is another area affected by the conflict between GPs and LPs. It, too, has wider implications. As we saw in Chapter 2, the official story says GPs’ disclosure to their LPs is substantial. Since little of this disclosure ever becomes public, it is hard for outsiders to judge either its quantity or, more importantly, its quality. But there are plenty of reasons to think the situation is more complicated than the official story suggests.
A specific problem involves unrealised private equity investments. Because private equity investments are almost always unquoted, valuing them is necessarily subjective. Buyout managers have considerable discretion in setting the valuations. The valuations, in turn, affect the returns that they report to investors. This creates at least the potential for abuse: buyout managers are in effect marking their own homework. A 2008 study looked at evidence from 39 countries and found that “significant systematic biases exist in the reporting of fund performance”. The study notes that “there is a principal-agent problem between PE managers and their institutional investors.”35 As noted in Chapter 3, the FSA also expressed concern.
As well as putting their own valuations on companies, buyout managers have no obligation to value a firm consistently. Imagine that two separate buyout funds with different GPs have invested together in the same company. At each reporting period, the two GPs are free to assign different valuations to the same investment. An investor who happened to be involved in both funds would then receive reports showing two different valuations for the same investment. Investor overlap of this kind is probably common for large GPs. Whenever unquoted investments are concerned, a degree of subjectivity is inevitable, but this kind of inconsistency is not. It obscures the performance of the asset class and damages broader markets.
One high-profile example involves TPG (familiar from Debenhams) and Blackstone. Both invested in the December 2006 buyout of a semiconductor manufacturer called Freescale. One of the largest deals of the past cycle, Freescale has experienced difficulties. The Financial Times reported on 28 June 2010 that TPG and Blackstone had very different valuations for their Freescale investments in their first quarter 2010 updates. TPG’s valuation is 20 cents on the dollar; Blackstone’s is 45 cents. Ironically, Blackstone told the Financial Times that its internal valuations are “reviewed by Duff & Phelps, an appraisal company” (see page 21).
It appears private equity managers are less consistently transparent than they claim, even with their own investors. When it comes to the wider community, transparency is feeble. Blackstone provides a convenient example, but the principles are universal. Blackstone has claimed it would rank number 13 in the 2009 Fortune 500, which ranks companies by revenue. What do quoted Fortune 500 companies provide in terms of
35. Cumming, D., and Walz, U., “Private Equity Returns and Disclosure Around the World”, 2004.
Little of the disclosure becomes public
No obligation to value a firm consistently
C S F I
36 CSFI 5 DERBY STREET, LONDON W1J 7AB Tel: 020-7493 0173 Fax: 020-7493 0190 E-mail: [email protected] Web: www.csfi.org.uk
disclosure? The actual number 13 in the Fortune 500 was Warren Buffett’s company Berkshire Hathaway. It provides investors with consolidated financial statements for the companies that it controls. This allows investors and other stakeholders to judge how successfully management is running the assets. The public also has a legitimate interest in observing the stewardship of an empire this size; Berkshire Hathaway’s 2009 annual report shows revenues of $112bn.
Blackstone’s financial statements look very different from Berkshire Hathaway’s. Revenues for the last three years were $1.8bn in 2009, negative (yes – negative revenues) $350m in 2008 and $3.1bn in 2007. Blackstone’s financials are obviously describing a different kind of animal – and a much more complicated one. One difference is that it is both a manager and an owner of companies. At least, as a quoted company, its financial statements are audited and acceptable to the Securities and Exchange Commission, the New York Stock Exchange and stock market investors. Its website has a “Transparency and Disclosure” section, which lists SEC filings, the Private Equity Council, the UK’s Walker Report, etc.
Yet this does not make its financial statements adequate in an absolute sense. There is no question that Blackstone has some genuine differences from a “normal” Fortune 500 company: for example, its legal structures are more complicated, individual businesses do not cross-subsidise each other and holding periods on average are shorter. But it also has some real similarities. Blackstone executives exercise control over businesses with combined revenues of more than $100bn. Just as a conglomerate’s managers would do, they use their control to extract synergies wherever possible: “Our Portfolio Operations Group plays a key role in growing the value of our portfolio companies. With expertise in areas such as supply chain/procurement, lean processes, health care/benefits and technology, the Group helps businesses become more competitive and efficient. Its CoreTrust and Equity Healthcare networks combine the purchasing power of 43 portfolio companies, leading to annualized savings of more than $275 million.” (2009 annual report). As Blackstone puts it: “If our portfolio holdings and transactions were combined into a single company, it would rank as the equivalent of number 13 on the Fortune 500.”
Blackstone wants to have its cake – Fortune 500 size and status – and eat it, by not having to report on a consolidated basis. Instead, its reporting is closer to that of an investment trust. That should not be acceptable. To appreciate why, consider a hypothetical example involving GE, which ranked number 5 in the 2009 Fortune 500 with revenues of $183bn. One day, GE announces that it has decided to change the way it reports its business because it is really a management company. It creates value by applying GE’s legendary management expertise to a range of different businesses. The best way to show this in its financial reporting is to “deconsolidate” all its operating subsidiaries. In future, GE’s only reported revenues will be the management fees that the holding company charges to the operating subsidiaries. GE’s balance sheet will show just the holding company’s (unquoted) equity investment in each of the subsidiaries. GE’s management team will assign a value to each of these equity investments every quarter. To reassure investors, GE will even employ an independent valuation firm to sign a statement saying that the subsidiaries’ valuations are “not unreasonable”.
Similarities to a 'normal' company
C S F I
CSFI 5 DERBY STREET, LONDON W1J 7AB Tel: 020-7493 0173 Fax: 020-7493 0190 E-mail: [email protected] Web: www.csfi.org.uk 37
This hypothetical version of GE sounds absurd and would cause outrage. Investors, employees, suppliers and politicians would all complain about the sudden lack of transparency and accuse GE management of retreating into the shadows. But it describes essentially what Blackstone and other private equity firms are allowed to do. For an explanation of the issues surrounding transparency and private equity, see Chris Higson, “The Privacy of Private Equity” (London Business School, November 2007): “Transparency is at the core of the pact between business and society in our ‘shareholder capitalism’ economic system. But disclosure that is in society’s interests, for ethical discipline and to facilitate competition, will not always be in the self-interest of managers and owners.”
So far we have looked at the conflict of interest between GP and LP, with some of its consequences. A different conflict of interest that buyout managers may exploit is the one between managers and stakeholders of large institutional investors. A large pension fund employs managers in the same way that a quoted company does. Just as at a quoted company, it is a sad fact of life that the interests of the pension fund managers may not coincide with those of the fund’s stakeholders (the employer and members).
As we have seen, buyout managers consistently describe their investors as “large and sophisticated”. Some of them undoubtedly are. But we also saw that average returns on private equity have not been very impressive. Even private equity supporters admit that three quarters of managers underperform public stock markets, despite using high leverage. The remaining top-quartile managers achieve part of their outperformance through leverage. Those who produce genuine operational “alpha” may remove most of it in fees. And yet investment in private equity has continued to grow. This creates a “puzzle” (as acknowledged by Acharya et al in their returns study).
One possibility is that some investors may simply not understand. They may not realise that buyout returns have been less impressive than advertised. Obviously, this is not consistent with the idea that private equity investors are “large and sophisticated”. But where is the independent evidence that they are? It is hard to prove that some investors may just not understand, or to find supportive comments on the record. But the FSA36, David Swensen37 (Yale University) and a limited number of academics38 have all suggested or implied that sophistication is not universal among buyout investors. This kind of misunderstanding would be an inadvertent form of agency cost: pension scheme members are being let down by their agents, the pension scheme managers. If misunderstanding on this scale seems impossible, think about some of the other shortcomings revealed by the financial crisis.
36. E.g. Discussion Paper 06/6, page 54, para. 3.138.
37. “Pioneering Portfolio Management”, Free Press 2000, pages 230-233.
38. E.g. Ludovic Phalippou, “Beware of Venturing into Private Equity”, Journal of Economic Perspectives, forthcoming, page 2.
Sophistication is not universal among BO investors
C S F I
38 CSFI 5 DERBY STREET, LONDON W1J 7AB Tel: 020-7493 0173 Fax: 020-7493 0190 E-mail: [email protected] Web: www.csfi.org.uk
Another possibility is that institutions which invest in private equity understand that the returns are inadequate, but persist anyway. For 30 years, investors have allowed buyout firms to present their returns in terms of the multiple (which ignores the vital element of time) and the IRR (which generally overstates the realised return). The evidence suggests that buyout firms have not historically provided a return attribution that includes the impact of leverage and the stock market. These shortcomings clearly help the buyout managers. They may also suit some people within some investing organisations. Imagine a private equity or “alternative investment” department at a large institution. This group’s power and/or compensation might be boosted if the returns on buyouts appear more impressive than they really are.
A third possible reason for investing in private equity might be that it reduces career risk through “disguised leverage”. Imagine a group of pension fund trustees who are feeling the pressure. Their fund needs to meet its future pension promises but the trustees are unwilling to go back to the employees or to the employer to ask for more money. This means they have to increase the returns on the pension fund’s portfolio. They know that the only way to get a higher return is to take more risk. They can think of two ways to do this.
One (in an unregulated world) is to borrow directly to buy a quoted stock market fund such as an index tracker. This is similar to what Lord Myners was describing in his October 2009 speech (page 23). It is low-cost, transparent and very liquid (the trustees can sell any time they want to). Compared with private equity, its two key disadvantages are that the fund certainly will not obtain any benefit from private equity governance; and if the stock market goes down, it will be embarrassingly obvious to everyone that the trustees just decided to roll the dice.
The second way to take more risk is to “recommend an increased allocation to private equity” – or words to that effect. This has some disadvantages: high cost, low transparency, low liquidity. On the plus side, the pension fund might get some extra returns if the buyout managers run companies better without extracting all the extra return in fees. But this route also offers some subtle, selfish advantages for the trustees. Suppose the stock market goes down. This way it will be (a) less obvious that the trustees rolled the dice and (b) easier to blame it on someone else, ie the private equity managers. In effect the trustees are still rolling the dice – but doing it under the table. The disguise reduces the chance of embarrassment for trustees, managers or consultants. Private equity’s high fees become the cost that pension scheme members (the principals) unwittingly pay to reduce the career risk of their agents: trustees, managers or consultants.
In some jurisdictions it may be difficult or impossible for pension funds to borrow directly in the way suggested by Lord Myners. If that explains some of private equity’s growth, it is a classic example of unintended consequences. The regulation was supposed to prevent pension funds increasing their risk, but they are doing it anyway by investing in buyout private equity (“leveraged equity”) – and paying high fees to do it. There is a strong case for such regulation to be changed. Pension schemes should make this case in order to lower the fees they pay on behalf of their members.
'Disguised leverage' reduces career risk
Strong case for rules to be changed
C S F I
CSFI 5 DERBY STREET, LONDON W1J 7AB Tel: 020-7493 0173 Fax: 020-7493 0190 E-mail: [email protected] Web: www.csfi.org.uk 39
Chapter 5: Conclusions and recommendationsBuyout managers used to talk mainly about the high returns they generated. Their annual conference is modestly called “Super Return”. More recently, they have been re-tuning their message. For example: “It is private equity's hands-on approach which will define it in the coming years. This drive for operational excellence, alongside private equity's superior corporate governance model and its ability to choose the best deals, underscores the vital role our industry will play in the recovery of the economy.”39 Permira’s 2009 annual review is called “Building better businesses”. Perhaps the conference should be re-named “Super Governance”.
The rhetoric on both sides of the argument has been colourful over the last few years. Critics have called private equity “trading in used companies”, and were still talking about “locusts” as recently as 2008.40 Supporters invoke genetic modification: “[private equity firms] really transform the DNA of corporate governance.”41
Private equity can help an economy, in principle. Knowing that private equity is there in the background helps to keep quoted company executives on their toes. If a private equity firm buys and then runs a single company better, it increases the size of the national economic “pie”. Call it “buyout governance”: an economy is generally better off with it than without it.
But the buyout community must not be allowed to hide what is really going on behind this half-truth. Chapter 3 showed that, in practice, buyout firms do not always run companies better. When investment returns appear high, this may be due to the way they are presented (the IRR problem) or to factors other than “buyout governance” (the stock market, or high debt levels). And when buyout firms do run companies better and increase the size of the collective pie, who should get the extra slice? At the moment it looks as though most of it goes to the buyout managers. That means most investors in private equity, however “large and sophisticated” they are, would have been better off investing somewhere else.
Chapter 4 suggested some other problems with the current buyout model. In particular, it eliminates one principal-agent conflict, but conveniently ignores – or even exploits – others. One of these is the relationship between people who run large institutional funds and their stakeholders, including individual pension scheme members. Another involves debt. The finance industry has a track record of losing money on at least
39. Simon Walker, BVCA website, 7 April 2010.
40. Karel Williams, TSC Vol. II Q10; Poul Nyrup Rasmussen, “Taming the private equity ‘locusts’”, 4 April 2008.
41. Eli Talmor, TSC Vol. II Q6.
Economy is better off with 'buyout governance'

C S F I
40 CSFI 5 DERBY STREET, LONDON W1J 7AB Tel: 020-7493 0173 Fax: 020-7493 0190 E-mail: [email protected] Web: www.csfi.org.uk
some kinds of risky lending. Taxpayers need independent proof that buyout lending is an economically positive exercise across cycles. It is not enough to show merely that buyout lending is not a “systemic risk”. If it is a losing proposition across cycles, then taxpayers are underwriting buyout investors and (especially) managers. And, very importantly, buyout activity may distort the market for corporate valuations. Sub-prime mortgage lending certainly distorted house prices. Perhaps “sub-prime” corporate lending distorted company values in the same way.
Here is one common response to the issues raised so far: some investors have in fact done well out of investing in buyouts. But it is important to be clear what “doing well” means. David Swensen, who runs Yale University’s endowment, certainly understands. His 2000 book “Pioneering Portfolio Management” includes an overview of Yale’s buyout track record. This suggests that, for the period 1987-1998, Yale’s 118 buyout investments did better than the stock market after adjusting for extra-high debt. In other words, it looks as though those 118 companies were genuinely run better by private equity. But Yale’s analysis of a larger sample of 542 contemporary buyout deals suggests the opposite applies to them. At first sight, the returns on this larger group of deals looked higher than the stock market. Take out the impact of the extra debt, though, and these 542 deals underperformed the stock market by almost 40 percentage points per annum.
Yale’s findings undermine the credibility of those who cite the legendary track records of large American endowments in support of investing in private equity. The world of private equity investors includes many would-be Yales and Harvards. And yet those followers generally fail to follow Swensen in adjusting for debt and the stock market. They have an “unsophisticated” idea of what it means to “do well” in private equity. As Lord Myners said in his October 2009 speech to the BVCA: “It surprises me that many investors in private equity funds, pension funds, endowment and insurers have not in the past pressed for greater insights into delivered risk adjusted returns.” Perhaps the recent study by Acharya et al, and the Walker portfolio company analysis by Ernst & Young, will begin to make things clearer.
New regulation would be one way to respond, but this might create as many problems as it solves. Improved transparency is preferable. Both private equity and its investors need to be removed from the shadows. Two alternative approaches are already under way in private equity.
One is a voluntary approach originating within the UK buyout community. Leading private equity firms and the BVCA foresaw in 2007 an increase in political and public scrutiny. They asked Sir David Walker to consider how the community should improve its disclosure. He published his final report in November 2007. Since then, the Guidelines Monitoring Group has been responsible for making sure that buyout managers comply with the report’s recommendations. The most important of these are that:
• Individual companies that are controlled by private equity firms must publish annual financial results if they qualify as a “portfolio company”. Portfolio companies meet tests that measure size and “Britishness”.
Proof needed that buyout lending is positive across cycles
Voluntary approach within UK community
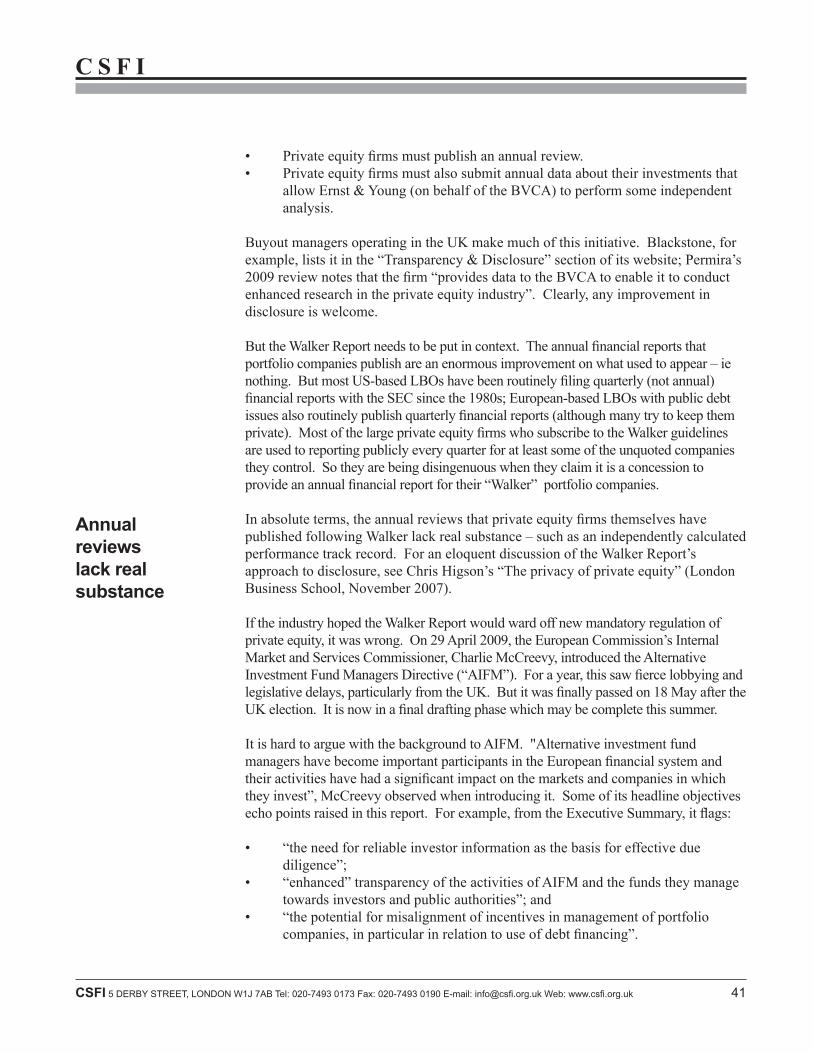
C S F I
CSFI 5 DERBY STREET, LONDON W1J 7AB Tel: 020-7493 0173 Fax: 020-7493 0190 E-mail: [email protected] Web: www.csfi.org.uk 41
• Private equity firms must publish an annual review.• Private equity firms must also submit annual data about their investments that
allow Ernst & Young (on behalf of the BVCA) to perform some independent analysis.
Buyout managers operating in the UK make much of this initiative. Blackstone, for example, lists it in the “Transparency & Disclosure” section of its website; Permira’s 2009 review notes that the firm “provides data to the BVCA to enable it to conduct enhanced research in the private equity industry”. Clearly, any improvement in disclosure is welcome.
But the Walker Report needs to be put in context. The annual financial reports that portfolio companies publish are an enormous improvement on what used to appear – ie nothing. But most US-based LBOs have been routinely filing quarterly (not annual) financial reports with the SEC since the 1980s; European-based LBOs with public debt issues also routinely publish quarterly financial reports (although many try to keep them private). Most of the large private equity firms who subscribe to the Walker guidelines are used to reporting publicly every quarter for at least some of the unquoted companies they control. So they are being disingenuous when they claim it is a concession to provide an annual financial report for their “Walker” portfolio companies.
In absolute terms, the annual reviews that private equity firms themselves have published following Walker lack real substance – such as an independently calculated performance track record. For an eloquent discussion of the Walker Report’s approach to disclosure, see Chris Higson’s “The privacy of private equity” (London Business School, November 2007).
If the industry hoped the Walker Report would ward off new mandatory regulation of private equity, it was wrong. On 29 April 2009, the European Commission’s Internal Market and Services Commissioner, Charlie McCreevy, introduced the Alternative Investment Fund Managers Directive (“AIFM”). For a year, this saw fierce lobbying and legislative delays, particularly from the UK. But it was finally passed on 18 May after the UK election. It is now in a final drafting phase which may be complete this summer.
It is hard to argue with the background to AIFM. "Alternative investment fund managers have become important participants in the European financial system and their activities have had a significant impact on the markets and companies in which they invest”, McCreevy observed when introducing it. Some of its headline objectives echo points raised in this report. For example, from the Executive Summary, it flags:
• “the need for reliable investor information as the basis for effective due diligence”;
• “enhanced” transparency of the activities of AIFM and the funds they manage towards investors and public authorities”; and
• “the potential for misalignment of incentives in management of portfolio companies, in particular in relation to use of debt financing”.
Annual reviews lack real substance
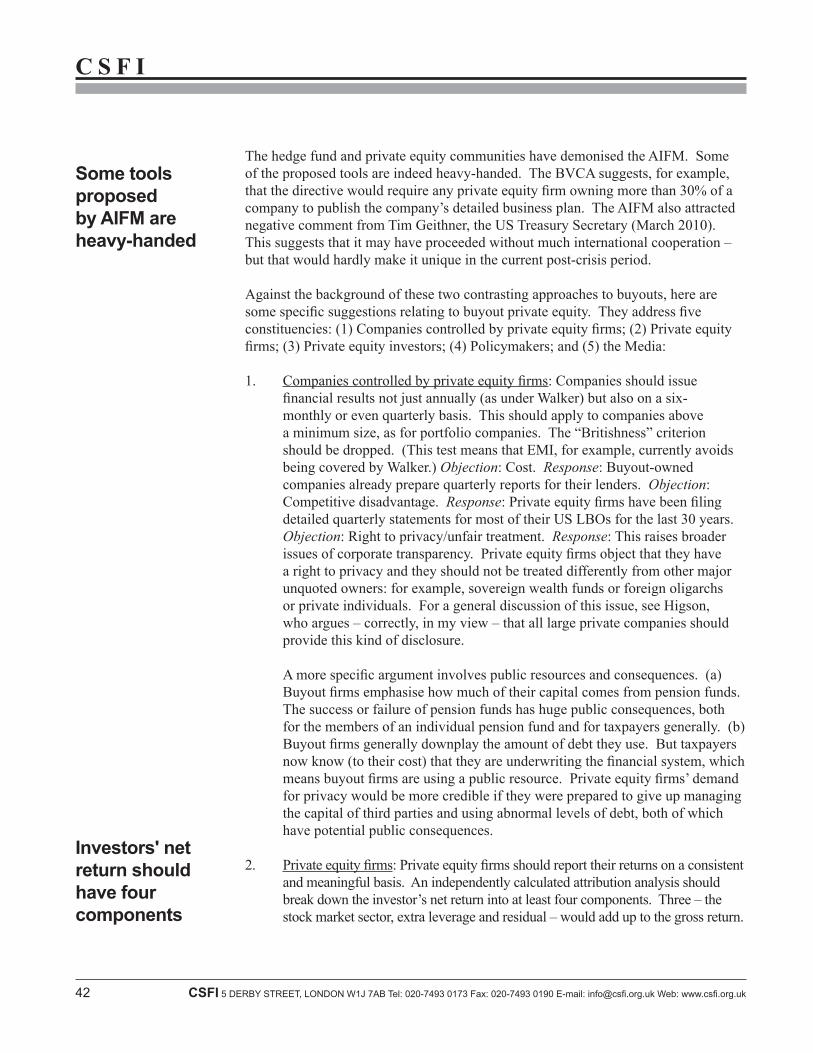
C S F I
42 CSFI 5 DERBY STREET, LONDON W1J 7AB Tel: 020-7493 0173 Fax: 020-7493 0190 E-mail: [email protected] Web: www.csfi.org.uk
The hedge fund and private equity communities have demonised the AIFM. Some of the proposed tools are indeed heavy-handed. The BVCA suggests, for example, that the directive would require any private equity firm owning more than 30% of a company to publish the company’s detailed business plan. The AIFM also attracted negative comment from Tim Geithner, the US Treasury Secretary (March 2010). This suggests that it may have proceeded without much international cooperation – but that would hardly make it unique in the current post-crisis period.
Against the background of these two contrasting approaches to buyouts, here are some specific suggestions relating to buyout private equity. They address five constituencies: (1) Companies controlled by private equity firms; (2) Private equity firms; (3) Private equity investors; (4) Policymakers; and (5) the Media:
1. Companies controlled by private equity firms: Companies should issue financial results not just annually (as under Walker) but also on a six-monthly or even quarterly basis. This should apply to companies above a minimum size, as for portfolio companies. The “Britishness” criterion should be dropped. (This test means that EMI, for example, currently avoids being covered by Walker.) Objection: Cost. Response: Buyout-owned companies already prepare quarterly reports for their lenders. Objection: Competitive disadvantage. Response: Private equity firms have been filing detailed quarterly statements for most of their US LBOs for the last 30 years. Objection: Right to privacy/unfair treatment. Response: This raises broader issues of corporate transparency. Private equity firms object that they have a right to privacy and they should not be treated differently from other major unquoted owners: for example, sovereign wealth funds or foreign oligarchs or private individuals. For a general discussion of this issue, see Higson, who argues – correctly, in my view – that all large private companies should provide this kind of disclosure.
A more specific argument involves public resources and consequences. (a) Buyout firms emphasise how much of their capital comes from pension funds. The success or failure of pension funds has huge public consequences, both for the members of an individual pension fund and for taxpayers generally. (b) Buyout firms generally downplay the amount of debt they use. But taxpayers now know (to their cost) that they are underwriting the financial system, which means buyout firms are using a public resource. Private equity firms’ demand for privacy would be more credible if they were prepared to give up managing the capital of third parties and using abnormal levels of debt, both of which have potential public consequences.
2. Private equity firms: Private equity firms should report their returns on a consistent and meaningful basis. An independently calculated attribution analysis should break down the investor’s net return into at least four components. Three – the stock market sector, extra leverage and residual – would add up to the gross return.
Some tools proposed by AIFM are heavy-handed
Investors' net return should have four components
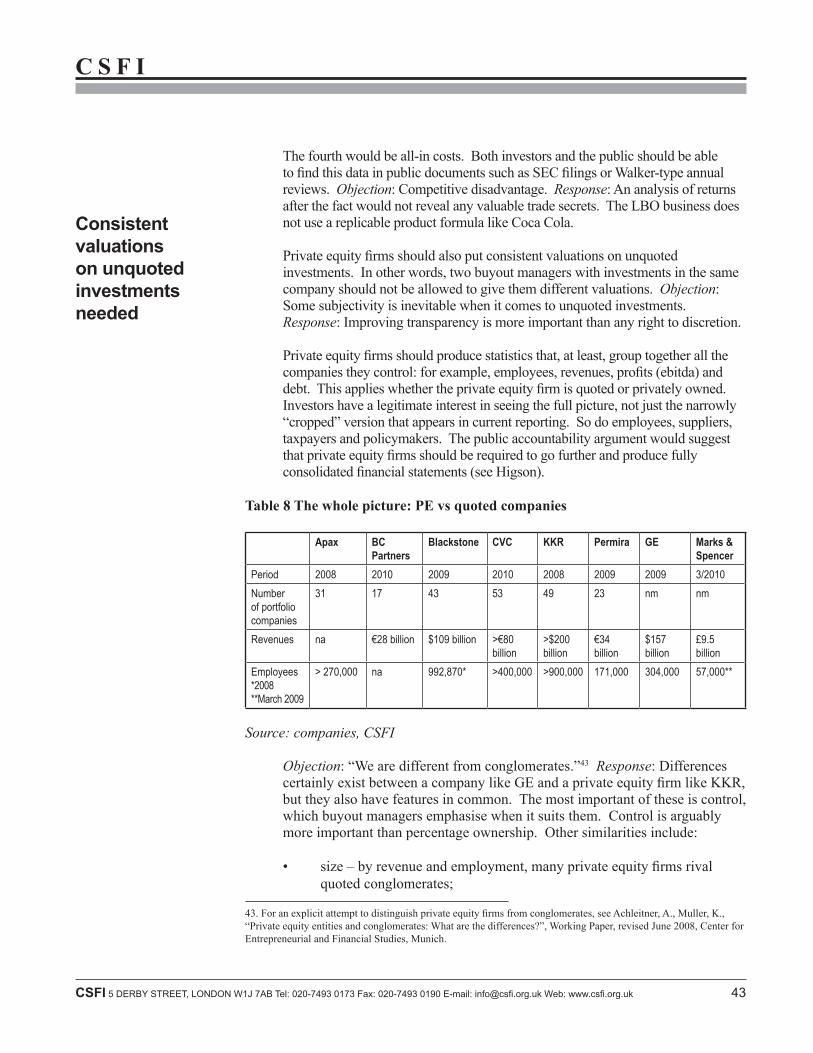
C S F I
CSFI 5 DERBY STREET, LONDON W1J 7AB Tel: 020-7493 0173 Fax: 020-7493 0190 E-mail: [email protected] Web: www.csfi.org.uk 43
The fourth would be all-in costs. Both investors and the public should be able to find this data in public documents such as SEC filings or Walker-type annual reviews. Objection: Competitive disadvantage. Response: An analysis of returns after the fact would not reveal any valuable trade secrets. The LBO business does not use a replicable product formula like Coca Cola.
Private equity firms should also put consistent valuations on unquoted investments. In other words, two buyout managers with investments in the same company should not be allowed to give them different valuations. Objection: Some subjectivity is inevitable when it comes to unquoted investments. Response: Improving transparency is more important than any right to discretion.
Private equity firms should produce statistics that, at least, group together all the companies they control: for example, employees, revenues, profits (ebitda) and debt. This applies whether the private equity firm is quoted or privately owned. Investors have a legitimate interest in seeing the full picture, not just the narrowly “cropped” version that appears in current reporting. So do employees, suppliers, taxpayers and policymakers. The public accountability argument would suggest that private equity firms should be required to go further and produce fully consolidated financial statements (see Higson).
Table 8 The whole picture: PE vs quoted companies
Apax BC Partners
Blackstone CVC KKR Permira GE Marks & Spencer
Period 2008 2010 2009 2010 2008 2009 2009 3/2010
Number of portfolio companies
31 17 43 53 49 23 nm nm
Revenues na €28 billion $109 billion >€80 billion
>$200 billion
€34 billion
$157 billion
£9.5 billion
Employees*2008**March 2009
> 270,000 na 992,870* >400,000 >900,000 171,000 304,000 57,000**
Source: companies, CSFI
Objection: “We are different from conglomerates.”43 Response: Differences certainly exist between a company like GE and a private equity firm like KKR, but they also have features in common. The most important of these is control, which buyout managers emphasise when it suits them. Control is arguably more important than percentage ownership. Other similarities include:
• size – by revenue and employment, many private equity firms rival quoted conglomerates;
43. For an explicit attempt to distinguish private equity firms from conglomerates, see Achleitner, A., Muller, K., “Private equity entities and conglomerates: What are the differences?”, Working Paper, revised June 2008, Center for Entrepreneurial and Financial Studies, Munich.
Consistent valuations on unquoted investments needed
C S F I
44 CSFI 5 DERBY STREET, LONDON W1J 7AB Tel: 020-7493 0173 Fax: 020-7493 0190 E-mail: [email protected] Web: www.csfi.org.uk
• diversification – private equity firms tend to span a number of sectors; and • third-party capital – like any quoted comglomerate, they are managing
the capital of third parties such as pension funds.
Taxpayers have recently discovered they underwrite the global financial system. GE’s consolidated debt was $471bn at December 2009. KKR’s portfolio companies by definition use abnormally large amounts of debt. But exactly how much is unclear because KKR does not report consolidated figures.
3. Investors: Limited partners as a group should take a hard look at what buyout private equity really is and why they are investing. Average realised returns do not justify the level of investment, given the current fee structure. Fees (including carried interest) should be based on the specific contribution of the private equity firm, not on the total return. The Institutional Limited Partners Association’s “Private Equity Principles” address some of these issues, but they appear to represent little more than a lowest common denominator of standards.
Specifically, LPs should at a minimum demand that GPs break down their gross returns in the three-way format already proposed: stock market sector, leverage and residual, with independent verification. It would then be easier for LPs to negotiate fees and carried interest that reflect a GP’s true contribution. For example, the stock market part of the return might deserve a stockpicking-type fee. It is debatable whether LPs should pay GPs any carry for risking their (ie the LPs’) capital through extra leverage. GPs’ most credible claim to carried interest would be limited to the residual. David Swensen made this point 10 years ago (“Pioneering Portfolio Management”):
“Obviously, paying buyout managers only a portion of the incremental value created would wipe out staggering amounts of compensation “earned” by private [sic] fund managers. Since the majority of funds fail to match marketable equity returns, even when measured by the weakest standard, most managers create no additional value in which to share. If fair risk-adjusted returns set the hurdle for measuring value added, handsomely compensated private equity managers become an endangered species”.
Buyout fee structures give private equity firms a big incentive to borrow. At times, this may distort broader financial markets. The AIFM directive offers a heavy-handed response by crudely regulating debt levels. This is likely to have unintended consequences. But suppose GPs did not receive carry for the part of the profit created by excess leverage. Suppose LPs were required to disclose how much of their returns came simply from leverage. It might still be the case that LPs would push for high leverage in their investments. But at least it would be clear what they were doing, and the worst part of the perverse incentives would have been removed.
Most managers create no additional value in which to share
C S F I
CSFI 5 DERBY STREET, LONDON W1J 7AB Tel: 020-7493 0173 Fax: 020-7493 0190 E-mail: [email protected] Web: www.csfi.org.uk 45
4. Policymakers (politicians and regulators): Policymakers should see it as their responsibility to enforce or encourage the suggestions listed above. For example, buyout returns would benefit from some “truth in advertising”. Crude internal rates of return give a misleading impression of the realised return. Policymakers should require some meaningful and consistent reporting standards and public disclosure from GPs (and LPs).
They should also examine whether lending to buyouts is profitable. Even now, after 30 years of institutionalised leveraged buyouts, no one knows whether lending to them has been profitable, collectively and across cycles. Note that this is a different question from whether it creates “systemic risk”. Taxpayers have a right to know if they have been quietly subsidising buyout returns. Objection: Why single out lending to buyouts from corporate lending in general? Response: Because it deliberately creates abnormal debt levels and therefore risk for the taxpayer, and because of perverse incentives in fee structures. (According to The Times on 27 January 2010, Lord Turner, FSA chairman, suggested that regulators might want to target specific types of lending in future. Lending to buyouts might be an example.)
They should put in place an ongoing, independent assessment of the returns from private equity. It is unacceptable that even after 30 years no one knows for sure how well private equity “works”. Independent academics who try to find out should not have to jump through hoops to obtain data that is still inadequate. Analogies between finance and pharmaceuticals may be a cliché by now, but here is another one. One of the finance industry’s jobs is to invent “drugs” (investment products) that will prevent a form of “disease” called impoverished retirement. Buyout private equity is like an expensive new cancer drug that has been marketed with increasing success for 30 years. Yet neither regulators nor politicians have taken responsibility for assessing how well it works, or for ensuring that patients can judge clearly. That would be inconceivable in medicine; it should be unacceptable in finance, too.
5 The Media: Journalists should not let private equity GPs (or LPs) get away with their customary vague references to “high returns” or “better governance”. Whenever a GP or LP discusses returns or profits, whether for an individual transaction, a fund or the long-term track record, the following questions should be asked:
• What was the realised return, as opposed to the IRR? • What proportion of the gross return came from (a) the stock market
sector (b) extra leverage or (c) residual? Has there been any independent verification of these figures?
• In the case of a fund with a long-term track record, what is the difference between the gross and the net return?
Taxpayers have right to know if they have been subsidising
C S F I
46 CSFI 5 DERBY STREET, LONDON W1J 7AB Tel: 020-7493 0173 Fax: 020-7493 0190 E-mail: [email protected] Web: www.csfi.org.uk
The media should also stop repeating the myth that “there is no conflict of interest” in private equity, and that interests are “directly aligned”.
To be fair, private equity is not the only form of investment that needs this kind of treatment. Most of the suggestions made here could apply to a wide range of “alternative investments”. All of them exploit the same basic weakness in the world’s current financial architecture: the concept of the “sophisticated investor”. This is the bigger problem.
Three basic actors take part in the investment process: investors (who have capital), managers (whom they hire to invest it on their behalf) and policymakers (who set the rules). It has become an article of faith in the financial belief system that institutional investors are “sophisticated”. This means they can safely be left to make their own investment decisions. Policymakers, including regulators, hardly need to get involved because they can look after themselves. If “sophisticated” investing has led to strong growth in private equity – so be it. Policymakers’ implicit logic goes like this:
• “large, sophisticated” investors can look after themselves, ie they will on average behave “rationally”;
• private equity has grown rapidly;therefore• private equity must be a good investment for the average “large, sophisticated”
investor.
To see how dangerous this is, remember that Alan Greenspan used the same logic to supervise the financial system – or rather, to avoid regulating it as much as he could. Policymakers now realise that banks cannot be left largely to supervise themselves. But the lesson of the banks needs to be applied to the investment world as well. Even Alan Greenspan knows now that banks will not automatically behave prudently. Why should we assume that so-called “sophisticated investors” will?
Back to private equity. Even private equity supporters admit that GPs have done better out of buyouts than LPs: they may have taken more than their “fair share” of any slice they add to the pie. It would be foolish to blame GPs for doing this. All they have done is to ruthlessly, but legally, exploit the rules of the game. That is what rational economic actors are supposed to do.
The notion of the “sophisticated investor” leads to juicy opportunities for private equity GPs (and other rent extracters) to exploit. So responsibility for putting an end to this situation falls to the other two actors in the process: investors and policymakers. In an ideal world, investors would do this for themselves. But as this report shows, in private equity at least, so-called “sophisticated investors” collectively have not done so.
Big problem is concept of 'sophisticated investor'
GPs have exploited rules of the game
C S F I
CSFI 5 DERBY STREET, LONDON W1J 7AB Tel: 020-7493 0173 Fax: 020-7493 0190 E-mail: [email protected] Web: www.csfi.org.uk 47
That leaves policymakers. Historically, they have delegated (some would say abrogated) their supervisory responsibilities in private equity and other “alternative investments” to “sophisticated investors”. This must stop. Policymakers urgently need to revise their blanket assumption that large investors need no supervision. As a former Associate General Counsel of Fidelity Investments wrote last year: “We have learned from LTCM through the most recent global financial crisis that ‘sophisticated investors’ do not have the ability to select and monitor ‘private’ unregulated investment options.”44 Thanks in part to the use Goldman Sachs has made of the “sophisticated” client argument in defending itself over the Abacus sub-prime mortgage deal, this broader issue has begun to attract some mainstream attention: witness Gillian Tett’s 6 May 2010 column in the Financial Times: “Sophisticated investor debate takes on a new dimension.”
Supervision does not have to mean heavy-handed, inappropriate regulation. The AIFM directive in its current form may be an example of that. If practitioners such as private equity GPs want to avoid that kind of outcome, they should show that they are serious about improving transparency. In the case of buyouts, that means going beyond Walker.
Conversely, policymakers must be robust about making sure that transparency improves in practice and not just in theory: they must be active, not passive. In one recent example in the UK, not related to private equity, rules were specifically introduced to improve transparency. Yet both investors and their fund managers went on withholding information that might allow outsiders to hold them accountable.
The single biggest lesson to emerge from 30 years of buyout private equity is how institutional, so-called “sophisticated”, investors behave. Policymakers cannot afford to be as hands-off with such investors as they were, to taxpayers’ cost, with banks. Complexity and opacity are usually not signs of brilliance but evidence of rent-seeking. “Sunlight is said to be the best of disinfectants”, wrote the great American lawyer Louis Brandeis in Other People’s Money: And How The Bankers Use It. His book was originally published in 1914 – but it still has resonance today.
44. Abrahamson, M., and Jenkinson, T., “Does transparency overcome conflicts of interest? Evidence from investment managers and their brokers”, SSRN, March 2009.
'Sunlight is the best of disinfectants'
C S F I
48 CSFI 5 DERBY STREET, LONDON W1J 7AB Tel: 020-7493 0173 Fax: 020-7493 0190 E-mail: [email protected] Web: www.csfi.org.uk
SourcesAbrahamson, M., and Jenkinson, T., “Does transparency overcome conflicts of interest? Evidence from investment managers and their brokers”, SSRN, March 2009
Acharya, Viral V., and Conor K., “Corporate Governance and Value Creation: Evidence from Private Equity”, London Business School draft, 4 February 2010
Achleitner, A., Muller, K., “Private equity entities and conglomerates: What are the differences?”, Working Paper, revised June 2008, Center for Entrepreneurial and Financial Studies, Munich
Achleitner, A., “Value Creation in Private Equity” October 2009 slide presentation, Center for Entrepreneurial and Financial Studies, Munich
Achleitner, A., Braun, R., Engel, N., Figge, C., and Tappeiner, F., “Value Creation Drivers in Private Equity Buyouts: Empirical Evidence from Europe”, The Journal of Private Equity, Vol. 13 no. 2, pp. 17-27
Axelson, U., Jenkinson, T., Stromberg, P., Weisbach, M., “Leverage and Pricing in Buyouts: An Empirical Analysis”, SSRN preliminary draft August 24 2007
Axelson, U., Stromberg, P., and Weisbach M., 2007, “Why are buyouts levered?”, Journal of Finance, forthcoming
Cao, J., and Lerner, J., “The Performance of Reverse Leveraged Buyouts”, SSRN
Chaplinsky, S.J. and Perry, S.E., (2004) “CalPERS vs. Mercury News: Disclosure comes to private equity”, Darden Case No.: UVA-F-1438-SSRN
Chen, C., and Mohan, N., “A Review of the RJR-Nabisco Buyout”, Journal of Applied Corporate Finance, Summer 1990
Cornelli, F., and Karakas, O., “Private equity and corporate governance: do LBOs have more effective boards?”, Global Economic Impact of Private Equity Report 2008, World Economic Forum
Cumming, D., and Walz, U., “Private Equity Returns and Disclosure Around the World”, 2004
Froud, J., and Williams, K., “Private equity and the culture of value extraction”, CRESC, The University of Manchester, Version 2 - February 2007
Gottschalg, O., and Phalippou, L., “The Performance of Private Equity Funds”, Review of Financial Studies, Vol. 22, Number 4, 2009
Gottschalg, O., Phalippou, L., and Lopez-de-Silanes, F., “Giants at the gate: Diseconomies of scale in private equity”, SSRN, 3rd draft Dec 25 2009
Gottschalg, O., and Phalippou, L., “The Truth About Private Equity Performance”, Performance”, Harvard Business Review, December 2007
Guo, S., Hotchkiss, E., and Song, W., “Do Buyouts (Still) Create Value?”, forthcoming, Journal of Finance, August 2009
Higson, C., “The Privacy of Private Equity”, LBS, November 2007.
Jenkinson, T., “Private Equity”, part of the 2009 European Economic Advisory Group Report on the European Economy, February 2009 (www.cesifo.org)
C S F I
CSFI 5 DERBY STREET, LONDON W1J 7AB Tel: 020-7493 0173 Fax: 020-7493 0190 E-mail: [email protected] Web: www.csfi.org.uk 49
Jenkinson, T., “The development and performance of European private equity”, in “Handbook of European Financial Markets and Institutions”, edited by Xavier Freixas, Philipp Hartmann and Colin Mayer, OUP, 2008.
Jensen, M., and Meckling, W., “Can the Corporation Survive?”, Financial Analysts Journal, January/February 1978, vol. 31
Jensen, M., “The Eclipse of the Public Corporation”, Harvard Business Review, September-October 1989
Jensen, M., “The Economic Case For Private Equity (and Some Concerns) — pdf of Keynote Slides” Harvard NOM Research Paper No. 07-02, 2007
Jensen, M., “Putting Integrity Into Finance: A Positive Approach”, slide presentation, 2007
Kaplan, S., “The Evolution of U.S. Corporate Governance: We are All Henry Kravis Now”, Journal of Private Equity, Fall, 1997
Kaplan, Steven N., and Schoar, A., 2005, “Private equity returns: Persistence and capital flows”, Journal of Finance 60, 1791-1823
Kaplan, Steven N., and Stromberg, P., “Leveraged Buyouts and Private Equity”, Draft June 2008, SSRN
Lerner, J., Schoar, A., and Wong, W., 2004, “Smart Institutions, Foolish Choices? The Limited Partner Performance Puzzle”, Journal of Finance
Metrick, A., and Yasuda, A., The Economics of Private Equity Funds”, forthcoming in the Review of Financial Studies, July 2009
Phalippou, L., “Beware of Venturing into Private Equity”, Journal of Economic Perspectives, forthcoming
Phalippou, L., “Risk and return of private equity: An overview of data, methods and results”, Chapter 12 of Wiley/Blackwell’s Companion to Private Equity, ed. Douglas Cumming
Phalippou, L., “The hazards of using IRR to measure performance: The case of private equity”, SSRN working paper, 2009
Phalippou, L., “Investing in Private Equity Funds: A Survey”, 2007, The Research Foundation of the CFA Institute
Rappaport, A., “The Staying Power of the Public Corporation”, Harvard Business Review, January-February 1990
Stromberg, P., “The Economic and Social Impact of Private Equity in Europe: Summary of Research Findings”, September 2009, SIFR
Taub, J., “Recommendations for Reality-Based Regulatory Reform of Hedge Funds and Other Private Pools of Capital”, University of Massachusetts, Amherst, October 2009
World Economic Forum, “The Global Economic Impact of Private Equity Report January 2008”
Other
3i, Annual Report, 2009
Apollo. SEC filings for AP Alternative Assets, LP and for Apollo Global Management
Blackstone. SEC filings
C S F I
50 CSFI 5 DERBY STREET, LONDON W1J 7AB Tel: 020-7493 0173 Fax: 020-7493 0190 E-mail: [email protected] Web: www.csfi.org.uk
Boston Consulting Group, “The Advantage of Persistence”, February 2008; “Get Ready for the Private-Equity Shakeout”, December 2008; “Driving the Shakeout in Private Equity”, July 2009; “Time to Engage – or Fade Away”, January 2010
Brandeis, L., “Other People’s Money: And How The Bankers Use It”, 1914, available at www.kessinger.net
Brummer, A., and Cowe, R., “Hanson”, Fourth Estate, London, 1994
BVCA. “Private Equity and Venture Capital Performance Measurement Survey 2007”,
May 2008. “The Economic Impact of Private Equity in the UK”, 2007. “Guidelines for Disclosure and Transparency in Private Equity”, November 2007.
Cambridge Associates, LLC, press releases
Coller Institute of Private Equity, “Findings Issue 1”, Autumn-Winter 2009
Ernst & Young. “BVCA Annual Report on the performance of Portfolio Companies, 2008”, January 2009; “AIFM – the Alternative Investment Fund Managers Directive”, 2009
European Central Bank, “Large Banks and Private Equity-sponsored Leveraged Buyouts in the EU”, April 2007
Financial Services Authority (FSA). “The Economist’s Inaugural City Lecture”, Turner, A., January 2009. “Private equity: a discussion of risk and regulatory engagement”, Discussion Paper, November 2006; and “Feedback”, June 2007.
Guidelines Monitoring Group, “Improving transparency and disclosure”, March 2010“Guidelines for Transparency and Disclosure in Private Equity”, November 2007
House of Commons Treasury Committee, “Private equity”, Volumes I and II, July-August 2007
KKR. SEC filings and presentations for KKR Private Equity Investors and for proposed IPO of KKR.
Moody’s Investors Service. “$640 Billion and 640 Days Later”, November 2009; “Historical Default Rates of Corporate Bond Issuers, 1920-1999”, January 2000
Rasmussen, P. N., “Taming the Private Equity ‘Locusts’”, April 4 2008
Service Employees International Union, “Behind the Buyouts”, April 2007; “Private Equity’s Appetite for Infrastructure Could Put State and Local Taxpayers and Services at Risk”, www.behindthebuyouts.org/storage/Copy_of_DRAFT_SEIU_Infrastructure_Policy_Paper_Oct_2008.pdf
Swensen, D., “Pioneering Portfolio Management”, Free Press, 2000
Universities Superannuation Scheme, annual reports
Walker, Sir D., “Guidelines for Transparency and Disclosure in Private Equity”, November 2007
Wellcome Trust, annual reports
The Yale Endowment, annual reports

CSFI PUBLICATIONS
96. “PRIVATE EQUITY, PUBLIC LOSS?”By Peter Morris. July 2010. ISBN 978-0-9563888-3-4.
£25/$45/€35
95. “SYSTEMIC POLICY AND FINANCIAL STABILITY: a framework for delivery.”By Sir Andrew Large. June 2010. ISBN 978-0-9563888-2-7.
£25/$45/€35
94. “STRUGGLING UP THE LEARNING CURVE: solvency II and the insurance industry.”By Shirley Beglinger. June 2010. ISBN 978-0-9563888-1-0.
£25/$45/€35
93. “INVESTING IN SOCIAL ENTERPRISE: the role of tax incentives.”By Vince Heaney. May 2010. ISBN 978-0-9561904-8-2.
£25/$45/€35
92. “BANANA SKINS 2010: after the quake.”Sponsored by PricewaterhouseCoopers.By David Lascelles. February 2010. ISBN 978-0-9561904-9-9.
£25/$45/€35
91. “FIXING REGULATION”By Clive Briault. October 2009. ISBN 978-0-9563888-0-3.
£25/$40/€27
90. “CREDIT CRUNCH DIARIES: the financial crisis by those who made it happen.”By Nick Carn and David Lascelles. October 2009. ISBN 978-0-9561904-5-1.
£9.99/$15/€10
89. “TWIN PEAKS REVISITED: a second chance for regulatory reform.”By Michael W. Taylor. September 2009. ISBN 978-0-9561904-7-5.
£25/$45/€35
88. “NARROW BANKING: the reform of banking regulation.”By John Kay. September 2009. ISBN 978-0-9561904-6-8.
£25/$45/€35
87. “THE ROAD TO LONG FINANCE: a systems view of the credit scrunch.”By Michael Mainelli and Bob Giffords. July 2009. ISBN 978-0-9561904-4-4.
£25/$45/€35
86. “FAIR BANKING: the road to redemption for UK banks.”By Antony Elliott. July 2009. ISBN 978-0-9561904-2-0.
£25/$50/€40
85. “MICROFINANCE BANANA SKINS 2009: confronting crises and change.”By David Lascelles. June 2009. ISBN 978-0-9561904-3-7.
84. “GRUMPY OLD BANKERS: wisdom from crises past.” £19.95/$29.95/€22.95March 2009. ISBN 978-0-9561904-0-6.
83. “HOW TO STOP THE RECESSION: a leading UK economist’s thoughts on resolving the current crises.”By Tim Congdon. February 2009. ISBN 978-0-9561904-1-3.
£25/$50/€40
82. “INSURANCE BANANA SKINS 2009: the CSFI survey of the risks facing insurers.”By David Lascelles. February 2009. ISBN 978-0-9551811-9-1.
£25/$50/€40
81. “BANKING BANANA SKINS 2008: an industry in turmoil.”The CSFI’s regular survey of banking risk at a time of industry turmoil.May 2008. ISBN 978-0-9551811-8-4.
£25/$50/€40
80. “MICROFINANCE BANANA SKINS 2008: risk in a booming industry.”By David Lascelles. March 2008. ISBN 978-0-9551811-7-7.
£25/$50/€40
79. “INFORMAL MONEY TRANSFERS: economic links between UK diaspora groups and recipients ‘back home’.”By David Seddon. November 2007. ISBN 978-0-9551811-5-3.
£25/$50/€40
78. “A TOUGH NUT: Basel 2, insurance and the law of unexpected consequences.”By Shirley Beglinger. September 2007. ISBN 978-0-9551811-5-3.
£25/$50/€40
77. “WEB 2.0: how the next generation of the Internet is changing financial services.”By Patrick Towell, Amanda Scott and Caroline Oates. September 2007. ISBN 978-0-9551811-4-6.
£25/$50/€40
76. “PRINCIPLES IN PRACTICE: an antidote to regulatory prescription.”The report of the CSFI Working Group on Effective Regulation. June 2007. ISBN 978-0-9551811-2-2.
£25/$50/€40
75. “INSURANCE BANANA SKINS 2007: a survey of the risks facing the insurance industry.”Sponsored by PricewaterhouseCoopers.By David Lascelles. May 2007. ISBN 978-0-9551811-3-9.
£25/$45/€40
74. “BIG BANG: two decades on.”City experts who lived through Big Bang discuss the lasting impact of the de-regulation of London’s securities marketsSponsored by Clifford Chance.February 2007. ISBN 978-0-9551811-1-5.
£25/$45/€40
73. “BANKING BANANA SKINS 2006”The latest survey of risks facing the banking industrySponsored by PricewaterhouseCoopers.By David Lascelles. April 2006. ISBN 0-9551811-0-0.
£25/$45/€40
72. “THE PERVERSITY OF INSURANCE ACCOUNTING: in defence of finite re-insurance.”An industry insider defends finite re-insurance as a rational response to irrational demands.By Shirley Beglinger. September 2005. ISBN 0-9545208-9-0.
£25/$45/€40
71. “SURVIVING THE DOG FOOD YEARS: solutions to the pensions crisis.”New thinking in the pensions area (together with a nifty twist by Graham Cox).By John Godfrey (with an appendix by Graham Cox). April 2005. ISBN 0-9545208-8.
£25/$45/€40

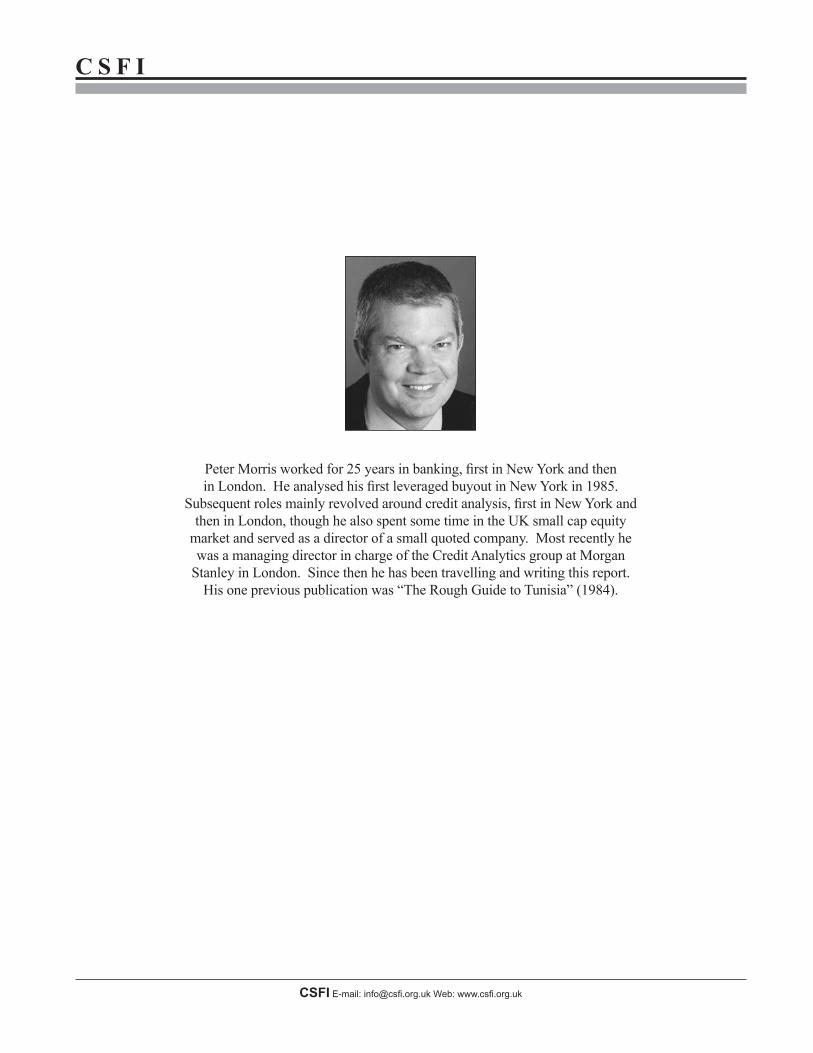
CSFI E-mail: [email protected] Web: www.csfi.org.uk
C S F I
Peter Morris worked for 25 years in banking, first in New York and then in London. He analysed his first leveraged buyout in New York in 1985.
Subsequent roles mainly revolved around credit analysis, first in New York and then in London, though he also spent some time in the UK small cap equity
market and served as a director of a small quoted company. Most recently he was a managing director in charge of the Credit Analytics group at Morgan
Stanley in London. Since then he has been travelling and writing this report. His one previous publication was “The Rough Guide to Tunisia” (1984).


SponsorshipThe CSFI receives general support from many public and private institutions, and that support takes different forms. The Centre currently receives financial support from; inter alia:
CSFIRegistered Charity Number 1017353Registered Office: North House, 198 High Street, Tonbridge, Kent TN9 1BERegistered in England and Wales limited by guarantee. Number 2788116
RufferCitigroupErnst & YoungICMA
Aberdeen Asset ManagementABIACCAAccentureArbuthnotAvivaBank of EnglandBarclaysChartered Insurance Institute City of LondonDeloitteDeutsche BankEvershedsFidelity International Finance & Leasing AssociationFINRAFitch RatingsFRCFSAGatehouse BankHSBCJersey FinanceKPMG
ACTAFMEAlpheus SolutionsBank of ItalyBrigade ElectronicsBVCAChown DewhurstCredit SuisseHM TreasuryIFSLLandesBank BerlinLansons CommunicationsLEBA and WMBA
The CSFI also received support in kind from, inter alia:
- Clifford Chance - Macquarie Group- Edwin Coe - NERC- Financial Times - NESTA- ifs School of Finance - Promontory- Linklaters LLP - Standard Chartered- Lovells - Taylor Wessing
The Centre has received special purpose funding from:- CGAP and Citi (for Microfinance Banana Skins) and;- PwC (for Banking Banana Skins and Insurance Banana Skins).
In addition, it has set up the following fellowship programmes:- the Generali/CSFI fellowship in Insurance;- the Visa/CSFI fellowship in European Payments and;- the DfID/Citi/CSFI fellowship in Development.
GISE AGJPMorgan PricewaterhouseCoopers
LCH.ClearnetLloyds Banking GroupLogicaLondon Stock ExchangeMan Group plcMcKinsey & CoMorgan StanleyMunich Re GroupNomura InstituteNYSE LiffePA ConsultingPrudential plcRegulEyesRoyal Bank of ScotlandRoyal London GroupSantanderThe Law Debenture CorporationThomson ReutersUBS Wealth ManagementUK PaymentsWDX OrganisationZ/YenZurich
Lending Standards BoardLombard Street ResearchLondon Metropolitan UniversityMacDougall AuctionsMobile Financial ServicesQuest 4Record Currency Management Serious Fraud Office Taiwan FSCThe Share CentreTHFC1776 Consulting
UK £25US $45 €35CSFI ©2 0 1 0