private equity ipos - milken institute equity ipos... · 4 steven n. kaplan and per strömberg,...
TRANSCRIPT

Private Equity IPOs Generating Faster Job Growth and More InvestmentJAKOB WILHELMUS AND WILLIAM LEE

ABOUT THE MILKEN INSTITUTE
The Milken Institute is a nonprofit, nonpartisan think tank.
For the past three decades, the Milken Institute has served as a catalyst for practical, scalable solutions to global challenges by connecting human, financial, and educational resources to those who need them. Guided by a conviction that the best ideas, under-resourced, cannot succeed, we conduct research and analysis and convene top experts, innovators, and influencers from different backgrounds and competing viewpoints. We leverage this expertise and insight to construct programs and policy initiatives.
These activities are designed to help people build meaningful lives, in which they can experience health and well-being, pursue effective education and gainful employment, and access the resources required to create ever-expanding opportunities for themselves and their broader communities.
ABOUT THE AUTHORS
Jakob Wilhelmus is an associate director working on international finance and macroeconomics, and William Lee is chief economist at the Milken Institute. All views expressed here are those of the authors and do not necessarily reflect those of the Milken Institute or its affiliates. ©2019 Milken Institute This work is made available under the terms of the Creative Commons AttributionNonCommercialNoDerivs 3.0 Unported License, available at creativecommons.org/licenses/by-nc-nd/3.0/

MILKEN INSTITUTE PRIVATE EQUITY IPOS 1
PRIVATE EQUITY IPOSGenerating Faster Job Growth and More Investment Jakob Wilhelmus and William Lee
We present evidence of stronger job creation, revenue generation, and investment spending by listed companies previously backed by private equity (PE) than peers that listed without PE backing.1 The profile of PE-backed companies we develop challenges popular narratives that emphasize job destruction and cost cutting as the primary source of PE value creation. There is evidence suggesting that private equity firms have become an important source for corporate funding. In addition, we present data for a limited group of companies that PE firms had owned previously, which suggest that these companies play a significant and growing role in creating new jobs and generating more productivity-enhancing investments.
1 Because of the paucity of data for companies under private equity ownership, we have chosen to evaluate the aftermath of private equity involvement. If PE restructuring leaves lasting efficiency gains, then such a successful IPO may grow faster than its peers, including faster job creation as the firm expands its scale.

MILKEN INSTITUTE PRIVATE EQUITY IPOS 2
INTRODUCTION
Private equity (PE) firms have become an increasingly important source of funds for financing US companies.2 PE firms make investment decisions that can brighten or darken the economic outlook of the communities in which their companies operate. When PE firms initially take over struggling companies, alarms sound over factory and store closings and laid off workers. Politicians, such as Senator Elizabeth Warren, have reportedly targeted PE firms as “vampires—bleeding the company dry and walking away enriched even as the company succumbs.”
However, because PE firms are so opaque, there is a paucity of data about the operating history of companies owned by PE firms. Few outsiders know much about the aftermath of PE involvement. There are few sources of data that can show whether the rejuvenated company would create new and better jobs, modernize factories, and generate more store openings that ultimately leave the community much better off than before the PE firm arrived.
Our research has uncovered information about the impressive performance of a small group of companies after PE firms sold them via an initial public offering (IPO). In this report, we provide evidence that these companies that were formerly backed by private equity on average created more jobs, generated larger revenues, and spent more in capital expenditures than did their non-PE-owned peers after their initial listing.
Academic and industry studies are replete with theories purporting to explain why companies with PE investors may have advantages over companies relying on other sources of capital (e.g., banks).3 Owing to regulatory, governance, and risk-management considerations, banks will often limit funding to asset-poor companies. Banks are especially reluctant to lend to borrowers with a large proportion of intangible-to-tangible assets, a substantial need to incur R&D expenses, and/or an absence of steady cash flows. Under such circumstances, banks are either reluctant or prohibited from funding such companies. By comparison, PE firms are more willing to finance such companies and either accept or manage many of these risks in return for higher prospective returns.
PE firms usually search for companies with high growth potential and develop flexible funding and management strategies to overcome assorted risks and agency
2 Our previous report, Companies Rush to Go Private, discussed the influences behind the rise in private equity financing, its growing importance for corporate capital raising, and potential policy issues raised by these developments.
3 For example, an influential cross-country study finds that “…difficulties in dealing with banks, such as bank paperwork and bureaucracies, and the need to have special connections with banks, do constrain firm growth. Collateral requirements and certain access issues—such as financing for leasing equipment—also turn out to be significantly constraining [on company growth and financing].” (Thorsten Beck, and others. “Financial and Legal Constraints to Growth: Does Firm Size Matter?” Journal of Finance, (July 2005).)

MILKEN INSTITUTE PRIVATE EQUITY IPOS 3
costs. Such risks and agency costs usually stem from information asymmetries between managers and owners, and divergent interests of creditors versus shareholders. PE firms manage such discouraging influences in the companies they own with staged financing to control risks and contractual incentives (e.g., stock options), to deter employee departures and the loss of R&D benefits to other firms, and to restructure management to improve active monitoring that reduces other agency costs.4
PRIVATE EQUITY FIRMS' IMAGE AS VISIGOTHS MAY NOT BE ACCURATE
PE investors are facing a growing social and political onslaught because of highly publicized layoffs associated with company downsizing and financial hollowing of companies under PE ownership.5 Unfortunately, most PE firms have not collected or made available adequate data to change such perceptions or document the net impact of their activities for non-investors and those who influence public policy. For example, there are widespread and deeply held concerns that PE firms engage mainly in “financial engineering” activities that saddle target companies with high debt burdens and do not generate economic or social benefits for non-investors. PE firms often are associated with plant closings and layoffs that contribute to creating “ghost towns” and the hollowing out of mid-America.
Notwithstanding the potential for heightened political pressures to gain more transparency through additional regulation or legislation, PE firms have scant regard for, and hardly acknowledge, the need to collect and standardize data to evaluate such claims. Most PE firms have not collected nor made available data on employment, investment expenditures, and other financial information for the companies they own and/or manage. Exceptions are rare but notable (e.g., New Mountain Capital has been reporting key job growth and investment data for the companies in their portfolio for the last 10 years as part of its “Social Dashboard” report).6
In the absence of direct data, some researchers have resorted to indirect data to infer the impact of PE activities on job growth and investment. One successful series of studies and data “mash-ups” began with a prominent study showing that while PE
4 Steven N. Kaplan and Per Strömberg, ”Leveraged Buyouts and Private Equity,” Journal of Economic Perspectives, Volume 22, Number 4—Season 2008 provides an excellent survey of the academic literature explaining these influences.
5 Negative reports about PE activities dominate the popular press. Recent reviews in the New York Times, Forbes, and the Center for Economic and Policy Research show there is much “damage control” work ahead. Senator Warren has proposed legislation limiting PE tax benefits and increasing accountability for the social consequences of their activities.
6 The New Mountain Capital press release for its 2018 “Social Dashboard” report can be found here.
MILKEN INSTITUTE PRIVATE EQUITY IPOS 4
buyouts may initially destroy jobs relative to their peers (sometimes for years under PE ownership), such companies do ultimately demonstrate some net job creation.7 Admittedly, it is difficult to identify whether job creation results from company acquisitions or organic growth.
However, from a social policy perspective, there is some merit to considering that “a job is a job,” regardless of whether it comes through acquisitions or from organic growth. It is especially important to note that some PE acquisitions may have precluded companies from going out of business and laying off even more of their employees. Indeed, our evidence suggests that PE-backed IPOs created more jobs than their non-PE peers in typically high-wage sectors (e.g., industrials and telecom) as well as lower-wage sectors (e.g., consumer/retail). Nevertheless, we cannot be confident about this inference because of our limited data.
Insufficient data availability remains the core obstacle to providing transparency into how PE ownership influences company performance. It also limits our ability to assess the impact of PE influence on the employment, revenue generating, and investment behavior of companies during and after exiting PE ownership.
There seems to be some indirect evidence, including from a study encompassing the United States and many European countries, that companies tend to show greater employment and productivity growth in sectors with relatively high PE participation.8 Although deal volume in the United States and the United Kingdom dominate that of the other countries, the authors noted that PE activities also boosted growth in companies (and sectors) located in continental Europe.9 This finding implies that the aftermath of PE involvement may have beneficial influences on job and productivity growth that transcends the more market-based labor market and investment practices of US and UK companies. To investigate this latter possibility, the researchers focused much of their analysis on companies operating in continental Europe. Unfortunately, they had no direct data indicating whether PE-owned companies invested more in productivity-enhancing capital equipment, staff training, or research and development of new or disruptive technologies that may boost macroeconomic productivity.
7 Steven J. Davis, John Haltiwanger, Kyle Handley, Ron Jarmin, Josh Lerner, and Javier Miranda, "Private Equity, Jobs, and Productivity," American Economic Review, 104 (12): 3956-90, (2014). These researchers merge US Census data containing US businesses with paid employees with databases (e.g., Capital IQ) containing firm-level transactions where PE firms can be associated with acquisitions, buyouts, and similar deals.
8 Shai Bernstein, Josh Lerner, Morten Sorensen, and Per Strömberg, "Private Equity and Industry Performance,” (2017); also earlier version "NBER Working paper 15632,” January 2010.
9 Deals in the United States and United Kingdom accounted for 67 percent of the number of deals in the sample. The authors also resorted to various statistical tests to rule out the possibility of reverse-causation: PE firms are more active in sectors that are already fast growing.

MILKEN INSTITUTE PRIVATE EQUITY IPOS 5
Our study examines the robustness of the inferences made by these earlier studies that suggest there may be some positive impact from PE involvement on subsequent company employment, revenue growth, and investment spending. We focus on the impact of PE ownership of a select population of companies that later become listed on public stock exchanges. The advantage of our approach is that it allows direct “apples-to-apples” comparison of the behavior of PE- and non-PE-owned companies. Our data leverage the strict data reporting requirements for listing on stock exchanges and avoid some of the potential errors that may arise from matching data from disparate sources.
Our study evaluates company-level performance against a tighter control group than earlier studies; we compare the behavior of PE- and non-PE-backed IPOs collectively and separately by sector and company size. We specifically examine whether PE-backed alumni companies show persistently better performance, such as faster employment and revenue growth, and more investment spending compared with companies in the same sectors and of the same size.
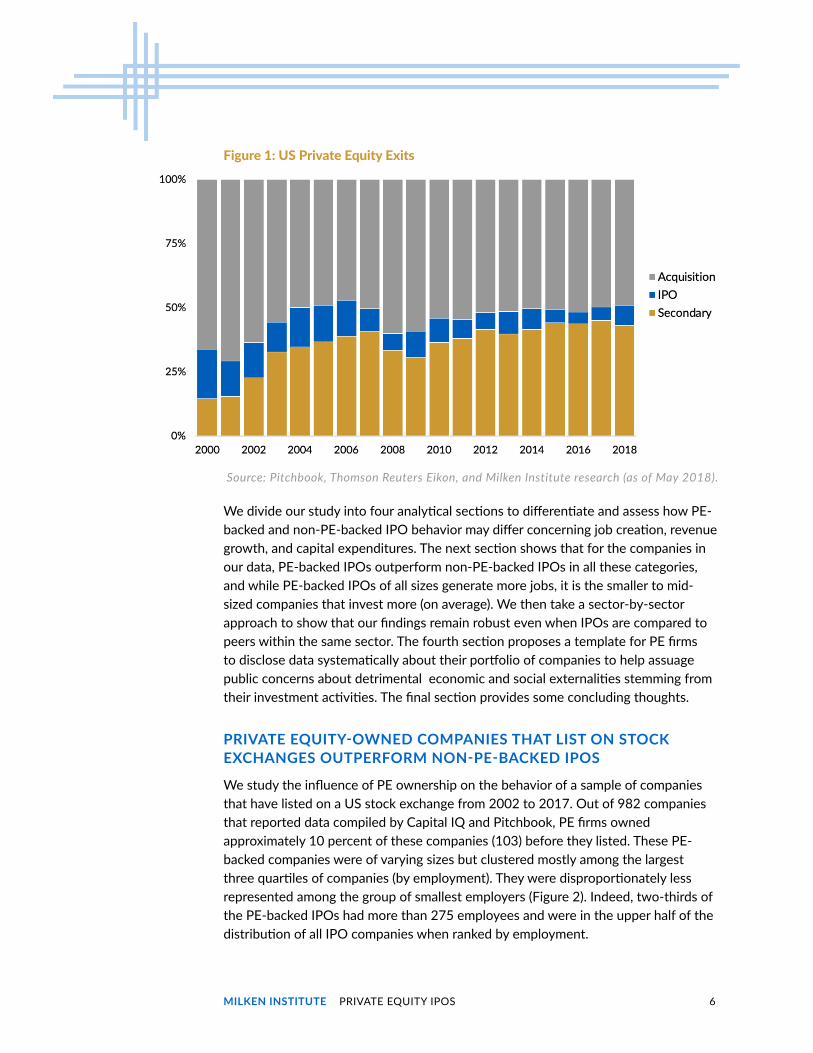
We are mindful of the special nature of this group of companies we have chosen to study—they represent a small sliver of companies that leave private equity ownership (approximately 10 to 20 percent). IPOs are not the typical way for a company to exit from private equity ownership. Since early 2000, there has been huge growth in sponsor-to-sponsor deals, where both the buyer and seller are PE firms. Such “secondary” exits now comprise 40 percent of all instances where companies leave a private equity owner (Figure 1). Such alternatives for companies to develop outside the IPO limelight have also extended the tenure of companies under PE ownership. Indeed, some estimates imply that “53 percent of all 2004-vintage buyout funds are still active.”10 Therefore, most of the companies that went private before the Financial Crisis likely have not returned to public markets.
Consequently, the companies we study are a small share of the companies reshaped by PE firms. Nevertheless, we show that the transformation of these companies to provide high returns for their investors may also have a positive influence on aggregate employment and investment trends. Unfortunately, we do not have relevant information about how PE activities influence company-level changes beyond this group of listed companies. Nevertheless, we believe the lessons learned about how PE influences company behavior after public listing contributes to the ongoing discussion about the PE industry. At a minimum, we believe our evidence may help reshape some inaccurate stereotypes about the effects of PE activities and contribute to ongoing discussions about regulatory and other policy changes to manage or limit the PE industry’s investment activities.
10 "For the longest time,” Pitchbook (2018).
MILKEN INSTITUTE PRIVATE EQUITY IPOS 6
We divide our study into four analytical sections to differentiate and assess how PE-backed and non-PE-backed IPO behavior may differ concerning job creation, revenue growth, and capital expenditures. The next section shows that for the companies in our data, PE-backed IPOs outperform non-PE-backed IPOs in all these categories, and while PE-backed IPOs of all sizes generate more jobs, it is the smaller to mid-sized companies that invest more (on average). We then take a sector-by-sector approach to show that our findings remain robust even when IPOs are compared to peers within the same sector. The fourth section proposes a template for PE firms to disclose data systematically about their portfolio of companies to help assuage public concerns about detrimental economic and social externalities stemming from their investment activities. The final section provides some concluding thoughts.
PRIVATE EQUITY-OWNED COMPANIES THAT LIST ON STOCK EXCHANGES OUTPERFORM NON-PE-BACKED IPOS
We study the influence of PE ownership on the behavior of a sample of companies that have listed on a US stock exchange from 2002 to 2017. Out of 982 companies that reported data compiled by Capital IQ and Pitchbook, PE firms owned approximately 10 percent of these companies (103) before they listed. These PE-backed companies were of varying sizes but clustered mostly among the largest three quartiles of companies (by employment). They were disproportionately less represented among the group of smallest employers (Figure 2). Indeed, two-thirds of the PE-backed IPOs had more than 275 employees and were in the upper half of the distribution of all IPO companies when ranked by employment.
Figure 1: US Private Equity Exits
Source: Pitchbook, Thomson Reuters Eikon, and Milken Institute research (as of May 2018).

MILKEN INSTITUTE PRIVATE EQUITY IPOS 7
Figure 2: PE-Backed IPOs Are Evenly Distributed Among the Larger Employees
Source: Pitchbook and S&P Capital IQ, Refinitiv, and Milken Institute research (as of June 2018)..
Company Distribution by Employment
PE-Backed Non-PE
More than 1,400 32 218
275-1,400 33 208
43-274 32 213
Fewer than 43 6 240
TOTAL 103 879
Percentage of PE and Non-PE
PE-Backed Non-PE
More than 1,400 31% 25%
275-1,400 32% 24%
43-274 31% 24%
Fewer than 43 6% 27%
TOTAL 100% 100%
Source: Pitchbook and S&P Capital IQ, Refinitiv, and Milken Institute research (as of June 2018).

MILKEN INSTITUTE PRIVATE EQUITY IPOS 8
PE-BACKED COMPANIES SHOW LARGEST POST-IPO EMPLOYMENT GAINS
Our data show that PE-backed IPOs created more jobs and at a faster pace (on average) than non-PE-backed companies during the 2002-2016 period (Figures 3a and 3b). Two years after their IPO, the PE-backed companies created an average of 421 jobs per year compared with an average of 290 jobs for non-PE-backed companies each year from 2002 to 2016.11 Apart from producing more jobs, our data also show that PE-backed IPOs generated jobs at a faster pace. Average annual employment growth among PE-backed companies for two years after the IPO was 8.7 percentage points faster than for the IPOs without PE involvement (i.e., PE-backed IPOs averaged 71.2 percent average annual employment growth compared with 62.9 percent for non-PE backed companies).12
Following the Great Recession of 2008, all companies created jobs at a faster pace, but the rate of PE-backed IPO job creation continued to exceed that for non-PE-backed companies, albeit by only 2.1 percentage points.13 Although the rate of job creation for PE- and non-PE-backed IPOs converged after 2008, the absolute number of jobs created by the former (on average) continued to exceed by 40 percent (e.g., 417 versus 297) the number produced by non-PE companies. Also, PE-backed IPOs consistently created jobs on average at a faster pace across companies of all sizes. Sorting all the companies by employment as a proxy for company size, the data continue to show that PE-backed IPOs created jobs at a faster pace than non-PE-backed companies (Figure 4). It is clear that among the smallest quartile of companies (those employing fewer than 43 workers), PE-owned companies averaged the fastest employment growth, although for this smallest-company quartile, there were disproportionately fewer of them than non-PE-backed IPOs.14 However, unlike the other size groupings, in the group of smallest companies (those employing fewer than 43 employees), the average non-PE-backed company created more jobs than the average PE-backed company.
11 In this report, when we refer to “average” employment, revenue, and investment (or capital expenditures), we calculate this value by dividing the total employment, revenue, or investment by the number of companies in the relevant category (e.g., PE-backed company or quartile). Consequently, the rows or columns in some of the tables below may not add to the total because of rounding.
12 The higher average employment growth for PE-backed firms is statistically significant at the 5 percent confidence level.
13 We calculated the average pace of job creation by companies in the PE and non-PE groups by dividing the number of jobs produced by each company for the two-year period after the IPO by the number of IPOs.
14 It is evident that these out-sized job gains are not an arithmetic artifact (where growth is generally more rapid for companies with a small number of employees). A company with five employees will experience 100 percent growth if it adds another five workers, whereas a company with 100 employees would experience only 5 percent growth.

MILKEN INSTITUTE PRIVATE EQUITY IPOS 9
Average differential for 2002-2009: +12.1 percentage points Average differential for 2010-2016: +2.1 percentage points
Figure 3a: PE-Associated IPOs Average Faster Growth in Jobs than Non-PE IPOs
Source: Pitchbook and S&P Capital IQ, Refinitiv, and Milken Institute research (as of June 2018).
Two-Year Job Creation by PE-Backed and Non-PE-Backed IPOs (number of new employees)
Figure 3b: PE-Associated IPOs Average More Job Creation than Non-PE IPOs
Average 2002-2008 Average 2009-2015 Average 2002-2015
PE 424 PE 417 PE 421
Non-PE 282 Non-PE 297 Non-PE 290
Two-Year Job Creation After PE-Backed and Non-PE-Backed IPOs (number of new employees)

MILKEN INSTITUTE PRIVATE EQUITY IPOS 10
While companies that conducted IPOs tended to be smaller than the typical company in their respective sector, PE-backed IPOs in the largest three employment quartiles consistently created more jobs (on average) than non-PE-backed companies. Indeed, the larger PE-backed companies (those in the largest quartile) generated more than twice as many jobs as the larger non-PE-backed IPOs. Moreover, the table under Figure 4 shows that employment gains for the median PE-backed IPO exceeded the number of jobs created by the median non-PE IPO in that same quartile.15
Measuring company size by revenue instead of employment continues to show that PE-backed IPOs generate faster employment growth and more jobs on average (Figure 5). Almost half (45 percent) of all PE-backed IPOs are mid-sized companies, with revenues in the $33 million to $243 million range. On average, these (third quartile) mid-sized companies, representing only 14 percent of all PE-backed IPOs, are the ones that produced jobs at the fastest pace (table accompanying Figure 5). Moreover, the median PE-backed IPO within each quartile produced more jobs than the median non-PE-backed IPO in the same size grouping.
15 At the time of its IPO, the median PE-backed company employed 642 workers, compared with 222 workers for those that were not PE-backed. For all companies in our sample (including those that did not IPO), the median company employed 1,840 workers.

MILKEN INSTITUTE PRIVATE EQUITY IPOS 11
Figure 4a: Faster PE-Backed IPO Employment Growth Evident Across Companies of All Sizes
1st 2nd 3rd 4th
42 274 1,400 >1,400
Employment Quartiles (number of new employees)
1st 2nd 3rd 4th Total Percent
PE average 6 32 33 32 103 10%
Non-PE average 240 213 208 218 879 90%
Number of IPOs
Source: Pitchbook and S&P Capital IQ, Refinitiv, and Milken Institute research (as of June 2018).

MILKEN INSTITUTE PRIVATE EQUITY IPOS 12
Figure 4b: Faster PE-Backed IPO Employment Growth Evident Across Companies of All Sizes
Employment Quartile 1st 2nd 3rd 4th
PE average 26.5 140.1 454.9 1,596
Non-PE average 37.1 122.2 401.4 719
Difference -10.6 17.9 53.5 877
Average Two-Year Job Creation (jobs created divided by number of companies in each quartile)
Two-Year Net Job Creation for Median Company (number of jobs for median company in quartile)
Employment Quartile 1st 2nd 3rd 4th
PE average 13 86 302 563
Non-PE average 12 45 219 400
Difference 1 41 84 163
Note: Among the 982 firms that conducted IPOs from 2002 to 2017 in our data, 103 were associated with PE firms. Two-thirds of the PE-related firms were in the largest two employment quartiles, employing 275 or more employees. Employment gains for the median company backed by private equity in each employment quartile exceeded job creation by the median non-PE-backed company.Source: Pitchbook and S&P Capital IQ, Refinitiv, and Milken Institute research (as of June 2018).

MILKEN INSTITUTE PRIVATE EQUITY IPOS 13
Figure 5a: Mid-Sized PE-Backed IPOs Display Fastest Employment Growth Gains
1st 2nd 3rd 4th
<3 32 243 > 243
Revenue Quartiles ($ million)
Revenue Quartile 1st 2nd 3rd 4th Total Percent
PE average 7 25 45 26 103 10%
Non-PE average 239 220 200 220 879 90%
Number of IPOs
Source: Pitchbook and S&P Capital IQ, Refinitiv, and Milken Institute research (as of June 2018).

MILKEN INSTITUTE PRIVATE EQUITY IPOS 14
Figure 5b: Mid-Sized PE-Backed IPOs Display Fastest Employment Growth Gains
Revenue Quartile 1st 2nd 3rd 4th
PE average 322 186 604 1,410
Non-PE average 97 238 369 572
Difference 225 -52 235 837
Average Two-Year Job Creation (jobs created divided by number of companies in each quartile)
Two-Year Net Job Creation for Median Company (number of jobs for median company in quartile)
Revenue Quartile 1st 2nd 3rd 4th
PE average 61 86 185 361
Non-PE average 15 49 180 238
PE-Difference (Non-PE base) 46 37 5 123
Source: Pitchbook and S&P Capital IQ, Refinitiv, and Milken Institute research (as of June 2018).
PE-BACKED IPOS DISPLAY MORE REVENUE GROWTH AND INVESTMENT SPENDING
Comparing their revenue-generating capabilities, PE-backed IPOs, on average, have consistently produced more revenues cumulatively during the two years after their IPO than non-PE-backed companies (Figure 6). Excluding the dampening effects from the 2008 recession, PE-backed IPOs earned an average of $196.3 million per year compared with $145.3 million for non-PE-backed companies. For the pre-recession period 2002-2007, PE-backed IPOs earned 50.3 percent more revenues than non-PE-backed companies (e.g., $252.9 million compared with $168.3 million).

MILKEN INSTITUTE PRIVATE EQUITY IPOS 15
Figure 6: PE-Backed IPOs Generated More Revenues After IPO
Source: Pitchbook and S&P Capital IQ, Refinitiv, and Milken Institute research (as of June 2018).
Cumulative Change in Revenues Two Years After IPO
Average 2002-2007 Average 2010-2015 Average 2002-2007, 2010-2015
PE 252.9 PE 139.7 PE 196.3
Non-PE 168.3 Non-PE 122.2 Non-PE 145.3
Cumulative Revenue Change Two Years After IPO ($ million)
For the period after the recession (2010-2015), IPO revenue growth slowed, as would be expected during a time when the economy grew at the slowest pace in post-WWII history. However, the revenue falloff in this period was sharpest for PE-backed IPOs, which earned, on average, $139.7 million compared with $122 million for non-PE-backed IPOs.
Although the larger companies generally produced more revenues than did smaller companies, the size of the average revenue gain two years after the IPO was similar across all company sizes except those in the smallest revenue quartile (Figure 7 second panel and accompanying table). Nevertheless, the average PE-backed IPO produced more than twice the revenues of non-PE-backed companies (an average of $133 million compared with $58 million).
The largest difference in revenue generation capacity was among the companies in the small-to-mid-sized (2nd) and largest (4th) quartiles (revenues with $3 million to

MILKEN INSTITUTE PRIVATE EQUITY IPOS 16
$32 million and over $243 million). The earnings of former PE-owned companies in these categories exceeded that of their non-PE counterparts by the largest amounts (Figure 6 and accompanying table). Also, it is notable that these two mid-sized quartiles contained 71 percent of all PE-backed IPOs. However, in comparing the median companies for each quartile, PE-backed IPOs earned more revenues than their non-IPO peers did in all but the largest grouping (companies with revenues greater than $243 million). Revenues of this large PE-backed IPO fell short of those of the non-PE median company by $8 million.
PE-BACKED IPOS INVESTED MORE THAN NON-PE-BACKED IPOS
In addition to generating more revenues, our data show that PE-backed companies, on average, invested more than the average non-PE-backed IPO (Figure 7). During 2002-2015 (excluding the recession years 2008 and 2009), PE-backed IPOs invested an average of $45 million a year, compared with $12.3 million for non-PE-backed companies. Indeed, before the 2008 recession, during the period 2002-2007, PE-backed IPO investment spending (on average) was 4.8 times that of non-PE-backed IPOs ($64 million compared with $13.4 million). As expected, with the drag on revenue growth during the post-recession period, capital expenditures declined for all companies, but much more so for PE-backed IPOs, whose investment spending on average dropped to $26.1 million, which was still more than double the pace of non-PE-backed IPOs.
Company size distinguishes and differentiates investment spending by PE- and non-PE-backed IPOs (Figure 7 and table). On average, the PE IPOs in the small- and mid-sized ($3–32 million revenue) group (second revenue quartile) spent the most on capital expenditures. Their spending exceeded the average spending by their non-PE-backed counterparts by more than 13 times ($93 million compared with $7 million). By comparison, the largest PE-backed IPOs reduced their investment spending by an average of $56 million during the two years after their IPO. Such behavior contrasts sharply with non-PE-backed IPOs of all sizes: They all increased investment spending (on average). Indeed, the non-PE-backed IPOs in the largest revenue quartile also had the largest average increase in investment spending ($16 million). However, the amount of this increase was smaller than the smallest increase in capital expenditures by PE-backed companies ($19 million).

MILKEN INSTITUTE PRIVATE EQUITY IPOS 17
Figure 7: PE-Backed IPOs Invest More than Non-PE-Backed Companies After IPO
Cumulative Two-Year Change in Capital Expenditure ($ millions; revenue quartiles)
Company Distribution by Revenue Quartile ($ million for quartile designation and number of companies)
1st 2nd 3rd 4th
< $3 $3 to $32 $33 to $243 > $243
PE-Backed 7 25 45 26
Non-PE 239 220 200 220
Source: Pitchbook and S&P Capital IQ, Refinitiv, and Milken Institute research (as of June 2018).
Revenue Quartile 1st 2nd 3rd 4th Total
PE net $135 $2,325 $1,241 $(1,467) $2,233
PE average $19 $93 $28 $(56) $22
Non-PE net $728 $1,646 $1,210 $3,572 $7,157
Non-PE average $3 $7 $6 $16 $8
Average difference $16 $86 $22 $(73) $51
Quartile share of average PE difference
32% 169% 43% -144% 100%
Cumulative Two-Year Capital Expenditure ($ million)
MILKEN INSTITUTE PRIVATE EQUITY IPOS 18
SECTOR-BY-SECTOR ANALYSIS VERIFIES PE-BACKED IPOS EMPLOY, EARN, AND INVEST MORE THAN PEERS
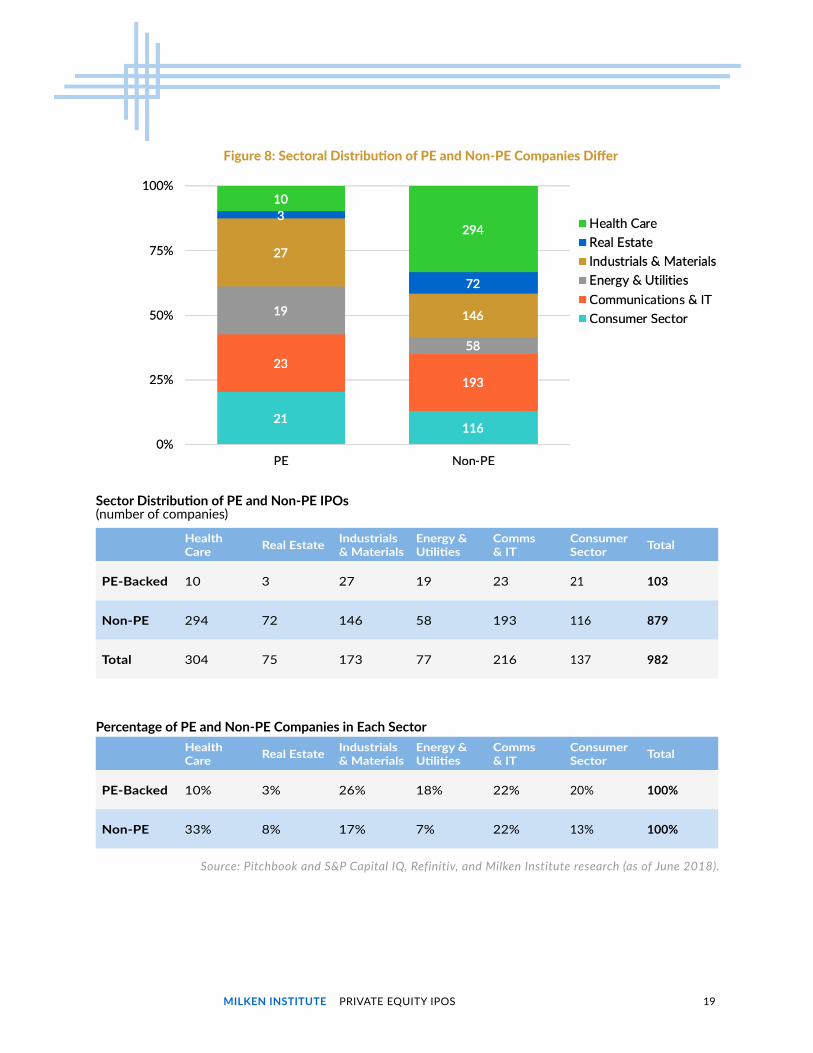
Differences in the sectoral composition of PE-backed versus non-PE-backed IPOs do not explain fully why the PE-backed companies appear to outperform in post-IPO job creation, revenue generation, and investment spending. Certainly, there are many examples where some post-IPO employment or investment spending by PE-alumni companies was larger than for companies in other sectors. For example, almost half of all PE-backed IPOs occurred in two relatively capital-intensive sectors (Figure 8): industrials and materials (26 percent) and communications and information technology (22 percent). By comparison, non-PE IPOs were more heavily concentrated (33 percent) in the labor-intensive health-care sector. Not surprisingly, total health-care capital expenditures after the IPO by all companies (on average) in our sample summed to less than 8.7 percent of the average capital expenditures by IPOs in the Industrial sector, where PE-backed IPOs were the most concentrated.
When considered on a sector-by-sector basis, our data show the following (on average) for PE-backed IPOs compared with their non-PE-backed IPO peers in that same sector (Table 1):
• They employ more workers.
• They generate more revenues (except for companies in the real estate sector).
• They spend more on capital expenditures (except companies in the health-care and real estate sectors).
MILKEN INSTITUTE PRIVATE EQUITY IPOS 19
Figure 8: Sectoral Distribution of PE and Non-PE Companies Differ
Source: Pitchbook and S&P Capital IQ, Refinitiv, and Milken Institute research (as of June 2018).
Health Care Real Estate Industrials
& MaterialsEnergy & Utilities
Comms & IT
Consumer Sector Total
PE-Backed 10 3 27 19 23 21 103
Non-PE 294 72 146 58 193 116 879
Total 304 75 173 77 216 137 982
Sector Distribution of PE and Non-PE IPOs (number of companies)
Health Care Real Estate Industrials
& MaterialsEnergy & Utilities
Comms & IT
Consumer Sector Total
PE-Backed 10% 3% 26% 18% 22% 20% 100%
Non-PE 33% 8% 17% 7% 22% 13% 100%
Percentage of PE and Non-PE Companies in Each Sector

MILKEN INSTITUTE PRIVATE EQUITY IPOS 20
Industrials & Materials Sector IPOs in the industrials and materials (IM) sector illustrate well the apparent positive influence of previous PE ownership on company performance. In our data, the IM sector contained the largest number of PE-backed IPOs (27 out of 103 PE-backed IPOs in our data), and PE-backed IPOs comprise 16 percent of the IPOs in this sector. PE-backed IPOs are concentrated among the largest companies (grouped by number of employees) (Table 2). Consequently, it is not surprising that most of the outperformance in job creation over companies that were not PE-backed originated from companies among the largest three quartiles of companies (those employing more than 269 workers).
What is surprising is that only the smaller PE-backed IPOs (i.e., companies in the first two quartiles with revenues below $348 million) demonstrated higher average (per company) revenue generation and investment spending compared with their non-PE-backed peers. In addition, comparing the median c3mpany in each revenue quartile further supports the relationship between company size and performance. Here again, the PE-backed IPOs in the smaller two quartiles produced more revenues and invested more than did non-PE backed companies. However, the reverse is true for the larger median companies. Interestingly, in the largest employment quartile of this sector, the PE-backed median IPO did not produce more jobs than did the non-PE-backed median company.
Communications & Information Technology Sector The communications and information technology (CIT) sector in our data contained the second highest number of PE-backed IPOs (23 out of 103) and comprised 11 percent of all IPOs in the sector (Table 3). These few IPOs generated more than twice the number of jobs as the other IPOs within this sector combined. Company size did not matter for creating jobs in this instance. The PE-backed IPOs of all sizes generated more jobs than did their peers. This is also evident by comparing the median company in each size quartile.
Unlike the IPOs in the IM sector, it was the larger CIT companies that generated more of the revenues and invested more, on average, than did their non-PE-backed peers.
Consumer Sector The consumer sector contained the third highest number (21 out of 103) of PE-backed IPOs, comprising 11 percent of all IPOs in the sector (Table 4). As with the previous two sectors, the few PE-backed IPOs produced more jobs, on average, than all other IPOs combined. In this case, companies in the largest grouping (those employing more than 5,209 workers) created most of the incremental jobs (on average).

MILKEN INSTITUTE PRIVATE EQUITY IPOS 21
The larger, PE-backed IPOs also generated most of the incremental revenues for the two years after the IPO, but it was the smallest group of companies (those with revenues below $41 million) that accounted for most of the incremental capital expenditures (of the PE-backed IPOs). One might speculate that in this relatively low-capital intensity sector, the smaller PE-backed IPOs sought to raise productivity by investing more than their competitors invest.
Health-Care Sector In contrast to the preceding sectors, there were relatively few PE-backed IPOs in the health-care sector; PE-backed health-care IPOs (10 out of 103) represented only 3 percent of all PE-backed IPOs (Table 5). Nevertheless, these few companies created more than twice the number of jobs for the two years after the IPO than all other companies combined. Most of the jobs created stemmed from the seven largest PE-backed IPOs (with revenues greater than $17 million and employing more than 134 workers).
These 10 companies managed to generate revenues (on average) that exceeded the average revenues of non-PE-backed IPOs. However, this outperformance was mainly due to two companies in the third revenue quartile ($2–17 million), and such outperformance may be unusual.
Other Sectors with Few PE IPOs: Real Estate and Energy Tables 6 and 7 display employment, revenue, and capital expenditure patterns in the energy/utility sectors and real estate sectors, respectively. The energy sector had more employment gains (on average) among PE-backed IPOs but did not have similar performance for revenue growth and capital expenditures. With only three IPOs in our data for the real estate sector, we hesitate to discuss the differences between PE and non-PE-backed IPOs but include the data for completeness.
A PROPOSED TEMPLATE FOR DISSEMINATING DATA FOR PE-OWNED COMPANIES
We understand the reluctance of PE firms to disclose information that may reveal trade secrets and operational improvements underlying company turnarounds that contribute to their out-sized returns. However, more institutional investors, especially public pension funds, reportedly are adding “sustainable” and “responsible” investing goals (e.g., Environmental, Social, and Governance, or ESG, targets) to their usual performance criteria.16 This implies that there will be more pressure on PE firms to show that they are part of the “investable universe” generating positive social contributions as well as high returns.
16 Investing with a focus on environmental, social, and governance issues—known as ESG—now amounts to $12 trillion in the United States, according to a new report from the nonprofit US SIF: The Forum for Sustainable and Responsible Investment.

MILKEN INSTITUTE PRIVATE EQUITY IPOS 22
To dispel its negative image, critics demand that the PE industry demonstrates that PE interventions into acquiring businesses will leave local communities better off than alternatives without PE intervention. This requires that PE firms provide evidence of ultimate job gains and store and factory openings that offset the initially disruptive changes directed by PE managers.
PE data disclosure can be limited to “macro” variables that do not reveal proprietary information about the PE firm’s value-enhancing techniques.
1. Job creation and destruction: At a minimum, PE firms should provide a time series detailing job losses and gains (or more precisely, full-time equivalent employees for each year a company is under PE ownership). Certainly, it would be important to distinguish between job changes due to organic growth or through a merger with other companies acquired by the PE firm.
2. Income generation and distribution: To satisfy the growing concern about rising income disparities, reporting the median income of company employees and its relationship to CEO compensation would help evaluate the degree to which PE firm activities meet ESG objectives.
3. Productivity-improving capital expenditures: Capital expenditures at the company level are vital incremental contributions to boosting aggregate productivity and creating better higher-paying jobs in the future. Disclosing annual capital expenditures and revenues (to scale the capital spending and compare across companies) would provide evidence that PE activities not only profit investors but also aim toward raising the community’s standard of living. Additional details about the share of capital expenditures devoted to R&D, equipment, and property would be helpful, too.
We believe this template is a minimal start toward bringing transparency and accountability to PE activities that critics describe as “…vampires bleeding the company dry and walking away enriched as the company succumbs.”
CONCLUDING THOUGHTS: PE-BACKED IPOS PUNCH WELL ABOVE THEIR WEIGHT CLASS
Our research uncovered evidence that challenges the negative cost-cutting, plant-closing, layoff-producing stereotype of private equity. While this image may be accurate for companies that remain under PE management, we find that companies that have graduated from PE ownership and listed on stock exchanges behaved differently. They tended to create more jobs, generate more revenues, and invest more than other companies that list.
Nevertheless, our investigation into the working of private equity is limited, and we would be the first to raise caution flags about generalizing our findings owing to our

MILKEN INSTITUTE PRIVATE EQUITY IPOS 23
limited data. We do not know whether the post-IPO gains in creating more jobs, revenues, and capital expenditures outweigh the costs of potentially more severe efficiency-improving measures taken by PE firms while they owned the company. After exiting PE ownership, presumably viable companies should be able to grow their payrolls and expand their investment spending at a healthy pace. Nevertheless, PE ownership may not be the primary factor behind the over-performance of PE-backed IPOs. Indeed, we are not able to compare IPOs with the performance of companies that leave PE ownership through a merger with other companies or are sold to other PE firms. Indeed, we cannot assess net job creation, revenue generation, and investment spending even for IPOs because PE firms do not disclose performance data for the companies they own.
If PE firms do not make available relevant data to the public, the uncertainty caused by such opaqueness about the “dark” inner workings of private companies owned by private equity will likely amplify public fears and worsen their already negative image. The lack of transparency and a continued stream of negative anecdotal reports will likely increase concerns about the potentially harsh social and economic impact that the activities of private equity investors may have on target companies and local economies. Consequently, such rising social pressure may restrain and limit some institutional investors (e.g., public pension funds) from allocating investments to private equity. The possibility of such adverse reactions should make the collection and public release of relevant and standardized data a top priority for the PE industry.
Our analysis has focused on those companies that have left private equity ownership and listed on a stock exchange. Consequently, we benefited from having relevant data collected in a standardized and audited manner, as required by regulations for listed companies. Making more data available about how companies fare under PE ownership may ease concerns about their negative social impact and reduce the number of calls for regulating and limiting investment fund flows into private equity. Indeed, the small crack of transparency that allowed us to investigate the aftermath of private equity influence on their IPO alumni suggests more bright rainbows than dark clouds ahead.

MILKEN INSTITUTE PRIVATE EQUITY IPOS 24
Table 1: Overall Sector Distribution
Health Care Real Estate Industrials & Materials
Energy & Utilities Comms & IT Consumer
Sector
PE-Backed 266 38 913 359 596 1,084
Non-PE 126 90 373 107 268 1,048
Difference 140 -52 540 252 328 36
Sector Distribution of Average Two-Year Employment Gains of PE and Non-PE IPOs (number of workers per company)
Health Care Real Estate Industrials & Materials
Energy & Utilities Comms & IT Consumer
Sector
PE-Backed 72 13 158 73 149 185
Non-PE 42 97 133 -316 127 54
Difference 30 -84 25 389 22 131
Sector Distribution of Average Two-Year Revenue Gains of PE and Non-PE IPOs ($ million per company)
Health Care Real Estate Industrials & Materials
Energy & Utilities Comms & IT Consumer
Sector
PE-Backed 0 0 31 18 12 35
Non-PE 1 22 12 27 7 7
Difference -1 -22 19 -9 5 28
Sector Distribution of Average Two-Year Capital Expenditures of PE and Non-PE IPOs ($ million per company)

MILKEN INSTITUTE PRIVATE EQUITY IPOS 25
Table 2: Industrials & Materials Sector
Revenue Quartile 1st 2nd 3rd 4th Total/Average
PE Net -2,670 9,137 2,754 15,434 24,655
PE Avg -667 761 551 2572 913
Non-PE Net 8,316 11,770 18,350 16,092 54,527
Non-PE Avg 213 380 483 423 373
PE Difference -880 381 68 2,149 540
PE Difference (of total difference) -51% 22% 4% 125%
Industrials & Materials Employment (net jobs and per-company average)
Quartile 1st 2nd 3rd 4th Total Percent
PE-Backed 4 12 5 6 27 16%
Non-PE 39 31 38 38 146 84%
173
Industrials & Materials Number of IPOs
Quartile 1st 2nd 3rd 4th Total/Average
PE Net 2,433 1,783 870 -829 4,258
PE Avg 608.4 148.6 173.9 -138.2 157.7
Non-PE Net 1,589 2,246 6,815 8,702 19,352
Non-PE Avg 40.7 72.5 179.3 229 132.6
PE Difference 567.6 76.2 -5.4 -367.2 25.1
PE Difference (of total difference) 209% 28% -2% -135%
Industrials & Materials Net Revenue (average)

MILKEN INSTITUTE PRIVATE EQUITY IPOS 26
Table 3: Communications & IT
Table 2: Industrials & Materials Sector (Continued)
Revenue Quartile 1st 2nd 3rd 4th Total/Average
PE Net 197 799 43 -205 835
PE Avg 49.3 66.6 8.7 -34.2 30.9
Non-PE Net 65 456 367 913 1,800
Non-PE Avg 1.7 14.7 9.7 24.0 12.3
PE Difference 47.6 51.9 -1.0 -58.2 19
PE Difference (of total difference) 81 88% -2% -99%
Industrials & Materials Capital Expenditure (per-company average; $ million)
Revenue Quartile 1st 2nd 3rd 4th Total/Average
PE Net 1,575 4,127 7,280 722 13,704
PE Avg 525 825 728 144 596
Non-PE Net 22,339 17,291 20,010 -7,914 51,727
Non-PE Avg 438 353 455 -162 268
PE Difference 87 472 273 306 328
PE Difference (of total difference) 8% 41% 24% 27%
Communications & IT Employment (average; net jobs)
Quartile 1st 2nd 3rd 4th Total Percent
PE-Backed 3 5 10 5 23 11%
Non-PE 51 49 44 49 193 89%
216
Communications & IT Number of IPOs

MILKEN INSTITUTE PRIVATE EQUITY IPOS 27
Revenue Quartile 1st 2nd 3rd 4th Total/Average
PE Net 125 220 2,025 1,057 3,426
PE Avg 41.6 44.0 202.5 211.3 149
Non-PE Net 6,992.7 2,867.6 5,960.8 8,783.4 24,604
Non-PE Avg 137.1 58.5 135.5 179.3 127
PE Difference -95.5 -14.5 67.0 32.1 -11
PE Difference (of total difference) 873% 133% -612% -293%
Communications & IT Net Revenue (average)
Revenue Quartile 1st 2nd 3rd 4th Total/Average
PE Net -49 5 186 143 285
PE Avg -16.3 1.0 18.6 28.6 1.4
Non-PE Net 223 162 290 589 1,265
Non-PE Avg 4.4 3.3 6.6 12.0 0.1
PE Difference -20.7 -2.3 12.0 16.6 1.3
PE Difference (of total difference) -369% -40% 214% 295%
Communications & IT Capital Expenditure (average)
Communications & IT Net Revenue (median; $ million)
Revenue Quartile 1st 2nd 3rd 4th
PE 43.8 37.5 66.1 117.0
Non-PE 18.3 33.0 58.7 174.8
PE Difference (Non-PE base) 25.5 4.5 7.4 -57.8
Table 3: Communications & IT (Continued)

MILKEN INSTITUTE PRIVATE EQUITY IPOS 28
Table 4: Consumer Sector
Revenue Quartile 1st 2nd 3rd 4th Total/Average
PE Net 2,839 3,034 12,498 4,400 22,771
PE Avg 473 337 2,500 4,400 367
Non-PE Net 14,919 16,044 27,293 63,283 121,539
Non-PE Avg 533 642 941 1,861 34
PE Difference -60 -305 1,559 2,539 333
PE Difference (of total difference) -2% -8% 42% 68%
Consumer Sector Employment (average; net jobs)
Revenue Quartile 1st 2nd 3rd 4th Total/Average
PE Net 492 773 1,935 682 3,882
PE Avg 82.0 85.9 386.9 682.0 59
Non-PE Net 731.3 1,787.7 2,512.4 1,181.6 6,213
Non-PE Avg 26.1 71.5 86.6 34.8 2
PE Difference 55.9 14.4 300.3 647.2 57
PE Difference (of total difference) 5% 1% 30% 64%
Consumer Sector Net Revenue (average; $ million)

MILKEN INSTITUTE PRIVATE EQUITY IPOS 29
Table 4: Consumer Sector (Continued)
Revenue Quartile 1st 2nd 3rd 4th Total/Average
PE Net 590 30 80 32 731
PE Avg 98.3 3.3 15.9 32 7.1
Non-PE Net 65 105 141 483 795
Non-PE Avg 2.3 4.2 4.9 14.2 0.2
PE Difference 96 -0.9 11 17.8 6.9
77% -1% 9% 14%
Consumer Sector Capital Expenditure (average; $ million)
Revenue Quartile 1st 2nd 3rd 4th Total/Average
PE Net 3 0 111 2,550 2,664
PE Avg 3 0 56 364 266
Non-PE Net 3,006 2,889 6,357 24,873 37,124
Non-PE Avg 40 38 86 360 126
PE Difference -37 -38 -30 4
Health-Care Employment (average; net jobs)
Table 5: Health Care

MILKEN INSTITUTE PRIVATE EQUITY IPOS 30
Revenue Quartile 1st 2nd 3rd 4th Total/Average
PE Net 0 0 52 666 717
PE Avg 0.0 0.0 25.8 95.1 71.7
Non-PE Net 471.1 465.6 1,146.8 10,177.6 12,261.1
Non-PE Avg 6.3 6.1 15.5 147.5 41.7
PE Difference -6.3 -6.1 10.3 -52.4
Health-Care Net Revenue (average; $ million)
Table 5: Health Care (Continued)
Revenue Quartile 1st 2nd 3rd 4th Total/Average
PE Net 0 2 0 -6 -5
PE Avg 0.0 0.3 -0.1 -3.1 -0.3
Non-PE Net -2.5 15.0 61.4 155.1 229.0
Non-PE Avg 0.0 0.2 0.8 2.1 0.8
PE Difference 0.00 0.05 -0.93 -5.20
Health-Care Capital Expenditure (average; $ million)

MILKEN INSTITUTE PRIVATE EQUITY IPOS 31
Table 6: Energy & Utility
Revenue Quartile 1st 2nd 3rd 4th Total/Average
PE Net 290 887 3,008 2,639 6,824
PE Avg 145 99 501 1,320 109
Non-PE Net 843 1,413 227 3,712 6,195
Non-PE Avg 50 141 17 206 7
PE Difference 95 -43 484 1,114 107
6% -3% 29% 67%
Energy & Utility Employment (average; net jobs)
Revenue Quartile 1st 2nd 3rd 4th Total/Average
PE Net 303 788 550 -263 1,379
PE Avg 151.7 87.6 91.7 -131.3 11
Non-PE Net 686.8 633.6 3,180.6 -22,851.0 -18,350
Non-PE Avg 40.4 63.4 244.7 -1,269.5 -16
PE Difference 111.3 24.2 -153.0 1,138.2 26
10% 2% -14% 102%
Energy & Utility Net Revenue (average; $ million)

MILKEN INSTITUTE PRIVATE EQUITY IPOS 32
Energy & Utility Capital Expenditure (average; $ million)
Table 6: Energy & Utility (Continued)
Revenue Quartile 1st 2nd 3rd 4th Total/Average
PE Net 405 1,483 -228 -1,318 343
PE Avg 202.7 164.8 -38 -659 -17
Non-PE Net 931.6 1,541 99.3 -1,030.4 1,542
Non-PE Avg 54.8 154.1 7.6 -57.2 3
PE Difference 147.9 10.7 -45.6 -601.8 -20
-30% -2% 9% 123%
Table 7: Real Estate
Revenue Quartile 1st 2nd 3rd 4th Total/Average
PE Net 0 93 20 0 113
PE Avg 0 47 20 0 67
Non-PE Net 1,331 1,918 -2,314 5,555 6,490
Non-PE Avg 74 113 -129 292 351
PE Difference - -66 149 - 82
- -80% 149% -
Real Estate Employment (average; net jobs)
Quartile 1st 2nd 3rd 4th Total Percent
PE-Backed 0 2 1 0 3 4%
Non-PE 18 17 18 19 72 96%
75
Real Estate Number of IPOs

MILKEN INSTITUTE PRIVATE EQUITY IPOS 33
Table 7: Real Estate (Continued)
Revenue Quartile 1st 2nd 3rd 4th Total/Average
PE Net 0 92 -54 0 38
PE Avg 0 46 -54 0
Non-PE Net 1,387 774 1,416 3,411 6,988
Non-PE Avg 77 46 79 180 381
PE Difference - 0 -133 - -133
PE Difference (of total difference) - 0% 100% 0%
Real Estate Net Revenue (average)
Real Estate Capital Expenditure (average; $ million)
Revenue Quartile 1st 2nd 3rd 4th Total/Average
PE Net 0 -2 1 0 -2
PE Avg - -1 1 - 0
Non-PE Net -446 -51 -13 2,082 1,571
Non-PE Avg -25 -3 -1 110 81
PE Difference - 2 1 - 3
PE Difference (of total difference) - 60% 40% -
Real Estate Net Revenue (median; $ million)
Revenue Quartile 1st 2nd 3rd 4th
PE - 22 -7 -
Non-PE 12 12 33 52
PE Difference (Non-PE base) - 10 -40 -

SANTA MONICA | WASHINGTON | NEW YORK | LONDON | ABU DHABI | SINGAPORE