private equity investments in the automotive supplier … · private equity investments in the...
TRANSCRIPT
Automotive
Private equity investments in the automotive supplier industry

Private equity investments in the automotive supplier industry
Foreword
3
Foreword
So far 2008 has been a less than satisfactory year for most investors. Prominent quoted equity indices, such as the DAX or the DOW, have moved deeply into the red. A similar trend is occurring in company transactions. “We have witnessed a decline in EBITDA multiples at a speed not seen before,” says Marcus Schroeder, Director, European Head of Automotive Suppliers at Merrill Lynch.
The automotive industry has been hit particularly hard, with substantial loss of shareholder value after almost all top OEMs issued profit warnings. “Selling automotive suppliers has certainly become more difficult as of late. High-tech companies, e.g. in the electronics segment, are holding up pretty well but commodity suppliers have become tougher”, says Martin Schwarzer, PwC’s German Head of Automotive M&A.
As OEMs have begun to suffer in public, private equity interest in automotive suppliers has declined, meaning that the market for automotive supplier LBOs has come to a grinding halt. Many PE houses have toned down their deal activities altogether; others have turned their attention towards less cyclical sectors. As the global financial crisis worsened in September/October, the majority of LBO activity came to a standstill.
On top of this, the automotive industry is facing further significant challenges such as globalisation, cost pressure, CO2 reduction to name just a few.
Nevertheless, we believe that there will continue to be attractive investment opportunities for private equity funds in the automotive sector, when credit facilities become available again.
Our aim with this study is to:
● shed some light on the reasons for this decline in deal activity;
● explore the industry in a little more detail and suggest segments that will be attractive areas of investment in the future;
● provide guidance on potential future investment opportunities.
For this purpose we have analysed background data including our AUTOFACTS® database, as well as carrying out numerous interviews with private equity investors, M&A advisors, LBO bankers, industry experts and macroeconomic institutes. We believe that the results provide an overview of the key drivers of the market and should provoke some thoughts around upcoming trends and opportunities.
We wish you a pleasant read and success with your current and future investments.
Harald Kayser Automotive Leader Germany
Volker Strack Managing Partner Transaction Services
Richard Burton Private Equity Leader Germany
Christian Knechtel Automotive Leader Transaction Services

Private equity investments in the automotive supplier industry
Contents
4
Contents
Foreword...............................................................................................................3
Figures..................................................................................................................5
Abbreviations........................................................................................................6
Executive summary ............................................................................................. 7
A Macroeconomic development ......................................................................... 8
1 Global macroeconomic situation......................................................................8
1.1 Regional trends ............................................................................................ 8
1.2 Macroeconomic risks and outlook .............................................................. 10
1.3 Impact of global macroeconomic downturn on the automotive industry .... 10
B Business situation of the automotive industry............................................... 12
1 Automotive demand and production growth ..................................................12
2 Mega-trends ...................................................................................................16
2.1 Socio-economic trends............................................................................... 17
2.2 Product trends ............................................................................................ 19
2.2.1 Reduction of resource consumption........................................................ 19
2.2.2 Safety ...................................................................................................... 22
2.2.3 Comfort.................................................................................................... 23
2.3 Industry trends............................................................................................ 23
2.4 Impact on supplier landscape..................................................................... 25
C Financial markets.......................................................................................... 26
D Wrap-up/conclusions .................................................................................... 28
PwC competence ...............................................................................................29
Acknowledgements ........................................................................................... 29
Contacts..............................................................................................................30
Private equity investments in the automotive supplier industry
Figures
5
Figures
Fig. 1 Annual percentage change in global GDP development (2003–2011) ...................................................................................... 8
Fig. 2 Annual percentage change in Triad GDP development (2003–2011) ...................................................................................... 9
Fig. 3 Annual percentage change in BRIC GDP development (2003–2011) .................................................................................... 10
Fig. 4 Annual percentage change in the correlation of world GDP with global vehicle production volume (1991–2008) ....................... 11
Fig. 5 Comparison of US and EU 15 light vehicle production (Q3/2007 vs. Q4/2008) .................................................................... 12
Fig. 6 Global light vehicle production of OEMs by region.......................... 13
Fig. 7 Global light vehicle sales by region (2003, 2007–2011) ................. 13
Fig. 8 Global light vehicle sales by region (2003, 2007–2011) ................. 14
Fig. 9 Global light vehicle production by region (2003, 2007–2011) ......... 15
Fig. 10 Global light vehicle production of top seven OEMs based on 2007 (2003–2008) ........................................................................... 15
Fig. 11 SOP of top three platforms by region based on 2011 ..................... 16
Fig. 12 Mega-trends..................................................................................... 17
Fig. 13 Proportion of emerging markets to mature markets as a percentage of total production (2007–2011) ................................... 17
Fig. 14 Global light vehicle production by segment (2007–2011) ............... 18
Fig. 15 Global light vehicle production by engine size (2007–2011)........... 20
Fig. 16 Global light vehicle production by engine type (2007–2011) .......... 21
Fig. 17 Volume share of global top 10 platforms as a percentage of total production (2003–2011)........................................................... 24
Fig. 18 Key money market indicators .......................................................... 26
Fig. 19 Risk premiums for LBOs.................................................................. 26

Private equity investments in the automotive supplier industry
Abbreviations
6
Abbreviations
BRIC Brazil, Russia, India, China
CAGR Compound Annual Growth Rate
CNG Compressed Natural Gas
CO2 Carbon Dioxide
CVT Continuously Variable Transmission
DCT Dual Clutch Transmission
DSG Direct Shift Gearbox
EU European Union
GDP Gross Domestic Product
GTL Gas to liquid
HCCI Homogeneous Charge Compression Ignition
IMF International Monetary Fund
JIS Just in sequence
JIT Just in time
LBO Leveraged Buy-Out
LPG Liquefied petroleum gas
M&A Mergers & Acquisitions
OEM Original Equipment Manufacturer
OLED Organic Light-emitting Diode
RoW Rest of World
SOP Start of production
USP Unique Selling Proposition

Private equity investments in the automotive supplier industry
Executive summary
7
Executive summary
The number of private equity-led acquisitions in the German automotive supplier industry has declined markedly in recent months. According to mergermarket, an M&A research firm, the third quarter of 2008 saw only two private equity acquisitions, down from eight in the second quarter.
We believe the reasons for this are threefold:
1. The decline in global GDP growth and with it the expected decline in business prospects of the automotive industry
2. Uncertainty about the direction of the automotive industry as a whole
3. The drying up of credit facilities available in the market
Our research suggests that these reasons are valid, but that the sector still offers good investment opportunities provided adequate care is taken in selecting the right targets, managing the acquisition process, developing the targets post deal and securing sufficient financing.
The global economic outlook may have declined, and growth expectations for Europe and the United States look weak in the short and medium term. Nevertheless, projected annual GDP growth in most emerging economies is still positive. Overall macroeconomic weakness will take its toll on the automotive industry. However, this reduction in volume will not be spread evenly across the industry and volume development will vary by region, by OEM and by platform.
Although the automotive industry is going through a significant change, we believe that the major components of that change are clear and that their effects can be understood. These are, in particular:
1. Socio-economic changes (e.g. the industrialisation of emerging economies, urbanisation, polarisation of income, increasing life expectancy)
2. Technological changes of cars and their components aimed to reduce resource consumption and improve vehicle safety and comfort
3. Improvements in industry efficiency and flexibility, primarily through optimisation of the global production footprint, vehicle platform strategies and modularisation
Generally speaking, suppliers which are positioned with successful OEMs and platforms, which have products that fit the above-mentioned mega-trends and provide sufficient barriers of entry are still likely to achieve the required financial performance to support an LBO.
In the current crisis, all LBOs have become difficult. For those brave enough to conduct acquisitions in this climate, alternative methods of financing (e.g. vendor loans, sale & leaseback agreements, etc.) have become more prevalent. When leverage returns to the market, we believe that it will be possible to secure financing for automotive deals. But to secure positive decisions from their financing committees, LBO bankers may need a higher level of confidence than in the past. To build such confidence, business plans must provide a realistic outlook and due diligence must provide a solid understanding of how the target in question is positioned vis-à-vis the mega-trends of the market and, hence, how the company can perform in the current and future market environment.
Private equity investments in the automotive supplier industry
Macroeconomic development
8
A Macroeconomic development
1 Global macroeconomic situation
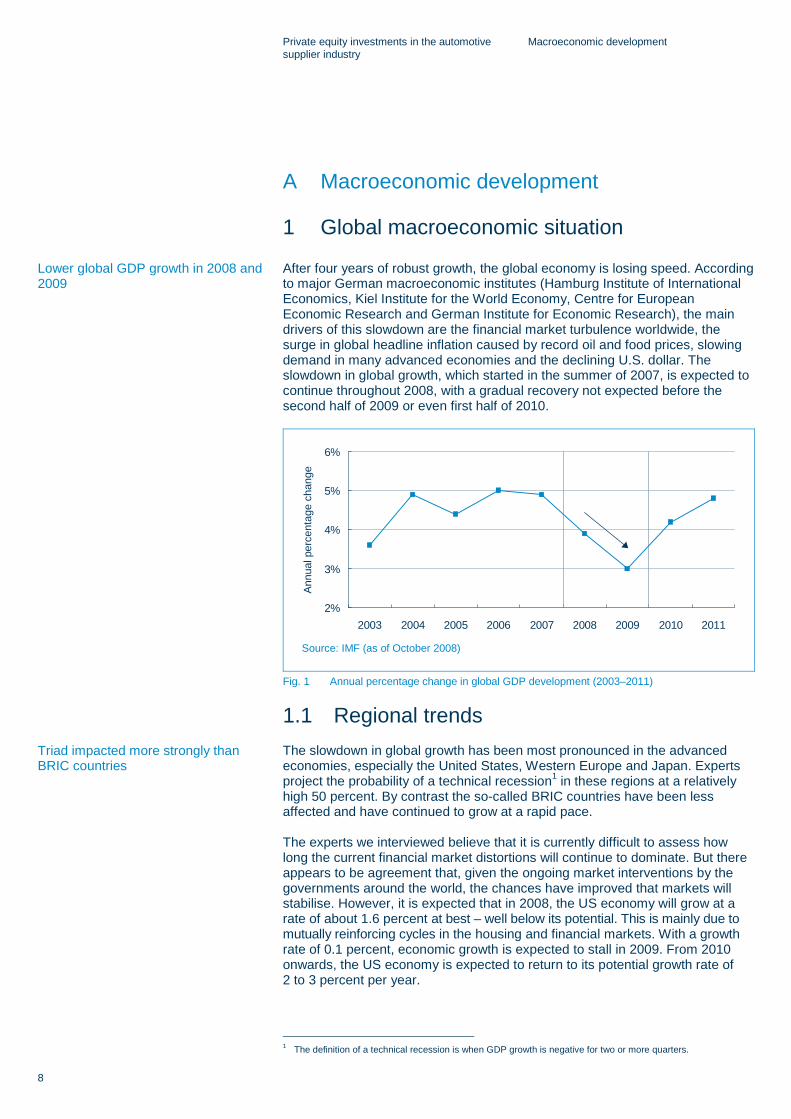
After four years of robust growth, the global economy is losing speed. According to major German macroeconomic institutes (Hamburg Institute of International Economics, Kiel Institute for the World Economy, Centre for European Economic Research and German Institute for Economic Research), the main drivers of this slowdown are the financial market turbulence worldwide, the surge in global headline inflation caused by record oil and food prices, slowing demand in many advanced economies and the declining U.S. dollar. The slowdown in global growth, which started in the summer of 2007, is expected to continue throughout 2008, with a gradual recovery not expected before the second half of 2009 or even first half of 2010.
Ann
ual p
erce
ntag
e ch
ange
Source: IMF (as of October 2008)
2%
3%
4%
5%
6%
2003 2004 2005 2006 2007 2008 2009 2010 2011
Fig. 1 Annual percentage change in global GDP development (2003–2011)
1.1 Regional trends The slowdown in global growth has been most pronounced in the advanced economies, especially the United States, Western Europe and Japan. Experts project the probability of a technical recession1 in these regions at a relatively high 50 percent. By contrast the so-called BRIC countries have been less affected and have continued to grow at a rapid pace.
The experts we interviewed believe that it is currently difficult to assess how long the current financial market distortions will continue to dominate. But there appears to be agreement that, given the ongoing market interventions by the governments around the world, the chances have improved that markets will stabilise. However, it is expected that in 2008, the US economy will grow at a rate of about 1.6 percent at best – well below its potential. This is mainly due to mutually reinforcing cycles in the housing and financial markets. With a growth rate of 0.1 percent, economic growth is expected to stall in 2009. From 2010 onwards, the US economy is expected to return to its potential growth rate of 2 to 3 percent per year.
1 The definition of a technical recession is when GDP growth is negative for two or more quarters.
Lower global GDP growth in 2008 and 2009
Triad impacted more strongly than BRIC countries

Private equity investments in the automotive supplier industry
Macroeconomic development
9
In 2008, the eurozone economy has been affected by the situation in the United States, the strong euro, slowing demand, high oil prices and inflation. Additionally, the crises in the housing markets of some European countries, particularly Spain, are impacting growth projections for 2008 and 2009. As a result, EU 15 growth is expected to remain below its potential – declining from 2.6 percent in 2007 to 1.3 percent in 2008 and further to 0.2 percent in 2009, before starting a recovery in 2010.
Based on our interviews, Japan is less directly affected by the current financial market turbulence. However, growth in Japan is also projected to decelerate. The main reasons for this projection are: A slower expansion of exports driven by declining consumption in Europe and the US, loss of market share to other Asian countries, in particular China, and a poor development of private household income due to high inflation and weak investment.
Ann
ual p
erce
ntag
e ch
ange
Source: IMF (as of October 2008)
0%
1%
2%
3%
4%
2003 2004 2005 2006 2007 2008 2009 2010 2011
EU 15 Japan USA
Fig. 2 Annual percentage change in Triad GDP development (2003–2011)
Growth in the BRIC countries is also expected to lose steam, in large part to the ongoing turmoil in the global financial markets and the slowdown of the US and European economies. But both the current and projected slowdowns are so far expected to be moderate compared to the Triad countries. The reasons for this relative robustness are the expected strength of domestic demand, consumption and investment in the BRIC countries. Due to improved fundamental conditions, the resilience of the BRIC countries to external shocks has increased in recent years. The projection is that the economies of the BRIC countries will grow at a consistently high level, however first signs of weaknesses are on the horizon.

Private equity investments in the automotive supplier industry
Macroeconomic development
10
Ann
ual p
erce
ntag
e ch
ange
Source: IMF (as of 15 October 2008)
0%
2%
4%
6%
8%
10%
12%
2003 2004 2005 2006 2007 2008 2009 2010 2011
Brazil India Russia China
Fig. 3 Annual percentage change in BRIC GDP development (2003–2011)
1.2 Macroeconomic risks and outlook The crisis in the US housing and financial markets and its effects on the European economy are still considered the biggest risks to the world economy, not to mention possible further liquidity crises which large financial institutions may face. This could have a significant impact on the financial conditions of companies and households alike. At the same time, risks related to inflationary pressures have risen, reflecting price increases in commodity markets and the upward trend of core inflation.
The current economic situation is still volatile and the uncertainty surrounding the projections still high. But according to expert discussions, the recent government interventions should improve the chances that the financial markets will stabilise. In Europe, the economic slowdown is expected to reach a trough in 2009. But even if so, the negative impacts on growth are projected to continue until the first half of 2010, particularly in the Triad countries. After that, challenges are projected to subside slowly, demand should start to increase and the economies in the Triad countries are expected to grow close to their potential again. However, we would like to draw your attention to upcoming global forecast revisions and their potential implications. “We see a global recovery within 2009. The global economy is more resilient than expected. Our forecast is that commodities will stabilize in 2009: oil and food prices will not be as high as their peaks in past months. We see the US housing market finding a bottom in the coming months,” says Dominique Strauss-Kahn, managing director of the International Monetary Fund.
1.3 Impact of global macroeconomic downturn on the automotive industry
The current economic downturn affects several industry sectors around the world. In addition to the building and construction, financial, chemical and plastic, and metals and mining sectors, the automotive industry is affected in the form of commodity price increases and declining demand.
The automotive industry is particularly sensitive to changes in overall economic conditions. Even a modest decline in GDP growth can have a significant effect on the performance of the industry.
Gradual recovery of the US and eurozone economies projected for the beginning of 2010 at the earliest, but substantial uncertainties remain
Strong correlation between global GDP growth and automotive production volume
Private equity investments in the automotive supplier industry
Macroeconomic development
11
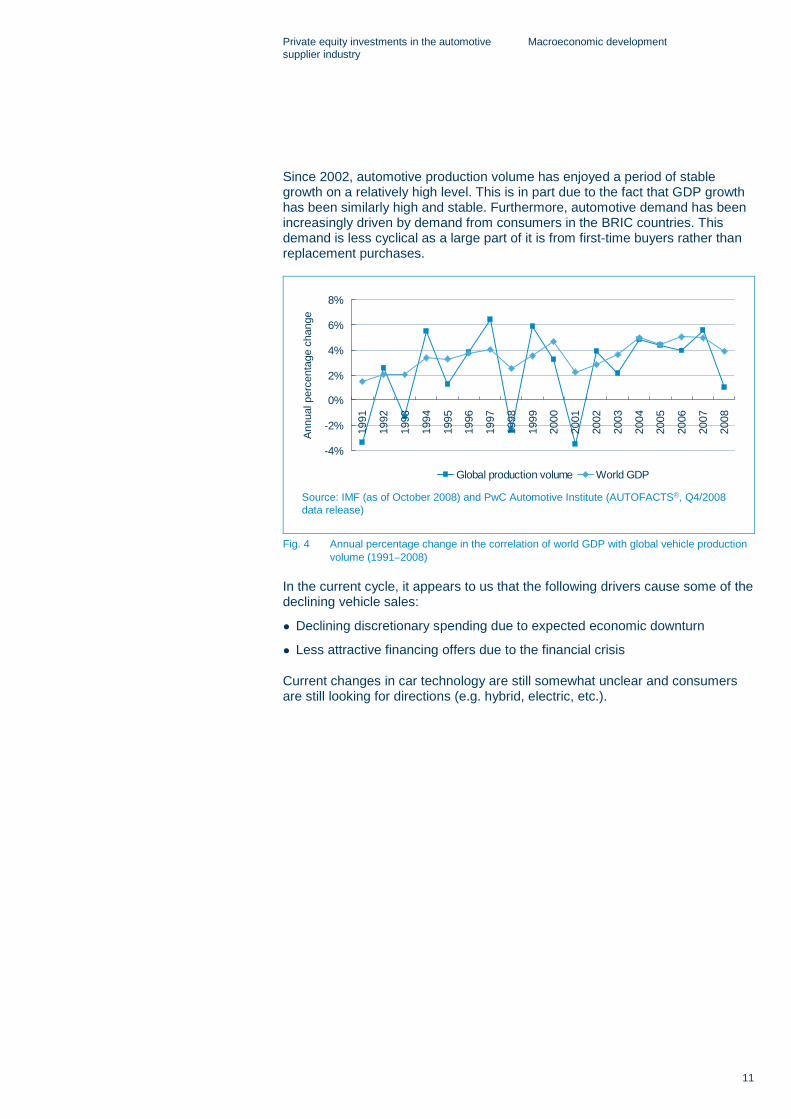
Since 2002, automotive production volume has enjoyed a period of stable growth on a relatively high level. This is in part due to the fact that GDP growth has been similarly high and stable. Furthermore, automotive demand has been increasingly driven by demand from consumers in the BRIC countries. This demand is less cyclical as a large part of it is from first-time buyers rather than replacement purchases.
Ann
ual p
erce
ntag
e ch
ange
Source: IMF (as of October 2008) and PwC Automotive Institute (AUTOFACTS®, Q4/2008 data release)
-4%
-2%
0%
2%
4%
6%
8%
1991
1992
1993
1994
1995
1996
1997
1998
1999
2000
2001
2002
2003
2004
2005
2006
2007
2008
Global production volume World GDP
Fig. 4 Annual percentage change in the correlation of world GDP with global vehicle production volume (1991–2008)
In the current cycle, it appears to us that the following drivers cause some of the declining vehicle sales:
● Declining discretionary spending due to expected economic downturn
● Less attractive financing offers due to the financial crisis
Current changes in car technology are still somewhat unclear and consumers are still looking for directions (e.g. hybrid, electric, etc.).

Private equity investments in the automotive supplier industry
Business situation of the automotive industry
12
B Business situation of the automotive industry
1 Automotive demand and production growth
The automotive industry currently faces difficult market conditions and other fundamental challenges. Cost pressures, production overcapacities, consolidation and restructuring trends, as well as deteriorating margins and high fuel prices, are just a few of the items facing the sector. In addition to these challenges, the global economic slowdown is having a significant impact on the automotive sector. As a result, almost all top original equipment manufacturers (OEMs) have issued profit warnings and reduced their volume and sales projections. Based on the recent development in the automotive environment, the PwC Automotive Institute has reduced its projections for light vehicle production in the EU 15 countries by a cumulative 4.3 million units and in the USA by 6.3 million units for the period from 2008 to 2011.
These values relate to the Q4 Data release which represents the latest full set of projections. An interim release was issued on 23 October 2008 indicating a further decline.
In m
illio
ns
Source: PwC Automotive Institute (AUTOFACTS®)
8
9
10
11
12
13
14
15
2005 2006 2007 2008 2009 2010 2011
EU 15 (Q3/2007) EU 15 (Q4/2008) USA (Q3/2007) USA (Q4/2008)
Cumulated volume reductionEU 15: 4.3 m units
Cumulated volume reductionUSA: 6.3 m units
Fig. 5 Comparison of US and EU 15 light vehicle production (Q3/2007 vs. Q4/2008)
These challenges in the automotive sector will affect the current and future business situation of the OEMs, especially in the Triad countries. In particular, the importance of the BRIC countries and other emerging economies will increase significantly, as they are considered both important growth markets and an opportunity for cost reduction.
Substantial reduction in projections of production volume in Triad countries

Private equity investments in the automotive supplier industry
Business situation of the automotive industry
13
10.1 9.3 7.8 6.2 6.1 4.0 3.9 3.6 2.6 2.4
3.0
1.62.7
2.3
0.20.2
2.32.31.8
0.7
2.1
1.0
0.7
0.3
2.2
2.8
1.4
0.8
1.1
1.3
1.31.0
5.4
4.2
0.90.80.6
0.8
0.50.3
1.7
0.8
1.8
0.6
2.80.50.7
2.8
1.32.3
1.43.0
2.00.30.2 12.8
Toyo
ta
GM
Ford
Volk
s-w
agen
Ren
ault-
Nis
san
Hyu
ndai
Hon
da
PSA
Fiat
Suzu
ki
Oth
ers
EU 15 USA Japan BRIC RoW
Source: PwC Automotive Institute (AUTOFACTS®, Q4/2008 data release)
Total in 2007: 69.0 million units
10.1 9.3 7.8 6.2 6.1 4.0 3.9 3.6 2.6 2.4 12.8
Fig. 6 Global light vehicle production of OEMs by region
After six years of relatively robust sales growth, the global sales volume of light vehicles is expected to decrease by 0.9 percent in 2008 mainly due to declining sales volume projections, especially in the Triad countries. In contrast, sales volume in the BRIC countries is projected to increase by a CAGR of 11.1 percent from 2007 to 2011. The main driver of this development is the overall increase in disposable income due to the general economic improvement in these countries. From 2009 onwards, a modest recovery of the global sales volume of light vehicles is expected driven by the growth projections in the BRIC countries and RoW.
12.3 13.2 12.3 11.8 12.5 13.3
16.6 16.1 14.2 14.3 14.9 15.4
5.7 5.2 5.1 5.2 5.3 5.47.7
14.7 16.9 18.5 20.4 22.416.4
19.9 19.9 20.021.2
22.558.8
69.1 68.4 69.774.2 79.0
0
10
20
30
40
50
60
70
80
2003 2007 2008 2009 2010 2011
EU 15 USA Japan BRIC RoW
In m
illion
s
Source: JD Power
0.4%
1.6% 0.3%
CAGR 2003–2007
CAGR 2007–2011
–0.8% –1.1%
17.7% 11.1%
–2.2% 0.7%
4.9% 3.1%
4.1% 3.4%
Fig. 7 Global light vehicle sales by region (2003, 2007–2011)
From 2009 onwards, global light vehicle sales volume expected to increase thanks to BRIC countries and RoW

Private equity investments in the automotive supplier industry
Business situation of the automotive industry
14
The growth projections in the BRIC countries may appear impressive. However, they have to be seen against a background of very low overall vehicle density2. Even in 2011, after several years of growing automobile sales, vehicle density in the BRIC countries will still be very low compared to the Triad countries.
580.0 591.9 612.0
30.2 44.4 63.7
0
100
200
300
400
500
600
700
2003 2007 2011
Triad BRIC
No.
of c
ars
per 1
,000
pot
entia
l driv
ers
The vehicle density refers to personal vehicles only (i.e. excluding commercial light vehicles).Source: JD Power
0.5% 0.8%
CAGR 2003–2007
CAGR 2007–2011
10.1% 9.4%
Fig. 8 Global light vehicle sales by region (2003, 2007–2011)
On the one hand, the growth in BRIC and RoW countries is driven by the projected production increase of emerging OEMs, e.g. Tata Motors Limited, Chery and Geely. On the other hand, established OEMs in the Triad countries view the BRIC countries and other emerging economies as an opportunity to reduce their cost base and build production capacities. It should be noted that automotive production in the BRIC countries almost exactly matches overall demand from the region. For suppliers this means that if they want to profit from automotive demand growth in the BRIC countries, they have to deliver to OEM factories located there. In many cases, this requires suppliers to have local facilities. As a result, the growth in vehicle demand in these countries is triggering substantial investment needs for western automotive suppliers.
2 Vehicle density is defined here as the number of light vehicles per 1,000 potential drivers.
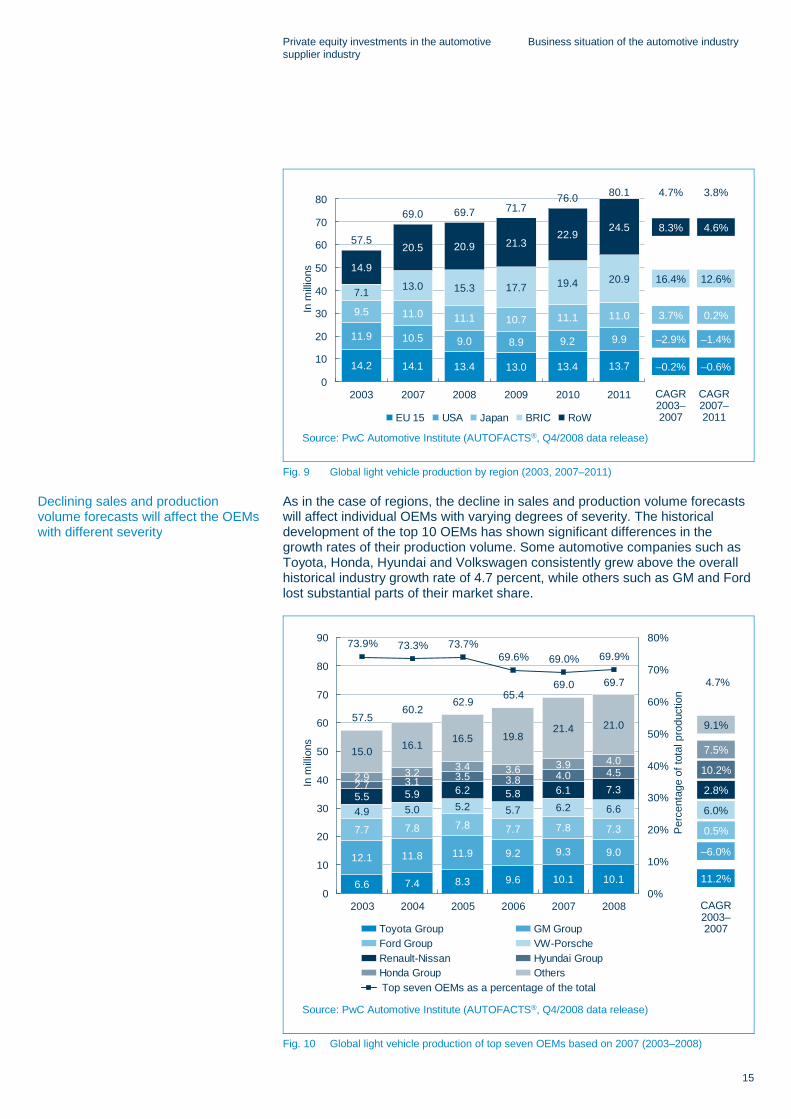
Global light vehicle production is expected to increase by a CAGR of 3.8 percent from 2007 to 2011, mainly due to growth in production in the BRIC countries and RoW.
Private equity investments in the automotive supplier industry
Business situation of the automotive industry
15
14.2 14.1 13.4 13.0 13.4 13.7
11.9 10.5 9.0 8.9 9.2 9.9
9.5 11.0 11.1 10.7 11.1 11.0
7.1 13.0 15.3 17.7 19.4 20.914.9
20.5 20.9 21.322.9
24.557.5
69.0 69.7 71.776.0 80.1
0
10
20
30
40
50
60
70
80
2003 2007 2008 2009 2010 2011
EU 15 USA Japan BRIC RoW
In m
illion
s
Source: PwC Automotive Institute (AUTOFACTS®, Q4/2008 data release)
–0.2% –0.6%
CAGR 2003–2007
CAGR 2007–2011
–2.9% –1.4%
16.4% 12.6%
3.7% 0.2%
8.3% 4.6%
4.7% 3.8%
Fig. 9 Global light vehicle production by region (2003, 2007–2011)
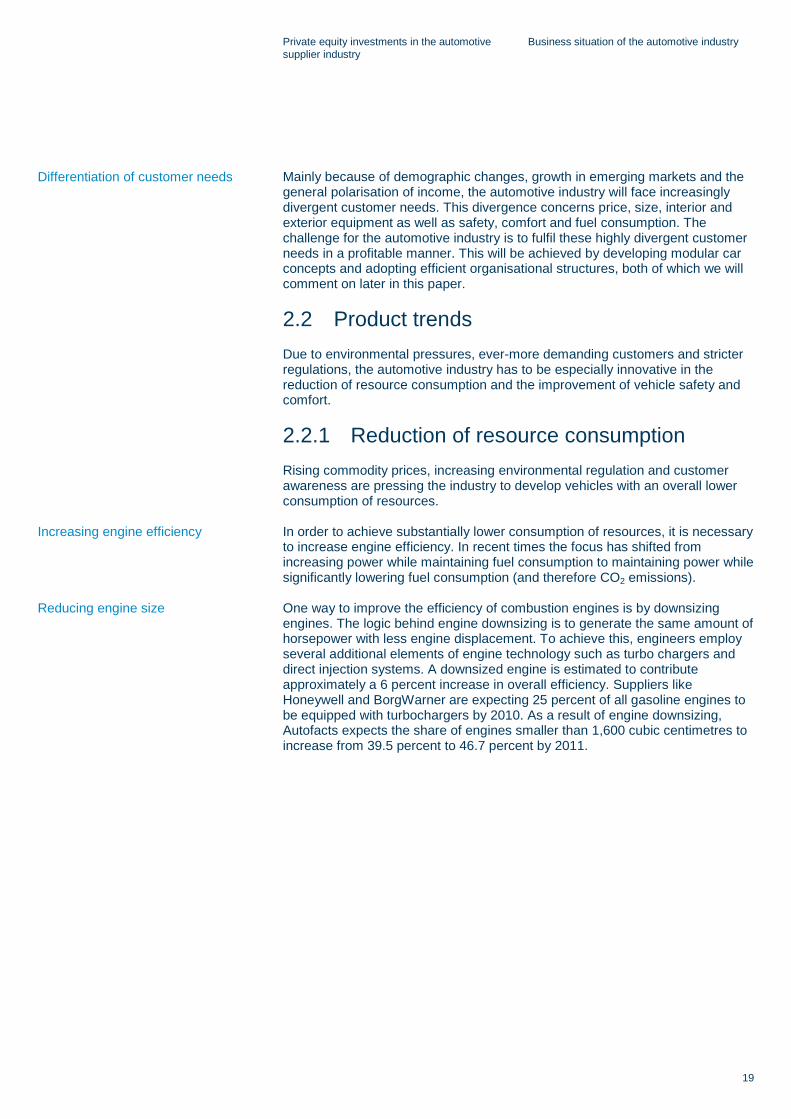
As in the case of regions, the decline in sales and production volume forecasts will affect individual OEMs with varying degrees of severity. The historical development of the top 10 OEMs has shown significant differences in the growth rates of their production volume. Some automotive companies such as Toyota, Honda, Hyundai and Volkswagen consistently grew above the overall historical industry growth rate of 4.7 percent, while others such as GM and Ford lost substantial parts of their market share.
6.6 7.4 8.3 9.6 10.1 10.1
12.1 11.8 11.9 9.2 9.3 9.0
7.7 7.8 7.8 7.7 7.8 7.34.9 5.0 5.2 5.7 6.2 6.65.5 5.9 6.2 5.8 6.1 7.32.7 3.1 3.5 3.8 4.0 4.52.9 3.2 3.4 3.6 3.9 4.0
15.0 16.1 16.5 19.821.4 21.0
73.9% 73.3% 73.7%69.6% 69.0% 69.9%
57.560.2
62.9 65.469.0 69.7
0
10
20
30
40
50
60
70
80
90
2003 2004 2005 2006 2007 20080%
10%
20%
30%
40%
50%
60%
70%
80%
Toyota Group GM GroupFord Group VW-PorscheRenault-Nissan Hyundai GroupHonda Group Others Top 7 OEM's as % of Total
In m
illion
s
Source: PwC Automotive Institute (AUTOFACTS®, Q4/2008 data release)
Top seven OEMs as a percentage of the total
Per
cent
age
of to
tal p
rodu
ctio
n
11.2%
CAGR 2003–2007
–6.0%
6.0%
0.5%
2.8%
4.7%
7.5%
10.2%
9.1%
Fig. 10 Global light vehicle production of top seven OEMs based on 2007 (2003–2008)
Declining sales and production volume forecasts will affect the OEMs with different severity

Private equity investments in the automotive supplier industry
Business situation of the automotive industry
16
It should also be noted that the OEMs’ individual platforms have different volume prospects based on their market acceptance and position in the product life cycle. Thus it is critical for automotive suppliers to be nominated in a sufficiently large number of growing platforms to compensate for foreseeable volume losses in platforms that are being phased out. Hence the suppliers need to have and maintain a good relationship with their respective OEMs in order to strengthen their position for new or subsequent platforms.
In summary, automotive suppliers which are positioned in attractive regions, delivering to successful OEM’s and into growing platforms can still experience reasonable growth.
Region Top three platforms Alliance group
2000
2001
2002
2003
2004
2005
2006
2007
2008
2009
2010
2011
2012
USA MC Toyota Group
GLOBAL EPSILON GM Group
GMT900 GM Group
EU 15 PQ36/47 (A6) VW-Porsche
PF2 PSA Group
C1/P1 Ford Group
Japan MC Toyota Group
NBC Toyota Group
L4 Toyota Group
BRIC X85/B Renault-Nissan
MINICAB GM Group
YP/YN Suzuki Group
RoW X85/B Renault-Nissan
HD Hyundai Group
NF Hyundai Group
Source: PwC Automotive Institute (AUTOFACTS®, Q4/2008 data release)
Fig. 11 SOP of top three platforms by region based on 2011
2 Mega-trends
The automotive industry is currently facing unprecedented change. This relates to global socio-economic changes as well as changes in product technology and the way products are developed and produced. Firstly, it has to adapt to global socio-economic changes, particularly the industrialisation of emerging economies and urbanisation. Secondly, major changes to cars themselves are expected, primarily in response to environmental pressures and safety and comfort expectations. “We are reinventing the car,” says Daimler AG CEO Dieter Zetsche. Thirdly, the industry evolution continues, in particular the value chain efficiency will play an ongoing role.
Automotive suppliers positioned in growing platforms can still experience attractive growth

Private equity investments in the automotive supplier industry
Business situation of the automotive industry
17
Socio-economic Product Industry
● Increasing importance of emerging markets
● Emergence of low-cost-cars
● Increasing share of smaller cars
● Individualisation
● Reducing resource-consumption – Increased engine efficiency – Innovative transmission concepts – Alternative fuels – Alternative engine concepts – Incremental vehicle improvements
(weight, rolling resistance, etc.) ● Improving vehicle safety ● Raising passenger comfort
● Improving value chain efficiency – Global footprint optimisation – Lean manufacturing – Design for manufacturability – Standardisation and
modularisation ● Collaboration ● Outsourcing
Fig. 12 Mega-trends
2.1 Socio-economic trends Many current trends in the automotive industry are driven by global socio-economic changes, such as the industrialisation of emerging economies, urbanisation, increasing life expectancy and the polarisation of income. The most prominent of these trends are:
● Increasing importance of emerging markets
● Emergence of low-cost cars
● Increasing share of smaller cars
● Individualisation
As a result of industrialisation and urbanisation, the demand for mobility will increase, especially in emerging markets. Thus, these markets’ importance on the global market for light vehicles will increase, and so will their share of vehicle production. The joint share of worldwide vehicle production of the EU 15, the United States and Japan is expected to decline from around 58 percent in 2007 to around 49 percent in 2011, whereas the share of the BRIC countries will increase from 19 percent to 26 percent in the same period. Among the BRIC countries, Russia and India are especially expected to exhibit high growth rates, although on a smaller absolute level. In Russia and India, many OEMs just recently opened their first factories or are doing so at the moment. Volkswagen, for example, has just opened its first factory in Russia and will also do so in India at the beginning of 2009. The changing split between emerging and mature markets shown below illustrates this market shift.
35.8% 40.4% 43.3% 45.2% 46.8%
64.2% 59.6% 56.7% 54.8% 53.2%
0%
20%
40%
60%
80%
100%
2007 2008 2009 2010 2011
Emerging markets Mature markets
Per
cent
age
of to
tal p
rodc
utio
n
Source: PwC Automotive Institute (AUTOFACTS®, Q4/2008 data release)
Fig. 13 Proportion of emerging markets to mature markets as a percentage of total production (2007–2011)
Increasing share of vehicle production outside Triad countries

Private equity investments in the automotive supplier industry
Business situation of the automotive industry
18
As emerging economies industrialise, the need for mobility will become greater and greater. However, discretionary income in emerging economies continues to be very low. At the same time, as discretionary income in the industrialised world is growing only slowly, the need for cheaper modes of transportation is also relevant there. These discrepancies are creating a market for a new product category: the low-cost car (LCC) and the ultra-low-cost car. LCCs are defined as cars in the price range of 5,000 euros to 10,000 euros (Triad countries). Ultra LCCs, marketed primarily in the BRIC countries, are defined as all vehicles in the price range below 5,000 euros. The best known example of an ultra LCC is the Tata Nano, with a price tag of about 1,700 euros. An example of an LCC is the Dacia Logan, starting at around 7,000 euros. These emerging segments are likely to show disproportionately high growth.
Industrialisation will go hand in hand with urbanisation. Experts currently estimate that about 70 percent of the world population will live in cities and mega-cities by 2050. This, in combination with the increasing demand for mobility and environmental protection, will cause a shift towards smaller and more efficient cars. The share of small, compact and medium-sized cars (categories S and M1) is expected to grow by 3.6 percent between 2007 and 2011. The share of larger cars (M2 and L), on the other hand, will decline by the same amount. Evidence of this trend is the increasing success of the Smart and the development of the Up! by Volkswagen or the iQ by Toyota.
22.4% 23.2% 23.1% 23.3%
37.3% 38.3% 39.3% 40.0%
23.6% 23.0% 22.8% 22.1%
16.7% 15.5% 14.9% 14.6%
0%
20%
40%
60%
80%
100%
2007 2008 2009 2011
S M1 M2 L
Per
cent
age
of to
tal p
rodc
utio
n
Source: PwC Automotive Institute (AUTOFACTS®, Q4/2008 data release)
Fig. 14 Global light vehicle production by segment (2007–2011)
Segment Chassis size (length by width) Autofacts segments Example
L > 9 sq m E, E/F, F, G S-Class F-series 300C
M2 8 sq m–9 sq m D, D/E Camry Passat 3 Series
M1 6.5 sq m–8 sq m C, D/E Golf Corolla Civic
S < 6.5 sq m A, A/B, B Polo Peugeot 207 Smart
Emerging segment of low-cost cars
Increasing share of smaller vehicles
Private equity investments in the automotive supplier industry
Business situation of the automotive industry
19
Mainly because of demographic changes, growth in emerging markets and the general polarisation of income, the automotive industry will face increasingly divergent customer needs. This divergence concerns price, size, interior and exterior equipment as well as safety, comfort and fuel consumption. The challenge for the automotive industry is to fulfil these highly divergent customer needs in a profitable manner. This will be achieved by developing modular car concepts and adopting efficient organisational structures, both of which we will comment on later in this paper.
2.2 Product trends Due to environmental pressures, ever-more demanding customers and stricter regulations, the automotive industry has to be especially innovative in the reduction of resource consumption and the improvement of vehicle safety and comfort.
2.2.1 Reduction of resource consumption Rising commodity prices, increasing environmental regulation and customer awareness are pressing the industry to develop vehicles with an overall lower consumption of resources.
In order to achieve substantially lower consumption of resources, it is necessary to increase engine efficiency. In recent times the focus has shifted from increasing power while maintaining fuel consumption to maintaining power while significantly lowering fuel consumption (and therefore CO2 emissions).
One way to improve the efficiency of combustion engines is by downsizing engines. The logic behind engine downsizing is to generate the same amount of horsepower with less engine displacement. To achieve this, engineers employ several additional elements of engine technology such as turbo chargers and direct injection systems. A downsized engine is estimated to contribute approximately a 6 percent increase in overall efficiency. Suppliers like Honeywell and BorgWarner are expecting 25 percent of all gasoline engines to be equipped with turbochargers by 2010. As a result of engine downsizing, Autofacts expects the share of engines smaller than 1,600 cubic centimetres to increase from 39.5 percent to 46.7 percent by 2011.
Differentiation of customer needs
Increasing engine efficiency
Reducing engine size

Private equity investments in the automotive supplier industry
Business situation of the automotive industry
20
39.5% 42.3% 43.8% 45.0% 46.7%
22.2% 22.5% 21.8% 20.9% 20.2%
20.3% 20.1% 20.0% 19.8% 19.6%
18.0% 15.1% 14.3% 14.2% 13.5%0.1%
0%
20%
40%
60%
80%
100%
2007 2008 2009 2010 2011
< 1600 cc 1601–2000 cc 2001–3000 cc > 3001 cc Electric
Per
cent
age
of to
tal p
rodu
ctio
n
Source: PwC Automotive Institute (AUTOFACTS®, Q4/2008 data release)
8.2%
CAGR 2003–2007
1.4%
–3.5%
2.9%
280%
Fig. 15 Global light vehicle production by engine size (2007–2011)
Other methods to increase the efficiency of combustion engines include: cylinder deactivation, variable valve control, variable compression systems, Homogeneous Charge Compression Ignition (HCCI) and start-stop systems.
In addition to the efficiency of the engine itself, it is crucial how efficiently the engine’s output is used, i.e. transmitted to the wheels. Due to differences in regional vehicle types, infrastructure and consumer preferences, etc., there is not one optimal transmission type. In Europe, the popularity of the dual-clutch transmission (DCT) is expected to grow quickly, while in Asia continuously variable transmissions (CVT) will be the fastest growing novel transmission concept. In North America, both CVTs and DCTs are expected to be popular, depending on the type of vehicle. The use of a DCT, for example, can reduce the consumption of resources by up to 5 to 6 percent. Volkswagen’s direct shift gearbox (DSG) is a very good example of the success of such a concept. Over one million DSG units have been sold since 2003 – more than 400,000 in 2007 alone.
However, all the methods mentioned so far have natural limits and will not lead to a CO2-free vehicle. To overcome such limits, carmakers have to find fundamentally new means to power vehicles such as alternative fuel types or alternative engine concepts.
Alternative fuels include biofuels and gas. The leading alternative fuels are compressed natural gas (CNG) and liquefied petroleum gas (LPG). Other gas variants are known as synthetic fuels, e.g. gas to liquid (GTL). Storing gas is more complicated and space-consuming than storing liquid fuels. However, CNG has already gained popularity in some niche markets (e.g. forklift trucks), as it is a very economical form of energy. Furthermore, the usage of CNG reduces CO2 emissions by 20 to 25 percent compared to conventional fuel. Biofuel is a term for fuels made from biological material and can be used without major adjustments to the traditional internal combustion engine. With respect to CO2 reduction, biofuels are attracting attention because they recycle atmospheric CO2 rather than releasing additional CO2. Although the importance of biofuels is increasing, they are unlikely to replace fossil fuels entirely, since the quantities of farmland available are not sufficient to cover global fuel demand. Furthermore, the farming of fuel crops could come into competition
Innovative transmission concepts
Alternative engines and fuels

Private equity investments in the automotive supplier industry
Business situation of the automotive industry
21
with food crops and thus cause food shortages in developing countries. “Renewable energies will play an important role in the future but they alone will not be able to cover global energy demand”, says Ulrich Seiffert, professor at the Technical University of Braunschweig,
Recent years have seen numerous attempts to launch alternative engine concepts. These include the well-publicised launch of the world’s first volume-produced hybrid vehicle, the Toyota Prius, a set of small firms with all-electric vehicle concepts (Aptera, Tesla, Zap), as well as concept studies from Western automakers. Alternative engine concepts fall into four categories: two types of hybrid (the series and the parallel hybrid), fully electric and fuel cell. Which of these technologies will dominate in the longer term is, of course, difficult to predict. Lithium ion battery technology has recently made some impressive strides in terms of energy density, reliability and safety. It is not unlikely that it will become the dominant form of energy storage for short travel distances. For longer distances a combination of engine concepts will be necessary. For example, the Chevrolet Volt, which is expected to go into serial production in 2010, is set to be the first high-volume electric car based on serial hybrid technology. For journeys longer than 60 kilometres the battery can be recharged by a small combustion engine. In the middle or long term it is conceivable that the combustion engine is replaced by a fuel cell. Most major OEMs are planning to launch models with alternative engine concepts within the next three years. The BMW 7-series and X6 will be offered as a hybrid variant as will the Q5 by Audi and the Cayenne by Porsche. Mercedes is planning to offer a fuel cell variant of its B-Class and a fully-electric Smart subcompact car.
As just described, alternative engine concepts will play only a niche role in the next few years. Although novel engine concepts like hybrid, electric and fuel cell are projected to grow at a CAGR of 39 percent from 2007 to 2011, this will happen on a very small scale. With an overall fraction of 2.5 percent of total produced cars, alternative engines will remain the exception rather than the rule for the foreseeable future. This is mainly a result of technical problems in energy storage, as well as the relatively high cost of components and current methods of production. Nevertheless, experts agree that in the longer term the electric car will play a significant role. This could provide the opportunity for major changes in the supplier industry.
21.8% 22.1% 22.4% 22.6% 22.6%
77.4% 77.1% 76.2% 75.7% 75.0%
0.8% 0.8% 1.4% 1.7% 2.5%
0%
20%
40%
60%
80%
100%
2007 2008 2009 2010 2011
Combustion/diesel Combustion/gasoline Hybrid/electric
Per
cent
age
of to
tal p
rodu
ctio
n
Source: PwC Automotive Institute (AUTOFACTS®, Q4/2008 data release)
5.5%
CAGR 2003–2007
3.4%
38.7%
Fig. 16 Global light vehicle production by engine type (2007–2011)
Combustion engine dominant in the short to medium term

Private equity investments in the automotive supplier industry
Business situation of the automotive industry
22
Weight reduction is another focus area for engineers. In the past, the weight of cars has increased from generation to generation, a result mainly of the addition of features (air conditioning, electric windows, central locking systems, etc.). If vehicles are to become more efficient, this will most likely stop. Development departments are exploring numerous ways to reduce weight by removing features, using lighter materials or using materials in a smarter way. This is a key area where suppliers can add value for their customers if they are able to support the reduction of overall vehicle weight. The Wuppertal Institute for Climate, Environment and Energy assessed the potential weight reduction of a medium-sized car to be between 25 and 50 percent; this would reduce the overall consumption by 0.9 to 1.8 litres per 100 kilometres.
Many more ways to minimise the vehicle’s resource consumption are being pursued. These include reducing aerodynamic resistance, rolling resistance and recuperating braking losses. As part of a study on reducing aerodynamic resistance, Daimler has developed a concept vehicle called the bionic car. The design of the bionic car was inspired by a boxfish and has enabled a coefficient of drag (cD) of only 0.19. This makes it one of the most aerodynamically efficient cars in its size category. Michelin has developed a new tyre concept with the aim of minimising rolling resistance. The result, called the Energy Saver tyre, is estimated to reduce fuel consumption by 0.2 litres per 100 kilometres. BMW has combined a number of such measures within its so-called Efficient Dynamic concept. Parts of this concept are the Auto Start-Stop function, brake energy regeneration, electric power steering, air vent control, gear shift indicator and tyres with reduced rolling resistance.
2.2.2 Safety In addition to making cars more efficient, the industry is also challenged to make cars and traffic safer. This is driven by ever stricter regulation, customer demand and the increasing risk of accidents resulting from a growing number of cars on the road. OEMs are trying to meet the demand for additional safety by developing new active and passive safety systems.
Active safety systems include radar, cameras for visible or infrared light, and ultrasound. Another concept meant to improve safety is the ‘networked car’. This concept entails automated wireless communication of the vehicle to other vehicles (car-to-car) or to traffic lights or road site units. Additional areas of improvement include ergonomics, such as the use of flat screens and similar display technology, so that as many display and control elements as possible can be placed in the driver’s core visual field. Delphi, for example, pursues this goal with their new display and operating concept. Exterior and rear view mirrors are replaced by displays connected to outside cameras. A head-up display with backlight projects information such as speed, direction and details from the car computer onto the lower visual field. All functions are operated from a touchpad on the steering wheel. An extra camera within the car continuously checks the attention of the driver.
Passive safety systems comprise mainly interior safety products (e.g. increasing number of airbags, sophisticated sensor systems for occupant detection etc.).
Reducing weight
Increasing use of electronic safety systems

Private equity investments in the automotive supplier industry
Business situation of the automotive industry
23
2.2.3 Comfort The need to increase driver and passenger comfort is not entirely new. Most traditional ways of doing this, however, have resulted in additional vehicle size and weight. This is not the case for the more innovative means of increasing comfort, most of which rely heavily on electronics.
In order to reduce stress on the driver, OEMs are introducing novel driver assistance systems. Such systems provide, amongst other things, automatic parking and dynamic route guidance. In addition, cars can be wirelessly connected to the outside world, allowing the use of Internet, TV and other data services. These may include things like remote vehicle diagnostics or transfer of vehicle data for warranty and customer relations management purposes.
To ease access to increasingly sophisticated vehicle functions, user interfaces (i.e. displays and vehicle operation) will change. Engineers envisage large numbers of displays distributed all over the vehicle, potentially based on flat panels, e-paper, OLED or projectors. Vehicle operation may be carried out intuitively, by gesture or using voice commands or external control elements (e.g. mobile phone). In the future, as shown in a concept car by Delphi, the driver may be able to check fuel level and car computer information, or start the climate-control unit or even the engine via mobile phone.
As people spend more and more time inside their cars, vehicles increasingly have to suit needs associated with ‘living space’. In particular, vehicle interiors will have to be responsive to varying ‘living room’ needs. This may entail flexible interior design depending on the situation and passengers – e.g. flexible seating concepts like sitting face to face. Another example is a large screen on the inside of the ceiling, enabling different lighting and design settings like a stress relaxation, concentration or work mode (comparable to mobile phone profiles).
Mainly as a result of the trends mentioned above, electronic systems will play an increasingly important role in core functions of the vehicle. Consequently the share of value added in electric/electronic systems will increase disproportionately. However, demand for such extras could also be cyclical – so the short term outlook may be moderate.
2.3 Industry trends In addition to reinventing the car, the industry is also reinventing the way of making it.
As one way to do this, the industry has already moved substantial parts of production to lower-cost countries and will continue to do so in the coming years. This has an inevitable effect on suppliers who have also been under pressure to follow their customers to these regions. This is particularly relevant for suppliers of highly labour intensive products. As this trend is expected to continue, the percentage of cars produced in the BRIC countries will increase from 19 percent in 2007 to 26 percent in 2011.
Electronic driver assistance systems
Novel user interfaces
Car becomes ‘living space’
Increasing share of vehicle value in electronics
Globalisation of production footprint

Private equity investments in the automotive supplier industry
Business situation of the automotive industry
24
A popular set of measures to improve value chain efficiency is known as ‘lean manufacturing’. Even though this is not an entirely new method, some OEMs and plants still have a way to go in this direction or are just beginning to do so. The main goal of lean manufacturing is to increase productivity by eliminating waste in the manufacturing process. Well-known tools are the Kanban (pull system for component logistics), Just-In-Time (JIT) or Just-In-Sequence (JIS) delivery methods, poka-yoke (error-proofing) and the 5S workplace philosophy.
One major trend in the industry not yet fully deployed is standardisation and modularisation. These design methods allow OEMs to build an ever-increasing number of cars on the same platform, i.e. with as many shared components as possible. The industry expects to achieve enormous economies of scale by using this lever. The share of vehicles built on the top 10 platforms worldwide is projected to increase from 19.3 percent in 2003 to 26.5 percent in 2011. The Volkswagen group, for instance, is building more than 10 different models on the same platform. Simultaneously, the number of different models increases from 1,034 to 1,192 (2003 to 2011), allowing the industry to follow diverging customer needs. As a consequence, OEMs are greatly increasing their flexibility – e.g. by making different models and even different platforms on the same assembly line.
1,034
1,073
1,118 1,1271,147 1,154
1,1781,205
1,19219.3% 18.3%20.1% 20.9% 21.4%
23.6% 24.4% 25.1%26.5%
1,000
1,050
1,100
1,150
1,200
1,250
1,300
2003 2004 2005 2006 2007 2008 2009 2010 20110%
5%
10%
15%
20%
25%
30%
Number of global models Top 10 platforms
Num
ber o
f glo
bal m
odel
s
Source: PwC Automotive Institute (AUTOFACTS®, Q4/2008 data release) Top
10 p
latfo
rms
as p
erce
ntag
e of
tota
l pro
duct
ion
Fig. 17 Volume share of global top 10 platforms as a percentage of total production (2003–2011)
Modularisation will allow OEMs to assemble vehicles out of different (potentially generic) subsystems that have standardised interfaces (‘plug and play’). This would allow OEMs to not only enhance flexibility, but also reduce production time. A standardised module concept may also, in the long run, enable consumers to equip their car according to changing needs, i.e. to upgrade their cars instead of purchasing new ones.
Another way to face increasing cost pressure is to build collaborative business networks. Those can include all areas including R&D, procurement and production. Lower-volume OEMs, in particular, are trying to benefit from such networks. In this context it is important, however, to take care that collaboration does not stand in the way of differentiation. Well-known collaboration agreements on supplier level include, for example, the ‘battery collaboration’ between Bosch and Samsung.
Lean manufacturing
Platform strategy
Modularisation
Collaboration
Private equity investments in the automotive supplier industry
Business situation of the automotive industry
25
OEMs will continue to concentrate their R&D and production capacities on brand formative modules and components. As a result, their share of value added is expected to decline. Whereas in 2002 the OEMs share of value added was 35 percent, this number is expected to decline to 23 percent by 20153. However, this trend is less pronounced in premium OEMs than in the volume segment. Some of the German OEMs have even decided to move certain activities from suppliers to in-house facilities in order to ensure utilization of staff.
2.4 Impact on supplier landscape As described, the automotive industry is going through a period of major change. This change will have substantial effects on suppliers and force them to react to these developments. Suppliers are expected to follow the mega-trends, such as reduction of resource consumption and supporting OEMs to improve production efficiency and flexibility. In addition, as most production growth in the automotive sector will occur in the BRIC countries, suppliers will need to continue to build up their presence there. At the same time, they have to respond to increasingly differentiated needs and increase their overall flexibility.
We believe that these developments will cause the supplier industry to consolidate, leaving a few global, diversified supplier groups and numerous specialised niche players who will need a healthy financial background and a strong business development focus.
3 Source: Mercer/FhG study “FAST 2015”
Outsourcing

Private equity investments in the automotive supplier industry
Financial markets
26
C Financial markets
Recent turbulence in the financial markets has been well publicised. Increasing commodity prices have lifted inflation expectations and thus limited the ECB’s room for lowering interest rates. The minimum bid rate of the ECB’s main refinancing operations was raised three times since January 2007 – up to a level of 4.25 percent. Due to concerns about bank liquidity, the Euro Interbank Offered Rate (Euribor) has increased even more markedly. As of 14 October 2008, the three-month Euribor was at 5.32 percent after a spike in bad news from the financial sector.
Bas
is p
oint
s
Source: www.euribor.org, www.ecb.int
300
350
400
450
500
550
Jan 2007 Apr 2007 Aug 2007 Nov 2007 Feb 2008 Jun 2008 Sep 2008 Dec 2008
ECB main refinancing minimum bid rate Three-month Euribor
Fig. 18 Key money market indicators
Even before the liquidity crunch, markets for bank refinancing had become very difficult, in particular syndication and CDOs4. It had become similarly difficult for banks to insure against default, as the price of credit default swaps (CDSs) had increased. As a result, risk premiums demanded by LBO financiers had increased as well.
Bas
is p
oint
s
Source: S&P
750800850900950
1,0001,050
Jan2007
Mar2007
May2007
Jul2007
Sep2007
Nov2007
Jan2008
Mar2008
May2008
Jul2008
Sep2008
Mezzanine (PIK + cash)
100150200250300350400
Jan2007
Mar2007
May2007
Jul2007
Sep2007
Nov2007
Jan2008
Mar2008
May2008
Jul2008
Sep2008
Senior A Senior B Senior C Mezzanine (PIK + cash)
Fig. 19 Risk premiums for LBOs
4 Collateralised debt obligations: Securities which banks use to sell repackaged loans (e.g. Mortgages, LBO
credit, etc.) to financial markets and thereby reduce the leverage in their balance sheets
Increasing interest rates
Increasing risk premiums

Private equity investments in the automotive supplier industry
Financial markets
27
Over the past weeks the situation deteriorated and a number of banks have currently discontinued lending for automotive LBOs. Many of those that still operated in the market did so under noticeable restrictions.
Firstly, the amount of credit available has declined. In the recent past, it was possible to secure senior debt of up to 6x EBITDA – a number that has now declined to 2.5–3.5x.
Secondly, the structure of credit has changed. ‘Covenant-light’5 arrangements or structures without senior A6 tranches have all but disappeared.
Thirdly, credit applications are subject to significantly more scrutiny. “We look for the special case; the company that can withstand the current pressures. And as always, ask the two key questions: Does this company have a real USP? If not, are they cost leaders?” explained an LBO banker from a leading German credit provider.
Additionally, banks have become even more reluctant to finance an entire LBO by themselves. Club deals of three, four or more partners have become the norm; larger, more complex arrangements have also been reported. As such structures tend not to be much stronger than the weakest link, the risk of a last-minute no-go – with a substantial bill of broken deal costs – has increased. As many banks have substantial tranches of doubtful loans and loan derivatives on their books their ability to lend is impaired. Additionally, many had already financed several automotive deals and therefore their appetite for more exposure to the industry is limited.
As long as the global liquidity crisis prevails, LBOs will be difficult, automotive even more so. However, the current situation in the markets is expected to stabilise in the future, by which time it is likely that valuations will have found an attractive level and financial sponsors will have committed capital ready for investment.
Potential investors in the automotive sector in future will be well advised to ensure that there are no open questions regarding the target’s strategic, operational or financial position. Additionally, financial investors will most likely, at least for some time, have to accept higher financing costs, somewhat lower leverage and increased scrutiny from financing partners.
5 LBO credit agreements typically include a set of conditions, or ‘covenants’, that the borrower must fulfil in order
for the agreement to remain valid. Were one of these conditions to be violated (‘covenant breach), the lender gains certain rights, e.g. to demand immediate repayment of principal and interest.
6 A lender of a senior A credit tranche is typically required to perform ongoing cash payments against principal and interest, whereas in senior B and C tranches, principal is repaid only at the end of the agreed credit period (so-called ‘bullet payments’).
Less leverage
Increased scrutiny
More club deals
Outlook

Private equity investments in the automotive supplier industry
Wrap-up/conclusions
28
D Wrap-up/conclusions
Clearly, the market for automotive LBOs will remain challenging for a while. The economic and business outlook has deteriorated, financing has become very difficult and the sector itself is going through a period of fundamental change – which will yield both risks and opportunities.
When the financial markets stabilise, we believe that the sector will continue to provide attractive opportunities for private equity investors. However, a sound investment case will need to have its foundation in profitable growth and an optimal cost structure rather than rely purely on leverage or valuation arbitrage.
To be successful, an investor needs to consider the following three areas:
Firstly, the selection of the right target will be more important than ever. Our analysis suggests that well-positioned targets should:
● be suppliers to (several) successful OEMs and be nominated for a sufficient number of growing vehicle platforms, building the basis for future growth;
● have products that follow the technological trends of the industry, such as reducing the vehicle's resource consumption or increasing the level of safety and comfort for passengers;
● be proactive innovators that solve their customer’s problems, providing the basis for an USP;
● be able to support OEM needs for an efficient value chain (i.e. support platform strategies/modularisation, just-in time supply, cost-efficient manufacturing, etc.); and
● have a high-quality management team.
Secondly, the investor needs to secure sufficient financing based on a realistic business plan. In a financial environment like the current one, it is crucial that equity and debt providers alike believe in the stability of the business case. In this context, a rigorous due diligence process is key to generate the confidence that stems from a well-understood business model. It seems less than clear whether the structured auction processes we have seen in recent years will be the best way to conduct these deals in future. Establishing whether a particular supplier is likely to profit or suffer from current industry trends can require extensive commercial/technological and operational due diligence. The structured auction process may not provide sufficient time for this and investors may consider the costs prohibitive – especially given the high level of completion risk in the current market conditions. A process including thorough vendor due diligence may help overcome this challenge. Even then, however, the demand for more “top-up” assurance on behalf of potential investors is likely to persist.
Thirdly, investors must take care that companies are well run throughout their period of ownership. Speedy execution of key post-deal improvement projects and regular strategic and operational reviews are recommended in order to avoid surprises at the time of exit.
Private equity investments in the automotive supplier industry
PwC competence
29
PwC competence
As one of the leading advisors to the German private equity community, we believe that we can bring the value required to be successful in the changing buy out and transaction environment. In particular, our market-leading credentials in the automotive sector mean that we can support all critical phases of an automotive LBO.
Our M&A practice has developed deep industry know-how in the automotive sector and has been the lead advisor on numerous deals – both on the buy-side and the sell-side. In particular, we can support identifying the right targets and conducting a structured acquisition process, as well as your financing process.
Our Transaction Services teams can support a wide range of due diligence requirements. In addition to financial due diligence, we offer commercial and operational due diligence services. In the field of commercial due diligence, we evaluate the technological and competitive position of a target and validate its revenue plans based on our proprietary AUTOFACTS® platform volume forecast database. For operational due diligence we analyse the target’s operational set-up, identify strengths and weaknesses, and quantify improvement potential.
Following the analytical phase of the due diligence process, we will be able to support you in extracting the maximum possible value from the deal. In particular, we can support the development of portfolio companies post deal. To do this, we will help you to implement significant post-deal performance improvement programmes.
Acknowledgements
We would like to thank all of our numerous interviewees for their contributions, in particular Wilhelm Becker of ab-consult, Prof. Bernd Gottschalk of AutoValue, Thomas Grau of the Bank of Ireland, Georg Liebler, former member of the Board at Kolbenschmidt Pierburg, Paul Pruss of Silverfleet Capital, Dr. Jörg Richard of HSH Private Equity, Matthias Schirmer of Granville Baird, Marcus Schroeder of Merril Lynch, Jens Willenbockel of Sal. Oppenheim and all others who did not wish to be named.
We further thank our colleagues at the PwC Automotive Institute for their relentless efforts in retrieving, analysing and commenting on AUTOFACTS® volume data and our marketing team for their support in coordinating the editing and printing process.
The authors,
Christian Knechtel Partner
Hatto Schick Manager
Luis Roever Senior Associate
Ihsan Ugurlu Associate

Private equity investments in the automotive supplier industry
Contacts
30
Contacts
Harald Kayser Automotive Leader Germany Fuhrberger Straße 5 30625 Hannover Phone: +49 511 5357-5685 E-mail: [email protected]
Volker Strack Managing Partner, Transaction Services Marie-Curie-Straße 24–28 60439 Frankfurt am Main Phone: +49 69 9585-1297 E-mail: [email protected]
Richard Burton Private Equity Leader Germany Marie-Curie-Straße 24–28 60439 Frankfurt am Main Phone: +49 69 9585-1251 E-mail: [email protected]
Christian Knechtel Automotive Leader, Transaction Services Marie-Curie-Straße 24–28 60439 Frankfurt am Main Phone: +49 69 9585-3188 E-mail: [email protected]
Martin Schwarzer Automotive M&A Leader Germany Marie-Curie-Straße 24–28 60439 Frankfurt am Main Phone: +49 69 9585-5667 E-mail: [email protected]
This study can be downloaded via our PwC website at www.pwc.de/de/automotiveLBO2008.pdf.
The information contained in this paper represents the culmination of proprietary research conducted by PwC and the PwC Automotive Institute. All material contained in this report was developed independently of any PricewaterhouseCoopers client relationship and does not represent the firm’s view as an auditor to any legal business entity. While every effort has been made to ensure the quality of information provided, no representation or warranty of any kind (whether expressed or implied) is given by PricewaterhouseCoopers as to the accuracy, completeness or fitness for any purpose of this document. As such, this document does not constitute the giving of investment advice, nor a part of any advice on investment decisions. Accordingly, regardless of the form of action, whether in contract, tort or otherwise, and to the extent permitted by applicable law, PricewaterhouseCoopers accepts no liability of any kind and disclaims all responsibility for the consequences of any person acting or refraining from acting in reliance on this document. AUTOFACTS is a trademark of PricewaterhouseCoopers LLP and is registered in the United States, Canada, the European Union, and the United Kingdom by PricewaterhouseCoopers LLP. Reproduction or retransmission without prior written consent from the PwC Automotive Institute is strictly prohibited. © 2008 PricewaterhouseCoopers AG Wirtschaftsprüfungsgesellschaft PricewaterhouseCoopers refers to the German firm PricewaterhouseCoopers AG Wirtschaftsprüfungsgesellschaft and the other member firms of PricewaterhouseCoopers International Limited, each of which is a separate and independent legal entity.
