private equity capital briefing - united states - ey · pdf filethe private equity capital...
TRANSCRIPT

Private Equity Capital Briefing
May 2017
Monthly insights and intelligence on PE trends
Fundraising continues its run
Little indication that investors are slowing the pace of commitments

The Private Equity Capital Briefing has been designed to help you remain current on capital market trends. It captures key insights from subject-matter professionals across EY firms and distills this intelligence into a succinct and user-friendly publication.
Private Equity Capital Briefingcan provide perspectives on both recent developments and the longer-term outlook for private equity (PE) fundraising, acquisitions and exits, as well as trends in global M&A, cross-border deal flows, IPOs and the debt and bond markets.
Please feel free to reach out to any of the subject-matter contacts listed on the back page of this document if you wish to discuss any of the topics covered.
Contents
Section 1 Private equity: fundraising 4
Private equity: acquisitions 5
Private equity: exits 6
Section 2 M&A 7
Section 3 IPOs 9
Section 4 Loans 10
Section 5 Bonds 11
AppendicesAppendix A PE activity by geography 13
Appendix B M&A activity monthly flash 22
Appendix C M&A multiples and bid premium 23
Appendix D Capital Confidence Barometer 24

1.i. Private equity: fundraising
Executive summary
• PE fundraising is seeing its strongest start to a year since 2008. PE firms have closed 215 funds valued at US$189b so far in 2017.
• Buyout dry powder continues to climb, reaching US$563b in April.
• Despite expectations that fundraising might slow in 2017 in the face of growing dry powder, the market continues to see strong momentum as the secular trends driving capital into the asset class (such as new investors) win out versus the cyclical headwinds (slowing exits and distributions).
Current state
Fundraising
• PE fundraising is seeing its strongest start to the year since 2008. To date, PE firms have closed fund valued at US$189b, up 3% from the same period last year, and the highest since 2008, when firms closed funds valued at US$217b between January and the end of April.
• Fundraising for buyout funds has been particularly active. Buyout funds have raised US$84.1b so far this year, accounting for 44% of total PE fundraising, the highest percentage since 2006. Investor demand for the asset class was underscored by a couple of large funds that closed in April; Clayton, Dubilier & Rice reached a final close on its 10th flagship fund, with total commitments of US$9.35b, making it US$3b larger than its predecessor fund. Additionally, Silver Lake Partners closed its Fund V with US$15b in commitments. The fund surpassed its target by US$2.5b, and surpassed Silver Lake’s 2013 fund by nearly US$5b.
Dry powder
• Dry powder continues to grow. Buyout capital available for new deals reached US$563b in April 2017, up from $534b at the end of 2016, and up from US$470b at the end of 2015. Effectively putting those assets to constructive use remains the industry’s biggest challenge.
Environment and horizon
• The expectation at the beginning of the year was that the industry would begin to see some slowdown in the pace of fundraising as exits slowed and LPs looked for GPs to deploy a meaningful percentage of dry powder. However, four months in, there has been little indication that investors are slowing the pace of their commitments. Indeed, the secular trends driving capital into the asset class (such as new investors like retail and high net worth individuals, and the need for pension funds to bridge their funding gaps) are winning out versus the cyclical headwinds (slowing exits and distributions).
• A recent survey conducted by Preqin shows a shift from region-targeted funds toward funds with a global purview. All single markets saw a decrease in investor appetite in 1Q17 versus 1Q16, while funds with a global purview saw an increase in anticipated activity, with 52% of active fund searches targeting global funds, versus 43% in the same period last year.
• More changes are in store for CalPERS, the US’ largest public pension fund. In April, longtime PE head Real Desrochers announced he was leaving the fund to pursue opportunities in the private sector. Desrochers joined CalPERS in 2010. His tenure saw CalPERS undertake a significant push toward manager consolidation, taking the fund from roughly 400 separate managers to approximately 100 by the mid-2016. The fund ultimately is seeking to reduce its manager relationships to 30 by 2020. The position will be filled on an interim basis by Sarah Corr, an investment director at the fund.
• CalPERS also disclosed that is was considering the removal of its standalone PE allocation target. In December 2016, the fund cuts its interim PE allocation to 8%, from 10%. In an April 17 meeting, the investment committee proposed to combine its private equity and public equity allocations into one, benchmarked against the FTSE All-World Index. A presentation released ahead of the meeting pointed to three other large investors that follow a similar model; the Ontario Teachers’ Pension Plan, CPPIB and the New Zealand Superannuation Fund. CalPERS is hoping to more effectively streamline the management and risk profiles of its PE and public portfolios by effecting the combination, saying the change will “enable potential portfolio construction capability to offset idiosyncratic regional, sector and company exposure.” A vote on the matter however, is not expected until early next year.
4
Source: Preqin
Regions targeted by LPs over the next 12 months – views from 1Q16 vs. 1Q17
Source: Preqin
Buyout funds — dry powder (US$b)
2003 2004 2005 2006 2007 2008 2009 2010 2011 2012 2013 2014 2015 2016 YTD2017
$0
$50
$100
$150
$200
$250
Global PE fundraising – YTD 2003 through YTD 2017 (in US$b)
2003 2004 2005 2006 2007 2008 2009 2010 2011 2012 2013 2014 2015 2016 YTD2017
$0
$100
$200
$300
$400
$500
$600
CalPERS current versus proposed allocations
North America:
1Q16 – 47%
1Q17 – 43%
Europe:
1Q16 – 56%
1Q17 – 39% Asia-Pac
1Q16 – 25%
1Q17 – 15%
Global
1Q16 – 43%
1Q17 – 52%
Source: Preqin private equity quarterly update 1Q17
Source: CalPERS
Private Equity Capital Briefing
Liquidity, 4%
Inflation, 9%
Infra and Forest, 2%
Real estate,
11%
Global fixed
income, 20%PE
, 8%
Global equity,
46%
Liquidity, 4%
Inflation, 9%
Real assets,
13%
Global fixed
income, 20%
Global equity,
54%
1.ii. Private equity: acquisitions
Executive summary
• PE acquisition activity remains strong, up 20% on a year-to-date basis versus last year.
• Deals in the middle market and large buyout space have remained steady over the last 16 months, averaging 21 deals per month.
• Through the end of April, all regions have seen an increase in activity, with the greatest increase in EMEA.
Current state
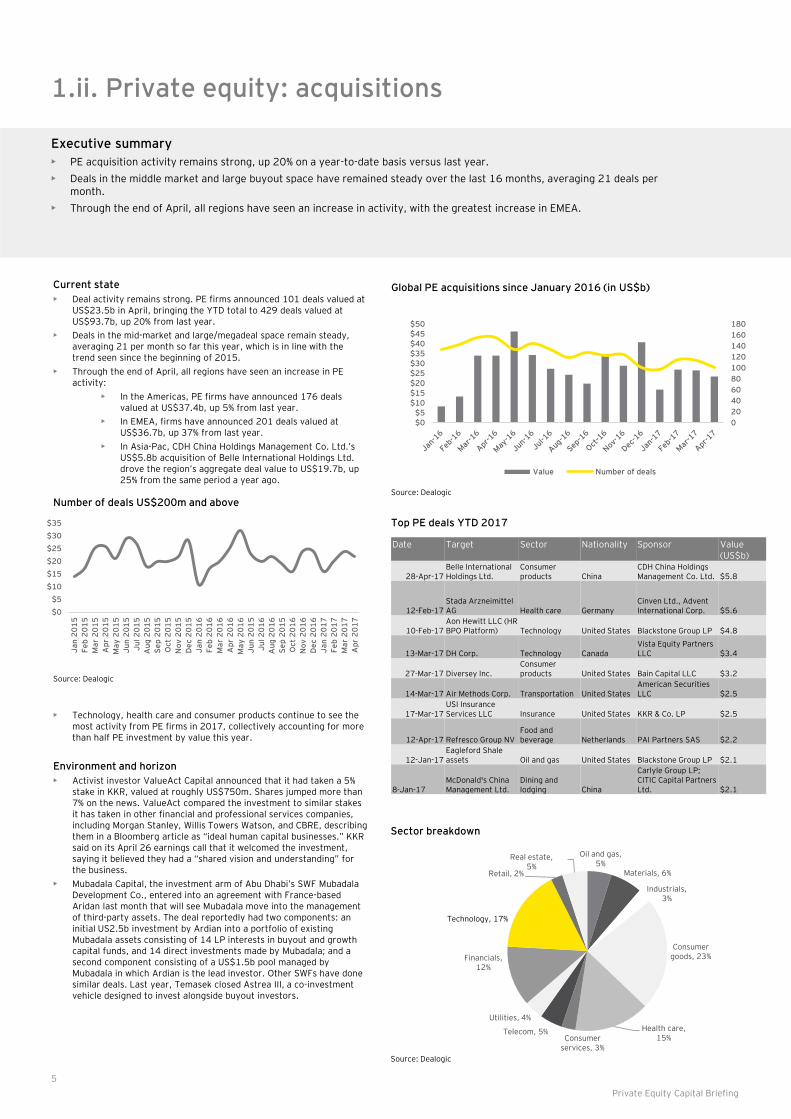
• Deal activity remains strong. PE firms announced 101 deals valued at US$23.5b in April, bringing the YTD total to 429 deals valued at US$93.7b, up 20% from last year.
• Deals in the mid-market and large/megadeal space remain steady, averaging 21 per month so far this year, which is in line with the trend seen since the beginning of 2015.
• Through the end of April, all regions have seen an increase in PE activity:
• In the Americas, PE firms have announced 176 deals valued at US$37.4b, up 5% from last year.
• In EMEA, firms have announced 201 deals valued at US$36.7b, up 37% from last year.
• In Asia-Pac, CDH China Holdings Management Co. Ltd.’s US$5.8b acquisition of Belle International Holdings Ltd. drove the region’s aggregate deal value to US$19.7b, up 25% from the same period a year ago.
• Technology, health care and consumer products continue to see the most activity from PE firms in 2017, collectively accounting for more than half PE investment by value this year.
Environment and horizon
• Activist investor ValueAct Capital announced that it had taken a 5% stake in KKR, valued at roughly US$750m. Shares jumped more than 7% on the news. ValueAct compared the investment to similar stakes it has taken in other financial and professional services companies, including Morgan Stanley, Willis Towers Watson, and CBRE, describing them in a Bloomberg article as “ideal human capital businesses.” KKR said on its April 26 earnings call that it welcomed the investment, saying it believed they had a “shared vision and understanding” for the business.
• Mubadala Capital, the investment arm of Abu Dhabi’s SWF MubadalaDevelopment Co., entered into an agreement with France-based Aridan last month that will see Mubadala move into the management of third-party assets. The deal reportedly had two components: an initial US2.5b investment by Ardian into a portfolio of existing Mubadala assets consisting of 14 LP interests in buyout and growth capital funds, and 14 direct investments made by Mubadala; and a second component consisting of a US$1.5b pool managed by Mubadala in which Ardian is the lead investor. Other SWFs have done similar deals. Last year, Temasek closed Astrea III, a co-investment vehicle designed to invest alongside buyout investors.
5
Private Equity Capital Briefing
Source: Dealogic
Date Target Sector Nationality Sponsor Value (US$b)
28-Apr-17Belle International Holdings Ltd.
Consumer products China
CDH China Holdings Management Co. Ltd. $5.8
12-Feb-17Stada Arzneimittel AG Health care Germany
Cinven Ltd., Advent International Corp. $5.6
10-Feb-17Aon Hewitt LLC (HR BPO Platform) Technology United States Blackstone Group LP $4.8
13-Mar-17 DH Corp. Technology CanadaVista Equity Partners LLC $3.4
27-Mar-17 Diversey Inc.Consumer products United States Bain Capital LLC $3.2
14-Mar-17 Air Methods Corp. Transportation United StatesAmerican Securities LLC $2.5
17-Mar-17USI Insurance Services LLC Insurance United States KKR & Co. LP $2.5
12-Apr-17 Refresco Group NVFood and beverage Netherlands PAI Partners SAS $2.2
12-Jan-17Eagleford Shale assets Oil and gas United States Blackstone Group LP $2.1
8-Jan-17McDonald's China Management Ltd.
Dining and lodging China
Carlyle Group LP;CITIC Capital Partners Ltd. $2.1
Top PE deals YTD 2017
Number of deals US$200m and above
Source: Dealogic
Global PE acquisitions since January 2016 (in US$b)
0
20
40
60
80
100
120
140
160
180
$0$5
$10$15$20$25$30$35$40$45$50
Value Number of deals
Sector breakdown
Source: Dealogic
Oil and gas, 5%
Materials, 6%
Industrials, 3%
Consumer goods, 23%
Health care, 15%Consumer
services, 3%
Telecom, 5%
Utilities, 4%
Financials, 12%
Technology, 17%
Retail, 2%
Real estate, 5%
$0
$5
$10
$15
$20
$25
$30
$35
Ja
n 2
01
5
Fe
b 2
01
5
Ma
r 2
01
5
Ap
r 2
01
5
Ma
y 2
01
5
Ju
n 2
01
5
Ju
l 2
01
5
Au
g 2
01
5
Se
p 2
01
5
Oct
20
15
No
v 2
01
5
De
c 2
01
5
Ja
n 2
01
6
Fe
b 2
01
6
Ma
r 2
01
6
Ap
r 2
01
6
Ma
y 2
01
6
Ju
n 2
01
5
Ju
l 2
01
6
Au
g 2
01
6
Se
p 2
01
5
Oct
20
16
No
v 2
01
6
De
c 2
01
6
Ja
n 2
01
7
Fe
b 2
01
7
Ma
r 2
01
7
Ap
r 2
01
7

1.iii. Private equity: exits
Executive summary
• Strength in the IPO markets and increased activity by PE investors in seeking to acquire PE-backed assets has led to a 22% increase by value in exit activity versus last year.
• Thee bulk of exit activity is centered in the Americas, which has seen M&A exits increase by 55%, and IPOs increase more than400% by value.
• Pent-up demand for public offerings suggests global IPOs will continue to rise in 2017.
Current state
• Overall exit activity has increased 22% by value in 2017 versus the same period last year, driven by an increase in secondary buyouts and rising sentiment in the IPO markets. PE firms announced 311 exits valued at US$102.1b in the first four months of the year. April saw US$24.9b in announced deals, up 24% versus last year.
• Exit routes have shifted in recent months, with PE firms becoming increasingly active buyers. Secondary buyouts have totaled US$25.7b so far this year, up 77% from last year. Sales to strategic investors have remained flat over the same period, with US$63.8b in announced deals, up 2% from last year.
• Activity has also been driven by strong tailwinds in the global IPO markets. After a quiet 2016, PE-backed IPO activity has increased markedly in the first four months of this year. PE firms have taken 38 companies public, raising proceeds of US$12.6b, up 94% from the same period a year ago. Activity was particularly robust in the oil and gas and life sciences spaces, with comparative weakness in consumer products and chemicals relative to the broader IPO market. The strong showing early this year has established a solid runway for the remainder of 2017.
• Increases in the Americas have been driving activity from a regional perspective. While M&A and IPO exit activity have declined in both Asia-Pacific and Europe, the Americas region has seen a 55% YTD increase in exits via M&A and a 474% increase in exits via IPO.
Environment and horizon
• Exit activity should remain at a consistent pace through the balance of the year, as PE firms look to avail themselves of continued favorable conditions for exits. While PE inventories have been spent down from where they were a few years ago, PE firms continue to hold more than 14,000 companies across the globe. Activity will remain driven by both corporate acquirors seeking growth through M&A-focused strategies, as well as PE firms seeking to put more than US$560b in dry powder to work.
• Pent-up demand for public offerings suggests global IPOs will continue to rise in 2017. Performance and valuations are trending upward, with several major indices reaching all-time highs. Concurrently, volatility is low, underpinning positive IPO sentiment, which is also supported by the successful US listing of a large technology unicorn. As such, pipelines are full, particularly in Asia-Pacific. There are currently more than 70 PE-backed companies in registration that, in the aggregate, could raise more than US$11b in total proceeds.
PE exits by month (US$b)
Top PE exits so far in 2017
6
Private Equity Capital Briefing
Source: Dealogic
Source: Dealogic
PE exits by type
Announcement or
filing dateCompany Sector
Value (US$b)
Sponsor Type
6-Jan-17 Invitation Homes Inc. Real Estate $6.3Blackstone Group LP IPO
25-Apr-17AdvancePierre Foods Holdings Inc.
Food and Beverage $4.3
Oaktree Capital Group LLC M&A
9-Jan-17Surgical Care Affiliates Inc. Health Care $3.5 TPG Capital LP M&A
19-Dec-16Jagged Peak Energy Inc. Oil and Gas $3.2
Quantum Energy Partners IPO
16-Mar-17 Alinta Holdings Utilities $3.1 TPG Capital LP M&A
0
20
40
60
80
100
120
$0
$10
$20
$30
$40
$50
Value Number of deals
0%10%20%30%40%50%60%70%80%90%
% Strategic % PE % IPO
PE IPOs by month (US$b)
Source: Dealogic
0
2
4
6
8
10
12
14
16
18
$0
$1
$2
$3
$4
$5
$6
$7
$8
Value Number of deals
Source: Dealogic
Source: Dealogic
$0
$10
$20
$30
$40
$50
$60
Americas EMEA Asia-Pacific
2016 M&A 2017 M&A 2016 IPOs 2017 IPOs
PE exits by type and region (US$b)

Current state• The M&A market continued to perform at elevated levels, with US$212b
of deals announced in April. Total value for 2017 is now 9% ahead of the same period in 2016. The volume of deals remained broadly flat compared with the prior year, at 2,327.
• The key value range driving M&A in 2017 is the US$1b−US$10b band. So far, 2017 has seen 167 deals in this range, compared with 149 in the same period in 2016 and 155 in 2015. This is a clear sign of boardroom optimism as companies pursue substantial acquisitions to boost strategic growth prospects.
• In France, billionaire Bernard Arnault moved to consolidate control over Christian Dior for €12.1b (US$13b), folding the fashion house’s operations into the LVMH luxury empire. The deal unites ownership of one of the most iconic fashion brands under one roof for the first time in decades. LVMH will also buy the Christian Dior couture brand from the Christian Dior holding company for €6.5b (US$7.1b). The two-part transaction, which comes amid a China-led revival in the luxury goods industry, simplifies a complicated ownership structure. This is a trend that may accelerate through 2017, both in the luxury fashion industry and in other sectors.
• US medical equipment supplier Becton Dickinson and Co. will acquire C.R. Bard Inc. in a US$24b deal, adding Bard's devices to its portfolio in the high-growth sectors of oncology and surgery. The transaction will build on BD’s leadership position in medication management and infection prevention with an expanded offering of solutions across the care continuum. It is the latest in a string of deals in the medical technology sector, as manufacturers turn to acquisitions to boost profit margins and respond better to ongoing product pricing pressures.
Environment and horizon• Near-term global dealmaking is expected to remain strong. According to
EY 16th Global Capital Confidence Barometer (CCB), more than half (56%) of companies expect to actively pursue deals in the next 12 months − up six percentage points from a year ago. Improving economic conditions underpin deal activity — European M&A markets, in particular, have seen a strong start to 2017 as European companies on the buy-side return to the market.
• Boardroom agendas continue to be dominated by disruptive forces such as digital innovation and the search for growth, even while set against a backdrop of geopolitical or emerging policy concerns. Geopolitical issues may dominate the headlines, but boards are laser-focused on counter measures against disruption and seizing new routes to growth.
• The need to generate returns above gross domestic product levels is spurring executives to look even more favorably on M&A. “Geopolitical and policy uncertainty is a permanent feature of the boardroom, but technology-enabled disruption poses a greater challenge to many business models. The exponential pace of disruption and transformation is compelling executives to engage in M&A. Companies need to innovate to follow rapidly changing customer preferences, and buying assets can be the fastest way to radically reshape their business for future growth,” commented Steve Krouskos, EY Global Vice Chair, Transaction Advisory Services.
• Consequently, corporates are reorganizing their portfolios, creating a natural pipeline of deal opportunities. Amid rapid change, companies are building more agility into their strategies, with 73% increasing portfolio review processes to respond to or capitalize on disruptive forces in their sectors. Technology-fueled industry convergence and transformational customer changes are challenging executives to reassess and reinvent their businesses continually.
• Cross-border deals are likely to increase in the coming months. Despite concerns about increasing nationalism and protectionism, 2017 has seen a significant uptick in cross-border deals. Potential policy changes affecting market access could drive cross-border deals as companies look to protect and sustain their globalized operations. “For many companies, cross-border deals are a necessity — successful companies will find ways to navigate challenges such as rising nationalism. Executives are evaluating M&A across a wide range of geographies to secure market access and grow customer base,” said Mr. Krouskos.
Deal environment: by area (US$b)
Last 12 months (LTM) to April 2017 versus LTM to April 2016Source: Dealogic and EY analysis
Deal environment: by target sector and target area (% share of global value)
LTM to April 2017Source: Dealogic and EY analysis; excludes real estate asset sales.
Note: because of rounding, percentages may not add up to total.
Top 10 announced deals by value, April 2017Source: Dealogic
M&A analysis as at 1 May 2017.
Note: data is continually updated and therefore subject to change.
Figures have been rounded off to nearest decimal place.
7
Executive summary• April continued the robust M&A market seen so far 2017, with US$212b of deals announced.
• US$1b−US$10b deals are driving the current market, with 167 deals in this banding announced in 2017.
• More than half of companies surveyed were looking to acquire in the next 12 months, according to EY Capital Confidence Barometer.
• The M&A outlook for 2017 remains healthy as companies look keen to reorganize their portfolio more frequently.
• Future-proofing will be an essential M&A driver as companies look for disruptive trends within their core and innovation outside their sectors.
1. M&A
Target Sector Country Acquiror Value (US$m)
C.R. Bard Inc. Life sciences US Becton Dickinson & Co. 24,433
Christian Dior SE (26.0032%)
Consumer products and retail
France Groupe Arnault SAS 13,146
Panera Bread Co. Real estate US JAB Holding Co SARL 7,490
Christian Dior Couture SA
Consumer products and retail
France LVMH Moet Hennessy Louis Vuitton SE
7,079
Patient Monitoring & Recovery Division ofMedtronic plc
Life sciences US Cardinal Health Inc. 6,059
Belle International Holdings Ltd (87.938%)
Consumer products and retail
China Hillhouse Capital Management Ltd, Wisdom Man Ventures Ltd and CDH Investments Ltd
5,823
Akorn Inc. Life sciences US Fresenius SE & Co. KGaA
4,887
AdvancePierre Foods Holdings Inc.
Consumer products and retail
US Tyson Foods Inc. 4,277
Swift Transportation Co.
Automotive and transportation
US Knight Transportation Inc.
4,010
Chewy Inc. Technology US PetSmart Inc. 3,350
Americas Asia-Pacific EMEA Total
Technology 8% 3% 4% 16%
Oil and gas 10% 1% 2% 14%
Diversified industrial products 5% 2% 4% 11%
Consumer products and retail 6% 2% 3% 10%
Life sciences 4% 1% 2% 8%
Power and utilities 3% 2% 2% 7%
Media and entertainment 4% 1% 1% 5%
Real estate, hospitality and construction
2% 2% 2% 5%
Banking and capital markets 2% 1% 2% 5%
Others 9% 6% 5% 19%
All sectors 52% 21% 27% 100%
Private Equity Capital Briefing
-
1,000
2,000
3,000
Americas Asia-Pacific EMEA
LTM value PTM value

1.i. M&A: cross-border deal flow
Key cross-border M&A deal flow(LTM to April 2017)(Total = US$1.31t)
N America to:W Europe – $194b
UK&I – $59bMiddle East – $20b
Japan to:N America – $48b
UK&I - $35bW Europe – $10b
UK&I to:N America – $104b
W Europe – $6bAfrica – $3b
Middle East – $3b
L America to:N America – $9b
Russia, CIS and CSE - $1b
Greater China andMongolia to:
N America – $43bW Europe – $36b
Oceania – $19bW Europe to:N America – $152bL America - $15b
Russia, CIS and CSE - $9b
Cross-border M&A deal flow (LTM to April 2017)
(US$m)
Key
>$100b
>$50b
>$10b
Note: all figures are in US$.
# Acquiror refers to acquiror’s ultimate holding company.
$ Greater China and Mongolia includes mainland China, Hong Kong, Macau, Mongolia and Taiwan.
M&A analysis as at 1 May 2017.
Source: Dealogic. All Rights Reserved.
Note: data is continually updated and therefore subject to change.
Key >US$100b >US$50b >US$10b
Intra-area cross-border deals
Target Acquiror# Africa SE Asia (including Korea)
Greater China and Mongolia$
Russia, CIS and CSE
W Europe (excluding UK&I)
India Japan Latin America
Middle East
North America
Oceania UK&I Inboundtotal
% versus PTM
Africa 896 81 6,734 1,577 3,515 22 1,568 - 112 7,398 882 3,196 25,982 111%
SE Asia (including Korea)
5 6,016 8,540 13 2,663 7 2,821 24 8,170 5,440 145 1,237 35,082 -6%
Greater China andMongolia $
- 3,287 27,879 450 3,878 - 688 40 - 8,454 521 195 45,393 3%
Russia, CIS and CSE 1,131 347 2,581 2,493 8,852 3,107 8,845 1,048 11,916 1,776 1,759 1,285 45,139 34%
W Europe (excluding UK&I)
1 4,589 35,627 2,216 95,273 1,267 9,953 566 3,096 193,575 957 5,966 353,085 22%
India 334 7,760 3,409 12,922 1,326 - 1,515 - 575 5,222 58 26 33,146 88%
Japan - 295 345 - 320 151 - - - 2,993 29 - 4,133 -87%
Latin America 40 109 16,971 200 14,846 9 204 7,227 1,194 18,709 689 321 60,519 27%
Middle East 42 80 17,427 411 6,465 12 26 - 3,615 20,211 101 2,905 51,295 383%
North America 6,937 14,625 43,100 110 152,344 1,685 47,501 8,511 13,221 103,118 5,310 104,013 500,474 15%
Oceania 683 1,899 19,405 1 1,259 67 1,553 - 484 4,162 1,901 1,566 32,981 -21%
UK&I 3,794 881 12,604 213 7,433 1,025 34,772 - 1,935 59,449 3,605 1,479 127,189 -51%
Outbound total 13,864 39,968 194,622 20,606 298,173 7,352 109,446 17,417 44,317 430,507 15,957 122,190 1,314,417 4%
% versus previous 12 months (PTM)
16% 49% -5% 78% -19% 12% 72% -11% -26% 20% 36% 6% 4%
8 Private Equity Capital Briefing
2. IPOs
Executive summary
• This month recorded the strongest year-to-date (YTD) IPO activity in terms of proceeds, witnessing a significant year on year (YOY) increase in terms of both number of IPOs and proceeds.
• EMEA accounted for 5 of the top 10 deals this month.
• The Asia-Pacific region continued to dominate global IPO activity, in terms of both number of deals and proceeds.
• Several big IPOs, such as Quadrant Energy (with expected proceeds of US$4.0b) and Officeworks (US$1.1b), are expected to hit the Australian IPO market in the coming quarters, making it a key IPO destination.
9
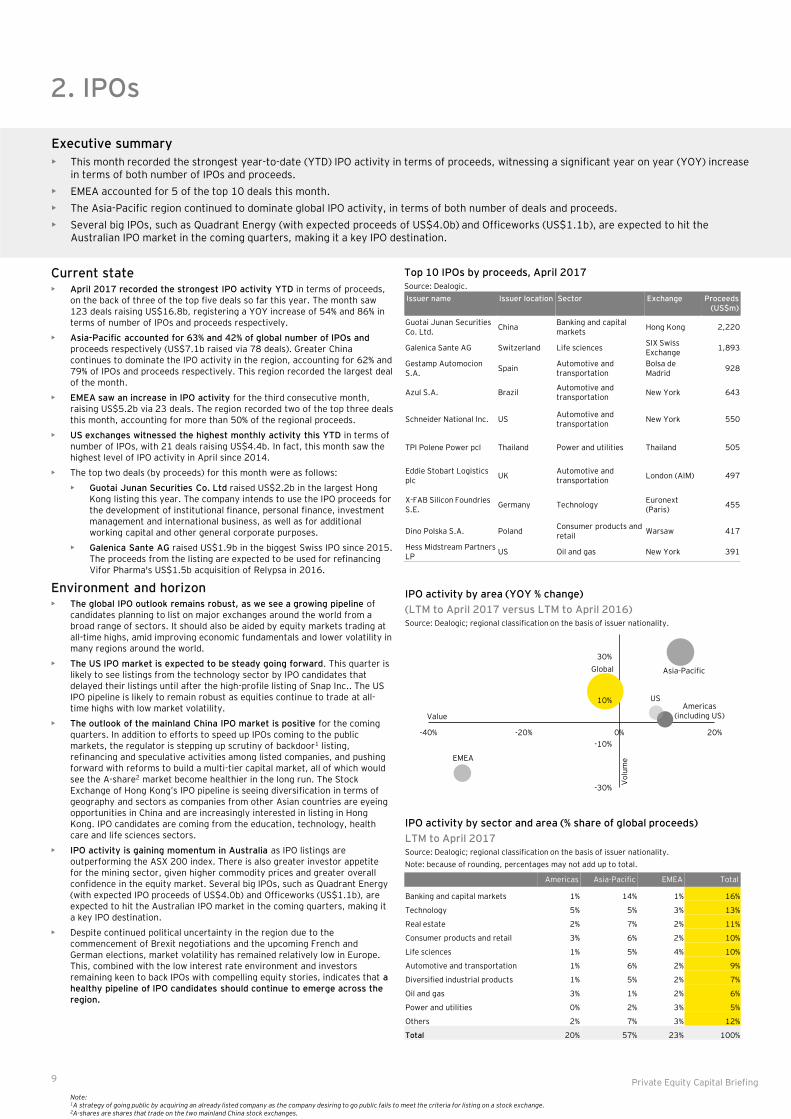
Current state• April 2017 recorded the strongest IPO activity YTD in terms of proceeds,
on the back of three of the top five deals so far this year. The month saw 123 deals raising US$16.8b, registering a YOY increase of 54% and 86% in terms of number of IPOs and proceeds respectively.
• Asia-Pacific accounted for 63% and 42% of global number of IPOs and proceeds respectively (US$7.1b raised via 78 deals). Greater China continues to dominate the IPO activity in the region, accounting for 62% and 79% of IPOs and proceeds respectively. This region recorded the largest deal of the month.
• EMEA saw an increase in IPO activity for the third consecutive month, raising US$5.2b via 23 deals. The region recorded two of the top three deals this month, accounting for more than 50% of the regional proceeds.
• US exchanges witnessed the highest monthly activity this YTD in terms of number of IPOs, with 21 deals raising US$4.4b. In fact, this month saw the highest level of IPO activity in April since 2014.
• The top two deals (by proceeds) for this month were as follows:
• Guotai Junan Securities Co. Ltd raised US$2.2b in the largest Hong Kong listing this year. The company intends to use the IPO proceeds for the development of institutional finance, personal finance, investment management and international business, as well as for additional working capital and other general corporate purposes.
• Galenica Sante AG raised US$1.9b in the biggest Swiss IPO since 2015. The proceeds from the listing are expected to be used for refinancing Vifor Pharma's US$1.5b acquisition of Relypsa in 2016.
Environment and horizon• The global IPO outlook remains robust, as we see a growing pipeline of
candidates planning to list on major exchanges around the world from a broad range of sectors. It should also be aided by equity markets trading at all-time highs, amid improving economic fundamentals and lower volatility in many regions around the world.
• The US IPO market is expected to be steady going forward. This quarter is likely to see listings from the technology sector by IPO candidates that delayed their listings until after the high-profile listing of Snap Inc.. The US IPO pipeline is likely to remain robust as equities continue to trade at all-time highs with low market volatility.
• The outlook of the mainland China IPO market is positive for the coming quarters. In addition to efforts to speed up IPOs coming to the public markets, the regulator is stepping up scrutiny of backdoor1 listing, refinancing and speculative activities among listed companies, and pushing forward with reforms to build a multi-tier capital market, all of which would see the A-share2 market become healthier in the long run. The Stock Exchange of Hong Kong’s IPO pipeline is seeing diversification in terms of geography and sectors as companies from other Asian countries are eyeing opportunities in China and are increasingly interested in listing in Hong Kong. IPO candidates are coming from the education, technology, health care and life sciences sectors.
• IPO activity is gaining momentum in Australia as IPO listings are outperforming the ASX 200 index. There is also greater investor appetite for the mining sector, given higher commodity prices and greater overall confidence in the equity market. Several big IPOs, such as Quadrant Energy (with expected IPO proceeds of US$4.0b) and Officeworks (US$1.1b), are expected to hit the Australian IPO market in the coming quarters, making it a key IPO destination.
• Despite continued political uncertainty in the region due to the commencement of Brexit negotiations and the upcoming French and German elections, market volatility has remained relatively low in Europe. This, combined with the low interest rate environment and investors remaining keen to back IPOs with compelling equity stories, indicates that a healthy pipeline of IPO candidates should continue to emerge across the region.
Top 10 IPOs by proceeds, April 2017Source: Dealogic.
Issuer name Issuer location Sector Exchange Proceeds(US$m)
Guotai Junan Securities Co. Ltd.
ChinaBanking and capital markets
Hong Kong 2,220
Galenica Sante AG Switzerland Life sciencesSIX Swiss Exchange
1,893
Gestamp AutomocionS.A.
SpainAutomotive and transportation
Bolsa de Madrid
928
Azul S.A. BrazilAutomotive and transportation
New York 643
Schneider National Inc. USAutomotive and transportation
New York 550
TPI Polene Power pcl Thailand Power and utilities Thailand 505
Eddie Stobart Logistics plc
UKAutomotive and transportation
London (AIM) 497
X-FAB Silicon Foundries S.E.
Germany TechnologyEuronext (Paris)
455
Dino Polska S.A. PolandConsumer products and retail
Warsaw 417
Hess Midstream Partners LP
US Oil and gas New York 391
IPO activity by sector and area (% share of global proceeds)
LTM to April 2017Source: Dealogic; regional classification on the basis of issuer nationality.
Note: because of rounding, percentages may not add up to total.
Americas Asia-Pacific EMEA Total
Banking and capital markets 1% 14% 1% 16%
Technology 5% 5% 3% 13%
Real estate 2% 7% 2% 11%
Consumer products and retail 3% 6% 2% 10%
Life sciences 1% 5% 4% 10%
Automotive and transportation 1% 6% 2% 9%
Diversified industrial products 1% 5% 2% 7%
Oil and gas 3% 1% 2% 6%
Power and utilities 0% 2% 3% 5%
Others 2% 7% 3% 12%
Total 20% 57% 23% 100%
IPO activity by area (YOY % change)
(LTM to April 2017 versus LTM to April 2016)Source: Dealogic; regional classification on the basis of issuer nationality.
-30%
-10%
10%
30%
-40% -20% 0% 20%
Value
Vo
lum
e
Americas(including US)
EMEA
Global Asia-Pacific
US
Note:1A strategy of going public by acquiring an already listed company as the company desiring to go public fails to meet the criteria for listing on a stock exchange.2A-shares are shares that trade on the two mainland China stock exchanges.
Private Equity Capital Briefing

4. Loans
Executive summary
Global investment-grade loans (US$b)Source: Thomson ONE.
Global high-yield loans (US$b)Source: Thomson ONE.
Top arrangers ranking, YTD April 2017 (US$b)Source: Thomson ONE.
Global loan issuance by industry, March 2017Source: Thomson ONE.
Proceeds Issues
Bank of America Merrill Lynch 85.0 439
JP Morgan 74.2 385
Citi 58.3 267
Mitsubishi UFJ Financial Group 51.8 523
Barclays 51.0 224
All loans by region, YTD April 2017 (US$b)Source: Thomson ONE.
Market share Proceeds Issues
Americas 60.9% 690.0 1,193
EMEA 22.2% 251.3 313
Asia-Pacific 16.9% 190.7 1,111
0
200
400
600
0
200
400
600
800
1Q15 2Q15 3Q15 4Q15 1Q16 2Q16 3Q16 4Q16 1Q17 QTDApr*
Proceeds (LHS) Number of issues (RHS)
0
1,000
2,000
3,000
0
300
600
900
1,200
1Q15 2Q15 3Q15 4Q15 1Q16 2Q16 3Q16 4Q16 1Q17 QTDApr*
Proceeds (LHS) Number of issues (RHS)
10
• Loan volume in April fell in both Europe and the US due to political and exogenous risks along with demand supply imbalance.
• The impact of low oil prices in the Middle Eastern loan market is expected to continue to hamper economic growth across the region.
• Nonexistent M&A in 1Q17 showed signs of recovery in April as many US companies lined up loans.
• The leveraged loan repricing wave that hit record heights in January is beginning to show signs of waning.
• Capacity remains for issuers last in the market six months or so ago, to shave more than 1% from the cost of their financing.
• Lenders are expected to remain optimistic on volume picking up in the coming quarters.
0 50 100 150 200
Financials
Consumer staples
High technology
Health care
Consumer products and services
Real estate
Government and agenciesProceeds (US$b)
Current state• In April, US$57b of loans were issued in the US and €6b in Europe, taking
the YTD global issuance to US$311b, up 121% from the same period in 2016.
• The European volume of loan recaps and refinancings fell in April compared with March, but the flow of repricings continued as issuers returned to cut yields. Repricing activity in Europe in April (€6.9b) was more than double the 2016 monthly average of €2.4b, making it the sixth-busiest month for repricings since 2013.
• Historically April is low on loan activity in the US, explaining the 50% decline month on month from March. Political and exogenous risks also drove the market downward to US$63b compared with US$127b last month. With demand continuing to exceed supply, the imbalance is leading to thinning of spreads and an increase in leverage.
• The Middle Eastern loan market has been slow due to a lack of refinancing opportunities and low oil prices, which is still hampering economic growth across the region and curbing corporate and financial institutions' demand for new money loans.
• Nonexistent loans financing M&A in 1Q17 showed signs of recovery in April as many US companies lined up loans in order to fund mergers in sectors such as health care, food and retail. As large-scale M&A has been on hold since the US presidential election, deals such as Becton Dickinson and Bard can trigger another wave of deals and bridge financings.
• In the YTD, 40% of loan issuance in the US and 30% in Europe was M&A driven, up by 35% in the US and down by 8% in Europe compared with the same period last year.
• The leveraged loan repricing wave that hit record heights in January is beginning to show signs of waning; the average clearing yield for single-B rated term loans widened in the US to 5.21% from 5.09% in March, and was unchanged at 4.07% in Europe.
Environment and horizon• Repricing volumes have begun to fall in both the US and the Europe. This
can be attributed to the massive volume over recent months leaving fewer issuers to reprice, leading to investor fatigue setting in.
• A long-standing dearth of supply in the loan market has led to a dramatic fall in pricing since the start of the year but, in recent weeks, investors have begun to resist those weakened terms. However, investors who are weary of successive rounds of repricings are welcoming large liquid deals.
Opportunities• Although some of the heat has come off the market there is still capacity
for issuers, that were last in the market six months or so ago, to shave more than 1% from the cost of their financing.
• Lenders are expected to remain optimistic that volume will pick up in the coming quarters. But, following a slower than expected start to the year, expectations have been rolled back until US President Donald Trump is able to push through his pro-business measures.
*Data until 30 April 2017.
*Data until 30 April 2017.
Private Equity Capital Briefing

Current state• Global high-yield activity fell on a monthly basis after an overwhelming
1Q17. High-yield issuance was US$15.1b in the US and €7.9b in Europe, taking the YTD total global issuance to US$133b, up 62% compared with the same period last year.
• The European high-yield bond market was dominated with refinancingsand recaps, with only €330 million used for M&A. Overall, the YTD volume went up to €32.1 billion, up 167% from the first four months of 2016. April’s European bond collections were at their third highest in many years, down only on last month and September 2016.
• The first round of the French presidential election and constructive market conditions led to a strong supply of European loans in April, as bankers were pushing to get deals completed before the election. Although usually a busy period, Easter was even more special this year, with 10 issuers and 13 bonds in the market in a two-week period, making it second only to 2010.
• In the US, the monthly high-yield issuance volume was the lowest April volume since 2009. Refinancing continued to be the primary reason for issuance, but the contribution decreased from 80% in March to 66% in April.
• The refinancing wave also means overpowering seasoned credits when compared with debut issuers. Although the number of debut issuers increased on a monthly basis due to the low number in February and March, the YTD volume is still behind the number of deals completed in the same period last year.
• Cash-strapped sovereigns such as Qatar and Oman have also turned to the bond market after tapping the loan market for billions of dollars last year, reducing the demand for loans in the region.
• High-yield issuance for M&A activity to April was US$21b, contributing 21% to the total in the US. In Europe, there was €3.2b of high-yield issuance, a 10% contribution.
• Clearing yields for single-B rated bonds widened in the US to 6.57% in the three months to the end of April from 6.49% at the end of March, and yields tightened to 5.20% from 5.64% in Europe, the lowest yield since the first quarter of 2010.
Environment and horizon• With refinancing deals contributing the maximum in volume, refinancing of
bonds with bonds is also rising, which was not the case in other months this year.
• In Asian markets, supply and demand are nicely balanced, with investors looking out for assets, and issuers wanting to lock in long-term funding and sell riskier products while appetite is high and rates are low. Most market participants expect a fairly benign 2017, which will drive Asian new issues to new heights.
Opportunities• Bankers expect issuance levels to remain strong into mid-May, when the
blackout period occurs.
• Refinancings are likely to continue to dominate, as conditions are strong enough to keep supporting tighter margins.
0 50 100
Energy and power
Industrials
High technology
Telecommunications
Real estate
Consumer staples
Consumer products and services
Materials
Health care
Retail
Media and entertainment
Proceeds (US$b)
Executive summary
Euro bond issuancesSource: Thomson ONE.
US bond issuancesSource: Thomson ONE.
Top 10 corporate bond issuers, YTD April 2017 (US$b)Source: Thomson ONE.
Global bond issuance by industry, YTD 2017Source: Thomson ONE.
Issuer Nation Industry Proceeds
Microsoft Corp US High technology 17.0
Broadcom Corp US High technology 13.6
Verizon Communications Inc
US Telecommunications 11.0
Apple Inc US High technology 11.0
AT&T Inc US Telecommunications 10.5
China Railway Corp China Industrials 8.7
Deutsche Telekom International
Netherlands Telecommunications 7.6
Siemens NV Netherlands High technology 7.5
Telefonica Emisiones S.A.U Spain Telecommunications 6.2
State Power Investment Corp
China Energy and power 5.7
0
50
100
150
200
0
50
100
150
200
250
Jan16
Feb16
Mar16
Apr16
May16
Jun16
Jul16
Aug16
Sep16
Oct16
Nov16
Dec16
Jan17
Feb17
Mar17
Apr17
Proceeds (US$b) (LHS) Number of issues (RHS)
11
0
100
200
300
400
500
0
100
200
300
400
Jan16
Feb16
Mar16
Apr16
May16
Jun16
Jul16
Aug16
Sep16
Oct16
Nov16
Dec16
Jan17
Feb17
Mar17
Apr17
Proceeds (US$b) (LHS) Number of issues (RHS)
5. Bonds
• Global high-yield activity fell on a monthly basis in April, with both the US and Europe experiencing volume decline.
• The first round of the French presidential election and constructive market conditions led to a strong supply of European loans in April.
• Refinancing wave implied overpowering seasoned credits when compared to debut issuers, reducing the new issuance volume.
• The trend of refinancing of bonds with bonds is also rising, which was not the case in other months this year.
• Bankers expect issuance levels to remain strong into mid-May, until the blackout period.
Private Equity Capital Briefing

Appendices

Dry powder — buyout funds — by region (in US$b)
Global PE fundraising (in US$b)
Appendix AGlobal PE fundraising activity
Source: Preqin
0
200
400
600
800
1,000
1,200
$0
$100
$200
$300
$400
$500
$600
$700
2003 2004 2005 2006 2007 2008 2009 2010 2011 2012 2013 2014 2015 2016 YTD2017
Commitments (US$b) Number of funds
0%
2%
4%
6%
8%
10%
12%
14%
16%
$0
$100
$200
$300
$400
$500
$600
2003 2004 2005 2006 2007 2008 2009 2010 2011 2012 2013 2014 2015 2016 YTD2017
North America Europe
Asia-Pacific and rest of world Asia-Pacific and rest of world as percentage of total
Private Equity Capital Briefing13
Source: Preqin
Source: Dealogic
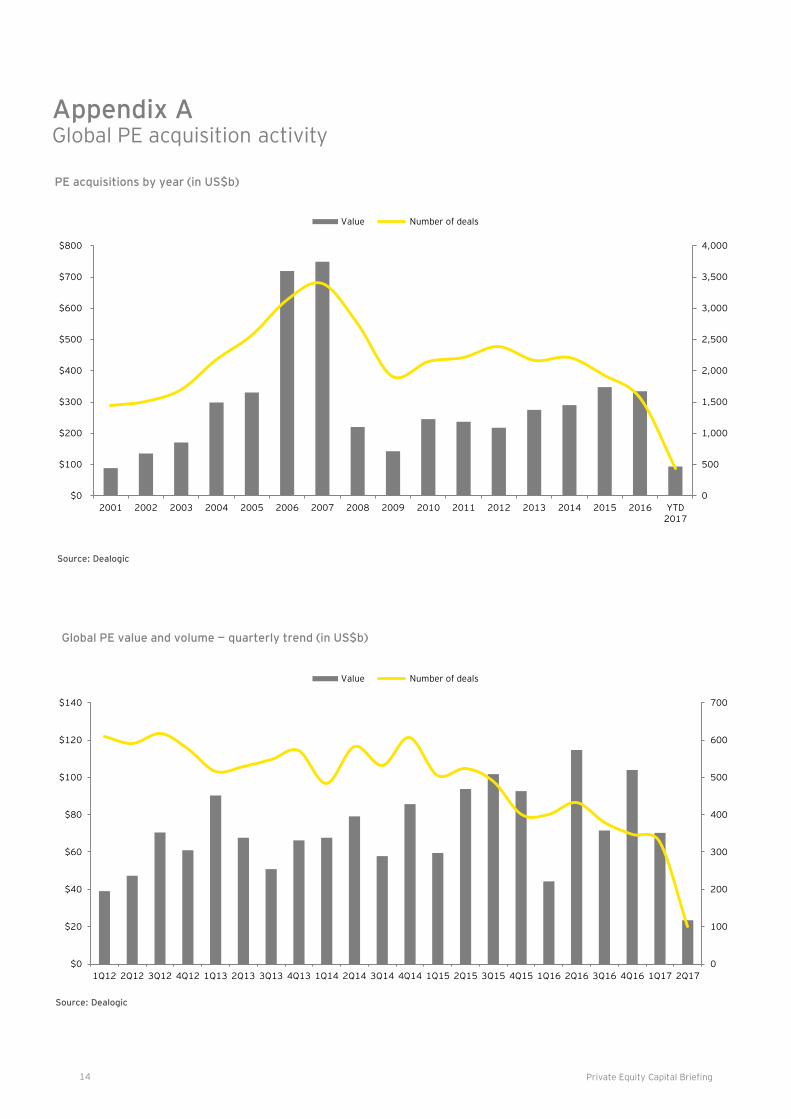
Global PE value and volume — quarterly trend (in US$b)
PE acquisitions by year (in US$b)
Appendix AGlobal PE acquisition activity
Source: Dealogic
0
100
200
300
400
500
600
700
$0
$20
$40
$60
$80
$100
$120
$140
1Q12 2Q12 3Q12 4Q12 1Q13 2Q13 3Q13 4Q13 1Q14 2Q14 3Q14 4Q14 1Q15 2Q15 3Q15 4Q15 1Q16 2Q16 3Q16 4Q16 1Q17 2Q17
Value Number of deals
Private Equity Capital Briefing14
0
500
1,000
1,500
2,000
2,500
3,000
3,500
4,000
$0
$100
$200
$300
$400
$500
$600
$700
$800
2001 2002 2003 2004 2005 2006 2007 2008 2009 2010 2011 2012 2013 2014 2015 2016 YTD2017
Value Number of deals

15
Americas PE acquisitions — the top deals with disclosed financial terms in 2017
Appendix AGlobal PE acquisition activity by region — Americas
Americas PE acquisitions (in US$b)
0
50
100
150
200
250
300
350
$0
$10
$20
$30
$40
$50
$60
$70
$80
1Q12 2Q12 3Q12 4Q12 1Q13 2Q13 3Q13 4Q13 1Q14 2Q14 3Q14 4Q14 1Q15 2Q15 3Q15 4Q15 1Q16 2Q16 3Q16 4Q16 1Q17 2Q17
Value Number of deals
Private Equity Capital Briefing
Source: Dealogic
Announcementdate
Completiondate
Company Sector Value (US$b) Acquiror
10-Feb-17 Aon Hewitt LLC (HR BPO Platform) Technology $4.8 Blackstone Group LP
13-Mar-17 DH Corp. Technology $3.4 Vista Equity Partners LLC
27-Mar-17 Diversey Inc. Consumer products $3.2 Bain Capital LLC
14-Mar-17 21-Apr-17 Air Methods Corp. Transportation $2.5 American Securities LLC
17-Mar-17 USI Insurance Services LLC Insurance $2.5 KKR & Co. LP
12-Jan-17 1-Mar-17 Eagleford shale assets Oil and gas $2.1 Blackstone Group LP
17-Apr-17 EagleClaw Midstream Services LLC Utilities $2.0 Blackstone Group LP
14-Apr-17 14-Apr-17 Ascend Learning LLC Technology $2.0 Blackstone Group LP
17-Jan-17 Leslie's Poolmart Inc. Consumer products $1.8 Catterton Management Co. LLC
20-Feb-17 20-Feb-17 US property portfolio Real estate $1.7 Blackstone Group LP
Source: Dealogic

Appendix AGlobal PE acquisition activity by region — EMEA
EMEA PE acquisitions (in US$b)
Source: Dealogic
16
Private Equity Capital Briefing
Announcement date
Completion date
Company Sector Value (US$b) Acquiror
23-Feb-17 Stada Arzneimittel AG Health care $5.0 Cinven Ltd.; Advent International Corp.
12-Apr-17 Refresco Group NV Food and beverage $2.2 PAI Partners SAS
22-Jan-17 Cerba HealthCare SASU Health care $1.9 Partners Group Holding AG
7-Mar-17 Allfunds Bank SA Finance $1.9 Hellman & Friedman LLC
20-Apr-17 20-Apr-17
Mubadala Development Co. (Private equity portfolio worth US$2.5b) Finance $1.8 Ardian SA
20-Mar-17Property Portfolio (German and Dutch property portfolio) Real estate $1.4 Blackstone Group LP
31-Mar-17 31-Mar-17Bradford & Bingley plc (Mortgage loans portfolio) Finance $1.2 Blackstone Group LP
30-Mar-17 30-Mar-17 Corialis International SA/NV Metal and steel $1.1 CVC Capital Partners Ltd.
31-Mar-17 Novo Banco SA Finance $1.1 Lone Star Global Acquisitions Ltd.
31-Mar-17Compania Logistica de Hidrocarburos SA CLH Oil and gas $1.1 CVC Capital Partners Ltd.
0
50
100
150
200
250
300
$0
$5
$10
$15
$20
$25
$30
$35
$40
$45
$50
1Q12 2Q12 3Q12 4Q12 1Q13 2Q13 3Q13 4Q13 1Q14 2Q14 3Q14 4Q14 1Q15 2Q15 3Q15 4Q15 1Q16 2Q16 3Q16 4Q16 1Q17 2Q17
Value Number of deals
Source: Dealogic
EMEA PE acquisitions — the top deals with disclosed financial terms in 2017

Appendix AGlobal PE acquisition activity by region — Asia-Pacific
Asia-Pacific PE acquisitions (in US$b)
Source: Dealogic
0
20
40
60
80
100
120
140
$0
$5
$10
$15
$20
$25
$30
1Q12 2Q12 3Q12 4Q12 1Q13 2Q13 3Q13 4Q13 1Q14 2Q14 3Q14 4Q14 1Q15 2Q15 3Q15 4Q15 1Q16 2Q16 3Q16 4Q16 1Q17 2Q17
Value Number of deals
17 Private Equity Capital Briefing
Announcement date
Completion date
Company Sector Value (US$) Acquiror
28-Apr-17Belle International Holdings Ltd. Consumer products $5.8
CDH China Holdings Management Co. Ltd.
8-Jan-17McDonald's China Management Ltd. Dining & lodging $2.1
Carlyle Group LP;CITIC Capital Partners Ltd.
24-Feb-17 24-Mar-17Daesung Industrial Gases Co. Ltd. Chemicals $1.6 MBK Partners Ltd.
26-Apr-17 Hitachi Kokusai Electric Inc. Telecommunications $1.5 KKR & Co. LP
13-Jan-17 22-Mar-17 Hitachi Koki Co. Ltd. Consumer products $1.2 KKR & Co. LP
25-Apr-17 Nord Anglia Education Inc. Professional services $1.2Canada Pension Plan Investment Board-CPPIB
28-Mar-17 28-Mar-17 Bharti Infratel Ltd. Telecommunications $0.9Canada Pension Plan Investment Board-CPPIB
1-Feb-17 Hyundai Card Co Ltd. Finance $0.6
Affinity Equity Partners (HK) Ltd.Carlyle Group LP
6-Apr-17 Zhaopin Ltd. Technology $0.4 FountainVest Partners
24-Mar-17 TASAKI & Co. Ltd. Retail $0.4 MBK Partners Ltd.
Source: Dealogic
Asia-Pac PE acquisitions — the top deals with disclosed financial terms in 2017

Source: Dealogic
Global PE-backed IPOs — value and volume — quarterly trend (in US$b)
Appendix AGlobal PE exit activity
Global PE-backed exits by M&A — value and volume — quarterly trend (in US$b)
0
50
100
150
200
250
300
350
$0
$20
$40
$60
$80
$100
$120
$140
1Q12 2Q12 3Q12 4Q12 1Q13 2Q13 3Q13 4Q13 1Q14 2Q14 3Q14 4Q14 1Q15 2Q15 3Q15 4Q15 1Q16 2Q16 3Q16 4Q16 1Q17 2Q17
Value Number of deals
0
10
20
30
40
50
60
70
80
90
$0
$5
$10
$15
$20
$25
$30
$35
$40
$45
1Q12 2Q12 3Q12 4Q12 1Q13 2Q13 3Q13 4Q13 1Q14 2Q14 3Q14 4Q14 1Q15 2Q15 3Q15 4Q15 1Q16 2Q16 3Q16 4Q16 1Q17 2Q17
Value Number of deals
18 Private Equity Capital Briefing
Source: Dealogic

Source: Dealogic
Appendix AGlobal PE exit activity — Americas
Americas PE exits — top exits 2017
Americas PE exits (in US$b)
Announcementor filing date
Completion or priced
date
Company Sector Value (US$b) Sponsor Type
6-Jan-17 31-Jan-17 Invitation Homes Inc. Real estate $6.3 Blackstone Group LP IPO
25-Apr-17AdvancePierre Foods Holdings Inc. Food and beverage $4.3 Oaktree Capital Group LLC M&A
9-Jan-17 24-Mar-17Surgical Care Affiliates Inc. Health care $3.5 TPG Capital LP M&A
19-Dec-16 26-Jan-17 Jagged Peak Energy Inc. Oil and gas $3.2 Quantum Energy Partners IPO
13-Feb-17 28-Apr-17 ZELTIQ Aesthetics Inc. Health care $2.5 Frazier Healthcare Partners M&A
17-Mar-17USI Insurance Services LLC Insurance $2.5 Onex Corp. M&A
1-Jun-16 26-Jan-17 JELD-WEN Holding Inc. Construction/building $2.4 Onex Corp. IPO
2-Oct-15 31-Jan-17 Laureate Education Inc. Professional services $2.4
Sterling Partners Inc.;Citigroup Private Equity;KKR & Co. LP;Snow Phipps Group LLC IPO
24-Jan-17Multi Packaging Solutions International Ltd. Forestry and paper $2.3
Carlyle Group LP;Madison Dearborn Partners LLC M&A
6-Feb-17 10-Apr-17 Azul SA Transportation $2.2
Weston Presidio Capital;Peterson Partners LP;TPG Capital LP IPO
0
20
40
60
80
100
120
140
160
$0
$10
$20
$30
$40
$50
$60
$70
$80
$90
1Q12 2Q12 3Q12 4Q12 1Q13 2Q13 3Q13 4Q13 1Q14 2Q14 3Q14 4Q14 1Q15 2Q15 3Q15 4Q15 1Q16 2Q16 3Q16 4Q16 1Q17 2Q17
M&A value IPO value M&A volume IPO volume
19
Source: Dealogic
Private Equity Capital Briefing
Source: Dealogic
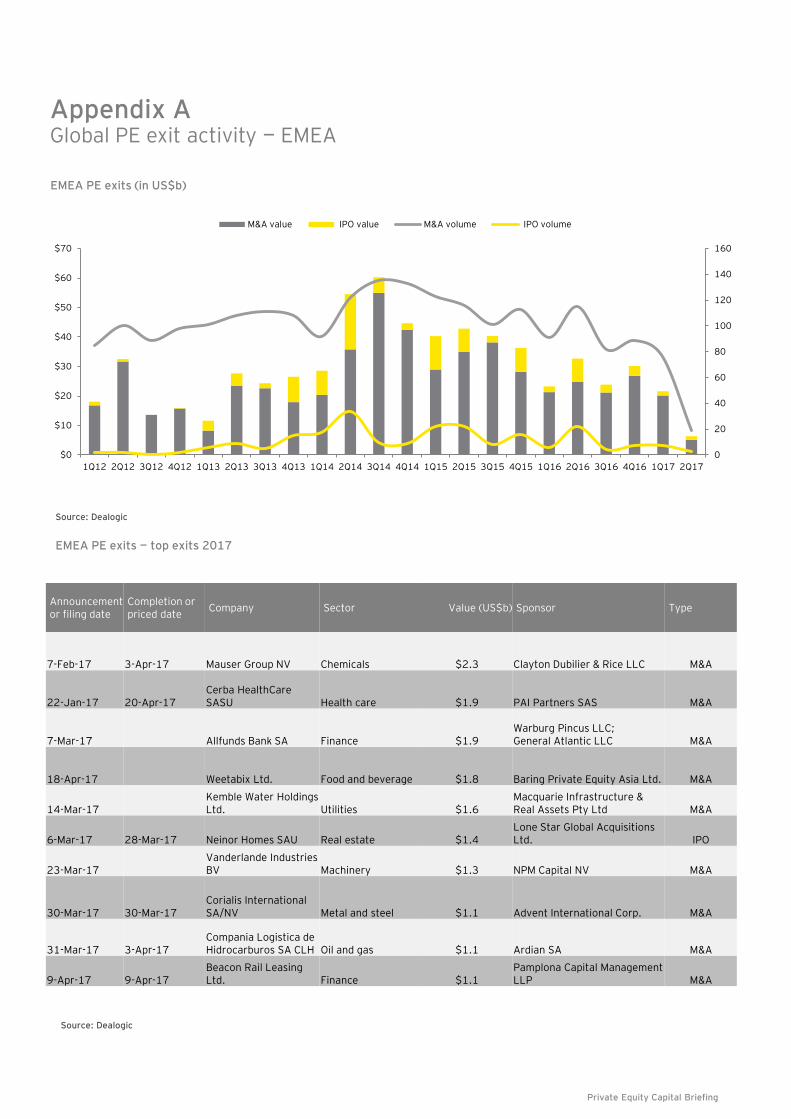
Appendix AGlobal PE exit activity — EMEA
EMEA PE exits — top exits 2017
EMEA PE exits (in US$b)
Announcementor filing date
Completion orpriced date
Company Sector Value (US$b) Sponsor Type
7-Feb-17 3-Apr-17 Mauser Group NV Chemicals $2.3 Clayton Dubilier & Rice LLC M&A
22-Jan-17 20-Apr-17Cerba HealthCare SASU Health care $1.9 PAI Partners SAS M&A
7-Mar-17 Allfunds Bank SA Finance $1.9Warburg Pincus LLC;General Atlantic LLC M&A
18-Apr-17 Weetabix Ltd. Food and beverage $1.8 Baring Private Equity Asia Ltd. M&A
14-Mar-17Kemble Water Holdings Ltd. Utilities $1.6
Macquarie Infrastructure & Real Assets Pty Ltd M&A
6-Mar-17 28-Mar-17 Neinor Homes SAU Real estate $1.4Lone Star Global Acquisitions Ltd. IPO
23-Mar-17Vanderlande Industries BV Machinery $1.3 NPM Capital NV M&A
30-Mar-17 30-Mar-17Corialis International SA/NV Metal and steel $1.1 Advent International Corp. M&A
31-Mar-17 3-Apr-17Compania Logistica de Hidrocarburos SA CLH Oil and gas $1.1 Ardian SA M&A
9-Apr-17 9-Apr-17Beacon Rail Leasing Ltd. Finance $1.1
Pamplona Capital Management LLP M&A
0
20
40
60
80
100
120
140
160
$0
$10
$20
$30
$40
$50
$60
$70
1Q12 2Q12 3Q12 4Q12 1Q13 2Q13 3Q13 4Q13 1Q14 2Q14 3Q14 4Q14 1Q15 2Q15 3Q15 4Q15 1Q16 2Q16 3Q16 4Q16 1Q17 2Q17
M&A value IPO value M&A volume IPO volume
20
Source: Dealogic
Private Equity Capital Briefing

Capital Briefing21
Source: Dealogic
Appendix AGlobal PE exit activity — Asia-Pacific
Asia-Pacific PE exits — top exits 2017
Asia-Pacific PE exits (in US$b)
0
5
10
15
20
25
30
35
40
45
$0
$5
$10
$15
$20
$25
$30
$35
$40
$45
1Q12 2Q12 3Q12 4Q12 1Q13 2Q13 3Q13 4Q13 1Q14 2Q14 3Q14 4Q14 1Q15 2Q15 3Q15 4Q15 1Q16 2Q16 3Q16 4Q16 1Q17 2Q17
M&A value IPO value M&A volume IPO volume
Source: Dealogic
Private Equity Capital Briefing
Announcementor filing date
Completion orpriced date
Company Sector Value (US$b) Sponsor Type
16-Mar-17 Alinta Holdings Utilities $3.1 TPG Capital LP M&A
23-Mar-17 24-Apr-17ING Life Insurance Korea Ltd. Insurance $2.4 MBK Partners Ltd. IPO
28-Feb-17 USJ Co. Ltd.Leisure and recreation $2.3
Goldman Sachs Capital Partners;MBK Partners Ltd. M&A
24-Feb-17 24-Mar-17Daesung Industrial Gases Co. Ltd. Chemicals $1.6
Goldman Sachs Capital Partners M&A
5-Jan-17 22-Mar-17China Modern Dairy Holdings Ltd. Agribusiness $1.5
CDH China Holdings Management Co. Ltd.;KKR & Co. LP M&A
22-Feb-17 21-Mar-17Sushiro Global Holdings Ltd. Dining and lodging $0.9 Permira Ltd. IPO
8-Feb-17 13-Mar-17 Macromill Inc.Professional services $0.7 Bain Capital LLC IPO
6-Apr-17 6-Apr-17Zhejiang UniviewTechnologies Co. Ltd.
Computers and electronics $0.5 Bain Capital LLC M&A
27-Feb-17Crystal Orange Hotel Holdings Ltd. Dining and lodging $0.5 Carlyle Group LP M&A
6-Feb-17 6-Feb-17 Yongle Tape Co., Ltd Chemicals $0.2 Shaw Kwei & Partners Ltd. M&A
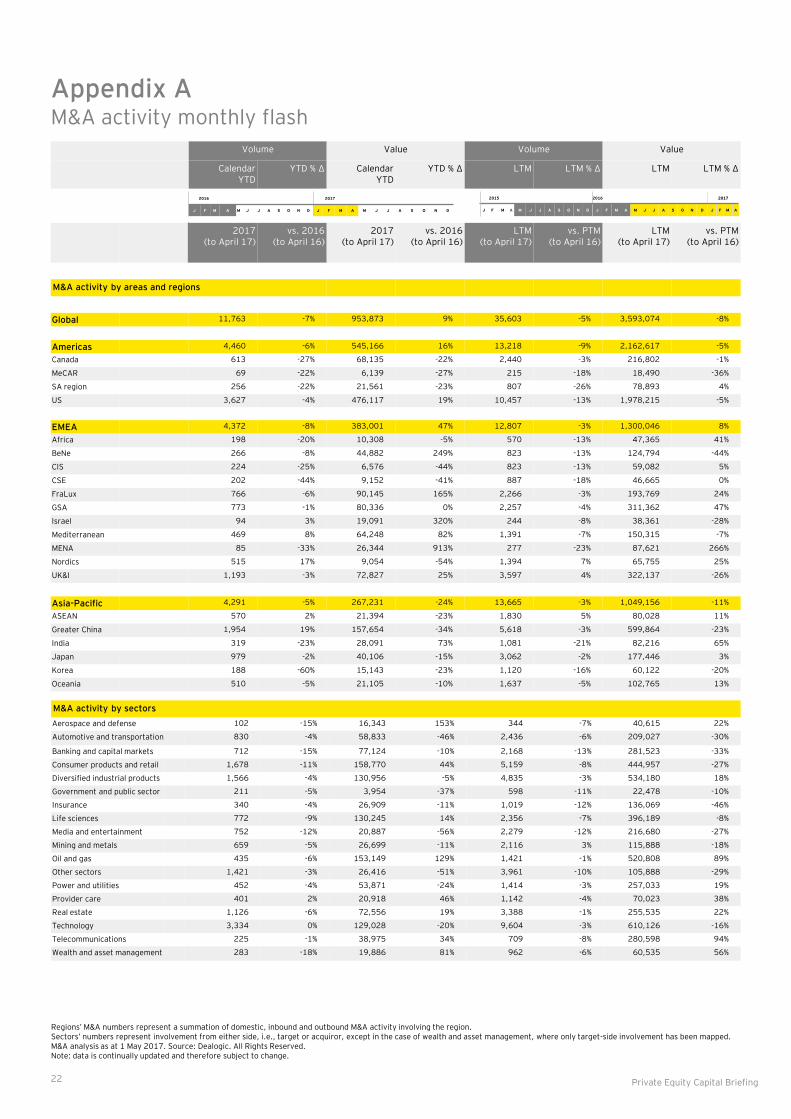
Appendix AM&A activity monthly flash
Volume Value Volume Value
Calendar YTD
YTD % ∆ Calendar YTD
YTD % ∆ LTM LTM % ∆ LTM LTM % ∆
2017(to April 17)
vs. 2016(to April 16)
2017(to April 17)
vs. 2016(to April 16)
LTM(to April 17)
vs. PTM(to April 16)
LTM (to April 17)
vs. PTM(to April 16)
M&A activity by areas and regions
Global 11,763 -7% 953,873 9% 35,603 -5% 3,593,074 -8%
Americas 4,460 -6% 545,166 16% 13,218 -9% 2,162,617 -5%
Canada 613 -27% 68,135 -22% 2,440 -3% 216,802 -1%
MeCAR 69 -22% 6,139 -27% 215 -18% 18,490 -36%
SA region 256 -22% 21,561 -23% 807 -26% 78,893 4%
US 3,627 -4% 476,117 19% 10,457 -13% 1,978,215 -5%
EMEA 4,372 -8% 383,001 47% 12,807 -3% 1,300,046 8%
Africa 198 -20% 10,308 -5% 570 -13% 47,365 41%
BeNe 266 -8% 44,882 249% 823 -13% 124,794 -44%
CIS 224 -25% 6,576 -44% 823 -13% 59,082 5%
CSE 202 -44% 9,152 -41% 887 -18% 46,665 0%
FraLux 766 -6% 90,145 165% 2,266 -3% 193,769 24%
GSA 773 -1% 80,336 0% 2,257 -4% 311,362 47%
Israel 94 3% 19,091 320% 244 -8% 38,361 -28%
Mediterranean 469 8% 64,248 82% 1,391 -7% 150,315 -7%
MENA 85 -33% 26,344 913% 277 -23% 87,621 266%
Nordics 515 17% 9,054 -54% 1,394 7% 65,755 25%
UK&I 1,193 -3% 72,827 25% 3,597 4% 322,137 -26%
Asia-Pacific 4,291 -5% 267,231 -24% 13,665 -3% 1,049,156 -11%
ASEAN 570 2% 21,394 -23% 1,830 5% 80,028 11%
Greater China 1,954 19% 157,654 -34% 5,618 -3% 599,864 -23%
India 319 -23% 28,091 73% 1,081 -21% 82,216 65%
Japan 979 -2% 40,106 -15% 3,062 -2% 177,446 3%
Korea 188 -60% 15,143 -23% 1,120 -16% 60,122 -20%
Oceania 510 -5% 21,105 -10% 1,637 -5% 102,765 13%
M&A activity by sectors
Aerospace and defense 102 -15% 16,343 153% 344 -7% 40,615 22%
Automotive and transportation 830 -4% 58,833 -46% 2,436 -6% 209,027 -30%
Banking and capital markets 712 -15% 77,124 -10% 2,168 -13% 281,523 -33%
Consumer products and retail 1,678 -11% 158,770 44% 5,159 -8% 444,957 -27%
Diversified industrial products 1,566 -4% 130,956 -5% 4,835 -3% 534,180 18%
Government and public sector 211 -5% 3,954 -37% 598 -11% 22,478 -10%
Insurance 340 -4% 26,909 -11% 1,019 -12% 136,069 -46%
Life sciences 772 -9% 130,245 14% 2,356 -7% 396,189 -8%
Media and entertainment 752 -12% 20,887 -56% 2,279 -12% 216,680 -27%
Mining and metals 659 -5% 26,699 -11% 2,116 3% 115,888 -18%
Oil and gas 435 -6% 153,149 129% 1,421 -1% 520,808 89%
Other sectors 1,421 -3% 26,416 -51% 3,961 -10% 105,888 -29%
Power and utilities 452 -4% 53,871 -24% 1,414 -3% 257,033 19%
Provider care 401 2% 20,918 46% 1,142 -4% 70,023 38%
Real estate 1,126 -6% 72,556 19% 3,388 -1% 255,535 22%
Technology 3,334 0% 129,028 -20% 9,604 -3% 610,126 -16%
Telecommunications 225 -1% 38,975 34% 709 -8% 280,598 94%
Wealth and asset management 283 -18% 19,886 81% 962 -6% 60,535 56%
22
Regions’ M&A numbers represent a summation of domestic, inbound and outbound M&A activity involving the region. Sectors’ numbers represent involvement from either side, i.e., target or acquiror, except in the case of wealth and asset management, where only target-side involvement has been mapped.M&A analysis as at 1 May 2017. Source: Dealogic. All Rights Reserved. Note: data is continually updated and therefore subject to change.
2016 2017
J F M A M J J A S O N D J F M A M J J A S O N D
2015 2016 2017
J F M A M J J A S O N D J F M A M J J A S O N D J F M A
Private Equity Capital Briefing

Appendix BM&A multiples and bid premium
Deal multiples greater than 30x and bid premium greater than 100% have been excluded from calculation of median.M&A analysis as at 1 May 2017. Source: Dealogic. All Rights Reserved. Note: data is continually updated and therefore subject to change.
23
Median deal multiple — EV / EBITDA
Global Americas Asia-Pacific EMEA
LTM(to Apr 17)
PTM(to Apr 16)
LTM(to Apr 17)
PTM(to Apr 16)
LTM(to Apr 17)
PTM(to Apr 16)
LTM(to Apr 17)
PTM(to Apr 16)
Aerospace and defense 13.6x 11.3x 10.3x 9.1x 11.2x 14.1x 15.5x 11.6x
Automotive and transportation 9.5x 9.2x 8.5x 11.5x 9.8x 9.9x 10.4x 8.4x
Consumer products and retail 10.5x 11.0x 11.1x 10.7x 11.9x 11.9x 9.6x 10.4x
Diversified industrial products 9.7x 9.9x 10.8x 10.8x 10.7x 10.5x 8.1x 9.3x
Financial services 10.5x 10.3x 13.0x 12.3x 8.8x 7.9x 8.7x 9.6x
Government and public sector 8.2x 11.1x 8.2x 6.6x 10.5x 11.2x 7.2x 11.4x
Healthcare 10.0x 11.8xx 11.6x 10.3x 15.7x 17.5x 8.3x 11.0x
Life sciences 11.9x 11.2x 8.2x 9.5x 12.2x 8.3x 12.2x 12.3x
Media and entertainment 13.5x 11.8x 11.4x 12.7x 19.6x 11.0x 12.0x 10.8x
Mining and metals 9.9x 12.3x 9.9x 9.7x 10.4x 15.6x 9.0x 11.5x
Oil and gas 8.5x 8.5x 9.8x 7.7x 8.0x 10.9x 8.7x 9.0x
Other sectors 8.9x 8.2x 10.7x 7.8x 14.2x 9.0x 5.6x 11.2x
Power and utilities 9.3x 9.5x 11.9x 10.5x 9.0x 10.7x 8.7x 7.9x
Real estate 11.0x 10.1x 12.4x 10.4x 12.8x 10.3x 10.0x 10.0x
Technology 10.9x 11.3x 11.8x 13.2x 11.7x 11.6x 10.0x 10.2x
Telecommunications 8.2x 7.4x 10.1x 6.9x 7.9x 9.9x 7.9x 7.4x
Total 10.2x 10.4x 11.2x 10.5x 10.7x 11.0x 9.1x 9.8x
Median bid premium to four-week stock price
Global Americas Asia-Pacific EMEA
LTM(to Apr 17)
PTM(to Apr 16)
LTM(to Apr 17)
PTM(to Apr 16)
LTM(to Apr 17)
PTM(to Apr 16)
LTM(to Apr 17)
PTM(to Apr 16)
Aerospace and defense 35% 22% 50% 14% 30% 31% 29% -
Automotive and transportation 19% 16% 27% 25% 18% 11% 8% 9%
Consumer products and retail 17% 23% 27% 32% 14% 17% 15% 26%
Diversified industrial products 23% 19% 30% 29% 23% 17% 19% 24%
Financial services 19% 26% 24% 30% 15% 10% 15% 13%
Government and public sector 27% 22% 31% 44% 16% 18% 23% 16%
Healthcare 16% 18% 18% 28% 5% 10% 19% 17%
Life sciences 25% 22% 25% 34% 29% 16% 16% 2%
Media and entertainment 27% 25% 42% 38% 14% 19% 12% 14%
Mining and metals 22% 16% 27% 24% 17% 12% 25% 14%
Oil and gas 23% 25% 31% 28% 21% 19% 12% 30%
Other sectors 17% 25% 16% 27% 21% 24% 19% 20%
Power and utilities 21% 21% 30% 30% 13% 21% 36% 14%
Real estate 25% 14% 27% 13% 24% 15% 19% 8%
Technology 24% 23% 34% 31% 18% 16% 18% 22%
Telecommunications 12% 22% 43% 26% 10% 27% 10% 15%
Total 22% 21% 29% 30% 18% 17% 17% 17%
Private Equity Capital Briefing
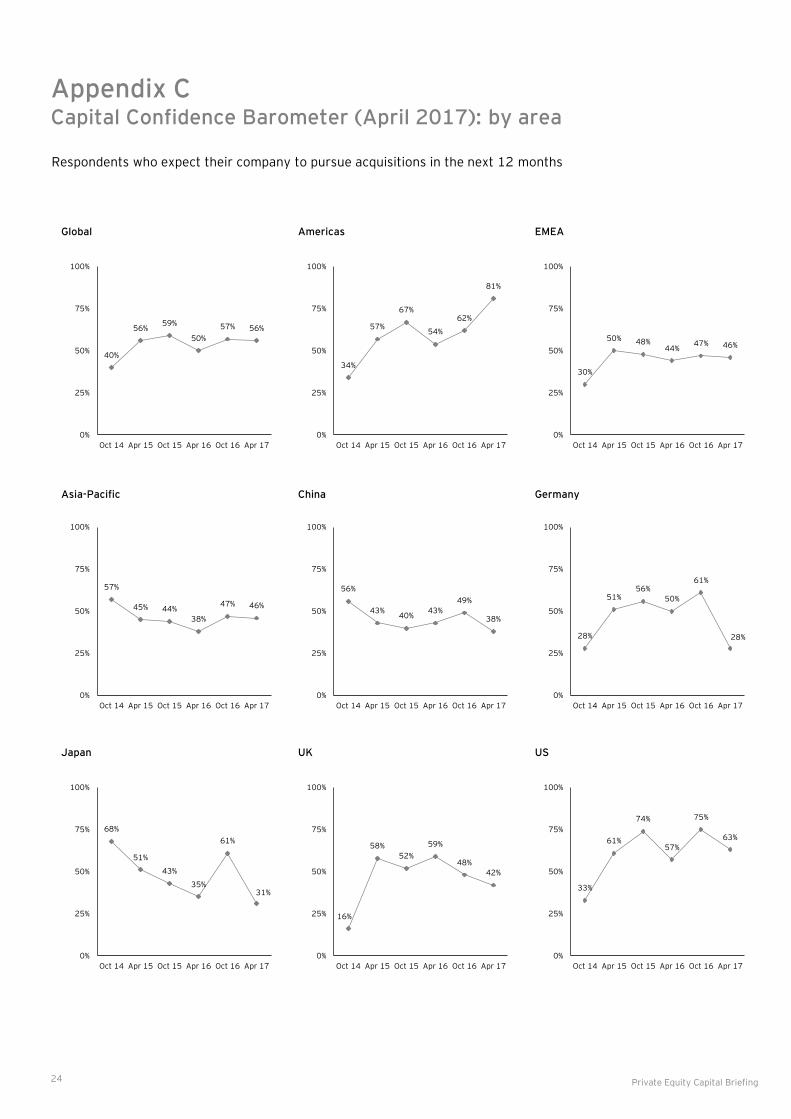
Appendix CCapital Confidence Barometer (April 2017): by area
Respondents who expect their company to pursue acquisitions in the next 12 months
40%
56%59%
50%
57% 56%
0%
25%
50%
75%
100%
Oct 14 Apr 15 Oct 15 Apr 16 Oct 16 Apr 17
34%
57%
67%
54%
62%
81%
0%
25%
50%
75%
100%
Oct 14 Apr 15 Oct 15 Apr 16 Oct 16 Apr 17
30%
50% 48%44%
47% 46%
0%
25%
50%
75%
100%
Oct 14 Apr 15 Oct 15 Apr 16 Oct 16 Apr 17
Global Americas EMEA
57%
45% 44%
38%
47% 46%
0%
25%
50%
75%
100%
Oct 14 Apr 15 Oct 15 Apr 16 Oct 16 Apr 17
Asia-Pacific China Germany
28%
51%56%
50%
61%
28%
0%
25%
50%
75%
100%
Oct 14 Apr 15 Oct 15 Apr 16 Oct 16 Apr 17
Japan UK US
16%
58%
52%
59%
48%
42%
0%
25%
50%
75%
100%
Oct 14 Apr 15 Oct 15 Apr 16 Oct 16 Apr 17
33%
61%
74%
57%
75%
63%
0%
25%
50%
75%
100%
Oct 14 Apr 15 Oct 15 Apr 16 Oct 16 Apr 17
24
56%
43%40%
43%
49%
38%
0%
25%
50%
75%
100%
Oct 14 Apr 15 Oct 15 Apr 16 Oct 16 Apr 17
68%
51%
43%
35%
61%
31%
0%
25%
50%
75%
100%
Oct 14 Apr 15 Oct 15 Apr 16 Oct 16 Apr 17
Private Equity Capital Briefing

Notes
25 Private Equity Capital Briefing

Notes
26 Private Equity Capital Briefing
If you would like to discuss any of the topics covered in this publication, please contact your EY advisor or any of the contacts below.
EY | Assurance | Tax | Transactions | Advisory
About EY
EY is a global leader in assurance, tax, transaction and advisory services. The insights and quality services we deliver help build trust and confidence in the capital markets and in economies the world over. We develop outstanding leaders who team to deliver on our promises to all of our stakeholders. In so doing, we play a critical role in building a better working world for our people, for our clients and for our communities.
EY refers to the global organization, and may refer to one or more, of the member firms of Ernst and Young Global Limited, each of which is a separate legal entity. Ernst and Young Global Limited, a UK company limited by guarantee, does not provide services to clients. For more information about our organization, please visit ey.com.
About EY’s Transaction Advisory Services
How you manage your capital agenda today will define your competitive position tomorrow. We work with clients to create social and economic value by helping them make better, more informed decisions about strategically managing capital and transactions in fast-changing markets. Whether you're preserving, optimizing, raising or investing capital, EY’s Transaction Advisory Services combine a unique set of skills, insight and experience to deliver focused advice. We can help you drive competitive advantage and increased returns through improved decisions across all aspects of your capital agenda.
The views of the third parties set out in this publication are not necessarily the views of the global EY organization or its member firms. Moreover, they should be seen in the context of the time they were made.
© 2017 EYGM Limited.All Rights Reserved.
EYG no. 03160-174GBL
ED None
In line with EY’s commitment to minimize its impact on the environment, this document has been printed on paper with a high recycled content.
This material has been prepared for general informational purposes only and is not intended to be relied upon as accounting, tax or other professional advice. Please refer to your advisors for specific advice.
ey.com
Transaction Advisory Services
Steve Krouskos
EY Global Vice Chair
Transaction Advisory Services
+1 404 817 5090
Bill Casey
EY Americas Leader
Transaction Advisory Services
+1 305 415 1645
Andrea Guerzoni
EY EMEIA Leader
Transaction Advisory Services
+39 02 8066 9707
Harsha Basnayake
EY Asia-Pacific Leader
Transaction Advisory Services
+65 6309 6741
Peter Wesp
EY Japan Leader
Transaction Advisory Services
+81 3 4582 6465
Private Equity
Herb Engert
EY Global Private Equity Leader
+1 212 773 6202
Bill Stoffel
EY Americas Private Equity Leader
+1 212 773 3141
Jeff Hecht
EY Global PE Tax Leader
+1 212 773 2339
Research and Insights
Mark Temple
EY Knowledge
Transaction Advisory Services
+44 20 7951 6985
Pete Witte
EY Knowledge
Private Equity
+1 312 879 4404