private equity as a canary in a coal mine: building the ... equity as canary in a coal mine:...
TRANSCRIPT
Private Equity as a Canary in a Coal
Mine: Building the Ecosystem for
Effective Global Financial Integration
_______________
Stephen J. MEZIAS
Prodyumna GOUTAM
2014/17/EFE
(Revised version of 2012/102/EFE)
Private Equity as Canary in a Coal Mine: Building the Ecosystem for Effective Global
Financial Integration
Stephen J. Mezias*
Prodyumna Goutam**
Revised version of 2012/102/EFE
Forthcoming in Managerial and Decision Economics
This research was undertaken when Prodyumna Goutam worked as a Research Associate at the Centre for Public Policy
at the Indian Institute of Management, Bangalore. He has since left to pursue graduate studies. We would like to thank
seminar participants at IIM, Bangalore and the University of Nairobi, and at two conferences, SuperReturns Berlin and
Private Equity International Istanbul, for comments and suggestions. All remaining errors are our own.
* Professor of Entrepreneurship and Family Enterprise at INSEAD, Abu Dhabi Campus,
Muroor Road – Street n° 4 P. O. Box 48049 Abu Dhabi, UAE.
Email: [email protected] Corresponding author
** Research Associate at Indian Institute of Management, Bannerghatta Road, Bangalore, India.
Email: [email protected]
This working paper was developed using funds made available through the Abu Dhabi Education
Council, whose support is gratefully acknowledged.
A Working Paper is the author’s intellectual property. It is intended as a means to promote research to
interested readers. Its content should not be copied or hosted on any server without written permission
from [email protected]
Find more INSEAD papers at http://www.insead.edu/facultyresearch/research/search_papers.cfm

2
Abstract
A burgeoning private equity (PE) industry provides investment capital to build the capacity
of an economy for innovation and entrepreneurial growth. We argue that for PE to contribute to this
capacity building requires effective systems for allocation of financial capital to the private sector
and an ecosystem of supportive organizations. To illustrate these claims, we review the recent
history of PE in the MENA region to contrast the PE industry in MENA, which stagnated after the
financial crisis, with the industry in Turkey, which recovered quickly from a brief pause after the
crisis and has thrived since 2008.
Keywords: Private Equity; Organizational Forms; Middle East and North Africa.

3
Introduction
As the recent financial crises have made clear, the many benefits of globalization, more
specifically integration with global financial markets, can be accompanied by significant risks
(Agenor, 2003). For a variety of reasons, not least the complexities of the multiple issues involved,
research on this topic has been relatively sparse. In hopes of making progress in the face of these
apparent difficulties, we will concentrate on only one piece of the global financial integration puzzle,
but one that we believe is particularly important. More specifically, we focus on the capability of an
economy to allocate capital effectively to the private sector and private equity (PE) investments as a
lead indicator of this capability. In particular, we argue that because it offers the possibility of much
greater involvement by the investor, PE is an important indicator for how integration with global
financial markets can create economic value. This can range from the transfer of managerial
knowledge to guide effective organizational practices in nascent firms to the development of
products to tap into latent demand in frontier markets. However, our analysis suggests that the value
creation that differentiates private equity from other investments does not occur only at the firm
level, investment by investment. Rather, successful PE investments should be regarded as part of a
much larger pattern of activities that allow an economy to derive benefits from global financial
integration. To frame these arguments, we will review the travails of the PE industry in the Middle
East-North Africa (MENA) region during the recent past.1 We interpret this recent history to suggest
that the creation of an ecosystem to support PE investments can be regarded as an important signal
of the capability and capacity of an economy for effective integration into the global finance system.
This is the rationale for the metaphor suggested by our title comparing PE with a canary in a
coalmine. In the years before more sophisticated technologies became available, miners would keep
canaries in the coal mine as an early warning against the presence of poisonous gasses. As long as
1 MENA countries are Algeria, Djibouti, Egypt, Iran, Iraq, Jordan, Lebanon, Libya, Malta, Morocco, Syria, Tunisia, West Bank and Gaza, Yemen,
Bahrain, Oman, Qatar, United Arab Emirates, Kuwait, and Saudi Arabia.
4
the canaries remained healthy, the miners would remain below ground and productive activity would
continue. Similarly, we view the situation where the level of private equity investments remains
steady or even grows, as a sign that the economy as a whole has in place the ecosystems to turn
financial capital into sustained economic growth. Equally important to our thesis is the opposite
situation, when the canaries are falling sick or dying; this was the sign to the miners that it was time
to exit. Similarly, when PE investments fail on a wide scale, this becomes a sign that effective
global financial integration is not happening, and financial capital will exit the economy, unlikely to
reenter in the near term.
Of course, the economic benefits of private equity do not occur simply because stakes in the
firm are sold privately rather than listed on public markets. Instead, we argue that private equity
investors adopt an inherently longer time frame in assessing their investment targets and act to
enhance the long-run value of the firms in which they have taken stakes. Although the evidence is
mixed regarding the short-run impact of PE investments, research has demonstrated that PE
investments increase levels of employment and wages in the longer run (Wright et al., 2007; Work
Foundation, 2007; Cressy, Munari, and Malipiero, 2007). With regard to growth and investment
strategies, Davis et al. (2008) found that firms that received PE investments were more effective with
value added strategies, were more likely to broaden their market focus than other new ventures, and
made more effective investments in product development. Similarly, Bruining and Wright (2002)
and Lerner, Sørensen and Stromberg (2008) found that PE investment was associated with more
effective research and development. For example, firms that had PE backed buyouts focused their
patent portfolios to yield increased patent citations with no reduction in the quantity of patents. Cao
and Lerner (2007) found that firms that had received PE investments yielded better than average
market returns for years after the investments. In a study of middle market transactions across
nineteen industries, Chapman and Klein (2009: 24) found that PE investments were associated with
5
growth, the ultimate driver of wealth creation for smaller companies. For over three quarters of their
sample, revenues, operating profits, and total employment increased; they concluded that PE
investments were a catalyst for exploiting scale and scope economies and providing operating
leverage. A similar conclusion is suggested by the finding of Wilson, Wright and Scholes (2011: 2)
linking PE investments with more resilient performance following the 2008 financial crisis and
recession. Their research showed that private-equity backed buyouts had better economic
performance in the period before and during the recent recession than a matched sample of private
companies and listed companies. In fact, the performance of the firms experiencing private equity-
backed buyouts actually showed a higher return on assets, greater ability to cover the interest
payments on their debt, and higher gross margin in the recession period than before it.
In the remainder of this study we elaborate these points by presenting some suggestive
comparisons using a variety of measures of the financial system of the MENA region. This region is
a particularly appropriate setting for our arguments for at least three reasons. First, the financial
integration of economies in this region, especially in terms of share of foreign direct investment, has
remained low given both the size of the population and the levels of GDP (Khoury and Wagner,
2009). Second, there were huge increases in flows of financial capital to the region in the years
before the financial crisis, particularly through alternative investments such as private equity. To
assess the impact of these monies, we use two kinds of data to provide a rough assessment of the
relationship between financial capital and sustainable economic growth: measures of how capital has
been allocated in these economies and the flow of investment capital. The latter is specifically
relevant to our claim that PE investments and the ecosystem that support them are lead indicators of
effective global financial integration. Third and related, the region offers the opportunity for a
comparison that informs our thesis: not all countries fared badly in the wake of the collapse of
investment inflows in 2008. Indeed, while PE investments in the rest of the region have stagnated,

6
the industry in Turkey recovered quickly from a brief pause after the crisis and has thrived since
2008.
In the remainder of this study, we compare Turkey with the MENA countries in terms of
capital allocation, the quantity and success of PE deals, and the ecosystem for supporting PE
investments. We interpret these comparisons to inform our thesis concerning the emergence and
growth of the ecosystem in these geographies to support economic value creation through private
equity investments. A burgeoning PE industry can play an important role in attracting investment
into the domestic productive capacity of emerging markets, fostering the creation of new firms and
industries that develop and diversify economies. In the rest of the paper, we proceed as follows.
First, we review the readiness of economies to use PE money effectively by investigating their
success at allocating financial capital to the private sector. Second, we extend our argument about
the allocation of credit to the private sector by elaborating the notion of an ecosystem to support
private investment, including PE investments. Then, we integrate our findings about allocation of
capital to the private sector and the ecosystem to support private investment by linking them with
quantity of deals in MENA and Turkey as well as the comparative success of PE funds with
investments in Turkey. We close by discussing some implications of our findings and outlining the
key conclusions.
Allocating Financial Capital to the Private Sector
We begin by investigating country level data for a series of measures that we interpret as
indicators of effective allocation of capital to the private sector. The primary conclusion from all
these measures is that Turkey succeeded in creating a robust conduit for allocating capital to the
private sector through both the banking system and the equity markets. Of course, more fine-grained
data tracking actual credit flows and investments would be preferable, but gathering such
longitudinal data for multiple countries would be extremely difficult. Further, since our
7
investigation is explicitly exploratory, we believe that there is some value in assessing rough
indicators of allocation of capital to the private sector, particularly because we believe it is very
relevant to the issue of successful integration of emerging markets into global financial markets. The
question of what constitutes successful integration, although difficult to answer, is important,
particularly in light of fundamental change in global investment patterns. Specifically, financial
flows between emerging markets, such the MENA region and Turkey, and global financial centers in
the developed world have increased rapidly in recent decades (Lane and Milesi-Ferreti, 2001; 2003;
2008).
In his review of the potential benefits and costs of global financial integration, Agenor (2003:
1092) focused on the importance of expanding access to credit for the private sector in emerging
economies. He began his argument with the observation that the capacity to save in many
developing economies is constrained by low levels of income; yet these economies need
considerable financial investment to fund their growth. By his logic, the key parameter is whether
the marginal rate of return from investment in an emerging economy is at least equal to cost of
(borrowed) capital. When this is true, “… net foreign resource inflows can supplement domestic
saving, increase levels of physical capital per worker, and help the recipient country raise its
economic growth and improve living standards.” Based on this argument, we examine credit
provision to private sector participants in the MENA region and in Turkey. Specifically, we take the
credit extended to the private sector by deposit money banks and other financial institutions to be our
primary measure of credit provision. This indicator has been widely used in the international
economics literature to capture the private sector’s access to capital pools. For example, Levine,
Loayza, and Beck (2000: 10) underscore the usefulness of the measure in capturing the extent to
which savings are translated into credit for private sector projects. According to their argument, this
measure is superior to measures of the size of the financial sector because it separates credit issued to
8
the private sector from credit issued to governments, government agencies, and public enterprises.
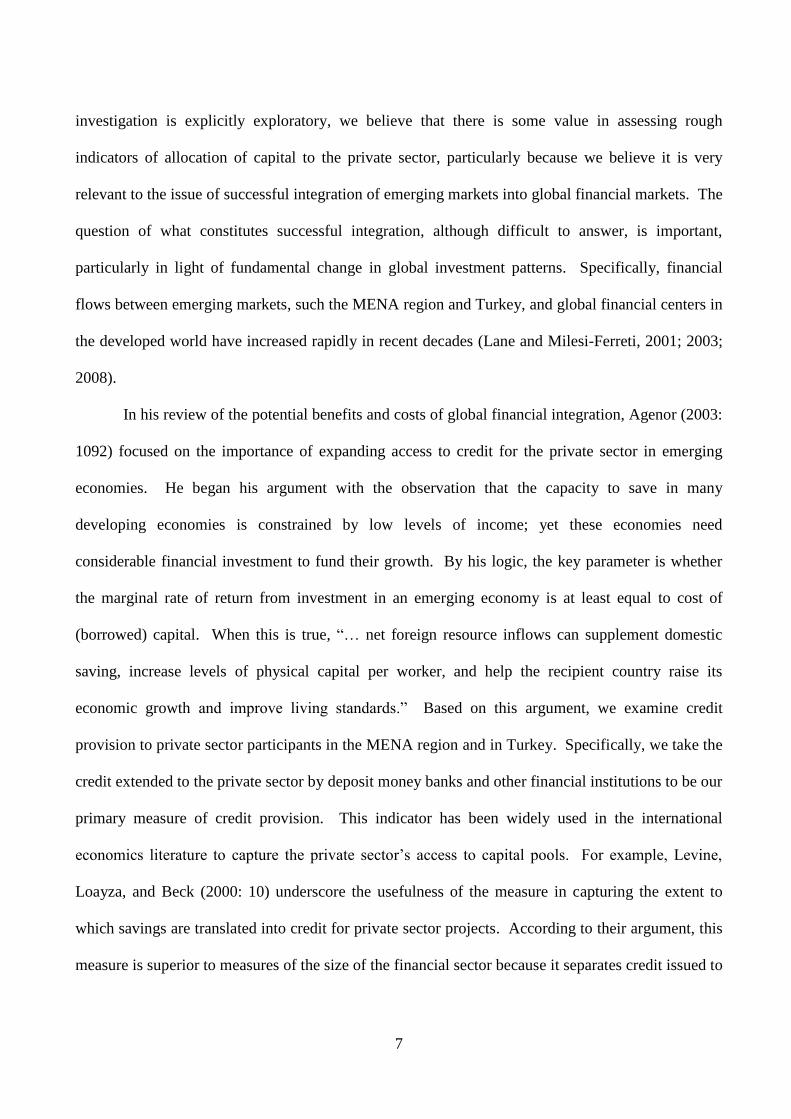
Figure 1 charts the annual growth in the ratio of private sector credit provision to GDP from 1991 to
2009; for the MENA region, this is calculated by taking the average of year-on-year growth rates for
individual countries, which is compared with the year-on-year growth rate for Turkey.2
Insert Figure 1 about here.
From 1991 to 2000, private sector credit provision in Turkey was extremely volatile; 1996
marked the pinnacle with a growth rate of 0.245, and 1998 marking the nadir with a growth rate of
negative -0.22. On the other hand, MENA countries – on average – maintained largely positive rates
with the exception of 1992 and 2000. Both the MENA region and Turkey saw sharp decreases in
growth rates between 2000 and 2002. Beginning in 2002, growth in private sector credit for Turkey
has remained ahead of the MENA region. Although a downturn for Turkey in 2005 had the result
that the rate was almost equal with that of the MENA average by 2007, 2008 marked a distinct
deceleration for the MENA region while the rate for Turkey has remained more or less the same.
Thus, this data reveals two trends in private sector credit allocation. First, there has been a generally
positive trend for Turkey since 2002. Second, the rate in Turkey was hardly affected by the financial
crisis of 2008 while the rate in MENA suffered a considerable decline.
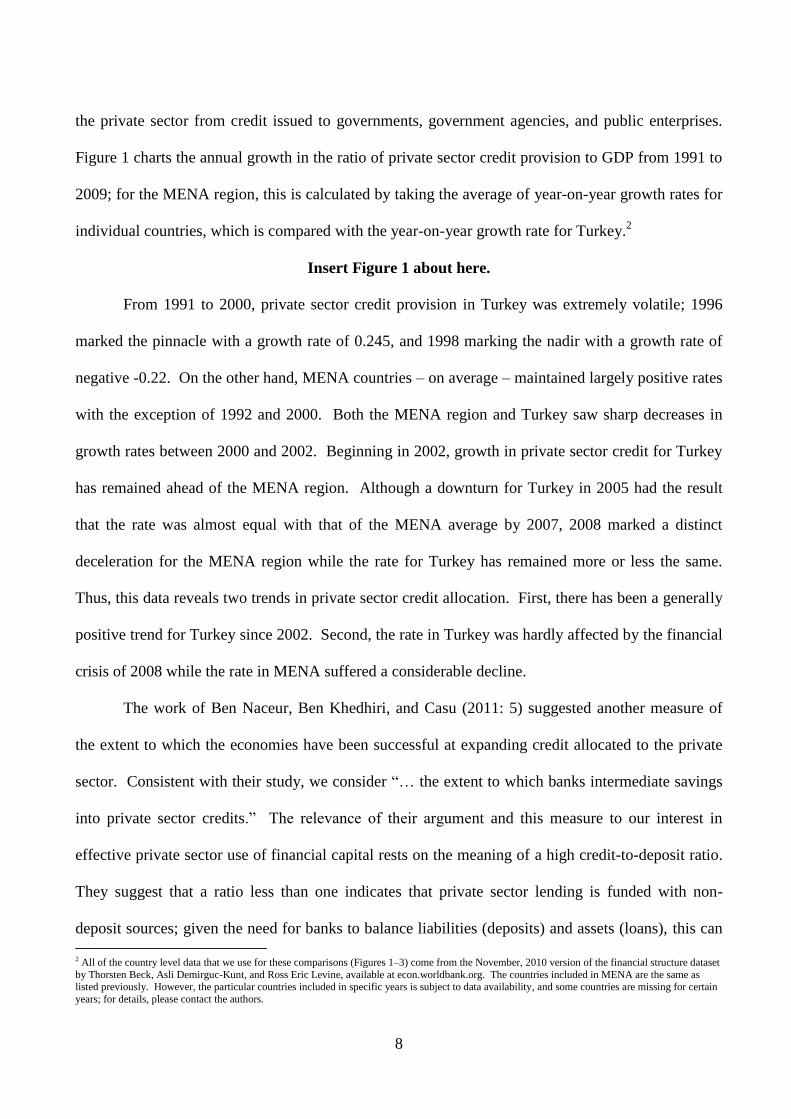
The work of Ben Naceur, Ben Khedhiri, and Casu (2011: 5) suggested another measure of
the extent to which the economies have been successful at expanding credit allocated to the private
sector. Consistent with their study, we consider “… the extent to which banks intermediate savings
into private sector credits.” The relevance of their argument and this measure to our interest in
effective private sector use of financial capital rests on the meaning of a high credit-to-deposit ratio.
They suggest that a ratio less than one indicates that private sector lending is funded with non-
deposit sources; given the need for banks to balance liabilities (deposits) and assets (loans), this can
2 All of the country level data that we use for these comparisons (Figures 1–3) come from the November, 2010 version of the financial structure dataset
by Thorsten Beck, Asli Demirguc-Kunt, and Ross Eric Levine, available at econ.worldbank.org. The countries included in MENA are the same as listed previously. However, the particular countries included in specific years is subject to data availability, and some countries are missing for certain
years; for details, please contact the authors.
9
result in funding instability. Figure 2 presents data on this ratio for MENA and Turkey;3 while
neither Turkey nor the MENA region exhibit a ratio greater than one, only Turkey ever rises
significantly above 0.7. Of course, Turkey does exhibit a steep fall from 0.759 in 1997 to 0.358 in
2001; thus, the translation of deposits into private sector credit was severely constrained within this
time period. However, the years after 2001 saw a sustained rise in credit to deposit ratio, surpassing
the MENA average in 2006 and remaining above that average to end with 0.861 in 2009. The
average in the MENA region, by contrast, has remained fairly stable, oscillating between a minimum
of 0.64 and a maximum of 0.70. Neither region achieves a ratio greater than one during the time
period considered, which suggests caution in being overly optimistic about performance on this
metric. Nonetheless, we conclude that the mechanism of allocating deposits to provide credit is
more robust in Turkey than in the MENA region.
Insert Figure 2 about here.
Having presented two measures linked with the banking sector, we add a measure that we
believe is particularly relevant to the effective use of PE investment capital by turning our attention
to equity markets. If initial public offerings represent the mode of exit for PE investments that
maximizes value (Leeds and Sunderland, 2003: 12), then there should be a close relationship
between the extent to which local equity markets provide liquidity and PE activity. eck, emirg -
Kunt, and Levine (1999: 17) argued that that the ratio of “… stock market total value traded to GDP
…” is the best measure of the liquidity of the stock market. This measure is defined as total value of
shares traded on the stock market exchange divided by GDP, which requires no deflation since both
numerator and denominator are flow variables measured over the same time period. This is a better
3 More precisely, this ratio measures the provision of credit to the private sector by deposit money banks as a proportion of three kinds of deposit
accounts in money banks: demand, time and savings.
10
measure of liquidity than total market capitalization, which measures market size more than market
turnover.4
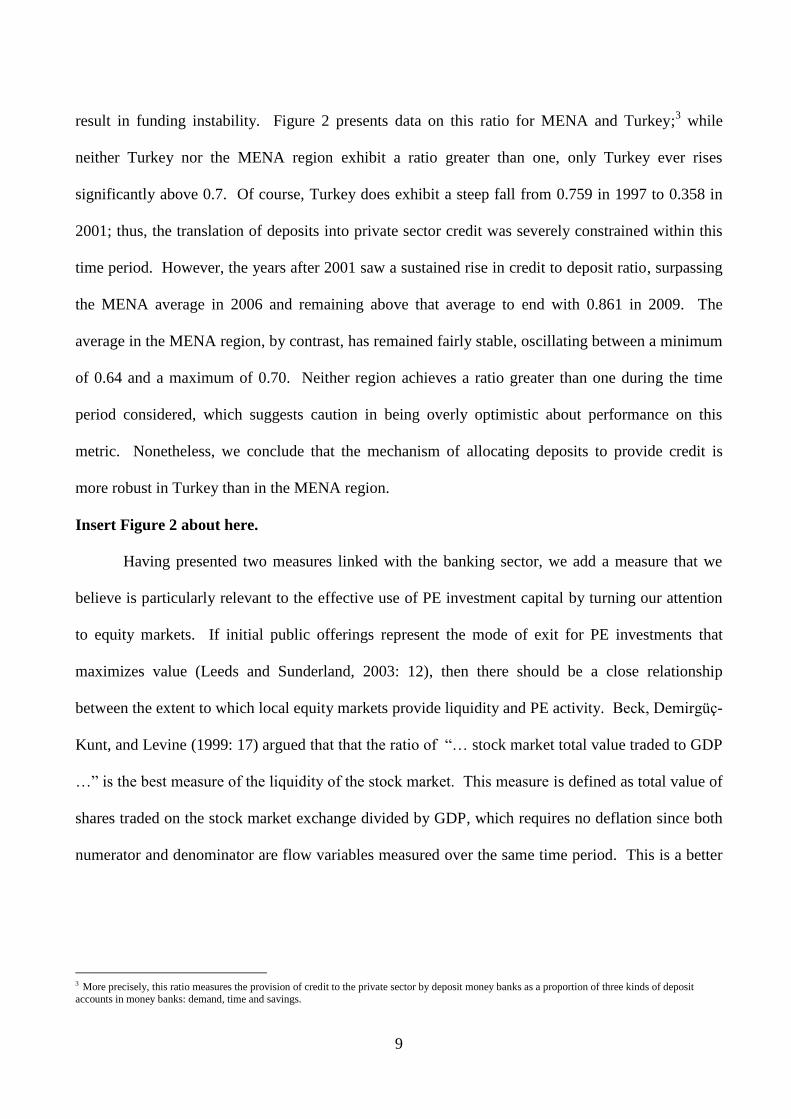
In Figure 3, we compare the average ratio across the MENA countries with the ratio for
Turkey between 1990 and 2009 in Figure 3. MENA displays a gradual rise in the total value traded
on stock markets from 1990 to 2002, which accelerates from 2002 to 2005. This largely coincides
with the development of stock exchanges around the region in places such as Dubai; however, from
2005 onwards, we begin to see a decline in stock market activity. In fact, it is interesting to note that
this decline precedes the financial crisis of 2008; this can be interpreted to suggest that even during
the height of the financial boom that preceded the crash, investors perceived a lack of depth in
MENA equity markets (Harrison and Moore, 2012). The trend for Turkey looks dramatically
different: given the fact that the country had a more developed financial system, activity took off
much earlier than MENA, that is from1992 onwards. The major crash in local stock market activity
was encountered right at the turn of the century; the ratio of total value traded to GDP fell from 0.67
in 2000 to 0.30, two years later. From this point, however, the Turkish stock market has shown
considerable resilience, with activity increasing steadily from 2002 to 2009; even the financial crisis
and subsequent global recession did not stop the rise in equity activity relative to GDP.
Insert Figure 3 about here.
All of the measures comparing the allocation of financial capital to the private sector in
MENA and Turkey reveal some consistent patterns. From 2002 to the present, Turkey has shown
net improvement on all measures, while MENA has not. Indeed, Turkey pulled ahead of MENA on
all of these measures before the financial crisis of 2008. Thus, it seems clear that the better
performance of Turkey relative to MENA on all of these measures cannot be attributed to the
financial crisis. It is also true that Turkey has outperformed MENA in the wake of the financial
4 This is particularly true for the emerging markets of MENA, which are characterized by extremely low levels of volume and share sales, which
Harrison and Moore (2012) call thin trading. Given the problems with thin trading we believe that the level of activity of the domestic stock market rather than market capitalization as a ratio of GDP is the better measure of the extent to which the stock market provides liquid financing to the private
sector.

11
crisis. Indeed, while the performance of MENA remained flat or declined after the financial crisis,
the performance of Turkey has either improved or remained relatively unaffected. We conclude
from this review of the data that Turkey has done a better job allocating financial capital to the
private sector in recent years than the countries of the MENA region.
The Private Investment Ecosystem in MENA and Turkey
We have established the favorable comparison of Turkey with the MENA region in terms of
the ability of the economies to allocate financial capital, both credit and equity investments, to the
private sector. In this section, we extend this suggestive finding by providing some evidence
consistent with the claim that these differences might be understood in terms the development of an
ecosystem to support private sector investments. Where the ecosystem develops well, presumably as
credit and equity investments allocated to the private sector increase, e.g., in Turkey, financial
capital can be used more productively. By contrast, when there is less allocation of credit and equity
to the private sector, then the development of an ecosystem to provide structural support for private
investment will languish. Whether investments in the private sector, for example, PE investments,
chase short-term returns rather than productive investments will be affected by the ability of the
ecosystem to support the latter. Indeed, our presumption is that the allocation of capital to the
private sector in an economy builds capabilities that facilitate private investment activity; we will
discuss these capabilities in terms of the community of organizations that deploy particular
competencies to support private equity investments, which we shall refer to as the PE ecosystem.
The literature to date on the factors that drive PE investment in emerging markets has
focused almost exclusively on the legal-financial systems and related institutions at the national
level. For instance, in their assessment of the causes behind the underperformance of PE in
emerging markets relative to US and Europe, Leeds and Sunderland (2003) point towards three main
institutional factors: weak corporate governance standards, unreliable legal institutions, and shallow
12
markets for initial public offerings (IPO). In relation to the first, lax accounting practices and
insufficient regulatory oversight lead to severe informational gaps between investors and target firms
in terms of the provision and quality of information about finances and operations. Although the
authors note that this problem is particularly salient during the due diligence stage, they also argue
that these information asymmetries remain as investors try to assess the health and progress of their
portfolio companies.
The loss in investor confidence arising from information asymmetries associated with weak
accounting standards are further aggravated by the weak enforceability of contractual rights in some
emerging markets. Investors rely on the threat of legal action to provide the necessary disincentives
against contract breach; the lack of proper channels for registering and pursuing legal claims
undermine this support. Additionally, as Leeds and Sunderland observed (2003:12), a maze of
personal connections and the prevalence of corruption mean that local parties “… tend to be
exceedingly adept at navigating the ins and outs of the legal system.” As they note, this puts foreign
investors at a distinct disadvantage in the judicial resolution of disputes.
The third factor behind the underperformance of PE in emerging markets is a weak IPO
market. According to Leeds and Sunderland (2003: 12), IPOs are the fundamental driver of the
private equity industry, as they “… tend to maximize firm value.” However, the lack of depth in
many equity markets in developing countries means that IPOs are not a viable exit option for PE
investors. Furthermore, equity markets in emerging economies often serve as a capital-raising
vehicle for only the largest of firms. For example, evidence from Latin America and Asia collected
by Leeds and Sunderland (2003) showed that a small number of firms dominated daily trading
volume in both geographies.
The importance of these three institutional factors in driving PE activity has been
underscored repeatedly in the literature. Indeed, the gospel of the effects of financial-legal

13
institutions on PE investments is widely believed among the congregation of participants in PE
markets. Our own data, based on 40 survey responses from and 25 interviews with participants in
PE in the MENA region, reveal similar beliefs, as indicated by Figure 4.5
Insert Figure 4 about here.
Here we report the answers to a question about the major concerns of those who supply the
capital for PE investments, so-called limited partners (LP). More than 80% of those who responded
listed transparency in their relationship with the investing firms, so-called general partners (GP), as
one of their top concerns. Indeed, this was regarded as more important, albeit by a small margin,
than returns themselves; in other words, respondents indicated slightly more concern about whether
the process was transparent than about returns. Nearly two thirds expressed concern about the
alignment of interest between LP and GP; this concern outweighed concern about the two kinds of
fees that GP charge LP, management fees and carry deal fees. Not surprisingly, we find these data
convincing, but we would also suggest that a focus on institutional reform as a response to these
concerns is incomplete in at least two ways. First, a narrow focus on national policy reform suggests
an understanding of institutions and how they facilitate economic activity that is incomplete (Zucker,
1983). Second, a focus on legal financial institutions diverts attention from the capabilities and
capacities for coordinated private action that enhance the success of PE investments.
With respect to the first point, words like quality institutions, transparency, corporate
governance, and corruption are often used, particularly in discussions of countries in the developed
world, as if they had a singular meaning. This often translates into discussions of policy options that
characterize institutions to support economic development in binary fashion, almost as if there were
a switch that policy makers could operate to reform the climate for foreign investment. This
simplistic representation is often accompanied by an emphasis on single measures of institutional
5 The survey results come from an unscientific survey of 40 key industry participants conducted in the second quarter of 2011. The details are reported in Balze, Mezias and Bazian (2011).
.

14
quality. For example, corruption is often reported in terms of an index score, e.g., the corruption
perceptions index published by Transparency International.6 We do not mean to suggest that single
dimension measures are never useful, far from it; rather, our point is that we need to bear in mind
that thinking about these issues has to be multidimensional, even if we use single measures on
occasion to summarize particularly relevant facts about global economies. This is borne out by the
fact that almost every comparative study reveals significant differences in the systems of developed
economies such as those of Germany, Japan, and the USA with respect to all of these institutions
(e.g., Witt, 2004). Thus, we advocate an approach to thinking about the institutional context of PE
investments that takes a broader view than simply advocating policies designed to produce ‘high
quality’ institutions.
Second, the fact that policy regimes vary significantly among developed economies suggests
the importance of culture and prevailing practice in determining what will be encoded in the official
policies of the legal environment. This has been documented in great detail with respect to civil
rights law and organizational practices in the US (e.g., Edelman, 1990; 1992), but we believe it is
likely equally true with respect to legal principles and norms governing financial practices. Indeed,
this is almost certainly part of the explanation for why different average concentrations of ownership
in the equity markets of different developed economies are associated with very different regimes for
regulating those markets (e.g., Maher and Andersson, 1999). More to our point, since new laws and
regulations often only affirm what is already the prevailing practice on the ground (Abzug and
Mezias, 1993), advocating change to policy and legal guidelines is likely insufficient. Therefore, we
suggest that analysis of the institutions to support PE investments can also be framed around
capabilities on the ground and how the organized interests that possess them have influenced and
reacted to policy. Participants in the MENA PE market understand that statements about institutions
only have meaning when they are linked with capabilities on the ground and the extent to which the
6 http://www.transparency.org/policy_research/surveys_indices/cpi
15
entire ecosystem facilitates certain activities. For example, the head of a major private equity firm
based in Bahrain elaborated the ‘difficulty of exits’ during an interview. 7
His detailed observations
about the travails of using the equity markets for exit from PE investments in MENA summarize
some of the key challenges: “The region does not have very liquid public markets. Stock exchanges
are fragmented. Listing requirements are not standardized across MENA … requirements in terms
of corporate governance are often below international standards … As a result, the time and level of
effort involved in educating business owners, structuring a deal, institutionalizing, growing and
exiting a company is very high in the region compared to western markets.” Fragmented markets,
non-standard listing requirements, the lack of knowledge among business owners, the need for
templates to structure deals, and the difficulty of founding, nurturing, and selling businesses are
complex problems that cannot be solved by a simple wave of the visible hand.
For these reasons, we take an ecosystem view of how particular sets of institutions might
engender investor confidence, which we depict in Figure 5. We emphasize the competencies and
capabilities not just of PE firms but also of all the organizations that support them, such as firms that
provide fund services, special advisers (like logistics, information technology, and management
consultancies), legal services, and banking and transaction services. Of course, the actual ecosystem
is likely far more complex than our simple representation, and there are likely significant differences
across countries, regions, cultures, and levels of development in terms of the relative importance of
specific components of the ecosystem. Nonetheless, we believe that the ecosystem perspective
captures something fundamentally important about what leads to the success of private equity
investments. Thus, we link the presence and vibrancy of this community of organizations with the
ability of PE investors to create value. Ultimately, value creation is what sustains investor
confidence and the flow of financial resources to PE investments in the local economy.
7 We conducted interviews with twenty-five participants in the PE industry from the MENA region; again this was a convenience sample. The details are reported in Balze, Mezias and Bazian (2011).
16
Insert Figure 5 about here.
Taking a community ecology view, we emphasize the capabilities that support PE
investments and how they are embedded in particular organizational forms. For example, a
capability for effective corporate governance can be mapped to the presence of specialized audit and
tax accounting firms. Similarly, the depth of legal institutions can be mapped to the presence of law
firms that specialize in PE contracts and the legal services firms that support those contracts.
Specific forms of managerial know-how can be mapped to the presence of firms that provide
advisory services in areas like information technology, logistics, and management consulting. This
shifts the focus of the analysis away from abstractions like ‘institutional quality’ and puts attention
on more tangible issues such as the presence and quality of firms with capabilities that allow PE
investments to thrive. The benefit of adopting a community ecology lens on PE is that it allows for a
bottom-up analysis of the emergence and growth of the PE industry. Re-focusing the discussion to
consider the myriad of organizations that bolster the industry can provide insights at a level of
granularity that is missing from more abstract discussions of financial legal institutions. Moreover,
from a policy perspective, the prescription of enacting profound changes to the underlying
institutions of a country’s economy leads almost inevitably to paralysis by analysis or even worse,
egregiously misguided policy. By contrast, we emphasize the possibilities for policies to enhance PE
investments by facilitating the development of complementary capabilities, e.g., in information
technology integration, efficient supply chain management, or transaction services.
Much like the idea of an ecosystem in biology, a PE ecosystem refers to a clearly delineated
set of organizations that provide services to support successful PE investment. When parts of this
community of organizations are underdeveloped or even absent in an economy, PE investment
cannot play its full role in advancing economic development. Although there is not yet convergence
in the literature on a formal definition of the set of firms that constitute a PE ecosystem, it is possible
17
to deduce what they might be from the perspective of practitioners (e.g., the regular listing of
industry categories in trade publications such as those of Private Equity International).8 For
example, one might argue that the PE ecosystem consists of organizations providing specifics kinds
of services such as fund services, special advisers (such as information technology, logistics, and
management consulting firms), legal services, and banking and transaction services. Consistent with
this approach, the robustness of the PE ecosystem could be measured in terms of the presence or
absence of these various types of firms.
As a first approximation to the strength of the PE ecosystem in Turkey and the MENA
countries, we gathered evidence about how frequently the component organizational forms are
mentioned in cyberspace. Our central claim is simple; most organizations, particularly newer ones
engaged in professional services, are likely to have at least a minimal presence on the internet. Thus,
internet search results associated with private equity, each of these organizational forms, and the
names of the respective countries should give us some idea of the presence or absence of the various
forms to support the private equity industry in the MENA region. We used English language terms
based on our assumption that the vast majority of the professional service firms would have some
English language presence even if the majority of their business were conducted in another language,
e.g., Arabic or Turkish.9 For example, a sample search would include the terms “Private Equity,”
“Fund Services,” and Iraq. The quotation marks are an instruction to the search engine, e.g., Google,
which is the one we used, to search for pages that contain the literal terms enclosed. Tabulating the
number of search results for each such category provides a rough indication of the presence or
absence of each organizational form in each country; normalized counts from such a search are
presented in Figure 6.
8 www.privateequityinternational.com 9 In addition, translation of all of these search terms into a variety of languages would present difficulties and require assumptions of comparability of
terms across languages. Admittedly, using only English terms may skew the counts because more investment oriented countries likely are also more English oriented; however, as long as the processes that produce more use of English are related to the building of the ecosystem for private equity, we
do not believe that this bias will be too severe.
18
Insert Figure 6 about here.
To produce the ranking of countries presented in this graph, we took the raw counts that were
produced by the Google searches and executed the following calculations for more effective
comparisons across countries: For each element of the ecosystem, we associated search counts with
countries. For instance, each country presented in Figure 6 received a raw Google count that
resulted from using ‘Fund Services’ as the search term. For all countries we search for four
components of the ecosystem. After allocating counts to each country along each dimension, we
implement a simple max-min normalization procedure.10
Finally, the transformed scores along each
dimension are averaged to provide a composite score for each country. This normalization provides
a more effective benchmark for comparing the countries than would a simple comparison of raw
counts because it reflects performance relative to the group of countries under consideration. Of
course, we do not wish to overstate the reliability of a measure as crude as these counts; as we
suggested above, it is, at best, a first order approximation. Clearly, some direct measure of the
capabilities of the component organizations of the ecosystem, such as input measures, e.g., the
quality of professional training, or an output measure, e.g., total revenue of firms from private equity
clients, would be superior. At the same time, it is also clear that gathering such data would be
difficult, if not impossible. Ultimately we believe that despite these important caveats, the data are
still informative. We believe this not least because Turkey, which we have shown is more effective
in allocating financial capital to the private sector, emerges as the country in the region with the most
robust PE ecosystem.
The validity of these findings is also bolstered by the fact that Turkey is ahead of its MENA
neighbors in growth, innovation, and entrepreneurship. With respect to GDP, Turkey has run ahead
of not just of the average for MENA countries, but was one of the ten fastest growing economies in
10 Specifically, it represents the raw counts for a given component of the ecosystem where N is the number of countries, we transform the raw counts
using the formula for each i between 1 and N. This bounds the transformed scores between 1 and 7.
19
the world in 2011.11
With respect to innovation, Turkey also emerges as a leader according to the
ranking in the Global Innovation Index 2011. This measure includes innovation driven outputs of
the economy such as patents and scientific research articles; the score for Turkey was about fifteen
percent higher than the average for MENA. With respect to entrepreneurship, we get a similar result
using data from the Global Entrepreneurship Monitor (2011), which suggests Turkey has higher
percentage of the population between 18 and 64 actively involved in setting up their own business.
The coincidence of these facts suggests the possibility that the ecosystem to support private equity is
an important harbinger of productive economic development.
Private Equity in MENA: Boom and Bust
Thus far, we have presented suggestive data to support two claims. First, Turkey is
allocating capital more effectively to the private sector than the average MENA country. Second,
the organizational capabilities to support private investments, which we labeled the PE ecosystem,
are more developed in Turkey than in the average MENA country. We conclude with the central
claim of the analysis: More effective allocation of capital to the private sector and the creation of
capabilities to support investments in that sector is associated with more success in PE investments.
Evidence consistent with this claim is important because we believe that PE investments are a lead
indicator of effective integration into the global financial system. For this evidence, we now turn
attention to the history of the PE industry in the MENA region and Turkey since 1995; we compare
the performance of PE investments in Turkey and MENA on two measures: total number of deals
and the success of funds at raising capital from investors.
We begin by reviewing data on the total number of PE deals, reporting separate counts for
the total MENA region and Turkey in Figure 7. It is notable that each line represents total counts,
comparing the number of deals in Turkey with the total count of deals for all countries in the MENA
11 http://en.wikipedia.org/wiki/List_of_countries_by_real_GDP_growth_rate_(latest_year) based on CIA World Factbook, downloaded 14 June 2012.
20
region; 12
no adjustment is made to render the MENA count to the country level so as to make it
more comparable with Turkey. From 1995 to about 2004, approximately one decade, there was
relatively little activity in the region. Occasional small spikes of activity, such as in 1999-2000 and
2003-2004 interrupted longer periods with relatively little activity. According to data from Zawya
and TEPAV,13
the total deals in the MENA region or Turkey never exceeded ten per year during this
decade. Then in 2004, there was a sea change; money flooded to the region. MENA countries saw
this PE wave hit first, and it followed to Turkey about a year later. Throughout this boom, Turkey
lagged by about a year; indeed, the MENA figures for a given year, remained larger than the Turkey
figures for the subsequent year through 2008, when the financial crisis overwhelmed global markets.
At this point, activity in both the larger MENA region and Turkey decreased sharply, crashing back
to levels in 2009 not seen since 2004. The years since the crisis yield a very different pattern of PE
deal flows. More specifically, the data show that the PE industry in Turkey has rebounded more
strongly than in the MENA region and without the lag seen during the boom that preceded the bust.
Although PE performance as measured by the number of deals undertaken was more robust in the
MENA region prior to the financial crisis, it appears that PE is more robust in Turkey from 2009
onwards.
Insert Figure 7 about here.
The claim that the private equity ecosystem is burgeoning in Turkey is validated when we
examine data at the level of individual funds. The data to demonstrate this came from two sources,
and we ran two analyses that corresponded to these different data. The smaller dataset, which we
obtained from Zawya, contains observations on PE funds across the MENA region; from these data,
we were able to construct observations on 101 funds. We were able to supplement this dataset with
data on 119 funds exclusively in Turkey from TEPAV; this combined dataset contains observations
12 A small number of years excluded specific MENA countries from the count of deals due to missing data; details are available from the authors. 13 You can visit their websites to learn more about Zawya http://www.zawya.com/ or TEPAV http://www.tepav.org.tr/tr/. Please contact the
corresponding author to discuss the actual data used in this report.
21
on 220 funds. In all discussions below, the smaller dataset (termed the partial dataset) is the one
that includes only the information on 101 funds obtained from Zawya; the larger dataset (termed the
full dataset) includes the data on 220 funds from both Zawya and TEPAV.
We interpret Realized Fund Size, a continuous variable indicating the amount of capital
raised in USD, as a measure of performance of the individual funds. Since the raising of capital
occurs towards the beginning of the life of a fund, often years prior to its close, it is a measure of
expectations of ultimate fund performance rather than performance itself. Because measures of the
performance of the investments of a fund are often not known until it closes, we worried that
measures based on the performance of actual investments would be less available, i.e., right-
censored, and have more measurement error, for more recent funds. As a result, we did not deem it
feasible to use measures of actual fund performance; additionally, realized fund size is a widely used
benchmark in the industry (Balze, Mezias, and Bazian, 2011). Because the distribution of this
variable is skewed, with a long tail of very large funds, we used the natural log of realized fund size
as our dependent variable. We estimate the values of this transformed variable using linear
regression with White’s heteroscedasticity-consistent standard errors. We include as independent
variables a set of categorical variables signifying the geographic focus of particular funds (North
Africa, Levant, GCC, MENA and Global). The variable to assess our claim that funds that invest in
Turkey have better performance is called Invested in Turkey, which is coded one if a particular fund
carried out transactions in Turkey and zero otherwise. The descriptive statistics for these variables
are reported in Table 1 for both data sets. Correlation coefficients for the two models are presented
in Tables 2 and 3. The results of the estimation of the models for the two datasets are presented in
Table 4.14
Insert Tables 1 through 4 about here.
14 The estimates we report are all net of fixed effects for investment focus, related to the strategy of the funds, and fund status, related to the life cycle
of the deal; details on these data can be requested from the authors.
22
As Table 1 reports, the mean fund size for the full dataset is smaller ($161M) than the mean
fund size for the partial dataset ($227M). Because the full dataset is constructed by adding funds
exclusively focused on Turkey, this indicates that – on average – realized fund sizes are smaller in
the TEPAV data, simply because the funds are smaller. The geographic focus dummies (Levant,
GCC, MENA, Global and North Africa) are coded to represent broad regional aggregates.15
In the
partial dataset, which includes funds from all over the MENA region, 22 percent had a strategic
focus on North Africa. Analogous figures for focus on Levant, GCC, Global, and all of MENA were
18 percent, 30 percent, 8 percent and 46 percent. The decrease in means for these dummies between
the partial and the full dataset is accounted for by the increase in the total number of observations.
The exception is the variable Global, which increases because the additional 119 Turkish funds in
the TEPAV data are assigned to this category. In terms of our variable of interest, 9 percent of the
funds surveyed in the partial dataset carried out transactions in Turkey while 58 percent of the funds
in the full dataset had done so.
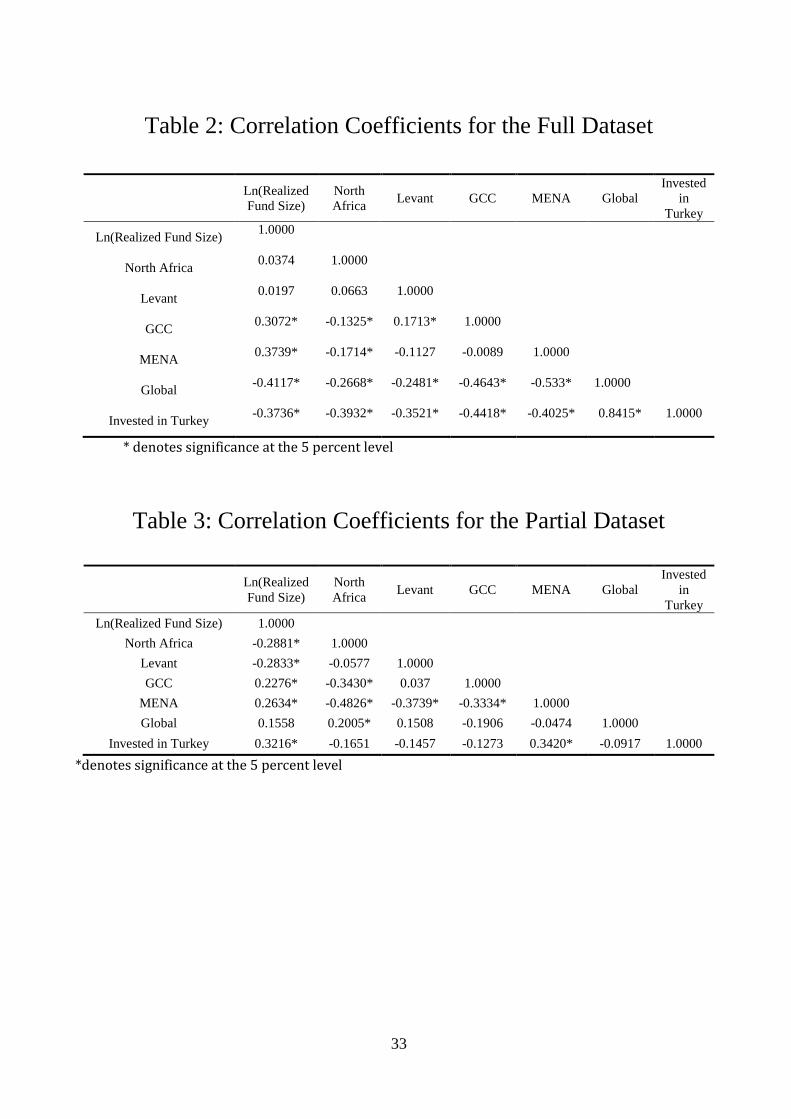
As a precursor to our empirical results, we present correlation coefficients for the variables
included in our regressions. Table 2 presents results for the full dataset, while Table 3 presents
results for the partial dataset. For the full dataset, the variables North Africa and Levant have a
positive association with the dependent variable but they are not significant at the 5 percent level.
Out of the remaining geographic indicator variables, GCC and MENA have a correlation coefficient
of 0.31 and 0.37, respectively while global displays a negative association with the log of realized
fund size with a coefficient of -0.41. The merged data indicator – the variable which signifies
observations that came from the TEPAV data – displays a negative association with realized fund
size implying that PE investments in Turkey tend to be smaller. Most importantly, our variable of
15 We coded the geographic focus of funds as follows. They were labeled North Africa if they listed Egypt, Sudan, Libya, Algeria, Tunisia, Morocco or North Africa. They were labeled Levant if they listed Iraq, Syria, Palestinian Territories, Jordan, Lebanon, or Levant. They were labeled GCC if they
listed Saudi Arabia, Oman, UAE, Kuwait, Qatar, Bahrain, Yemen, or GCC. Funds were included under the MENA label if they listed Middle East or
MENA. We labeled a fund Global if it listed Iran, Turkey, Africa, Worldwide, North America, Pakistan, or South Asia. Given debate as to whether Iran and Turkey should be considered a part of MENA, we ran versions of our models with these two countries coded under MENA and Global; results
did not differ. In the results presented, we put Iran and Turkey in the Global category.
23
interest Invested in Turkey is negatively associated with the log of realized fund size. Since these
are simple correlation coefficients rather than in a multiple regression format with a constant, this
result does not lead us to re-evaluate the predicted direction of the Turkey effect, which we believe
to be positive.16
Moving to the partial dataset, the North Africa, Levant and GCC indicators reverse
signs; by contrast, the GCC and MENA indicators keep the same sign but the magnitudes of the
effects decrease. Interestingly, in the case of the restricted set, the association between our variable
of interest and the dependent variable is actually positive with a correlation coefficient of 0.32.
In Table 4, we present the results of our estimation, net of fixed effects for fund status, fund
investment focus, and year. Critical to our central narrative, the Invested in Turkey dummy has a
positive impact on the log of realized fund size with a coefficient of 0.7, which is significant at the
10 percent level on a two-sided test and at the 5 percent level on a one-sided test. Recalling that the
dependent variable is log transformed, this coefficient implies that companies that invested in Turkey
increased realized fund size by approximately 70 percent, holding all else constant. This effect is
more pronounced for the partial dataset where companies that invested in Turkey realized around 76
percent gains in the size of their funds. Given the fact that all of our independent variables are
categorical, it is important to interpret these results as a comparison to the excluded category or
reference group. In this particular case, the reference group is a fund with a balanced investment
strategy with MENA as its geographic focus in the fund raising phase of its lifecycle. Thus, the
coefficient on the Invested in Turkey dummy denotes that, on average, firms that invested in Turkey
achieved higher fund sizes than the reference group. Since we take realized fund size to be a
measure of performance, we also interpret this to mean that these funds performed better. The
coefficients for the other variables reveal no particularly surprising results: Funds with North Africa
and Levant as their geographic focus fare worse than the reference group whereas funds which have
GCC and the wider MENA region fare better. Also, it is important to note that since we are
16 The regression analysis also includes fixed effects for the status of the fund, the investment focus of the fund, and year.

24
including a variety of fixed effects in the specification, the coefficients reported are net of the impact
of these categories; these include fund status, fund focus, and year. On the whole, there is little
material difference between the results of the full and partial datasets. Both display a pronounced
and statistically significant finding: Funds that invested in Turkey were more successful in terms of
raising capital than funds that did not have investments in Turkey.
Concluding Points
Through the course of our analysis, we have presented a series of indicators and facts in an
attempt to weave these suggestive data into a single narrative. We began by analyzing three
different data series to support our claim that Turkey has done a better job than its MENA neighbors
at allocating capital to the private sector. Specifically, we presented two measures of how well the
banking system operates to intermediate funds to the private sector and a single measure of the
effectiveness of the equity market. None of these measures alone would be convincing; however,
three measures addressing two different sectors, banking and equities, revealed the same temporal
patterns, with Turkey ultimately moving to the forefront. We do not believe that such a systematic
pattern would be likely to emerge simply as the result of a coincidence.
The reliability of this pattern as well as our interpretation of it is further bolstered by our
finding that Turkey was ahead of its MENA neighbors in the creation of an ecosystem to support
private sector investments, including PE. In terms of presence in cyberspace, organizations with
capabilities that support the successful use of private capital to create productive domestic economic
capacity are more present in Turkey than MENA countries. We linked this finding with our
evidence about allocation of capital to the private sector, suggesting that the effective allocation of
capital to the private sectors will be an important determinant of the creation of the PE ecosystem.
Consistent with this conjecture, the data we collected suggest that the ecosystem of Turkey is more
developed than the ecosystem of its MENA neighbors.
25
We closed our argument by drawing the link from the first two findings, more effective
allocation of capital to the private sector and a more developed PE ecosystem, to two measures of the
success of PE investments. First, using data on the counts of deals, we demonstrated a specific
pattern. There was a long period of relatively little PE activity followed by several boom years that
saw a significant influx of investment capital to the PE industry in MENA and Turkey; throughout
this period, Turkey lagged behind the MENA countries in terms of the total number of deals. The
2008 financial crisis brought this ‘period of plenty’ to a close, and both MENA and Turkey
witnessed declines in the number of deals. However, the post-crisis years have seen Turkey emerge
as a preferred destination for PE investments; since 2008, Turkey has pulled ahead and remained
ahead of its MENA neighbors in total number of deals. The dominance of Turkey as the preferred
PE destination can also be seen when we undertake a more systematic analysis of the performance of
PE funds. Our regression analysis of fund-level data from all over the MENA region indicates that
funds with investments in Turkey achieved significantly greater realized fund size. Thus, on a key
measure of fund performance, we showed that investing in Turkey was associated with considerably
better outcomes.
Although there are weaknesses in the data and considerable leaps of faith are required to link
the findings with the specific interpretations we have drawn, we believe that consistency of the
findings is encouraging. Using three macroeconomic indicators to assess the ability of specific
company investments to deliver value for the economy has obvious weaknesses. First, any
subsample of indicators may paint a different picture than would a more comprehensive review of
the panoply of indicators based on a more complete model of how macroeconomic variables interact
to affect private equity investments in emerging economies. We have little doubt that growth in the
gross domestic product, per capita income, the current account deficit, foreign direct investment
flows, as well as many other overall factors characterizing the economic environment of a country

26
matter to the success of private equity. We chose three that we believed were particularly important
and illustrative of the processes of interest to an ecosystem perspective on PE; we leave it to others
with more expertise in macroeconomics and finance to develop a more comprehensive model
relating macroeconomic variables and PE investments. Second, and more important to the
interpretation of our findings, we provided no direct measurement of mechanisms linking the
macroeconomic indicators of readiness to allocate financial capital to the private sector with either
the total number of PE deals or the relative success of funds with investments in Turkey. Similarly,
we drew no direct links between the macroeconomic measures in our figures with the internet-based
measure of the PE ecosystem that we provided. Finally, we provided no direct measure of the
mechanisms that link either the macroeconomic indicators in our figures or our internet based
measures of the PE ecosystem with the quicker recovery of the volume of deals in Turkey or the
Turkey effect revealed by our analysis of realized fund size. Even the analyses of realized fund size,
which permitted specific statistical inferences, must be regarded as largely exploratory. In particular,
because our data were at the fund and not the country level of analysis, we could not control for a
variety of potentially important factors such as growth in the gross domestic product, per capita
income, foreign direct investment flows, the current account deficit, etc. Replication in the context
of more rigorous multivariate analyses to replicate these findings and validate our interpretations is
necessary. Additionally, we have made short shrift of enormous scholarly literatures on how
governance and legal systems, e.g., Henisz (2000), society, e.g., Dobbin; 1997, and culture, e.g.,
Guillén (1994) may affect the growth of private equity and integration into global financial systems.
We have also ignored a large body of more practitioner and mass oriented discussions of private
equity and investor rights, e.g., Ferris (2013), not to mention enormous amounts of materials
produced by advisory firms and consultancies available from the websites of various firms.17
Thus,
we have left to future research the hard work of establishing more systematically the links about
17 http://www.imeams.com/downloads/IMEAMS_2013_English.pdf provides one recent example focused on the MENA region.
27
which we have provided little more than speculations. In empirical terms, this will require finding
the right kinds of data and estimating the correct underlying relationships accurately and effectively.
In theoretical terms, it will require integrating what we have called an ecosystem perspective with a
considerable volume of both theoretical and practitioner research.
Despite some obvious weaknesses and the fact that the analyses we have presented here do
not constitute conclusive findings, we have presented them in the belief that they highlight important
questions concerning how alternative investments, innovation, and growth are linked: What are good
measures of the effectiveness of an economy in allocating capital to the private sector? What
measures might capture the capabilities of firms and other actors in the economy, which we have
lumped under the label of ecosystem, to support the effective allocation of investment capital to
achieve economic growth? What makes an economy succeed in attracting and allocating one form
of private capital, namely PE investments? We believe we have done more than suggest these
important questions; indeed, we regard our findings as data based conjectures about possible answers
to these questions. Despite some obvious weaknesses in these data, we believe the underlying ideas
are of critical importance, particularly for emerging economies. For example, taking an ecosystem
view implies that the policymakers can shift their focus from “rectifying” abstractions like legal
institutions to the encouragement of the formation of specific types of firms that comprise the PE
ecosystem.
At a minimum, this greater repertoire of policy interventions enhances the extent to which
public policy to encourage investments can be tailored to the specific needs of the local context. The
apparent success of Chinese investments in emerging markets, particularly Africa (Nartey and
Mezias, 2013), also would seem to suggest that enacting the institutional reforms advocated by
economists at multilateral organizations is not the only route to attracting foreign investment.
Similarly, the uneven history of development and associated difficulty in establishing universal

28
policy principles and prescriptions (Easterly, 2001) suggest the need for more contextual approaches.
We believe that an ecosystem approach can do this in at least two ways. First, the desire to
encourage specific ecosystem components based on particular development needs or past studies of
how it has proceeded can guide policy in specific settings. Second, a census of existing
organizations with capabilities relevant to utilizing private capital to catalyze economic development
provides a means of assessing the economic strengths and weaknesses of specific countries or
regions. Longitudinal tracking of the ecosystem based on either or both of these contextual
approaches offers the promise of significantly enhancing our understanding of how the mechanisms
that link financial capital, growth, innovation, and entrepreneurship. Thus, we hope that the
approach we have advocated can inform policies that are important to pressing issues of economic
development as the global economy enters the second decade of the 21st century.
29
References A New Database on Financial Development and Structure. 2010. Available at econ.worldbank.org [accessed on 15 June 2012] Agénor PR. 2003. Benefits and Costs of International Financial Integration: Theory and Facts. World Economy 26(8) : 1089-1118. Abzug R, Mezias SJ. 1993. The Fragmented state and due process protections in organizations: The case of comparable worth. Organization Science 4 (3) : 433-453. Balze P, Mezias SJ, Bazian Y. 2011. MENA PE: The next five years. Working Paper. Beck T, Demirgüç-Kunt A, Levine R. 2000. A New Database on Financial Development and Structure. World Bank Economic Review 14: 597 – 605. Beck T, Demirgüç-Kunt A. 2009. Financial Institutions and Markets Across Countries and over Time: Data and Analysis. World Bank Policy Research Working Paper 4943. Ben Naceur BS, Ben Khedhiri H, Casu B. 2011. What Drives the Performance of Selected MENA Banks? A Meta-Frontier Analysis. IMF Working Paper. Bruining H, Wright M. 2002. Entrepreneurial orientation in management buyouts and the contribution of venture capital. Venture Capital: An International Journal of Entrepreneurial Finance 4(2): 147 – 168. Cao J, Lerner J. 2007. The performance of reverse leveraged buyouts. Working Paper. Chapman JL, Klein PG. 2009. Value Creation in Middle-Market Buyouts: A Transaction-Level Analysis. Working Paper. Cressy R, Munari F, Malipiero A. 2007. Playing to Their Strengths? Evidence that Specialization in the Private Equity Industry Confers Competitive Advantage. Journal of Corporate Finance 13(4): 647-669. Davis S, Haltiwanger J, Jarmin R, Lerner J, Miranda. J. 2008. Private equity and employment. The Global Economic Impact of Private Equity Report: World Economic Forum. Dobbin, Frank. 1997. Forging Industrial Policy: The United States, Britain, and France in the Railway Age. Cambride University Press: New York, NY. Easterly W. 2001. The Elusive Quest for Growth: Economists' Adventures and Misadventures in the Tropics The MIT Press: Cambridge, MA. Edelman LB. 1990. Legal Environments and Organizational Governance: The Expansion of Due Process in the American Workplace. American Journal of Sociology 95:1401 – 1440. Edelman LB. 1992. Legal ambiguity and symbolic structures: Organizational mediation of civil rights law. American Journal of Sociology 97(6): 1531-1576. Freeman JH, Audia PG. 2006. Community ecology and the sociology of organizations. Annual Review of Sociology 32(1): 145-169.
30
Global Innovation Index 2011. 2012. Available at http://www.globalinnovationindex.org/gii/ [accessed on 15 June 2012] Global Entrepreneurship Monitor 2011. 2012. Available at http://www.gemconsortium.org/ [accessed on 15 June 2012] Guillén, M. F. 1994. Models of Management: Work, Authority, and Organization in a Comparative Perspective. University of Chicago Press: Chicago, IL. Harrison, B., and Moore, W. 2012. Stock Market Efficiency, Non-Linearity, Thin Trading and Asymmetric Information in MENA Stock Markets. 17: 77-93. Henisz, W. J. 2000. The Institutional Environment for Economic Growth. Economics and Politics, 12(1): 1-31. Khoury SJ, Wagner EM. 2009. A Case of Missing Links: FDI in MENA Countries. International Journal of Business Research 9(4): 1 – 16. Lane, PR, Milesi-Ferretti, GM. 2001. The External Wealth of Nations: Measures of Foreign Assets and Liabilities for Industrial and Developing Countries. Journal of International Economics 55: 263 – 294. Lane PR, Milesi-Ferretti GM. 2003. International Financial Integration. IMF Staff Papers 50: 82–113. Lane, PR, Milesi-Ferretti, GM. 2008. International Investment Patterns. Review of Economics and Statistics 90(3): 538-549. Leeds R, Sunderland J. 2003. Private equity investing in emerging markets. Journal of Applied Corporate Finance 15(4): 111 – 119. Lerner J, Sørensen M, Strömberg P. 2008. Private Equity and Long-Run Investment: The Case of Innovation. National Bureau of Economic Research Working Paper 14623. Levine R, Loayza N, Beck T. 2000. Financial Intermediation and Growth: Causality and Causes. Journal of Monetary Economics 46: 31 – 77. List of Countries by Real GDP Growth Rate. 2012. Available at http://en.wikipedia.org/wiki/List_of_countries_by_real_GDP_growth_rate_(latest_year) [accessed on 14 June 2012] Maher M, Anderson T. 1999. Corporate Governance: Effects on Firm Performance and Economic Growth. Organization for Economic Co-operation and Development, Paris Mezias SJ, Kuperman JC. 2001. The community dynamics of entrepreneurship: the birth of the American film industry, 1895-1929. Journal of Business Venturing 16(3): 209 – 233. Nartey, L. and Mezias, S. 2013. Chinese investment in Africa: Avenues for Academic Scholarship. INSEAD Working paper. Private Equity International. 2012. Available at www.privateequityinternational.com [accessed on 15 June 2012] TEPAV. 2012. Available at http://www.tepav.org.tr/tr [accessed on 15 June 2012]
31
Transparency International. 2012. Available at http://www.transparency.org/policy_research/surveys_indices/cpi [accessed on 15 June 2012] Wilson N, Wright M, and Scholes L. 2011. Private Equity Portfolio Company Performance Through the Recession. Working Paper. Witt U. 2004. On the proper interpretation of ‘evolution’ in economics and its implications for production theory. Journal of Economic Methodology 11(2): 125 – 146. Wright M, Weir C, Burrows A. 2007. Irrevocable Commitments, Going Private and Private Equity. European Financial Management 13: 757 – 775. Work Foundation. 2007. Inside the Dark Box: Shedding Light on Private Equity. Zawya. 2012. Available at http://www.zawya.com/ [accessed on 15 June 2012] Zucker LG. 1983. Organizations as Institutions. In Research in the Sociology of Organizations, Bacharach SB (ed). JAI Press: Greenwich, CT; 1-47.

32
Table 1: Descriptive Statistics
Full Dataset Partial Dataset
Mean Std. Dev Observations Mean Std. Dev Observations
Realized Fund Size 161,000,000 367,000,000 220 227,000,000 366,000,000 101
ln(Realized Fund Size) 17.50 1.80 220 18.43 1.33 101
Levant Dummy 0.08 0.27 220 0.18 0.38 101
GCC Dummy 0.14 0.34 220 0.30 0.46 101
MENA Dummy 0.21 0.41 220 0.46 0.50 101
Global Dummy 0.58 0.50 220 0.08 0.27 101
North Africa Dummy 0.10 0.30 220 0.22 0.41 101
Invested in Turkey
Dummy 0.58 0.49 220 0.09 0.29 101
Merged Data Indicator 0.54 0.50 220
33
Table 2: Correlation Coefficients for the Full Dataset
Ln(Realized
Fund Size)
North
Africa Levant GCC MENA Global
Invested
in
Turkey
Ln(Realized Fund Size) 1.0000
North Africa 0.0374
1.0000
Levant 0.0197
0.0663
1.0000
GCC 0.3072*
-0.1325*
0.1713*
1.0000
MENA 0.3739*
-0.1714*
-0.1127
-0.0089
1.0000
Global -0.4117*
-0.2668*
-0.2481*
-0.4643*
-0.533*
1.0000
Invested in Turkey -0.3736*
-0.3932*
-0.3521*
-0.4418*
-0.4025*
0.8415*
1.0000
* denotes significance at the 5 percent level
Table 3: Correlation Coefficients for the Partial Dataset
Ln(Realized
Fund Size)
North
Africa Levant GCC MENA Global
Invested
in
Turkey
Ln(Realized Fund Size) 1.0000
North Africa -0.2881* 1.0000
Levant -0.2833* -0.0577 1.0000
GCC 0.2276* -0.3430* 0.037 1.0000
MENA 0.2634* -0.4826* -0.3739* -0.3334* 1.0000
Global 0.1558 0.2005* 0.1508 -0.1906 -0.0474 1.0000
Invested in Turkey 0.3216* -0.1651 -0.1457 -0.1273 0.3420* -0.0917 1.0000
*denotes significance at the 5 percent level

34
Table 4: Regression Analysis of log of Realized Fund Size
Full Dataset Partial Dataset
Variables Ln (Realized Fund Size) Ln (Realized Fund Size)
Constant 19.55** 18.68**
Invested in Turkey 0.671+ 0.812*
North Africa Dummy -1.225** -0.775*
Levant Dummy -1.536** -1.292**
GCC Dummy -.798 -0.087
Multiregion Dummy 0.377 0. 286
Merged Data Indicator -1.775**
Observations 220 101
R-squared 0.501 0.484
Notes: All tests use robust standard errors. ** p<0.01, * p<0.05, + p < 0.1
All estimates are net of fixed effects for fund status, fund focus, and year of first close.