private company valuation - csh | homejennie/xavier/privatevaluation.pdf · private company...
TRANSCRIPT

Aswath Damodaran 179
Private Company Valuation
Aswath Damodaran

Aswath Damodaran 180
Process of Valuing Private Companies
n Choosing the right model• Valuing the Firm versus Valuing Equity
• Steady State, Two-Stage or Three-Stage
n Estimating a Discount Rate• Cost of Equity
– Estimating Betas
• Cost of Debt– Estimating Default Risk
– Estimating an after-tax cost of debt
• Cost of Capital– Estimating a Debt Ratio
n Estimating Cash Flows
n Completing the Valuation: Depends upon why and for whom thevaluation is being done.

Aswath Damodaran 181
Estimating Cost of Equity for a Private Firm
n Most models of risk and return (including the CAPM and the APM)use past prices of an asset to estimate its risk parameters (beta(s)).
n Private firms and divisions of firms are not traded, and thus do nothave past prices.
n Thus, risk estimation has to be based upon an approach that does notrequire past prices

Aswath Damodaran 182
I. Comparable Firm Betas
n Collect a group of publicly traded comparable firms, preferably in thesame line of business, but more generally, affected by the sameeconomic forces that affect the firm being valued.• A Simple Test: To see if the group of comparable firms is truly
comparable, estimate a correlation between the revenues or operatingincome of the comparable firms and the firm being valued. If it is high(and positive), of course, your have comparable firms.
n If the private firm operates in more than one business line collectcomparable firms for each business line
Aswath Damodaran 183
Estimating comparable firm betas
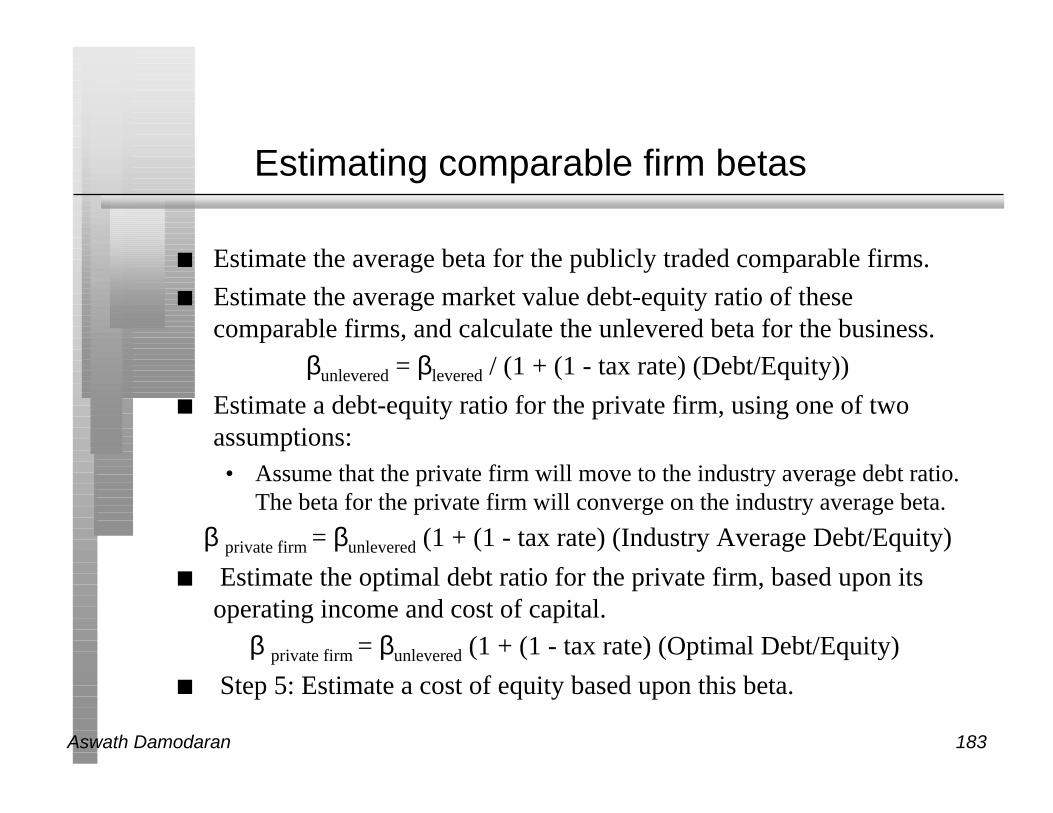
n Estimate the average beta for the publicly traded comparable firms.
n Estimate the average market value debt-equity ratio of thesecomparable firms, and calculate the unlevered beta for the business.
βunlevered = βlevered / (1 + (1 - tax rate) (Debt/Equity))
n Estimate a debt-equity ratio for the private firm, using one of twoassumptions:• Assume that the private firm will move to the industry average debt ratio.
The beta for the private firm will converge on the industry average beta.
β private firm = βunlevered (1 + (1 - tax rate) (Industry Average Debt/Equity)
n Estimate the optimal debt ratio for the private firm, based upon itsoperating income and cost of capital.
β private firm = βunlevered (1 + (1 - tax rate) (Optimal Debt/Equity)
n Step 5: Estimate a cost of equity based upon this beta.

Aswath Damodaran 184
Accounting Betas
n Step 1: Collect accounting earnings for the private company for aslong as there is a history.
n Step 2: Collect accounting earnings for the S&P 500 for the same timeperiod.
n Step 3: Regress changes in earnings for the private company againstchanges in the S&P 500.
n Step 4: The slope of the regression is the accounting beta
n There are two serious limitations -(a) The number of observations in the regression is small
(b) Accountants smooth earnings.

Aswath Damodaran 185
Estimating a Beta for the NY Yankees
n You have three choices for comparable firms:• Firms that derive a significant portion of their revenues from baseball
(Traded baseball teams, baseball cards & memorabalia…)
• Firms that derive a significant portion of their revenues from sports
• Firms that derive a significant portion of their revenues fromentertainment.
Comparable firms Levered Beta Unlevered Beta
Baseball firms (2) 0.70 0.64
Sports firms (22) 0.98 0.90
Entertainment firms (91) 0.87 0.79 Management target
n Levered Beta for Yankees = 0.90 ( 1 + (1-.4) (.25)) = 1.04
n Cost of Equity = 6.00% + 1.04 (4%) = 10.16%

Aswath Damodaran 186
Estimating a beta for InfoSoft: A privatesoftware firm
n Comparable firms include all software firms, with marketcapitalization of less than $ 500 million.
n The average beta for these firms is 1.29 and the average debt to equityratio for these firms is 7.09%. With a 35% tax rate, this yields anunlevered beta of
Unlevered Beta = 1.29/ (1 + (1-.35) (.0709)) = 1.24
n We will assume that InfoSoft will have a debt to equity ratiocomparable to the average for the comparable firms and a similar taxrate, which results in a levered beta of 1.29.
n Cost of Equity = 6.00% + 1.29 (4%) = 11.16%

Aswath Damodaran 187
Is beta a good measure of risk for a privatefirm?
n The beta of a firm measures only market risk, and is based upon theassumption that the investor in the business is well diversified. Giventhat private firm owners often have all or the bulk of their wealthinvested in the private business, would you expect their perceivedcosts of equity to be higher or lower than the costs of equity fromusing betas?
o Higher
o Lower

Aswath Damodaran 188
Total Risk versus Market Risk
n Adjust the beta to reflect total risk rather than market risk. Thisadjustment is a relatively simple one, since the correlation with themarket measures the proportion of the risk that is market risk. Total Beta = Market Beta / Correlation with market
n In the New York Yankees example, where the market beta is 0.85 andthe R-squared for comparable firms is 25% (correlation is therefore0.5),• Total Unlevered Beta = 0.90/0. 5= 1.80
• Total Levered Beta = 1.80 (1 + (1-0.4)(0.25)) =2.07
• Total Cost of Equity = 6% + 2.07 (4%)= 14.28%

Aswath Damodaran 189
When would you use this total risk measure?
n Under which of the following scenarios are you most likely to use thetotal risk measure:
o when valuing a private firm for an initial public offering
o when valuing a private firm for sale to a publicly traded firm
o when valuing a private firm for sale to another private investor
n Assume that you own a private business. What does this tell you aboutthe best potential buyer for your business?
Aswath Damodaran 190
Estimating the Cost of Debt for a Private Firm
n Basic Problem: Private firms generally do not access public debtmarkets, and are therefore not rated.
n Most debt on the books is bank debt, and the interest expense on thisdebt might not reflect the rate at which they can borrow (especially ifthe bank debt is old.)

Aswath Damodaran 191
Estimation Options for Cost of Debt
n Solution 1: Assume that the private firm can borrow at the same rate assimilar firms (in terms of size) in the industry.Cost of Debt for Private firm = Cost of Debt for similar firms in the industry
n Solution 2: Estimate an appropriate bond rating for the company,based upon financial ratios, and use the interest rate estimated bondrating.Cost of Debt for Private firm = Interest Rate based upon estimated bond
rating (If using optimal debt ratio, use corresponding rating)
n Solution 3: If the debt on the books of the company is long term andrecent, the cost of debt can be calculated using the interest expense andthe debt outstanding.Cost of Debt for Private firm = Interest Expense / Outstanding Debt
If the firm borrowed the money towards the end of the financial year, theinterest expenses for the year will not reflect the interest rate on the debt.

Aswath Damodaran 192
Estimating a Cost of Debt for Yankees andInfoSoft
n For the Yankee’s, we will use the interest rate from the most recentloans that the firm has taken on:• Interest rate on debt = 7.00%
• After-tax cost of debt = 7% (1-.4) = 4.2%
n For InfoSoft, we will use the interest coverage ratio estimated usingthe operating income and interest expenses from the most recent year:• Interest coverage ratio = EBIT/ Interest expenses = 2000/315 = 6.35
• Rating based upon interest coverage ratio = A+
• Interest rate on debt = 6% + 0.80% = 6.80%
• After-tax cost of debt = 6.80% (1-.35) = 4.42%
Aswath Damodaran 193
Estimating the Cost of Capital
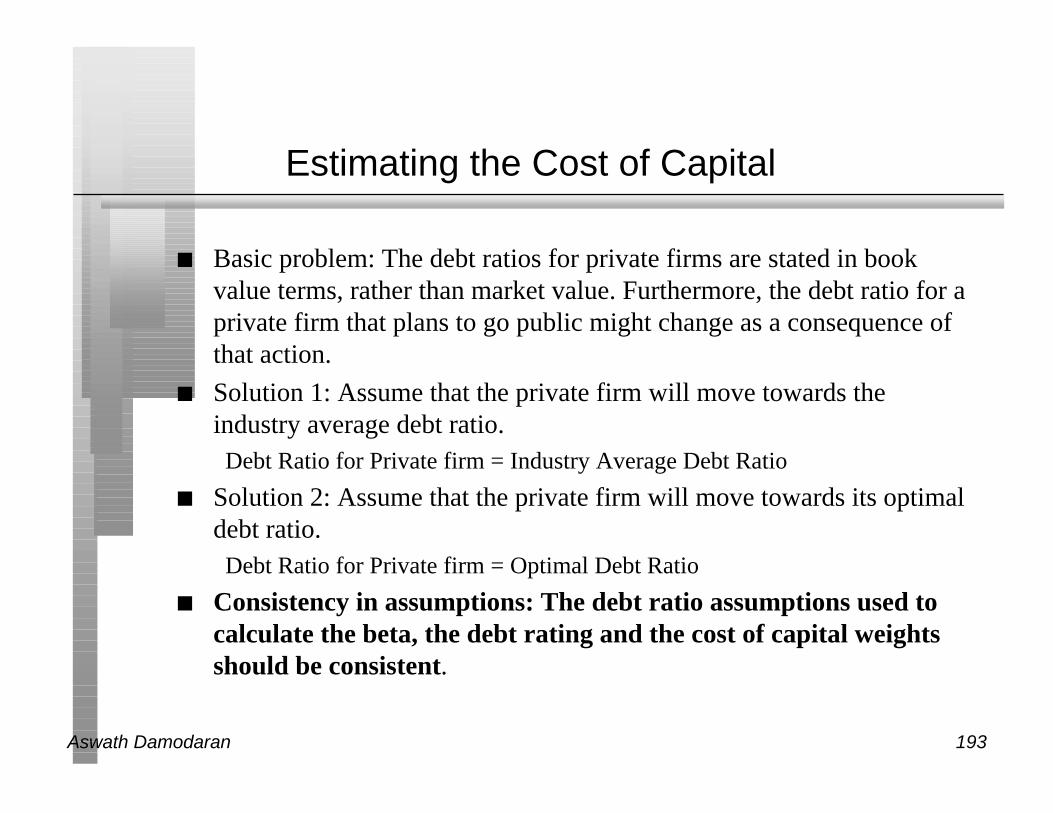
n Basic problem: The debt ratios for private firms are stated in bookvalue terms, rather than market value. Furthermore, the debt ratio for aprivate firm that plans to go public might change as a consequence ofthat action.
n Solution 1: Assume that the private firm will move towards theindustry average debt ratio.Debt Ratio for Private firm = Industry Average Debt Ratio
n Solution 2: Assume that the private firm will move towards its optimaldebt ratio.Debt Ratio for Private firm = Optimal Debt Ratio
n Consistency in assumptions: The debt ratio assumptions used tocalculate the beta, the debt rating and the cost of capital weightsshould be consistent.

Aswath Damodaran 194
Estimating Costs of Capital
New York InfoSoftYankees Corporation
Cost of Equity 14.28%(total beta) 11.16%(market beta)
E/ (D+E) 80.00% 93.38%
Cost of Debt 7.00% 6.80%
AT Cost of Debt 4.20% 4.42%
D/(D+E) 20.00% 6.62%
Cost of Capital 12.26% 10.71%
Aswath Damodaran 195
Estimating Cash Flows for a Private Firm
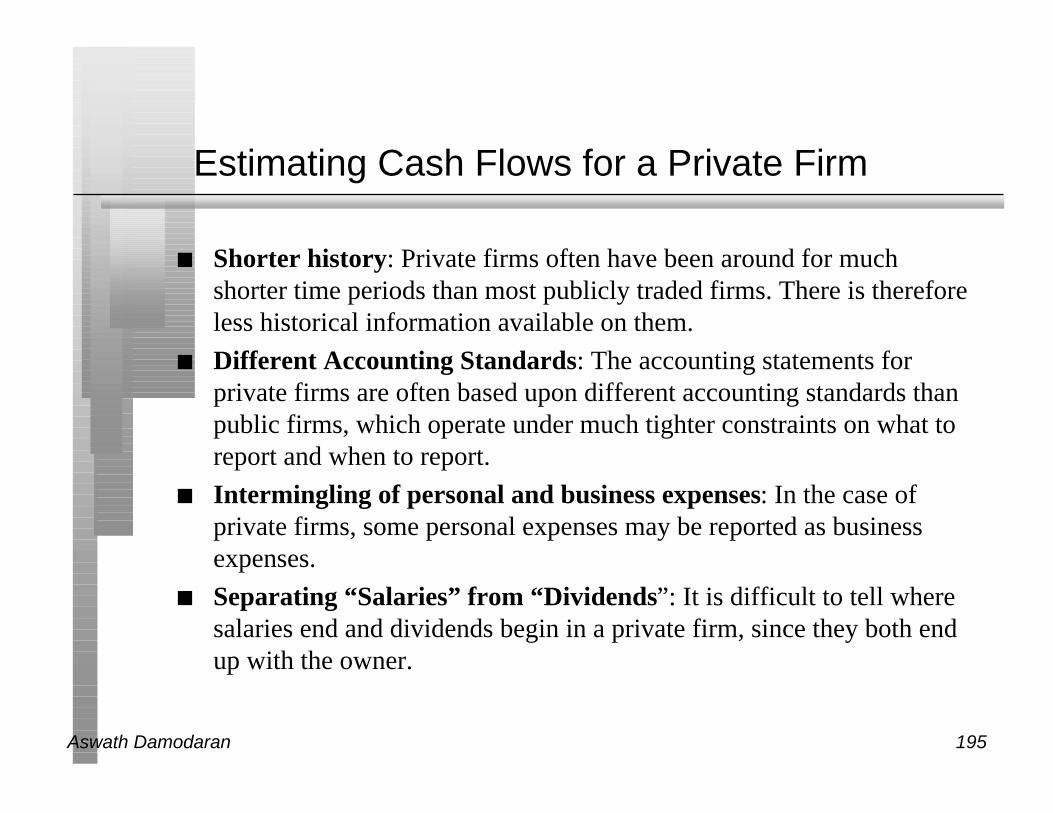
n Shorter history: Private firms often have been around for muchshorter time periods than most publicly traded firms. There is thereforeless historical information available on them.
n Different Accounting Standards: The accounting statements forprivate firms are often based upon different accounting standards thanpublic firms, which operate under much tighter constraints on what toreport and when to report.
n Intermingling of personal and business expenses: In the case ofprivate firms, some personal expenses may be reported as businessexpenses.
n Separating “Salaries” from “Dividends”: It is difficult to tell wheresalaries end and dividends begin in a private firm, since they both endup with the owner.

Aswath Damodaran 196
Estimating Private Firm Cash Flows
n Restate earnings, if necessary, using consistent accounting standards.• To get a measure of what is reasonable, look at profit margins of
comparable publicly traded firms in the same business
n If any of the expenses are personal, estimate the income without theseexpenses.
n Estimate a “reasonable” salary based upon the services the ownerprovides the firm.

Aswath Damodaran 197
The Yankee’s Revenues
Pittsburg Pirates Baltimore Orioles New York Yankees
Net Home Game Receipts $ 22,674,597 $ 47,353,792 $ 52,000,000
Road Receipts $ 1,613,172 $ 7,746,030 $ 9,000,000
Concessions & Parking $ 3,755,965 $ 22,725,449 $ 25,500,000
National TV Revenues $ 15,000,000 $ 15,000,000 $ 15,000,000
Local TV Revenues $ 11,000,000 $ 18,183,000 $ 90,000,000
National Licensing $ 4,162,747 $ 3,050,949 $ 6,000,000
Stadium Advertising $ 100,000 $ 4,391,383 $ 5,500,000
Other Revenues $ 1,000,000 $ 9,200,000 $ 6,000,000
Total Revenues $ 59,306,481 $ 127,650,602 $ 209,000,000

Aswath Damodaran 198
The Yankee’s Expenses
Pittsburg Pirates Baltimore Orioles New York Yankees
Player Salaries $ 33,155,366 $ 62,771,482 $ 91,000,000
Team Operating Expenses $ 6,239,025 $ 6,803,907 $ 7,853,000
Player Development $ 8,136,551 $ 12,768,399 $ 15,000,000
Stadium & Game Operations$ 5,270,986 $ 4,869,790 $ 7,800,000
Other Player Costs $ 2,551,000 $ 6,895,751 $ 7,500,000
G & A Costs $ 6,167,617 $ 9,321,151 $ 11,000,000
Broadcasting $ 1,250,000 $ - $ -
Rent & Amortization $ - $ 6,252,151 $ -
Total Operating Expenses $ 62,770,545 $ 109,682,631 $ 140,153,000
Aswath Damodaran 199
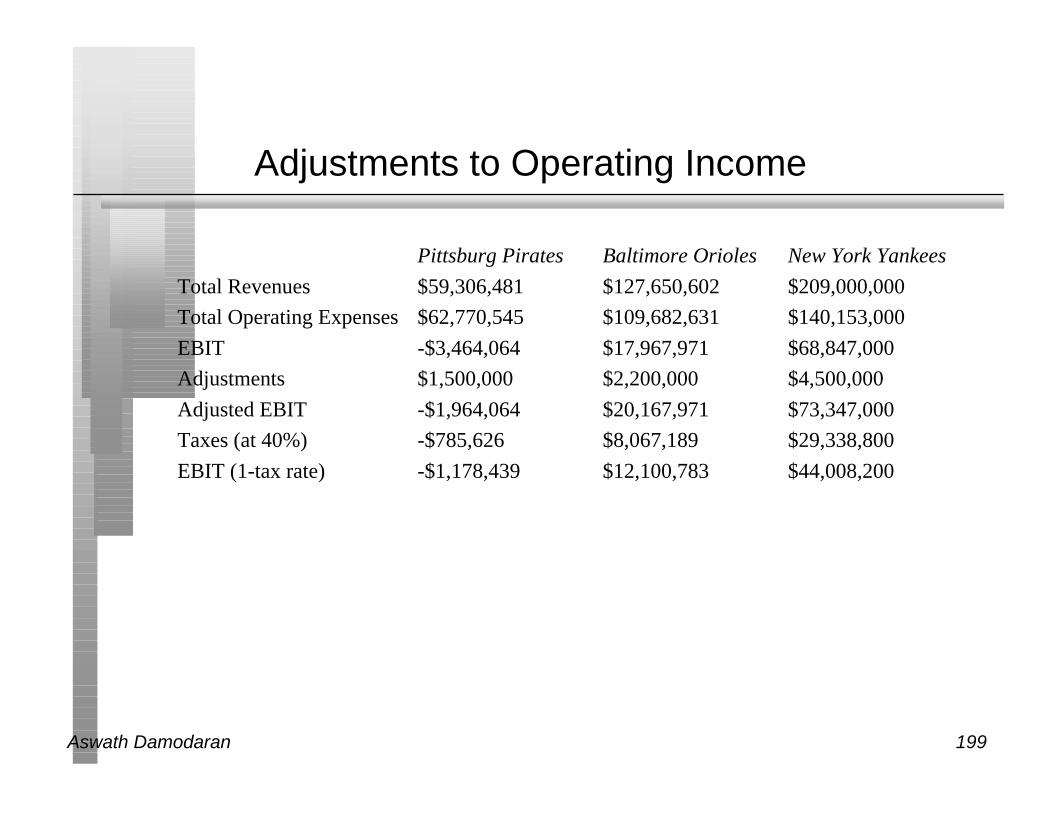
Adjustments to Operating Income
Pittsburg Pirates Baltimore Orioles New York Yankees
Total Revenues $59,306,481 $127,650,602 $209,000,000
Total Operating Expenses $62,770,545 $109,682,631 $140,153,000
EBIT -$3,464,064 $17,967,971 $68,847,000
Adjustments $1,500,000 $2,200,000 $4,500,000
Adjusted EBIT -$1,964,064 $20,167,971 $73,347,000
Taxes (at 40%) -$785,626 $8,067,189 $29,338,800
EBIT (1-tax rate) -$1,178,439 $12,100,783 $44,008,200

Aswath Damodaran 200
InfoSoft’s Operating Income
Stated Operating IncomeSales & Other Operating Revenues $20,000.00 - Operating Costs & Expenses $13,000.00 - Depreciation $1,000.00 - Research and Development Expenses $4,000.00 Operating Income $2,000.00Adjusted Operating Income Operating Income $ 2000.00+ R& D Expenses $ 4000.00- Amortization of Research Asset $ 2311.00Adjusted Operating Income $ 3689.00
Aswath Damodaran 201
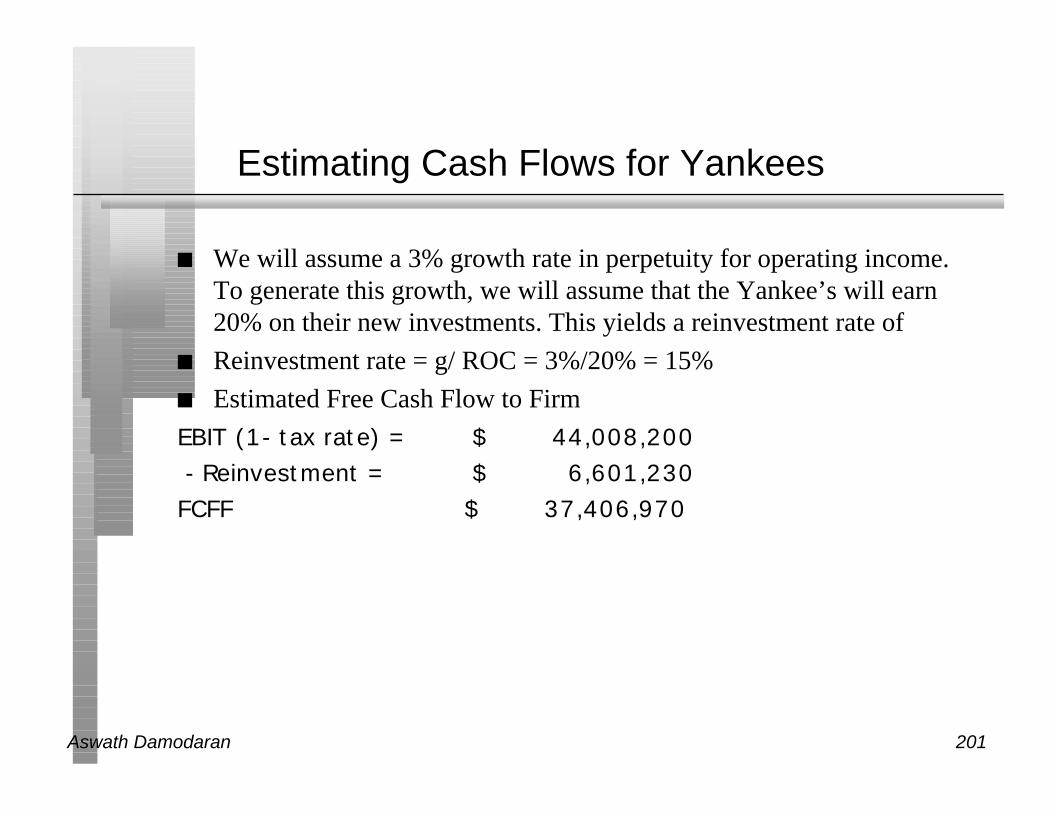
Estimating Cash Flows for Yankees
n We will assume a 3% growth rate in perpetuity for operating income.To generate this growth, we will assume that the Yankee’s will earn20% on their new investments. This yields a reinvestment rate of
n Reinvestment rate = g/ ROC = 3%/20% = 15%
n Estimated Free Cash Flow to Firm
EBIT (1- tax rate) = $ 44,008,200 - Reinvestment = $ 6,601,230 FCFF $ 37,406,970
Aswath Damodaran 202
From Cash Flows to Value
n Once you have estimated the cash flows and the cost of capital, youcan value a private firm using conventional methods.
n If you are valuing a firm for sale to a private business,• Use the total beta and the cost of equity emerging from that to estimate
the cost of capital.
• Discount the cash flows using this cost of capital
n If you are valuing a firm for an initial public offering, stay with themarket beta and cost of capital.

Aswath Damodaran 203
Valuing the Yankees
FCFF = $ 37,406,970Cost of capital = 12.26%Expected Growth rate= 3.00%
Value of Yankees = $ 37,406,970 (1.03)/(.1226-.03)= $ 415,902,192

Aswath Damodaran 204
What if?
n We are assuming that the Yankees have to reinvest to generate growth.If they can get the city to pick up the tab, the value of the Yankees canbe estimated as follows:• FCFF = EBIT (1-t) - Reinvestment = $44.008 mil - 0 = $ 44.008 million
• Value of Yankees = 44.008*1.03/(.1226 - .03) = $ 489 million
n If on top of this, we assume that the buyer is a publicly traded firm andwe use the market beta instead of the total beta• FCFF = $ 44.008 million
• Cost of capital = 8.95%
• Value of Yankees = 44.008 (1.03) / (.0895 - .03) = $ 761.6 million

Aswath Damodaran 205
Current Cashflow to FirmEBIT(1-t) : 2,933- Nt CpX 2,633- Chg WC 500= FCFF <200>Reinvestment Rate = 106.82%
Expected Growth in EBIT (1-t)1.1217*.2367 = .252825.28%
Stable Growthg = 5%; Beta = 1.20; D/(D+E) = 6.62%;ROC=17.2%Reinvestment Rate=29.07%
Terminal Value10= 6743/(.1038-.05) = 125,391
Cost of Equity11.16%
Cost of Debt(6+0.80%)(1-.35)= 4.42%
WeightsE = 93.38% D = 6.62%
Discount at Cost of Capital (WACC) = 11.16% (0.9338) + 4.42% (0.0662) = 10.71%
Firm Value: 73,909+ Cash: 500- Debt: 4,583=Equity 69,826
Riskfree Rate :Government Bond Rate = 6%
+Beta 1.29 X
Risk Premium4%
Unlevered Beta for Sectors: 1.24
Firm’s D/ERatio: 7.09%
Historical US Premium4%
Country RiskPremium0%
InfoSoft: A ValuationReinvestment Rate106.82%
Return on Capital23.67%
EBIT(1-t)- ReinvFCFF
36753926 -251
46044918 -314
57686161 -393
72277720 -493
9054 9671 -617
950727646743

Aswath Damodaran 206
Valuation Motives and the Next Step in PrivateCompany Valuation
n If valuing a private business for sale (in whole or part) to anotherindividual (to stay private), it is necessary that we estimate• a illiquidity discount associated with the fact that private businesses
cannot be easily bought and sold
• a control premium (if more than 50% of the business is being sold)
n If valuing a business for taking public, it is necessary to estimate• the effects of creating different classes of shares in the initial public offer
• the effects of options or warrants on the issuance price per share
n If valuing a business for sale (in whole or part) to a publicly tradedfirm, there should be no illiquidity discount, because stock in theparent firm will trade but there may, however, be a premiumassociated with the publicly traded firm being able to take betteradvantage of the private firm’s strengths

Aswath Damodaran 207
Analyzing the Effect of Illiquidity on Value
n Investments which are less liquid should trade for less than otherwisesimilar investments which are more liquid.
n The size of the illiquidity discount should depend upon• Type of Assets owned by the Firm: The more liquid the assets owned by
the firm, the lower should be the liquidity discount for the firm
• Size of the Firm: The larger the firm, the smaller should be size of theliquidity discount.
• Health of the Firm: Stock in healthier firms should sell for a smallerdiscount than stock in troubled firms.
• Cash Flow Generating Capacity: Securities in firms which are generatinglarge amounts of cash from operations should sell for a smaller discountsthan securities in firms which do not generate large cash flows.
• Size of the Block: The liquidity discount should increase with the size ofthe portion of the firm being sold.

Aswath Damodaran 208
Illiquidity Discounts and Type of Business
n Rank the following assets (or private businesses) in terms of theliquidity discount you would apply to your valuation (from biggestdiscount to smallest)
o A New York City Cab Medallion
o A small privately owned five-and-dime store in your town
o A large privately owned conglomerate, with significant cash balancesand real estate holdings.
o A large privately owned ski resort that is losing money

Aswath Damodaran 209
Empirical Evidence on Illiquidity Discounts:Restricted Stock
n Restricted securities are securities issued by a company, but notregistered with the SEC, that can be sold through private placementsto investors, but cannot be resold in the open market for a two-yearholding period, and limited amounts can be sold after that. Restrictedsecurities trade at significant discounts on publicly traded shares in thesame company.• Maher examined restricted stock purchases made by four mutual funds in
the period 1969-73 and concluded that they traded an average discount of35.43% on publicly traded stock in the same companies.
• Moroney reported a mean discount of 35% for acquisitions of 146restricted stock issues by 10 investment companies, using data from 1970.
• In a recent study of this phenomenon, Silber finds that the mediandiscount for restricted stock is 33.75%.

Aswath Damodaran 210
Cross Sectional Differences : Restricted Stock
n Silber (1991) develops the following relationship between the size ofthe discount and the characteristics of the firm issuing the registeredstock –LN(RPRS) = 4.33 +0.036 LN(REV) - 0.142 LN(RBRT) + 0.174 DERN +
0.332 DCUST
where,
RPRS = Relative price of restricted stock (to publicly traded stock)
REV = Revenues of the private firm (in millions of dollars)
RBRT = Restricted Block relative to Total Common Stock in %
DERN = 1 if earnings are positive; 0 if earnings are negative;
DCUST = 1 if there is a customer relationship with the investor; 0 otherwise;
n Interestingly, Silber finds no effect of introducing a control dummy -set equal to one if there is board representation for the investor andzero otherwise.

Aswath Damodaran 211
Using the Study Results to Estimate IlliquidityDiscounts
n Approach 1: Use the average liquidity discount, based upon paststudies, of 20% for private firms. Adjust subjectively for size - makethe discount smaller for larger firms.
n Approach 2: Estimate the discount as a function of the determinants -the size of the firm, the stability of cash flows, the type of assets andcash flow generating capacity. Plug in the values for your companyinto the regression to estimate the liquidity discount.

Aswath Damodaran 212
Liquidity Discount and Revenues
Effects of Increasing Revenues on Liquidity Discounts: Estimated from Silber Regression
0
0.02
0.04
0.06
0.08
0.1
0.12
0.14
0
10
20
30
40
50
60
70
80
90
10
0
20
0
30
0
40
0
50
0
60
0
70
0
80
0
90
0
10
00
20
00
Revenues ( in millions of dollars)
Esti
mat
ed R
educ
tion
in L
iqud
ity
Dis
coun
t
Marginal Reduction in Liquidity Discount Cumulative Reduction on Liquidity Discount

Aswath Damodaran 213
Losing or Making Money?
Effects of Negative Earnings
0.00%
5.00%
10.00%
15.00%
20.00%
25.00%
30.00%
35.00%
Rev=$10 m Rev=$100 m Rev = $ 1 bil Rev=$2 bil
Revenues
Liqu
idit
y D
isco
unt
PositiveNegativeEffect of Negative Earnings

Aswath Damodaran 214
Estimating the IlIiquidity Discount for theYankees
n REV : Revenues in 2000 = $ 207 million
n Liquidity Discount for small firm - with negligible revenues = 20%
n Liquidity Discount for the New York Yankees = 20% - 7.5% = 12.5%• [The 7.5% comes from the graph above, as the reduction in liquidity
discount as a function of the revenues]
n Estimated value for the Yankees in a private transaction = $416million ( 1 - 0.125) = $ 364 million
Aswath Damodaran 215
The Effects of Control
n This analysis assumes that the entire organization is up for sale.Assume now that you are buying out one of the limited partners in theYankees, who owns 10% of the organization. Would you be willing topay to pay 10% of the estimated value?
o Yes
o No
n If not, would you pay less or more than this amount?
o Less
o More
n Why?
Aswath Damodaran 216
An Alternate Approach to the IlliquidityDiscount: Bid Ask Spread
n The bid ask spread is the difference between the price at which youcan buy a security and the price at which you can sell it, at the samepoint.
n In other words, it is the illiqudity discount on a publicly traded stock.
n Studies have tied the bid-ask spread to• the size of the firm
• the trading volume on the stock
• the degree
n Regressing the bid-ask spread against variables that can be measuredfor a private firm (such as revenues, cash flow generating capacity,type of assets, variance in operating income) and are also available forpublicly traded firms offers promise.
Aswath Damodaran 217
Valuing Initial Public Offerings
n Discounted Cash Flow Approach• Value the firm and the equity in the firm using traditional discounted cash
flow models.
• From the value of the equity, subtract out the value of any non-commonstock equity claims on the firm (such as warrants and options)
• Divide the value of the equity by the total number of shares outstanding,including the shares that are retained by the existing owners of the firm
n Relative Valuation Approach• Choose a group of comparable firms
• Choose a multiple (preferably one that is widely used in the sector(
• Estimate a multiple for this firm based upon its characteristics, relative tothe comparable firms

Aswath Damodaran 218
Voting and Non-Voting Shares
n If one class of shares have no voting rights while the other class ofshares do, the difference in voting rights, other things being equal,should make the latter more valuable.
n The difference in value should be a function of the value of controllingthe firm.

Aswath Damodaran 219
A General Framework for Valuing Control
n The value of the control premium that will be paid to acquire a blockof equity will depend upon two factors -• Probability that control of firm will change: This refers to the
probability that incumbent management will be replaced. this can beeither through acquisition or through existing stockholders exercisingtheir muscle.
• Value of Gaining Control of the Company: The value of gainingcontrol of a company arises from two sources - the increase in value thatcan be wrought by changes in the way the company is managed and run,and the side benefits and perquisites of being in control
Value of Gaining Control = Present Value (Value of Company with changein control - Value of company without change in control) + Side Benefitsof Control

Aswath Damodaran 220
Determinants of Probability of ControlChanging
n Legal Restrictions on Takeovers: The greater the legal restrictions ontakeovers the smaller the probability of control changing.
n Anti-takeover and Pro-incumbent restrictions in corporatecharter: The greater the restrictions on takeovers and on changes inincumbent management the lower the probability of control changing.
n Market Attitudes towards Control Changes: The probability ofcontrol changing will be much greater is markets accept and welcomechallenges to incumbent management’s authority.
n Size of stock holding controlled by incumbent management: Thegreater the proportion, the lower the probability of control changing.
n Diffusion of Holdings: One might be able to exert control with lessthan 51%, if shares are widely held.
n Relative numbers of voting and non-voting shares: The greater thenumber of voting shares, relative to non-voting shares, the smaller isthe control premium per share.

Aswath Damodaran 221
Determinants of Value of Control Changing
n Quality of Incumbent Management: To the degree that the companyis well managed and well run under the incumbent management, thereis no increase in value that flows from gaining control of the company.A badly managed company might provide much more opportunity forvalue creation from changes in management and financial policy.
n Ease with which changes in management can be made: Acquiringcontrol is not the same thing as exercising control. The easier it is toexercise control, the greater will be the value to the control. Thedifficulty of exercising control will generally increase with the size ofthe firm and with the number of lines of business it is in. It is mucheasier to go into a small firm with one line of business and change theway it is run, than it is to do the same with a larger and morediversified organization. While control may still be exercisedeventually, the present value of the increased control will be muchsmaller .

Aswath Damodaran 222
Empirical Studies on Voting versus Non-VotingShares
n Studies that compare the prices of traded voting shares against theprices of traded non-voting shares, to examine the value of the votingrightsconclude that while the voting shares generally trade at apremium over the non-voting shares, the premium is small.• Lease, McConnell and Mikkelson (1983) find an average premium of
only 5.44% for the voting shares. (There are similar findings in DeAngeloand DeAngelo (1985) and Megginson (1990))
• These studies have been critiqued for underestimating the value ofcontrol, because the probability of gaining control by acquiring thesevoting shares is considered low for two reasons - first, a substantial blockof the voting shares is often still held by one or two individuals in many ofthese cases, and second, the prices used in these studies are based uponsmall block trades, which are unlikely to give the buyer majority control.
Aswath Damodaran 223
A Test: Reader’s Digest
n Reader’s Digest has two classes of shares outstanding - voting andnon-voting. These are the additional facts:• The company has seen its stock price drop substantially over the last 3
years, and analysts believe that the company’s valuable brand name is notbeing used well by incumbent management
• Of the outstanding voting shares, 71% is held by two charitableinstitutions, which are controlled by the current CEO of the firm.
n Would you expect the voting shares to trade at a significant premiumover the non-voting shares?
o Yes
o No

Aswath Damodaran 224
Valuing Estee Lauder

Aswath Damodaran 225
Estee Lauder: Comparables
Company Beta Price # Shares EPS BV /share Sales/share ROE Net Margin Payout Exp. GrowthAlberto Culver 0.85 30 27.8 2.1 15.1 54.85 14.00% 3.80% 17% 11%Avon Products 1.3 72 65 4.75 3.55 76.9 136.96% 6.30% 48% 12.50%BIC Corporation 0.65 40 23.56 2.7 13.8 23.75 19.50% 11.50% 38% 10.50%Carter-Wallace 1.2 12 46.2 0.8 8.25 14.95 10.50% 5.50% 22% 7.50%Gillette 1.25 49 444 2.15 7.15 16.85 29.00% 12.80% 33% 17%Helen of Troy 0.95 18 6.45 2.25 17.8 28.5 13.00% 8.20% 0 13%Helene Curtis 0.85 30 9.9 2.3 25.85 138.9 8.50% 1.60% 14% 8.50%Tambrands 1.05 44 36.65 2.75 3.55 19.6 76.92% 13.90% 69% 15.00%Jean Philippe Fragrances 1.9 11 10.24 0.7 4.35 7.33 16.30% 9.70% 0 20%
Estee Lauder 1.11 ? 114.6 0.9 3.13$ 25.30$ 28.74% 3.56% 37.78% 25%
Aswath Damodaran 226
Estee Lauder: PE ratio comparison
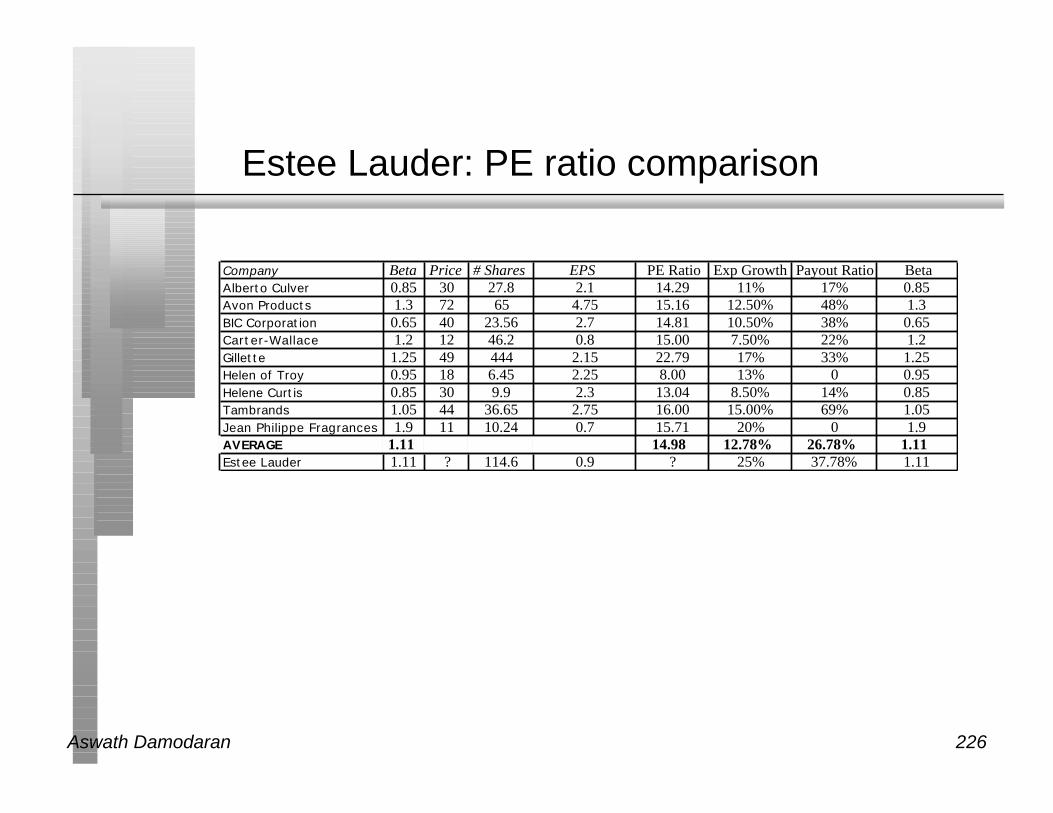
Company Beta Price # Shares EPS PE Ratio Exp Growth Payout Ratio BetaAlberto Culver 0.85 30 27.8 2.1 14.29 11% 17% 0.85Avon Products 1.3 72 65 4.75 15.16 12.50% 48% 1.3BIC Corporation 0.65 40 23.56 2.7 14.81 10.50% 38% 0.65Carter-Wallace 1.2 12 46.2 0.8 15.00 7.50% 22% 1.2Gillette 1.25 49 444 2.15 22.79 17% 33% 1.25Helen of Troy 0.95 18 6.45 2.25 8.00 13% 0 0.95Helene Curtis 0.85 30 9.9 2.3 13.04 8.50% 14% 0.85Tambrands 1.05 44 36.65 2.75 16.00 15.00% 69% 1.05Jean Philippe Fragrances 1.9 11 10.24 0.7 15.71 20% 0 1.9AVERAGE 1.11 14.98 12.78% 26.78% 1.11Estee Lauder 1.11 ? 114.6 0.9 ? 25% 37.78% 1.11

Aswath Damodaran 227
Estee Lauder: PE Ratio Analysis
n Simple Approach: The average PE/growth rate for the sector is 1.17,obtained by dividing the average PE ratio by the average growth rate.Applying this PEG ratio to Estee Lauder, we get:
Estimated PE ratio = 1.17*25 = 29.31
Estimated Price per share = 29.31*0.90 =$ 26.38• Assumes firms are of equivalent risk and have similar cash flow patterns.
• It also assumes that growth and PE are linearly related
n Regression Approach: A regression of PE against growth, payout andrisk yields the following:
PE = 10.17 + 37.62 g R2=15.86%
Estee Lauder's Predicted PE ratio (based upon regression)
= 10.17 + 37.62(.25)= 19.58
Estee Lauder’s Predicted Price = 19.58*0.90 = $ 17.62

Aswath Damodaran 228
Estee Lauder: PBV ratios of Comparable Firms
Company Beta Price # Shares BV /share PBV Ratio Exp Growth Payout Ratio Beta ROEAlberto Culver 0.85 30 27.8 15.1 1.99 11% 17% 0.85 14.00%Avon Products 1.3 72 65 3.55 20.28 12.50% 48% 1.3 136.96%BIC Corporation 0.65 40 23.56 13.8 2.90 10.50% 38% 0.65 19.50%Carter-Wallace 1.2 12 46.2 8.25 1.45 7.50% 22% 1.2 10.50%Gillette 1.25 49 444 7.15 6.85 17% 33% 1.25 29.00%Helen of Troy 0.95 18 6.45 17.8 1.01 13% 0 0.95 13.00%Helene Curtis 0.85 30 9.9 25.85 1.16 8.50% 14% 0.85 8.50%Tambrands 1.05 44 36.65 3.55 12.39 15.00% 69% 1.05 76.92%Jean Philippe Fragrances 1.9 11 10.24 4.35 2.53 20% 0 1.9 16.30%AVERAGE 1.11 5.62 12.78% 26.78% 1.11 36.08%Estee Lauder 1.11 ? 114.6 3.13 ? 25% 37.78% 1.11 28.74%
Aswath Damodaran 229
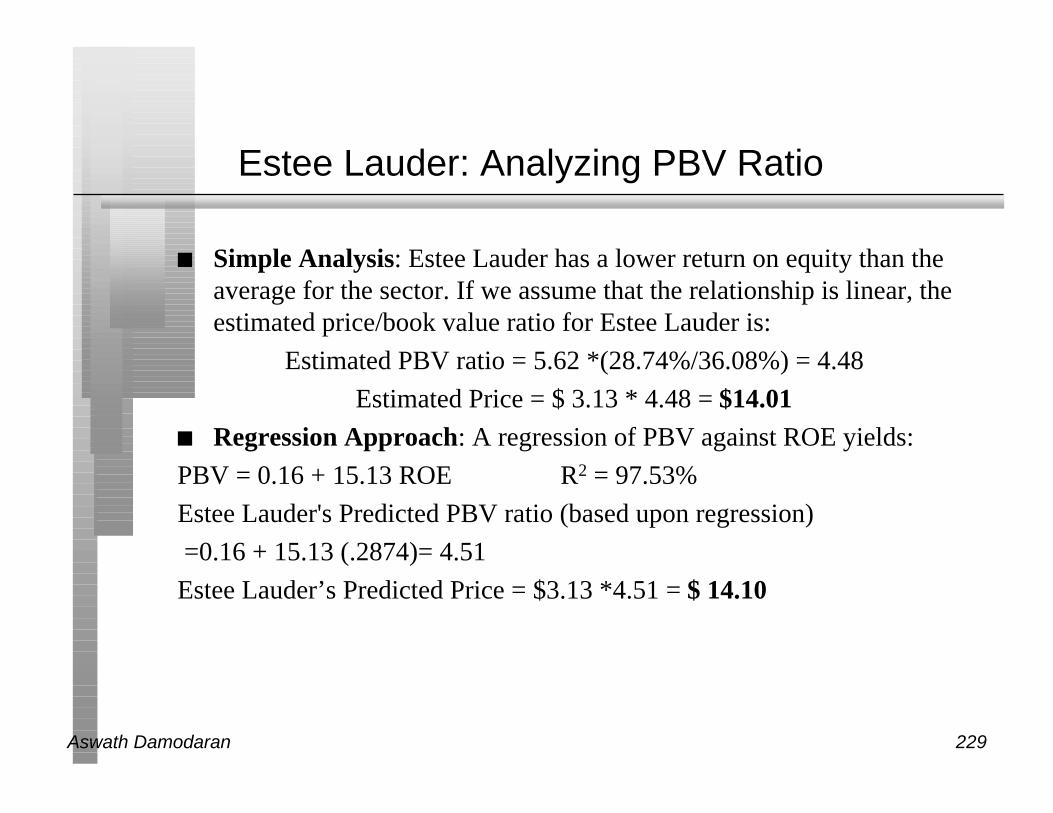
Estee Lauder: Analyzing PBV Ratio
n Simple Analysis: Estee Lauder has a lower return on equity than theaverage for the sector. If we assume that the relationship is linear, theestimated price/book value ratio for Estee Lauder is:
Estimated PBV ratio = 5.62 *(28.74%/36.08%) = 4.48
Estimated Price = $ 3.13 * 4.48 = $14.01n Regression Approach: A regression of PBV against ROE yields:
PBV = 0.16 + 15.13 ROE R2 = 97.53%
Estee Lauder's Predicted PBV ratio (based upon regression)
=0.16 + 15.13 (.2874)= 4.51
Estee Lauder’s Predicted Price = $3.13 *4.51 = $ 14.10

Aswath Damodaran 230
Estee Lauder: PS Ratios of Comparable Firms
Company Beta Price # Shares Sales/share PS Ratio Exp Growth Payout Ratio Beta MarginAlberto Culver 0.85 30 27.8 54.85 0.55 11% 17% 0.85 3.80%Avon Products 1.3 72 65 76.9 0.94 12.50% 48% 1.3 6.30%BIC Corporation 0.65 40 23.56 23.75 1.68 10.50% 38% 0.65 11.50%Carter-Wallace 1.2 12 46.2 14.95 0.80 7.50% 22% 1.2 5.50%Gillette 1.25 49 444 16.85 2.91 17% 33% 1.25 12.80%Helen of Troy 0.95 18 6.45 28.5 0.63 13% 0 0.95 8.20%Helene Curtis 0.85 30 9.9 138.9 0.22 8.50% 14% 0.85 1.60%Tambrands 1.05 44 36.65 19.6 2.24 15.00% 69% 1.05 13.90%Jean Philippe Fragrances 1.9 11 10.24 7.33 1.50 20% 0 1.9 9.70%AVERAGE 1.11 1.27 12.78% 26.78% 1.11 8.14%Estee Lauder 1.11 ? 114.6 25.3 ? 25% 37.78% 1.11 3.56%

Aswath Damodaran 231
Estee Lauder: Analyzing PS Ratio
n Simple Analysis: Estee Lauder has a lower margin than the averagefor the sector. If we assume that the relationship is linear, the estimatedprice/sales value ratio for Estee Lauder is:
Estimated PS ratio = 1.27 *(3.56%/8.14%) = 0.56
Estimated Price = $ 25.30 * 0.56 = $ 14.10n Regression Approach: A regression of PBV against ROE yields:
PS = -0.28 + 19.09 Margin R2 = 82.27%
Estee Lauder's Predicted PS ratio (based upon regression)
=- 0.28 + 19.09 (.0356)= 0.40
Estee Lauder’s Predicted Price = $ 25.30 *0.40 = $ 10.12

Aswath Damodaran 232
Estee Lauder: Summing up the Estimates
Approach ValueDiscounted Cashflow Models
Dividend Discount Model $ 16.68
FCFE Discount Model $ 17.63
Relative Valuation Models
PEG Ratio: Simple $26.31
PE ratio: Regression $17.62
PBV Ratio: Simple $ 14.01
PBV Ratio: Regression $ 14.10
PS Ratio: Simple $ 14.10
PS Ratio: Regression $ 10.12

Aswath Damodaran 233
What would you do?
n If you were one of the investment bankers taking the company public,which of the valuation approaches would you use and why? Whatprice would you put on the IPO?
n If you were a long term investor interested in Estee Lauder, what pricewould you be willing to pay for the stock?