private and public merger waves - faculty &...
TRANSCRIPT
THE JOURNAL OF FINANCE • VOL. LXVIII, NO. 5 • OCTOBER 2013
Private and Public Merger Waves
VOJISLAV MAKSIMOVIC, GORDON PHILLIPS, and LIU YANG∗
ABSTRACT
We document that public firms participate more than private firms as buyers andsellers of assets in merger waves and their participation is affected more by creditspreads and aggregate market valuation. Public firm acquisitions realize higher gainsin productivity, particularly for on-the-wave acquisitions and when the acquirer’sstock is liquid and highly valued. Our results are not driven solely by public firms’better access to capital. Using productivity data from early in the firm’s life, wefind that better private firms subsequently select to become public. Initial size andproductivity predict asset purchases and sales 10 and more years later.
PRIOR RESEARCH ESTABLISHES THAT the market for corporate assets is procycli-cal. Mergers and acquisitions tend to cluster in time.1 However, what causesfirms to participate in these waves, and whether acquisitions that occur on thewaves lead to the same efficiency outcomes as mergers that occur off the waves,remain open questions. The extent to which private firms participate in mergerwaves and whether their participation is affected by similar demand and sup-ply factors that affect public firms also remain unanswered. At one extreme,acquisition waves may occur because investment opportunities also occur in
∗Maksimovic and Yang are from the University of Maryland and Phillips is from the Universityof Southern California and NBER. This research was supported by NSF grant #0965328 and wasconducted while the authors were Special Sworn Status researchers of the U.S. Census Bureau atthe Center for Economic Studies. We would like to thank the Editor (Cam Harvey), an anonymousreferee, and an Associate Editor for many helpful comments. In addition we wish to thank Jose-Miguel Gaspar, Jarrad Harford, David Robinson, and seminar participants at Florida State Uni-versity, Norwegian School of Economics and Business Administration, UCLA, University of ParisDauphine, IFN conference at Stockholm, York University, University of California at Riverside,University of Rochester, California Corporate Finance Conference, UCLA/USC Annual Conference,NBER Corporate Finance Group, UBC 2010 Summer Conference, University of Virginia, Washing-ton University 2010 Corporate Finance Conference, and the WFA 2010 meetings. We also thankresearchers at the Center for Economic Studies for their helpful comments, and Antonio Falatoat the Federal Reserve for providing data on Commercial and Industrial (C&I) loan rates. Re-search results and conclusions expressed are those of the authors and do not necessarily reflect theviews of the Census Bureau. This paper has been screened to ensure that no confidential data arerevealed.
1 Mitchell and Mulherin (1996) and Harford (2005) analyze merger waves by public firms. Netter,Stegemoller, and Wintoki (2011) show that when including small deals and private acquirers thispattern is much smoother than the pattern with only large and public deals. See Andrade, Mitchell,and Stafford (2001) and Betton, Eckbo, and Thorburn (2008) for two surveys on the overall mergermarket.
DOI: 10.1111/jofi.12055
2177

2178 The Journal of Finance R©
waves. At the other extreme, waves may be driven by changes in liquidity andinvestment climate that allow certain types of firms to obtain capital more eas-ily or cheaper than other firms. Thus, public firms may take advantage of highvaluations in the stock market to buy assets.
The central contribution of this paper is to show how and why real andfinancial factors affect public and private firms differently in their acquisitionand asset sale behavior. We examine the impact of real and financial factors bycomparing the participation of public and private firms in merger waves andtheir outcomes. Using plant-level data on a sample of approximately 40,000firms over the 1977 to 2004 period, we compare how public and private firmsparticipate in merger waves and the outcomes of the mergers. We find sharpdifferences between these two groups. Public firms purchase and sell assets ata higher intensity than private firms. This is true even after controlling for firmsize and plant productivity. Moreover, there exists a notable difference betweenthese two types of firms’ acquisition decisions over the business cycle. Publicfirms are almost twice as likely to buy and sell assets in wave years than innonwave years, while the transactions of private firms are much flatter overtime. To a large extent, the observed merger and acquisition waves are drivenby higher participation of public firms.
Both efficiency and valuation affect acquisition decisions. Firms with higherproductivity are more likely to buy assets and firms with lower productivityare more likely to sell assets. The productivity–acquisition relation is strongerfor public firms than for private firms. In addition, for public firms, acquisitiondecisions are also influenced by stock market conditions. Public firms withhigher unexplained valuation (or misvaluation) and stock liquidity participatemore in acquisitions.
We show that credit market liquidity, as measured by the spread betweenCommercial and Industrial (C&I) loans and the Fed Funds rate, has a signif-icant effect on merger intensity. In addition to productivity, private firms areless sensitive to credit spreads than public firms, suggesting that, while pro-ductivity matters, private firms’ financing constraints may also be sufficientlybinding and cannot be relaxed even at times of high liquidity.
To further study how the credit spread interacts with financial constraints inaffecting acquisition decisions, we divide our sample of public firms into groupsbased on the level of potential borrowing constraints. We use credit ratingstatus (investment grade, below investment grade, and nonrated) to measurea firm’s liquidity in the debt market and use stock liquidity (based on theAmihud illiquidity index) to measure the firm’s liquidity in the stock market.We find that public firms with intermediate access to financial markets (debtor equity) have the highest sensitivity. However, public firms that are morelikely to be constrained (nonrated and with a high illiquidity index) havegreater sensitivity to industry-level financial factors than private firms. Thus,our finding suggests that access to the financial market and market liquidityare important drivers for merger waves through the cost of accessing externalfinancing.

Private and Public Merger Waves 2179
We also take direct account of the fact that the decision to acquire public sta-tus is itself a choice variable. If public status confers advantages in financingmergers or accessing capital, firms may self-select into public status in antic-ipation of future acquisitions. Indeed, we find that firms that are larger andmore productive at birth choose to go public, participate more in acquisitions,and are more wave-driven. Controlling for the probability of being public (or“public quality”) based on initial conditions, the difference in participation ratesbetween public and private firms declines. Specifically, public quality explainsmore than 27% of the difference in acquisitions and 91% of the difference inasset sales between public and private firms.
Our results show that the difference in public and private firms’ acquisitionactivity is not simply due to the public firms’ better access to financial markets.While better access to markets and lower cost of capital may help public firmsparticipate in acquisitions, they are not the fundamental reasons why publicand private firms differ in their acquisition behavior. Rather, differences in firmquality enable some firms to grow through productivity-enhancing acquisitions,and these differences are reflected in their earlier choice of obtaining publicstatus.
We find that acquisitions are efficiency improving, both on and off the wave.Plants acquired gain more in productivity compared to similar plants that arenot sold. Productivity increases are higher for on-the-wave mergers, and inparticular, when the buyer and seller are both public firms and when the buyeris highly valued with more liquid stock. We thus do not find evidence that theincreased occurrence of public mergers in waves leads to misallocation of assets.Instead, our findings suggest that periods of more frequent transactions andgreater stock valuation are associated with ex post efficiency improvements.The evidence is consistent with public buyers paying for synergies as theyare more likely to buy with highly valued stock but still make productivityimprovements ex post.
We find that firms with high unexplained valuation relative to current fun-damentals are indeed more likely to buy assets. This result is consistent withthe notion in Rhodes-Kropf and Viswanathan (2004) that firms cannot tellthe difference between overvalued stock and high productivity of other firmsand therefore high valuations facilitate acquisitions, even if potentially at thewrong price. We find that acquirers with high unexplained valuation also expe-rience greater subsequent productivity gains following the acquisitions. Thus,while acquirers may pay or fund their purchases with highly valued equity, thepurchases are not without merit and improve the allocation of resources in theeconomy.
As a robustness check, we also separate transactions into partial- and whole-firm acquisitions and find that firms with high unexplained valuation areequally likely to engage in partial-firm purchases as they are whole-firm acqui-sitions. Since the former are more likely to be paid in cash and less affected bystock valuation, our finding supports the idea that firms with high valuationface better opportunities and are more likely to engage in acquisitions.

2180 The Journal of Finance R©
Our paper builds on the rapidly growing literature on merger waves. Clus-tering of mergers by public firms in time and industry has been studied byMitchell and Mulherin (1996), Mulherin and Boone (2001), Andrade, Mitchell,and Stafford (2001), and Harford (2005). Netter, Stegemoller, and Wintoki(2011) examine a large sample of mergers that includes small deals and pri-vate acquirers, and find that these deals are smoother over time. Dittmar andDittmar (2008) and Rau and Stouraitis (2011) show that corporate financ-ing events including mergers come in waves. Shleifer and Vishny (2003) andRhodes-Kropf, Robinson, and Viswanathan (2005) argue that merger wavesare driven by misvaluation in financial markets, while Harford (2005) placesgreater reliance on availability of liquidity. Schlingemann, Stulz, and Walkling(2002) find that firms are more likely to sell assets in periods of high industryliquidity. Moeller, Schlingemann, and Stulz (2006) show that acquisitions madeduring merger waves create value for acquiring shareholders on average de-spite a small number of acquisitions with extremely large losses. Eisfeldt andRampini (2006) identify liquidity as the reason why asset sales are procyclical.
Our paper differs from existing studies in several respects. First, we studyboth public and private firms using a comprehensive data set from the Cen-sus Bureau. By comparing participation and outcomes of public and privateacquisitions on and off the wave, we can directly analyze the effect of marketvaluation, liquidity, and access to the financial market on acquisition decisions.
Second, we use detailed plant-level input and output data to estimate pro-ductivity for both public and private firms. As a result, we obtain estimates ofthe economic value created by mergers that are not affected by over- or under-payment between buyers and sellers. These data give us a better platform tocompare efficiency implications of mergers on and off the wave, and by publicand private firms.
Third, the unique and separate plant and firm identifiers in the Census dataset allow us to pin down exactly which plants within a firm have changedownership, and thus we can directly assess the outcome of an acquisition bycomparing productivity changes for those plants. In comparison, most existingstudies draw their conclusions based on performance changes in the entireacquirer firm, which confounds the performance changes of the acquired unitswith those of the acquirer’s own units.
Our work is related to several recent papers. Yan (2006) and Duchin andSchmidt (2008) analyze the value created by on- and off-the-wave mergers.They find that on-the-wave mergers are more likely to be value destroying asreflected by acquirer stock returns. By contrast, we find that on average on-the-wave mergers of public firms increase productivity of the acquired plants.The two findings are not inconsistent, in that acquiring firms may overpayfor real synergies. However, our results show that the transactions increaseoverall efficiency in the economy.
Our results are also related to several papers that document higher ac-quisition activity for firms that recently had IPOs (Brau and Fawcett (2006),Hovakimian and Hutton (2008), and Celikyurt, Sevilir, and Shivdasani (2010)).While this finding does not prove that a primary motivation for IPOs is to

Private and Public Merger Waves 2181
enable firms to make acquisitions, it does suggest that, for young firms at thevery least, public status facilitates acquisitions. Our paper complements andextends these papers in several important ways. Consistent with these papers,we also find that firms undertake more acquisitions in the first 5 years aftergoing public. In addition, we find that acquirers that recently went public re-alize similar productivity gains on their purchased plants, compared to otherpublic firms, on or off the wave. Different from these papers, we show thatinitial conditions in the early pre-IPO stage can predict both public status andsubsequent acquisition activities years afterwards. Furthermore, we analyzedecisions to sell assets, and find significant differences between public and pri-vate firms based on fundamentals and financial conditions consistent with ourarguments.2
Our paper joins the emerging literature on private firms. Brav (2009) exam-ines financing decisions of private firms and Asker, Farre-Mensa, and Ljunqvist(2010, 2011) compare investment decisions of public and private firms. How-ever, these studies are not able to control for self-selection into public status.They match firms based on recent size data, which may imply matching suc-cessful private firms with less successful public firms. In contrast to the Askeret al. studies, we find a benefit of public market status. We show that publicfirms increase the productivity of the assets they purchase more than privatefirms. We thus contribute to the literature by providing evidence on acquisitiondecisions between public and private firms and the differential effect over thebusiness cycle.
The remainder of the paper proceeds as follows. Section I presents ourempirical framework including research questions addressed by our study,our estimation strategy, and theoretical predictions related to merger waves.Section II provides a description of the data, variables, and summary statistics.We endogenize the decision to be public in Section III. Section IV compares de-cisions to participate in mergers and acquisitions by public and private firms.Section V examines changes in productivity around transactions, and SectionVI concludes.
I. Empirical Framework
One explanation for the phenomenon of procyclical merger waves is that thegains from the reallocation of assets across firms are also procyclical. How-ever, merger waves may also be driven by conditions in the financial markets.Harford (2005) argues that waves occur in part because it is easier to raiseexternal capital at a lower cost when the economy is improving. For publicfirms, periodic stock market misvaluation can be an alternative cause of mergerwaves. Shleifer and Vishny (2003) and Rhodes-Kropf and Viswanathan (2004)
2 Our empirical results are not driven by mergers of recently public firms. We do find thatrecently public firms have a higher acquisition rate. However, such transactions are only a smallportion of our sample of public firm acquisitions and the outcomes of those transactions are notdifferent from those of the rest of the sample.

2182 The Journal of Finance R©
0
10
20
30
40
50
60
70
80
90
100
0
0.02
0.04
0.06
0.08
0.1
0.12
# of Ind. Waves% of Transaction
IW Public Buyer Private Buyer
Figure 1. Transactions over time. This figure plots the time series for the rate of acquisitionsamong U.S. manufacturing firms over the 1977 to 2004 period. The two lines present the percentageof transactions made by public firms (diamond) and private firms (square). The bars show thenumber of industries having industry-wide merger waves. Industry merger waves are defined asyears when the rate of transactions within an industry is at least one standard deviation above itssample mean.
suggest that higher valuations in the equity market make equity-financed ac-quisitions more attractive. Using samples of publicly traded firms in the UnitedStates, Harford (2005) and Rhodes-Kropf, Robinson, and Viswanathan (2005)find support for liquidity and misvaluation hypotheses, respectively.
Much less is known about mergers by private firms.3 Comparing acquisitionactivities of public and private firms over the business cycle helps us shed lighton how fundamentals and financial markets may affect firms’ decisions. Fromour data (described fully in the next section), we are able to identify mergerand acquisition decisions of both public and private firms. Figure 1 plots thetime series for the rate of purchases and sales of U.S. manufacturing plantsover the 1977 to 2004 period.
There exists a remarkable difference between public and private firms intheir acquisition rates over the business cycle. As shown in Figure 1, publicfirms are almost twice as likely to buy assets in aggregate wave years than innonwave years while purchases by private firms are much flatter. The observedaggregate merger waves are driven to a large extent by higher participation ofpublic firms. This finding is consistent with the pattern found by Betton, Eckbo,and Thorburn (2008) using publicly available data on public and nonpublicbidders.
3 Brav (2009) shows that British public and private firms differ systematically in their financialand investment policies, but does not address their merger activity.

Private and Public Merger Waves 2183
A. Initial Statistics: Public and Private Participation in Merger Waves
In this section we provide basic summary statistics on merger and acquisitionactivities of both public and private firm using our data—described fully in thenext section—from U.S. manufacturing industries.
We identify merger and acquisition waves at the aggregate economy level aswell as at the industry level using the following procedure. For each industry,based on three-digit SIC code, we first calculate the percentage of plants tradedbetween firms each year. We then calculate the standard deviation of thisannual percentage over all years. Industry merger wave years are definedas years in which the percentage of plants traded is at least one standarddeviation higher than the industry mean rate. To identify aggregate waveyears, we use a similar method, except that the mean rate and the standarddeviation are calculated using all plants in the economy. Aggregate mergerwave years are years in which the percentage of plants traded is greater thanone standard deviation above the aggregate mean rate. Using Census data for2,957 industry-years from 1977 to 2004, we identify six aggregate wave years,1986, 1987, 1996, 1998, 1999, and 2000, and 432 industry wave years.
Table I presents summary statistics on aggregate merger waves.First, public firms participate in acquisitions more than private firms in gen-
eral, with a larger difference in on-the-wave years. On average, public firmsoperate 20% of the firms in our sample, but account for 37% of the total trans-actions. During aggregate wave years, 42% of buyers and 40% of sellers arepublic firms, as compared to 35% and 30%, respectively, off the wave.
Second, the number of public-to-public transactions increases more than anyother type of transaction during aggregate wave years. In particular, 19% of alltransactions on the wave are between public firms, up from 12% off the wave.In contrast, private-to-private transactions account for 37% all transactions onthe wave, a sharp decrease from 48% off the wave.
The increase in the proportion of public buyers is consistent with the con-jecture that during waves financial constraints on public firms are relaxed.However, the proportion of transactions from public firms to private firms in-creases from 18% to 21%, whereas the reverse flow, from private sellers to pubicbuyers, increases by only 1%, from 23% to 24%. Thus, we do not find evidencethat more assets transfer from private to public firms during merger waves.On-the-wave transactions cannot therefore be explained just by a relative in-crease in access to capital by public firms relative to private firms—they mayalso be affected by changes in relative productivity between public and privatefirms.
Public firms also engage in bigger transactions than private firms—the aver-age number of plants sold in a public-to-public transaction is 3.19 on the waveand 2.48 off the wave, compared to 1.38 and 1.42 in private-to-private trans-actions. About 26% of all public-to-public transactions on the wave involve fullownership transfer (mergers), while only 18% off the wave do so. In contrast,about three-quarters of all private-to-private transactions are mergers, bothon and off the wave.

2184 The Journal of Finance R©
Table ISummary Statistics: Public and Private Merger Waves
This table presents summary statistics on participation over the merger waves. Panel A presentsthe percentage of plants in transactions by public status. We use the number of plants ownedby public (private) firms as the denominator to calculate the rate for public (private) buyers andsellers. Panel B shows the composition of all transactions and Panel C presents summary statisticson the size and type of transactions. D Wave is an indicator variable that equals one for aggregatemerger wave years and zero otherwise. Aggregate wave years are years in which the percentageof plants traded is greater than one standard deviation above the aggregate mean. We classify alltransactions into two categories: asset acquistions and mergers.
Panel A: Percentage of Plants in Transactions
Public Firms Private Firms
D Wave Buyers Sellers Buyers Sellers
0 4.16% 3.39% 3.74% 4.21%1 7.41% 5.94% 5.06% 6.27%Average 4.88% 3.95% 4.03% 4.66%
Panel B: Number of Transactions
Buyer D Wave = 0 D Wave = 1
Private 22,470 (65%) 8,374 (58%)Public 11,892 (35%) 6,179 (42%)Total 34,362 14,553
Seller D Wave = 0 D Wave = 1
Private 24,127 (70%) 8,787 (60%)Public 10,235 (30%) 5,766 (40%)Total 34,362 14,553
Transaction D Wave = 0 D Wave = 1
Public buyer public seller 4,129 (12%) 2,726 (19%)Public buyer private seller 7,763 (23%) 3,453 (24%)Private buyer public seller 6,106 (18%) 3,040 (21%)Private buyer private seller 16,364 (48%) 5,334 (37%)Total 34,362 14,553
Panel C: Size and Type of Transactions
Number of Plants Bought Percent of Mergers
Transaction D Wave = 0 D Wave = 1 D Wave = 0 D Wave = 1
Public buyer public seller 2.48 3.19 18% 26%Public buyer private seller 2.01 2.13 72% 78%Private buyer public seller 1.74 1.94 8% 11%Private buyer private seller 1.42 1.38 74% 74%Average 1.67 1.84 58% 57%

Private and Public Merger Waves 2185
Industry wave years and aggregate wave years are highly correlated. Theaggregate waves are driven by many industries having waves at the same time.The probability of having an industry wave is about one-third (33%) when theaggregate economy is on wave, and is less than one-tenth (9.4%) in off-the-waveyears. Moreover, one additional industry on the wave increases the odds ratioof other industries being on the wave by 6%.
B. Public Status and Participation in Merger Waves
The fact that public firms’ merger activity is more cyclical suggests thataccess to financial markets facilitates merger waves. However, public status isendogenous. Firms may choose to go public to have better access to financialmarkets. More specifically, by going public a firm acquires an option to obtainpublic financing at some future date at the prevailing rates, thereby loweringthe cost of capital for acquisitions. This option is more valuable when a firmperceives greater future need for external capital, either for investment oracquisitions. Thus, the observed difference between public and private firms inacquisition can also reflect the difference in initial firm quality. In this section,we outline a framework that permits us to empirically examine how access topublic financial markets and investment opportunities affect mergers decisionsgiven initial firm quality and demand and financing shocks.
Firms are founded by entrepreneurs who differ in their vision, managerialtalent, or initial capital. Some firms have the potential to become significantplayers in their industries. Others, with less able entrepreneurs, niche prod-ucts, or small-firm-dominated industries will most likely stay small. Early inthe life of the firm, the entrepreneur receives a signal about the firm’s prospectsand decides whether to go public now or later with a high probability. On theone hand, public status offers financing advantages such that if the firm goespublic it has the option to access public markets at a future date and acquireother firms at a lower cost.4 On the other hand, public status is costly to acquireinitially (i.e., including direct and indirect costs of an IPO) and, due to report-ing and governance regulations, has a per-period cost to maintain. Given thesetrade-offs, entrepreneurial firms that are initially larger, more productive, andin industries with higher capital intensity or significant growth opportunitiesare more likely to go public.
Since public status is an endogenous choice, to compare public and privatefirms in their acquisition decisions it is important to separate out the followingthree distinct sources of differences between them.
First, we expect differences in acquisition activity purely on the basis ofdifferences in fundamentals. Because larger and more productive firms mayselect public status, we expect a sample of public firms to engage in more
4 The firm has the option to postpone an IPO to a future date. This is not essential to our mainargument and empirical tests. However, it is consistent with the finding by Celikyurt, Sevilir,and Shivdasani (2010) and Hovakimian and Hutton (2008) that IPOs are frequently followed byacquisition activity within a short span.

2186 The Journal of Finance R©
acquisitions, all other things being equal. This is purely a selection effect andwill be reflected in differences in the values of the explanatory variables in thesubsamples of public and private firms.
Second, public status may cause a disparity in the elasticity of acquisition ac-tivity with respect to demand shocks in the industry. Maksimovic and Phillips(2001, 2002) and Yang (2008) argue that demand and productivity shocks causefirms’ comparative advantage in an industry to shift. Specifically, positive de-mand shocks cause the optimal capacity of productive firms to expand relativeto that of less productive firms. As a result, assets will flow from less to more pro-ductive firms following the positive demand shock. To the extent that more pro-ductive firms self-select into public status, following a positive industry shockthe rate of public acquisitions will increase relative to private acquisitions.
Third, public and private firms may be affected differently by financial mar-ket shocks. Public firms can access public financial markets, especially for long-term capital, at more favorable or easier terms while private firms rely more onshort-term financing from financial intermediaries (Brav (2009)). Faulkenderand Peterson (2006) show that public firms with higher bond ratings also havebetter access to public bond markets. Such access might be needed both to fi-nance cash offers and to refinance the debt of target firms that comes due upona change in control. Public firms’ incentives to merge may also be driven by mis-pricing in public markets, analyzed by Rhodes-Kropf and Viswanathan (2004),possibly in conjunction with agency problems (Shleifer and Vishny (2003)). Inaddition, public firms, especially those with liquid stock, can use equity as amedium of exchange to finance their acquisitions while the same option usuallyis not available for privately held firms.
However, the comparative effect of shocks such as the narrowing creditspreads on private and public firms cannot be predicted a priori. If increasedliquidity in the market relaxes private firms’ financing constraints more thanthose of public firms, then, all else equal, macro liquidity shocks will have agreater effect on the participation of private firms. However, if liquidity shocksoccur when private firms have fewer growth opportunities relative to publicfirms as a result of differences in their respective productivity, increases inmarket liquidity will be associated with an increase in the ratio of public toprivate acquisitions.
We use the following basic model to examine the decision to buy or sellassets:
mit+1 = F(δ0 Pit + δ1 Xit + δ2 Zt + δ3(Pit Xit) + δ4(Pit Zt) + εit), (1)
where mit+1 is one if firm i engages in a purchase (sale) of assets at time t + 1and zero otherwise; Xit includes firm-specific variables (including productivity,size, stock market valuation, and liquidity) together with industry variables;Zt includes macroeconomic conditions or indicators for merger waves; Pit is anindicator variable for public status, which we predict later with firm initialconditions at firm birth; εit is a random error; and F(.) is a nonlinear limiteddependent variable in parametric form.

Private and Public Merger Waves 2187
Model (1) divides the difference in acquisition decisions between public andprivate firms into three distinct sources as mentioned above. First, the coeffi-cient δ1 captures the effect of firm characteristics, such as size and productivityfirms. These characteristics will differ across the population of private andpublic firms as firms self-select to go public. Second, public status may cause adifference in the elasticity of acquisition activity with respect to measured firmfundamentals or macroeconomic shocks. These effects will be reflected in thecoefficients of δ3 and δ4, respectively. Lastly, the coefficient δ0 will pick up themarginal effect of public status on acquisition decisions based on factors thatare not fully covered by our framework.
C. Firm Quality, Decision to Be Public, and Participation in Merger Waves
The key to our framework is the prediction that firms self-select into publicstatus based on their potential for long-run profitable growth, and that thedifference in firm quality, rather than actual public status, may explain thedifference in their participation in acquisitions. To establish this link, we needto separate the latent quality of a firm from its public status. If this potentialis evident early in the life of the firm, then initial characteristics can predictboth the selection into public status and merger activity in subsequent years.5
We proceed in two steps. First, we take a subsample of firms that are bornafter the beginning of our sample, and use their characteristics at time t0i, thedate of firm i’s first appearance, as explanatory variables to predict whetherthe firm is public at time t, where t ranges from 5 (or alternatively 10) yearsafter the initial appearance to the end of the sample. We use the followingspecification:
yit = G(π1 Xit0i + νit
)(2)
and
Pit = 1 if yit > Pi∗
Pit = 0 if yit ≤ Pi∗ ,
where Pit equals one if firm i is public at time t and zero otherwise, Xit0 capturesthe initial firm characteristics that are observable at birth. Vit is a randomvariable and G (.) is a nonlinear limited dependent variable parametric form.
In the second step, we replace Pit, the public status indicator in equation (1),with the predicted probability Pit estimated from (2) to predict participation inthe market for corporate assets:
mit+1 = F(δ0 Pi + δ1 Xit + δ2 Zi + δ3(Pi Xit) + δ4(Pi Zt) + εit). (3)
By examining the significance of coefficients δ0, δ3, and δ4, specification (3)allows us to analyze how initial conditions such as productivity and size affect
5 Lemmon, Roberts, and Zender (2008) show that firms’ leverage ratios are driven by an unob-served time-invariant effect that can be traced to periods prior to the IPO.

2188 The Journal of Finance R©
a firm’s decisions to buy or sell assets in subsequent years. Specification (2)also addresses two potential econometric problems. First, an estimate of therelation between contemporaneous public status and acquisition activity can beconfounded by market shocks as firms may go public during a merger wave inorder to more efficiently accomplish a specific planned transaction (Celikyurt,Sevilir, and Shivdasani (2010) and Hovakimian and Hutton (2008)). We caneliminate this problem by using firms’ initial conditions at birth. It is unlikelythat micro and macro shocks that occur at the time of the firm’s initial appear-ance directly affect merger decisions 5 or 10 years later.
Second, public and private firms differ in size and productivity. A straightcomparison of acquisition activity between these two groups may be confoundedby differences in contemporaneous characteristics that are hard to control foreffectively using a standard econometric model. To avoid these issues, we alsoperform a matching exercise using the propensity score based on initial char-acteristics and the predicted probability of going public (Pit). For firms withcomparable propensity score, we estimate the average treatment effect due topublic status in participation of mergers and acquisitions on and off the wave.This nonparametric approach provides an alternative way to separate the effectdue to selection from the effect due to public status.
D. Gains in Productivity: On- and Off-the-Wave Mergers
Comparing changes in productivity for transacted plants in public and pri-vate acquisitions helps us to study the relative importance of fundamentals,financial access, and agency problems. If merger waves occur because growthopportunities also come in waves, then we should observe greater improvementin economic efficiency in periods when there are more transactions. Moreover,if the higher participation of public firms on the wave is driven by their dif-ference in productivity and growth opportunities, then acquisitions of publicfirms should perform at least as well as (or better than) acquisitions by privatefirms. Better access to financing by public firms can facilitate transactions bythese firms.
On the other hand, since public status is associated with dispersed ownershipand potentially entrenched management, public firms may be more likely toengage in empire building. If so, we would expect to see lower productivity gainsfor assets acquired by public firms compared to those purchased by privatefirms. As such, changes in productivity for acquired assets provide a measureof the relative importance between agency problems and inherent quality (i.e.,productivity) in public and private firms.
The timing of the transaction may also drive changes in productivity for ac-quired assets. Merger waves often coincide with higher liquidity and valuationin the financial market. If waves are largely driven by valuation or liquidityin the financial market, then large transaction volume would not necessarilylead to higher operational efficiency. Moreover, if public firms acquire moreon the wave to take advantage of more favorable access to financial marketsrather than to realize synergies, then we should observe worse performance

Private and Public Merger Waves 2189
from public acquirers on the wave. In contrast, if merger waves are driven byexpected productivity gains, we should observe greater productivity gains inperiods when there are more transactions, that is, on the wave. To test thesehypotheses, we compare changes in productivity for plants bought by publicand private firms on and off the wave.
II. Data and Basic Statistics
A. Plant-Level Census Data
We use data from the Annual Survey of Manufactures (ASM), Census ofManufactures (CMF), and Longitudinal Business Database (LBD), maintainedby the Center for Economic Studies (CES) at the Bureau of the Census toidentify and track mergers and asset sales for both public and private firms. TheCensus data track approximately 50,000 manufacturing plants every year, andcontain detailed plant-level data on the value of shipments produced by eachplant, investments broken down by equipment and buildings, and labor inputsuch as number of employees and hours worked.6 The ASM covers all plantswith more than 250 employees. Smaller plants are randomly selected everyfifth year to complete a rotating 5-year panel. Even though it is called the ASM,reporting is mandatory for large plants and is mandatory for smaller plantsonce they are selected to participate. All data are reported to the governmentby law and fines are levied for misreporting.
The data we use cover the period from 1972 to 2004. To be included in oursample, firms must have manufacturing operations in SIC codes 2000 to 3999.We require each plant to have a minimum of 3 years of data. For each firm, wealso exclude all its plants in an industry (at the three-digit SIC code level) ifits total value of shipments in that industry is less than $1 million in real 1982dollars. Since we construct measures of productivity (described later) usingup to 5 years of lagged data, our regressions cover the period from 1977 to2004. We lose the initial year that a firm or a firm-segment enters the databaseand observations that are noncontinuous since we use lagged capital stock tocompute the rate of capital expenditure and we use lagged sales to computesales growth. Our final sample has about 665,000 firm-industry-years and morethan one million plant-years.
The Census databases keep unique identifiers for both firms and plants thatallow us to track ownership changes over time. For example, if plant #1000 isunder firm A in 2000 but firm B in 2001, we identify it as a transaction fromfirm A to firm B during 2001. Census staff (Javier Miranda and Ron Jarmin)confirmed to us that information on ownership transfers is updated in a timelymanner for nearly all public and private transactions in the company organiza-tion survey. The survey form is sent in December and companies are requiredby law to return the form in 30 days to report any ownership changes during the
6 We access the ASM and CMF data using the Longitudinal Research Database (LRD). Fora more detailed description of the LRD, see McGuckin and Pascoe (1988) and Maksimovic andPhillips (2002).

2190 The Journal of Finance R©
reference year.7 To identify public firms, we use an existing bridge file createdby the CES staff that links the Census firm identifiers with identifiers of publicfirms in Compustat. To construct the bridge file, firms are matched by employeridentification number (EIN) and name in each year from 1980 to 2005.
In our final sample, 20% of the plants are owned by public firms, and togetherthey produce about 35% of total output. Public firms are bigger—on average,public firms operate 3.1 plants compared to 1.4 plants owned by private firms.The median value of shipment (in 1982 dollars) is about $9 million for privatefirms, and $48 million for public firms. Public firms are also more produc-tive than private firms and have higher operating margins. Using these datawe calculate productivity for each plant using a translog production function.Kovenock and Phillips (1997) describe the productivity calculations, the dataused as inputs, and the method for accounting for inflation and depreciation ofcapital stock in more detail.
B. Economy and Industry Conditions
We focus on supply and demand factors that may affect acquisition decisionsover time. To capture the supply of capital, we use the spread between therate on Commercial & Industrial (C&I) loans and the Fed Funds rate as ameasure of aggregate liquidity following Harford (2005). Lown, Morgan, andRohatgi (2000) find that this spread is strongly correlated with the tightening ofliquidity measured from the Federal Reserve Senior Loan Officer (SLO) survey.When the credit spread is low, acquisitions become easier to finance and aremore likely to be carried out. However, the comparative effect of narrowingcredit spreads on private and public firms cannot be predicted a priori. Onthe one hand, narrowing spreads might allow public firms to take advantageof their access to public markets and increase their acquisition activity bothabsolutely and relative to private firms. On the other hand, the increasedliquidity associated with low spreads might also make it comparatively cheaperfor private firms to obtain loans. This second effect would increase the rate ofprivate acquisitions relative to public acquisitions.
We use several variables to capture the level of demand and investmentopportunities in the industry. When investment opportunities and demand in-crease and the supply of new capital is inelastic, highly efficient firms maychoose to buy other firms instead of building new capacity. This relation ispredicted by Maksimovic and Phillips (2001), Harford (2005), and Yang (2008),among others. We use the industry Tobin’s Q and the aggregate return on theS&P industrials index as proxies for industry and aggregate investment oppor-tunities, respectively, and examine their impact on merger activities. Tobin’s Q
7 For more detailed information on the survey, please refer to http://www.census.gov/econ/overview/mu0700.html. Evidence on the quality of ownership change reporting in the LRD is pro-vided by Davis et al. (2010), who examine transaction dates reported in the Capital IQ databasefor a series of leverage buyout (LBO) transactions. While they do discover limited discrepancies inthe reporting of some LBO transactions, they find that their results are qualitatively the same asthe results with SDC Platinum transaction dates, with similar signs and significance levels.

Private and Public Merger Waves 2191
is calculated from Compustat data and is measured as the sum of the marketvalue of equity and the book value of debt divided by the book value of assets.
Not surprisingly, these factors are correlated. For example, the correlationbetween the credit spread and the S&P industrial return is 47%. For robust-ness, we estimate the effects of these factors both separately and jointly in allof our specifications. For brevity, we only report results on joint estimation.Unless mentioned explicitly in the paper, results based on individual factorsare qualitatively the same.
We also include the industry Herfindahl index in the specifications to controlfor the incentive to buy competitors and increase the firm’s market power or theease of finding a trading partner. This index is calculated as the sum of squaredfirm-industry market shares using sales based on both public and private firmsin the industry.
III. Participation in Merger Waves: Public and Private Firms
A. Decisions to Buy and Sell Assets
In this section we compare decisions to buy or sell assets for both public andprivate firms, focusing on the effect of firm characteristics, industry conditions,and conditions in the financial market. We test whether public and privatefirms respond to fundamentals and financial conditions differently as we hopeto understand how fundamentals and financial conditions influence mergeractivity and the sources of differences in such activity.
Table II examines the probability of buying and selling assets for both publicand private firms using firm productivity and industry variables, and indicatorsfor credit market conditions. In Panel A, our dependent variable, D Buy, takesthe value of one if a firm buys a plant in the next period and zero otherwise.In Panel B, our dependent variable, D Sell, takes the value of one if a firmsells a plant. In each panel, we run two specifications, one with the aggregatewave indicator (columns 1 and 2), and the other with macro variables suchas the credit spread and the S&P return (columns 4 and 5).8 We estimateeach specification separately for public and private firms to allow differentcoefficients on all variables. Columns 3 and 6 report the p-value for testing thedifference in coefficients between the two groups. Note that Table II reports theestimated marginal effects using a logit specification. In Table III, we presentsimilar results using a linear probability model. The results are qualitativelyunchanged and actually slightly stronger for the linear probability model.
We control for firm size using the total value of shipments across all in-dustries in which the firm operates, as large firms may have higher financingcapacity when it comes to acquiring assets. We also include firm productiv-ity (TFP) to control for operating efficiency. On the industry level, we includethe industry Tobin’s Q to control for demand for assets and the Herfindahl in-dex (based on sales) to control for industry structure. We also include a proxy
8 This variable is equal to one for the six wave years identified in Section I (1986, 1987, 1996,1998, 1999, and 2000), and zero otherwise.

2192 The Journal of Finance R©
Table IIDecision to Buy or Sell Assets (Logit)
This table reports the estimated marginal effects (in %) from logit models. In Panel A, the dependentvariable, D Buy, equals one if a firm buys at least one plant and zero otherwise. In Panel B, thedependent variable, D Sell, equals one if a firm sells at least one plant and zero otherwise. Size isthe log of the total value of shipments (in 1987 dollars), and TFP is the total factor productivity.I Tobinq is the industry Tobin’s Q and HERF measures the industry Herfindahl index based onsales. Ind UV is the average unexplained valuation (UV) based on all public firms in that industry.We calculate UV using the procedure of Rhodes-Kropf, Robinson, and Viswanathan (2005) asupdated by Hoberg and Phillips (2010). Credit Spread is the spread between the C&I loan rate andthe Fed Funds rate. S&P is the return of S&P Industrial index. D Wave is an indicator variablethat equals one for wave years and zero for nonwave years. Columns 1 and 4 are estimated usingpublic firms and Columns 2 and 5 are estimated using private firms. Columns 3 and 6 report thep-value for the difference between public and private firms, which we estimate using the combinedsample with interaction between the public status dummy and all other explanatory variables. Wecontrol for firm random effects. Robust standard errors allow for clustering at the industry-yearlevel and are reported in parentheses. *, **, and *** represent significance at the 10%, 5%, and 1%level, respectively.
Public Private p-value for Public Private p-value for(1) (2) Difference (3) (4) (5) Difference (6)
Panel A: Decision to Buy Assets (Dependent Variable = D Buy)
Size 0.425*** 0.338*** <0.001 0.436*** 0.335*** <0.001(0.040) (0.010) (0.040) (0.010)
TFP 0.300*** 0.023** 0.294 0.307*** 0.024** 0.308(0.080) (0.010) (0.080) (0.010)
I Tobinq –0.361*** –0.096*** 0.037 –0.177 –0.072*** 0.039(0.130) (0.020) (0.130) (0.020)
Ind UV 0.022 0.049** 0.223 –0.520** 0.003 0.079(0.210) (0.020) (0.220) (0.020)
HERF 1.083 0.612*** 0.143 2.131 0.701*** 0.185(1.790) (0.210) (1.800) (0.210)
D Wave 2.454*** 0.182*** <0.001(0.18) (0.020)
Credit spread –1.941*** –0.020 <0.001(0.220) (0.030)
S&P 3.096*** 0.383*** 0.978(0.510) (0.060)
Pr(D Buy) 7.36% 1.75% 7.36% 1.75%Chi Square 385 6,716 291 6,600Number of obs. 99,121 420,944 520,065 99,121 420,944 520,065
Panel B: Decision to Sell Assets (Dependent Variable = D Sell)
Size 0.969*** 1.091*** <0.001 0.963*** 1.101*** <0.001(0.050) (0.020) (0.050) (0.020)
TFP –0.813*** –0.169*** <0.001 –0.810*** –0.169*** <0.001(0.090) (0.020) (0.090) (0.020)
I Tobinq –0.602*** –0.105*** 0.185 –0.445*** –0.083** 0.478(0.130) (0.030) (0.130) (0.030)
(Continued)
Private and Public Merger Waves 2193
Table II—Continued
Public Private p-value for Public Private p-value for(1) (2) Difference (3) (4) (5) Difference (6)
Panel B: Decision to Sell Assets (Dependent Variable = D Sell)
Ind UV 1.688*** 0.330*** <0.001 1.349*** 0.221*** 0.001(0.230) (0.050) (0.240) (0.050)
HERF –6.150*** 1.973*** <0.001 –5.656*** 2.005*** <0.001(2.050) (0.470) (2.050) (0.470)
D Wave 3.641*** 0.441*** <0.001(0.20) (0.040)
Credit spread –3.905*** –0.350*** <0.001(0.250) (0.050)
S&P 0.294 0.834*** <0.001(0.560) (0.120)
Pr(D Sell) 7.91% 4.08% 7.91% 4.08%Chi Square 821 5,191 663 5,279Number of obs. 107,645 557,470 665,115 107,645 557,470 665,115
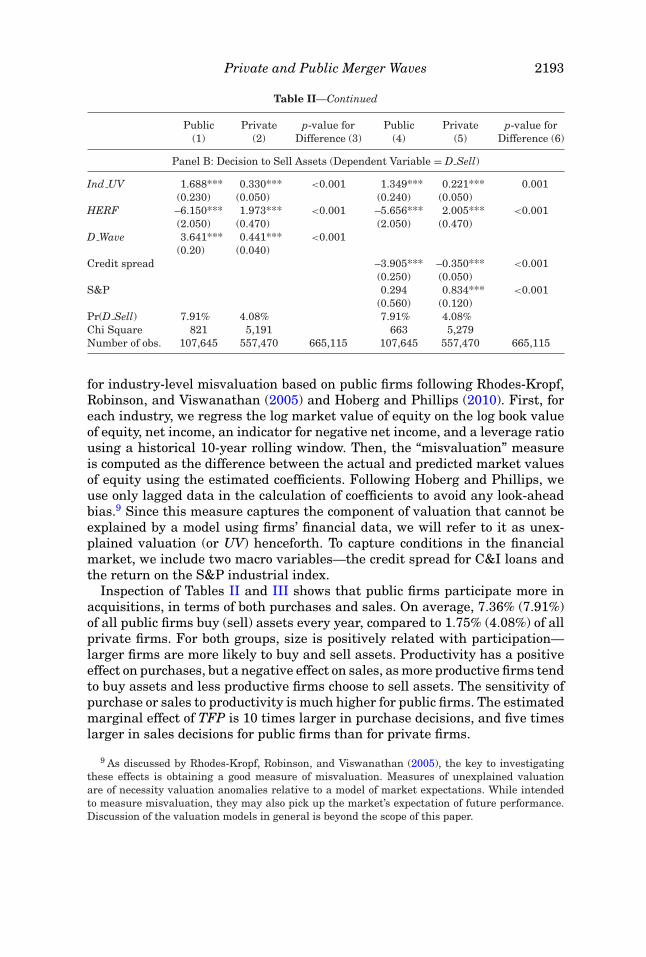
for industry-level misvaluation based on public firms following Rhodes-Kropf,Robinson, and Viswanathan (2005) and Hoberg and Phillips (2010). First, foreach industry, we regress the log market value of equity on the log book valueof equity, net income, an indicator for negative net income, and a leverage ratiousing a historical 10-year rolling window. Then, the “misvaluation” measureis computed as the difference between the actual and predicted market valuesof equity using the estimated coefficients. Following Hoberg and Phillips, weuse only lagged data in the calculation of coefficients to avoid any look-aheadbias.9 Since this measure captures the component of valuation that cannot beexplained by a model using firms’ financial data, we will refer to it as unex-plained valuation (or UV) henceforth. To capture conditions in the financialmarket, we include two macro variables—the credit spread for C&I loans andthe return on the S&P industrial index.
Inspection of Tables II and III shows that public firms participate more inacquisitions, in terms of both purchases and sales. On average, 7.36% (7.91%)of all public firms buy (sell) assets every year, compared to 1.75% (4.08%) of allprivate firms. For both groups, size is positively related with participation—larger firms are more likely to buy and sell assets. Productivity has a positiveeffect on purchases, but a negative effect on sales, as more productive firms tendto buy assets and less productive firms choose to sell assets. The sensitivity ofpurchase or sales to productivity is much higher for public firms. The estimatedmarginal effect of TFP is 10 times larger in purchase decisions, and five timeslarger in sales decisions for public firms than for private firms.
9 As discussed by Rhodes-Kropf, Robinson, and Viswanathan (2005), the key to investigatingthese effects is obtaining a good measure of misvaluation. Measures of unexplained valuationare of necessity valuation anomalies relative to a model of market expectations. While intendedto measure misvaluation, they may also pick up the market’s expectation of future performance.Discussion of the valuation models in general is beyond the scope of this paper.

2194 The Journal of Finance R©
Table IIIDecision to Buy or Sell Assets (OLS)
This table reports the estimated coefficients from OLS (multiplied by 100). Variables are as definedin Table II. Columns 1 and 4 are estimated using public firms and columns 2 and 5 are estimatedusing private firms. Columns 3 and 6 report the p-value for the difference between public andprivate firms, which we estimate using the combined sample with interaction between the publicstatus dummy and all other explanatory variables. We control for firm random effects. Robuststandard errors allow for clustering at the industry-year level and are reported in parentheses. *,**, and *** represent the significance at 10%, 5%, and 1% level, respectively.
p-value for p-value forPublic Private Difference Public Private Difference
(1) (2) (3) (4) (5) (6)
Panel A: Decision to Buy Assets (Dependent Variable = D Buy)
Size 0.050 1.080*** <0.001 0.070 1.090*** <0.001(0.100) (0.000) (0.100) (0.000)
TFP 0.420*** –0.010 <0.001 0.430*** –0.010 <0.001(0.100) (0.000) (0.100) (0.000)
I Tobinq –0.790*** –0.310*** 0.163 –0.470** –0.250*** 0.985(0.200) (0.000) (0.200) (0.000)
Ind UV 0.050 0.050 0.806 –0.740*** –0.070 0.017(0.300) (0.100) (0.300) (0.100)
HERF 7.500** 3.070*** 0.891 9.570*** 3.170*** 0.669(3.200) (0.700) (3.200) (0.700)
D Wave 2.730*** 0.390*** <0.001(0.20) (0.100)
Credit spread –1.520*** 0.060 <0.001(0.200) (0.100)
S&P 5.180*** 1.120*** <0.001(0.600) (0.100)
Pr(D Buy) 7.36% 1.75% 7.36% 1.75%R-Square 0.3% 2.9% 0.2% 2.9%Number of obs. 99,121 420,944 520,065 99,121 420,944 520,065
Panel B: Decision to Sell Assets (Dependent Variable = D Sell)
Size 1.230*** 2.440*** <0.001 1.210*** 2.440*** <0.001(0.100) (0.000) (0.100) (0.000)
TFP –0.900*** –0.510*** <0.001 –0.890*** –0.510*** <0.001(0.100) (0.000) (0.100) (0.000)
I Tobinq 0.110 0.340*** 0.441 0.400** 0.450*** 0.079(0.200) (0.100) (0.200) (0.100)
Ind UV 2.010*** 0.980*** 0.002 1.630*** 0.890*** 0.022(0.300) (0.100) (0.300) (0.100)
HERF –2.520 6.630*** 0.327 –1.550 6.720*** 0.466(2.700) (1.200) (2.700) (1.200)
D Wave 4.280*** 1.230*** <0.001(0.20) (0.100)
Credit spread –4.750*** –1.130*** <0.001(0.200) (0.100)
(Continued)
Private and Public Merger Waves 2195
Table III—Continued
p-value for p-value forPublic Private Difference Public Private Difference
(1) (2) (3) (4) (5) (6)
Panel B: Decision to Sell Assets (Dependent Variable = D Sell)
S&P –1.560*** –0.620*** 0.003(0.600) (0.200)
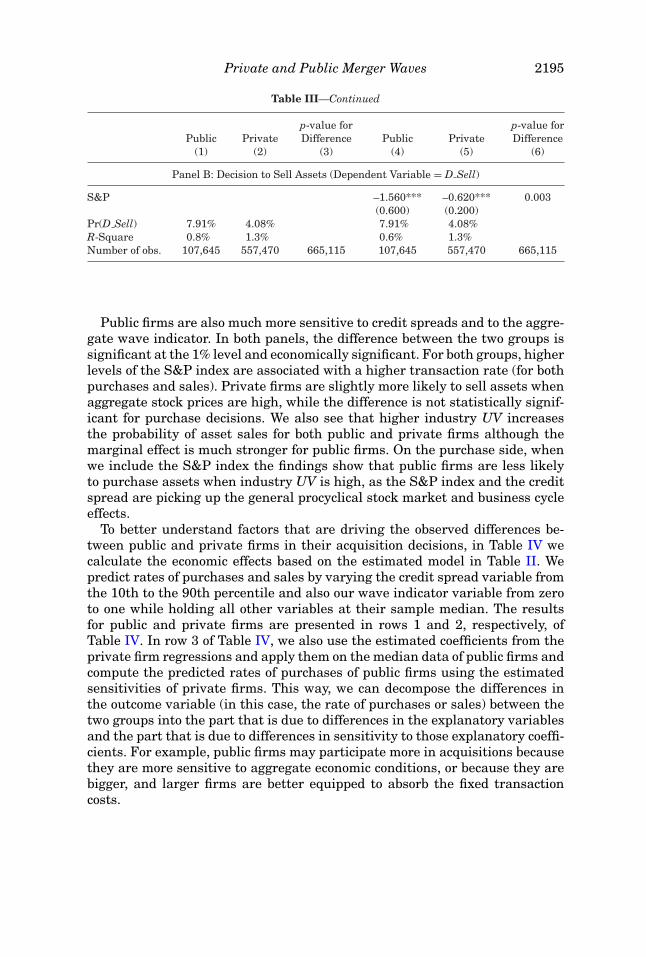
Pr(D Sell) 7.91% 4.08% 7.91% 4.08%R-Square 0.8% 1.3% 0.6% 1.3%Number of obs. 107,645 557,470 665,115 107,645 557,470 665,115
Public firms are also much more sensitive to credit spreads and to the aggre-gate wave indicator. In both panels, the difference between the two groups issignificant at the 1% level and economically significant. For both groups, higherlevels of the S&P index are associated with a higher transaction rate (for bothpurchases and sales). Private firms are slightly more likely to sell assets whenaggregate stock prices are high, while the difference is not statistically signif-icant for purchase decisions. We also see that higher industry UV increasesthe probability of asset sales for both public and private firms although themarginal effect is much stronger for public firms. On the purchase side, whenwe include the S&P index the findings show that public firms are less likelyto purchase assets when industry UV is high, as the S&P index and the creditspread are picking up the general procyclical stock market and business cycleeffects.
To better understand factors that are driving the observed differences be-tween public and private firms in their acquisition decisions, in Table IV wecalculate the economic effects based on the estimated model in Table II. Wepredict rates of purchases and sales by varying the credit spread variable fromthe 10th to the 90th percentile and also our wave indicator variable from zeroto one while holding all other variables at their sample median. The resultsfor public and private firms are presented in rows 1 and 2, respectively, ofTable IV. In row 3 of Table IV, we also use the estimated coefficients from theprivate firm regressions and apply them on the median data of public firms andcompute the predicted rates of purchases of public firms using the estimatedsensitivities of private firms. This way, we can decompose the differences inthe outcome variable (in this case, the rate of purchases or sales) between thetwo groups into the part that is due to differences in the explanatory variablesand the part that is due to differences in sensitivity to those explanatory coeffi-cients. For example, public firms may participate more in acquisitions becausethey are more sensitive to aggregate economic conditions, or because they arebigger, and larger firms are better equipped to absorb the fixed transactioncosts.

2196 The Journal of Finance R©
Table IVEconomic Significance: Decision to Buy or Sell and Credit Spreads
This table shows the estimated probabilities of purchases and sales for public and private firms at(1) the 10th, 25th, 50th, 75th, and 90th percentiles of the credit spread and (2) on and off the wave.We compute the estimated probabilities using coefficients from the logit regression reported inTable II. Throughout, all other variables are held at the sample median for the respective sample(public and private firms).
Credit Spread D Wave
p10 p25 p50 p75 p90 0 1
Panel A: Probability of Purchases
(1) Public firms 6.23% 5.80% 5.42% 5.22% 4.84% 4.81% 7.29%(2) Private firms 0.50% 0.49% 0.49% 0.49% 0.48% 0.45% 0.59%(3) Private firms
using medians ofdata from publicfirms
4.05% 4.02% 4.00% 3.99% 3.96% 3.68% 4.74%
Ratio (unadjusted):(2)/(1)
0.08 0.08 0.09 0.09 0.10 0.09 0.08
Ratio (adjusted forsize): (3)/(1)
0.65 0.69 0.74 0.76 0.82 0.77 0.65
Panel B: Probability of Sales
(1) Public firms 8.34% 7.40% 6.62% 6.23% 5.49% 5.80% 9.48%(2) Private firms 2.34% 2.27% 2.20% 2.17% 2.10% 2.04% 2.45%(3) Private firms
using medians ofdata from publicfirms
5.26% 5.11% 4.97% 4.90% 4.75% 4.63% 5.52%
Ratio (unadjusted):(2)/(1)
0.28 0.31 0.33 0.35 0.38 0.35 0.26
Ratio (adjusted forsize): (3)/(1)
0.63 0.69 0.75 0.79 0.87 0.80 0.58
Table IV shows that the purchase decision is vastly different between publicand private firms at every percentile of the credit spread data. For example,when the credit spread is at its median, the rate of purchases is 5.42% forpublic firms, but only 0.49% for private firms. Public firms are also more sen-sitive to credit spreads. For public firms, the purchase rate increases from4.84% to 6.23% when the credit spread moves from its 90th to 10th percentile.In comparison, for private firms, the change is much flatter, from 0.48%to 0.50%.10
10 For this exercise, we estimate the predicted probability using the sample median for therespective sample (public and private firms). Since large firms are far more likely to participate inpurchases and sales in both samples, the resulting predicted probability is lower than the reportedsample mean.

Private and Public Merger Waves 2197
The difference in the transaction rate between public and private firmsshrinks significantly when we apply the estimated coefficients from the pri-vate firm regressions to public firm data. For the median credit spread, thepredicted rate of purchases by private firms is 9% of the rate for public firms(0.49% vs. 5.42%). However, when we apply the estimated coefficients from theprivate regression (column 2) using the medians of the data from the publicfirms, we find that differences in firm characteristics explain about 74% of theobserved difference between public and private firms (4% vs. 5.42%). Thus, dif-ferences between public firms and private firms in their acquisition behaviorare due in part to differences in their fundamentals. Public firms are larger andmore productive, and large and more productive firms are more likely to buyassets. Nevertheless, a sizable gap (26%) still remains even after we controlfor firm characteristics. This gap is attributable to the differences in sensi-tivities to firm characteristics between these two groups. More interestingly,the gap is bigger when credit spreads are low and during wave years, sug-gesting that public and private firms also have a different sensitivity to macroconditions.
We find similar patterns in decisions to sell assets. When the credit spreadmoves from the 90th to the 10th percentile, the sales rate increases from 2.10%to 2.34% for private firms, compared to 5.49% to 8.34% for public firms. Whenwe apply the estimated coefficients from the private firm regression (column 2)to public firm data, we find that differences in firm characteristics explain about75% of the observed differences between public and private firms. Controllingfor firm characteristics, the differences between public and private firms be-comes bigger when credit spreads are low and aggregate acquisition activity ishigh.
As an alternative robustness check for the size effect, we divide our sampleinto quintiles based on firm size, and repeat our analysis using only firms inthe largest quintile. Compared to the overall sample, the largest quintile hasa much more balanced panel of public and private firms—43% of the firms arepublic firms and the rest are private firms. Our results remain qualitativelythe same. Among firms in the largest size quintile, public firms are still moresensitive to liquidity in the capital market and aggregate merger activity thanprivate firms in their decisions to buy and sell assets. Thus, a substantialportion of the differences in the level of transactions between public and privatefirms is driven by differences in fundamentals, while the responsiveness tocredit market conditions is affected by public status.
B. The Effect of Market Valuation and Liquidity
We have shown so far that public firms are more sensitive than private firmsto financial market conditions such as industry valuation, stock market re-turn, and credit spreads. In this section, we extend our analysis to includefirm-level valuation (in addition to the industry-level measures) and stockmarket liquidity. Our goal is to understand how differences in relative valua-tion within an industry affect merger and acquisition activities. Since market

2198 The Journal of Finance R©
valuations for private firms are not observable, we use the subsample of publicfirms in our sample for this analysis.
For public firms, the valuation and liquidity of their own equity play impor-tant roles in acquisition decisions because equity can be used as a medium ofexchange to finance acquisitions. Rhodes-Kropf, Robinson, and Viswanathan(2005) point out that, while economic shocks might be fundamental determi-nants of merger activity, misvaluation in the stock market may determine whobuys whom and explain why mergers cluster over time. They also emphasizethat managers of public firms themselves may suffer from asymmetric informa-tion about potential synergies and thus will be more likely to buy with positivesignals from the stock market. In our context, overvaluation in the stock mar-ket may be associated with more transactions but does not necessarily lead toproductivity decreases as firms may use their highly valued equity to facilitateproductivity-increasing transactions.
In order to test these ideas, in Table V we add to our earlier specificationsfrom Table II variables that capture firm-level valuation and liquidity such asunexplained valuation (UV), annualized stock return (Ret), and the Amihudilliquidity index (Illiq).11 For all three variables (UV, Ret, and Illiq), we alsoinclude industry averages based on all public firms within the industry. 12,13
Panels A and B present our results for decisions to buy and sell assets, respec-tively. In each panel, columns 1 and 3 contain the baseline results—one withthe wave indicator and the other with the macro variables. Columns 2 and 4further control for stock market return and stock illiquidity.
Panel A reveals that our baseline results for the decision to buy in Table IIare largely unaffected by adding the valuation, return, and liquidity measures.However, the firm-level stock-related variables are significant in explainingdecisions to buy for public firms. In all the specifications, firm UV is significantand positive, while industry UV is only significant for the specification withthe global wave dummy variable, and becomes insignificant when illiquidityis added. Stock illiquidity is significant and negative for all specifications, atboth the firm level and the industry level. Stock return is positively related topurchase decisions at the firm level, although it is only significant without thewave indicator.
These results indicate that stock market valuation and liquidity have sig-nificant independent effects on the decision to buy assets for public firms.Firms that are valued beyond the predicted level based on their fundamentalvariables are more likely to engage in acquisitions. Stock liquidity also has animportant role in facilitating acquisitions for public firms. Firms that have less
11 We download the Amihud illiquidity measure directly from Joel Hasbrouk’s website at NYU.All firm-level measures have been de-meaned by industry.
12 To calculate industry-level measures, we aggregate firms based on their main industry re-ported in Compustat.
13 We also adjust the industry return by the S&P return to filter out the aggregate effect. In theregression, the industry return is the industry raw return adjusted for the S&P return, and thefirm return is the firm raw return adjusted for the industry return.

Private and Public Merger Waves 2199
Table VPublic Firms’ Decisions to Buy or Sell Assets
This table reports the estimated marginal effects (in %) from logit models using public firms only.Ret measures the annualized equity return and Illiq measures the Amihud liquidity. For all threevariables (UV, Ret, and Illiq), we compute the industry average (based on three-digit SIC codes)and the firm-level de-meaned variable. We control for firm random effects. All other variables aredefined as in Table II. Robust standard errors allow for clustering at the industry-year level andare reported in parentheses. *, **, and *** represent significance at the 10%, 5%, and 1% level,respectively.
Panel A: D Buy Panel B: D Sell
(1) (2) (3) (4) (1) (2) (3) (4)
Size 0.422*** 0.131** 0.435*** 0.128** 0.872*** 0.703*** 0.867*** 0.690***(0.050) (0.060) (0.050) (0.060) (0.060) (0.070) (0.060) (0.070)
TFP 0.255** 0.208** 0.275*** 0.220** –0.844*** –0.854*** –0.829*** –0.842***(0.100) (0.100) (0.100) (0.100) (0.110) (0.110) (0.110) (0.110)
I Tobinq –0.276* –0.346** –0.091 –0.197 –0.592*** –0.619*** –0.492*** –0.548***(0.160) (0.160) (0.160) (0.160) (0.160) (0.160) (0.160) (0.160)
HERF 3.668 3.243 4.350* 3.599 –6.926*** –6.273** –6.485** –6.195**(2.300) (2.290) (2.300) (2.290) (2.570) (2.550) (2.570) (2.560)
D Wave 2.316*** 2.107*** 3.060*** 2.787***(0.220) (0.230) (0.240) (0.250)
Credit spread –1.619*** –1.580*** –3.575*** –3.251***(0.280) (0.290) (0.310) (0.330)
S&P 2.805*** 3.335*** 1.431** 1.337*(0.630) (0.650) (0.690) (0.750)
Firm UV 1.251*** 0.659*** 1.091*** 2.699*** 0.481*** 0.276 0.264 0.150(0.170) (0.210) (0.170) (0.970) (0.160) (0.200) (0.160) (1.000)
Ind UV 0.602** 0.315 –0.009 –0.336 1.528*** 1.540*** 0.997*** 1.067***(0.280) (0.280) (0.290) (0.300) (0.290) (0.290) (0.300) (0.300)
Firm Ret 0.212 0.459** –0.988*** –0.804***(0.210) (0.210) (0.240) (0.240)
Ind. Ret 0.195 0.191 –1.282*** –1.223***(0.370) (0.370) (0.400) (0.420)
Firm Illiq –2.133*** –2.201*** –2.300*** –2.320***(0.280) (0.280) (0.240) (0.240)
Ind Illiq –2.615*** –2.867*** –2.358*** –2.556***(0.340) (0.340) (0.320) (0.320)
Chi Square 291 333 220 295 425 515 373 470Number of obs. 61,252 61,252 61,252 61,252 66,501 66,501 66,501 66,501
liquid stock (or a high Amihud illiquidity index) are less likely to be acquirers,perhaps reflecting their target’s hesitation to hold illiquid stock.
Examining the results for the decision to sell in Panel B of Table V, wenotice one important difference relative to the decision to buy. Firms are morelikely to sell assets when industry UV is high (significant at the 1% level in allspecifications) while firm-level UV is mostly insignificant. This suggests that,when industries become highly valued, less productive firms are more likely tosell to their highly valued counterparts (as evident from Panel A). Sellers, onthe other hand, do not seem to be over- or undervalued. The coefficient on theAmihud illiquidity index is negative, as in Panel A.

2200 The Journal of Finance R©
It is worth noting that the unexplained valuation measures used here cancapture either deviations from the true value (or misvaluation) or market ex-pectations of unmeasured future productivity. One way to shed light on thisquestion is to examine whether and how stock valuation affects firms’ decisionsto engage in different types of transactions. We perform two additional tests.First, since most of the partial-firm acquisitions are financed with cash, if ac-quisitions are driven by overvalued equity, we should observe lower valuation–acquisition sensitivity in partial-firm acquisitions, as compared to whole-firmmergers that are more often paid by stock. Second, because diversifying merg-ers are often viewed as signs of agency problems or a waste of resources (e.g.,Morck, Shleifer, and Vishny (1990), Servaes (1997)), if acquisitions on the waveare pursued to use overvalued equity rather than to improve efficiency, thenwe would expect to see higher valuation–acquisition sensitivity in diversifyingacquisitions as compared to horizontal acquisitions.
We present these results in our Internet Appendix.14 We show that the es-timated odds ratio (from a multinomial logit model) for UV is greater thanone for all types of transactions. More interestingly, UV has almost the sameeffect on partial-firm acquisitions as it has on mergers, and the same effecton horizontal acquisitions as on diversifying acquisitions. These results, whileconsistent with a model of efficient mergers, are at odds with models thatattribute overvaluation as the main driver for merger waves.
To the extent that partial-firm purchases are easier to finance than whole-firm purchases, and financing constraints are more likely to be binding forprivate firms, we expect that private firms make relatively more partial-firmpurchases than whole-firm acquisitions.15 We do not find that to be the case.The incidence of public purchases is higher (3.53% for partial-firm and 3.83%for whole-firm purchases) than the incidence of private purchases (0.84% forpartial-firm and 0.92% for whole-firm purchases). However, the ratios of wholeand partial purchases for the two types of sales are very close. The coef-ficients in the regressions predicting partial- and whole-firm purchase arequalitatively similar. These findings suggest that the lower overall rate ofprivate transactions is determined in part by differences in skill and theability to exploit investment opportunities as well differences in financingconstraints.
C. Credit Ratings and Stock Liquidity
In this section, we examine how public firms with different levels of finan-cial constraints respond differently in terms of their acquisition decisions tochanges in economic fundamentals and financial conditions. If the difference
14 The Internet Appendix may be found in the online version of this article.15 Whole and partial purchases by private firms are normally cash transactions, so there is little
countervailing tendency for private firms to make whole-firm purchases using stock to avoid usingcash in partial sales.
Private and Public Merger Waves 2201
in acquisition activities between public and private firms is partly attributableto differences in access to the financial market, then we would expect publicfirms with the least access to financial markets to behave similarly to privatefirms.
We consider both bond market and stock market liquidity. Faulkender andPetersen (2006) show that firms with higher bond ratings have better access topublic bond markets. Finding that unrated or low-rated firms’ merger activityis the most sensitive to credit spreads and the overall economy would be consis-tent with the notion that increased liquidity in the market has a bigger impacton firms that are more financially constrained. In contrast, a lower sensitiv-ity of unrated or low-rated firms would indicate that financial constraints arebinding for those firms and cannot be relaxed even at times of high liquidity.Stock market liquidity is relevant because firms with low stock liquidity mayfind it harder to issue equity or use existing equity as a means for payment inacquisitions. These firms are also likely to be financially constrained.
First, we split our sample of public firms into three groups based on S&Plong-term debt ratings (Compustat data item 280): firms with an investmentgrade credit rating (above BBB), firms with a below investment grade rating(BBB and below), and unrated firms. Within our sample, 28% of public firmshave an investment grade rating (HR), 14% have a below investment graderating (LR), and the rest are unrated (NR). We then run regressions to predictdecisions to buy and sell assets for each rating group.
Next, we separate public firms into three equal-sized groups based on theirstock liquidity using the Amihud illiquidity measure. We then apply a similarspecification as used in Table V, column 1, to each group. Table VI reports ourresults.
For all credit rating groups, credit spreads have a significant negative effecton acquisition decisions, and they affect LR firms the most. The estimatedmarginal effect of credit spread on acquisitions for LR firms is almost threetimes as high as the marginal effect for HR or NR firms. On the sales side,LR firms, especially those with lower productivity, are also more likely to sellassets when credit spreads are low. Therefore, credit spreads appear to have adouble effect on LR firms: on the one hand, more liquidity in the market helpsrelax the constraints faced by LR firms and enables them to borrow more orat a lower rate to finance acquisitions; on the other hand, liquidity may alsoaffect LR firms by lifting covenants on previous bank loans that prevent themfrom selling assets. We find that the effect of credit spreads is the smallestfor unrated firms. We also find that acquisition activity by nonrated firmsand firms with low stock market liquidity are more sensitive to size. Theseresults parallel the results in Hovakimian, Kayhan, and Titman (2009), whoshow that, controlling for whether firms have debt ratings, size can have adifferential effect on firm decisions, with larger effects for size among smallernonrated firms.
Our results also show that the effect of productivity (TFP) on acquisitiondecisions is strongest for the high credit rating group. Together with our earlier

2202 The Journal of Finance R©
Table VIDecisions by Credit Rating and Liquidity Groups
This table reports the estimated marginal effects (in %) from logit models on the decision to buy(Panel A) or sell (Panel B) assets by credit rating status and liquidity groups. “No Rating” refersto public firms that are not rated, “Low Rating” refers to public firms rated BBB or below, and“High Rating” refers to public firms rated above BBB. For illiquidity, we separate firms into threeequal-sized groups based on the Amihud illiquidity measure. All other variables are defined as inTable II. All explanatory variables are lagged. We control for firm random effects. Robust standarderrors are computed allowing for clustering at the industry-year level and reported in parentheses.*, **, and *** represent significance at the 10%, 5%, and 1% level, respectively. a, b, and c representsignificance at the 1%, 5%, and 10% level, respectively, for testing the difference between the Lowor High Rating group and the No Rating group or between the Medium or High Liquidity groupand Low Liquidity group.
Credit Rating Groups Liquidity Groups
Low High Low Medium HighNo Rating Rating Rating Liquidity Liquidity Liquidity
Panel A: Decisions to Buy Assets (D Buy)
Size 0.460*** –0.538***,a –0.405**,a 0.558*** –0.374***,a –0.310**,a
(0.06) (0.16) (0.16) (0.09) (0.12) (0.15)TFP 0.072 0.251 0.482** 0.069 –0.035 0.352*
(0.11) (0.27) (0.21) (0.13) (0.18) (0.20)Firm UV 0.843*** 1.259*** 0.115b 0.898*** 0.040a 0.365b
(0.16) (0.38) (0.42) (0.20) (0.30) (0.37)I Tobinq –0.692*** –0.121b 0.545*,a –0.702*** –0.901*** 0.132b
(0.17) (0.37) (0.29) (0.23) (0.28) (0.25)HERF –2.982 17.264***,a 8.229*,b –1.583 –0.950 12.978***,b
(2.36) (5.36) (4.91) (2.79) (3.78) (4.55)Credit spread –1.218*** –4.213***,a –1.742*** –0.847** –2.619***,c –1.063**
(0.28) (0.76) (0.52) (0.35) (0.48) (0.57)S&P 2.499*** 1.962 1.990* 1.483 2.039* 4.655***
(0.75) (1.49) (1.19) (0.95) (1.11) (1.12)Pr (D Buy) 6.10% 8.89% 9.37% 5.07% 7.75% 9.30%Chi Square 152 79 40 82 55 46Number of obs. 43,230 12,240 22,424 19,796 21,220 22,257
Panel B: Decisions to Sell Assets (D Sell)
Size 0.936*** 0.723***,b 0.686***,a 0.443*** 0.453*** 0.722***(0.07) (0.14) (0.12) (0.09) (0.10) (0.12)
TFP –0.638*** –0.899*** –1.160***,b –0.381*** –1.046*** –1.199***(0.11) (0.25) (0.21) (0.13) (0.17) (0.22)
Firm UV 0.647*** 0.948*** 0.383 –0.142 –0.444 0.510(0.16) (0.36) (0.42) (0.18) (0.29) (0.43)
I Tobinq –0.139 –0.082 0.194 –0.001 –0.307 –0.791***(0.16) (0.35) (0.28) (0.18) (0.25) (0.30)
HERF –5.989** –4.197 –2.174 –1.480 –5.554 –8.307(2.59) (5.45) (5.06) (2.67) (3.73) (5.73)
Credit spread –2.837*** –5.016***,b –4.021*** –1.426*** –2.607*** –4.865***(0.30) (0.72) (0.58) (0.35) (0.46) (0.72)
S&P 0.463 –0.393 2.899** 0.401 1.308 6.050***,b
(0.77) (1.44) (1.25) (0.85) (1.11) (1.34)
(Continued)

Private and Public Merger Waves 2203
Table VI—Continued
Credit Rating Groups Liquidity Groups
Low High Low Medium HighNo Rating Rating Rating Liquidity Liquidity Liquidity
Panel B: Decisions to Sell Assets (D Sell)
Pr (D Sell) 7.47% 8.05% 8.87% 4.63% 7.08% 10.35%Chi Square 284 92 128 49 84 133Number of obs. 50,337 13,606 24,139 23,058 23,552 23,375
findings, this finding indicates that the constrained low-rated firms are moreaffected by market liquidity, while the less constrained high-rated firms aremore affected by productivity. Public firms with no rating are most similar toprivate firms with low sensitivity to productivity and credit spreads.
Examining the results for stock liquidity groups, we observe similar patternsas those described for the credit rating groups. Although credit spreads have anegative effect for all liquidity groups, the effect on acquisitions is largest forthe midlevel liquidity group. Productivity (TFP) has the largest effect for thehigh-liquidity group. In addition, size has the largest effect in the low-liquiditygroup, suggesting that size can compensate for the lack of liquidity. On thesales side, credit spreads affect the high-liquidity group the most.
We also compute the economic significance of these results. For low-ratedfirms, the probability of buying and selling assets increases 62% when thecredit spread moves from the 90th to the 10th percentile. In comparison, theincreases are 19% and 23%, respectively, for highly rated firms and for nonratedfirms, respectively. Similarly, for firms with medium stock liquidity, the rate ofasset purchases increases 42% when the credit spread moves from the 90th tothe 10th percentile. In comparison, the increases are 18% and 12% for firms inthe low- and high-liquidity groups, respectively.
In sum, although public firms with better access to credit or the equity market(the highly rated group and the high liquidity group) do more acquisitions ingeneral, firms with intermediate access (the low-rated group and the mediumliquidity group) have the highest sensitivity to changes in credit spreads andare most affected by changes in market liquidity in their acquisition decisions.Among all groups, the acquisitions and sales of public firms with no creditrating and low stock liquidity most resemble private firms. As such, our findingsuggests that the observed difference between public and private firms is duein part to the differences in their access to financial markets.
IV. Endogenizing Public Status
A. Predicting the Decision to Be Public
The preceding sections establish that public firms participate more in ac-quisitions, especially during merger waves. But the decision to acquire public

2204 The Journal of Finance R©
status is itself a choice variable. If public status confers advantages in financ-ing acquisitions, then firms with superior growth opportunities can self-selectinto public status to take advantage of the easier financing. Thus, the greatermerger activity of public firms could be primarily due to inherent character-istics, such as superior corporate culture or technology, rather than to theadvantages of public status in acquisitions. To distinguish between these twoeffects, we next analyze the decision to be public, and compare the subsequentmerger activity of public and private firms with the same productivity and sizeat birth. Our hypothesis is that the quality of a firm is evident very early in itslife, and that firms with greater growth potential select to be public to betterengage in mergers and acquisitions later. As such, the decision to be public canbe predicted using the initial quality of the firm (model (2)).
We use the LBD from the Census Bureau to confirm the birth year for firmsin our sample. LBD is a data set constructed using information from the Busi-ness Registry that covers firms with any paid employees in the United States(>10 million establishments per year).16 The LBD starts in 1976, and thus,to correctly identify the birth year, we only include a subsample of firms thatfirst appeared in the LBD after 1976. As in the overall sample, both public andprivate firms are included when their segment sales are one million dollars orlarger in their initial year. Since we want to examine the decision to be pub-lic based on initial conditions, in these tests we also exclude firms that werealready public the first time they appear in the database.
For the firms born after 1975 we create an exclusion window to removethe first 5 (or in some specifications 10) years after birth from our sample.We then run probit models to predict firms’ public status after this exclusionwindow as a function of the firm’s initial characteristics at birth and, in somespecifications, industry conditions. The exclusion window mitigates concernsthat contemporaneous shocks affect the incentives both to go public and totrade assets. Thus, the specification captures the fundamental quality of afirm, which affects both the incentives to go public as well as the incentives totrade assets.
We find that initial conditions are very persistent. For example, 10 years afterbirth, 44% of the firms that start in the smallest size quintile remain in thesame quintile, and 90% of the firms that start in the largest size quintile remainin the same quintile. Similar patterns also exist for productivity, although theyare not as strong. Ten years after the birth, 36% (40%) of firms that start in theleast (most) productive quintile remain in the same productivity quintile.
Table VII presents our results for predicting public status—columns 1 to 3use a 5-year window and columns 4 to 6 use a 10-year window.
In column 1, we include initial size and productivity (Size0, TFP0) and theirsquare terms (Size2
0, TFP20) to measure the initial quality of a firm, and use
the change in aggregate industry shipments in the next 25 years (CDTVS25)to measure the long-term growth in industry demand. Both linear and square
16 See Jarmin and Miranda (2002) for a detailed description of the LBD (http://ideas.repec.org/p/cen/wpaper/02-17.html).

Private and Public Merger Waves 2205
Table VIIPredicting Public Status
This table reports the estimated marginal effects (in %) of probit models predicting public sta-tus. The dependent variable, D Pub, equals one for public firms and zero for private firms. TFP0and TFP2
0 represent the linear and square terms of initial TFP, respectively, and Size0 and Size20
measure the linear and square terms of initial size, respectively. CDTVS25 measures the changein long-run shipments in the industry (in 25 years). I CapEx represents the industry capital ex-penditures. S50 measures the percentage of small firms (with less than 50 employees) in theindustry. Persistence measures the persistence of TFP within the industry based on rank correla-tion. Ln(N IPO) is the log number of annual IPOs. Q2(Size0) to Q5(Size0) are indicators for thesecond to fifth quintiles based on Size0, respectively. For columns 1 to 3, we only include firms thatare at least 5 years old, and for columns 4 to 6, we only include firms that are 10 years old. All othervariables are as defined in Table II. All time-varying variables are lagged. Robust standard errorsare computed allowing for clustering at the industry level. *, **, and *** represent significance atthe 10%, 5%, and 1% level, respectively.
5 Years after Birth 10 Years after Birth
(1) (2) (3) (4) (5) (6)
TFP0 0.29 1.98*** –0.89 0.52 2.90*** 1.00(0.20) (0.30) (0.90) (0.40) (0.50) (1.50)
TFP20 11.48*** 10.04*** 17.16*** 15.58***
(0.60) (0.60) (1.00) (1.00)Size0 1.80*** 1.25*** 1.90** 1.46*
(0.50) (0.50) (0.80) (0.80)Size2
0 0.18*** 0.19*** 0.22*** 0.22***(0.00) (0.00) (0.00) (0.00)
CDTVS25 0.31*** 0.21*** 0.22*** 0.42*** 0.28*** 0.28***(0.00) (0.00) (0.00) (0.00) (0.00) (0.00)
I CapEx 12.08*** 11.72*** 19.91*** 19.95***(0.70) (0.70) (1.30) (1.30)
I Tobinq 9.56*** 10.92*** 14.23*** 14.94***(1.40) (1.40) (2.30) (2.30)
HERF 7.20*** 7.78*** 4.13*** 4.37***(0.70) (0.70) (1.10) (1.20)
S50 –12.41*** –14.80*** –16.79*** –19.41***(0.60) (0.60) (1.00) (1.00)
Persistence 1.70*** 1.83*** 1.94*** 2.09***(0.10) (0.10) (0.10) (0.10)
Ln(N IPO) 0.24*** 0.06 0.42*** 0.36***(0.10) (0.10) (0.10) (0.10)
Q2(Size0) 1.43*** 1.42***(0.30) (0.50)
Q3(Size0) 5.70*** 6.72***(0.40) (0.60)
Q4(Size0) 10.86*** 11.95***(0.40) (0.60)
Q5(Size0) 30.05*** 30.51***(0.60) (0.80)
Q2(Size0) × TFP –2.99** –6.12***(1.20) (2.00)
Q3(Size0) × TFP –0.75 –3.24*(1.10) (1.80)
(Continued)

2206 The Journal of Finance R©
Table VII—Continued
5 Years after Birth 10 Years after Birth
(1) (2) (3) (4) (5) (6)
Q4(Size0) × TFP 1.45 0.21(1.00) (1.70)
Q5(Size0) × TFP 5.62*** 4.83***(1.00) (1.60)
R-square 0.180 0.191 0.169 0.165 0.178 0.167Number of obs. 187,581 187,581 187,581 88,934 88,934 88,934
terms of productivity and size are positive, suggesting that firms that werelarger and more productive at birth are more likely to be public later in theirlife cycles. In our sample, 5 years after birth, firms that begin in the highestquintile in both size and productivity have a 27% probability of being public,while less than 1% of the firms that begin in the lowest quintile in both sizeand productivity become public. Industry long-term demand also plays an im-portant role. Firms in industries with increasing long-term demand are morelikely to be public. The initial conditions, together with the industry long-termdemand, explain about 18% of the total variation in firms’ public status 5 yearsafter birth.
In column 2, we add lagged industry and macro variables to account for casesin which firms change their public status over time. Firms in industries withhigh capital expenditures and more growth opportunities may have higherdemand for capital. We capture these effects by including the industry capitalexpenditure rate (I CapEx) and the industry Tobin’s Q (I Tobinq). We includethe Herfindahl index (HERF) to capture the industry concentration ratio. Thismeasure is calculated based on sales from both public and private firms.
Some industries may be more suitable for small private firms than othersdue to the characteristics of the industry. We use the percentage of firms withless than 50 employees (S50) as a proxy for industry business conditions.17
Initially productive firms might be more likely to go public if productivity ispersistent over time. We therefore include a measure for productivity persis-tence (Persistence) calculated as the mean rank correlation between the laggedand current TFP for all firms in the industry-year. Lastly, we include the logof the number of IPOs in a year to control for economic conditions for IPOs.18
All variables have the predicted signs. Firms in industries with higher capitalexpenditures, better growth prospects, a higher concentration ratio, a lowerproportion of small firms, and higher persistence in TFP are more likely to gopublic. Firms are also more likely to go public during an IPO wave. In thisexpanded specification the initial firm conditions (size, productivity, and theirsquared terms) remain positive and significant at the 1% level.
17 We use the employment numbers provided in LBD to compute this percentage.18 The series is calculated based on data provided on Jay Ritter’s website: http://bear.cba.
ufl.edu/ritter/ipoisr.htm.

Private and Public Merger Waves 2207
In column 3, we use initial size quintiles and interact them with initialproductivity. The marginal effect on public status is monotonically increasingin size quintiles. Moreover, TFP matters for large size quintiles. In columns4 through 6, we estimate the same specification using initial firm quality andfirm size from at least 10 years prior to subsequent years. The results fromthese specifications are similar to those for the specification with initial qualityand size from 5 years prior.
B. Endogenous Selection: Reexamining the Decisions to Buy and Sell Assets
Firms with higher productivity and greater anticipation of future growth maychoose to become public to participate more in acquisitions when opportunitiesemerge. We show above that initial conditions at birth are good signals for firmquality—firms that are larger and more productive at birth are more likely tobe public later in their lives. If the same quality also affects later decisionsin participating acquisitions, then we should observe a positive relationshipbetween initial conditions (or the probability of being public) and the probabilityof engaging in acquisitions. In this section, we control for the endogeneityof public status using first a selection model and then a matching model toreexamine the decision to buy and sell assets.
First, we examine how the selection into public status affects purchase andsale decisions. We estimate the probability of being public using the specifica-tion in Table VII, column 1. In predicting the probability of being public weuse as independent variables firm characteristics at birth and remove obser-vations in a 5-year exclusion window following the firm’s birth. Since all theexplanatory variables are time-invariant, the predicted probability capturesthe firm’s initial condition. Because the predicted probability of being public isonly available for firms born after 1976, the first year that the LBD is avail-able, our sample of firms with predicted public status is more representative ofyounger firms.19
In Table VIII, we perform a matching exercise based on the predicted prob-ability of being public as a propensity score. We then compare decisions to buyand sell assets between the treated group (public firms) and the control group(private firms) using stratification matching. The estimated average treatmenteffect on the treated group (ATT) then captures the effect that public statushas on acquisition decisions controlling for initial public quality. We also en-force the computation of the ATT only in the region of common support. Wereport the estimated ATT over the whole sample period and also on and off thewave.
On the purchase side, matching based on the probability of being public pre-dicted by initial conditions explains about 27% of the difference between publicand private firms. When we separate our sample period into wave and non-wave years, we find that predicted public status matters more during merger
19 The predicted probability is available for 15% of public firms and 29% of private firms in ourdata set.

2208 The Journal of Finance R©
Table VIIIDecision to Buy or Sell Assets: Propensity Score Matching
This table shows the difference in estimated probabilities in purchases (Panel A) and sales (PanelB) between public and private firms before and after matching. We match firms based on thepredicted probability of being public using the specification in Table VII, column 1. The treatmentgroup includes all firm-year observations for public firms and the control group includes all firm-year observations for private firms.
Panel A: Probability of Purchases
Off-the-Wave On-the-WaveAll (D Wave = 0) (D Wave = 1)
Public firms 5.37% 4.83% 6.47%Private firms 1.11% 1.03% 1.28%Difference (w/o matching) 4.27% 3.80% 5.19%Difference (w/ matching) 3.10% 2.56% 4.00%% Explained by matching 0.27 0.33 0.23# of Treatment 16,656 11,138 5,518# of Control 143,576 99,735 43,841T-stat (from bootstrap) (16.36) (13.31) (9.64)
Panel B: Probability of Sales
Off-the-Wave On-the-WaveAll (GW = 0) (GW = 1)
Public firms 6.63% 5.88% 8.16%Private firms 3.42% 3.21% 3.90%Difference (w/o matching) 3.22% 2.68% 4.26%Difference (w/ matching) 0.30% 0.03% 0.85%% Explained by matching 0.91 0.99 0.80# Treatment 16,656 11,138 5,518# Control 143,576 99,735 43,841T-stat (from bootstrap) (1.07) (0.13) (1.91)
waves—initial conditions explain 23% of the difference on the wave while 33%of the difference off the wave. On the sales side, most of the differences betweenpublic and private firms can be explained by initial selection. Controlling forinitial public quality, public firms are no longer more likely to sell assets thanprivate firms. Initial quality selection explains almost all of the difference foroff-the-wave sales and 80% of the difference for on-the-wave sales.
Two factors may explain our findings. First, through initial quality (such assize and productivity), we are able to capture the capacity to be public, but notthe willingness. Some entrepreneurial firms may have the same initial qualityto become public but choose to stay private to maintain a quiet life (Bertrandand Mullainathan (2003)) or to maintain control by insiders for other reasons.In that case, public status is a signal of both quality and preference.
Alternatively, our results can suggest that being public does make a differ-ence when it comes to access to financing. Public firms have better access tocapital markets in general, and benefit even more when credit becomes more

Private and Public Merger Waves 2209
readily available. Therefore, they are more likely to engage in acquisitions inthe presence of good opportunities. The asymmetry in our findings betweensales and purchases suggests that, as expected, the advantage of being publicthrough better access to capital is more prominent for acquisitions, while assetsales are driven more by firm fundamentals and initial conditions.
In addition to this matching exercise, we further examine endogenous selec-tion into public status, by running the regression model of Table II by quartilesof firms based on their predicted probability of being public. We first separatefirms in quartiles (Q1 to Q4) based on the predicted probability of being pub-lic, with Q1 firms having the lowest probability and Q4 having the highestprobability. Not surprisingly, the percentage of public firms increases over thequartiles. For example, less than 2% of the firms in Q1 are public, comparedto 27% of the firms in Q4. The transaction rate (both purchases and sales) ismonotonically increasing from Q1 to Q4.
We use these quartiles of predicted public status to reestimate the decisionto buy and sell assets based on firm, industry, and macro factors for each groupseparately using the same specification as in Table II. These results allow us toassess whether firms based on their predicted probability of being public (andnot actual public status) have differential sensitivity to credit spreads and theS&P stock market index. These results, presented in the Internet Appendix,show that the Q4 group has a much higher sensitivity to credit spreads ascompared to the Q1 group in terms of both the purchase and the sale of assets.These results parallel our earlier findings using samples of firms that areactually public and private, suggesting that a large portion of the differencein observed acquisition behavior between public and private firms is indeeddriven by differences in fundamentals early in a firm’s life. Larger and moreproductive firms self-select to become public, and later these firms participatemore in asset purchases and sales when opportunities arise.
We further control for selection effects when we focus on the subsample ofQ4 firms with a high probability of being public and divide them based ontheir actual public status. Private Q4 firms are those firms that we predict,based on initial fundamentals, to be public in future years but are in factprivate when observed 5 or more years later. For acquisition decisions, theyhave a higher sensitivity to macro conditions, such as credit spreads or theaggregate wave indicator, than private firms, but a lower sensitivity than pub-lic Q4 firms that are in fact public. However, this difference between publicand private firms in the Q4 subsample is smaller than the difference betweenpublic and private firms overall. These results thus show that actual publicstatus affects acquisition decisions but to a smaller degree after accounting forselection.
We find even smaller differences between public and private Q4 firms fordecisions to sell assets. Private Q4 firms have a much higher sensitivity tocredit spreads and to the aggregate wave indicator than do the full sampleof private firms. The marginal effect of credit spreads on sales decisions forprivate Q4 firms is much closer to that of public firms. Our results remainqualitatively the same when we use an exclusion window of 10 years.

2210 The Journal of Finance R©
V. Postsale Performance on Merger Waves: Private and Public Firms
A. Public Status and Changes in Productivity
To further pinpoint the effect of fundamentals and financial markets in driv-ing merger waves, we now examine changes in productivity for the transactedplants on and off the wave. If the higher participation of public firms on thewave is driven by differences in their productivity and growth opportunities,then acquisitions of public firms should perform at least as well as or betterthan acquisitions by private firms. Alternatively, if public firms acquire more onthe wave to take advantage of their more favorable access to financial marketsrather than to realize synergies, then we should observe worse performancefrom public acquirers than private acquirers on the wave.
Table IX examines changes in productivity for transacted plants aroundacquisitions for both off- and on-the-wave mergers. We measure changes inproductivity at the plant level using three windows, (−1, 1), (−1, 2), and (−1,3), with year 0 being the transaction year. Since firms may choose to sell acertain type of plant, we correct for selection bias following Heckman (1979)in all of our regressions. We first use a similar specification as in Table III,columns 1 and 2, to predict the outcome of being sold at the plant level. As inTable III, we also estimate the model separately for public and private firms toallow for differences in sensitivity to firm, industry, and macro factors betweenthe two groups. We then include the inverse Mills ratio or Heckman’s lambdain our second-stage regressions when we examine changes in productivity fortransacted plants. In all of our specifications, Heckman’s lambda is negativeand significant, suggesting that it is necessary to correct for selection bias.
Panel A shows that on average transacted plants have bigger improvementsin productivity than nontransacted plants. The coefficient on D Sale , the indi-cator for whether the plant is sold, is significantly positive at the 1% level in allof our specifications, consistent with acquisitions being on average value en-hancing. Moreover, the interaction between D Sale and D Wave, the indicatorfor aggregate wave years, is positive and significant, suggesting that on-the-wave acquisitions experience even greater improvements in productivity. Forexample, 2 years after acquisition, plants that are sold have a 3.4% increase inproductivity compared to nontransacted plants, and on-the-wave transactionsrealize a 2% additional productivity increase compared to off-the-wavetransactions.
Rhodes-Kropf and Robinson (2008) provide evidence that synergies frommergers are greatest when high productivity firms take over other high produc-tivity firms. We find that public firms are more productive than private firms ingeneral and their sensitivity to productivity is higher. Yan (2006) and Duchinand Schmidt (2008) find that on-the-wave horizontal mergers are followed bypoor stock and operating performance. By contrast, we find that on-the-wavetransactions create bigger efficiency gains. There are several notable differ-ences between our study and theirs. First, we examine efficiency gains ratherthan stock returns. The two findings are not necessarily inconsistent, in thatacquiring firms may overpay for real synergies. Second, due to the unique

Private and Public Merger Waves 2211
Table IXChanges in Productivity
This table reports regression estimates on changes in TFP on the plant level. D Sale is an indicatorvariable that equals one if the plant is sold and zero otherwise. D Wave is an indicator variable thatequals one for aggregate merger wave years and zero otherwise. PrvtoPrv indicates transactionsbetween private firms, and PubtoPub indicates transactions between public firms. PrvtoPub indi-cates transactions between private sellers and public buyers, and PubtoPrv indicates transactionsbetween public buyers and private sellers. Lambda is estimated as the inverse Mills ratio basedon a first-stage selection model in which we predict the probability of being sold (based on TableII, Panel B). TFP and Ln(output) measure total factor productivity and the log of output level forthe plant, respectively. TFP(–1, 1) is the change in TFP from t – 1 to t + 1 with t being the currentyear. Similarly, TFP(–1, 2) and TFP(–1, 3) measure the change in TFP from t – 1 to t + 2 andt + 3, respectively. Industry (based on three-digit SIC) fixed effects are included. Robust standarderrors allow for clustering at the industry-year level and are reported in parentheses. *, **, and*** represent significance at the 10%, 5%, and 1% level, respectively
TFP (–1, 1) TFP (–1, 2) TFP (–1, 3)
(1) (2) (3) (4) (5) (6)
Panel A: Regression 1
D Sale 0.020*** 0.014*** 0.034*** 0.028*** 0.028*** 0.021***(0.00) (0.01) (0.01) (0.01) (0.00) (0.01)
D Wave –0.005* –0.009*** –0.003(0.00) (0.00) (0.00)
D Sale × D Wave 0.021*** 0.020** 0.024**(0.01) (0.01) (0.01)
Lamda –0.065*** –0.066*** –0.074*** –0.078*** –0.056** –0.057*(0.02) (0.02) (0.03) (0.03) (0.03) (0.03)
TFP –0.019*** –0.019*** –0.032*** –0.032*** –0.036*** –0.036***(0.01) (0.01) (0.01) (0.01) (0.01) (0.01)
Ln(Output) 0.054*** 0.054*** 0.064*** 0.064*** 0.066*** 0.066***(0.00) (0.00) (0.00) (0.00) (0.00) (0.00)
Constant –0.389*** –0.384*** –0.475*** –0.467*** –0.543*** –0.541***(0.05) (0.05) (0.06) (0.06) (0.07) (0.07)
R-Square 1.46% 1.46% 1.70% 1.70% 1.61% 1.61%Number of obs. 745,940 745,940 624,899 624,899 513,743 513,743
Panel B: Regression 2
PrvtoPrv 0.004 0.002 0.013** 0.006 0.003 –0.001(0.01) (0.01) (0.01) (0.01) (0.01) (0.01)
PrvtoPub 0.020** 0.010 0.023** 0.020* 0.028*** 0.026**(0.01) (0.01) (0.01) (0.01) (0.01) (0.01)
PubtoPrv 0.046*** 0.043*** 0.067*** 0.072*** 0.043*** 0.037**(0.01) (0.01) (0.01) (0.01) (0.01) (0.02)
PubtoPub 0.034*** 0.023 0.066*** 0.058*** 0.071*** 0.055***(0.01) (0.02) (0.01) (0.02) (0.01) (0.02)
D Wave –0.005* –0.009*** –0.003(0.00) (0.00) (0.00)
PrvtoPrv × D Wave 0.008 0.029 0.014(0.02) (0.02) (0.01)
PrvtoPub × D Wave 0.032* 0.009 0.007(0.02) (0.02) (0.02)
(Continued)

2212 The Journal of Finance R©
Table IX—Continued
TFP (–1, 1) TFP (–1, 2) TFP (–1, 3)
(1) (2) (3) (4) (5) (6)
Panel B: Regression 2
PubtoPrv × D Wave 0.009 –0.012 0.017(0.02) (0.02) (0.02)
PubtoPub × D Wave 0.028* 0.024 0.039*(0.02) (0.02) (0.02)
Lambda –0.064*** –0.066*** –0.075*** –0.078*** –0.056** –0.057*(0.02) (0.02) (0.03) (0.03) (0.03) (0.03)
TFP –0.019*** –0.019*** –0.032*** –0.032*** –0.036*** –0.036***(0.01) (0.01) (0.01) (0.01) (0.01) (0.01)
Ln(Output) 0.054*** 0.054*** 0.064*** 0.064*** 0.066*** 0.066***(0.00) (0.00) (0.00) (0.00) (0.00) (0.00)
Constant –0.389*** –0.384*** –0.474*** –0.465*** –0.542*** –0.540***(0.05) (0.05) (0.06) (0.06) (0.07) (0.07)
R-Square 1.46% 1.46% 1.70% 1.71% 1.62% 1.62%Number of obs. 745,940 745,940 624,899 624,899 513,743 513,743
feature of the Census data set, we are able to track transacted plants beforeand after the acquisition whereas the other studies examine changes in oper-ating performance for all of the assets managed by the acquirer. In additionaltests, we find that acquirers’ existing plants do not perform worse compared toother plants within the industry.
Panel B presents results when we divide transactions based on the publicstatus of the buyer and the seller. Except for private-to-private transactions(PrvtoPrv), all other types of transactions have positive post-transaction pro-ductivity gains significant at the 5% level. Across the four groups, changes inproductivity for on-the-wave acquisitions are positive and either significantlyhigher than or statistically indistinguishable from changes in productivity foroff-the-wave acquisitions. In particular, on-the-wave transactions between pub-lic firms are associated with post-transaction productivity gains—plants soldbetween public firms increase productivity 5% to 10% in the next 3 years.Both of these results, namely, on-the-wave mergers generating more efficiencygains and public-to-public transactions generating bigger improvements in pro-ductivity, suggest that the higher incidence of such mergers may be the con-sequence of higher expected synergies. In addition, our findings have implica-tions for corporate governance in public and private firms. Acquisition decisionsmade in public firms may result in productivity gains from more efficient orskilled management.
B. Valuation and Changes in Productivity
Our results in Table V show that public firms are more likely to make ac-quisitions when their unexplained valuation (UV) is high. If highly valued
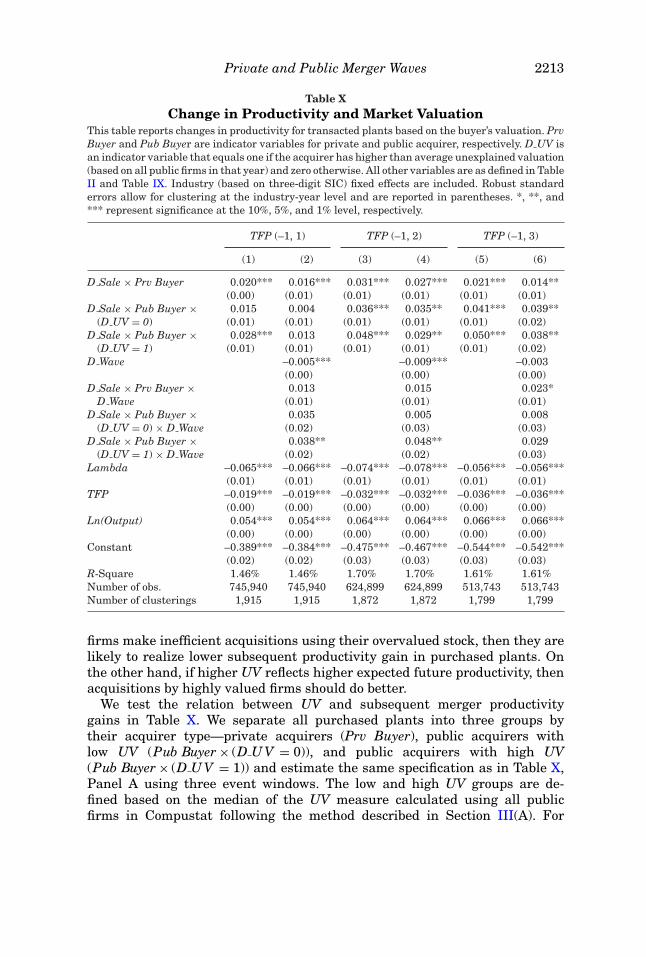
Private and Public Merger Waves 2213
Table XChange in Productivity and Market Valuation
This table reports changes in productivity for transacted plants based on the buyer’s valuation. PrvBuyer and Pub Buyer are indicator variables for private and public acquirer, respectively. D UV isan indicator variable that equals one if the acquirer has higher than average unexplained valuation(based on all public firms in that year) and zero otherwise. All other variables are as defined in TableII and Table IX. Industry (based on three-digit SIC) fixed effects are included. Robust standarderrors allow for clustering at the industry-year level and are reported in parentheses. *, **, and*** represent significance at the 10%, 5%, and 1% level, respectively.
TFP (–1, 1) TFP (–1, 2) TFP (–1, 3)
(1) (2) (3) (4) (5) (6)
D Sale × Prv Buyer 0.020*** 0.016*** 0.031*** 0.027*** 0.021*** 0.014**(0.00) (0.01) (0.01) (0.01) (0.01) (0.01)
D Sale × Pub Buyer × 0.015 0.004 0.036*** 0.035** 0.041*** 0.039**(D UV = 0) (0.01) (0.01) (0.01) (0.01) (0.01) (0.02)
D Sale × Pub Buyer × 0.028*** 0.013 0.048*** 0.029** 0.050*** 0.038**(D UV = 1) (0.01) (0.01) (0.01) (0.01) (0.01) (0.02)
D Wave –0.005*** –0.009*** –0.003(0.00) (0.00) (0.00)
D Sale × Prv Buyer × 0.013 0.015 0.023*D Wave (0.01) (0.01) (0.01)
D Sale × Pub Buyer × 0.035 0.005 0.008(D UV = 0) × D Wave (0.02) (0.03) (0.03)
D Sale × Pub Buyer × 0.038** 0.048** 0.029(D UV = 1) × D Wave (0.02) (0.02) (0.03)
Lambda –0.065*** –0.066*** –0.074*** –0.078*** –0.056*** –0.056***(0.01) (0.01) (0.01) (0.01) (0.01) (0.01)
TFP –0.019*** –0.019*** –0.032*** –0.032*** –0.036*** –0.036***(0.00) (0.00) (0.00) (0.00) (0.00) (0.00)
Ln(Output) 0.054*** 0.054*** 0.064*** 0.064*** 0.066*** 0.066***(0.00) (0.00) (0.00) (0.00) (0.00) (0.00)
Constant –0.389*** –0.384*** –0.475*** –0.467*** –0.544*** –0.542***(0.02) (0.02) (0.03) (0.03) (0.03) (0.03)
R-Square 1.46% 1.46% 1.70% 1.70% 1.61% 1.61%Number of obs. 745,940 745,940 624,899 624,899 513,743 513,743Number of clusterings 1,915 1,915 1,872 1,872 1,799 1,799
firms make inefficient acquisitions using their overvalued stock, then they arelikely to realize lower subsequent productivity gain in purchased plants. Onthe other hand, if higher UV reflects higher expected future productivity, thenacquisitions by highly valued firms should do better.
We test the relation between UV and subsequent merger productivitygains in Table X. We separate all purchased plants into three groups bytheir acquirer type—private acquirers (Prv Buyer), public acquirers withlow UV (Pub Buyer × (D U V = 0)), and public acquirers with high UV(Pub Buyer × (D U V = 1)) and estimate the same specification as in Table X,Panel A using three event windows. The low and high UV groups are de-fined based on the median of the UV measure calculated using all publicfirms in Compustat following the method described in Section III(A). For

2214 The Journal of Finance R©
robustness, we repeat our analysis using alternative grouping methods suchas (1) using industry-adjusted UV and (2) defining the high UV group based onthe 75th percentile rather than the median. The results are qualitatively thesame.
Table X shows that transacted plants in all three groups experience gains inproductivity following the acquisition, with the gains largest for public buyerswith high UV. Three years following the transaction, plants purchased bypublic acquirers with high UV realize a 5% gain in productivity, compared to2.1% and 4.1% when acquirers are private firms and public firms with lowUV, respectively. Moreover, when we interact the acquirer group indicator andthe indicator for aggregate wave years, we see an additional large incrementaleffect for public buyers on the wave when they have high UV. This effect persistsfor up to 2 years after the transaction.
For robustness, in our Internet Appendix we use the annualized stock re-turn as an alternative valuation measure. Similar to Table X, we separate allpurchased plants into three groups by their acquirer type—private acquires,public acquirers with low returns, and public acquirers with high returns.We find that, for public firms, the efficiency gains are bigger for acquirerswith high recent stock returns. For example, 3 years following the transaction,plants purchased by public acquirers with high returns realize a 7.4% gain inproductivity, compared to 2.6% for acquirers with low past returns. There is anadditional productivity gain in aggregate wave years but this additional gainis concentrated in low-return acquirers, suggesting that high-return acquirersconsistently do better while low-return acquirers have additional gains on thewave.20
In sum, adding UV and stock returns to our specifications provides new in-sights, but does not change any of our previous results. UV predicts higherparticipation in acquisition activity for public firms. Changes in productivityfor transacted plants remain positive, both on and off the wave, and are par-ticularly high for public buyers with high stock market valuation in aggregatewave years. This evidence is consistent with public buyers paying for synergiesas they are more likely to buy with highly valued stock but still make pro-ductivity improvements ex post. This result is consistent with high valuationsfacilitating productive mergers, even if potentially at the wrong price.
VI. Conclusions
We examine the participation of public and private firms in merger waves.We find that public firms participate in the market for assets more than privatefirms, in terms of both purchases and sales, and especially so during mergerwaves. Acquisitions by public firms are more likely to lead to increases in the
20 For robustness, we repeat this analysis using alternative grouping methods such as (1) usingindustry-adjusted unexplained valuation and (2) defining the high UV group based on the 75thpercentile rather than the median. The results are qualitatively the same.

Private and Public Merger Waves 2215
productivity of acquired assets, especially in transactions between public firmsand when public acquirers have higher valuations and stock market liquidity.
Our paper enhances our understanding of mergers and acquisitions acrossdifferent organization forms and over the business cycle. First, we find that bothefficiency and financial access affect acquisition decisions. Firms with higherproductivity are more likely to buy assets and firms with lower productivityare more likely to sell assets, and transacted plants improve in productivity.Further, the higher participation of public firms is due in part to their betteraccess to financial markets. Among all public firms, those with a better creditrating and more liquid stock are more likely to buy and sell assets. We showthat acquisition decisions of public firms with intermediate access to the capitalmarket (low-rated and medium-liquidity firms) are most sensitive to creditspreads. Public firms that do not have a credit rating, on the other hand,behave like private firms.
Second, differences in participation between public and private firms are notdriven just by contemporaneous efficiency and valuation. Firms with higherproductivity and greater anticipation of future growth choose to become publicand later participate more in acquisitions when opportunities rise. Using initialconditions at birth, we show that initial quality explains a significant portion ofvariation in public status 5 or 10 years later as well as subsequent acquisitionbehavior. Productive firms self-select to become public and later participatemore in the market for corporate assets as both buyers and sellers in ways thatincrease the productivity of the acquired assets. Hence, a firm’s later financialpolicies are predictable based on its early characteristics before going public.There are thus differences between firms that persist over many years andthat affect their behavior and value creation. Purchases and sales of assets aredriven in part by firm characteristics that are set when a firm is created by itsentrepreneur.
Third, consistent with neoclassical theories, Maksimovic and Phillips (2001,2002) and Yang (2008), we find that mergers that occur on the wave areassociated with greater efficiency improvements. In particular, acquisitionsby public firms during wave years realize bigger productivity gains. We findlittle evidence that merger waves are causing economic inefficiency. We dofind that public firms with high UV and high stock market liquidity are morelikely to engage in acquisitions. However, those transactions also result ingreater productivity gains, although we do not know whether the efficiencygains from these reallocations create sufficient value to the acquiring firms’shareholders to cover the premiums usually paid. The finding that highly val-ued acquirers do better in terms of productivity improvements suggests thatthere might be some economic rationale for high UV with the high valua-tions resulting from the capitalized value of future synergies or productivitygains.
Our results also have implications for corporate governance. We find thatpublic firms make better acquisition decisions than private firms as judged byefficiency gains despite potential conflicts due to separation of ownership andcontrol in public firms. This finding suggests that gains from access to capital

2216 The Journal of Finance R©
for productive firms may outweigh the potential costs from the separation ofownership and control.
Initial submission: September 20, 2010; Final version received: April 1, 2013Editor: Campbell Harvey
REFERENCES
Andrade, Gregor, Mark Mitchell, and Eric Stafford, 2001, New evidence and perspectives on merg-ers, Journal of Economic Perspectives 15, 103–120.
Asker, John, Joan Farre-Mensa, and Alexander Ljungqvist, 2010, Does the stock market distortinvestment incentives? Working paper, New York University.
Asker, John, Joan Farre-Mensa, and Alexander Ljungqvist, 2011, Comparing the investment be-havior of public and private firms, NBER working paper No. w17394. National Bureau ofEconomic Research.
Bertrand, Marianne, and Sendhil Mullainathan, 2003, Enjoying the quiet life? Corporate gover-nance and managerial preferences, Journal of Political Economy 111, 1043–1075.
Betton, Sandra, B. Espen Eckbo, and Karin S. Thorburn, 2008, Corporate takeovers, in B.E. Eckbo,ed.: Handbook of Corporate Finance: Empirical Corporate Finance (Elsevier, North-Holland).
Brau, James C., and Stanley E. Fawcett, 2006, Initial public offerings: An analysis of theory andpractice, Journal of Finance 61, 399–436.
Brav, Omer, 2009, Access to capital, capital structure and the funding of the firm, Journal ofFinance 64, 263–308.
Celikyurt, Ugur, Merih Sevilir, and Anil Shivdasani, 2010, Going public to acquire? The acquisitionmotive in IPOs, Journal of Financial Economics 96, 345–363.
Davis, Stephen, John Haltiwinger, Ron Jarmin, Joshua Lerner, and Javier Miranda, 2010, Privateequity and employment, Working paper, Center for Economic Studies.
Dittmar, Amy, and Robert Dittmar, 2008, Timing of financial decisions: An examination of thecorrelation in financing waves, Journal of Financial Economics 90, 59–83.
Duchin, Ran, and Breno Schmidt, 2008, Riding the merger wave, Working paper, University ofMichigan and University of Southern California.
Eisfeldt, Andrea, and Adriano Rampini, 2006, Capital reallocation and liquidity, Journal of Mone-tary Economics 53, 369–399.
Faulkender, Michael, and Mitchell A. Petersen, 2006, Does the source of capital affect capitalstructure? Review of Financial Studies 19, 45–79.
Harford, Jared, 2005, What drives merger waves? Journal of Financial Economics 77, 529–560.Heckman, James J., 1979, Sample selection bias as a specification error, Econometrica 47, 153–161.Hoberg, Gerard, and Gordon Phillips, 2010, Real and financial industry booms and busts, Journal
of Finance 65, 45–86.Hovakimian, Armen, and Irena Hutton, 2008, Merger-motivated IPOs, Working paper, CUNY and
Florida State University.Hovakimian, Armen, Ayla Kayhan, and Sheridan Titman, 2009, Credit rating targets, Working
paper, University of Texas.Jarmin, Ron, and Javier Miranda, 2002, The longitudinal business database, Working paper,
Center for Economic Studies.Kovenock, Dan, and Gordon Phillips, 1997, Capital structure and product market behavior: An
examination of plant exit and investment decisions, Review of Financial Studies 10, 767–803.Lemmon, Michael, Michael Roberts, and Jaime Zender, 2008, Back to the beginning: Persistence
and the cross-section of capital structure, Journal of Finance 63, 1575–1608.Lown, Cara, Donald Morgan, and Sonali Rohatgi, 2000, Listening to loan officers: The impact of
commercial credit standards on lending and output, Economic Policy Review 6, 1–16.Maksimovic, Vojislav, and Gordon Phillips, 2001, The market for corporate assets: Who engages
in mergers and asset sales and are there gains? Journal of Finance 56, 2019–2065.

Private and Public Merger Waves 2217
Maksimovic, Vojislav, and Gordon Phillips, 2002, Do conglomerate firms allocate resources ineffi-ciently across industries? Journal of Finance 57, 721–767.
McGuckin, Robert H., and George A. Pascoe, 1988, The longitudinal research database (LRD):Status and research possibilities. U.S. Department of Commerce, Bureau of the Census.
Mitchell, Mark L., and Harold J. Mulherin, 1996, The impact of industry shocks on takeover andrestructuring activity, Journal of Financial Economics 41, 193–229.
Moeller, Sara B., Frederik P. Schlingemann, and Rene M. Stulz, 2006, Wealth destruction on amassive scale? A study of acquiring-firm returns in the recent merger wave, Journal of Finance60, 757–782.
Morck, Randall, Andrei Shleifer, and Robert W. Vishny, 1990, Do managerial objectives drive badacquisitions? Journal of Finance 45, 31–48.
Mulherin, J. Harold, and Audra L. Boone, 2000, Comparing acquisitions and divestitures, Journalof Corporate Finance 6, 117–139.
Netter, Jeffry, Michael Stegemoller, and Modupe Wintoki, 2011, Implications of data screens onmerger and acquisition analysis: A large sample study of mergers and acquisitions from 1992-2009, Review of Financial Studies 24, 2242–2285.
Rau, P. Raghavendra, and Aris Stouraitis, 2011, Patterns in the timing of corporate event waves,Journal of Quantitative Analysis 46, 209–246.
Rhodes-Kropf, Matthew, David T. Robinson, and S. Viswanathan, 2005. Valuation waves andmerger activity: The empirical evidence, Journal of Financial Economics 77, 561–603.
Rhodes-Kropf, Matthew, and David Robinson, 2008, The market for mergers and the boundariesof the firm, Journal of Finance 63, 1169–1211.
Rhodes-Kropf, Matthew, and S. Viswanathan, 2005, Market valuation and merger waves, Journalof Finance 59, 2685–2718.
Schlingemann, Frederik P., Rene M. Stulz, and Ralph A. Walkling, 2002, Divestitures and theliquidity of the market for corporate assets, Journal of Financial Economics 64, 117–144.
Servaes, Henri, 1997, The value of diversification during the conglomerate merger wave, Journalof Finance 51, 1201–1225.
Shleifer, Andrei, and Robert W. Vishny, 2003, Stock market driven acquisitions, Journal of Finan-cial Economics 70, 295–311.
Yan, Jinghua, 2006, Merger waves: Theory and evidence, Working paper, University of Pennsylva-nia.
Yang, Liu, 2008, The real determinants of asset sales, Journal of Finance 63, 2231–2262.