prison capacity - wa
TRANSCRIPT

Prison Capacity 2015 Report to the Legislature
As Required by Engrossed Substitute Senate Bill 6052 and Second Engrossed
House Bill 1115
February 2016
Dan Pacholke, Secretary [email protected]

2 | P a g e
Washington State Department of Corrections 2015 Prison Capacity Report to the Legislature
Table of Contents
Table of Contents ...............................................................................................................................2
Executive Summary ............................................................................................................................5
Report Overview ................................................................................................................................7
Maple Lane Background .....................................................................................................................8
Capital Cost and Timing ............................................................................................................................ 8
Cost to Operate ......................................................................................................................................... 9
Recommended Solution to Increase Prison Capacity ......................................................................... 10
Options Deemed Non-Feasible ............................................................................................................... 11
Classification, Custody, and Security ................................................................................................. 16
Conversion of Existing Minimum Security Housing Units to Medium ................................................. 19
Medium Security Standards .................................................................................................................... 20
Methods of Conversion ........................................................................................................................... 20
Length of Time to Complete ................................................................................................................... 21
Changes to Capacity ................................................................................................................................ 21
Feasibility ................................................................................................................................................ 21
Capital and Operating Costs.................................................................................................................... 23
Determination of Costs to Convert Empty Prison Beds to Medium Security ....................................... 24
Architectural Considerations .................................................................................................................. 24
Methods of Conversion ........................................................................................................................... 26
Length of Time to Complete ................................................................................................................... 28
Costs and Capacity .................................................................................................................................. 28
Feasibility ................................................................................................................................................ 29
Units within WSP-Old Main: 1, 4, and 7 .................................................................................................. 31
Examination of DOC’s and Other States’ Custody Designation Policies ............................................... 34
Minnesota and Connecticut (low rank in rate of prison incarceration) ................................................. 36
Alabama and Oklahoma (high rank in rate of prison incarceration) ...................................................... 36
Colorado and Oregon (moderate rank in rate of prison incarceration) ................................................. 37
Cost Scenario: Facilities that Operate at Different Security Levels ........................................................ 40
Possibilities to Utilize Local Jail Beds for Medium Security ................................................................. 41
Prisons and Jails: Designed for Different Populations ............................................................................ 41
Cost Scenario: The Yakima County Corrections Center .......................................................................... 42
Expansion of Work Release to Reduce the Need for Minimum Security Beds ..................................... 43

3 | P a g e
Washington State Department of Corrections 2015 Prison Capacity Report to the Legislature
AVWR Background .................................................................................................................................. 43
Bellingham WR Background .................................................................................................................... 43
Work Release Expansion ......................................................................................................................... 43
Length of Time to Complete ................................................................................................................... 44
Costs and Capacity .................................................................................................................................. 44
Feasibility and Impact ............................................................................................................................. 45
References ....................................................................................................................................... 46
Appendix A – High Security Compared to Minimum Security Fencing ................................................ 47
Photo 1. High Security Fencing with Armed Tower at WSP ................................................................... 47
Photo 2. Minimum Security Fence at AHCC – MSU ............................................................................... 47
Appendix B – Facility Aerial Photos ................................................................................................... 48
Photo 3. AHCC Site ................................................................................................................................. 48
Photo 4. AHCC - MSU ............................................................................................................................. 48
Photo 5. AVWR ....................................................................................................................................... 49
Photo 6. Bellingham WR ........................................................................................................................ 49
Photo 7. CCCC......................................................................................................................................... 50
Photo 8. SCCC Site .................................................................................................................................. 51
Photo 9. SCCC – IMU .............................................................................................................................. 51
Photo 10. WSP Site ................................................................................................................................. 52
Photo 11. WSP-Old Main and WSP-MSU ............................................................................................... 52
Appendix C – Architectural Assessments by Integrus Architecture ..................................................... 53
Assessment 1. AHCC-MSU...................................................................................................................... 53
Assessment 2. CCCC ............................................................................................................................... 54
Assessment 3. MCC-TRU E Building ....................................................................................................... 55
Assessment 4. MCC-WSR Building 3A .................................................................................................... 56
Assessment 5. MCC-WSR Cellhouse 3 .................................................................................................... 57
Assessment 6. SCCC-IMU F Unit ............................................................................................................. 58
Assessment 7. WSP-Old Main Unit 1 ..................................................................................................... 59
Assessment 8. WSP-Old Main Unit 4 ..................................................................................................... 61
Assessment 9. WSP-Old Main Unit 7 ..................................................................................................... 63
Assessment 10. WSP-Old MSU ............................................................................................................... 65
Appendix D – Definitions for Capital Costs ........................................................................................ 66
Appendix E – Explanation of Operating Costs (FY2015 and Revised Estimated) .................................. 67

4 | P a g e
Washington State Department of Corrections 2015 Prison Capacity Report to the Legislature
Appendix F – Interior Photos of Cellhouse 3 ...................................................................................... 69
Photo 12. Hallway in Cellhouse 3 ........................................................................................................... 69
Photo 13. Control Booth for Cellhouse 3 ............................................................................................... 69
Appendix G – ASCA Survey Custody Designation Definitions ............................................................. 70
Appendix H – Summary of Sampled States’ Classification Models ...................................................... 71
Appendix I – Summary of Jails and Prisons in Washington State (BERK, 2014) .................................... 74

5 | P a g e
Washington State Department of Corrections 2015 Prison Capacity Report to the Legislature
Department of Corrections
Prison Capacity
2015 Report to the Legislature
Executive Summary The 2015 Legislature directed the Department of Corrections (DOC) to explore options to increase prison
capacity at medium security through various approaches. The DOC is near capacity and the Caseload
Forecast Council (CFC), through its adopted June 2015 forecast, projects the offender caseload to exceed
capacity in the near future. While a shortage is estimated for both minimum and medium security beds,
medium security beds have been the most critical need. For example, a shortage of over 1,000 beds is
expected by Fiscal Year (FY) 2024, of which, will include a shortage of approximately 1,100 medium
security beds. The DOC is also experiencing a shortage at minimum security and expects to have a
shortage of over 200 minimum security beds in FY2024.
The Legislature, through provisos in both the enacted operating and capital budget bills have asked DOC
to report on the following ways to alleviate the need for medium security beds:
Report on methods of converting existing minimum security housing units to medium security
Determine costs to convert any empty prison beds to medium security
Explore possibilities to utilize local jail beds for medium security
Review its policies that determine custody designations and examine other states' policies
The DOC contracted with Integrus Architecture to estimate the capital costs for converting existing
minimum security housing units and empty housing units to medium security and provided its own
estimates for operating costs. The possibility of using local jail beds in lieu of prison beds has been
explored in response to previous legislation which resulted in BERK’s (2014) Analysis of Statewide
Correctional Needs and Costs and DOC’s Use of Yakima County Corrections Center Report (2014) and
served as key sources in the present report. The DOC worked with the Association of State Correctional
Administrators (ASCA) to conduct a multi-state survey to gauge the distribution of individual states’
prison populations across the custody designations of close, medium, and minimum and to examine
their classification policies.
The DOC explored all of the above-mentioned options as ways to reduce the need for medium security
prison capacity and also went beyond legislative directive and explored opportunities to expand work
release as a way to reduce the need for minimum security beds. All options were compared to the cost

6 | P a g e
Washington State Department of Corrections 2015 Prison Capacity Report to the Legislature
and timing of new prison construction and examined for their impact on correctional practices, safety
and security in particular.
The following are options that may increase prison capacity in the most cost-efficient, timely manner, in
order by feasibility:
Most Feasible
Utilize Maple Lane (a vacant juvenile detention facility owned by DOC that is currently being
assessed as part a capital project to convert it to a 700-bed medium security adult male prison),
to increase medium security prison capacity.
Convert existing empty housing units such as E Building located within Monroe Correctional
Complex – Twin Rivers Unit (MCC-TRU) and Building 3A located within MCC – Washington State
Reformatory (MCC-WSR) to medium security (which would provide a total of 112 medium
security beds).
Expand work release capacity by 121 work release beds at Ahtanum View Work Release (AVWR)
and Bellingham Work Release (Bellingham WR) to reduce the need for minimum security beds.
Somewhat Feasible
Convert an existing empty housing unit such as F Unit at Stafford Creek Corrections Center –
Intensive Management Unit (SCCC-IMU) to provide 72 medium security beds by making certain
operational modifications to mitigate security risks the conversion might otherwise present.
Not Feasible
Convert any existing minimum security housing unit such as a standalone or co-located
minimum security facility to medium security.
Convert an empty housing unit (Cellhouse 3) located within MCC-WSR and multiple empty
housing units (Units 1, 4, and 7) at Washington State Penitentiary – Old Main (WSP-Old Main) to
medium security.
Convert existing minimum security beds located within the WSP-Old Main to medium security.
Feasibility Undetermined
Using jail beds in lieu of medium security prison beds is possible provided that substantial
modifications are made to the physical plant of a given jail. It is difficult to assess feasibility
without a specific jail option to examine.
Modifying a classification policy only to solve DOC’s prison capacity problem is not
recommended as it may pose risks to safety. DOC could more effectively gauge feasibility of a
potential classification policy change provided a specific policy change was identified.

7 | P a g e
Washington State Department of Corrections 2015 Prison Capacity Report to the Legislature
This report will detail the advantages and challenges of the different ways to increase capacity at
medium security. Because DOC’s population is predominately male (around 93%), this report focuses on
options for facilities housing male offenders.
Report Overview The DOC is at 99% of prison capacity and is projected to soon exceed capacity if no actions are taken.
Based on the adopted June 2015 forecast of the CFC, a shortage of over 1,000 beds is expected by
FY2024, of which, will include a shortage of approximately 1,100 medium security beds. The shortage of
beds at the medium security level may be greater than DOC’s overall bed shortage because of a surplus
of beds at other security levels. Beds at other security levels are not suitable for medium custody
offenders and cannot be used to house this population efficiently.
The legislature, through two bills passed during the 2015 legislative session, directed DOC to explore
options to increase prison capacity for beds at the medium security level through different approaches.
Engrossed Substitute Senate Bill 6052 (ESSB 6052), Section 220(2)(f) states:
“In an effort to reduce its need for medium security beds, the department shall review options to
meet capacity needs in the most cost-efficient manner without compromising safety. The
department shall at a minimum review its policies that determine custody levels, including
examining other states' policies and determine costs to convert any empty prison beds to
medium security and possibilities to utilize local jail beds for this purpose. The department must
evaluate the options on both a short-term and long-term basis against the cost and timing of any
proposal to build a new prison facility. The department shall report its findings and
recommendations to the appropriate committees of the legislature by December 1, 2015.”
A very similar directive was included in the Capital Budget Bill, Second Engrossed House Bill 1115 (2EHB
1115), Section 2059(2) which states:
“The department shall report to the senate ways and means committee, the house of
representatives capital budget committee, and the governor's office options on methods of
converting existing minimum security housing units to medium security housing units. The report
must contain methods, construction cost estimates, length of time to complete, facility locations
where this is feasible, and changes to capacity.”
This report responds to requirements pertaining to potential ways to address the shortfall of medium
security beds as outlined in ESSB 6052 and 2EHB 1115. This report also explores an option beyond
legislative requirement: expanding work release capacity to help reduce the demand for minimum
security beds. The DOC is also experiencing a shortage at minimum security and expects to have a
shortage of over 200 minimum security beds in FY2024.
8 | P a g e
Washington State Department of Corrections 2015 Prison Capacity Report to the Legislature
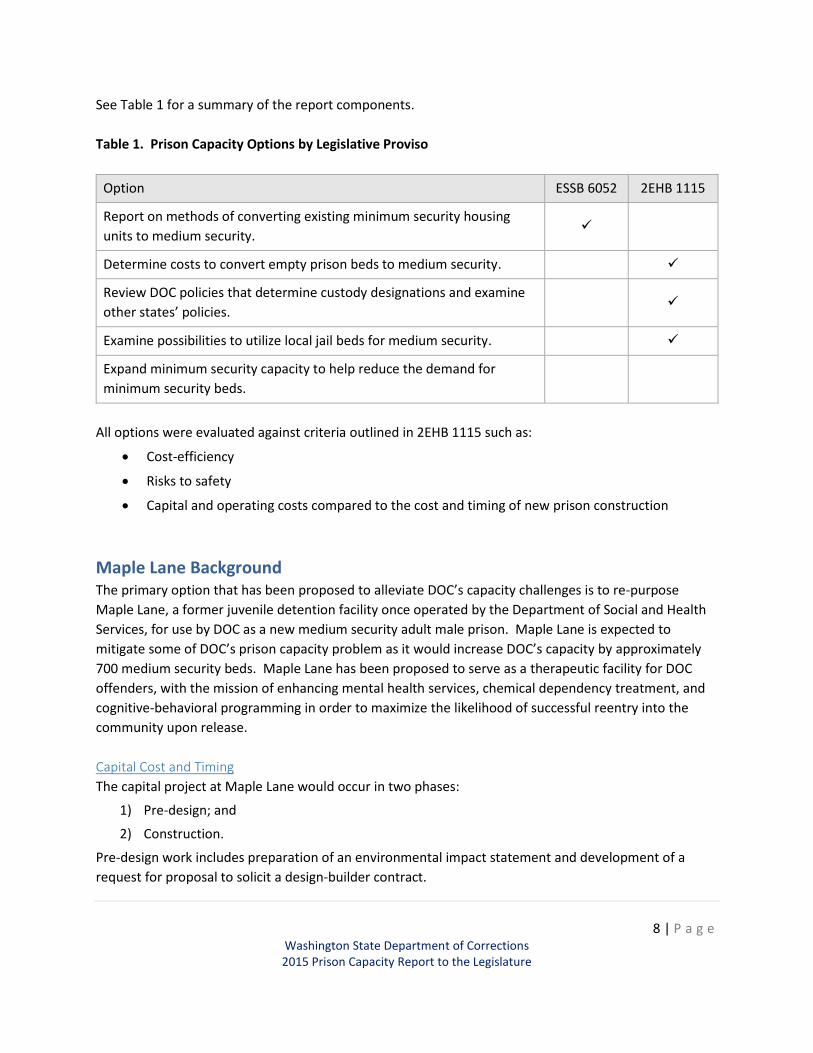
See Table 1 for a summary of the report components.
Table 1. Prison Capacity Options by Legislative Proviso
Option ESSB 6052 2EHB 1115
Report on methods of converting existing minimum security housing
units to medium security.
Determine costs to convert empty prison beds to medium security.
Review DOC policies that determine custody designations and examine
other states’ policies.
Examine possibilities to utilize local jail beds for medium security.
Expand minimum security capacity to help reduce the demand for
minimum security beds.
All options were evaluated against criteria outlined in 2EHB 1115 such as:
Cost-efficiency
Risks to safety
Capital and operating costs compared to the cost and timing of new prison construction
Maple Lane Background The primary option that has been proposed to alleviate DOC’s capacity challenges is to re-purpose
Maple Lane, a former juvenile detention facility once operated by the Department of Social and Health
Services, for use by DOC as a new medium security adult male prison. Maple Lane is expected to
mitigate some of DOC’s prison capacity problem as it would increase DOC’s capacity by approximately
700 medium security beds. Maple Lane has been proposed to serve as a therapeutic facility for DOC
offenders, with the mission of enhancing mental health services, chemical dependency treatment, and
cognitive-behavioral programming in order to maximize the likelihood of successful reentry into the
community upon release.
Capital Cost and Timing
The capital project at Maple Lane would occur in two phases:
1) Pre-design; and
2) Construction.
Pre-design work includes preparation of an environmental impact statement and development of a
request for proposal to solicit a design-builder contract.

9 | P a g e
Washington State Department of Corrections 2015 Prison Capacity Report to the Legislature
The DOC was appropriated $4.8 million of pre-design funding by the legislature for the 2015-17
biennium. The DOC awarded a contract to Integrus Architecture for Maple Lane pre-design, which is
currently underway. Once pre-design work is complete, an estimated $184 million would then be
requested to begin construction in the 2017-19 biennium. Maple Lane is estimated as being available to
house offenders once construction is complete in FY2020.
The total cost of Maple Lane, including pre-design and construction, is projected to be approximately
$189 million ($4.8 million + $184 million).
The proposed therapeutic mission for Maple Lane does result in construction costs that are higher than
a typical prison bed. Maple Lane is being designed to meet offenders’ mental health, chemical
dependency, and cognitive-behavioral change needs through a continuum of care model that provides
services starting the day of arrival to prison and continues through the end of the term of incarceration
or period of community supervision (if community supervision is required).
Offenders would have access to a comprehensive treatment setting with services ranging from
residential co-occurring mental health and substance abuse treatment in a therapeutic community to
outpatient mental health and substance abuse treatment. The facility will also include a close
observation area for offenders with more acute mental health needs or those in immediate mental
health crises.
Cost to Operate
The cost to operate the 700-bed Maple Lane facility will depend on physical plant layout, programmatic
and health care services offered; the amount of renovated existing facilities instead of new construction;
and operating staffing resource needs specific to the mission of the facility. These factors are all being
considered as part of Maple Lane’s pre-design work. The cost per day per offender at Maple Lane will
be calculated by June 30, 2016.
The cost to operate DOC’s other medium security adult male prison facilities in FY2015 ranged from
$70.73 to $124.74 per offender per day. The lowest cost of $70.73 is for DOC’s newest facility, Coyote
Ridge Corrections Center (CRCC) and the highest cost of $124.74 is for one of DOC’s oldest facilities,
MCC. MCC also has a higher cost than most medium security prisons because it contains units that have
a specialized mental health mission and houses some offenders with serious medical issues due to its
close geographic location to major hospitals in the Seattle area.
Maple Lane will have a specialized therapeutic mission, including mental health but also other
therapeutic services with a reentry focus. Thus, Maple Lane is expected to result in a cost per offender
per day that is closer to the higher end of the range for a medium security prison ($124.74) and may be
higher as this range is based on operating costs for FY2015 and does not include salary and benefits
increases that went into effect on July 1, 2015.

10 | P a g e
Washington State Department of Corrections 2015 Prison Capacity Report to the Legislature
Recommended Solution to Increase Prison Capacity The DOC explored all of the approaches set forth in ESSB 6052 and 2EHB 1115 that could potentially
increase capacity at medium security and evaluated them in terms of their cost-efficiency, risks to
safety, and their capital and operating costs compared to the cost and timing of Maple Lane. Very few
options were identified as feasible ways to increase capacity at medium security.
Use of Maple Lane:
Maple Lane is the most feasible option to increase medium security prison capacity. Though a
significant capital investment ($189 million), Maple Lane will provide 700 medium security beds
in FY2020, the same year DOC projects shortage of 745 medium security beds. The cost to
operate Maple Lane is not yet known but the operating costs for DOC’s other medium security
prisons ranged from $70.73 and $124.74 per offender per day in FY2015. The cost to operate
Maple Lane is expected to be at the higher end of the range of medium security facilities
because of its therapeutic mission but it will improve outcomes and increase efficiencies by
enhancing the continuum of mental health care currently distributed across DOC’s 12 facilities.
Convert Empty Existing Housing Units:
There are some empty housing units that may be converted to increase prison capacity at
medium security. The most feasible empty housing unit options are E Building at MCC-TRU and
Building 3A at MCC-WSR. However, these housing units would provide marginal increases to
prison capacity (112 medium security beds combined) alongside a significant capital investment
(about $9 million for both of them). A somewhat feasible option is F Unit at SCCC-IMU, which
may be converted to medium security provided that certain operational modifications are
made. The revised estimated facility operating costs for these units on a per offender per day
basis ($124.51 for MCC-TRU E Building; $122.88 for MCC-WSR Building; and $72.57 for SCCC-
IMU F Unit) are less expensive than Maple Lane but do not include services associated with a
therapeutic mission. Also, the construction timeline of these units would exceed that of Maple
Lane. The soonest any of these units could house offenders would be FY2021. This timeline is
partly because the majority of these units are old segregation units and would require
substantial physical modifications to make them suitable to house medium custody offenders.
Expand Work Release Capacity:
Expanding work release is a viable solution to help reduce the need for minimum security beds.
The DOC is experiencing a shortage of minimum security beds now and projects a shortage of
282 minimum security beds in FY2020. The DOC estimates that there are currently about 360
offenders classified for work release who are housed in minimum security prisons due to a lack
of work release capacity. Bringing an additional 121 work release beds online by expanding a
total potential capacity available at AVWR and Bellingham WR may allow DOC to shift the

11 | P a g e
Washington State Department of Corrections 2015 Prison Capacity Report to the Legislature
backlog of work release offenders from minimum security prisons to work release. This is
projected to have a capital cost of $3.6 million. Funding would need to be appropriated by the
Legislature to support the capital investment that would be needed for DOC to expand work
release but, these additional work release beds could be brought online relatively quickly and
sooner than Maple Lane. The work release capacity available at Bellingham WR (a non-DOC
owned facility) is estimated by the owner to be available as early as FY2016 and a portion of the
capacity available at AVWR could be brought online as early as FY2017.
Even if all of these options are adopted, DOC still expects to have a shortage of both medium and
minimum security beds in the future. For example, the adopted June 2015 of the CFC projects a
shortage of 1100 medium security beds and 200 minimum security beds by FY2024. The 700 medium
security beds that Maple Lane is expected to provide mean that DOC may still have a shortage of 400
medium security beds in FY2024. This may be mitigated by converting MCC-TRU E Building and MCC-
WSR Building 3A to medium security (112 medium security beds combined) but, there would still be 288
medium security beds needed by FY2024. Also, the additional 121 work release beds that could be
brought online at AVWR and Bellingham WR may allow the backlog of work release offenders housed at
minimum security facilities to be shifted to work release but, DOC may still have a shortage of 79
minimum security beds in FY2024.
Options Deemed Non-Feasible
1. Convert an Existing Minimum Security Housing Unit to Medium Security
Converting an existing minimum security housing unit to medium security is not feasible due
to the projected shortage of minimum security capacity and the need to maintain a supply of
minimum custody offender work crews to help operate multi-custody facilities.
The DOC is currently experiencing a shortage of minimum security beds which means there is no
extra capacity to absorb any loss of minimum security capacity. In addition, opportunities to
convert a minimum security housing unit to medium security are limited to standalone
minimum security facilities. Co-located minimum security facilities provide minimum custody
offender work crews that help support multi-custody facilities. Converting any co-located
minimum security facility would require that another housing unit at the prison site be
constructed for minimum security, incurring additional capital costs.
Converting a standalone minimum security facility to medium would require that the facility’s
existing minimum security capacity (up to 480 minimum security beds) be converted to 512
medium security beds at an estimated capital cost of approximately $142.7 million. This cost is
mostly due to minimum security facilities being constructed of wood frame buildings that would
have to be demolished and rebuilt with concrete to establish them as medium security facilities.
The cost to operate a standalone minimum security facility as medium security is estimated to
have a revised facility operating cost of $95.89 per offender per day. This cost is less expensive

12 | P a g e
Washington State Department of Corrections 2015 Prison Capacity Report to the Legislature
than Maple Lane but it does not include any additional services associated with a therapeutic
mission. The construction timeline would also be less timely. The soonest that a standalone
minimum security facility could be converted and available to house medium custody offenders
would be FY2021.
The loss of the minimum security capacity that converting a standalone minimum security
facility to medium security would result in would occur during the construction phase of the
project and there is no extra capacity to absorb the loss of minimum security beds.
2. Converting Certain Empty Existing Housing Units
Converting certain empty housing units to medium security would not be cost-efficient and
would compromise safety and security.
Most of the empty housing units that were explored for their potential use as medium security
were deemed non-feasible. All of the empty housing units are either old segregation or close
security units. This would pose considerable difficulties in operating them at medium security or
require housing medium custody offenders in the same building with offenders of lower custody
designations, which would increase the risk of contraband introduction or escape. These risks
apply to three empty housing units located within WSP-Old Main, a currently operational
minimum security facility that houses minimum custody offenders. Minimum custody offenders
may leave the perimeter to work outside the facility. Medium custody offenders may not.
In addition to safety and security risks, housing medium custody offenders within WSP-Old Main
would require that its perimeter be upgraded to medium security. The cost to refurbish WSP-
Old Main’s four towers (which have gone unused since WSP-Old Main was converted from
medium to minimum security in 2011) is estimated at a capital cost of $1.3 million.
The possibility of mitigating the risks brought about by co-housing distinct populations inside
the same perimeter at WSP-Old Main could be accomplished by instead converting the existing
capacity within WSP-Old Main from minimum to medium security. The capital cost to convert
WSP-Old Main’s current 815 minimum security capacity to medium security is unknown but
would require capital modifications that, at a minimum, are estimated to cost $64 million. The
DOC examined its ten-year capital improvement plan for WSP-Old Main from 2009 (before WSP-
Old Main was converted from medium to minimum security), which showed that roughly $107
million was required to maintain the facility as medium security at that time.
Regardless, converting the entire WSP-Old Main is not feasible as it would reduce the supply of
minimum custody offender work crews needed to support facility operations throughout the
WSP site and would require that another building such as WSP-Old MSU be brought back online
which would result in additional capital cost (estimated $26.9 million). The cost to operate
WSP-Old MSU at minimum security is estimated at a revised facility cost of $106.32 per offender
per day but, the capacity it would offer (189 minimum security beds) would still not be enough
to absorb the loss of 815 minimum security beds that converting WSP-Old Main to minimum
would result in. Further, it would reduce cost efficiencies gained by WSP-Old Main’s previous

13 | P a g e
Washington State Department of Corrections 2015 Prison Capacity Report to the Legislature
conversion from medium to minimum security which allowed a backlog of minimum custody
offenders who had been inefficiently held at medium security to be shifted into a large, co-
located minimum security facility. These were predominantly offenders with medical or mental
health needs that exceeded the resources of a standalone minimum security facility and who
may now be housed at WSP-Old Main where they may access the healthcare resources at the
WSP site.
3. Modifications to DOC’s Classification Process.
Any modifications to DOC’s classification policies for the purposes of prison capacity should be
considered carefully as they could present risks to safety. There appear to be few
opportunities for DOC to modify its classification policies beyond housing more sex offenders
at minimum custody or narrowing the definition and length of time for factoring escape into
its classification model. With additional research, there may be an opportunity to extend the
criterion of length of time to release for offenders to be eligible for minimum custody.
However, there is no extra capacity at minimum security.
The DOC worked with ASCA to conduct a multi-state survey of state prison populations held at
close, medium, and minimum custody, and to obtain copies of individual states’ classification
policies. The DOC selected a sample of six states to analyze due to limited time and resources to
support a multi-state classification policy analysis.
The DOC used rate of prison incarceration to compile a sample diversely represented by high,
moderate, and low incarceration states. Rate of prison incarceration helps provide a standard
measure to assess how criminal seriousness (a factor used by virtually all states to assign
offenders a custody designation) influences how a state’s prison population is held across
custody designations. States with higher prison incarceration rates are assumed to have a
higher percentage of their prison populations serving sentences for less serious crimes such as
drug and property and consequently, more offenders at minimum custody. States with lower
prison incarceration rates are assumed to have a higher percentage of their prison populations
serving sentences for more serious crimes such as crimes against a person and as a result, more
offenders at close custody. Washington ranks relatively low in rate of prison incarceration (41st)
and houses more than one-third of its prison population at minimum custody.
The six states selected into the sample included states similar to Washington by ranking low in
rate of prison incarceration (Minnesota ranks 47th; Connecticut ranks 36th), states very different
than Washington by ranking high in rate of prison incarceration (Alabama ranks 3rd; Oklahoma
ranks 2nd), and states somewhat different than Washington by maintaining moderate ranks in
rate of prison incarceration (Oregon ranks 27th; Colorado ranks 24th).
The states in the sample (Minnesota, Connecticut) who ranked low in rate of prison
incarceration seem to operate more conservative classification systems than Washington
despite managing a prison population characterized by a similarly serious criminal profile. For
example, Minnesota and Connecticut both maintain higher percentages (about one-third

14 | P a g e
Washington State Department of Corrections 2015 Prison Capacity Report to the Legislature
respectively) of their prison population at close custody which is higher than Washington who
maintains nine-percent at close custody. Minnesota prohibits offenders with life sentences
from being housed any lower than close custody. Connecticut requires offenders to serve a
certain percentage of their sentence at certain custody designations before considering them
eligible for promotion. Washington allows offenders with a life sentence to be classified as low
as medium custody and does not use percent of sentence served as a criterion for re-
classification.
The states in the sample (Alabama, Oklahoma) who ranked high in rate of prison incarceration
seem to operate less conservative classification systems than Washington to manage prison
populations characterized by a less serious criminal profile. Alabama and Oklahoma both
maintain low percentages (less than two-percent respectively) of their prison populations at
close custody. Close custody is used sparingly in both systems, which may be why their prison
populations are most concentrated at medium custody (52% in Alabama; 45% in Oklahoma).
The percentages of their prison populations at minimum custody were very different (20% in
Alabama; 48% in Oklahoma). Alabama limits assignment to minimum custody for offenders
convicted of non-violent and property crimes. Oklahoma houses offenders who violate a
condition of their community supervision (e.g., violators) in its minimum custody prisons. In
general, Washington only restricts certain sex offenders from minimum custody and houses
violators in local jails.
The states in the sample (Colorado, Oregon) who ranked moderate in rate of prison
incarceration seem to have classification systems with unique attributes that may present
opportunities but would require further evaluation to understand the policy implications they
may hold.
The distribution of Colorado’s prison population across custody designation looked very similar
to Washington’s except for holding a slightly higher percentage (36%) at minimum custody.
Colorado maintains two “tiers” of minimum custody: minimum-unrestricted and minimum-
restricted. Minimum-restricted appears to be equivalent to Washington’s version of minimum
custody. There does not appear to be a direct equivalent of minimum-unrestricted in
Washington but it is likely less restrictive than Washington’s version of minimum custody and
more restrictive than work release. Colorado allows offenders to be considered for minimum-
restricted when they are five years or less to release and for minimum-unrestricted when they
are three years or less to release. This is unique from Washington who considers offenders for
minimum custody when they are four years or less to release but, Colorado does not have work
release. Thus, Colorado may be more progressive than Washington by maintaining two tiers of
minimum custody but less progressive than Washington by not having work release. Also, it
could be that a small portion of Colorado’s minimum-unrestricted population would be housed
at work release in Washington and that a small portion of their minimum-restricted population
would be housed at Minimum 3 (MI3, a subset of minimum custody housed in medium security
facilities) in Washington.

15 | P a g e
Washington State Department of Corrections 2015 Prison Capacity Report to the Legislature
Oregon maintains 44% of its prison population at minimum custody; a percentage notably
higher than Washington’s 34%. However, Oregon seems to have a lower threshold for escapes
than Washington by maintaining a narrower definition of what constitutes escape and a shorter
period of time for how long escapes are factored into an offender’s custody score. This likely
results in more offenders being assigned to lower custodies such as minimum. Oregon also
appears to have fewer offsite work crew opportunities at its minimum security facilities than
Washington. This is important because offsite work crew opportunities require the ability to
leave the facility, a privilege that typically does not apply to sex offenders. Thus, Oregon may
have fewer constraints than Washington for how many sex offenders may be assigned to
minimum custody. Oregon also houses violators in prisons, mostly at minimum security
facilities. Washington houses violators predominantly in local jails.
Washington’s classification system may also be more cost-efficient than the other six states
examined. Washington has a lower percentage of its prison population at close custody (the
most expensive general population custody designation) and a higher percentage of prison
population at minimum custody (the least expensive total confinement custody designation)
than any of the other six states sampled (except for Oregon and Oklahoma which house
violators in prison). In FY2015, Washington’s close custody facilities ranged between $109.42
for WSP and $109.51 for Clallam Bay Corrections Center (CBCC) on a per offender per day basis.
Washington’s standalone minimum custody facilities cost an average of $72.44 per offender per
day.
4. Use of Local Jails for Medium Security Capacity
Using local jails for medium security prison beds is possible but only if substantial physical
modifications are made to the jails requiring a significant capital investment.
The option to house prison offenders in local jails has been explored previously by the Office of
Financial Management (OFM) who worked with BERK Consulting to analyze statewide
correctional needs, including barriers and solutions for using jail beds in lieu of prison beds, and
by DOC who examined potential ways to use the Yakima County Corrections Center (YCCC).
A key finding from BERK’s (2014) report on statewide correctional needs was that jail and prison
beds are not interchangeable. There are key differences between prisons and jails such as their
different purposes, populations, and designs that make them non-interchangeable. For
example, because jails typically confine people sentenced to less than a year of incarceration
and prisons confine people sentenced to more than a year of incarceration, the risk level of jail
and prison offenders is different. The physical design of facilities used to house prison offenders
need to be particularly secure while also providing opportunities to reduce that risk through
evidence-based programming. Key constraints for using local jails as medium security prison
beds are that their construction is typically less secure than DOC’s medium security standards.
Also, space constraints often limit jails’ ability to provide evidence-based programming.

16 | P a g e
Washington State Department of Corrections 2015 Prison Capacity Report to the Legislature
The DOC’s previous assessment of YCCC found that the cost to construct a medium security
perimeter at the YCCC site would be about $417,000 but that the configuration of the site would
not permit this. The cost to house an offender at YCCC assumed as average daily population
(ADP) of 288 but varied based on multiple options available for consideration. For this report,
DOC compared the cost of housing offenders in prison to the statewide average cost per
offender per day to house violators in local jails. Housing offenders in medium security prisons
is less expensive than jails. For example, the FY2015 cost per offender per day to house
offenders in one of DOC’s newer medium security prisons such as CRCC is $70.73. The cost per
offender per day to house violators in local jails was about $81.99.
To fully consider any option that may increase prison capacity, including at particular security levels,
some understanding of DOC’s classification system is required. The following section may be skipped by
those already familiar with adult corrections.
Classification, Custody, and Security Classification is the management tool used in corrections to assign offenders to the least restrictive
custody that addresses programming and other needs while also providing sufficient safety for staff,
offenders, and the public.
The DOC uses a classification tool that assigns offenders into various categories related to two key
factors:
1) The danger they pose to staff, other offenders, and the public; and
2) The amount of supervision they require while incarcerated.
These categories are known as custody designations. The classification tool calculates a custody score
for offenders through an initial classification that is conducted when offenders are first committed to
DOC and through recurring classification reviews that are performed regularly for the remainder of their
incarceration. Thus, an offender’s custody score may change during their period of incarceration.
Classification reviews provide for a graduated release through a systematic decrease in supervision and
corresponding increase in offender responsibility and reentry into the community. For example,
classification reviews provide offenders the opportunity to gradually transition into lesser restrictive
custody designations so that, at the time of release (for the majority who will release), they may re-
enter the community from the least restrictive custody designation. Initial classification takes into
account mostly static factors such as criminal history, escape history, and age. Classification reviews
continue to account for these static factors but also allow institutional factors such as the offender’s
current custody designation, programming, and infraction history to be considered to accurately capture
the offender’s current risk and allow for reclassification. This makes DOC’s classification system
primarily a behavior-based model. Good behavior during incarceration may result in a lesser restrictive

17 | P a g e
Washington State Department of Corrections 2015 Prison Capacity Report to the Legislature
custody designation. Bad behavior may result in the offender maintaining or demoting to a more
restrictive custody designation.
The classification system governs how offenders move through the prison system, including the facilities
at which they are housed. This is because facilities operate at various security levels that adhere to
certain physical security requirements needed to safely house offenders of certain custody designations.
There are five custody designations to which an offender may be classified and each corresponds to a
particular security level. See Table 2 below. More restriction is imposed through higher security levels
in order to safely manage the offenders that the classification tool has deemed more dangerous and
requiring more supervision.
Table 2. Custody and Security
Custody Designations Security Levels
Maximum Custody Maximum Security (Level 5)
Close Custody Close Security (Level 4)
Medium Custody Medium Security (Level 3)
Minimum Custody Minimum Security (Level 2)
Work Release Work Release (Level 1)
Maximum custody offenders require the most supervision; have the greatest restriction on their
freedom of movement and interaction with others; and require single occupancy cells in the most
secure buildings. Higher custody offenders such as maximum and close are also typically housed in “wet
cells”, a cell with a toilet and sink. Some medium security facilities and virtually all minimum security
facilities, contain “dry cells”, cells with no plumbing fixtures. This is partly due to the lesser supervision
and greater freedom of movement provided at lower custody designations. For example, a custody
designation known as Minimum 2 (MI2) provides offenders the most freedom of movement of all total
confinement facilities, including the ability to go outside a facility’s secure perimeter. Minimum 1 (MI1)
offers the most freedom of movement of any DOC facility but it is limited to partial confinement
facilities such as work release. For this reason, MI2 is referred to as “minimum” and MI1 is referred to as
“work release” throughout the report unless otherwise made explicit.
Higher security facilities offer more physical security than lower security facilities. For example,
maximum, close, and medium security facilities have double-apron, high-security, armed perimeter
fences or walls. Minimum security facilities typically have a single fence. Photos of a high security
prison fence and a minimum security prison fence are provided in Appendix A. Work release facilities
may have a fence but one that serves more as a boundary line rather than for containment.

18 | P a g e
Washington State Department of Corrections 2015 Prison Capacity Report to the Legislature
Higher security facilities, including medium, also require all housing units and program buildings to be
made of concrete. Minimum security facilities may be constructed from wood. The difference in the
building composition for minimum and medium security is mostly attributable to fire code as minimum
security facilities allow for offenders to move about more freely, including the ability to self-evacuate in
the event of a fire, whereas medium custody facilities do not.
Custody designations and security levels are different things: custody designations apply to offenders
and security levels apply to facilities. This is important in relation to a cardinal rule of corrections: an
offender may be held in a facility which has a security level equal to or greater than their custody
designation – but not one that is lower. For example, a medium custody offender may be housed in a
maximum, close, or medium security facility but not at a minimum security facility or work release.
All DOC facilities (except for standalone minimum security and work release) house offenders of more
than one custody designation, making them multi-custody. For example, a maximum security facility
may be located at the same site as a close, medium, and minimum security facility. Any buildings that
house higher custody offenders are located inside one or more secure perimeters. Any minimum
security beds are typically located outside the secure perimeter. Minimum security facilities located at
the same site as facilities of other security levels are known as co-located minimums. Minimum security
facilities that don’t share the same site as other facilities are known as standalone minimums.
In addition to the custody score calculated by the classification tool, minimum custody offenders are
typically required to have less than four years to their Earned Release Date (ERD). An underlying
assumption is that this shorter sentence structure makes minimum custody offenders less of an escape
risk than higher custody offenders who typically have more time left to their ERD. Time left to ERD may
be used to further distinguish the minimum custody offender population. For example, offenders who
classify as minimum and are within six months of their ERD may be eligible for work release.
There is also another subset of minimum custody known as MI3. These are generally offenders who
have scored minimum custody but are restricted from being housed at standalone minimum security
facilities because they:
Have more than four years to their ERD; or
Have a medical, dental, and/or mental health need that exceeds the resources available at a
standalone minimum security facility; or
Have a felony warrant or detainer; or
Are categorized as a certain type of sex offender. This typically includes offenders under the
jurisdiction of the Indeterminate Sentence Review Board or Community Custody Board who
have not yet been found conditionally paroleable or releasable.

19 | P a g e
Washington State Department of Corrections 2015 Prison Capacity Report to the Legislature
Provided that they do not meet any of the above criteria, sex offenders may be placed at minimum
custody through a special screening process (done for sex offenders but also a select set of other non-
sex crimes) that requires a recommendation by a Facility Risk Management Team and approval by a
Headquarters Classification Screening Committee. As a result, the percentage of offenders held at MI3
and minimum who are sex offenders is very different. For example, in June of 2015:
Less than two-percent of the offenders assigned to minimum custody were sex offenders.
Almost half of the offenders assigned to MI3 were sex offenders.
MI3 offenders require housing at a medium security facility. The DOC has sometimes built less secure
(and therefore less costly) housing units inside medium security perimeters and staffed them (at less
expense) at minimum security staffing levels. To reiterate: MI3 housing units are located behind a
medium security perimeter (double-apron, high security, armed perimeter fencing). For this reason,
“medium custody” is a term often used to include both medium custody and MI3 and will be defined as
such throughout this report unless otherwise made explicit.
Multi-custody facilities also have segregation units. Segregation units operate at maximum security and
are used to temporarily remove offenders who demonstrate a threat to the safety of themselves, staff,
or other offenders from general population (security levels lower than maximum). Segregation units are
designed to house offenders for no more than 47 days. Segregation beds are non-capacity because they
are temporary and the offender’s general population bed is typically held until the offender returns to
that bed or is assigned a bed at a more suitable custody designation. Standalone minimum security
facilities have secured housing units that are similar to segregation units but not designed to house
offenders for more than 14 days.
Conversion of Existing Minimum Security Housing Units to Medium ESSB 6052 directed DOC to report on methods of converting existing minimum security housing units to
medium security. The DOC operates seven male minimum security facilities:
Four are co-located (also referred to as minimum security units or MSUs); and
Three are standalone.
See Table 3 on the following page.

20 | P a g e
Washington State Department of Corrections 2015 Prison Capacity Report to the Legislature
Table 3. Existing Minimum Security Facilities with their Minimum Security Operating Capacity
Co-Located Minimum Security Facilities Minimum Security
Operating Capacity
Airway Heights Corrections Center (AHCC) – MSU 600
CRCC-MSU 480
MCC-WSR-MSU 480
WSP-Old Main 815
Standalone Minimum Security Facilities Minimum Security
Operating Capacity
Cedar Creek Corrections Center (CCCC) 480
Larch Corrections Center (LCC) 480
Olympic Corrections Center (OCC) 381
The DOC worked with Integrus Architecture to determine methods of converting an existing minimum
security facility to medium and to identify capital cost estimates using AHCC-MSU and CCCC as
prototypes. These facilities were selected to provide general estimates for converting an existing
minimum security facility to medium based on the facility being co-located or standalone. As discussed
previously, neither AHCC-MSU nor CCCC could operate as medium security facilities without a minimum
custody offender population to help support facility operations. Facility aerial photos are provided in
Appendix B.
Medium Security Standards
The typical building construction for DOC’s medium security facilities is two, standard 256-bed
housing units as well as program, dining, and recreation buildings to support a population of 512
offenders. Medium security facilities also contain a segregation unit. The DOC requires all
medium security housing units and program buildings to be made of concrete to provide safety,
security, and long-term durability. Medium security facilities are enclosed with double perimeter,
high security fencing. American Correctional Association (ACA) construction standards are also
considered in the design and build of DOC facilities.
Methods of Conversion
Converting either AHCC-MSU or CCCC from minimum security to medium security would require a
“demolish and rebuild” methodology. The current minimum security facility construction of wood
frame buildings at both AHCC-MSU and CCCC would have to be demolished and replaced with
concrete buildings. The existing perimeter fencing at both facilities would also need to be

21 | P a g e
Washington State Department of Corrections 2015 Prison Capacity Report to the Legislature
demolished and replaced. The extent of the re-build that would need to take place at each facility
varies based on their current status as either a co-located or standalone minimum.
AHCC-MSU – As a co-located minimum, a new fence similar to the current medium
security fence would be incorporated as part of the existing fence. This would allow the
MSU, which is currently located outside the secure perimeter, to be enclosed within the
existing secure perimeter of the AHCC site.
CCCC – As a standalone minimum, new high security fencing would be required to enclose
the entire facility. A new 32-bed segregation unit would also be required at the site as
CCCC does not have a segregation unit.
The above represent the most significant modifications needed to convert either AHCC-MSU or
CCCC to medium security. More detailed architectural assessments for each of these facilities are
found in Appendix C.
Length of Time to Complete
Both AHCC-MSU and CCCC were estimated as having a four-year construction timeline. If a capital
project were to begin in July of 2016, it is estimated that the pre-design would be completed in
July 2018 and the construction would be completed in July 2020. This means that either facility
would not be able to house any offenders until FY2021.
Changes to Capacity
AHCC-MSU currently has 600 minimum security beds. CCCC currently has 480 minimum security
beds. AHCC-MSU and CCCC would increase capacity at medium security by each offering 512
medium security beds. However, both options would decrease capacity at minimum security by
reducing the number of minimum security beds currently at AHCC-MSU and CCCC. For example:
Converting AHCC-MSU from minimum security to medium security would result in an
additional 512 medium security beds but a loss of 600 minimum security beds.
Converting CCCC from minimum security to medium security would result in an additional
512 medium security beds but a loss of 480 minimum security beds
Feasibility
The loss of minimum security beds that would result by converting an existing minimum security
facility to medium would present the need to offset the bed shortage at minimum security. For
example, the 480 minimum security beds that would be lost by converting CCCC to medium
security would require that capacity to be shifted to another minimum security facility. There is
no additional capacity at other minimum security facilities to offset such a shift. The DOC projects
a shortage of approximately 300 minimum security beds as early as FY2016 which, if no actions
are taken, will continue into the future with a shortage of around 280 minimum security beds by
FY2020.

22 | P a g e
Washington State Department of Corrections 2015 Prison Capacity Report to the Legislature
There are currently medium and minimum custody offenders who are being held at higher
security levels than their custody designation. For example, there are minimum custody offenders
currently being held at medium security and medium custody offenders being held at close
security. This is generally because of a backlog that has resulted from the shortage of medium
and minimum custody beds. This backlog should not be misconstrued as an option to solve DOC’s
capacity challenges at medium security for reasons such as:
Higher security levels are generally more expensive than lower security levels. For
example, the cost per offender per day in FY2015 for the DOC facilities that operate close
custody units ranged between $109.42 for WSP and $109.51 for CBCC. The cost per
offender per day in FY2015 for DOC’s medium security facilities ranged between $70.73
for CRCC (newer facility) and $124.74 for MCC (older facility).
It conflicts with DOC’s classification policy, which assigns offenders to the least restrictive
custody designation that addresses programming and other needs.
Addressing programming and other needs becomes difficult as the burden on facility
capacity results in burdens on programming capacity, including recidivism reduction
programs. DOC uses the risk-need-responsivity model, which includes assessing an
offender’s risk to re-offend and targeting programs to their unique risk and need profile.
Agencies who adhere to the risk-need-responsivity model are more likely to reduce
recidivism compared to agencies who do not (Bonta and Andrews, 2007).
It results in disparate treatment in that some offenders who have presumably earned
medium custody (as informed various factors, including their institutional behavior) are
held at a higher security level such as close. This may also hold legal implications.
Shifting any medium custody population into an existing minimum security facility that has been
converted to medium security is theoretically more acceptable than shifting them into existing
close security facilities but not actually feasible because of the shortage of minimum security
beds.
There was a bill proposed in the 2015 Legislative Session that would have resulted in additional
capacity at minimum security. The legislature considered the Justice Reinvestment Initiative (JRI),
which included a new sentencing grid for felony property offenders that reduced the length of
incarceration and required community supervision for certain property offenders. The JRI bill was
expected to reduce the prison population overall by about 900 offenders by FY2021 (Council of
State Governments, 2015); of which was expected to primarily impact minimum security.
However, JRI legislation was not adopted.
Converting an existing minimum security facility to medium security would also create operational
constraints. Minimum custody offenders are eligible to work outside a facility’s secure perimeter.
Medium custody offenders are not. A noteworthy portion of the offenders housed at minimum security

23 | P a g e
Washington State Department of Corrections 2015 Prison Capacity Report to the Legislature
facilities participate in work crew opportunities. Converting a minimum security facility to medium
would reduce the supply of offenders needed for work crews, including those serving critical functions
for both DOC and the State of Washington.
A particular work crew opportunity that is available at all standalone minimum security facilities and
some co-located minimum security facilities is for offenders to work under the supervision of the
Department of Natural Resources (DNR) in helping provide critical forestry functions, including fighting
forest fires. Converting a minimum security facility to medium security would displace a vital resource
from areas at risk of fire danger and do little to help the State combat its firefighting seasons, including
wildfires that in recent years have been recognized as some of the largest in state history.
Higher custody facilities, particularly those that are multi-custody, depend on co-located minimum
security facilities to provide minimum custody offenders for work crews. Due to their being allowed
outside the perimeter, minimum custody offender work crews help support the daily operation and
maintenance of multi-custody facilities by working in core operational areas such as automotive,
plumbing, electrical, and building repair. It is extremely difficult for a multi-custody facility to operate
without a co-located minimum security facility located at the same site. Converting a co-located
minimum security facility to medium may be counterproductive as it would present the need to
establish a new MSU to replace a converted MSU. For example, converting AHCC-MSU to medium
security would require a new MSU to be established at the AHCC site.
Capital and Operating Costs
Table 4 below shows each housing unit’s potential medium security operating capacity as well as
estimated capital and operating costs. The capital cost to convert any of the existing minimum
security facility options to medium security include maximum allowable construction cost (MACC),
soft costs, and taxes. Capital cost definitions are provided in Appendix D and a more detailed
explanation of operating costs (including how the revised estimated facility operating cost was
calculated) is provided in Appendix E.
Table 4. Existing Minimum Security Units Medium Capacity and Costs (Capital and Operating)
Facility Medium Security
Operating Capacity
Total Estimated Capital
Cost*
Revised Estimated
Facility Operating Cost
per Offender per Day**
AHCC-MSU 512 $94,459,381 $83.35
CCCC 512 $142,195,660 $95.89
*Capital cost estimates provided by Integrus Architecture
**Operating cost estimates provided by DOC. Revised facility cost per offender per day was estimated by calculating a revised capacity and revised annual cost
for a given facility. Revised capacity was calculated by adding new capacity to existing FY2015 capacity. Revised annual cost was calculated by adding the
cost of new capacity to the FY2015 total operating cost for the facility. [Revised facility cost per offender per day = (Revised annual cost/ (Revised capacity))
/365 days per year)]. Operating costs do not include additional services associated with a therapeutic mission or salary and benefits increases which went
into effect on July 1, 2015.

24 | P a g e
Washington State Department of Corrections 2015 Prison Capacity Report to the Legislature
Determination of Costs to Convert Empty Prison Beds to Medium Security 2EHB 1115 directed DOC to determine costs to convert empty prison beds to medium security. The DOC
identified seven empty housing units within four currently operational facilities including SCCC-IMU,
MCC-TRU, MCC-WSR, and WSP-Old Main.
These units are located in facilities that currently operate at various security levels, which will constrain
how they may be converted to medium security. Most of the empty units are old segregation units. The
constraints regarding the conversion of empty prison beds are discussed in more detail at the end of this
section. Facility aerial photos are provided in Appendix B.
Table 5 below provides more information on the seven housing units examined for their potential
medium security conversion below.
Table 5. Empty Housing Units with Historical Operating and Capital Information
Facility Unit Last Operated As Year Built Year Closed
SCCC-IMU F Unit Segregation 2000 2015
MCC-TRU E Building Segregation 1984 1995
MCC-WSR Cellhouse 3 Segregation 1955 2006
MCC-WSR Building 3A Close 1955 2006
WSP-Old Main Unit 1 Segregation 1959 2009
WSP-Old Main Unit 4 Segregation 1959 2011
WSP-Old Main Unit 7 Segregation 1933 2011
The DOC contracted with Integrus Architecture to estimate the capital costs for converting empty
housing units to medium security and DOC provided estimates for the associated operating costs.
Architectural Considerations
The cost of converting an empty housing unit to medium security varies based on the unique
construction needs of an individual housing unit. Some of the modifications to consider include:
Seismic structural retrofits for the foundation, basement construction, and/or super structure of
buildings to provide resistance to earthquakes
Exterior enclosures such as roofing, windows, and insulation
Interior construction such as sallyports, cells, dayrooms, shower space, and office space but also
walls and doors as well as any finishes such as painting or flooring
Plumbing such as showers, fixtures, and piping

25 | P a g e
Washington State Department of Corrections 2015 Prison Capacity Report to the Legislature
Heating Ventilation and Air Conditioning (HVAC) systems
Fire Protections such as sprinkler systems, including their adherence to fire and energy codes
Electrical work such as lighting, camera systems, and fire alarms
Security equipment such as control booths and furnishings for cells and dayrooms
ACA construction standards are also considered in the design and build of DOC facilities.
Table 6 below provides a matrix that summarizes the potential modifications for converting the empty
housing unit options to medium security. More detailed architectural assessments for each of these
facilities may be found in Appendix C.
Table 6. Matrix of Modifications* for Converting Empty Housing Units to Medium Security
Seis
mic
Str
uct
ura
l
Encl
osu
re T
her
mal
Imp
rove
men
ts
Ro
of
Re
pla
cem
ent
Inte
rio
r C
on
stru
ctio
n
Plu
mb
ing
Rep
airs
HV
AC
Re
pla
cem
ent
Fire
Sp
rin
kler
Inst
alla
tio
n
Fire
Ala
rm R
ep
lace
men
t
Cam
era
Syst
em U
pgr
ade
Secu
rity
Sys
tem
Up
grad
e
Haz
ard
ou
s M
ate
rial
Ab
atem
ent
SCCC-IMU F Unit
MCC-TRU E Unit
MCC-WSR Cellhouse 3
MCC-WSR Building 3A
WSP-Old Main Unit 1
WSP-Old Main Unit 4
WSP-Old Main Unit 7
*Matrix created by DOC based on capital assessments provided by Integrus Architecture

26 | P a g e
Washington State Department of Corrections 2015 Prison Capacity Report to the Legislature
Methods of Conversion
Each empty housing unit would vary in terms of the capital modifications required to convert them to
medium security. However, most of them would require similar modifications such as:
Interior finish upgrades throughout the unit such as paint and flooring, which will drive some
cost since these units represent relatively large areas
Expansion of dayroom or programming space to comply with ACA standards, a particular cost-
driver as most of these units last operated as segregation units (segregation units have limited
dayroom and programming space)
Hazardous materials abatement as age of construction poses the risk of hazardous materials
(such as asbestos)
Some of the modifications that represent some of more substantial cost-drivers for converting particular
empty housing units to medium security are discussed below.
SCCC-IMU F UNIT
F Unit is located within the SCCC-IMU, a currently operational maximum security facility, and was last
operated as a segregation unit.
A new sallyport would need to be installed to provide an entrance/exit for medium custody
offenders separate from the existing sallyport used for maximum custody offenders who would
continue to be housed in the other part of the SCCC-IMU. The medium custody offenders
housed in F unit would leave the building to go to other areas throughout the SCCC site such as
programming, dining, etc. Housing a mobile population such as medium custody offenders in
the same building as maximum custody offenders (who do not freely leave the building)
increases the potential for contraband to make its way into the maximum security portion of the
facility. Separate sallyports help mitigate this risk.
New offices would need to be added for the staff needed to manage the medium custody
offender population that would be housed in F Unit.
MCC-TRU E BUILDING
E Building is located within MCC-TRU, a currently operational medium security facility, and was last
operated as a segregation unit. E Building is currently used as a staff training building.
There would be modest renovations required to seismically retrofit the existing building. The
roof area over E Building would also need to be replaced.
The most substantial modification for E Building would be to replace its HVAC system. The
current system is over 35 years old.
MCC-WSR: CELLHOUSE 3 AND BUILDING 3A
Cellhouse 3 and Building 3A are located adjacent to one another inside MCC-WSR, a currently
operational medium security facility. Cellhouse 3 was last operated as a segregation unit. Building 3A

27 | P a g e
Washington State Department of Corrections 2015 Prison Capacity Report to the Legislature
was last operated as a close custody unit. Both Cellhouse 3 and Building 3A would require similar
modifications.
The age of the buildings would require a full seismic structural renovation. To provide cost-
efficiency, the seismic structural renovation of Cellhouse 3 and Building 3A could be done
simultaneously since they are neighboring housing units. Both units would require new roofs as
well as a new thermal assembly for all exterior walls such as insulation, metal studs, sheathing,
and weather barrier.
Cellhouse 3 and Building 3A each have their own HVAC system. Both would need to be replaced
and upgraded to energy code.
While Cellhouse 3 and Building 3A had the sprinkler and fire alarm systems recently replaced,
the systems within each unit would require some work to be in compliance with current fire
code requirements.
A new camera system, comparable to the contemporary camera systems located throughout
MCC-WSR, would be required to replace the existing systems in each unit that are old and
nearing their end-of-life. The new camera systems in both Cellhouse 3 and Building 3A would
then need to be integrated into MCC-WSR’s existing camera system.
WSP-OLD MAIN: UNITS 1, 4, AND 7
Units 1, 4, and 7 are located within WSP-Old Main, a currently operational minimum security facility,
and were last operated as segregation units. Similar modifications would be required for Units 1, 4, and
7.
The age of the buildings would require a full seismic structural renovation. This is significant
given that the existing buildings are unreinforced masonry construction. A new roof to cover
each individual unit would also be required as well as a new thermal assembly for all exterior
walls such as insulation, metal studs, sheathing, and weather barrier.
The plumbing piping in each unit would need to be replaced as the current piping is degrading.
Each of the units have separate HVAC systems which would each have to be replaced.
Entirely new fire protection systems, including sprinklers and fire alarms would be required for
each unit. The current fire alarms located throughout WSP-Old Main are obsolete and are not in
compliance with current fire code. WSP-Old Main has no sprinklers. The installation of new fire
alarms and sprinklers for WSP-Old Main is included in DOC’s ten-year capital plan. However, fire
alarms and sprinklers would have to be installed before housing a medium custody offender
population within any unit inside WSP-Old Main. This is because WSP-Old Main currently
houses minimum custody offenders, a population who may leave their cells in the event of a
fire, and presents lesser urgency with upgrading fire protection systems.
Both a new camera system and security system, comparable to the systems located throughout
WSP-Old Main, would be required for Units 1, 4, and 7. This would include replacing their

28 | P a g e
Washington State Department of Corrections 2015 Prison Capacity Report to the Legislature
existing, older systems, which are nearing their end-of-life, and integrating them into WSP-Old
Main’s existing, more contemporary camera and security systems.
Length of Time to Complete
Converting any of these empty housing units to medium security was estimated as a four-year
construction timeline. If a capital project were to begin in July of 2016, it is estimated that the
pre-design would be completed in July 2018 and the construction would be completed in July
2020. This means that any of the empty housing units would not be able to house offenders until
FY2021.
Costs and Capacity
Table 7 below shows each housing unit’s potential medium security operating capacity as well as
estimated capital and operating costs. The capital cost to convert any of the empty prison bed options
to medium security include MACC, soft costs, ACA upgrades, and taxes. Capital cost definitions are
provided in Appendix D and a more detailed explanation of operating costs (including how the revised
estimated facility operating cost was calculated) is provided in Appendix E.
Table 7. Empty Housing Units Medium Capacity and Costs (Capital and Operating)
Facility
Medium Security
Operating Capacity
Total Estimated Capital
Cost*
Revised Estimated
Facility Operating Cost
per Offender per Day**
SCCC-IMU F Unit 72 $2,650,560 $72.57
MCC-TRU E Building 40 $3,528,417 $124.51
MCC-WSR Cellhouse 3 80 $12,368,606 $123.04
MCC-WSR Building 3A 72 $5,869,516 $122.88
WSP-Old Main Unit 1*** 110 $19,797,488 $115.98
WSP-Old Main Unit 4*** 100 $19,797,488 $116.11
WSP-Old Main Unit 7*** 120 $23,069,573 $111.67
*Capital cost estimates were provided by Integrus Architecture
**Operating cost estimates provided by DOC. Revised facility cost per offender per day was estimated by calculating a revised capacity and revised annual cost for a given facility. Revised capacity was calculated by adding new capacity to existing FY2015 capacity. Revised annual cost was calculated by adding the cost of new capacity to the FY2015 total operating cost for the facility. [Revised facility cost per offender per day = (Revised annual cost/ (Revised capacity)) /365 days per year)]. Operating costs do not include additional services associated with a therapeutic mission or salary and benefits increases which went into effect on July 1, 2015.
***Costs for the empty housing Units 1, 4, and 7 assume that in order to open them as medium security, the existing designated 815 minimum security capacity
at WSP-Old Main must also be converted to medium security. The cost to convert the existing capacity is incorporated in each scenario. Constraints on
converting any empty housing unit within WSP-Main to a security level other than its current capacity of minimum require unique assumptions to be made
for WSP-Old Main, which are discussed at the end of this section.

29 | P a g e
Washington State Department of Corrections 2015 Prison Capacity Report to the Legislature
Feasibility
The security level of the currently operational facilities in which some of these empty housing units are
located would pose some constraints in safely housing a medium custody offender population.
SCCC-IMU F UNIT
Converting F Unit to medium security would require that medium custody offenders be housed in the
same building as maximum custody offenders. For security purposes, this would require certain
operational modifications.
Maximum security is the highest security level where out-of-cell time and access to privileges are very
limited. Offenders are typically only classified as maximum custody when they present a serious threat
to the safety of staff or offenders or have extreme protection needs. Maximum security facilities are the
most secure and provide the most supervision in order to safely manage maximum custody offenders.
None of DOC’s existing buildings house both a maximum custody population with general population
offenders such as medium custody. Most of DOC’s maximum security units are located within the same
building as a segregation unit. A segregation unit may house offenders of various custody designations
but none of them may freely leave the building.
The maximum and medium custody populations could be managed to have no contact with one another
within the unit. However, they would still occupy the same building, increasing the risk of contraband
introduction in a maximum security facility because the medium custody population would move
between the SCCC-IMU and other areas of the SCCC site.
Access to contraband in prison is limited compared to non-confinement settings but, there are fewer
constraints in accessing contraband at lesser restrictive security levels because of the increased
privileges and greater freedom of movement that is available. The highly restrictive setting of maximum
security means that access to any contraband such as drugs or weapons is particularly limited.
The DOC has protocols for mitigating the risk of contraband introduction at all of its facilities, including
maximum security. However, because DOC does not typically house offenders of other custody
designations in the same building as maximum custody offenders (except for those in segregation who
do not freely leave the building) at any of its facilities, this would present a unique scenario in which
some operational modifications would be required to mitigate the risk.
The DOC could house medium custody offenders in SCCC-IMU F Unit provided that the following
measures were taken:
Conducting an enhanced screening as part of the decision to house any medium custody
offender in the same building as maximum custody offenders. This would include a more in-
depth review of an offender’s case file in addition to standard classification procedures to

30 | P a g e
Washington State Department of Corrections 2015 Prison Capacity Report to the Legislature
ensure that they represented most risk-averse population to house in F Unit. For example, DOC
would want to make additional efforts to ensure than any offender housed in F unit did not have
a history of contraband introduction.
Constructing and maintaining separate sallyports for the maximum custody and medium
custody offender populations
MCC-TRU E BUILDING
There are few constraints with using E Building for medium security other than not being cost-effective.
The 40 medium security beds E Building could provide would require capital modifications of
approximately $3.5 million. The cost to operate MCC-TRU E building as medium security is estimated to
have a revised facility cost of $124.51 per offender per day.
MCC-WSR CELLHOUSE 3
Cellhouse 3 is an old segregation unit and despite any modifications such as expanding its dayroom and
shower space, the layout of the unit would still more closely resemble close security than medium
security. This would make it very hard to operate as a medium security housing unit, including engaging
in any direct supervision practices.
The majority of DOC’s medium security facilities adhere to the direct supervision model, a correctional
standard, which involves a staff member assigned to a fixed post visually monitoring offenders who
move about freely within the unit. There are few barriers in a direct supervision unit, which fosters
interaction between staff and offenders. This allows staff to detect (and address) any conflict at the
earliest opportunity before it escalates to problematic offender behavior. The physical design of a living
unit that is typical for direct supervision includes dry cells so that offenders must leave their cell (and
interact with others) to utilize bathroom facilities, including showers.
Cellhouse 3 is comprised of wet cells and very few showers, and as such does not support a direct
supervision model. The shower expansions that could be done to convert it to medium security would
help but, the interior layout of Cellhouse 3 has limited sight lines which would inhibit direct supervision.
Sight lines should allow for optimal viewing of the housing unit by staff from their fixed post. Cellhouse
3 has spaces and corridors that create blind spots making it hard for staff to visually monitor a medium
custody offender population, which pose risks to safety and security of the unit. Interior photos of
Cellhouse 3 are provided in Appendix F.
MCC-WSR BUILDING 3A
There are few constraints with using Building 3A for medium security other than not being cost-
effective. The 72 medium security beds Building 3A could provide would require capital modifications of
approximately $5.8 million. The cost to operate MCC-WSR Building 3A as medium security is estimated
to have a revised facility cost of $122.28 per offender per day.

31 | P a g e
Washington State Department of Corrections 2015 Prison Capacity Report to the Legislature
Units within WSP-Old Main: 1, 4, and 7
Units 1, 4, and 7 are old segregation units located within WSP-Old Main. WSP-Old Main is the only
facility offering potential empty housing units for medium security that exist within a currently occupied
minimum security facility. This requires a deliberate discussion on the costs and consequences of
converting any empty units within WSP-Old Main such as 1, 4, or 7 to medium security because the
constraints they pose may seem to suggest an alternative: converting the entire WSP-Old Main (current
815-bed minimum security capacity only) to medium security. This alternative scenario is discussed at
the end of this section.
WSP-Old Main is referred to as the “Old Main” because it was WSP’s original close security institution and was converted to medium security when other newer, more efficient close security units came online in 2008. WSP-Old Main was converted to minimum security in 2011. This allowed WSP’s previous older and smaller, “Old MSU” located outside the perimeter to be closed. Aerial photos of both facilities may be found in Appendix B. The 2011 conversion of WSP-Old Main from medium security to minimum security generated $11.7 million in operating budget savings over the 2011-13 Biennium ($3.9 million in FY2012 + $7.8 million in FY2013). It also provided cost-efficiencies by increasing capacity at minimum security.
Prior to conversion of the WSP-Old Main to minimum security, a large number of minimum custody
offenders were being held at medium security facilities throughout the state because of medical or
mental health issues that exceeded the healthcare resources available at a minimum security facility.
This was not cost-efficient as medium security beds are more expensive to operate than minimum
security beds. Converting the WSP-Old Main to minimum security allowed a backlog of minimum
custody offenders that were inefficiently held at medium security to be shifted into a large, co-located
minimum security facility where their medical and mental health needs could be met by the healthcare
resources available at the WSP site.
THE PERIMETER
Converting any single unit within WSP-Old Main such as Unit 1, 4, or 7 to medium security would require
the entire perimeter surrounding WSP-Old Main to be converted to medium security. Although the
majority of the offenders in the WSP-Old Main would be minimum custody, the perimeter of the facility
must correspond to the highest custody designation of the offenders housed inside the facility. The
existing medium security perimeter, specifically four towers that have gone unused since the WSP-Old
Main was converted from medium to minimum security, would need to be upgraded with seismic
structural work and repairs to the HVAC and security electronic systems.
The cost of the four tower upgrades is estimated to have a capital cost of approximately $1.3 million.
32 | P a g e
Washington State Department of Corrections 2015 Prison Capacity Report to the Legislature
RISKS WITH CO-HOUSING MEDIUM AND MINIMUM CUSTODY
The perimeter of WSP-Old Main could be upgraded to medium security but, there would still be risks
with housing a medium custody population in the empty housing units such as 1, 4, and 7 next to units
housing minimum custody offenders. This is because the perimeter would be somewhat permeable due
to the minimum custody work crews that would leave the facility to work outside the perimeter,
including throughout the WSP site or in the community. Medium custody offenders are not free to
leave the facility. Co-housing medium custody offenders within the same facility as the more mobile
minimum custody offender population increases the risk of contraband introduction and escape.
The presence of minimum custody work crews would provide a unique opportunity for the
introduction of contraband into a secure facility as they have access to the community, including
the ability to acquire contraband such as drugs or weapons. Medium custody offenders are a
more dangerous population than minimum custody offenders, as assessed by DOC’s
classification tool, which means that medium custody offenders would likely capitalize on the
enhanced contraband access that housing the mobile minimum custody population would
present. Such contraband may also increase the risk of violence within the facility thereby
risking the safety of staff and offenders.
Minimum custody offenders are generally four years or less until their ERD which makes them
less likely to attempt to escape than offenders with longer sentences such as medium custody
offenders. Minimum custody offenders who participate in offsite work crews are also screened
for any public safety concerns that would prohibit them from working outside the perimeter.
For example, sex offenders housed at minimum security are generally restricted from going
outside the perimeter. Housing medium custody offenders alongside a population that actively
moves between the facility and the community on a daily basis increases the risk of escape. For
example, a medium custody offender would have opportunities to “pose” as a minimum
custody work crew offender.
The DOC maintains security protocols at all of its correctional facilities to mitigate both the risk of
contraband introduction and escape. However, none of DOC’s facilities house medium custody
offenders with minimum custody offenders who go outside the perimeter.
ALTERNATIVE SCENARIO: CONVERTING THE ENTIRE FACILITY TO MEDIUM
Given the constraints and risks with co-housing medium custody offenders with minimum custody
offenders, an alternative solution may seem to be converting the entire WSP-Old Main to medium
security. For example, converting WSP-Old Main’s current 815 minimum security capacity to medium
security and keeping vacant Units 1, 4, and 7 closed. This would reverse the cost efficiencies gained by
WSP-Old Main’s 2011 conversion to minimum security which allowed minimum custody offenders who
had previously been inefficiently held at medium security facilities due to medical or mental health
needs that exceeded minimum security facility healthcare resources. It would also reduce minimum
security capacity.

33 | P a g e
Washington State Department of Corrections 2015 Prison Capacity Report to the Legislature
Converting the WSP-Old Main back to medium security would reduce the supply of minimum custody
offender work crews needed to operate multi-custody facilities, particularly at WSP. The intricate
perimeter system of the WSP site allows minimum custody offenders to move in-and-out of the
perimeter to help support the daily operation and maintenance of WSP. It would be virtually impossible
for WSP to operate without the support of minimum custody offenders. The loss of minimum custody
offenders from the WSP site would require that another building be purposed as a co-located minimum
security facility. For example, converting WSP-Old Main to medium security would require that WSP-
Old MSU be brought back online at the WSP site. A cost scenario for that is provided below:
Converting WSP-Old Main back to medium security
o Capital – The capital assessments conducted for WSP-Old Main by Integrus Architecture
focused on Units 1, 4, and 7 and excluded assessing any of WSP-Old Main’s current
capacity of 815 minimum security beds. It is possible to estimate some of the capital
costs to convert WSP-Old Main’s current minimum security capacity to medium using
the architectural assessments done for Units 1, 4, or 7 because similar capital
modifications would likely be required. The capital upgrades that would be needed to
convert the individual Units 1, 4, and 7 to medium security and the tower upgrades
equate to an estimated cost of roughly $64 million. However, this is a very low estimate
as it assumes there would be no additional capital expenses needed to convert WSP-Old
Main’s current capacity back to medium security. DOC reviewed its ten-year capital
improvement plan for WSP-Old Main from 2009 when the facility was still medium
security which shows that roughly $107 million was required to maintain WSP-Old Main
as medium security. However, this is also a very low estimate as it is based on capital
improvements identified at that time and the cost of which are presumed to be pre-
escalation.
o Operating – The cost to operate WSP-Old Main as medium security was estimated by
DOC to have a revised facility cost of $116.92 per offender per day. This assumes
capacity of 815 medium security beds. See Appendix E for a more detailed explanation
of operating costs, including how the revised estimated facility operating cost was
calculated.
Re-opening the WSP-Old MSU at minimum security
o Capital – Capital costs to re-open the WSP-Old MSU at minimum security are estimated
to be roughly $26.9 million. This includes MACC, soft costs, ACA upgrades, and taxes.
The main cost-drivers are a full seismic structural renovation; new roof with historic tile;
new thermal assembly for all exterior walls such as insulation, metal studs, sheathing,
and weather barrier; new plumbing system to replace the current system which is no
longer useable; new HVAC system; and a completely new fire protection system with
fire alarms and sprinklers.
o Operating – The cost to operate WSP-Old MSU at minimum security was estimated by
DOC to have a revised facility cost of $106.32 per offender per day. This assumes

34 | P a g e
Washington State Department of Corrections 2015 Prison Capacity Report to the Legislature
capacity of 189 minimum security beds. See Appendix E for a more detailed explanation
of operating costs, including how the revised estimated facility operating cost was
calculated.
CAPACITY CHANGES FROM THE WSP-OLD MAIN/WSP-OLD MSU SCENARIO
WSP-Old Main offers the same medium security capacity as it does minimum security capacity: 815
beds. The minimum custody population currently housed at WSP-Old Main would be displaced by
converting it to medium security. Re-opening WSP-Old MSU, which has capacity of 189 minimum
security beds, would help absorb part of the minimum custody population that would be displaced by
converting the WSP-Old Main to medium security; however, not all of it. Converting the WSP-Old Main
to medium security and re-opening WSP-Old MSU at minimum security would still result in a loss of 626
minimum security beds.
Examination of DOC’s and Other States’ Custody Designation Policies 2EHB 1115 directed DOC to review its policies that determine custody designations and examine other
states’ policies.
The DOC worked with ASCA to conduct a survey of other states’ classification policies. The ASCA survey
asked states to provide information such as their total prison population on September 1, 2015 and
what percentage of their population was housed at close, medium, and minimum custody.
Definitions for close, medium, and minimum custody were provided to help elicit responses that could
be compared against generally accepted custody designation definitions within the corrections field.
See Appendix G for the custody designation definitions provided in the ASCA survey. Forty-five
jurisdictions completed the ASCA survey. Most states also provided copies of their classification policies.
The DOC selected a sample of six states to analyze for this report. This was done to conduct a
comprehensive analysis of classification policies between prison systems, each of which are unique
compared to Washington and one another, and required an in-depth translation of each state’s policy.
There were multiple reasons for why DOC focused on a small sample of states, including limited time
and resources to support a multi-state classification policy analysis.
Some states were excluded from the sample because they:
Completed the ASCA survey but did not provide their classification policy
Did not complete the ASCA survey correctly
Provided classification policies that were not comprehensive enough for DOC’s own subject-
matter experts to interpret without a substantial amount of additional information requests

35 | P a g e
Washington State Department of Corrections 2015 Prison Capacity Report to the Legislature
A key criterion for selecting states into the sample was rate of prison incarceration. Rate of prison
incarceration has implications for prison classification because crime is a factor used by virtually all
prison systems to determine custody designation. Typically, the more serious the crime, the higher the
custody designation. States with higher prison incarceration rates are assumed to have a higher
percentage of their prison populations serving sentences for less serious crimes such as drug and
property and consequently, more offenders at minimum custody. States with lower prison incarceration
rates are assumed to have a higher percentage of their prison populations serving sentences for more
serious crimes such as crimes against a person and as a result, more offenders at close custody.
The DOC did not examine the criminal seriousness of any states’ prison population. Rate of prison
incarceration is only an assumed measure of criminal seriousness of a states’ prison population.
Washington State:
Ranks 41st in the nation in rate of prison incarceration.
Two-thirds of the offenders in prison are serving time for crimes against a person.
Forty-percent of offenders in prison are serving sentences of more than ten years.
More than one-third of the offenders in prison are assigned minimum custody.
Rate of prison incarceration was gathered from the Bureau of Justice Statistics’ (BJS) publicly available
data. Each state was then ranked on their rate of prison incarceration relative to all other states. This
allowed DOC to compile a sample of states whose prison incarceration rates were diversely represented
as low, moderate, or high. See Table 8 below. The DOC also ensured the sample held diversity in the
percent distribution of prison populations across custody designations and in geographic representation.
Table 8. Sample of States with ASCA Survey Responses* and BJS Prison Incarceration Rank
State
Total Prison
Population
Percent at
Close
Percent at
Medium
Percent at
Minimum
Prison
Incarceration Rank
Minnesota 10,119 35% 52% 13% 47th
Washington** 17,270 9% 52% 34% 41st
Connecticut 16,106 34% 34% 32% 36th
Oregon 14,046 27% 28% 44% 27th
Colorado 20,524 13% 51% 36%*** 24th
Alabama 31,034 2% 52% 20% 3rd
Oklahoma 28,118 <1% 45% 48% 2nd
*The percentages states reported for each custody designation may not equate to 100%. This may be because the custody definitions provided in the ASCA
survey did not precisely meet the custody designations recognized by those states.

36 | P a g e
Washington State Department of Corrections 2015 Prison Capacity Report to the Legislature
**The DOC did not participate in the ASCA survey but the distribution of its prison population on April 30, 2015 is shown here for reference.
***Colorado indicated that the approximate 36% of its prison population held at minimum is comprised of two “tiers” of minimum; about 25% is “minimum
restricted” and about 10% is “minimum-unrestricted”. This is discussed in more detail in the remaining sections of this report.
Each state has a unique classification system that accounts for different factors in their classification
model and maintains different practices for housing offenders at different custody designations. A
summary of the primary differences between each states’ classification model is provided in Appendix
H.
Minnesota and Connecticut (low rank in rate of prison incarceration)
Minnesota and Connecticut are similar to Washington by ranking low in rate of prison incarceration.
Thus, like Washington, Minnesota and Connecticut are assumed to each have a prison population that is
more heavily comprised of offenders serving time for more serious crimes. This is reaffirmed by
Minnesota and Connecticut having higher percentages (about one-third) of their prison populations at
close custody compared to the other states sampled. However, this is where Minnesota and
Connecticut differ from Washington. Washington houses a minority (about nine-percent) of its
population at close custody. A couple factors may contribute to this:
Minnesota does not allow offenders serving a life sentence to be housed any lower than close
custody. In Washington, offenders sentenced to life must serve their first four years at close
custody but may be re-classified to medium custody.
Connecticut uses length of sentence as an explicit factor to determine an offender’s custody
designation, including requiring offenders to serve a certain percentage of their sentence at
their assigned custody designation before being promoted. For example, an offender housed at
close custody must serve 35% of their sentence there before they can promote to medium
custody. Washington does not use sentence length as a factor in its custody model nor does it
require offenders to serve a percentage of their sentence at any custody designation.
This suggests that Minnesota and Connecticut operate a more conservative classification system than
Washington to manage a prison population that is characterized by a similarly serious criminal profile.
Alabama and Oklahoma (high rank in rate of prison incarceration)
Alabama and Oklahoma are different from Washington by ranking high in rate of prison incarceration.
Thus, unlike Washington, Alabama and Oklahoma are assumed to each have a prison population that is
comprised more heavily of offenders serving time for less serious crimes. This is reaffirmed by Alabama
and Oklahoma holding a very small percentage (two-percent or less) of their prison populations at close
custody. However, they differ greatly from one another in how their prison populations are split
between medium and minimum security. A couple factors may contribute to this:
Oklahoma uses close custody mostly as short-term housing to observe offenders newly
admitted to prison or for those who demonstrate behavioral problems. Half of Oklahoma’s
prison population is held at minimum custody which is likely because they house violators in
their minimum security prisons. Washington predominantly houses violators in local jails. This,

37 | P a g e
Washington State Department of Corrections 2015 Prison Capacity Report to the Legislature
in combination with their sparing use of close custody, may be why the other half of Oklahoma’s
prison population is held at medium custody, as well as policies around offenders with life
sentences. Like Washington (but unlike some states such as Minnesota), Oklahoma does not
prohibit offenders serving life sentences from being housed at medium custody.
Alabama reserves close custody mostly for offenders who commit the most serious acts of
institutional violence. This means that Alabama has a tendency to more heavily classify
offenders to medium custody. Alabama is also particularly selective when it comes to which
offenders may be housed at minimum custody. Alabama only allows offenders convicted of a
property or other non-violent crime who are within seven years of release to be assigned to
minimum custody. Washington is less selective when it comes to which crimes restrict an
offender from being assigned minimum custody, in that typically only certain sex offenders are
exempt.
This suggests that Alabama and Oklahoma operate a less conservative classification system than
Washington to manage a prison population that is characterized by a less serious criminal profile.
Colorado and Oregon (moderate rank in rate of prison incarceration)
Colorado and Oregon maintain a moderate rank in rate of prison incarceration. Thus, they are assumed
to have a prison population that is more heavily comprised of offenders convicted of less serious crimes
than Washington but lesser than that of high ranking prison incarceration states like Oklahoma.
However, Colorado and Oregon differ greatly from one another in how their prison populations are
distributed across custody designations, including how their populations are split between medium and
minimum custody. Colorado looks similar to Washington in terms of the percentage of its prison
population held across all custody designations but does hold a slightly higher percentage of its prison
population at minimum custody than Washington. However, Oregon holds a notably higher percentage
of its prison population at minimum custody than Washington despite holding a moderate rank in rate
of prison incarceration like Colorado. This prompted a particularly close look at the classification policies
of Colorado and Oregon.
COLORADO
Colorado and Washington do not appear to possess directly comparable versions of minimum custody.
For example, the 36% of the prison population that is held at minimum custody in Colorado includes two
“tiers” of minimum custody: minimum-unrestricted (about 10% of their prison population) and
minimum-restricted (about 25% of their prison population). Both of Colorado’s minimum-unrestricted
and minimum-restricted offenders may leave the facility to work in the community but, minimum-
restricted offenders are held in facilities that are more secure than the facilities in which minimum-
unrestricted offenders are housed.
Colorado’s minimum-unrestricted population is housed at facilities in which the perimeter is less
secure than Washington’s minimum security facilities. Washington’s minimum security facilities
are typically enclosed by a single minimum security fence. It appears that a notable portion of
Colorado’s minimum-unrestricted security facilities do not have any fencing. Colorado’s

38 | P a g e
Washington State Department of Corrections 2015 Prison Capacity Report to the Legislature
minimum-restricted population is housed at facilities that are enclosed by fencing with razor
wire and this more closely resembles Washington’s minimum security facilities. This means that
Colorado’s minimum-restricted facilities and Washington’s minimum security facilities are fairly
equivalent. Colorado’s minimum-unrestricted security facilities seem non-equivalent to
Washington’s minimum security facilities and translate more closely to a security level
somewhere between Washington’s work release facilities and minimum security facilities.
Colorado allows an offender to be classified to minimum-unrestricted when they are three years
or less to release. Offenders may be classified to minimum-restricted when they are five years
or less to release. This is different than Washington, which allows offenders to be classified to
minimum custody when they are four years or less to ERD. Offenders with more than four years
to ERD who otherwise score minimum custody are assigned MI3. However, Colorado does not
allow sex offenders who have had treatment recommended to be housed at either tier of
minimum (minimum-unrestricted or minimum-restricted). This is similar to Washington who
restricts certain types of sex offenders from minimum custody but uses different criteria and
processes to do so.
Like Colorado, Washington also has two tiers of minimum custody that are held in total
confinement facilities: MI3 and MI2. Washington holds its MI3 population behind a medium
security perimeter and considers MI3 the same (capacity-wise) as medium custody. Colorado’s
two tiers of minimum (minimum-unrestricted and minimum-restricted) are also both held in
total confinement facilities. However, Colorado is unique from Washington in an important
way: Colorado does not have work release (a subset of minimum custody known as MI1 in
Washington). This means that the spread between Colorado’s two tiers of minimum (minimum-
unrestricted and minimum-restricted) may look different in Washington. For example, it might
be that a portion of Colorado’s minimum-restricted population would be housed at medium
security facilities in Washington because they would meet criteria as an MI3 offender, being
more than four years to ERD in particular. It might also be that a portion of Colorado’s
minimum-unrestricted custody population would be housed at work release in Washington
because they would meet criteria for a work release offender, being six months or less to ERD in
particular. However, this is hypothetical and would need to be determined through additional
analyses beyond a policy review.
This suggests that Colorado operates a fairly progressive classification system despite managing a prison
population characterized by a moderately serious criminal profile. Colorado’s distinction in housing
offenders who are five years or less to release at more secure minimum-restricted facilities (that are
more like Washington’s minimum security facilities) and offenders who are three years or less to release
at less secure minimum security facilities may help them do this.
It is difficult to compare how progressive Colorado’s classification system is compared to Washington’s
because of state-specific nuances around minimum custody that, in Colorado, seems to divide the
minimum custody population between two types of minimum security facilities and that, in Washington,
divides the minimum custody population between medium and minimum security facilities.

39 | P a g e
Washington State Department of Corrections 2015 Prison Capacity Report to the Legislature
In some ways, Colorado may be more progressive than Washington by having two tiers of minimum
custody. In other ways, Colorado may be less progressive than Washington by not having work release.
However, DOC would need to conduct additional research on Colorado’s classification policies to fully
evaluate the policy implications for distributing their offender population across custody designations,
particularly at minimum custody, in a way that seems unique from Washington.
OREGON
There are components of Oregon’s classification model that seem to directly influence the distribution
of its prison population across custody designations, including the 44% that is held at minimum security,
but also factors external to its classification system.
Oregon uses a violence predictor score (VPS) to help determine an offender’s custody
designation. The VPS is derived through an assessment that was developed using Oregon data,
such as the characteristics of offenders who commit violent acts in prison. The VPS predicts an
offender’s risk of committing a violent act in prison up to a year from when the score is
calculated. The VPS’ predictive nature (as opposed to actual, demonstrated behavior) results in
a tendency to classify offenders into higher custodies. This may explain why Oregon has a
higher percentage of its prison population at close custody compared to Washington.
Washington does not use any predictive assessments such as a VPS to assign offenders into any
custody designation.
Oregon has a more narrow definition of escape than Washington and a lower threshold for how
long escape history is factored into an offender’s custody score. For example, Oregon defines
escape primarily as any escape from a facility or escaping from custody of a peace or law
enforcement officer if restraints have already been applied. Washington defines escape more
broadly as any escape from a facility but also any escape from community supervision (e.g.,
absconding). Also, an offender who commits an escape in Washington will have custody points
deducted for the next ten years. Oregon on the other hand will only factor in escape history for
the next five years.
Oregon has fewer offsite work crew opportunities than Washington. This results in fewer
constraints in how many offenders housed at minimum security facilities are restricted from
working outside the perimeter, including sex offenders. Both Oregon and Washington allow sex
offenders to be assigned to minimum custody provided they meet special screening criteria.
Also, both Oregon and Washington generally do not allow sex offenders who are housed at
minimum security from working outside the perimeter. However, Washington differs from
Oregon by having more offsite work crew opportunities for offenders at its minimum security
facilities, including a strong partnership with DNR. All four of DOC’s standalone minimum
security facilities and some co-located minimum security facilities have DNR work crews that
provide critical forestry functions. Only a couple of Oregon’s minimum security facilities have
offsite DNR-like offender work crews. Consequently, Oregon may be able to house a greater
number of offenders at minimum security, including more sex offenders, because their need to

40 | P a g e
Washington State Department of Corrections 2015 Prison Capacity Report to the Legislature
provide a critical number of offenders who can work outside the perimeter is less than
Washington.
Oregon confines violators in prison; most of whom are housed in minimum security facilities.
This differs from Washington, which houses violators in local jails. Washington does house
some violators in its prisons but, this is the exception rather than the rule.
These factors suggests that Oregon operates more a conservative classification system than Washington
to manage a prison population that is characterized by a somewhat less serious criminal profile.
Oregon’s classification policy does exercise lesser caution around escapes than Washington which likely
results in more offenders being assigned to lower custody levels in Oregon. However, factors such as
the fewer number of offsite work crew opportunities, which allow more sex offenders to be housed in
minimum security facilities and housing violators in prisons, are likely the biggest drivers for why a
substantial portion of Oregon’s prison population is housed at minimum custody.
Cost Scenario: Facilities that Operate at Different Security Levels
Washington’s classification policy may also be more cost-efficient than other states who house higher
percentages of their prison populations in higher custodies. This is because higher security levels are
typically more costly than lower security levels. For example, WSP and CBCC both operate close custody
units and are among the most expensive prisons in Washington State. See Table 9 below.
Table 9. DOC’s Male Facilities by Cost and Security Level for FY2015
Facility ADP Cost per Offender per
Day*
Highest General
Population Security Level
CBCC 888 $109.51 Close
WSP 2,553 $109.42 Close
AHCC 2,177 $73.65 Medium
CRCC 2,511 $70.73 Medium
MCC 2,445 $124.74 Medium
SCCC** 1,936 $72.31 Medium
CCCC 474 $66.63 Minimum
LCC 475 $64.34 Minimum
OCC 390 $75.60 Minimum
*Cost per offender per day includes health care costs by facility but excludes administrative services costs.
**Cost per offender per day excludes sewer bond payments for SCCC.

41 | P a g e
Washington State Department of Corrections 2015 Prison Capacity Report to the Legislature
Possibilities to Utilize Local Jail Beds for Medium Security 2EHB 1115 directed DOC to examine possibilities to utilize jail beds for medium security. The possibility
of utilizing local jail beds for medium security has been explored previously in response to Engrossed
Substitute Senate Bill 6002 from 2014, which directed:
DOC to assess possible uses for the YCCC; and
OFM to analyze statewide adult correctional needs, including identifying barriers and solutions
for the use of jail beds in lieu of prison beds.
Findings from both evaluations can be found in reports submitted to the legislature in 2014, including
DOC’s, Use of Yakima County Corrections Center Report and BERK’s Analysis of Statewide Adult
Correctional Needs and Costs. Both reports serve as key sources in the present report.
A key finding from BERK’s (2014) assessment was that jail and prison beds are not interchangeable.
Table 10 below provides a cost comparison between housing offenders in prisons and jails using CRCC,
one of DOC’s newer medium custody prisons as an example, and the cost of housing violators in local
jails. To reiterate: the jail costs below represent the average cost of housing offenders in local jails
throughout the state.
Table 10. Statewide Average Cost per Offender per Day for all Prisons and Jails in FY2015
Prison (CRCC) Jail
$70.73 $81.99*
*This rate includes the cost of incarceration and healthcare as of October 1, 2015. This rate is not final as invoices and payments are still pending at the time of this report.
Prisons and Jails: Designed for Different Populations
In Washington, jails are operated by a diverse array of local governments such as cities, counties, and
tribes. Prisons are operated solely by DOC as part of a centralized prison system. DOC contracts with
local jails such as to confine community supervision violators. However, prisons and jails are different
entities and serve different purposes within the criminal justice system. State prisons may deliver
extensive programming that aims to reduce recidivism and prepare offenders for reentry into the
community upon release. Jails focus more on an individual’s intake into the criminal justice system and
full or partial confinement as sanctions for violations on community supervision (BERK, 2014).
A key difference between jails and prisons is the length of stay for the unique populations they each
house (BERK, 2014). In Washington, jails confine people who present a danger to the community and/or
are at risk of failing to appear at their court hearings and to hold offenders sentenced for less than a
year of incarceration. Prisons confine offenders sentenced to more than a year of incarceration. As a
result, offenders convicted of more serious crimes are sentenced to prison rather than jail, requiring the
physical architecture of prisons be particularly secure.

42 | P a g e
Washington State Department of Corrections 2015 Prison Capacity Report to the Legislature
Jails are designed to be short-term housing whereas prisons are designed to be long-term housing.
Offenders often come to jails directly from the street after arrest and their admission/release patterns
demonstrate a quick churn. As a result, an offender’s length of stay varies greatly in jail. For example,
King County reported that their average length of stay in jail is about 21 days but that their median
length of stay in jail is 2 days. The average length of stay in prison is about 23 months (BERK, 2014).
Jails are also designed to minimize movement between areas within a jail such as by feeding offenders
in-cell rather than in a cafeteria. Prisons offer an array of security levels and programming and often
have physical space within a prison to offer evidence-based programming that reduces recidivism. The
common practice for prisons is to utilize controlled movement to allow offenders to walk between
buildings and program areas within a secure perimeter, which means that the close-quarters nature of
jails is not ideal for a long-term population such as prison offenders and may do little to support the
state’s interest in evidence-based programming (BERK, 2014).
BERK’s (2014) Analysis of Statewide Adult Correctional Needs and Costs contains a table that summarizes
key differences between prisons and jails which may also be found in Appendix I of this report.
Cost Scenario: The Yakima County Corrections Center
Most jails are assumed to operate at security levels that are less than DOC’s medium security standards.
For example, DOC’s assessment of YCCC found that, because of its perimeter being a boundary fence
rather than security fence and its dormitory-style housing units, YCCC is equivalent to a minimum
custody facility. The DOC did identify a minimum custody offender population suitable for the YCCC
with a similar length of stay to jail offenders: offenders who have had their Drug Offender Sentencing
Alternative sentence revoked and were returned to prison to complete their original sentence (DOC,
2014).
The cost of using jails beds as medium security prison beds largely depends on the physical design of a
jail because that will determine the physical modifications needed to bring the facility up to medium
security standards. The size of a jail will also determine how many offenders may be housed there,
which will influence the operating costs. In the case of the YCCC, an ADP of 288 was assumed.
Capital - $417,000 to construct a new perimeter security fence. The physical configuration of
YCCC does not allow for either a security fence or patrol road (DOC, 2014). However, this is the
most proximal cost estimate for what it would take to convert the facility to medium security.
Transportation - $55,000 per year to transport offenders from the Reception Center at the
Washington Corrections Center to the YCCC
Operating - The cost per offender per day varied based on multiple options available for
consideration. See DOC’s, Use of Yakima County Corrections Center Report (2014) for details.
Yakima County estimated the cost of purchasing the YCCC at $25 million.

43 | P a g e
Washington State Department of Corrections 2015 Prison Capacity Report to the Legislature
Expansion of Work Release to Reduce the Need for Minimum Security Beds DOC explored opportunities to expand capacity at work release to reduce the need for minimum security beds.
DOC operates 16 work release facilities statewide. The AVWR and Bellingham WR were identified as two work
release facilities in which work release capacity may be expanded.
AVWR Background
The AVWR is comprised of two units: Unit 2A and Unit 9A.
Unit 2A is currently occupied by work release offenders but has some space within it that would allow
for its current work release capacity to be expanded if additional resources are provided.
Unit 9A is currently vacant as it was closed in 2010 but could provide additional work release capacity be
re-opening the unit if additional resources are provided.
The current capacity of AVWR is 54 work release beds, of which is located in Unit 2A. AVWR is a DOC-owned
facility.
Bellingham WR Background
Bellingham WR has a current capacity of 23 work release beds (19 male and four female). Bellingham WR is not
a DOC-owned facility. The current building is located on a property on which the owner has plans to build a
new, four-story building. The owner has expressed interest in a long-term contract with DOC to expand current
capacity of Bellingham WR. However, if DOC does not commit to expanding its work release capacity in the new
building, the owner plans to re-purpose the use of the current building and new building as housing for college
students. Thus, there is the risk that DOC will lose its current capacity of 23 work release beds at Bellingham WR
if it does not commit to expanding capacity.
Work Release Expansion
The extent of work that would be required to expand work release capacity at either AVWR or Bellingham WR
would vary greatly between the two facilities.
AVWR – The extent of work that would be required to expand work release capacity at AVWR would
vary between the two units as one is currently in-use and another is currently vacant.
o Unit 2A, which is currently in-use, would require some capital improvements but none that
would greatly exceed the capital improvement projects included in its current ten-year capital
plan.
o Unit 9A, which is currently vacant, would require more extensive capital improvements prior to
occupancy. The DOC identified that the roof is in relatively good condition, five residential
heating pumps would need to be replaced, and new bathroom fixtures (e.g., toilets, sinks,
showers) would need to be installed because the building currently has no bathroom fixtures.
They were removed when the facility was closed. However, there are some unknowns as to the
exact modifications that would be required to bring Unit 9A online because of the length of
time it has been closed. The DOC would need to conduct an extensive review of the building to
assess any upgrades required by current code regulations. For example, code regulations may

44 | P a g e
Washington State Department of Corrections 2015 Prison Capacity Report to the Legislature
require improvements to windows, insulation, boilers, and hot water tanks before the building
may be occupied.
Bellingham WR – As a non-DOC owned building, DOC is not responsible for any capital improvements.
Length of Time to Complete
AVWR and Bellingham WR could be brought online fairly soon and along similar timelines.
AVWR – Given the minimal modifications required for AVWR Unit 2A, it could be brought online
relatively quickly. The DOC expects that it could house additional work release offenders by FY2017.
However, AVWR Unit 9A is estimated to require more substantial modifications which may take about
one year to complete before it could be made available to house work release offenders. This means it
could house offenders in roughly FY2018.
Bellingham WR – While a non-DOC owned facility, the expansion of Bellingham WR is estimated by the
owner to be complete by April 2016 (FY2016).
Costs and Capacity
Table 11 below shows the capital and operating costs for increasing work release capacity in total and by unit.
The capital cost to expand work release capacity include MACC, soft costs, and taxes. Capital cost definitions are
provided in Appendix D and a more detailed explanation of operating costs (including how the revised estimated
facility operating cost was calculated) is provided in Appendix E.
Table 11. Work Release Expansion Capacity and Costs (Capital and Operating)
Facility/Unit Additional Work Release
Operating Capacity
Total Estimated Capital
Cost
Revised Estimated
Facility Operating Cost
per Offender per Day**
AVWR Unit 2a 41 $1,200,016 $63.34
AVWR Unit 9A 60 $2,400,031 $67.15
Bellingham WR 20* Not Applicable $78.33
Total 121 $3,600,047
*Expansion includes 17 male work release beds and three female work release beds
**Operating cost estimates provided by DOC. Revised facility cost per offender per day was estimated by calculating a revised capacity and revised annual cost for a given
facility. Revised capacity was calculated by adding new capacity to existing FY2015 capacity. Revised annual cost was calculated by adding the cost of new capacity to the
FY2015 total operating cost for the facility. [Revised facility cost per offender per day = (Revised annual cost/ (Revised capacity)) /365 days per year)]. Operating costs do
not include additional services associated with a therapeutic mission or salary and benefits increases which went into effect on July 1, 2015.

45 | P a g e
Washington State Department of Corrections 2015 Prison Capacity Report to the Legislature
Feasibility and Impact
Expanding work release capacity at both AVWR and Bellingham WR is a viable option that could help reduce the
demand for minimum security beds. Expanding work release capacity at Bellingham WR in particular will also
ensure that its current capacity can be retained.
AVWR – There is the potential to expand capacity by up to 101 work release beds (41-bed expansion in
Unit 2A and 60-bed expansion in Unit 9A). This equates to a potential total work release capacity of 155
work release beds (101-bed expansion in addition to the current 54-bed capacity) at AVWR.
Bellingham WR – There is the potential to expand capacity by 20 work release beds. This expansion is
necessary to retain Bellingham WR’s current capacity of 23 work release beds. Otherwise, Bellingham
WR’s potential total work release capacity of 43 work release beds (20-bed expansion in addition to the
current 23-bed capacity) will be lost as the property owner intends to re-purpose the property if DOC
does not expand capacity at the Bellingham WR site.
As of September 30, 2015, DOC had approximately 360 offenders that were classified as work release but
housed in minimum security facilities. Some of this backlog could be alleviated through the total potential
capacity of 121 work release beds offered by both AVWR and Bellingham WR.

46 | P a g e
Washington State Department of Corrections 2015 Prison Capacity Report to the Legislature
References
BERK. (2014). Analysis of Statewide Correctional Needs and Costs. (Available at
http://www.ofm.wa.gov/reports/Correctional_Needs_and_Costs_Study2014.pdf).
Bonta, J. and Andrews, D.A. (2007). Risk-Need-Responsivity Model for Offender Assessment and
Rehabilitation. Public Safety Canada. (Available at
http://www.pbpp.pa.gov/Information/Documents/Research/EBP7.pdf).
Council for State Governments. (2015). Justice Reinvestment in Washington: Analysis and Policy
Framework. (Available at https://csgjusticecenter.org/wp-
content/uploads/2015/01/JusticeReinvestmentinWashington.pdf).
DOC. (2014). Use of Yakima County Corrections Center Report. (Available at
http://app.leg.wa.gov/ReportsToTheLegislature/Home/GetPDF?fileName=Yakima%20County%20Jail
%20Facility_8740630c-bcc0-4543-8130-06e77e1d1f8f.pdf).

47 | P a g e
Washington State Department of Corrections 2015 Prison Capacity Report to the Legislature
Appendix A – High Security Compared to Minimum Security Fencing
Photo 1. High Security Fencing with Armed Tower at WSP
Photo 2. Minimum Security Fence at AHCC – MSU

48 | P a g e
Washington State Department of Corrections 2015 Prison Capacity Report to the Legislature
Appendix B – Facility Aerial Photos
Photo 3. AHCC Site
Photo 4. AHCC - MSU

49 | P a g e
Washington State Department of Corrections 2015 Prison Capacity Report to the Legislature
Photo 5. AVWR
Photo 6. Bellingham WR

50 | P a g e
Washington State Department of Corrections 2015 Prison Capacity Report to the Legislature
Photo 7. CCCC

51 | P a g e
Washington State Department of Corrections 2015 Prison Capacity Report to the Legislature
Photo 8. SCCC Site
Photo 9. SCCC – IMU

52 | P a g e
Washington State Department of Corrections 2015 Prison Capacity Report to the Legislature
Photo 10. WSP Site
Photo 11. WSP-Old Main and WSP-MSU

53 | P a g e
Washington State Department of Corrections 2015 Prison Capacity Report to the Legislature
Appendix C – Architectural Assessments by Integrus Architecture
Assessment 1. AHCC-MSU Overview: The two existing minimum facilities have been selected for possible revision to Medium prison from existing Minimum camp. The Air Heights Correction Center Minimum was selected as a test fit for an existing co-located facility. The facility would be configured with the same basic amount of typical building construction for a population of 512 inmates. This would consist of two, typical 256 bed housing units, 32 bed seg unit, programs, dining and recreation buildings to support the population of 512. The additional support area for outdoor recreation area would also be added. The entire facility would enclosed with a double perimeter security fence and include a perimeter patrol road. Analysis: The requirements for the I-3 occupancy for the secure cells required for the Medium level inmates will dictate the use of a Type 1 or 2B construction type. These construction types can be only be met with concrete or solid grout masonry walls. Additionally, the Washington State Department of Corrections requires that all buildings inside the secure perimeter are to be with concrete or solid grouted masonry construction for staff safety and long term durability. Given these parameters, the existing minimum camp construction of wood frame buildings will need to be demolished and replaced with the buildings having the necessary building construction for the Medium population along with a new double secure fence and patrol road. For Airway Heights, the existing buildings demolished and replaced and new fence matching the current Medium fence that would be tied into that existing fence.

54 | P a g e
Washington State Department of Corrections 2015 Prison Capacity Report to the Legislature
Assessment 2. CCCC Overview: The two existing minimum facilities have been selected for possible revision to Medium prison from existing Minimum camp. The Cedar Creek Corrections Center in Mason County was selected as a test fit for a current stand-alone facility. The facility would be configured with the same basic amount of typical building construction for a population of 512 inmates. This would consist of two, typical 256 bed housing units, 32 bed seg unit, programs, dining and recreation buildings to support the population of 512. The additional support area for outdoor recreation area would also be added. The entire facility would enclosed with a double perimeter security fence and include a perimeter patrol road. Analysis: The requirements for the I-3 occupancy for the secure cells required for the Medium level inmates will dictate the use of a Type 1 or 2B construction type. These construction types can be only be met with concrete or solid grout masonry walls. Additionally, the Washington State Department of Corrections requires that all buildings inside the secure perimeter are to be with concrete or solid grouted masonry construction for staff safety and long term durability. Given these parameters, the existing minimum camp construction of wood frame buildings will need to be demolished and replaced with the buildings having the necessary building construction for the Medium population along with a new double secure fence and patrol road. At Cedar Creek, this would require a complete replacement of the existing structures and new fence.

55 | P a g e
Washington State Department of Corrections 2015 Prison Capacity Report to the Legislature
Assessment 3. MCC-TRU E Building General Information
a. Built in 1984 b. Double bunked for 40 beds c. Programing space for inmates will not meet current WDOC standards
Structural (Includes Foundations, Basement Construction, Super Structure) a. Seismic retrofit may not need be required
Exterior Enclosure a. Roof replacement requirements need to be upgraded
Interiors (Includes Interior Construction and Finishes) a. Confirm new finishes will need to painted and floor finishes upgraded
b. Cell walls and doors and adequate
c. Additional showers will be required per ACA standards
d. Dayroom may need to be expanded to ACA standards.
Conveying
a. None
Plumbing a. Additional showers will be required for ACA standards.
HVAC a. System is 35 years old and will need replacing.
Fire Protections a. Sprinkler system was just upgraded under separate project and is adequate
Electrical
a. Figure new camera system and cameras
b. Fire Alarm was just upgraded under separate project and is adequate.
Detention Equipment and Furnishings
a. Currently double bunked. New cell furnishings not required.
b. Control Booth requires a new touch screen
c. Dayroom tables may be needed per ACA standards.
Selective Building Demolition
a. Include demo required for exterior enclosure items and new showers
Sitework a. Confirm if yard area is adequate

56 | P a g e
Washington State Department of Corrections 2015 Prison Capacity Report to the Legislature
Assessment 4. MCC-WSR Building 3A
General Information a. Built 1955 b. Double bunked will provide 72 beds.
Structural (Includes Foundations, Basement Construction, Super Structure) a. Seismic retrofit will need to be required
For a cost effective solution, this work should be done with the Cell block 3 work.
Exterior Enclosure a. Full new membrane roof assembly and insulation required
b. Some existing windows are cracked and would need repair.
Interiors (Includes Interior Construction and Finishes)
a. Confirm new finishes required in painting and existing floor finishes.
b. Double sized cells (currently medical cells) will remain.
c. Current showers would need to be added to for ACA standards
d. Dayroom needs to be expanded to ACA standards.
e. Doors are functional but need some upgrades
Conveying a. None
Plumbing a. Current showers would need to be added to for ACA standards
HVAC a. System is required to be upgraded for Energy Code
Fire Protections a. Sprinkler system will be up to code
Electrical a. Requires new camera system and cameras
b. Lighting is adequate however would need to be upgraded to ACA standards
c. Fire Alarm will be need to be upgraded for current code requirements.
Detention Equipment and Furnishings a. Existing cell furnishings can be reused
b. Control Booth requires a new touch screen.
c. Dayroom tables are needed.
Selective Building Demolition a. Demolish required for exterior enclosure items and new showers
Sitework a. Existing yard can be reused with demolition of cages in the yard. For a cost effective solution, this work
should be done with the Cell block 3 work.

57 | P a g e
Washington State Department of Corrections 2015 Prison Capacity Report to the Legislature
Assessment 5. MCC-WSR Cellhouse 3
General Information a. Built 1955 b. Double bunked will achieve 80 beds.
Structural (Includes Foundations, Basement Construction, Super Structure) a. Seismic retrofit will need to be required
For a cost effective solution, this work should be done with the Cell block 3A work.
Exterior Enclosure
a. Full new membrane roof assembly and insulation required
b. Some existing windows are cracked and would need repair.
Interiors (Includes Interior Construction and Finishes) a. Confirm new finishes required in painting and existing floor finishes.
b. Double sized cells will remain.
c. Current showers would need to be added to for ACA standards
d. Dayroom needs to be expanded to ACA standards.
e. Doors are functional but need some upgrades
Conveying a. None
Plumbing a. Current showers would need to be added to for ACA standards
HVAC a. System is required to be upgraded for Energy Code
Fire Protections
a. Sprinkler system will be up to code
Electrical a. Requires new camera system and cameras
b. Lighting is adequate however would need to be upgraded to ACA standards
c. Fire Alarm will be need to be upgraded for current code requirements.
Detention Equipment and Furnishings a. Existing cell furnishings can be reused
b. Control Booth requires a new touch screen.
c. Dayroom tables are needed.
Selective Building Demolition
a. Demolish required for exterior enclosure items and new showers
Sitework a. Existing yard can be reused with demolition of cages in the yard. For a cost effective solution, this work
should be done with the Cell block 3A work

58 | P a g e
Washington State Department of Corrections 2015 Prison Capacity Report to the Legislature
Assessment 6. SCCC-IMU F Unit
General Information a. Built in 2000 b. Double bunked for 72 beds
Structural (Includes Foundations, Basement Construction, Super Structure) a. Seismic retrofit may not need be required
Exterior Enclosure
a. Roof is adequate
Interiors (Includes Interior Construction and Finishes) a. Finishes will need to painted and floor finishes upgraded
b. Cell walls and doors and adequate
c. Additional showers will be required per ACA standards
d. Dayroom may need to be expanded to ACA standards.
e. New offices for CUS and shift sergeant will need to be added as a building addition. f. New sallyport needed for access to the Unit from campus
Conveying a. None
Plumbing a. Additional showers will be required for ACA standards.
HVAC a. System is recently upgraded
Fire Protections a. Sprinkler system is adequate
Electrical a. New cameras required for remodeled area
b. Fire Alarm is adequate
Detention Equipment and Furnishings a. New cell furnishings required for double bunking
b. Control Booth requires no upgrades
c. Dayroom tables may be needed per ACA standards.
Selective Building Demolition a. Include demo required for exterior enclosure items and new showers. The current exercise areas would be
demolished to allow the program or shower spaces to b added. b. Exterior door and sallyport to the campus would require exterior and interior demolition.
Sitework a. Yard area is adequate b. Drift fences will be added for west and south of the building exterior. c. New sidewalk will need to be added to campus pathways

59 | P a g e
Washington State Department of Corrections 2015 Prison Capacity Report to the Legislature
Assessment 7. WSP-Old Main Unit 1
General Information a. Built b. Double Bunk for 110 beds c. Programing and feeding space is adequate
Structural (Includes Foundations, Basement Construction, Super Structure) a. Seismic retrofit will be included as a separate line item
i. Building is unreinforced masonry construction
Exterior Enclosure a. Roof must be replaced. Full new membrane roof assembly.
b. Windows and daylighting added for daylighting.
Interiors (Includes Interior Construction and Finishes)
a. Interior finish will be needed painted and floor finishes upgraded.
b. Assume all cell walls and doors are adequate
c. Additional showers may be required for ACA standards.
d. Dayroom may need to be expanded to ACA standards.
Conveying
a. None
Plumbing a. More showers will be required for ACA standards
b. Plumbing fixtures are adequate
c. Plumbing piping will need replacement (excess metal was detected in discharge)
HVAC
a. New HVAC system required.
Fire Protections a. New Sprinkler system required
Electrical a. New fire alarm required.
b. New camera system and cameras required
c. Lighting may need upgrading to meet ACA standards.
Detention Equipment and Furnishings a. New cell furnishings not required
b. Control Booth requires a new touch screen.
c. Dayroom tables may be needed per ACA standards
Selective Building Demolition

60 | P a g e
Washington State Department of Corrections 2015 Prison Capacity Report to the Legislature
a. Include demo required for
i. exterior enclosure items
ii. new showers
iii. HVAC system
Sitework
a. Yard area is adequate
b. Perimeter site walls are adequate.
c. Four Watch Towers will need to be upgraded.

61 | P a g e
Washington State Department of Corrections 2015 Prison Capacity Report to the Legislature
Assessment 8. WSP-Old Main Unit 4 General Information
a. Built 1959 b. Double Bunk for 100 beds c. Programing and feeding space is adequate
Structural (Includes Foundations, Basement Construction, Super Structure) a. Seismic retrofit will be included as a separate line item
i. Building is unreinforced masonry construction
Exterior Enclosure
a. Roof must be replaced. Full new membrane roof assembly.
b. Windows and skylights added for daylighting.
Interiors (Includes Interior Construction and Finishes)
a. Interior finish will be needed painted and floor finishes upgraded.
b. Assume all cell walls and doors are adequate
c. Additional showers may be required for ACA standards.
d. Dayroom may need to be expanded to ACA standards.
Conveying
a. None
Plumbing
a. More showers will be required for ACA standards
b. Plumbing fixtures are adequate
c. Plumbing piping will need replacement (excess metal was detected in discharge)
HVAC
a. New HVAC system required.
Fire Protections a. New Sprinkler system required
Electrical a. New fire alarm required.
b. New camera system and cameras required
c. Lighting may need upgrading to meet ACA standards.
Detention Equipment and Furnishings
a. New cell furnishings not required
b. Control Booth requires a new touch screen.
c. Dayroom tables may be needed per ACA standards
Selective Building Demolition

62 | P a g e
Washington State Department of Corrections 2015 Prison Capacity Report to the Legislature
a. Include demo required for
i. exterior enclosure items ii. new showers iii. HVAC system
Sitework
d. Yard area is adequate
e. Perimeter site walls are adequate.
f. Four Watch Towers will need to be upgraded.

63 | P a g e
Washington State Department of Corrections 2015 Prison Capacity Report to the Legislature
Assessment 9. WSP-Old Main Unit 7
General Information a. Built 1933
b. Double bunked for 120 beds
c. Program and feeding spaces are adequate
Structural (Includes Foundations, Basement Construction, Super Structure)
a. Seismic retrofit will be included as a separate line item i. Building is unreinforced masonry construction
Exterior Enclosure
a. Roof must be replaced. Full new membrane roof assembly.
b. Windows and skylights for additional daylighting.
Interiors (Includes Interior Construction and Finishes)
a. Interior finish will be needed painted and floor finishes upgraded.
b. Assume all cell walls and doors are adequate
c. Additional showers may be required for ACA standards.
d. Dayroom may need to be expanded to ACA standards.
Conveying
a. None
Plumbing a. More showers will be required for ACA standards
b. Plumbing fixtures are adequate
c. Plumbing piping will need replacement (excess metal was detected in discharge)
HVAC
a. New HVAC system required.
Fire Protections
a. New Sprinkler system required
Electrical
a. New fire alarm required.
b. New camera system and cameras required
c. Lighting may need upgrading to meet ACA standards.
Detention Equipment and Furnishings a. New cell furnishings not required

64 | P a g e
Washington State Department of Corrections 2015 Prison Capacity Report to the Legislature
b. Control Booth requires a new touch screen.
c. Dayroom tables may be needed per ACA standards
Selective Building Demolition
a. Include demo required for
i. exterior enclosure items
ii. new showers
iii. HVAC system
Sitework a. Yard area is adequate
b. Perimeter site walls are adequate.
c. Four Watch Towers will need to be upgraded.

65 | P a g e
Washington State Department of Corrections 2015 Prison Capacity Report to the Legislature
Assessment 10. WSP-Old MSU
General Information a. Built 1929 b. Double bunked sleeping rooms and dorms for 189 inmate. c. Programing and feeding space need to upgraded or expanded
Structural (Includes Foundations, Basement Construction, Super Structure) a. Seismic retrofit will be needed
Exterior Enclosure a. Roof must be repaired with historic tile
Interiors (Includes Interior Construction and Finishes)
a. Wall finishes will need to be repainted and floor finishes upgraded
Conveying a. Food service lift will be required
Plumbing
a. Plumbing piping and fixtures will need be replaced
HVAC
a. New HVAC system required
Fire Protections
a. New Sprinkler system required
Electrical
a. New fire alarm required.
b. New camera system and cameras required
c. Lighting will need to be upgraded for ACA standards
Detention Equipment and Furnishings a. New controls and associated equipment
Selective Building Demolition a. Demolition required for items listed above
Sitework a. Outdoor area appears adequate

66 | P a g e
Washington State Department of Corrections 2015 Prison Capacity Report to the Legislature
Appendix D – Definitions for Capital Costs
Maximum Allowable Construction Cost (MACC) Refers to the cost of completing the construction work for the proposed scope of work. Generally this would be the bid amount that we would receive from the contractors to do the work.
Soft Costs Soft costs are generally those project costs that are not directly related to the cost of labor and materials for construction of the project, and include such items (but not limited to):
o Design services o Permitting o Environmental review and permitting o Contingencies o Washington State Sales Tax o Mitigation fees o Equipment not included in the construction contract o Furniture not included in the construction contract o Artwork o Owner project management o Security escorts
Taxes Taxes are included in the soft costs. Washington State Sales Tax applicable to the area where the construction will take place.
American Correctional Association (ACA) Upgrades The DOC designs and constructs their facilities to be in compliance with ACA Standards. Older DOC facilities may not be in compliance with current ACA Standards and would not be eligible to be certified by ACA. The cost of making improvements in compliance with ACA would be included within the MACC.

67 | P a g e
Washington State Department of Corrections 2015 Prison Capacity Report to the Legislature
Appendix E – Explanation of Operating Costs (FY2015 and Revised Estimated)
FY2015 facility operating cost per offender per day is the cost to operate the facility based on existing
capacity. [Facility operating cost per offender per day = (annual cost / (capacity)) /365 days per year)].
For example, the cost to operate SCCC (the entire facility) in FY2015 was $72.31 per offender per day.
Revised estimated facility operating cost per offender per day is the cost to operate the facility based on
revised capacity. Revised capacity was calculated by adding proposed new capacity to existing FY2015
capacity. [Revised facility cost per offender per day = (Revised annual cost/ (Revised capacity)) /365
days per year)]. For example, the cost to operate SCCC by adding capacity in SCCC-IMU F Unit results in
a revised estimated facility operating cost of $72.57 per offender per day. See Table 12 on the next
page.

68 | P a g e
Washington State Department of Corrections 2015 Prison Capacity Report to the Legislature
Table 12. Comparison of Operating Costs (FY2015 and Revised Estimated)
Facility Unit Description
FY2015 Facility
Operating Cost
per Offender per
Day
Revised Estimated
Facility Operating
Cost per Offender
per Day
AHCC MSU Convert existing minimum
unit to medium security $73.65 $83.35
CCCC Not Applicable Convert existing minimum
unit to medium security $66.63 $95.89
SCCC* IMU F Unit Convert empty unit to
medium security $72.31 $72.57
MCC E Building Convert empty unit to
medium security $124.74 $124.51
MCC Building 3A Convert empty unit to
medium security $124.74 $122.88
MCC Cellhouse 3 Convert empty unit to
medium security $124.74 $123.04
WSP Unit 1** Convert empty unit to
medium security $109.42 $115.98
WSP Unit 4** Convert empty unit to
medium security $109.42 $116.11
WSP Unit 7** Convert empty unit to
medium security $109.42 $111.67
WSP Old Main Convert existing minimum
complex to medium security $109.42 $116.92
WSP Old MSU Re-open empty minimum
unit at minimum security $109.42 $106.32
AVWR Unit 2A Add work release beds $71.18 $63.34
AVWR Unit 9A Add work release beds $71.18 $67.15
Bellingham WR New Unit Add work release beds $71.18 $78.33
*Cost per offender per day excludes sewer bond payments for SCCC.
**Costs for the empty housing Units 1, 4, and 7 assume that in order to open them as medium security, the existing designated 815 minimum security capacity
at WSP-Old Main must also be converted to medium security. The cost to convert the existing capacity is incorporated in each scenario.

69 | P a g e
Washington State Department of Corrections 2015 Prison Capacity Report to the Legislature
Appendix F – Interior Photos of Cellhouse 3
Photo 12. Hallway in Cellhouse 3
Photo 13. Control Booth for Cellhouse 3

70 | P a g e
Washington State Department of Corrections 2015 Prison Capacity Report to the Legislature
Appendix G – ASCA Survey Custody Designation Definitions
Close Custody: the highest general population custody level that participates in congregate
activities e.g., dining, program, recreation, etc. This custody level offender reside in high
security designed facilities and has the highest general population ration of security staff to
offender
Medium Custody: these inmates reside in secure facilities e.g., double fenced perimeter and
have lighter construction and lower security staffing ratios than close custody
Minimum Custody: this group of offenders can be permitted to work on community crews at a
ratio of 1 staff to 10 inmates (work crew supervisors are not armed). Essentially these offenders
reside in facilities with a single fence that does not use perimeter detection system or armed
towers or mobile patrols. This is the lowest custody level for prisoners.

71 | P a g e
Washington State Department of Corrections 2015 Prison Capacity Report to the Legislature
Appendix H – Summary of Sampled States’ Classification Models
State Initial Classification Factors
Reclassification Factors Frequency of Reviews
Policy Drivers
Who Eligible for Minimum
Alabama Severity of Current offense; History of Assault; Disciplinary History; Assigned Maximum custody at release during previous incarceration; Escape, Age; Time Left to Serve
Severity of Current offense; History of Assault; Disciplinary History; Assigned Maximum custody at release during previous incarceration; Escape, Age
Unknown Medium custody: Time left to serve more than 7 years to release. All sex offenders, Life without Parole (LWOP), Inmate with Mental Health Needs. Minimum custody: Property crimes/non-violent offense 7 years to ERD
Non-Violent/Property Offense: 7 years to release; Non-violent/property offense with prior history of violence: 5 years to release; Current Class A felony with no serious injury 4 years to release; Homicide or crime with serious injury 3 years to release; No Sex Offenders at Minimum custody
Colorado Severity of Current offense; History of Assault; Disciplinary History; Assigned Maximum custody at release during previous incarceration; Escape, Age; (Women include Time Left to Serve; Female-Specific LSI-R, Mental Health Issues as well)
Severity of Current offense; History of Assault; Disciplinary History; Assigned Maximum custody at release during previous incarceration; Escape, Age
6/12 months
Minimum-unrestricted (level I facility) must have 36 months to release, no violent offense unless offender served minimum of 6 months at level III or higher first, must be physically and mentally sound; Minimum-restricted must have less than 60 months to release, if serving violent offense, must have served 6 months at level III or higher first, Minimum-restricted is a level II facility and appears to have fencing with razor wire.
3 years or less for minimum custody (level I facility); 5 years or less for minimum restricted (level II facility). Sex offenders must not have been recommended for treatment. Restrictions for offenders with a violent offense. Detainers and escape history has varying levels of criteria for minimum placement.
Connecticut Severity of Current offense, History of Violence, Disciplinary History, Escape, Time Left to Serve, Detainer, Security Threat
Severity of Current Offense, History of Violence, Disciplinary History, Time left to Serve, Detainer, STG affiliation
Every 6 months
LWOP no reduction in custody; Must serve 35% of sentence to transition from level IV to III; Must serve an additional 30% sentence to
Risk Level 2 or Risk Level 3; No sex offenders; No STG offenders; Pre-trial offenders and offenders with less than 18 months to release.

72 | P a g e
Washington State Department of Corrections 2015 Prison Capacity Report to the Legislature
Group (STG) affiliation
transition from level III to level II,
Minnesota Severity of Current offense; History of Assault; Disciplinary History; Assigned Maximum custody at release during previous incarceration; Escape, Age
Severity of Current offense; History of Assault; Disciplinary History; Assigned Maximum custody at release during previous incarceration; Escape, Age
Every 6 months
LWOP no lower than Maximum custody; Life sentence or pending civil commitment no lower than Close; Must be under 10 years to release to be less than close custody; Offenders with detainers, escapes or behavioral concerns no lower than medium custody; Medium custody must have more than 4 years to serve and less than 10.
Must be under 4 years to release for minimum. Foreign born individuals excluded from minimum custody. All violators are held in Minnesota Department of Corrections.
Oklahoma Severity of Current Offense; Serious Offense History past 10 years; Escape History; Prior Felony Convictions; Disciplinary History; Age, (Women include Medical/Mental Health/Chemical Dependency Issues as well)
Severity of Current Offense; Serious Offense History past 10 years; Escape History; Prior Felony Convictions; Disciplinary History; Age, Assigned Program Participation; Adjustment Progression; (Women include Medical/Mental Health/Chemical Dependency Issues as well)
Every 6 months
LWOP no lower than Medium custody; Offenders with an Immigration and Customs Enforcement (ICE) detainer and a violent offense no lower than minimum; Distribution of Controlled Substance; Possession of a Controlled Substance, no lower than Medium;
Multiple layers of minimum in Oklahoma; Male offenders cannot be assigned minimum with more than 4 years to release and dependent on Earned Credit Level; Females can be assigned minimum at 8 years to Earned Release Date (ERD); No violent offenses within this time span. If violent offense not eligible until 2 years to release date. No ICE detainers, No felony detainers, no active Class X behaviors, No Sex Offense requiring registration; No Crimes against Children. No active escape points.
Oregon Severity of Offense; History of Violent Offenses; Disciplinary History; Escape; detainer; Age,
Severity of Offense; History of Violent Offenses; Disciplinary History; Escape; detainer; Age, Gender; Violence Predictor Score; Time Remaining on Sentence
6/12 months
Offender with more than 10 years assigned close custody; LWOP offenders maintained at Close Custody;
4 years or less to release except Sex Offenders; Sex Offenders who complete treatment eligible at 2 years to

73 | P a g e
Washington State Department of Corrections 2015 Prison Capacity Report to the Legislature
Gender; Violence Predictor Score; Time Remaining on Sentence
ERD (no fenceless facility); Oregon houses most violators in their minimum security facilities.
Washington Severity of Offense; History of Violent Offenses; Disciplinary History; Escape; detainer; Age, Time Remaining on Sentence
Current Custody Level; Programming Participation; Disciplinary Behavior; Escape and Detainer
6/12 months
Murder 1st 4 years Close Custody; LWOP 4 years Close Custody and special classification process;
Less than 4 years to release; No ICE Detainer or Felony Detainer; Murder 1st offender must be highly reviewed; Sex Offenders limited to eligibility for placement at minimum 2.

74 | P a g e
Washington State Department of Corrections 2015 Prison Capacity Report to the Legislature
Appendix I – Summary of Jails and Prisons in Washington State (BERK, 2014)
Jail Prison
Mission Public safety and security
Temporary holding of pre-sentence defendants
Short term housing of sentenced inmates
Public safety and security
Reducing recidivism through the use of evidence
based programs and practices
Long term housing of sentenced inmates
Location Found in all sizes of cities/ counties.
Typically located in proximity to courts
Larger facilities that tend to be more self-sufficient
and are often located outside urban areas
Population Inmates sentenced to one year or less
Misdemeanants and felons prior to transfer to
county jail
Defendants awaiting trial
Violators of the terms of community supervision
Other populations specific to a rental customer, i.e.,
federal marshal or Immigration and Customs
Enforcement
Inmates sentenced for more than one year
Length of Stay in Washington
Jails experience high churn rates, but can house
sentenced offenders for up to one year. Average
stay length is very different from the most common
stay length. For example, King County reported an
average of 21 days, a median of 2 days and a mode
of 1 day
Average
Defendants charged with misdemeanors: 9 days
Defendants charged with felonies: 25 days
Prisons experience more stable populations with
sentences ranging from a year and a day to life. In
this environment, the average stay is closer in
length to the typical stay
Average
23.4 months

75 | P a g e
Washington State Department of Corrections 2015 Prison Capacity Report to the Legislature
Jail Prison
Capacity Jail use varies greatly by jurisdiction and is driven by
local variables
Local jails in Washington range from 8 beds to over
2,500 beds, depending on the jurisdiction
City jails are 140 beds or less except for SCORE
which has 802
King County Correctional Facility
Prison use is driven by the State Department of
Corrections
Prisons are designed for scale, ranging in capacity
from 300 beds to over 2,500 beds
Corrections Center for Women
Demand Demand for local jails is driven by state sentencing
guidelines, but also distinctly local variables such as
law enforcement practices, prosecution and court
procedure, and crime rates and patterns
Four jails reported using forecasting models. For
jails, the number and unpredictability of demand
drivers can make forecasts impractical
DOC demand is driven by state sentencing
guidelines, and the aggregate of local practices that
result in sentences longer than one year, which is
more predictable
The state invests considerable resources in
forecasting demand through the state’s Caseload
Forecast Council
DOC invests resources in implementing programs
and strategies to reduce future demand
Staffing Jails do not have uniform staffing standards, but
determine this locally according to their physical
plant, security needs, and labor agreements
Staff ratios are subject to a state staffing model that
recommends number of correctional staff
according to physical plant and custody level, and
labor agreements and demands to bargain
Assessment Some mental health, chemical dependency, and
medical screening
Limited use of assessment to determine risk for
recidivism and criminogenic needs
Comprehensive mental health, chemical
dependency, and medical assessment and treatment
plans
In process of implementing comprehensive risk
and needs assessment and case plan
Mental Health Mental health screening
Limited onsite mental health care
Onsite mental health assessment and treatment
Long term care capability

76 | P a g e
Washington State Department of Corrections 2015 Prison Capacity Report to the Legislature
Jail Prison
Variety of models for provision of mental health
care across jurisdictions
Focused on stabilization, maintenance and outside
referral if needed
Pierce County Jail
State system-wide planning for mental health care
across prisons
Rehabilitative focus
Corrections Center for Women
Medical Support
Medical screening and triage
Limited basic onsite medical care
Variety of models for provision of medical care
across jurisdictions
SCORE
Comprehensive medical assessment and screening
Limited basic onsite medical care (more
comprehensive than jails)
Capability for long-term secure infirmary stays
Statewide coordination of medical care and
medications across prisons
State Penitentiary Walla Walla

77 | P a g e
Washington State Department of Corrections 2015 Prison Capacity Report to the Legislature
Jail Prison
Programs Program availability limited by local budget
constraints, capacity, and population turnover
Though there are exceptions especially in newer
facilities, programs are more likely to be run by
volunteers, less likely to be evidence-based, and less
likely to have dedicated space
Available programs are typically characterized by
higher reliance on and coordination with outside
service providers and agencies
Yakima County Corrections Center
Pierce County Jail
Statewide coordination across prisons and a
relatively stable population enables broader, richer
programs portfolio
Programs are more likely to be professionally-
staffed, evidence-based, occur in dedicated space,
and be uniform across prisons
DOC delivers most programs with internal
professional staff, Correctional Industries, and
external contracts including with Washington State
Board of Community & Technical Colleges
State Penitentiary Walla Walla
Visitation No contact, communication through phone and
glass barriers or video conferencing
Face to face visitation, including extended family
Corrections Center for Women

78 | P a g e
Washington State Department of Corrections 2015 Prison Capacity Report to the Legislature
Jail Prison
SCORE
Recreation Space
Recreation space typically is in-unit with limited
daylight
Access to space is typically only allowed during
limited hours due to mobility restrictions
King County Correctional Facility
Separate, dedicated recreation spaces
Expanded mobility and more flexible access to
recreation space, because of a secure perimeter
Corrections Center for Women
State Penitentiary Walla Walla
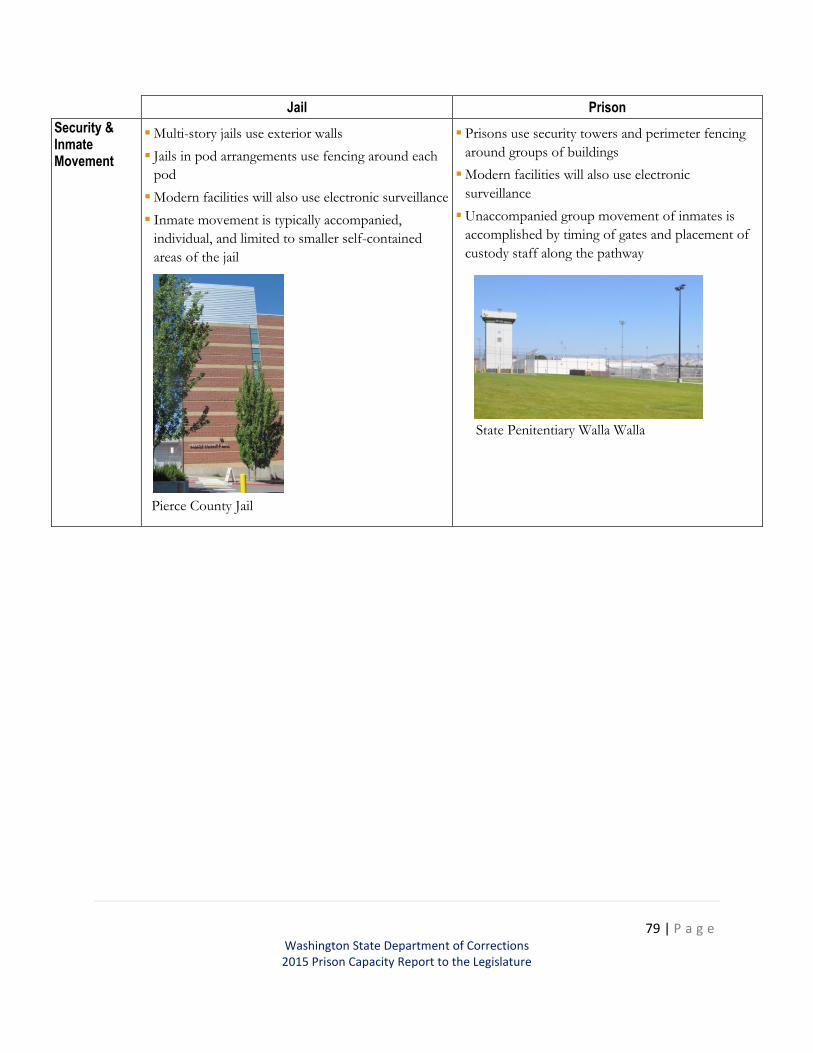
79 | P a g e
Washington State Department of Corrections 2015 Prison Capacity Report to the Legislature
Jail Prison
Security & Inmate Movement
Multi-story jails use exterior walls
Jails in pod arrangements use fencing around each
pod
Modern facilities will also use electronic surveillance
Inmate movement is typically accompanied,
individual, and limited to smaller self-contained
areas of the jail
Pierce County Jail
Prisons use security towers and perimeter fencing
around groups of buildings
Modern facilities will also use electronic
surveillance
Unaccompanied group movement of inmates is
accomplished by timing of gates and placement of
custody staff along the pathway
State Penitentiary Walla Walla