priority micronutrient density in foods
TRANSCRIPT

Priority micronutrient density in foodsTy Beal ( [email protected] )
Global Alliance for Improved Nutrition https://orcid.org/0000-0002-0398-9825Flaminia Ortenzi
Global Alliance for Improved Nutrition
Article
Keywords: nutrient density, micronutrient de�ciencies, animal-source foods, organs, shell�sh, �sh, darkgreen leafy vegetables, ruminant meat, eggs, dairy
Posted Date: November 3rd, 2021
DOI: https://doi.org/10.21203/rs.3.rs-701840/v3
License: This work is licensed under a Creative Commons Attribution 4.0 International License. Read Full License
Version of Record: A version of this preprint was published at Frontiers in Nutrition on March 7th, 2022.See the published version at https://doi.org/10.3389/fnut.2022.806566.
1
Priority micronutrient density in foods
Article type: Article
Authors: Ty Beal, Flaminia Ortenzi
Affiliations:
Knowledge Leadership, Global Alliance for Improved Nutrition (TB, FO); and Department of
Environmental Science and Policy, University of California, Davis (TB)
*Corresponding author:
Ty Beal, Global Alliance for Improved Nutrition (GAIN), Washington, DC, United States; and
Department of Environmental Science and Policy, University of California, Davis, California,
United States
1701 Rhode Island Ave NW, Washington, DC 20036, United States
(602) 481–5211
Sources of support: None
Short running head: Priority micronutrient density in foods
Abbreviations:
ARs: Average requirements
DGLVs: Dark green leafy vegetables
EFSA: European Food Safety Authority
FCTs: Food composition tables
FDC: FoodData Central
HICs: High-income countries
LMICs: Low- and middle-income countries
NCDs: Non-communicable diseases
UPFs: Ultra-processed foods
WRA: Women of reproductive age
Data described in the manuscript, code book, and analytic code will be made available upon
request pending application and approval
2
Abstract 1
Background: Despite concerted efforts to improve diet quality and reduce malnutrition, 2
micronutrient deficiencies remain widespread globally, especially in low- and middle-income 3
countries and among population groups with increased needs, where diets are often inadequate in 4
iron, zinc, folate, vitamin A, calcium, and vitamin B12. There is a need to understand the density 5
of these micronutrients and their bioavailability across diverse foods and the suitability of these 6
foods to help meet requirements for populations with high burdens of micronutrient malnutrition. 7
Objective: We aimed to identify the top food sources of these commonly lacking micronutrients, 8
which are essential for optimal health, to support efforts to reduce micronutrient malnutrition 9
among various populations globally. 10
Methods: We built an aggregated global food composition database and calculated 11
recommended nutrient intakes for five population groups with varying requirements. An 12
approach was developed to rate foods according to their density in each and all priority 13
micronutrients for various population groups with different nutrient requirements. 14
Results: We find that the top sources of priority micronutrients are organs, small fish, dark green 15
leafy vegetables, bivalves, crustaceans, goat, beef, eggs, milk, canned fish with bones, lamb, and 16
mutton. Cheese, goat milk, and pork are also good sources, and to a lesser extent, yogurt, fresh 17
fish, pulses, teff, and canned fish without bones. 18
Conclusions: The results provide insight into which foods to prioritize to fill common 19
micronutrient gaps and reduce undernutrition. 20
Keywords: nutrient density, micronutrient deficiencies, animal-source foods, organs, shellfish, 21
fish, dark green leafy vegetables, ruminant meat, eggs, dairy22

3
Introduction 23
Food is integral to everyday life, providing essential energy and nutrients for human function. An 24
important aspect of food, among others, is the vitamins and minerals it provides. Yet in many 25
low- and middle-income countries (LMICs) diets are known to be lacking in micronutrients, 26
especially for population groups with increased needs, leading to deficiencies, particularly in 27
iron, zinc, folate, vitamin A, calcium, and vitamin B12 (hereafter referred to as “priority 28
micronutrients”), that can have severe and lasting effects (1–6). Even in high-income countries 29
(HICs) like the United States, micronutrient deficiencies such as iron deficiency may be 30
common, especially among women (7). Globally, current diets are failing to provide adequate 31
density of these essential micronutrients. 32
There is an urgent need, therefore, to increase the density of priority micronutrients in diets 33
globally. One efficient and cost-effective strategy for reducing micronutrient deficiencies in 34
LMICs is food fortification (8). However, there are more than 70,000 compounds in foods (9) 35
bound together in a food matrix, which synergistically impact metabolism, including nutrient 36
absorption, and may have beneficial effects on satiety and the immune system, offering 37
protection from disease, among other potentially important health implications (10–13). Thus, 38
fortifying staple foods with priority micronutrients is important but does not fully replicate 39
inherently nutrient-dense foods and their health effects. Obtaining adequate micronutrients from 40
minimally processed foods may have additional benefits beyond fortification due to the added 41
value of diverse synergistic nutrients within a food matrix (10–12). Moreover, while there is 42
large variation in the health effects of different foods and dietary patterns, energy-dense ultra-43
processed foods (UPFs) in particular are associated with numerous noncommunicable diseases 44
(NCDs) and mortality and are increasing rapidly in LMICs (14). Energy-dense ultra-processed 45
foods are generally hyper palatable which can lead to overconsumption and weight gain when 46
they are a predominant component of the food environment (15). Improving overall diet quality, 47
especially the quantity and diversity of minimally processed foods inherently dense in priority 48
micronutrients is crucial to reduce micronutrient malnutrition while minimizing the transition to 49
UPFs and potential associated increase in NCDs. 50
Our study aims to identify the top food sources of commonly lacking micronutrients, which are 51
essential for optimal health, to support efforts to reduce micronutrient malnutrition among 52
various populations globally, particularly in low- and middle-income countries. 53
Methods 54
Recommended nutrient intakes. We calculated recommended intakes for adults ≥ 25 years of 55
age and groups vulnerable to malnutrition, including children 2–4 years, adolescents, non-56
pregnant and non-lactating women of reproductive age (WRA), and pregnant women, from the 57
European Food Safety Authority (EFSA) (16) for vitamin A, folate, calcium, and zinc and from 58
the Institute of Medicine (17) for vitamin B12 and iron. This aligns with the recently proposed 59
harmonized nutrient reference values (18), except for iron, because EFSA values are based on 60
the assumption that the population has iron stores, which is not the case for many people in 61
LMICs. We used recommended nutrient intakes rather than average requirements because we are 62
interested in target values for individuals, not in estimating population level adequacy. 63
4
Building a global food composition database. We built a global food composition database 64
(excluding fortified foods), with values for calories, phytate (19), and six priority micronutrients: 65
vitamin A, folate, vitamin B12, calcium, iron, and zinc. Nutrient densities are from USDA 66
FoodData Central (FDC) (20) and national and regional food composition tables (FCTs) from 67
LMICs globally (21): Kenya, Malawi, and Western Africa (Sub-Saharan Africa); Bangladesh, 68
Indonesia, Laos, Vietnam, and ASEAN (South and South-East Asia); Mexico and Colombia 69
(Latin America). 70
Foods were aggregated when showing relatively low nutrient density variance (for example, 71
pulses) or when likely to be targeted as a food group in policy and programming (for example, 72
DGLVs). Global nutrient values for individual foods were obtained by calculating medians of 73
composite values from the selected FCTs. Composite values were obtained by averaging nutrient 74
values for different cooking methods (and/or raw foods) and/or different cuts of a given food for 75
meat. Global nutrient values for aggregated food groups were obtained by averaging composite 76
values at the regional level and from FDC. Composite values for a given region were obtained by 77
calculating the medians of nutrient values for several individual foods within a food group, 78
available in the selected FCTs corresponding to that region. Standard deviations were calculated 79
for all obtained global nutrient values, as a measure of variability across included FCTs. 80
We accounted for iron and zinc bioavailability. For iron, foods were classified into one of three 81
levels of iron absorption (20% for ruminant meat, 15% for all other animal-source foods, and 82
10% for all plant-source foods), based on the proportion of heme to non-heme iron contained (1): 83
68% heme-iron in ruminant meat, including beef (22–24), goat, and lamb/mutton (24,25); 39% 84
heme-iron in pork (23,24,26–28); 26% heme-iron in chicken (23,24,26–28), fish and seafood 85
(23,26–29), and eggs and dairy (27); and 40% heme-iron in all other meat, including offal 86
(22,27,28). Regarding zinc, foods were classified into one of four levels of zinc absorption (44%, 87
35%, 30%, and 26%), based on the amount of phytate contained in each food in a portion 88
equivalent to one-third of daily mass intake, assuming an energy density of 1.3 kcal/g and 89
considering average requirements for energy for a moderately active WRA (16) (see 90
Supplemental Material for details). 91
Priority micronutrient density rating. Foods were classified into one of four levels of 92
micronutrient density based on the calories and grams needed to provide one-third (for individual 93
nutrients) or an average of one-third (for the aggregate score) of recommended intakes of vitamin 94
A, folate, vitamin B12, calcium, iron, and zinc. For the aggregate score, the average share of 95
recommended intakes (ASRI) across the six micronutrients (A), for a given quantity of calories 96
and grams (i), of a given food (j), was calculated as: 97
𝐴𝑆𝑅𝐼%,' =1|𝐴| + min{ 𝑛𝑢𝑡𝑟𝑖𝑒𝑛𝑡_𝑑𝑒𝑛𝑠𝑖𝑡𝑦;,' ∗ 𝑖𝑟𝑒𝑐𝑜𝑚𝑚𝑒𝑛𝑑𝑒𝑑_𝑖𝑛𝑡𝑎𝑘𝑒𝑠; ,;∈C
1} 98
A similar approach was previously used to identify micronutrient-dense complementary foods 99
for young children (4,30). Ratings were calculated for different population groups according to 100
the following thresholds for Average Requirements (ARs) of energy for a moderately active 101
individual and hypothetical ARs for mass, assuming an energy density of 1.3 kcal/g (the mean 102
energy density of a minimally processed plant-based, low-fat diet and animal-based, ketogenic 103
diet (31)): 104
5
• Very high: ≤ one-sixth of ARs for both energy and mass 105
• High: ≤ one-third of ARs for both energy and mass and < one-sixth of ARs for either 106
energy or mass 107
• Moderate: ≤ one-third and > one-sixth of ARs for both energy and mass 108
• Low: > one-third of ARs for either energy or mass 109
Micronutrient density of milk was classified based solely on ARs for energy, since mass is 110
typically not a limiting factor for liquids. The same energy thresholds as for solid foods were 111
used for very high and low micronutrient density. For high micronutrient density, thresholds 112
were ≤ one-fourth and > one-sixth of ARs for energy. For moderate micronutrient density, 113
thresholds were ≤ one-third and > one-fourth of ARs for energy. 114
As indicated in the formula for the aggregate score, each micronutrient’s contribution was 115
capped at 100% of recommended intakes, which means that each micronutrient can contribute 116
nothing or up to one-half of the total score (4,30). To illustrate this, a food containing only two 117
of the six nutrients would provide 100% of recommended intakes of both nutrients, while a food 118
with a perfectly even proportion of recommended intakes across all six nutrients would provide 119
33.3% of recommended intakes of all six nutrients—each micronutrient thus contributing an 120
equal one-sixth of the total score. This approach ensures that for foods to rate high, they need to 121
be high in at least two micronutrients and that foods with very high densities of individual 122
micronutrients are not rated higher for providing amounts well above recommended intakes or 123
above upper limits. 124
Results 125
Recommended nutrient intakes. Recommended nutrient intakes vary by population and, for 126
iron and zinc, bioavailability (Table 1). Among groups with roughly similar ARs for energy, 127
recommended nutrient intakes are generally highest for pregnant women, followed by adults, 128
WRA, and adolescents, but there is variability by nutrient. Notably, recommended folate intake 129
for pregnant women is double than for adults, WRA, and adolescents; recommended iron intake 130
for pregnant women is more than triple than for adults, more than double than for adolescents, 131
and more than 50% higher than for WRA. Recommended intakes for vitamin A, vitamin B12, 132
calcium, and zinc vary less across these groups. 133
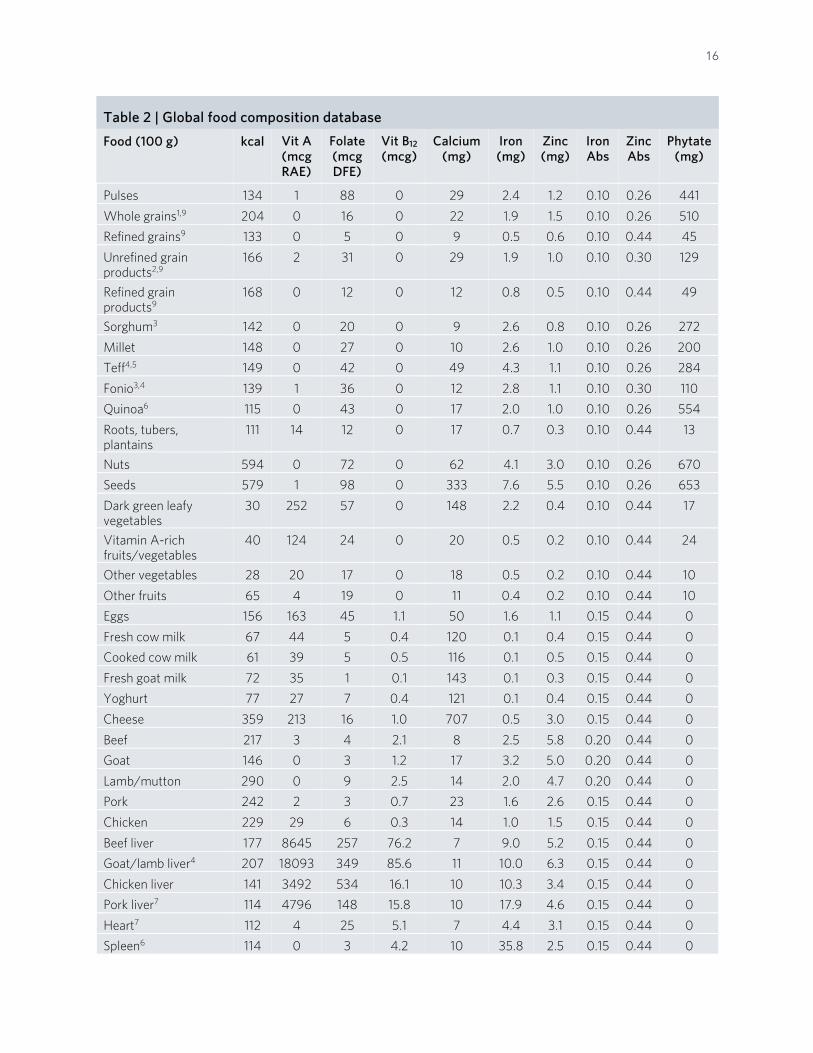
Global food composition database. Table 2 shows the compiled global food composition 134
database of 41 individual and aggregate foods, with values for the six priority micronutrients, 135
energy, phytate, and iron and zinc bioavailability (a version of the global food composition 136
database which includes standard deviations is available in Supplemental Table 1). Interestingly, 137
some food groups showed high nutrient density variance across included foods, such as DGLVs, 138
with spinach, amaranth leaves, and cassava leaves having much higher values than lettuce and 139
cabbage (Supplemental Table 4). Similarly, hard cheese (for example, cheddar and aged goat 140
cheese) and fatty fish (for example, herring and mackerel) were more nutrient-dense than soft 141
cheese (for example, cottage cheese) and lean fish (for example, cod and tilapia), respectively 142
(Supplemental Table 6). Other food groups, such as pulses, presented more equal nutrient density 143
distributions across foods, but there were significant differences across FCTs (Supplemental 144
Tables 2–7). For instance, Sub-Saharan Africa and South/South-East Asia showed much lower 145
values for folate in pulses than Latin America and FDC, which may be due to different varieties, 146
culinary traditions, and cooking methods and times. 147
6
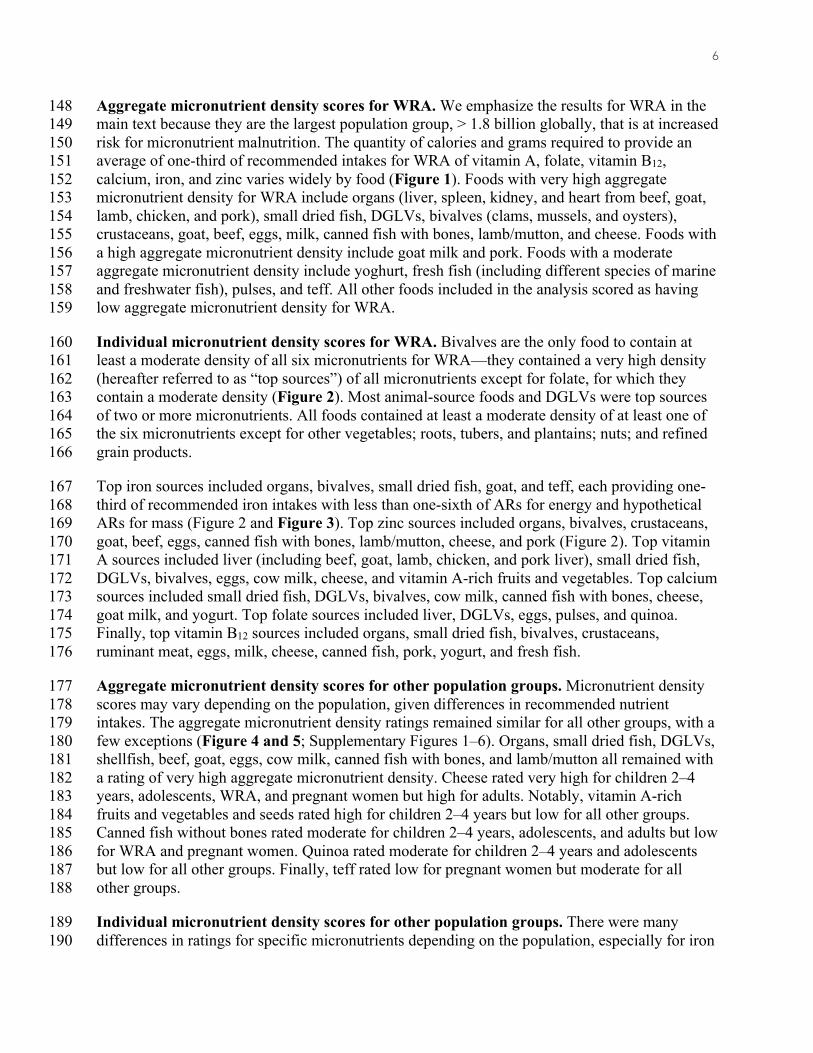
Aggregate micronutrient density scores for WRA. We emphasize the results for WRA in the 148
main text because they are the largest population group, > 1.8 billion globally, that is at increased 149
risk for micronutrient malnutrition. The quantity of calories and grams required to provide an 150
average of one-third of recommended intakes for WRA of vitamin A, folate, vitamin B12, 151
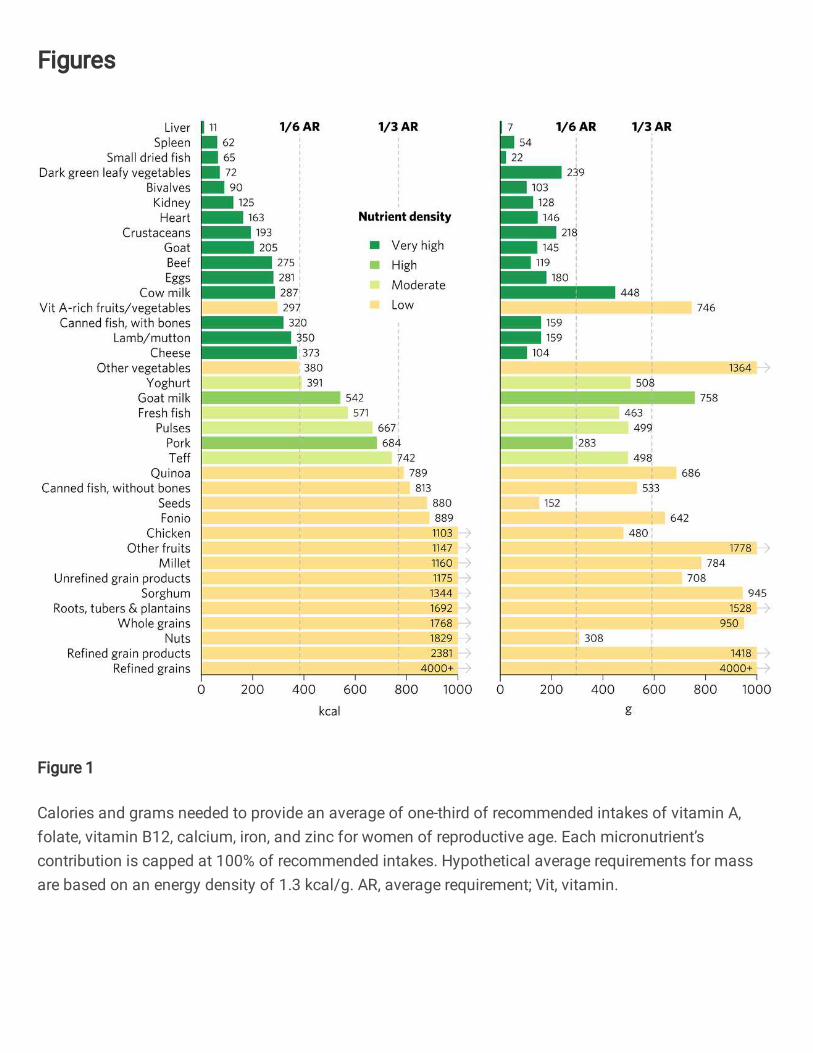
calcium, iron, and zinc varies widely by food (Figure 1). Foods with very high aggregate 152
micronutrient density for WRA include organs (liver, spleen, kidney, and heart from beef, goat, 153
lamb, chicken, and pork), small dried fish, DGLVs, bivalves (clams, mussels, and oysters), 154
crustaceans, goat, beef, eggs, milk, canned fish with bones, lamb/mutton, and cheese. Foods with 155
a high aggregate micronutrient density include goat milk and pork. Foods with a moderate 156
aggregate micronutrient density include yoghurt, fresh fish (including different species of marine 157
and freshwater fish), pulses, and teff. All other foods included in the analysis scored as having 158
low aggregate micronutrient density for WRA. 159
Individual micronutrient density scores for WRA. Bivalves are the only food to contain at 160
least a moderate density of all six micronutrients for WRA—they contained a very high density 161
(hereafter referred to as “top sources”) of all micronutrients except for folate, for which they 162
contain a moderate density (Figure 2). Most animal-source foods and DGLVs were top sources 163
of two or more micronutrients. All foods contained at least a moderate density of at least one of 164
the six micronutrients except for other vegetables; roots, tubers, and plantains; nuts; and refined 165
grain products. 166
Top iron sources included organs, bivalves, small dried fish, goat, and teff, each providing one-167
third of recommended iron intakes with less than one-sixth of ARs for energy and hypothetical 168
ARs for mass (Figure 2 and Figure 3). Top zinc sources included organs, bivalves, crustaceans, 169
goat, beef, eggs, canned fish with bones, lamb/mutton, cheese, and pork (Figure 2). Top vitamin 170
A sources included liver (including beef, goat, lamb, chicken, and pork liver), small dried fish, 171
DGLVs, bivalves, eggs, cow milk, cheese, and vitamin A-rich fruits and vegetables. Top calcium 172
sources included small dried fish, DGLVs, bivalves, cow milk, canned fish with bones, cheese, 173
goat milk, and yogurt. Top folate sources included liver, DGLVs, eggs, pulses, and quinoa. 174
Finally, top vitamin B12 sources included organs, small dried fish, bivalves, crustaceans, 175
ruminant meat, eggs, milk, cheese, canned fish, pork, yogurt, and fresh fish. 176
Aggregate micronutrient density scores for other population groups. Micronutrient density 177
scores may vary depending on the population, given differences in recommended nutrient 178
intakes. The aggregate micronutrient density ratings remained similar for all other groups, with a 179
few exceptions (Figure 4 and 5; Supplementary Figures 1–6). Organs, small dried fish, DGLVs, 180
shellfish, beef, goat, eggs, cow milk, canned fish with bones, and lamb/mutton all remained with 181
a rating of very high aggregate micronutrient density. Cheese rated very high for children 2–4 182
years, adolescents, WRA, and pregnant women but high for adults. Notably, vitamin A-rich 183
fruits and vegetables and seeds rated high for children 2–4 years but low for all other groups. 184
Canned fish without bones rated moderate for children 2–4 years, adolescents, and adults but low 185
for WRA and pregnant women. Quinoa rated moderate for children 2–4 years and adolescents 186
but low for all other groups. Finally, teff rated low for pregnant women but moderate for all 187
other groups. 188
Individual micronutrient density scores for other population groups. There were many 189
differences in ratings for specific micronutrients depending on the population, especially for iron 190

7
and folate (Figure 5 and Figure 6; Supplementary Figures 4–6). Organs, bivalves, small dried 191
fish, and goat were the only foods that rated as top iron sources for all population groups. For 192
iron, DGLVs rated low for pregnant women but high for all other groups, while crustaceans rated 193
low for pregnant women, moderate for children 2–4 years and WRA, and high for adolescents 194
and adults. Beef was a top source of iron for children 2–4 years, adolescents, and adults but rated 195
high for WRA and pregnant women. For adults, teff, fonio, sorghum, pulses, and millet were all 196
top iron sources, whereas they all rated low for pregnant women, except for teff and fonio, which 197
rated moderate. Further, quinoa, canned fish with bones, eggs, seeds, and pork also rated high for 198
iron for adults, while they rated moderate (quinoa, canned fish with bones, and eggs) or low 199
(seeds and pork) for WRA and low for pregnant women. In addition, several food groups 200
presented moderate iron density for adults, including fresh fish, canned fish without bones, 201
whole grains, and unrefined grain products, whereas they all rated low for both WRA and 202
pregnant women. Finally, for pregnant women, the only top folate sources were liver and pulses, 203
whereas for adults and WRA top sources also included DGLVs and quinoa, with the addition of 204
eggs for WRA and kidney (including beef, lamb, and pork kidney), fonio, and teff for children 205
2–4 years and adolescents. 206
Discussion 207
Our analysis has provided ratings of inherent food sources of multiple and individual 208
micronutrients commonly lacking in diets, especially in LMICs, for population groups with 209
increased needs and the broader adult population. In general, animal-source foods like organs, 210
shellfish, small fish, ruminant meat, eggs, milk, and canned fish with bones are top sources of 211
multiple priority micronutrients. Cheese, goat milk, and pork are also good sources, followed by 212
yogurt and fresh fish. Among plant-source foods, DGLVs are a top source of priority 213
micronutrients, and pulses and teff, a traditional grain, are also decent sources. Interestingly, 214
many foods commonly promoted as nutrient-dense, including most fruits and vegetables, canned 215
fish without bones, nuts and seeds, chicken, and whole grains, are not particularly dense in 216
micronutrients commonly lacking in LMICs. These foods, of course, provide important 217
nutritional benefits beyond these specific nutrients. Indeed, priority micronutrients are just one of 218
many important aspects contributing to overall diet quality, and foods presenting low density in 219
priority micronutrients may be rich in other essential and non-essential beneficial compounds 220
and can contribute to overall energy and protein requirements. 221
These findings have implications for vegetarian populations, since animal flesh foods are dense 222
in priority micronutrients. In addition to DGLVs, both eggs and dairy foods are excellent sources 223
of priority micronutrients for lacto-ovo vegetarians. Fortunately, eggs and dairy foods are among 224
the more affordable animal-source foods per unit priority nutrient density, although not as 225
affordable as organs and small fish, and they are still often inaccessible or unaffordable for 226
people with limited resources (30,32). Importantly, DGLVs and pulses are accessible and 227
affordable sources of several priority micronutrients in most populations (30,32). Further, 228
traditional grains, including teff, quinoa, fonio, and millet, are at least moderately dense in iron, 229
zinc, and folate and can also make significant contributions to nutrient adequacy. Lacto-ovo 230
vegetarian diets rich in eggs, dairy, DGLVs, pulses, and traditional grains can provide adequate 231
amounts of all six priority micronutrients. Carefully constructed vegan diets could provide 232
adequate amounts of all six priority micronutrients for the general population, except vitamin 233
B12, which would need to be consumed through fortified foods or supplements. However, 234
population groups with increased nutritional requirements, such as pregnant women and children 235
8
during the complementary feeding period, following a vegan diet might also need fortification or 236
supplementation for other micronutrients, such as iron, in addition to vitamin B12. 237
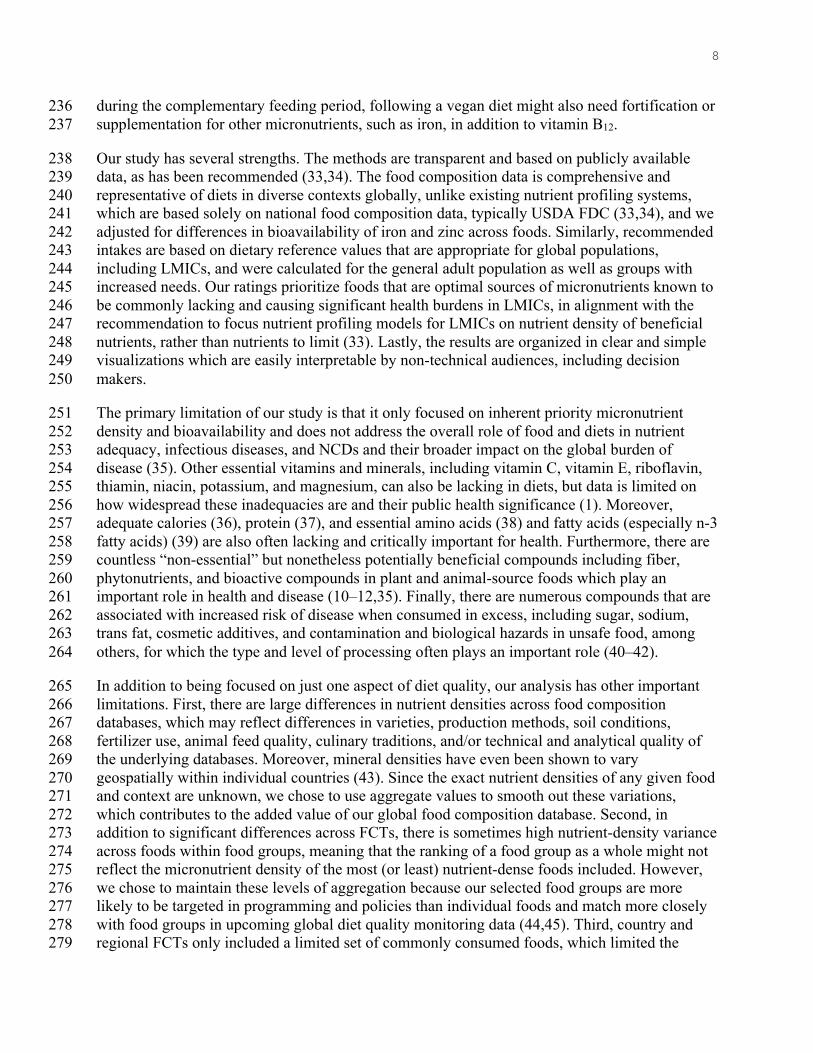
Our study has several strengths. The methods are transparent and based on publicly available 238
data, as has been recommended (33,34). The food composition data is comprehensive and 239
representative of diets in diverse contexts globally, unlike existing nutrient profiling systems, 240
which are based solely on national food composition data, typically USDA FDC (33,34), and we 241
adjusted for differences in bioavailability of iron and zinc across foods. Similarly, recommended 242
intakes are based on dietary reference values that are appropriate for global populations, 243
including LMICs, and were calculated for the general adult population as well as groups with 244
increased needs. Our ratings prioritize foods that are optimal sources of micronutrients known to 245
be commonly lacking and causing significant health burdens in LMICs, in alignment with the 246
recommendation to focus nutrient profiling models for LMICs on nutrient density of beneficial 247
nutrients, rather than nutrients to limit (33). Lastly, the results are organized in clear and simple 248
visualizations which are easily interpretable by non-technical audiences, including decision 249
makers. 250
The primary limitation of our study is that it only focused on inherent priority micronutrient 251
density and bioavailability and does not address the overall role of food and diets in nutrient 252
adequacy, infectious diseases, and NCDs and their broader impact on the global burden of 253
disease (35). Other essential vitamins and minerals, including vitamin C, vitamin E, riboflavin, 254
thiamin, niacin, potassium, and magnesium, can also be lacking in diets, but data is limited on 255
how widespread these inadequacies are and their public health significance (1). Moreover, 256
adequate calories (36), protein (37), and essential amino acids (38) and fatty acids (especially n-3 257
fatty acids) (39) are also often lacking and critically important for health. Furthermore, there are 258
countless “non-essential” but nonetheless potentially beneficial compounds including fiber, 259
phytonutrients, and bioactive compounds in plant and animal-source foods which play an 260
important role in health and disease (10–12,35). Finally, there are numerous compounds that are 261
associated with increased risk of disease when consumed in excess, including sugar, sodium, 262
trans fat, cosmetic additives, and contamination and biological hazards in unsafe food, among 263
others, for which the type and level of processing often plays an important role (40–42). 264
In addition to being focused on just one aspect of diet quality, our analysis has other important 265
limitations. First, there are large differences in nutrient densities across food composition 266
databases, which may reflect differences in varieties, production methods, soil conditions, 267
fertilizer use, animal feed quality, culinary traditions, and/or technical and analytical quality of 268
the underlying databases. Moreover, mineral densities have even been shown to vary 269
geospatially within individual countries (43). Since the exact nutrient densities of any given food 270
and context are unknown, we chose to use aggregate values to smooth out these variations, 271
which contributes to the added value of our global food composition database. Second, in 272
addition to significant differences across FCTs, there is sometimes high nutrient-density variance 273
across foods within food groups, meaning that the ranking of a food group as a whole might not 274
reflect the micronutrient density of the most (or least) nutrient-dense foods included. However, 275
we chose to maintain these levels of aggregation because our selected food groups are more 276
likely to be targeted in programming and policies than individual foods and match more closely 277
with food groups in upcoming global diet quality monitoring data (44,45). Third, country and 278
regional FCTs only included a limited set of commonly consumed foods, which limited the 279

9
breadth of foods included in our aggregated food composition database. For instance, we were 280
unable to analyze many nutrient-dense wild or indigenous vegetables, nuts, seeds, pulses, and 281
insects. Fourth, while we adjusted for bioavailability of iron and zinc, actual bioavailability 282
depends on the genetics and micronutrient status of the individual and their overall diet, 283
including a broad set of enhancers and inhibitors. Finally, ratings are sensitive to categorical 284
thresholds for quantities of calories and grams, which requires some attention when interpreting 285
results, since foods near the thresholds could have been rated differently with only small changes 286
in nutrient densities. Some of the differences in ratings across population groups could thus be 287
due to small differences in nutrient densities for foods near thresholds. 288
These ratings are most applicable for populations in LMICs suffering from widespread 289
micronutrient deficiencies. However, for population groups with increased needs in HICs, such 290
as women, who may often be deficient in micronutrients such as iron, these results can also help 291
identify relevant foods to prioritize. Importantly, diets should consist of a variety of foods with 292
varying nutrient densities. Even adding just small amounts of particularly nutrient dense animal-293
source foods (for example, organs and bivalves) to largely plant-based diets would go a long way 294
towards ensuring adequacy of micronutrients commonly lacking. Future analyses should focus 295
on understanding how to use these findings to improve food, agriculture, and nutrition policies 296
and programs, which tend to focus on specific foods or food groups. Researchers could build on 297
this work by incorporating additional foods and food groups, including wild or indigenous 298
vegetables, nuts, seeds, pulses, and insects (46), many of which contain very high nutrient 299
densities (47). Moreover, these ratings could be paired with broader diet quality metrics (45) and 300
included as an additional way to assess food affordability, for example, by expanding on existing 301
approaches (30,32), as has been done for other nutrient profiling systems (48). Finally, these 302
ratings could also be used for environmental impact assessments. While plant-source foods 303
generally have lower negative environmental impacts than animal-source foods per unit protein, 304
energy, or mass (49), this generalization may not hold when considering the higher nutrient 305
density of many animal-source foods. For example, bivalves are dense in all six priority 306
micronutrients and capable of being produced sustainably (50).307

10
Acknowledgements We thank Lynnette M. Neufeld, Saul S. Morris, Stella Nordhagen, Gina L. Kennedy, and
Christina Nyhus Dhillon for their feedback on draft versions of this manuscript.
Author contributions TB and FO designed the study, conducted the analyses, and wrote the paper.
Competing Interests statement The authors declare no competing interests.
11
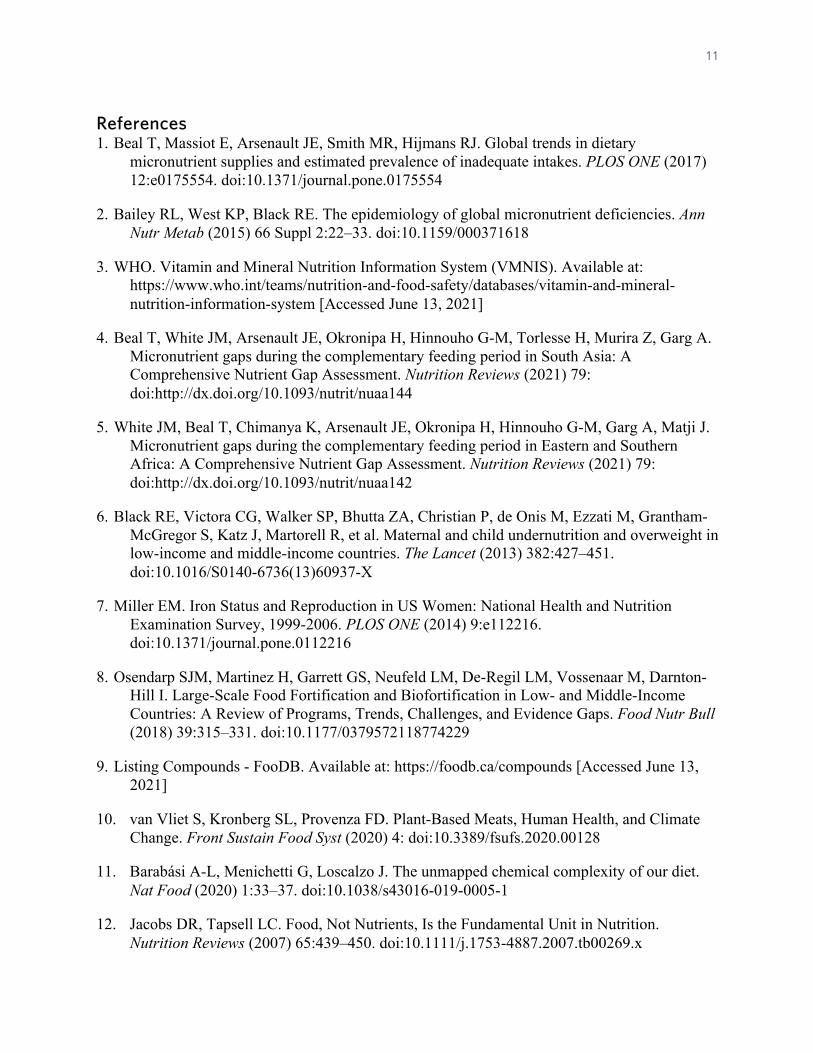
References 1. Beal T, Massiot E, Arsenault JE, Smith MR, Hijmans RJ. Global trends in dietary
micronutrient supplies and estimated prevalence of inadequate intakes. PLOS ONE (2017)
12:e0175554. doi:10.1371/journal.pone.0175554
2. Bailey RL, West KP, Black RE. The epidemiology of global micronutrient deficiencies. Ann
Nutr Metab (2015) 66 Suppl 2:22–33. doi:10.1159/000371618
3. WHO. Vitamin and Mineral Nutrition Information System (VMNIS). Available at:
https://www.who.int/teams/nutrition-and-food-safety/databases/vitamin-and-mineral-
nutrition-information-system [Accessed June 13, 2021]
4. Beal T, White JM, Arsenault JE, Okronipa H, Hinnouho G-M, Torlesse H, Murira Z, Garg A.
Micronutrient gaps during the complementary feeding period in South Asia: A
Comprehensive Nutrient Gap Assessment. Nutrition Reviews (2021) 79:
doi:http://dx.doi.org/10.1093/nutrit/nuaa144
5. White JM, Beal T, Chimanya K, Arsenault JE, Okronipa H, Hinnouho G-M, Garg A, Matji J.
Micronutrient gaps during the complementary feeding period in Eastern and Southern
Africa: A Comprehensive Nutrient Gap Assessment. Nutrition Reviews (2021) 79:
doi:http://dx.doi.org/10.1093/nutrit/nuaa142
6. Black RE, Victora CG, Walker SP, Bhutta ZA, Christian P, de Onis M, Ezzati M, Grantham-
McGregor S, Katz J, Martorell R, et al. Maternal and child undernutrition and overweight in
low-income and middle-income countries. The Lancet (2013) 382:427–451.
doi:10.1016/S0140-6736(13)60937-X
7. Miller EM. Iron Status and Reproduction in US Women: National Health and Nutrition
Examination Survey, 1999-2006. PLOS ONE (2014) 9:e112216.
doi:10.1371/journal.pone.0112216
8. Osendarp SJM, Martinez H, Garrett GS, Neufeld LM, De-Regil LM, Vossenaar M, Darnton-
Hill I. Large-Scale Food Fortification and Biofortification in Low- and Middle-Income
Countries: A Review of Programs, Trends, Challenges, and Evidence Gaps. Food Nutr Bull
(2018) 39:315–331. doi:10.1177/0379572118774229
9. Listing Compounds - FooDB. Available at: https://foodb.ca/compounds [Accessed June 13,
2021]
10. van Vliet S, Kronberg SL, Provenza FD. Plant-Based Meats, Human Health, and Climate
Change. Front Sustain Food Syst (2020) 4: doi:10.3389/fsufs.2020.00128
11. Barabási A-L, Menichetti G, Loscalzo J. The unmapped chemical complexity of our diet.
Nat Food (2020) 1:33–37. doi:10.1038/s43016-019-0005-1
12. Jacobs DR, Tapsell LC. Food, Not Nutrients, Is the Fundamental Unit in Nutrition.
Nutrition Reviews (2007) 65:439–450. doi:10.1111/j.1753-4887.2007.tb00269.x
12
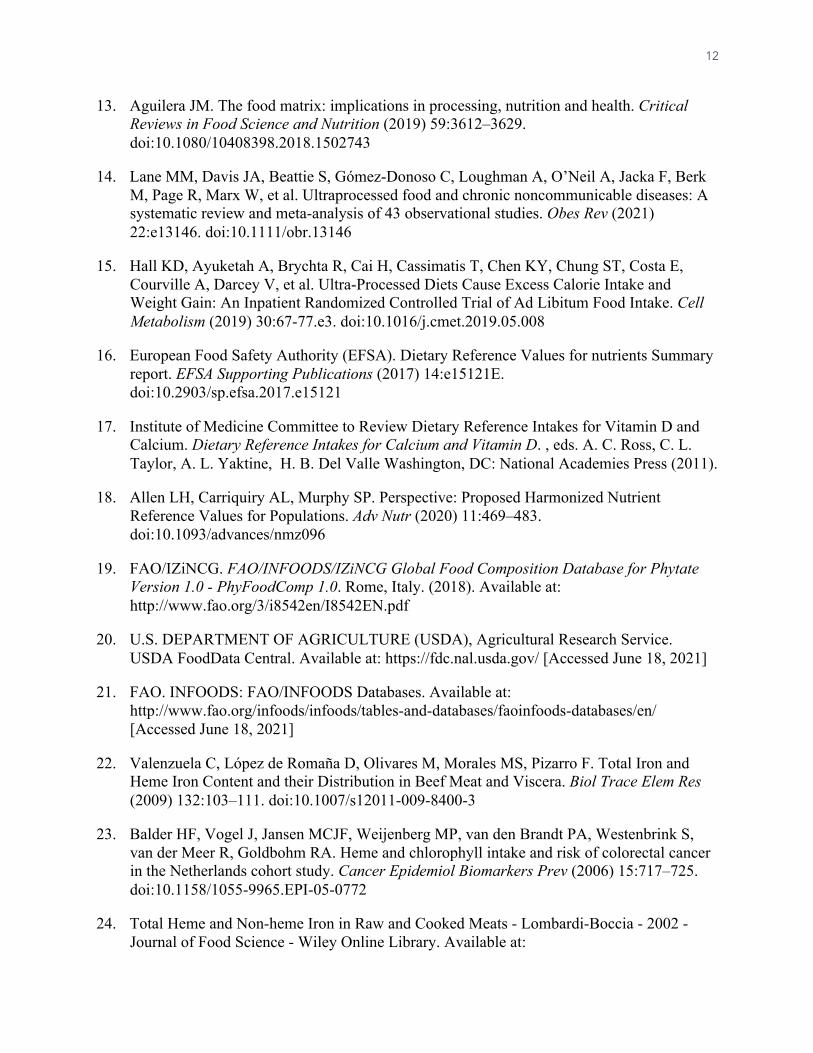
13. Aguilera JM. The food matrix: implications in processing, nutrition and health. Critical
Reviews in Food Science and Nutrition (2019) 59:3612–3629.
doi:10.1080/10408398.2018.1502743
14. Lane MM, Davis JA, Beattie S, Gómez-Donoso C, Loughman A, O’Neil A, Jacka F, Berk
M, Page R, Marx W, et al. Ultraprocessed food and chronic noncommunicable diseases: A
systematic review and meta-analysis of 43 observational studies. Obes Rev (2021)
22:e13146. doi:10.1111/obr.13146
15. Hall KD, Ayuketah A, Brychta R, Cai H, Cassimatis T, Chen KY, Chung ST, Costa E,
Courville A, Darcey V, et al. Ultra-Processed Diets Cause Excess Calorie Intake and
Weight Gain: An Inpatient Randomized Controlled Trial of Ad Libitum Food Intake. Cell
Metabolism (2019) 30:67-77.e3. doi:10.1016/j.cmet.2019.05.008
16. European Food Safety Authority (EFSA). Dietary Reference Values for nutrients Summary
report. EFSA Supporting Publications (2017) 14:e15121E.
doi:10.2903/sp.efsa.2017.e15121
17. Institute of Medicine Committee to Review Dietary Reference Intakes for Vitamin D and
Calcium. Dietary Reference Intakes for Calcium and Vitamin D. , eds. A. C. Ross, C. L.
Taylor, A. L. Yaktine, H. B. Del Valle Washington, DC: National Academies Press (2011).
18. Allen LH, Carriquiry AL, Murphy SP. Perspective: Proposed Harmonized Nutrient
Reference Values for Populations. Adv Nutr (2020) 11:469–483.
doi:10.1093/advances/nmz096
19. FAO/IZiNCG. FAO/INFOODS/IZiNCG Global Food Composition Database for Phytate
Version 1.0 - PhyFoodComp 1.0. Rome, Italy. (2018). Available at:
http://www.fao.org/3/i8542en/I8542EN.pdf
20. U.S. DEPARTMENT OF AGRICULTURE (USDA), Agricultural Research Service.
USDA FoodData Central. Available at: https://fdc.nal.usda.gov/ [Accessed June 18, 2021]
21. FAO. INFOODS: FAO/INFOODS Databases. Available at:
http://www.fao.org/infoods/infoods/tables-and-databases/faoinfoods-databases/en/
[Accessed June 18, 2021]
22. Valenzuela C, López de Romaña D, Olivares M, Morales MS, Pizarro F. Total Iron and
Heme Iron Content and their Distribution in Beef Meat and Viscera. Biol Trace Elem Res
(2009) 132:103–111. doi:10.1007/s12011-009-8400-3
23. Balder HF, Vogel J, Jansen MCJF, Weijenberg MP, van den Brandt PA, Westenbrink S,
van der Meer R, Goldbohm RA. Heme and chlorophyll intake and risk of colorectal cancer
in the Netherlands cohort study. Cancer Epidemiol Biomarkers Prev (2006) 15:717–725.
doi:10.1158/1055-9965.EPI-05-0772
24. Total Heme and Non‐heme Iron in Raw and Cooked Meats - Lombardi‐Boccia - 2002 -
Journal of Food Science - Wiley Online Library. Available at:
13
https://onlinelibrary.wiley.com/doi/abs/10.1111/j.1365-2621.2002.tb08715.x [Accessed
June 18, 2021]
25. Pourkhalili A, Mirlohi M, Rahimi E. Heme Iron Content in Lamb Meat Is Differentially
Altered upon Boiling, Grilling, or Frying as Assessed by Four Distinct Analytical Methods.
The Scientific World Journal (2013) 2013:e374030. doi:10.1155/2013/374030
26. Kabat GC, Miller AB, Jain M, Rohan TE. A cohort study of dietary iron and heme iron
intake and risk of colorectal cancer in women. Br J Cancer (2007) 97:118–122.
doi:10.1038/sj.bjc.6603837
27. Ronco A, Espinosa E, Calderon J. A case-control study on heme/non-heme iron and breast
cancer risk 1 MedDocs Publishers of Creative Commons Attribution 4.0 International
License Annals of Clinical Nutrition. (2018)
28. Kongkachuichai R, Napatthalung P, Charoensiri R. Heme and Nonheme Iron Content of
Animal Products Commonly Consumed in Thailand. Journal of Food Composition and
Analysis (2002) 15:389–398. doi:10.1006/jfca.2002.1080
29. Taniguchi CN, Dobbs J, Dunn MA. Heme iron, non-heme iron, and mineral content of
blood clams (Anadara spp.) compared to Manila clams (V. philippinarum), Pacific oysters
(C. gigas), and beef liver (B. taurus). Journal of Food Composition and Analysis (2017)
57:49–55. doi:10.1016/j.jfca.2016.12.018
30. Ryckman T, Beal T, Nordhagen S, Chimanya K, Matji J. Affordability of nutritious foods
for complementary feeding in Eastern and Southern Africa. Nutrition Reviews (2021) 79:
31. Hall KD, Guo J, Courville AB, Boring J, Brychta R, Chen KY, Darcey V, Forde CG,
Gharib AM, Gallagher I, et al. Effect of a plant-based, low-fat diet versus an animal-based,
ketogenic diet on ad libitum energy intake. Nat Med (2021) 27:344–353.
doi:10.1038/s41591-020-01209-1
32. Ryckman T, Beal T, Nordhagen S, Murira Z, Torlesse H. Affordability of nutritious foods
for complementary feeding in South Asia. Nutrition Reviews (2021) 79:
33. Miller GD, Drewnowski A, Fulgoni V, Heaney RP, King J, Kennedy E. It Is Time for a
Positive Approach to Dietary Guidance Using Nutrient Density as a Basic Principle. The
Journal of Nutrition (2009) 139:1198–1202. doi:10.3945/jn.108.100842
34. Drewnowski A, Amanquah D, Gavin-Smith B. Perspective: How to Develop Nutrient
Profiling Models Intended for Global Use: A Manual. Advances in Nutrition (2021)
12:609–620. doi:10.1093/advances/nmab018
35. Afshin A, Sur PJ, Fay KA, Cornaby L, Ferrara G, Salama JS, Mullany EC, Abate KH,
Abbafati C, Abebe Z, et al. Health effects of dietary risks in 195 countries, 1990–2017: a
systematic analysis for the Global Burden of Disease Study 2017. The Lancet (2019) 0:
doi:10.1016/S0140-6736(19)30041-8
14
36. FAO, IFAD, UNICEF, WFP, WHO. The State of Food Security and Nutrition in the World
2020: Transforming food systems for affordable healthy diets. Rome, Italy: FAO, IFAD,
UNICEF, WFP and WHO (2020). doi:10.4060/ca9692en
37. Wu G, Fanzo J, Miller DD, Pingali P, Post M, Steiner JL, Thalacker-Mercer AE.
Production and supply of high-quality food protein for human consumption: sustainability,
challenges, and innovations. Annals of the New York Academy of Sciences (2014) 1321:1–
19. doi:10.1111/nyas.12500
38. Semba RD, Shardell M, Sakr Ashour FA, Moaddel R, Trehan I, Maleta KM, Ordiz MI,
Kraemer K, Khadeer MA, Ferrucci L, et al. Child Stunting is Associated with Low
Circulating Essential Amino Acids. EBioMedicine (2016) 6:246–252.
doi:10.1016/j.ebiom.2016.02.030
39. Simopoulos AP. Essential fatty acids in health and chronic disease. The American Journal
of Clinical Nutrition (1999) 70:560s–569s. doi:10.1093/ajcn/70.3.560s
40. Mozaffarian Dariush. Dietary and Policy Priorities for Cardiovascular Disease, Diabetes,
and Obesity. Circulation (2016) 133:187–225.
doi:10.1161/CIRCULATIONAHA.115.018585
41. Neufeld LM, Hendriks S, Hugas M. Healthy diet: A definition for the United Nations Food
Systems Summit 2021. (2020)
42. Monteiro CA, Cannon G, Levy RB, Moubarac J-C, Louzada ML, Rauber F, Khandpur N,
Cediel G, Neri D, Martinez-Steele E, et al. Ultra-processed foods: what they are and how to
identify them. Public Health Nutrition (2019) 22:936–941.
doi:10.1017/S1368980018003762
43. Gashu D, Nalivata PC, Amede T, Ander EL, Bailey EH, Botoman L, Chagumaira C,
Gameda S, Haefele SM, Hailu K, et al. The nutritional quality of cereals varies geospatially
in Ethiopia and Malawi. Nature (2021) 594:71–76. doi:10.1038/s41586-021-03559-3
44. Herforth AW, Wiesmann D, Martínez-Steele E, Andrade G, Monteiro CA. Introducing a
Suite of Low-Burden Diet Quality Indicators That Reflect Healthy Diet Patterns at
Population Level. Current Developments in Nutrition (2020) 4: doi:10.1093/cdn/nzaa168
45. Herforth A, Beal T, Rzepa A. Global Diet Quality Project Aims to Bridge Data Gap.
Gallup.com (2020) Available at: https://news.gallup.com/opinion/gallup/321968/global-
diet-quality-project-aims-bridge-data-gap.aspx [Accessed June 29, 2021]
46. Smith MR, Stull VJ, Patz JA, Myers SS. Nutritional and environmental benefits of
increasing insect consumption in Africa and Asia. Environ Res Lett (2021) 16:065001.
doi:10.1088/1748-9326/abf06c
47. Nyirenda D, Musukwa M, Mugode R, Shindano J. Zambia Food Composition Tables, 4th
Edition. Lusaka, Zambia: National Food and Nutrition Commission (2009). Available at:

15
https://www.nfnc.org.zm/download/zambia-food-composition-tables-4th-edition/ [Accessed
June 29, 2021]
48. Drewnowski A, Smith J, Fulgoni VL. The New Hybrid Nutrient Density Score NRFh 4:3:3
Tested in Relation to Affordable Nutrient Density and Healthy Eating Index 2015: Analyses
of NHANES Data 2013–16. Nutrients (2021) 13:1734. doi:10.3390/nu13051734
49. Poore J, Nemecek T. Reducing food’s environmental impacts through producers and
consumers. Science (2018) 360:987–992. doi:10.1126/science.aaq0216
50. Wijsman JWM, Troost K, Fang J, Roncarati A. “Global Production of Marine Bivalves.
Trends and Challenges,” in Goods and Services of Marine Bivalves, eds. A. C. Smaal, J. G.
Ferreira, J. Grant, J. K. Petersen, Ø. Strand (Cham: Springer International Publishing), 7–
26. doi:10.1007/978-3-319-96776-9_2
Table 1 | Recommended nutrient intakes for select groups
Group AER
(kcal)
Vit A
(mcg
RAE)
Folate
(mcg
DFE)
Vit B12
(mcg)
Calcium
(mg)
Iron (mg)1 Zinc (mg)2
20% 15% 10% R SR SU U
Children 2–4
1246 230 128 1.0 590 7.4 9.8 14.8 3.2 3.9 4.7 5.5
Adolescents 10–19
2296 632 292 2.2 1085 9.9 13.2 19.8 8.3 9.9 11.4 13.0
Women 15–49
2305 637 325 2.4 977 15.9 21.2 31.8 8.0 9.6 11.1 12.6
Pregnant women 15–49
2583 700 600 2.6 977 24.3 32.4 48.6 9.1 10.9 12.6 14.3
Adults 25+3 2227 694 328 2.4 950 7.0 10.0 14.0 9.4 11.7 14.0 16.3
Average energy requirements for a moderately active individual and recommended intakes for vitamin A, folate, calcium and zinc from the European Food
Safety Authority (16). Recommended intakes for iron and vitamin B12 from the Institute of Medicine (17). 1Percentages represent different levels of
bioavailability that correspond with the possible classifications of each food in the analysis. 2Assuming 300 mg phytate/day and 44% absorption for refined (R) diets, 600 mg phytate/day and 35% absorption for semi-refined (SR) diets, 900 mg phytate/day and 30% absorption for semi-unrefined (SU) diets, and
1200 mg phytate/day and 26% absorption for unrefined (U) diets. 3Includes both men and women. AER, Average Energy Requirement; DFE, dietary folate
equivalent; R, refined; RAE, retinol activity equivalent; SR, semi-refined; SU, semi-unrefined; U, unrefined; Vit, vitamin.
16
Table 2 | Global food composition database
Food (100 g) kcal Vit A
(mcg
RAE)
Folate
(mcg
DFE)
Vit B12
(mcg)
Calcium
(mg)
Iron
(mg)
Zinc
(mg)
Iron
Abs
Zinc
Abs
Phytate
(mg)
Pulses 134 1 88 0 29 2.4 1.2 0.10 0.26 441
Whole grains1,9 204 0 16 0 22 1.9 1.5 0.10 0.26 510
Refined grains9 133 0 5 0 9 0.5 0.6 0.10 0.44 45
Unrefined grain products2,9
166 2 31 0 29 1.9 1.0 0.10 0.30 129
Refined grain products9
168 0 12 0 12 0.8 0.5 0.10 0.44 49
Sorghum3 142 0 20 0 9 2.6 0.8 0.10 0.26 272
Millet 148 0 27 0 10 2.6 1.0 0.10 0.26 200
Teff4,5 149 0 42 0 49 4.3 1.1 0.10 0.26 284
Fonio3,4 139 1 36 0 12 2.8 1.1 0.10 0.30 110
Quinoa6 115 0 43 0 17 2.0 1.0 0.10 0.26 554
Roots, tubers, plantains
111 14 12 0 17 0.7 0.3 0.10 0.44 13
Nuts 594 0 72 0 62 4.1 3.0 0.10 0.26 670
Seeds 579 1 98 0 333 7.6 5.5 0.10 0.26 653
Dark green leafy vegetables
30 252 57 0 148 2.2 0.4 0.10 0.44 17
Vitamin A-rich fruits/vegetables
40 124 24 0 20 0.5 0.2 0.10 0.44 24
Other vegetables 28 20 17 0 18 0.5 0.2 0.10 0.44 10
Other fruits 65 4 19 0 11 0.4 0.2 0.10 0.44 10
Eggs 156 163 45 1.1 50 1.6 1.1 0.15 0.44 0
Fresh cow milk 67 44 5 0.4 120 0.1 0.4 0.15 0.44 0
Cooked cow milk 61 39 5 0.5 116 0.1 0.5 0.15 0.44 0
Fresh goat milk 72 35 1 0.1 143 0.1 0.3 0.15 0.44 0
Yoghurt 77 27 7 0.4 121 0.1 0.4 0.15 0.44 0
Cheese 359 213 16 1.0 707 0.5 3.0 0.15 0.44 0
Beef 217 3 4 2.1 8 2.5 5.8 0.20 0.44 0
Goat 146 0 3 1.2 17 3.2 5.0 0.20 0.44 0
Lamb/mutton 290 0 9 2.5 14 2.0 4.7 0.20 0.44 0
Pork 242 2 3 0.7 23 1.6 2.6 0.15 0.44 0
Chicken 229 29 6 0.3 14 1.0 1.5 0.15 0.44 0
Beef liver 177 8645 257 76.2 7 9.0 5.2 0.15 0.44 0
Goat/lamb liver4 207 18093 349 85.6 11 10.0 6.3 0.15 0.44 0
Chicken liver 141 3492 534 16.1 10 10.3 3.4 0.15 0.44 0
Pork liver7 114 4796 148 15.8 10 17.9 4.6 0.15 0.44 0
Heart7 112 4 25 5.1 7 4.4 3.1 0.15 0.44 0
Spleen6 114 0 3 4.2 10 35.8 2.5 0.15 0.44 0

17
Kidney 97 69 34 14.5 12 5.6 2.4 0.15 0.44 0
Fresh fish10 123 10 10 1.8 39 0.8 0.7 0.15 0.44 0
Small dried fish4 294 186 37 12.1 2360 10.0 10.2 0.15 0.44 0
Canned fish, without bones8
153 14 5 2.2 12 1.3 0.6 0.15 0.44 0
Canned fish, with bones8
201 40 9 5.8 252 2.3 1.4 0.15 0.44 0
Crustaceans 89 8 12 1.3 74 1.2 2.2 0.15 0.44 0
Bivalves 87 77 19 23.5 113 4.8 3.6 0.15 0.44 0 1Only one food item available for the South and South East Asia; 2No foods available for the South and South East Asia; 3No values available from FoodData
Central; 4Values available for Sub-Saharan African only. Additional values from the literature used; 5for zinc absorption, used average phytate of the four other
traditional grains (sorghum, millet, fonio, quinoa); 6Values available for Latin America only; 7Values available for South and South East Asia and Latin American
only; 8Values available for Sub-Saharan Africa and Latin America only. 9The term "grains" (both whole and refined) refers to cereal grains, such as wheat, rice,
oats, and barley. The term "grain products" (both unrefined and refined) refers to products obtained from flours, requiring some additional processing, such as
breads, pasta, and noodles. 10Aggregate group including different species of marine and freshwater fish. Abs, absorption; Vit, vitamin.
18
Figure Legends Figure 1 | Calories and grams needed to provide an average of one-third of recommended intakes
of vitamin A, folate, vitamin B12, calcium, iron, and zinc for women of reproductive age. Each micronutrient’s contribution is capped at 100% of recommended intakes. Hypothetical average
requirements for mass are based on an energy density of 1.3 kcal/g. AR, average requirement; Vit,
vitamin.
Figure 2 | Aggregate and individual micronutrient density scores for women of reproductive age.
prod, products; veg, vegetables.
Figure 3 | Calories and grams needed to provide one-third of recommended iron intakes for
women of reproductive age. Hypothetical average requirements for mass are based on an energy
density of 1.3 kcal/g. AR, average requirement; Vit, vitamin.
Figure 4 | Calories and grams needed to provide an average of one-third of recommended intakes
of vitamin A, folate, vitamin B12, calcium, iron, and zinc for adults ³ 25. Each nutrient’s contribution
is capped at 100% of recommended intakes. Hypothetical average requirements for mass are based
on an energy density of 1.3 kcal/g. AR, average requirement; Vit, vitamin.
Figure 5 | Aggregate and individual micronutrient density scores for adults ³ 25. Mod, Moderate;
prod, products; veg, vegetables.
Figure 6 | Calories and grams needed to provide one-third of recommended iron intakes for
adults ³ 25. Hypothetical average requirements for mass are based on an energy density of 1.3
kcal/g. AR, average requirement; Vit, vitamin.
Figures
Figure 1
Calories and grams needed to provide an average of one-third of recommended intakes of vitamin A,folate, vitamin B12, calcium, iron, and zinc for women of reproductive age. Each micronutrient’scontribution is capped at 100% of recommended intakes. Hypothetical average requirements for massare based on an energy density of 1.3 kcal/g. AR, average requirement; Vit, vitamin.
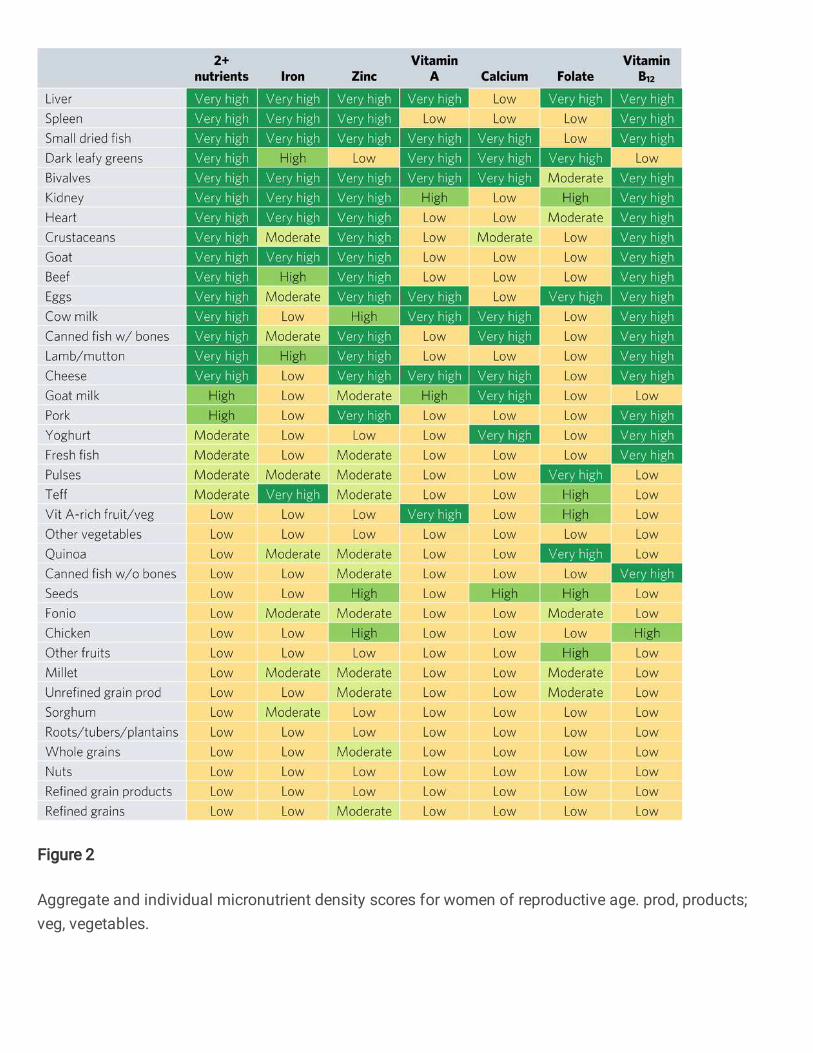
Figure 2
Aggregate and individual micronutrient density scores for women of reproductive age. prod, products;veg, vegetables.
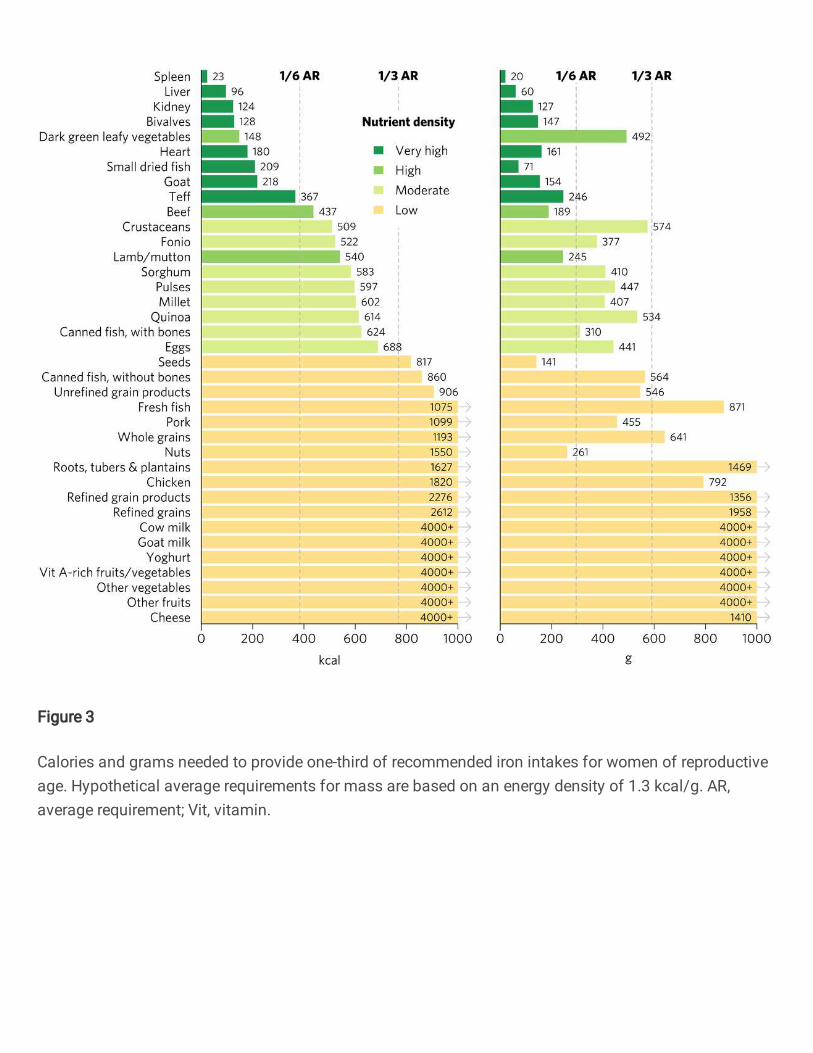
Figure 3
Calories and grams needed to provide one-third of recommended iron intakes for women of reproductiveage. Hypothetical average requirements for mass are based on an energy density of 1.3 kcal/g. AR,average requirement; Vit, vitamin.
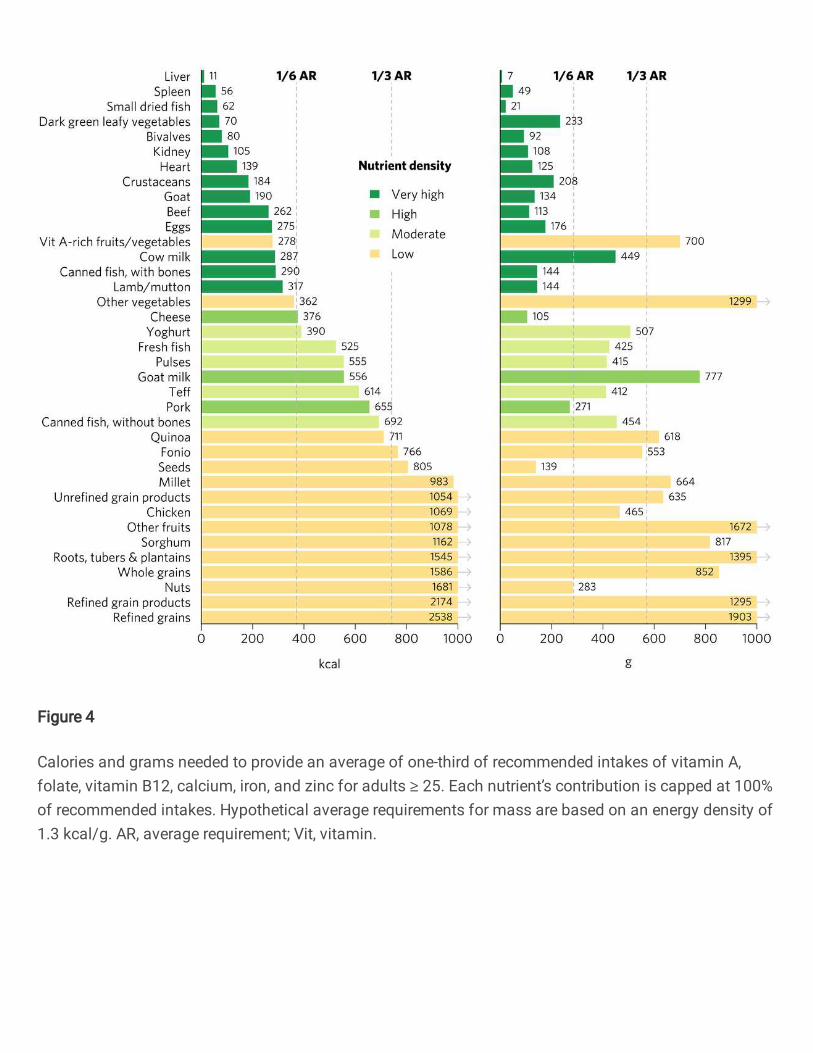
Figure 4
Calories and grams needed to provide an average of one-third of recommended intakes of vitamin A,folate, vitamin B12, calcium, iron, and zinc for adults ≥ 25. Each nutrient’s contribution is capped at 100%of recommended intakes. Hypothetical average requirements for mass are based on an energy density of1.3 kcal/g. AR, average requirement; Vit, vitamin.

Figure 5
Aggregate and individual micronutrient density scores for adults ≥ 25. Mod, Moderate; prod, products;veg, vegetables.
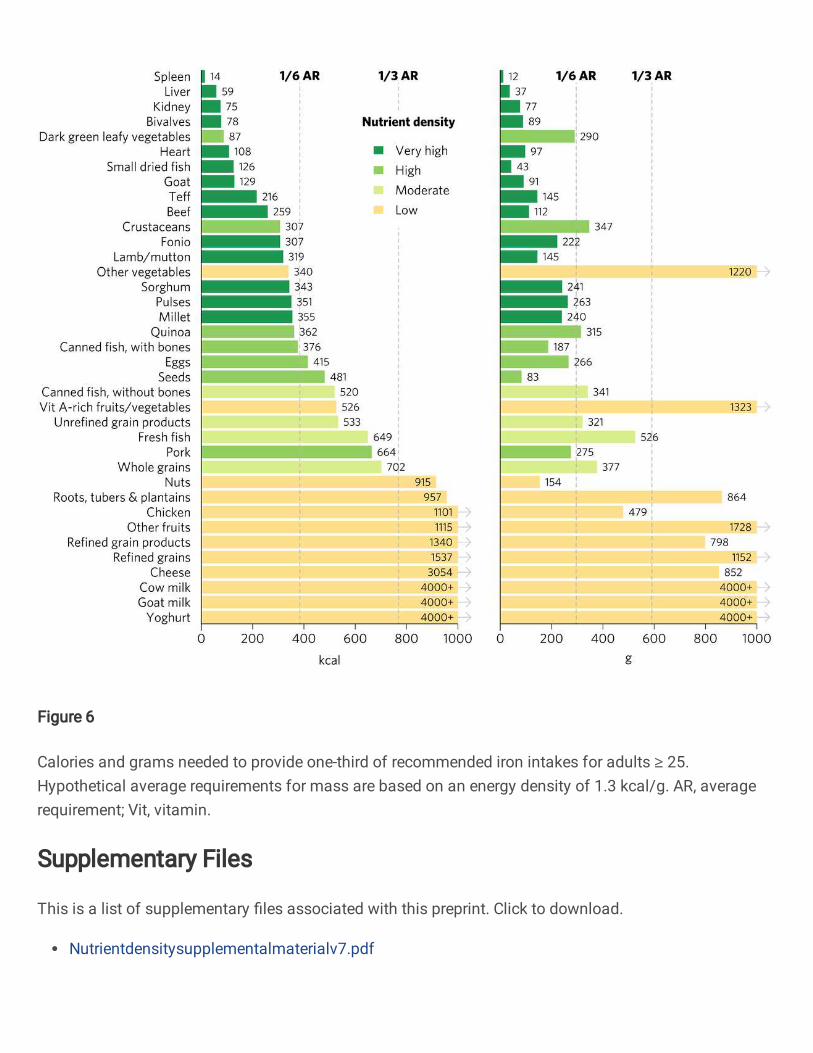
Figure 6
Calories and grams needed to provide one-third of recommended iron intakes for adults ≥ 25.Hypothetical average requirements for mass are based on an energy density of 1.3 kcal/g. AR, averagerequirement; Vit, vitamin.
Supplementary Files
This is a list of supplementary �les associated with this preprint. Click to download.
Nutrientdensitysupplementalmaterialv7.pdf