priority for school buildings programme · i have created an easy to follow workflow for the new...
TRANSCRIPT
www.iesve.com
Priority for School Buildings Programme Daylighting Criteria – DA and UDI in RadianceIES
Written and Prepared by Date Revision
Rosemary McLafferty and Don Stearn August 2013 Rev 01

Priority for Schools – RadianceIES Guidance
page 2
PSBP - Getting Started Step-by-Step Guide
Contents Introduction to Dynamic Daylighting Simulation in Radiance ....................................................................... 3
Setting Environment Variable ........................................................................................................................ 9
Step-by-step guide to running a Dynamic Daylighting Simulation in the VE............................................... 12

Priority for Schools – RadianceIES Guidance
page 3
PSBP - Getting Started Step-by-Step Guide
Introduction to Dynamic Daylighting Simulation in Radiance
In VE-Radiance we have used the ray-tracing capability of Radiance to generate images, luminance or illuminance, by using the module rpict. We have also generated illuminance data at given points in 3D space using the module rtrace, to generate illuminance over the WP or at sensor points. Both these approches can be expensive to get accurate results for daylighting simulation for even a single time-step.
Luminance image
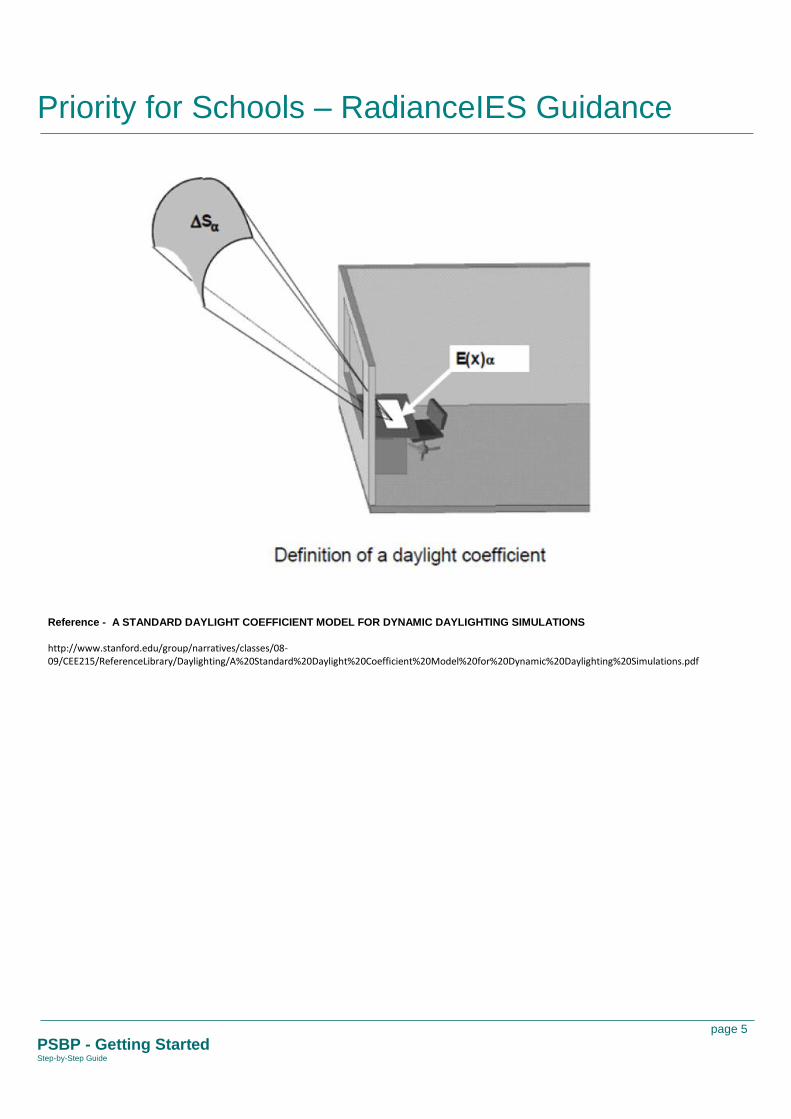
In order to get results for multiple time-steps we have to use a relatively new Radiance module, rcontrib (which is an updated version of rtcontrib and based on the rtrace module). This module does a ray-tracing simulation to create the daylight coefficients for points in the scene, i.e. sensor points or grid points on the WP. These coefficients can then be used to calculate the illuminance at particular time-steps. This is much more efficient than running a ray-tracing simulation at each time-step.

Priority for Schools – RadianceIES Guidance
page 4
PSBP - Getting Started Step-by-Step Guide
The underlying idea is to divide the celestial hemisphere into disjoint sky patches, this was first proposed by Tregenza who used 145 sub-divisions (see image below). Others (Reinhard – author of DAYSIM) have divided these patches by 4 or even 16 to achieve greater accuracy at the cost of increased simulation time. The efficiency is that once the daylight coefficient has been calculated, any sky distribution can be plugged-in to generate the illuminance data. Because this is a simple and fast calculation we can do this across a full year to generate annual metrics or time-step by time-step to get a true dynamic simulation.
Tregenza Sky Patches
Priority for Schools – RadianceIES Guidance
page 5
PSBP - Getting Started Step-by-Step Guide
Reference - A STANDARD DAYLIGHT COEFFICIENT MODEL FOR DYNAMIC DAYLIGHTING SIMULATIONS
http://www.stanford.edu/group/narratives/classes/08-09/CEE215/ReferenceLibrary/Daylighting/A%20Standard%20Daylight%20Coefficient%20Model%20for%20Dynamic%20Daylighting%20Simulations.pdf

Priority for Schools – RadianceIES Guidance
page 6
PSBP - Getting Started Step-by-Step Guide
We use this technique in two ways in VE-Radiance -
1. Dynamic Simulation for zone We create a grid of points across the zone and for a given design day (15th) of each month we do a simulation at each hour that the Sun is risen - we repeat this simulation for the Sunny Sky, Clear Sky and CIE Overcast Sky.
Grid points across zone
We can examine this data at each time-step
Average Lux for CIE Overcast Sky

Priority for Schools – RadianceIES Guidance
page 7
PSBP - Getting Started Step-by-Step Guide
We can process this data to get average values for each point for the given skies, and percentage within a given range (less than 100, 100-500, etc). We can interpolate the data against the "cloud cover" climate data to produce Daylight Autonomy results.
Annual average Lux for CIE Overcast Sky
% in range 100-500 Lux for Daylight Autonomy

Priority for Schools – RadianceIES Guidance
page 8
PSBP - Getting Started Step-by-Step Guide
2. Sensor data for Thermal Simulation
We create sensors for each zone and run an annual simulation using the Sunny Sky, Clear Sky and CIE Overcast Sky (using same time series as before).
Sensors on WP pointing up
Annual Lux data for particular sensor

Priority for Schools – RadianceIES Guidance
page 9
PSBP - Getting Started Step-by-Step Guide
Setting Environment Variable
In order to activate the Dynamic Simulation tab in Radiance it is necessary to set an Environment variable. Please follow the steps below to set this up. NOTE: Please ensure that you are comfortable working with the registry on your machine, if necessary, seek advice on making alternations to your registry from the IT department as you may not have admin privileges. To set the registry go Start > and type ‘regedit’ into the search box
Select Regedit.exe and allow the program to make changes to your machine. Navigate through the registry to:
HKEY_CURRENT_USER\Software\IES Applications\modx\RadianceIES In the right hand column, right click and select New > String Value. Create a string called DDSFLAG and set the data value to 1

Priority for Schools – RadianceIES Guidance
page 10
PSBP - Getting Started Step-by-Step Guide
Now that the environment variable has been set the "Dynamic Simulation" options in Radiance are activated.
The images below show the new features that have been enabled in Radiance.
"Illuminance - WP dynamic" option in "Images" tab
"Dynamic" button in "Sensor Settings" tab
New "Dynamic Simulation" tab
Priority for Schools – RadianceIES Guidance
page 11
PSBP - Getting Started Step-by-Step Guide
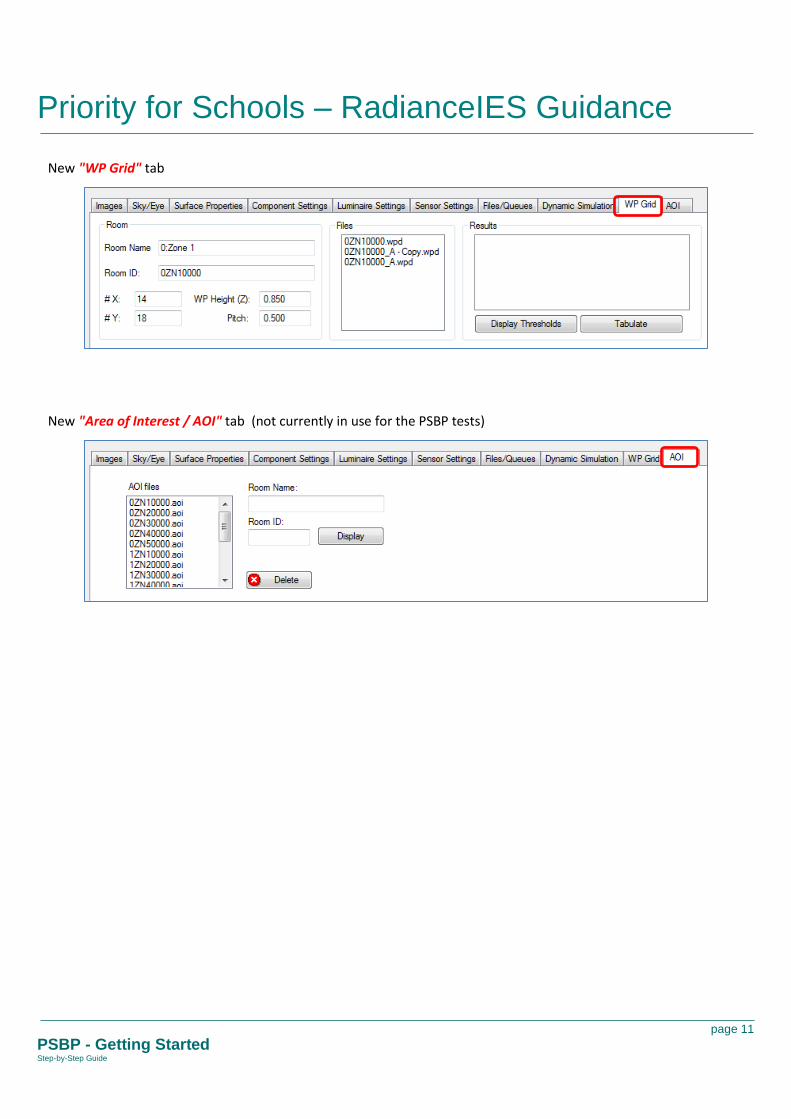
New "WP Grid" tab
New "Area of Interest / AOI" tab (not currently in use for the PSBP tests)

Priority for Schools – RadianceIES Guidance
page 12
PSBP - Getting Started Step-by-Step Guide
Step-by-step guide to running a Dynamic Daylighting Simulation in the VE I have created an easy to follow workflow for the new “Dynamic simulation” features in Radiance. The new features enables users to achieve the required Daylight Autonomy and Useful Daylight Index outputs for PSBP projects. I have also provided a test model for you to easily follow the steps in the document (test_model1.cab ). I would recommend saving the model on to you C:\VE-Projects\PSBP folder
Step 1: Open the VE test model provided

Priority for Schools – RadianceIES Guidance
page 13
PSBP - Getting Started Step-by-Step Guide
Step 2: Select Radiance from the Applications browser
Step 3: Select the "Dynamic Simulation" tab
The "Run Simulation" button will be inactive until at least one zone is selected - when clicked it will perform an annual simulation for each selected zone - initially we recommend that this is done for a single zone. The "Display Results" and "Process Results" buttons are inactive unless annual results have been calculated for a single zone.

Priority for Schools – RadianceIES Guidance
page 14
PSBP - Getting Started Step-by-Step Guide
Step 4: Select a zone to simulate
Run simulation Step 5: Click on - the simulation will start running
A Stop simulation button will appear beside the progress bar

Priority for Schools – RadianceIES Guidance
page 15
PSBP - Getting Started Step-by-Step Guide
Step 6: Display results
When a single zone, for which annual results have been created, is selected the "Display Results" button is active - clicking this pops-up the results table –
The combo-box can be changed to show results for -
"CIE Overcast Sky"
"Sunny Sky"
"Clear Sky"
"Daylight Autonomy".
The combo-box can show results for -
"Average Lux"
"Minimum Lux"
"Maximum Lux"
"% less 100 Lux"
"% range 100-500 Lux"
"% range 500-2500 Lux"
"% greater 2500 Lux"
The Lux values in the % range selections above are defined by the settings for the "Low", "Medium" and "High" threshold values (see below). Climate data is automatically read to generate the "Daylight Autonomy" data displayed on the grid - in this version of the software it uses a simple interpolation between the CIE Overcast Sky and the Sunny Sky by using the "Cloud Cover" climate variable.

Priority for Schools – RadianceIES Guidance
page 16
PSBP - Getting Started Step-by-Step Guide
Change Threshold ranges
Click on the "Thresholds" button - pops-up the "Thesholds" dialog" -
Note: this dialog is also activated by the "Display Thresholds" button in the "WP Grid" tab, with different functionality. The check-boxes can be used to switch the ranges ON/OFF -
If any of these values is changed and the "Display" button applied the grid data will change. The colour buttons on this dialog will change the colours displayed in the Grid display of the data, here we have set to only a single threshold, "< 200" or "> 200" –
The threshold ranges also change the data that's collated in the "Post Processing" filters.
Priority for Schools – RadianceIES Guidance
page 17
PSBP - Getting Started Step-by-Step Guide
Process Results When the "Process" button is clicked, the annual results data is processed into sets of data that can be displayed via the mechanism available in the "WP Grid" tab, see below. There are three options available as check-boxes -
"Overwrite" deletes the "wpd" file and write new data, otherwise any new data is appended to this file.
"Use Climate data" generates data for "Daylight Autonomy" using algorithm as explained
above. The simulation is run for the full year.
"Use Occupancy profile" filters the "Daylight Autonomy" data using a 9:00am to 17:00pm occupancy profile, in addition to the full year data.
This data can be viewed by using the options on the "WP Grid" tab, see below. Note: this data is filtered by the settings of the thresholds

Priority for Schools – RadianceIES Guidance
page 18
PSBP - Getting Started Step-by-Step Guide
Step 7: Select the "WP Grid" tab
When a zone is selected all the data files that apply to this zone are displayed .
NOTE: The data files are named using the "ZoneID" eight character label - if the data file has been created using the annual data then "_A" is appended to this label.
When a results file is selected all the available simulations are displayed in the "Results" drop-down list. These results are displayed automatically - at the MODEL level this shows the grid points that define this simulation.

Priority for Schools – RadianceIES Guidance
page 19
PSBP - Getting Started Step-by-Step Guide
When the zone is selected, click on the DOWN arrow which takes you to SURFACE level. At this level the data values are shown.
Select PLAN view to display the results in coloured bands

Priority for Schools – RadianceIES Guidance
page 20
PSBP - Getting Started Step-by-Step Guide
"Display Thresholds"
This pops-up the "Thresholds" dialog -
This has a combo-box with three selections "Lux", "Daylight Factor" or "Percentage", the default ranges for these are:
low medium high
"Lux" - 100 500 2500
"Daylight Factor" - 2 5 10
"Percentage" - 25 50 75
These thresholds can be changed in value or switched off to either three or two ranges, independently of the other ranges.

Priority for Schools – RadianceIES Guidance
page 21
PSBP - Getting Started Step-by-Step Guide
In this example the colour of the lower range has been changed and the high threshold has been set at 1000 Lux: